Embed Size (px)
Citation preview
Bulletin of Earth Sciences of Thailand
Lao-anuson and Chantraprasert_Structure of copper deposit. BEST, Vol. 4, No. 1, pp. 31-43.
Research Article
Structural Geology of Copper Deposit in the Puthep 1 Area, Loei
Province: Interpretation from Resistivity and Induced Polarization Data
Naris Lao-anuson* and Sarawute Chantraprasert
Department of Geological Sciences, Faculty of Science, Chiang Mai University, Chiang Mai, 50200 Thailand *Corresponding author e-mail: [email protected]
Abstract
The structural geology associated with mineralization in the Puthep 1 area, Loei Province, northeastern Thailand was interpreted based on depth slices of resistivity and induced polarization. The copper deposits are located mainly in a N-S trending zone along the central part of the area with a potentially small deposit in the southwestern corner of the area. The majority of the copper deposits occurs along N-S trending fractures that probably developed due to flexure along the crest of an anticline. The lateral extension of these N-S trending fractures were limited by E-W and NW-SE trending pre-existing structures and offset by subsequent left-lateral movements along NE-SW trending shear fractures. The study has implications for mineral exploration and production in the Puthep 1 area and surrounding areas with comparable geology.
Keywords: structural geology, copper deposit, resistivity, induced polarization, mineral
exploration, fracture, Loei 1. Introduction Mineralization often requires large volumes of opening spaces necessary for the precipitation of mineral veins (Lindgren, 1933; Sibson, 1996, 2002; Cox, 1999; Gudmundsson et al., 2001; Madrid and Garwin, 2002). Many of such opening spaces are fractures created by various tectonic processes. These structures are important as pathways for mineral fluids to migrate into and interact with appropriate host rocks. Understanding the geometry and distribution of these structures therefore facilitates the exploration and production of relevant mineral deposits.
The Puthep 1 deposit occurs approximately 20 km east of the Loei Province, between horseshoe-shaped ridges opening to the north and drained by a perennial creek flowing northward (Figure 1). The deposit is hosted by clastic and carbonate sedimentary rocks of the Wang Saphung Formation and Permian-Triassic intermediate intrusive igneous rocks (Punkaew et al., 2005). The sedimentary rocks include shale, siltstone,
sandstone and limestone. The igneous rock is diorite porphyry, which intruded the folded sedimentary units (Johnston, 2001). Seven lithological units (Figure 1) have been established by surface mapping (Punkaew et al., 2005). The rock units were folded into a SSE-plunging anticline and syncline pair that was cut by an E-W trending right-lateral strike-slip fault. Along the strike-slip fault and the fault termination area (Park, 1997) are N-S trending normal faults (Punkaew et al., 2005) forming a horsetail splay (Sylvester and Smith, 1976). Recent literature (Johnston, 2001; Kamvong, 2005) has documented the geology, alteration and mineralization styles of the Puthep 1 deposit. The purpose of this paper is to determine the relationship of structural geology and copper mineralization in the Puthep 1 area based on interpretation from resistivity and induced polarization data. Aside from native metals and graphite, most rock-forming minerals are insulators and electrical current is carried through a rock mainly via ions in pore waters. Therefore, in most rocks, resistivity generally increases as porosity decreases.
31

Bulletin of Earth Sciences of Thailand
Lao-anuson and Chantraprasert_Structure of copper deposit. BEST, Vol. 4, No. 1, pp. 31-43.
Figure 1. Geologic map of Puthep 1 area (modified from Punkaew et al., 2005).
32

Bulletin of Earth Sciences of Thailand
Lao-anuson and Chantraprasert_Structure of copper deposit. BEST, Vol. 4, No. 1, pp. 31-43.
Crystalline rocks with negligible
intergranular porosity may be conductive along cracks and fissures (Kearey and Brooks, 1984). Resistivity surveying method is commonly used in environmental, engineering and geological work (Loke, 1999; Nguyen et al., 2005). Induced polarization (IP) is a geophysical imaging technique used to identify subsurface materials, such as ore (Khesin et al., 1997). The method is similar to electrical resistivity, in that an electric current is induced into the subsurface. IP responses are computed analytically for simple geometric features such as spheres, ellipsoids, dykes, vertical contacts and horizontal layers (Kearey and Brooks, 1984). Positive IP anomalies could result from metallic sulphide mineralization and alteration. Almost all of alteration zones are located near the edge of such anomalies (Kearey and Brooks, 1984). Simple parameters of the anomalies, such as sharpness, symmetry, amplitude and spatial distribution may be used to estimate the location, lateral extent, dip and depth of anomalous zones (Kearey and Brooks, 1984). 2. Materials and methods Resistivity and IP surveys were carried out over the Puthep 1 area in 1992 to map structural geology, sulfide mineralization and alteration zones. The data in the northern part of the survey was acquired in detail with 100 m spaced lines, whilst the coverage over the central and southern parts is sparser with 200 m spaced lines. The surveys were carried out using a time-domain instrument with dipole-dipole array configuration (McNeill, 2008). Two-dimension measurements were taken and the data recorded in apparent chargeability in milliVolts per Volt (mV/V) for IP, whereas resistivity data were reported in apparent resistivity in ohm-meter (Ω-m). Two- and three-dimension inversions were then performed on the raw data. In this study,
depth slices from three-dimension inversion were used for delineating fracture orientation.
During acquisition, the monitoring of transmitter current output stability, contact resistance pots and repeatability of the data were employed as part of data quality-control measures. The archived data did not contain any of this information. This limited the amount of control on the data quality before running inversions. To counteract this deficiency both inline two-dimension smooth model inversions and three-dimension model inversions were run. Comparing the results of both inversions along the lines of acquisition helped determine the presence of noise and/or contamination in the original data.
The resistivity and IP data for this interpretation were extracted as depth slices (Figures 2 and 3) from three-dimensional block models, with depth interval of 12.5 m. The uppermost and lowermost slices were at 6 and 206 m below the surface respectively. The interpretation of linear features was made along abrupt contrasts of apparent resistivity and chargeability anomalies. The prominent resistivity anomalies with values above 200 Ω-m were outlined, since drill hole data indicated that these values correspond to [quartz stocks]. Two levels of IP anomalies were selected for interpretation. The first level is the values above 32 mV/V that presumably represent rock alteration zones (McNeil, 2008) and the second level includes the values above 45 mV/V corresponding to 2-8 % sulphide-bearing rocks (Table 1) (Telfold, 1990). Both levels of prominent IP anomalies were also correlated with drill-hole data. The lineaments on these depth slices were assumed to follow fractures – including those without slips and faults. These inferred fractures can be grouped into three N-S trending domains: W, C and E zones (Figures 2 and 3). The resistivity and IP anomalies outlined on depth slices were interpolated to create three-dimensional models.
33

Bulletin of Earth Sciences of Thailand
Lao-anuson and Chantraprasert_Structure of copper deposit. BEST, Vol. 4, No. 1, pp. 31-43.
Table 1. IP values in mV/V for common materials (after Telford et al., 1990).
Figure 2. Resistivity depth slice at 69 m below the surface. W, C and E denote N-S trending zones where most structures were interpreted. Contour interval is 50 ohm-m.
34

Bulletin of Earth Sciences of Thailand
Lao-anuson and Chantraprasert_Structure of copper deposit. BEST, Vol. 4, No. 1, pp. 31-43.
Figure 3. IP depth slice at 69 m below the surface. W, C and E denote N-S trending zones where most structures were interpreted. Contour interval is 10 mV/V.
35

Bulletin of Earth Sciences of Thailand
Lao-anuson and Chantraprasert_Structure of copper deposit. BEST, Vol. 4, No. 1, pp. 31-43.
3. Results and discussion 3.1 Interpretation of resistivity data
Based on their orientation, the fractures can be grouped into four sets trending, N-S, NE-SW, NW-SE and E-W, with the N-S trending set being the most dominant (Figure 4). The C zone has evenly distributed fractures, whereas the fractures in the W and E zones are localized. The fractures in the C zone and at shallower depths have higher density than those in other zones and at greater depths. The fractures are discontinuous particularly those in the C zone where they have different orientations and crosscut each other (Figure 4). On resistivity depth slices, N-S trending fractures appear to be crosscut by the fractures of other trends (NE-SW, NW-SE and E-W). Although the crosscutting locations do not necessarily have offsets nor imply timing relationships, in the three-dimensional model, some N-S trending fractures (p, q, r and s) appear offset in a left-lateral sense by two NE-SW trending fractures (Figure 5). The amounts of apparent offset vary along strike, decreasing from about 300 m
in the east to about 150 m in the west. Such a variation in displacement suggests that both NE-SW trending fractures are faults with their centers located to the east of the area and tips to the west. In the other three-dimensional display (Figure 6), N-S trending fractures are crosscut by NW-SE trending fractures. Both fracture sets are, in turn, crosscut by E-W trending fractures. However, in this case, the crosscutting relationship between these fracture sets shows no definite nor consistent offset (Figure 6).
High resistivity anomalies (values above 200 Ω-m are located in the northern, central and southeastern parts of the study area (Figure 4). The positive anomalies are elliptical in plan view with long axes oriented N-S, coincident with the orientation of prominent fractures. Most of these anomalies are also encased within N-S trending fractures. The anomalies are larger and stronger at shallow depths. In three dimensions, these anomalies are isolated and cone-shaped with steep sides (Figure 7).
Figure 4. The interpretation of resistivity slices at depths of 6, 69, 119, 169 m (a,b,c and d respectively) showing four fractures sets trending N-S, NW-SE, NE-SW and E-W. The light grey areas indicate resistivity anomalies with values above 200 ohm-m. W, C and E separated by grey dashed lines denote areas where most fractures were interpreted.
36

Bulletin of Earth Sciences of Thailand
Lao-anuson and Chantraprasert_Structure of copper deposit. BEST, Vol. 4, No. 1, pp. 31-43.
Figure 5. The 3D model of fracture interpretation from resistivity data in the C zone showing N-S trending fractures (grey surface labeled p, q, r and s) crosscut by NE-SW trending left-lateral strike-slip faults (black surfaces). Figure 6. The 3D model of resistivity interpretation showing E-W trending fractures (grey surfaces) crosscutting the N-S (black surfaces) and NW-SE (white surfaces) fracture sets. In the northern and western parts of the model the N-S trending fractures are also crosscut by the NW-SE trending fractures. W,C and E indicate the fracture sets referred to in text.
37

Bulletin of Earth Sciences of Thailand
Lao-anuson and Chantraprasert_Structure of copper deposit. BEST, Vol. 4, No. 1, pp. 31-43.
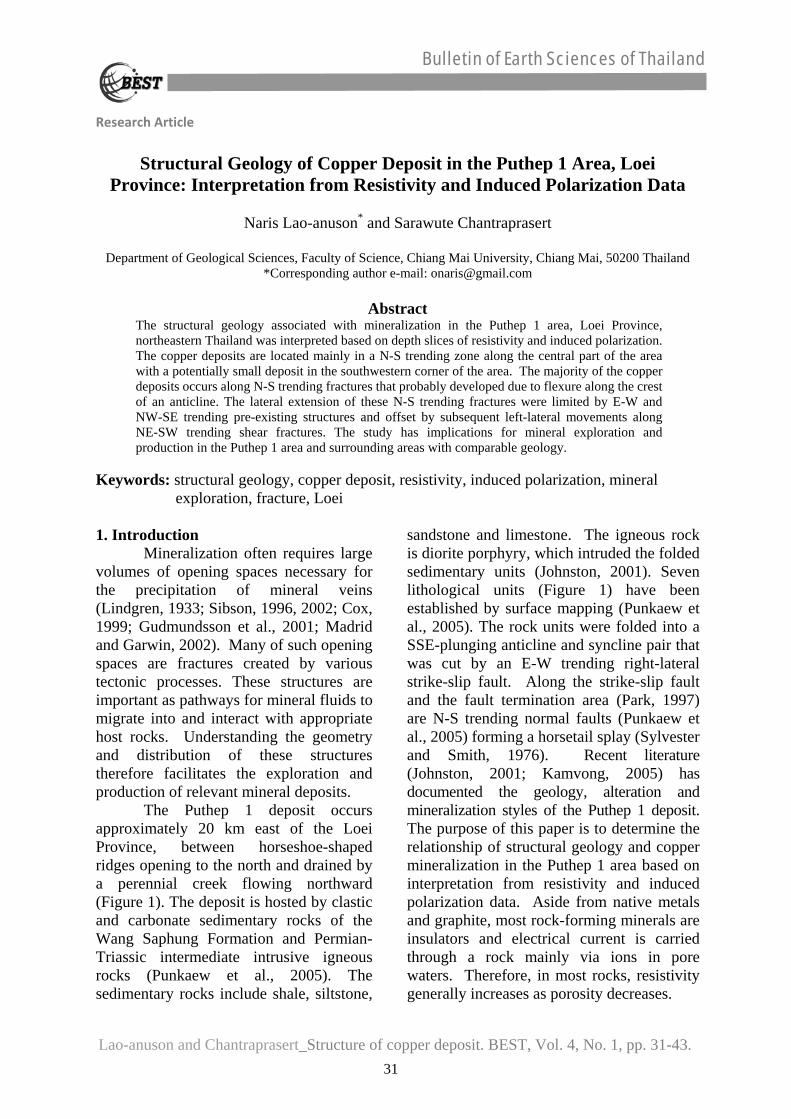
Figure 7. The 3D model showing interpolated positive-resistivity bodies with steep sided cone-shaped geometries. 3.2 Interpretation of induced polarization data The fractures interpreted from IP data can be grouped into four common orientation sets: N-S, NE-SW, NW-SE and E-W domains, with the N-S domain being the most dominant (Figure 8). The fractures on slices at shallower depths have higher density than those at greater depths. The length of the fractures increases with depth. Most long fractures mark the flanks of prominently positive anomalies. The fractures in the C zone have higher density than those in the W and E zones. The fractures in the W and E zones are localized, whereas those in the C zone are evenly distributed. Most fractures are discontinuous, especially those in the C zone and at shallow slices. They have different orientation and crosscut each other. In the three-dimensional model, the southern part of the W zone has E-W trending fractures crosscutting the NW-SE and N-S trending fractures, whereas the southern part of the C zone has E-W trending fractures crosscutting the N-S trending fractures (Figure 9). N-S trending fractures terminate against the NW-SE trending fractures in the northern part of the W zone. The southern parts of the W zone and C zone are crosscut by NE-SW
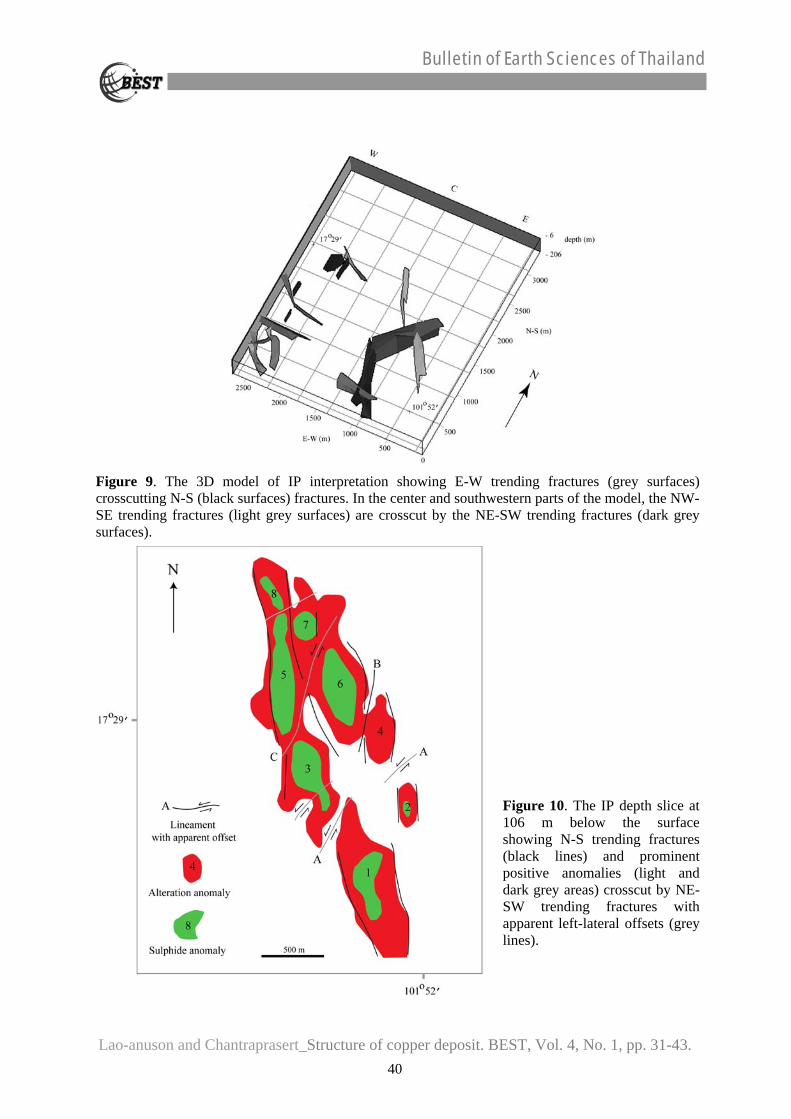
trending fractures. The interaction between the N-S and NE-SW fracture domains is related to mineralization in the study area. The mineral zones of the Puthep 1 area are located between the N-S trending fractures in the C zone that are crosscut by NE-SW trending fractures with apparent left-lateral offsets (Figure 10).
Prominent IP anomalies are located in
the C zone and in the southwestern part of the study area (Figure 8). The positive anomalies are larger and stronger at greater depths. They are elliptical in plan view with longer axes oriented N-S, consistent with the orientation of prominent fractures. Most of these anomalies are also encased within N-S trending fractures. The positive anomalies representing alteration and sulphide rocks can be grouped into two NNW-SSE trending zones with an additional isolate body in the southwestern part of the area (Figure 11). The amplitudes of the anomalies increase with depth. They form sub-vertical dyke-like bodies. The alteration anomalies are connected, whereas the sulphide anomalies are not. The above characteristics imply a concentration of sulphide minerals at deep levels in the C zone. This result conforms with the resistivity anomalies (Figure 12).
38

Bulletin of Earth Sciences of Thailand
Lao-anuson and Chantraprasert_Structure of copper deposit. BEST, Vol. 4, No. 1, pp. 31-43.
Figure 8. The interpretation of IP slices at the depths of 6,69, 119 and 169 m (a, b, c and d respectively) showing four fracture sets trending N-S, NW-SE, NE-SW and E-W. The light grey and grey areas indicate sulphide and alteration anomalies with values above 45 and 32 mV/V respectively. W, C and E separated by grey dashed lines denote areas where most fractures were interpreted.
39
Bulletin of Earth Sciences of Thailand
Lao-anuson and Chantraprasert_Structure of copper deposit. BEST, Vol. 4, No. 1, pp. 31-43.
Figure 9. The 3D model of IP interpretation showing E-W trending fractures (grey surfaces) crosscutting N-S (black surfaces) fractures. In the center and southwestern parts of the model, the NW-SE trending fractures (light grey surfaces) are crosscut by the NE-SW trending fractures (dark grey surfaces).
Figure 10. The IP depth slice at 106 m below the surface showing N-S trending fractures (black lines) and prominent positive anomalies (light and dark grey areas) crosscut by NE-SW trending fractures with apparent left-lateral offsets (grey lines).
40

Bulletin of Earth Sciences of Thailand
Lao-anuson and Chantraprasert_Structure of copper deposit. BEST, Vol. 4, No. 1, pp. 31-43.
Figure 11. The 3D model showing interpolated positive IP anomalies inferred as alteration (a) and sulphide contents (b) with NNW-SSE trending dyke-like geometries. Figure 12. Map showing location of positive resistivity anomalies and inferred alteration and sulphide IP anomalies. Most positive resistivity anomalies overly the alteration and sulphide anomalies.
41

Bulletin of Earth Sciences of Thailand
Lao-anuson and Chantraprasert_Structure of copper deposit. BEST, Vol. 4, No. 1, pp. 31-43.
3.3 Discussion
A comparison of the fractures and resistivity and IP anomalies demonstrates a close relationship between structural geology and mineralization in the Puthep 1 area. This fracture interpretation consists of four orientation-based sets: N-S, NE-SW, NW-SE and E-W domains. The dominant N-S domain is parallel to an anticline axis in the sedimentary host rocks (Punkaew et al., 2005) and the regional trend of the diorite porphyry intrusions, one of the important types of copper mineralization in the study area (Johnston, 2001; Kamvong, 2005). Both geophysical datasets suggest the existence of N-S trending sulphide zones of elevated resistivity anomalies near the surface overlying NNW-SSE trending zones of elevated IP anomalies at depth. A body of elevated IP anomaly in the southwestern corner of the area underlies a positive resistivity anomaly possibly indicating a zone of alteration. Other fracture domains crosscut the N-S fracture domain and the resistivity and IP anomalies.
According to the above findings, it could be inferred that the dominant N-S trending lineaments in the geophysical data are tensile fractures that controlled the location of diorite intrusion. Since the diorite has been dated at 248±6 Ma (Early Triassic?) (Kamvong, 2005), these fractures probably developed due to flexure along the crest of the N-S trending anticline that formed by E-W compression during the Indosinian Orogeny –collision between Shan-Thai and Indochina (Searle and Morley, 2011). Having no coherent offsets, the NW-SE and E-W trending features were possibly pre-existing structures or heterogeneity that prevent lateral propagation of the N-S trending fractures. The NE-SW fracture domain crosscut the previously formed N-S trending fractures with apparent left-lateral strike-slip offsets consistent with E-W extension. This post-Early Triassic
extension could be related to either the opening of Triassic basins beneath the Khorat Plateau or the Tertiary extensional basins in the Central Plains (Morley et al., 2011).
This study provides quantitative information applicable in drilling plans, exploration in surrounding areas and an analogue for the studies and exploration of mineral deposits with comparable geology.
4. Conclusions
Geological structure is arguably one of the principal factors influencing the geometry and distribution of the Puthep 1 deposit. The copper was deposited mainly in the central part of the area with a small isolate potential deposit in the southwest. Based on geophysical interpretation, most deposits occur along N-S trending fractures, the distribution of which was affected by linear features of other orientations. The formation of the fractures along the crest of a N-S trending anticline probably provided pathways and enhanced permeability for fluid-flow during igneous intrusion and hence the original location of mineral deposits. The lateral extension of these fractures were either restricted by pre-existing heterogeneous zones or offset by subsequent strike-slip movements. 5. References Cox, S.F., 1999, Deformational controls on
the dynamics of fluid flow in mesothermal gold systems, in: McCaffrey, K., Lonergan, L., Wilkinson, J., (eds.), Fractures, Fluid Flow and Mineralization, Geological Society of London, Special Publication 155, 123-139.
Gudmundsson, A., Berg, S.S., Lyslo, K.B. and Skurtveit, E., 2001, Fracture networks and fluid transport in active fault zone. Journal of Structural Geology, 23, 343-353.
Johnston, A.C., 2001, Puthep1 deposit feasibility study: geological model, Consultants report.
42

Bulletin of Earth Sciences of Thailand
Lao-anuson and Chantraprasert_Structure of copper deposit. BEST, Vol. 4, No. 1, pp. 31-43.
Kamvong, T., 2005, Geology and Genesis
of Porphyry-Skarn Cu-Au Deposits at the Northern Loei Fold Belt, Northeast Thailand and Laos, Preliminary Results for Puthep Company Ltd, 26.
Kearey, P., and Brooks, M., 1984, An introduction to geophysical exploration. Geoscience texts. vol. 4, 289 p.
Khesin, B., Alexeyev, V., and Eppelbaum, L., 1997, Rapid methods for interpretation of induced polarization anomalies. Journal of Applied geophysics. 37, 117-130.
Lindgren, W., 1933, Mineral Deposits. Mcgraw Hill, 155-163.
Loke, M.H., 2000, Electrical imaging surveys for environmental and engineering studies; A practical guide to 2-D and 3-D surveys, 67p.
Madrid, R.J. and Garwin, S.L., 2002, Structural methods for targeting gold deposits, northern Carlin trend, Nevada, In: Swager, C.P., Stone, B., Reddy, S., (eds), Applied Structural Geology for Mineral Exploration and Mining, Kalgoolie 2002, Australian Institute of Geoscientists, Extended Abstracts, 118-121.
McNeill, G., 2008, Resistivity and Induced polarization data review, Khumsup Siam reports for Puthep Company Ltd, 28.
Morley, C.K., Charusiri, P., and Watkinson, I.M., 2011, Structural geology of Thailand during the Cenozoic. The Geology of Thailand. The Geological Society, London 273-334.
Nguyen, F., Garambois, S., Jongmans, D.,
Pirard, E., and Loke, M.H., 2005, Image processing of 2D resistivity data for imaging faults. Journal of Applied Geophysics. 57, 260-277.
Park, R.G., 1997, Foundation of Structural Geology (3rd ed.), Chapman and Hall, London, 202.
Punkaew, T., Sonjai, P., Thummanon, P. and Sangsrichan, M., 2005, Geological Mapping in Baan Nong Na Saiy, Mueang Loei District, Loei Province, Thailand, Chiang Mai University, 58, (in Thai).
Searle, M.P. and Morley, C.K., 2011, Tectonic and thermal evolution of Thailand in the regional context of southeast Asia. In: M.F., Barber, A.J. & Crow, M.J., The Geology of Thailand, Geological Society, London, 539-571.
Sibson, R.H., 1996, Structural permeability of fluid-driven and fault-fracture meshes. Journal of Structural Geology 18, 1031-1042.
Sibson, R.H., 2002, Stress and fluid pressure controls on mineralization. In: Swager, C.P., Stone, B., Reddy, S., (eds). Applied Structural Geology for Mineral Exploration and Mining, Kalgoolie 2002, Australian Institute of Geoscientists, Extended Abstracts, 189-191.
Sylvester, A.G. and Smith, R.R., 1976, Tectonic transpression and basement-controlled deformation in San Andreas Fault Zone, Salton trough, California. Bulletin of the American Association of Petroleum Geologists 60, 2081-2120.
Telford, W.M., Geldhart, L.P., and Sheriff, R.E. 1990, Applied Geophysics second edition, Cambridge University Press, Cambridge, 770 p.
43


