Embed Size (px)
Citation preview

STRUCTURALFACTORS IN THE EUHOUSING MARKETS
March 2003
EC
B
EZ
B
EK
T
BC
E
EK
P
STRUCTURALFACTORS IN THE EUHOUSING MARKETS
March 2003

© European Central Bank, 2003
Address Kaiserstrasse 29
D-60311 Frankfurt am Main
Germany
Postal address Postfach 16 03 19
D-60066 Frankfurt am Main
Germany
Telephone +49 69 1344 0
Internet http://www.ecb.int
Fax +49 69 1344 6000
Telex 411 144 ecb d
All rights reserved.
Reproduction for educational and non-commercial purposes is permitted provided that the source is acknowledged.
The views expressed in this paper do not necessarily reflect those of the European Central Bank.
ISBN 92-9181-344-3 (print)
ISBN 92-9181-345-1 (online)

3ECB • S t r u c tu ra l f a c t o r s i n t he EU hous i ng marke t s • March 2003
Executive Summary 4
1 The importance of housing markets for the overall economy and formonetary policy 81.1 Relevance of housing market developments 81.2 Housing markets, economic activity and the transmission mechanism
of monetary policy 81.3 Rents and the Harmonised Index of Consumer Prices 121.4 House prices, credit developments and financial stability 121.5 Housing markets and the supply side 131.6 Concluding remarks 13
2 House price dynamics and their determinants 142.1 Introduction 142.2 Overview and long-term growth of real house prices since 1980 162.3 Cyclical volatility and synchronisation of EU house prices 182.4 Determinants of house price dynamics 212.5 House price fluctuations: some policy-related issues 25
3 Rent dynamics 263.1 Introduction 263.2 The evolution of rent controls and of social renting in EU countries 273.3 Rents, consumer prices and house prices 303.4 Rented accommodation: some policy issues 33
4 Housing taxes, subsidies and transaction costs 354.1 Introduction 354.2 Evolution of tax policies and subsidies in EU countries since 1990 354.3 Evolution of public expenditure on housing policies and social housing policies 384.4 The micro-management of housing markets 394.5 Housing taxes and subsidies: policy-related issues 40
5 Mortgage markets 405.1 The interrelationship between mortgage and housing markets 405.2 Characteristics of mortgage contracts 415.3 Mortgage debt 425.4 Mortgage borrowing as a source of extra liquidity 455.5 The housing credit system: some policy-related issues 48
Annex 1: Chronology of main policy measures 52
Annex 2: Data sources 55
Contents

ECB • S t r u c tu ra l f a c t o r s i n t he EU hous i ng marke t s • March 20034
Executive Summary
This report, prepared by the Task Force onHousing of the Monetary Policy Committeeof the European System of Central Banks(ESCB), examines the origins and effects ofhousing market fluctuations in the EuropeanUnion (EU) and provides an overview ofdevelopments in EU housing markets since 1980.The emphasis is on structural aspects of thehousing market that may influence the effects ofmonetary policy on economic activity andprices, in particular residential property priceand rent dynamics, housing taxes and subsidies,and the main inter-linkages between housingmarkets and mortgage markets that may giverise to financial cycles. The report presentscross-country information on housing markets,often of a non-harmonised nature, and hasbenefited from contributions of the EU nationalcentral banks (NCBs).
The importance of housing markets for theoverall economy and for monetary policy
There are manifold reasons for theconsiderable attention economists andmonetary policy-makers pay to developmentsin the housing markets.
First, housing wealth is an important part ofthe net worth of the private sector andhousing-related expenses (e.g. mortgagepayments or rents) represent a major part ofhousehold expenditure. Thus changes inresidential property prices (hereinafterreferred to as “house prices”), rents andmortgage interest rates may have a significantimpact on aggregate demand and inflation,and play an important role in the transmissionmechanism of monetary policy. Understandingthe factors that drive house prices and rentsis crucial for understanding the role housingmarkets play in the overall economy. Inparticular, monetary policy needs to identifythe sources and nature of the shocks drivinghouse price and rent fluctuations in order tounderstand their implications for the outlookfor price stability and to formulate theappropriate policy response.
Second, various episodes of boom and bustin house (and other asset) prices in a numberof developed economies have triggeredattention to the role of house prices inprompting financial cycles and on theimplications of sharp price fluctuations forfinancial stability. Understanding theinterrelationships between mortgage andhousing markets is important in this respect.They also affect the transmission mechanismof monetary policy.
Finally, the functioning of the housing marketmay have implications for the supply side ofthe economy, in particular, for labour mobilityin the EU. High transaction costs in housingmarkets and the existence of (non-portable)housing-related benefits hinder labourmobility across and within EU countries.
House price dynamics
Real house prices in most EU countries followlong cycles around a moderate upward trend.In the period since 1980, house price cyclesin many EU countries have often lasted morethan ten years. In real terms (i.e. deflated bythe private consumption deflator), houseprices are typically found, in the “long run”(over two decades), to have risen by 0% to3% per annum across different countries.
On some occasions, real house prices in someEU countries have changed by more than 10%in either direction in consecutive years, asituation labelled as a “boom” or a “bust”.Since 1980, booms have been more frequentthan busts, especially in the euro areacountries, and have typically been followedby prolonged periods of very low growth oreven of decline in house prices. House pricebooms and busts have been observed morefrequently in the three Nordic countries andin the United Kingdom, but they have notbeen altogether absent from other EUcountries. Spain, Ireland, the Netherlands andthe United Kingdom have been among theEU countries that have recently experienced

5ECB • S t r u c tu ra l f a c t o r s i n t he EU hous i ng marke t s • March 2003
two-digit growth rates in house prices. Thelatest data for 2002 show clear signs of adeceleration of house price inflation in Irelandand the Netherlands, but double-digit annualgrowth rates in real house prices in Spain andthe United Kingdom. Greece and Italy alsoexperienced a rapid rise of house prices in2001-2002.
In the long run, the increase in real houseprices is mainly correlated with the risingcost of land for construction use. Land is ascarce resource, so that its cost is expectedto rise as demand for space suitable forconstruction purposes rises with theincreasing number of households and withhigher income. In the short run, the supply ofnew housing or the dismantling of the existinghousing stock can only respond sluggishly todemand shocks, so that house prices mayovershoot or undershoot their long-termtrend for considerable periods of time. Thus,house price fluctuations are part of thefunctioning of the housing market and do notnecessarily reflect “bubbles” or “frenzies”.However, it is often difficult to reconcile largereal house price increases in successive yearswith the development of the underlyingfundamentals.
Empirical literature suggests that house pricefluctuations are to a significant degreeattributable to macroeconomic conditions,in particular to changes in households’disposable income and income expectationsand to nominal and real interest rates.Although nominal interest rates are no longera substantial source of asymmetry in houseprice fluctuations in the euro area, pastfluctuations of interest rates as well asdifferent inflation rates and, thus, real interestrates are thought to have played an importantrole in recent movements of house prices.These, in turn, may have contributed todifferences in business cycles.
Despite the importance of macroeconomicfactors, the functioning of the housingmarkets depends largely on national and localfactors. Housing markets are “local” markets
in the sense that forces driving house priceequalisation are weak even within a singlecountry and even in the long run.Furthermore, various local structural factors,such as land availability, the local planningsystem and local taxes as well as institutionaland contractual features of the nationalhousing markets and housing credit systemsare likely to have a role in amplifying ordampening the effects of macroeconomicshocks on house prices at the local andnational levels. It is at the national and locallevel that appropriate policies need to beimplemented in order to prevent a seriousunder-supply or over-supply of housing fromdeveloping, which in turn can havemacroeconomic and financial implications ofrelevance for monetary policy.
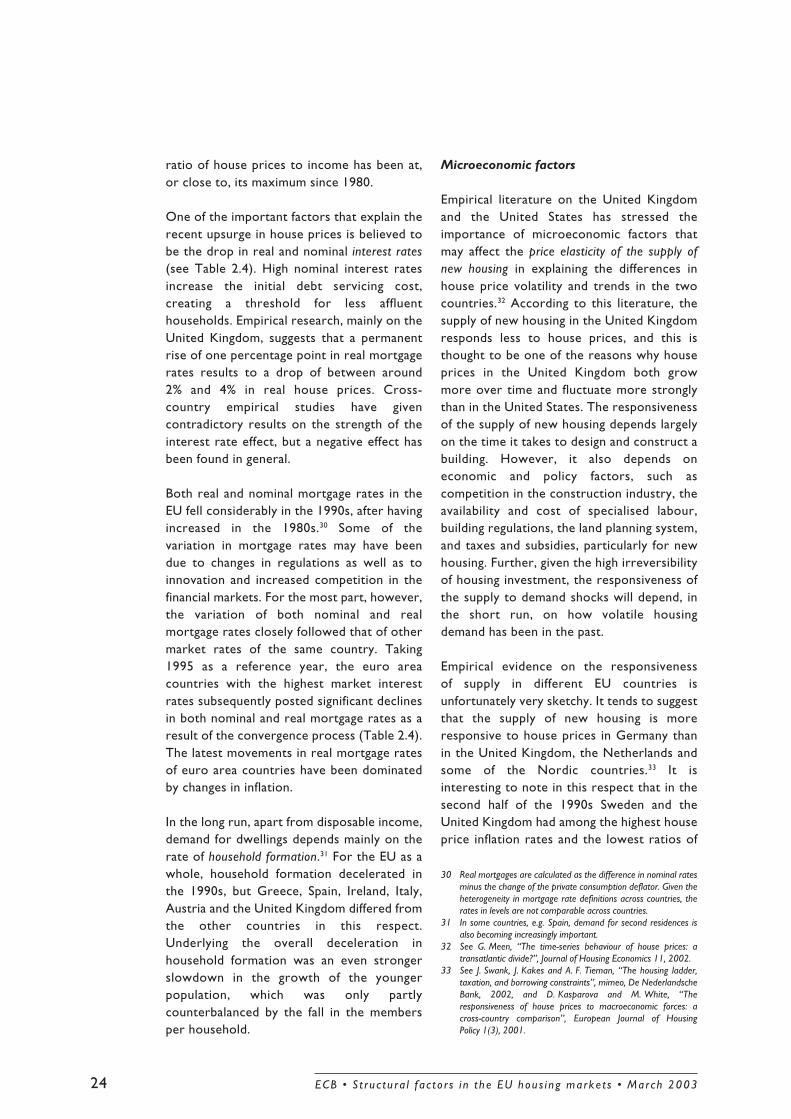
Rent dynamics
As an integral part of the housing market, thefunctioning of the rental sector can haveimplications for the rest of the market. Anefficient rental sector is likely to reducemobility costs and raise the liquidity of thehousing market. Moreover, with a weight ofabout 6% (both in the euro area and in theEU), rents are an important component ofthe Harmonised Index of Consumer Prices(HICP). Since 1997, nominal rents in the euroarea have risen, on average, by 1.7% perannum (1.9% in the EU) and have contributed0.1 percentage point per annum to euro area(and EU) HICP inflation.
The share of rented dwellings in the totalstock of housing in most EU countries hasbeen falling over the past 20 years. In somecases, this decline has been rather sharp.Although hard evidence is not available, it islikely that, at least in an earlier period, therelative decline of the rental sector in manyEU countries was attributable to a fall in thesupply of rental accommodation due to thestrictness of the rent-related regulatoryregimes. Tax systems, traditionally morefavourable to owner-occupied housing, arealso likely to have played a role.
ECB • S t r u c tu ra l f a c t o r s i n t he EU hous i ng marke t s • March 20036
In recent years, there has been somederegulation of rental markets, but importantsegments of the rental market in many EUcountries still operate under strict controlregimes, giving rise to market segmentation.Most EU countries have tended to relax rentcontrols in new contracts, but rents of sittingtenants are seldom adjusted to reflect housingmarket conditions, and short-term contractsare often not widely used. A sizeablediscrepancy between new rents and rents ofsitting tenants potentially has negative effectson labour mobility.
Despite rents rising more slowly than houseprices in most EU countries, it may havebecome more economical in recent years forhouseholds to buy rather than rent, becauseof the fall in interest rates. This is likely tohave resulted in declining demand for rentedaccommodation, contributing further to therelative shrinking of the rental sector.
Housing tax/subsidy systems
All EU governments have complex tax/subsidysystems in place that directly affect thehousing markets. This reflects the special roleof “housing” for public policy. The tax/subsidyregimes have tended to favour immovableassets rather than financial assets and owner-occupiers rather than landlords. In somecountries, they favoured purchases of newversus existing dwellings.
Housing taxes and subsidies have undergonesubstantial change in a number of EUcountries over the past decade. Overall, thetax/subsidy system has become more neutralwith respect to the different types of assets,but incentives for owner-occupied housinghave generally been reinforced vis-à-visrented accommodation, even thoughmeasures have become more targetedtowards low-income households in somecountries. Public expenditure on housing hasremained roughly stable, or has decreasedsomewhat where housing policies havebecome more focused. Some countries haveexperimented with the micro-management of
the housing market, including theintroduction of transaction taxes, withgenerally poor results. On some occasions,tax/subsidy reforms had to be changed only ashort period of time after having beenimplemented, thus adding to country-specificshocks faced by the national housing market.Sometimes policy measures have even turnedout to be pro-cyclical.
In view of the potential importance of therental sector for the efficient overallfunctioning of the housing market, the bias oftax relief and subsidies in favour of owner-occupied housing should be re-considered,particularly in those countries where theshare of the rental housing sector has fallento very low levels. A reduction of policy-induced transaction costs for owner-occupiedhousing would also foster labour mobility.
The mortgage market
Mortgage (and total) indebtedness hasincreased in most EU countries over the pastten years. This rise in mortgage indebtednessis to a large extent attributable to factorssuch as rising residential investment, higherincome expectations, falling interest rates anda tax treatment that is more favourable formortgages than for other loans. The recentproliferation of more flexible mortgagecontracts may have given previously credit-constrained households wider access tomortgage credit. Rising house prices may alsohave contributed to the accumulation ofmortgage debt by raising the collateral valueof the households’ assets. Despite the rapidrise of mortgage debt, the ratio of debtservicing costs to income is estimated to haveremained relatively constant in the secondhalf of the 1990s, because of falling mortgageinterest rates and rising incomes. The ratiohas been rising in different EU countries since2000.
Economic literature has highlighted how theinterplay between the housing and themortgage markets can strengthen the effectsof an original shock or of a change in

7ECB • S t r u c tu ra l f a c t o r s i n t he EU hous i ng marke t s • March 2003
monetary policy on house prices and finaldemand. This is because an initial increase inhouse prices, following a drop in interestrates, for instance, will increase the collateralvalue of the housing assets and thus improveaccess to mortgage-backed loans. The extraliquidity may feed back to the housing market,amplifying the effects of the original interestrate fall on house prices.
The extra liquidity may also go to financeextra final (non-housing) currentconsumption and/or the purchase of financialassets, thus strengthening the positive wealtheffects of house prices on final demand. Thisis referred to as “house equity withdrawal”.Tentative estimates suggest that house equitywithdrawal has recently been significant inDenmark, the Netherlands, Portugal and theUnited Kingdom. Gross of taxes andsubsidies, the household sector in thesecountries is estimated to have spentconsiderably less on housing investment thanit received in terms of mortgage-backed loansfrom the credit system. It should be noted,however, that these estimates may containsignificant measurement errors. In most otherEU countries, there were no signs ofsignificant house equity withdrawal.
Rising house prices are likely to havecontributed to house equity withdrawal, butthey were not the only reason for it. InPortugal, for example, house equitywithdrawal is seen to have taken place during
a period when house prices were notparticularly booming and despite the fact thatdirect equity withdrawal (through refinancinghigher amounts of a mortgage and/or secondmortgages) has not been common in thiscountry. The strong rise of mortgage debtcould have also reflected expectations forhigh income growth and lower interest rates.
As experience in some EU countries suggests,credit cycles are sometimes triggered byhouse price fluctuations. The resulting highindebtedness increases the vulnerability ofhouseholds to income shocks and interestrate changes and may eventually affect thestability of financial institutions. In view ofthis, careful consideration should be given tothe evolution of households’ indebtednessand to the appropriate risk assessmentprocedures.
The need for improved statisticalinformation
An important task of the Fourth StructuralIssues Report has been the collection ofcomparable data on housing markets. Thecollection of such data has proven hard,particularly for the euro area countries,restricting the scope of cross-countryanalyses. There is need for action aimed atimproving the standard of statistics onhousing markets across the EU countries.

ECB • S t r u c tu ra l f a c t o r s i n t he EU hous i ng marke t s • March 20038
1 The importance of housing markets for the overall economy andfor monetary policy
1.1 Relevance of housing marketdevelopments
In recent years, developments in the housingmarkets in general, and house prices inparticular, have received considerableattention from economists and monetarypolicy-makers. There are various reasons forthis. First, housing wealth is an importantpart of the net worth of the private sectorand housing-related expenses (e.g. mortgageor rent payments) represent an importantpart of household expenditure. Thusvariations in household wealth, income andexpenditure brought about by changes inhouse prices, rents and mortgage interestrates might have a significant impact ondemand and inflation, and play an importantrole in the transmission mechanism ofmonetary policy. Second, rents are animportant component of the consumer priceindex and therefore need to be closelymonitored in the assessment of the risks toprice stability. Third, various episodes ofboom and bust in house (and other asset)prices in a number of developed economieshave drawn attention to their role in shapingthe financial and business cycles and on theimplications of sharp price fluctuations forfinancial stability. Finally, the functioning ofthe housing market may have implications forthe supply side of the economy, especially forlabour mobility in the EU.
1.2 Housing markets, economic activityand the transmission mechanism ofmonetary policy
The link between housing markets and therest of the economy operates primarilythrough the effects of house pricefluctuations, as they represent the mainsource of fluctuations in housing wealth.Changes in house prices may be caused by avariety of factors that affect both the supplyof and the demand for housing.1 Moreover,house prices, like other asset prices, are
interest rate-sensitive and respond to changesin the monetary policy stance, therebycontributing to the transmission of monetarypolicy impulses to the economy.2
Economic research has identified variouschannels through which changes in houseprices are likely to affect economic activity.
A first channel operates through the effect ofhouse price fluctuations on residentialconstruction. A rise in house prices whichcauses an increase in the market value of thehousing stock relative to its reproductioncost, stimulates the construction of newdwellings as well as the renovation of existingdwellings. This effect is expected to build upquite gradually as it takes time to implementhousing investment projects and there maybe constraints related to the availability ofland for construction, planning policy andcompetition conditions in the constructionsector. Residential investment representsabout 4.9% of the gross domestic product(GDP) in the EU and 5.5% of GDP in theeuro area, varying between about 2.1% to8.8% of GDP in the different countries (seeTable 1.1).
A second impact of changes in house pricesoften discussed in literature is the wealtheffect on non-housing consumptionexpenditure and, thereby, on aggregatedemand in the rest of the economy. In thisrespect, it should be taken into account thathouses (contrary to other assets such as
1 See Section 2 of this report.2 In general, an unanticipated decrease in short-term interest
rates should lead to an increase in house prices. In fact, to theextent to which lower short-term interest rates are reflected inlower mortgage rates, this may increase the demand for housingproperty and, thereby, house prices (given an inflexible supply inthe short run). As holds true of other asset prices (e.g. bonds andequities), higher house prices must reflect the increase in thecurrent value of services flows (and rent payments) from housing.Other effects may derive from increased income expectations,changes in financial asset prices and from expectations offurther house price increases and speculative behaviour. SeeMuellbauer and Murphy, “Booms and busts in the UK housingmarket”, Economic Journal, November 1997, pages 1701-1727.

9ECB • S t r u c tu ra l f a c t o r s i n t he EU hous i ng marke t s • March 2003
bonds or equity) also provide services tohouseholds.3 In particular, house prices reflectthe current value of the stream of futureexpected rents (or imputed rents for owner-occupiers).4 If higher rents are the maindriving factor, then a rise in house prices willnot only increase the market value of thewealth of house owners, but also reflect ahigher cost of consuming housing servicesfor both owner-occupiers (in the form ofhigher imputed rents) and tenants in therental market sector. In this case, changes inhouse prices may have ambiguous effects onnon-housing consumption as they entail aredistribution of resources between tenantsand prospective new buyers, on the one hand,and current homeowners, on the other.5 Thetotal effect on non-housing consumption willdepend on their different reactions. It iscommonly believed that the higher theproportion of owner-occupiers, the larger
Table 1.1Overview of EU housing sector(in %)
Source: See Annex 1.1) Weights for the average euro area and EU share of ownership are based on the latest available number of dwellings per country.2) The ratio of mortgage debt to GDP reported here is not strictly comparable across countries. The ratios of euro area and EU
average mortgage debt to GDP should therefore also be treated as approximations. See Section 5.3) House prices for Germany refer to West Germany, while they refer to 2000 and 1999 in the case of Luxembourg and Austria
respectively. Euro area and EU GDP-weighted average house prices.
Ratio of Share of Ratio of House price Rent HICPresidential owner mortgage inflation inflation inflationinvestment occupied debt to (nominal) 3)
to GDP dwellings 1) GDP 2)
Latest2001 available 2001 2001 2001 2001
Belgium 4.8 72 28 5.3 1.9 2.4Germany 6.3 39 47 2.0 0.8 2.1Greece 4.8 80 12 11.3 4.0 3.7Spain 7.3 85 32 15.5 4.1 2.8France 4.2 58 22 6.5 0.5 1.8Ireland 8.8 78 30 8.0 14.4 4.0Italy 4.5 69 10 5.7 2.1 2.3Luxembourg 3.2 67 29 9.1 3.0 2.4Netherlands 5.8 53 74 9.7 2.6 5.1Austria 5.0 56 30 -2.9 2.8 2.3Portugal 5.7 64 47 3.6 2.6 4.4Finland 4.5 64 21 -0.8 3.9 2.7
Denmark 3.5 59 67 5.8 2.7 2.3Sweden 2.1 53 58 7.9 1.7 2.7United Kingdom 2.8 68 60 8.1 3.3 1.2
Euro area 5.5 60 33 6.8 1.3 2.5EU 4.9 61 39 7.1 1.6 2.3
will be the consumption response to a rise inhouse prices.6 The proportion of owner-
3 See D. Miles, “Housing, Financial Markets and the WiderEconomy,” New York 1994: Wiley.
4 House prices are linked to rents through the arbitrage conditionbetween rents and the user cost of houses. See Section 3 of thisreport.
5 Increases in house prices will generally be to the benefit of thosewho aim to “trade down”, i.e. move to a smaller house, butharm those who aim to “trade up”. However, it may not bepossible for the society as a whole to collectively trade down. Thehousing market is typically a “closed” domestic market andhomeowners cannot in the aggregate realise their capital gains.Unless houses are traded internationally, the gain of a last-timeseller is also a loss for a first-time buyer in the same country. SeeD. Miles (1994), op. cit.
6 For owner-occupiers, the positive wealth (and substitution) effectof higher house prices on non-housing consumption is generallybelieved to dominate the negative income effect (higher imputedrents). The effects on consumption are unambiguously negativefor tenants in the rental market sector and for prospective newbuyers who have to save more for down-payments and canexpect higher prices. The effect is unambiguously positive forlandlords and/or institutional investors owning rental houses.See D. Maclennan, J. Muellbauer and M. Stephens,“Asymmetries in Housing and Financial Market Institutions andEMU”, CEPR discussion paper No. 2062, London 1999.

ECB • S t r u c tu ra l f a c t o r s i n t he EU hous i ng marke t s • March 200310
occupiers varies substantially in EU countries,ranging from 39% to 85% (see Table 1.1).7
If the increase in house prices is due to adecline in interest rates (which is expectedto be long lasting and not related to lowergrowth expectations), then a positive effecton (non-housing) consumption is more likelyto emerge, as the gain of homeowners wouldnot be accompanied by a loss of prospectivenew buyers. The latter could also finance theacquisition of a house at a lower cost.
The above considerations make it clear thatit is important to analyse the factors drivinghouse price movements in order to evaluatetheir implications for the economy. In general,the impact of house price changes oneconomy activity may vary, depending on thesource of the economic shock causing theprice changes.
An increase in the market value of residentialproperty can also affect consumption via athird important channel that has beenemphasised in recent economic literature,namely the credit channel. Credit marketimperfections, arising from asymmetricinformation and the associated screening andmonitoring costs in the banking sector, implythat consumers and firms face an externalfinance premium on the financing of loansand/or constraints on the possibility ofborrowing against their future income. In theso-called “financial accelerator” model, theexternal finance premium and the borrowingconstraints depend on the quality of balancesheets and the level of net worth of
7 Moreover, the fact that, empirically, rents react sluggishly tohousing market conditions (which depends, inter alia, on theregulatory framework for the rental market) also suggests thathouse price movements may predominantly have a positiveconsumption effect in the short term (see Section 3).
Table 1.2Selected comparative studies reporting long-run elasticities of housing market wealth(prices) in consumption functions(* denotes significance at conventional levels)
Study Housing wealth
Ludwig/Slok (2002)Panel of 16 OECD countries– All countries 0.036 *– Market-based countries– (including e.g. the United States, the United Kingdom, the Netherlands and Ireland) 0.043 *– Bank-based countries– (including e.g. Germany, France, Italy, Spain, Belgium and Finland) 0.015Based on house prices
Case/Quigley/Shiller (2001)Panel of 14 developed countries 0.131 - 0.166 *Based on wealth data
Boone/Girouard/Wanner (2001)– United States 0.03– France 0.05– Italy -0.06*Based on wealth data
Eschenbach/Schuknecht (2001)– United States 0.16 *– Germany not significant– France 0.05– Italy not significant– Average of 17 OECD countries 0.07Based on house prices
Sources: Ludwig and Slok: “The impact of changes in stock prices and house prices on consumption in OECD countries”, IMFWorking paper 02/1, 2002; Case, Quigley and Shiller: “Comparing wealth effects: the stock market versus the housing market”,NBER Working Paper No. 8606, 2001; Boone, Girouard and Wanner: “Financial market liberation, wealth and consumption”,OECD Working paper No. 308, 2001; Eschenbach and Schuknecht: “Asset prices and fiscal balances”, ECB Working Paper No. 141,2002.

11ECB • S t r u c tu ra l f a c t o r s i n t he EU hous i ng marke t s • March 2003
borrowers.8 Fluctuations in the market valueof residential property affect the collateralvalue of the assets of firms and householdsand, therefore, the level of the externalfinance premium and the availability of loans.An increase in property prices (bothcommercial and residential property) permitshouseholds and firms to borrow more tofinance consumption and investment. Thismechanism thus has the potential ofamplifying the propagation of monetaryimpulses to the economy.9 Various structuralcharacteristics of the retail finance andmortgage markets (such as the degree ofcompetition and the level of transactioncosts) influence the ability of house ownersto extract the equity embodied in housingwealth and, therefore, the quantitative impactof this channel of transmission. Availableevidence shows that house equity withdrawalappears to be of major quantitativeimportance in only a few EU countries.10
Finally, besides the effects of variations inhouse prices, housing markets contribute tothe transmission mechanism of monetarypolicy via a fourth channel, i.e. via the effectsof monetary policy changes on households’disposable income through the mortgagemarket. Changes in mortgage rates caused bya change in the monetary policy stance willdirectly affect households’ disposable income(net of interest payments) and, thereby, theirconsumption and investment decisions, asmortgage payments are an important part oftotal household costs. The size of themortgage debt outstanding and thecharacteristics of the mortgage contracts (and,thereby, the sensitivity of mortgage rates toshort-term interest rates) are crucial factorsin this context. For example, when mortgagesare predominantly at a fixed rate of longduration and if refinancing is not a commonpractice, the short-term interest rate effecton disposable income will be small. The totalamount of average mortgage debt outstandingis about 39% of GDP in the EU and 33% ineuro area, but this proportion variessubstantially among countries (see Table 1.1).Clearly, the household sector is ultimatelyalso the recipient of the larger interest flows,
8 See B. Bernanke, M. Gertler and S. Gilchrist, “The FinancialAccelerator in a Quantitative Business Cycle Framework”, inJ. Taylor, and M. Woodford (eds.), The Handbook ofMacroeconomics, Vol. 1, North-Holland, Amsterdam 1999.
9 See M. Iacoviello, “House prices, borrowing constraints andmonetary policy in the business cycle,” Boston College, mimeo,2002.
10 See Section 5.11 More generally, the income effect of changes in interest rates on
consumption will depend on the net financial worth position ofthe household sector (associated with interest receipts/payments),which is positive in EU countries.
12 Moreover, further to the issues related to interest servicing, theneed to service principal may become important in two particularsituations: (a) following a period of over-borrowing by households,a change in the underlying economic conditions may forcehouseholds to increase their savings rate disproportionately inorder to service the principal. Consequently, the volatility ofconsumption and investment are exacerbated and recessionstend to be deeper and more prolonged; (b) in deflationaryperiods, which may occur in conditions of sudden, unexpectedand extremely weak demand, the real value of debt keeps rising,even if it is stable in nominal terms. In such situations, realincome is likely to be growing very moderately, or may even bedeclining, a vicious cycle of a continuously rising real debt burdenthat leads to weaker demand may take place.
13 The figures reported are the result of different definitions ofvariables, sample periods, specifications of the consumptionfunctions and estimation methods, and are therefore notcomparable. A major difficulty in estimating this effect is that, asmentioned above, the consumption response will depend on thesource of the shock affecting housing prices and wealth. Some ofthese shocks may affect housing prices (and housing wealth)and consumption contemporaneously, making it difficult toidentify their direct impact on consumption, i.e. there is anintrinsic problem of endogeneity in estimating the relationshipbetween house prices and consumption. In this respect, apromising approach is followed by Iacoviello (2002, op. cit.) whoanalyses the effects of various shocks in the context of acalibrated dynamic general equilibrium model. He finds that theeffect of an exogenous shock pushing up house prices (modelledas a change in preferences) implies a short-run elasticity ofconsumption to house prices of 7%. In the context of his model,most of the effect is due to the presence of borrowing constraintsand the operation of the credit channel.
so that the final effect on consumption willdepend on the distributional impact of thechange in mortgage rates.11, 12
Empirical analysis seeking to evaluate theeffects of changes in house prices onaggregate demand and real activity is severelycurtailed by data availability problems,particularly in euro area countries. Despitethese limitations, some authors have tried toquantify the effects of variations in houseprices and housing wealth on economicactivity in general, and on consumption inparticular. Not surprisingly, the empiricalresults are often mixed. Table 1.2 summarisesthe results of some selected studies,reporting the elasticities of consumption withrespect to housing wealth.13 Overall, theresults could be consistent with a positive

ECB • S t r u c tu ra l f a c t o r s i n t he EU hous i ng marke t s • March 200312
effect of changes in house prices onconsumption, but the precise magnitude ofsuch an effect remains unclear for most EUcountries.14
1.3 Rents and the Harmonised Index ofConsumer Prices
Through the mechanisms described above,developments in housing markets affectaggregate demand in the economy andthereby also price developments. However,housing markets may impact inflation moredirectly via the rental housing market.
Rents are in fact an important component ofthe consumer price index which is referredto in the monetary policy assessment of therisks to price stability. Changes in rents havea contemporaneous and potentially sizeableeffect on consumer price inflation asmeasured by this index. The weight of rentsin headline HICP (excluding owner-occupiedimputed rents which are not included in theHICP) in both the EU and the euro areacurrently accounts for about 6% of the totalindex.15 Changes in rents as a result of, forexample, national tax policies or regulationshave the potential of generating importantsecond-round effects on price developments,in particular because they may impact onwage contracts.
1.4 House prices, credit developmentsand financial stability
Another reason for the increased interest inhousing markets stems from their role in thepropagation mechanism of financial andbusiness cycles and the potential implicationsof changes in housing wealth for financialstability. As the previous discussion hashighlighted, a positive correlation betweencredit and property (and other asset) pricescan be explained from both a credit demandand a credit supply perspective as a directimplication of the “financial accelerator”mechanism.
14 A common finding across several empirical studies is that, inrecent years, a number of structural factors such as institutionalchanges in the housing market and better availability of housingfinance for private investors appear to have strengthened thelink between house price fluctuations and consumption and thatthe sensitivity of consumption to changes in house prices hasincreased over the past 20 years.
15 The weight of housing-related expenditure (including rents andrunning costs) in the HICP is about 15%.
16 However, it should be kept in mind that house price fluctuationsare part of the normal functioning of the housing market and donot necessarily reflect “bubbles” (see Section 2).
In expansionary phases, households and firmsface improved financing conditions for theirconsumption and investment decisions, whichin turn stimulate higher credit availability,higher demand and higher asset prices. Theupward expansion may be further acceleratedif “irrational exuberance”, over-optimism andspeculative price-to-price behaviour phase in,driving asset prices above their fundamentaldeterminants.16
In phases of contraction, the process isreversed. Falling commercial and residentialproperty prices undermine the quality ofhouseholds’ and firms’ balance sheets, thuspossibly leading to a credit crunch anddepressive effects on the economy. Themechanism involved may be highly non-linear:when there is plenty of collateral, a fall inasset prices which still leaves a considerablecushion may have no impact at all, while theimpact may be considerable if balance sheetsare more stretched.
According to the Bank for InternationalSettlements (BIS), over past decades,movements in property prices, in particularthose of commercial property, have beencentral to the most pronounced financialcycles, and substantial booms and busts inthis market lie behind many of the problemsexperienced in Australia, Japan, the UnitedStates, the United Kingdom and the Nordiccountries in the late 1980s and early 1990s.Developments in residential property priceshave also shaped financial cycles, especiallyby creating financial headwinds duringeconomic downturns, which have retarded

13ECB • S t r u c tu ra l f a c t o r s i n t he EU hous i ng marke t s • March 2003
economic recovery.17 Moreover, an observedupward trend in household indebtedness in anumber of countries could in future increasethe potential for financial headwinds in thepresence of an extended economic slowdownand/or a significant increase in interest rates.
Monetary policy may face a certain dilemmain the event of a strong boom in the housingmarket taking place in a relatively weakgeneral economic environment with lowinflationary pressures on consumer prices. Inthese circumstances, lower official interestrates could fuel the boom or even a bubblefurther, thus later aggravating a possibly sharpdownward correction of house prices withnegative consequences for the overalleconomy.
1.5 Housing markets and the supplyside
Finally, developments in housing markets mayhave important implications for the supplyside of the economy, especially for labourmobility.18 To the extent that large differencesin house price levels, frictions, lowtransparency, high transaction costs and theexistence of (non-portable) housing-relatedbenefits in housing markets prevent labourmobility, they hinder the complete adjustmentof labour markets following economic shocks,which imply asymmetric effects acrossregions. Due to its lower transaction costs,an efficient rental market is also importantfor labour mobility. Available evidence tendsto suggest that current housing arrangementsin the EU could represent an impediment tolabour mobility, in addition to other structuraland institutional factors. By increasing theefficiency of the housing market, housing marketpolicies can enhance labour mobility and beexpected to contribute to increasing sustainablenon-inflationary growth.
1.6 Concluding remarks
Against the above background, it is clear thatit is important for monetary policy to include
the analysis of housing markets in its overallassessment of economic conditions. Thefollowing aspects, which are explored in moredetail in the rest of this report, appear ofparticular relevance.
First, house price fluctuations are animportant nexus between the housing marketand the rest of the economy, and can play arole in the transmission mechanism ofmonetary policy. Understanding the factorsthat drive house prices is crucial for evaluatingthe impact of the housing market on theoverall economy. In particular, monetarypolicy cannot react mechanistically to houseprices (nor to other asset prices), but needsto identify the source and nature of theshocks driving house price fluctuations inorder to understand their implications forthe outlook for price stability and toformulate the appropriate policy response.
Second, understanding the functioning of therental sector is important because rents area direct cost for a large number of householdsand an important component of the overallconsumer price index.
Third, public policies (taxes/subsidies/regulations) which affect the functioning ofthe housing market can be sources ofindependent shocks or may affect the wayhousing markets react to economic shocks.Moreover, it is important that housingpolicies are put in place that do not hinderthe flexibility of labour markets, in particularby reducing labour mobility, and thereby thecapability of countries and regions to respond
17 See Bank for International Settlements, 71st Annual Report,2001. See also K. Okina, M. Shirakawa and S. Shiratsuka, “AssetPrice Bubble and Monetary Policy: Japan’s Experience in theLate 1980s and the Lessons”, Monetary and EconomicStudies, 19(S-1), Special Edition February 2001, pages 395-450. According to the BIS, the liberalisation of financial marketsover the past few decades, while having improved the provisionof financial services and the allocation of resources, has alsoincreased the scope for pronounced financial cycles and theamplification of cycles in the economy (see Bank for InternationalSettlements, 72nd Annual Report, 2002).
18 See L. Cannari, F. Nucci and P. Sestito, “Geographic labourmobility and the cost of housing: evidence from Italy”, AppliedEconomics, No. 32, 2000; G. Hughes and B. McCormick,“Housing Policy and Labour Market Performance”, DETR, 2000;and Maclennan, Muellbauer and Stephens (1999), op. cit.
ECB • S t r u c tu ra l f a c t o r s i n t he EU hous i ng marke t s • March 200314
efficiently to economic shocks in a singlecurrency area.
Finally, mortgage and housing markets arestrongly interlinked. Developments inmortgage rates and credit conditions affecthouse prices and thereby housing wealth. Atthe same time, fluctuations in house pricesaffect the collateral value of housing assets
and therefore the credit condition ofhouseholds. Examining the institutionalarrangements in the mortgage market is thekey to understanding this two-wayrelationship. For monetary policy, thisrelationship is important because it affects thetransmission mechanism of monetary policy.Moreover, it may in some circumstances impacton the stability of the financial sector.
2 House price dynamics and their determinants
2.1 Introduction
House price volatility, although generallylower than the volatility of financial assetprices, can have important effects oneconomic activity and financial stability.Housing assets represent a substantial part ofhouseholds’ portfolios, and even moderatehouse price fluctuations give rise to significantcapital gains or losses. The actual impact ofthese gains and losses on the consumption,savings and borrowing decisions ofhouseholds is likely to depend on the historyof the housing market and the structure ofcredit markets. A period of large changes willinevitably concentrate households’ minds onpotential capital gains in the housing market.This in turn is likely to make the housingmarket look more like a financial assetmarket. The more households take accruedor potential short-term capital gains/lossesinto consideration, the more the market islikely to be subject to fluctuations due tochanges in consumer confidence, expectationsand trading strategies. Phenomena of“irrational exuberance” that lead to bubblesmay also set in.
The above considerations have promptedeconomic literature to examine the factorsdriving house price dynamics in some detail.Important questions have been, first, whetherhousing market fluctuations are anindependent source of shocks or whetherthey just reflect macroeconomic fluctuationsand, second, whether certain institutions andpolicies can amplify or dampen the effect of amacroeconomic shock on house prices.Cross-country differences are far moredifficult to analyse, not least because of severeproblems in the comparability and reliabilityof house price data (see Box 1 on the“Accuracy and comparability of house pricedata”). Cross-country studies using a commonmethodology to examine different nationalhousing markets are rare.
With these caveats in mind, this sectiondescribes the house price trends and cyclesin the EU countries since 1980 and providesan overview of the main findings of empiricalliterature on the determinants of house pricedynamics. It differentiates between whatappear to be reasonably common cross-country features of housing markets in theEU countries and country-specific features.

15ECB • S t r u c tu ra l f a c t o r s i n t he EU hous i ng marke t s • March 2003
Box 1Accuracy and comparability of house price data
House price indices are constructed on the basis of non-harmonised national data from a variety of public and/
or private sources (national statistical services, mortgage lenders, real estate agents). National house price
series differ in their geographical coverage (e.g. main cities or country-wide), the coverage of the types of
dwellings (new or existing, flats or single houses, etc.), and they often cover only certain types of dwelling
transactions (only mortgage-financed or real estate brokered transactions). Most series are based on average
square metre prices, with varying degrees of correction for changes in the size of the dwellings involved in
transactions and their location (e.g. urban centre, periphery, etc.). Other quality adjustments are rare.
The table below provides a summary description and source of the house price indices used in this report.
Belgium Denmark Germany Greece Spain France Ireland Italy
Description Existing, small New and New dwellings, New and New and Existing New and New andand medium- existing West Germany existing existing, individual and existing recently
sized dwellings dwellings dwellings in excluding collective dwellings restructuredurban areas subsidised offered by real (simple dwellings
outside Athens dwellings estate agents average)
Source Real estate National Bundesbank Bank of Greece Ministry of Real estate Department of Banca d’Italiasector Statistical estimate based infrastructure sector Environment based on real
Institute on land prices and urban and Local estate sectorand residential planning Government dataconstruction based on dataprice index on loan
from Federal approvalsStatistical
Office
Luxembourg Netherlands Austria Portugal Finland Sweden United Kingdom
Description New and New and New and New and Existing flats Existing one or New andexisting one existing one- existing in the existing brokered by real two-dwelling existing
family houses, family houses area of Vienna dwellings estate agents. buildings dwellingsapartments and and flats Hedonic
apartment adjustmenthouses
Source Banque centrale De Real estate Banco de National National UK Govern-du Luxembourg Nederlandsche sector Portugal based Statistical Statistical ment Depart-
based on Bank based on on real estate Institute based Institute ment (Office ofNational land registry sector data on real estate the DeputyStatistical data sector data Prime Minister
Institute data based on a 5%survey of mort-
gage lenders
Description and sources of house price indices used in the report
The impact of these methodological differences on the reliability and comparability of the house price series is
difficult to judge a priori. Differences in coverage may have a particularly important effect on the short-term
dynamics of the series. For example, house prices based on samples of large cities are likely to be far more
volatile than country-wide data. Changes in the composition of the basket may both introduce “noise” in the
series (non-systematic errors) and affect the long-term trend of house prices. For example, a lack of adjustment
for location may introduce a downward bias in a price index for new dwellings, as these tend to be further
away from the urban centres as time progresses, whereas the lack of adjustment for quality improvements is
likely to give the price series an upward bias.
In the absence of reliable house price data, an alternative approach is to use land prices and construction costs
in order to approximate the evolution of house prices over time. This approach is chosen for estimating a
“surrogate” house price series for West Germany. In theory, a combined series of land prices and construction
costs should track developments in house prices, but this is not the case in practice in countries where all three
series are available (see below). Like house prices, land prices suffer from quality adjustment problems and, in
most countries (but not in Germany), they are based on a relatively small number of transactions.

ECB • S t r u c tu ra l f a c t o r s i n t he EU hous i ng marke t s • March 200316
2.2 Overview and long-term growth ofreal house prices since 1980
Real house prices in most EU countries havefollowed long cycles around an upward trend.In the period under examination (1980-2001),the length of the cycles seems in most casesto have been ten years or more, and theamplitude has generally been high (seeChart 2.1). During the upturn between thelate 1980s and early 1990s, real house prices(deflated by the private consumptiondeflator)19 typically rose by 30% or more fromtrough to peak and lost part of this increasein the subsequent downturn. Since about themid-1990s, real house prices have risen at anaccelerated pace in most EU countries,particularly so in Ireland and the Netherlands.
The latest data for 2002 show signs of adeceleration of house price inflation in Irelandand the Netherlands, but double-digit annualgrowth rates in real house prices in Spain andthe United Kingdom. Greece and Italy haverecently also experienced rapidly increasinghouse prices. For a number of EU countries,real house prices in 2002 were at their highestlevels since 1980.
In all countries except Sweden, real houseprices have risen over the long run, often
substantially so. With the exception ofIreland, average growth rates of over 3%were only reported for countries with shorttime series of house prices (see Table 2.1). Along-term trend of real house prices in therange of 0% to 3% is what one typically findswhen looking at long time series in the EUcountries.
In the long run, the growth of house pricesshould be approximately equal to that ofsupply costs, including the cost of land.20
Table 2.1 shows the average long-termgrowth rates of real construction costs(excluding land costs) and the real prices ofland for construction purposes. All variablesare deflated with the private consumptiondeflator. The increase of real constructioncosts (the cost of building materials andlabour) was not the prime reason for the realhouse price rise. In some cases, as in Ireland,the scarcity of labour in the constructionindustry pushed construction costs up, buteven in this case the long-term growth of
Table 2.1Annualised growth rate of real house prices, real construction costs and real landprices(in %)
Sources: National sources, ECB calculations. Also see Annex 2.Notes: All variables are deflated with the private consumption deflator. Land prices refer to the following periods: 1990-1999 in thecase of the Netherlands; 1990-1999 in that of Austria; 1980-1998 in that of Sweden; and 1981-2000 in that of the United Kingdom. Inthe case of Portugal, construction costs refer to the period from 1994 to 2001. Germany refers to West Germany.
Belgium Denmark Germany Greece Spain France Ireland ItalyPeriod 1981-2001 1980-2001 1980-2001 1994-2001 1987-2001 1980-2001 1980-2001 1980-2001
House prices 1.2 1.0 0.5 3.5 4.2 1.4 3.7 1.2Construction costs -0.5 0.0 0.1 0.1 -0.8 -0.7 1.5 -0.6Land prices 1.8 1.2 1.1 - - - - -
Luxembourg Netherlands Austria Portugal Finland Sweden United KingdomPeriod 1980-2000 1980-2000 1987-1999 1988-2001 1981-2001 1980-2001 1980-2001
House prices 2.6 2.3 3.5 0.4 1.9 -0.2 3.0Construction costs 0.3 0.0 1.2 0.7 1.1 -0.4 1.4Land prices 6.3 1.9 3.1 2.8 - 1.3 5.2
19 Throughout the report, the private consumption deflator is usedto calculate real house prices. Overall, results change very little ifthe HICP or the HICP excluding the rent item are used instead.
20 Another way of saying this is that, in the long run, Tobin’s q inhousing (= market value/replacement value) should be constant(and presumably close to unity), as is the case for everyinvestment good.

17ECB • S t r u c tu ra l f a c t o r s i n t he EU hous i ng marke t s • March 2003
Chart 2.1Real house prices(index 1995 = 100)
Source: See Annex 2.Note: Germany refers to estimated house prices in West Germany.
50
70
90
110
130
150
170
190
210
230
50
70
90
110
130
150
170
190
210
230
50
70
90
110
130
150
170
190
210
230
50
70
90
110
130
150
170
190
210
230
50
70
90
110
130
150
170
190
210
230
50
70
90
110
130
150
170
190
210
230
1981 1983 1985 1987 1989 1991 1993 1995 1997 1999 2001
1981 1983 1985 1987 1989 1991 1993 1995 1997 1999 2001
1981 1983 1985 1987 1989 1991 1993 1995 1997 1999 2001
BelgiumSpain
IrelandLuxembourg
NetherlandsGreece
GermanyFrance
ItalyAustria
Portugal
DenmarkFinland
SwedenUnited Kingdom
ECB • S t r u c tu ra l f a c t o r s i n t he EU hous i ng marke t s • March 200318
construction costs has remained well belowhouse price inflation. Instead, the long-termgrowth of real prices of land for constructionpurposes has generally been much higher andcloser to the growth of house prices.
In the long run, as a scarce resource, thecost of land is expected to increase asdemand for space rises. Planning rules, butalso transport and other infrastructures, willalso affect the premium on land forconstruction purposes over other types ofland. Planning rules and infrastructures maywell vary from location to location, evenwithin a country.21 Thus, the local scarcityand cost of construction land, combined withthe low demand substitutability for dwellingsin different locations, mean that the forces ofhouse price equalisation are weak even within asingle country and even in the long run.
This is clearly seen when comparing houseprices in the capital cities with those for therest of the country. Over periods of 15 to 20years, the former are typically found to rise 1to 2 percentage points faster per annum thanthose in the rest of the country. Such inflationdifferentials can only persist over the longrun if the rise of land prices is persistentlydifferent in the capital city than in the rest ofthe country.
2.3 Cyclical volatility andsynchronisation of EU house prices
The typical path of real house prices in manyEU countries contains cyclical movements ofboth long and short duration. This isillustrated in Chart 2.2 for Finland, whichprovides a particularly clear example. Thehouse price series for Finland is decomposedinto a long cycle (over eight years), short tomedium-run cyclical movements (betweenone-and-a-half and eight years) and “noise”.22
The chart shows both the long cycle, peakingin 1989, and the shorter-term cyclicalmovements, some of which are very sharp. Inless than three years, from the third quarterof 1986 to the first quarter of 1989, realhouse prices in Finland grew by a cumulative
65% and subsequently fell by a cumulative50% in four years.
In the last twenty years, most EU countrieshave experienced such a combination of longand short house price cycles, includingperiods of sharp growth and decline in realhouse prices. Defining “booms” and “busts”as periods with uninterrupted changes of atleast 10% per annum in real house prices, wefind that there have been 18 country-specificbooms in the EU (13 in the euro area) andten busts (five in the euro area) in the periodunder observation.23 Not every boom wasfollowed by a bust, and vice versa, but boomswere typically followed by long periods ofvery low growth or even of decline in realhouse prices. On average in the four yearsafter a boom, real house prices fell by closeto 3% per annum. The only EU countries notto have experienced a boom or a bust in theperiod under consideration are Germany andPortugal, but house price data for Portugalonly extend back to 1988.
Almost half of the “booms” and “busts” tookplace in the three Nordic countries and inthe United Kingdom. The relatively highvolatility of house prices in these countriesis to some extent also confirmed inTable 2.2, although any ranking of countriesin terms of the cyclical volatility of houseprices should be viewed with caution. Suchranking can change substantially, dependingon the period examined and on the houseprice series as well as on the volatilitymeasure used. In particular, the results for
21 Empirical literature on the United States confirms that zoningrules that affect the availability and cost of construction landalso affect the affordability of housing. See E. L. Glaeser andJ. Gyourko, “The impact of zoning on housing affordability”,National Bureau of Economic Research, working paper 8835,2002.
22 The Baxter and King filter was used for the decomposition. Thefrequencies were chosen to correspond with what is commonlyused to decompose cycles from trend in real GDP. For many EUcountries, we find that the short cyclical movements in realhouse prices are closely correlated with the real GDP cycle.
23 There is no established definition for booms and busts. The 10%threshold was therefore chosen arbitrarily. The periods from1986 to 1991 in Luxembourg and from 1983 to 1985 and1987 to 1990 in Denmark are counted as single boom or bustperiods, although there were intermittent years in all three caseswhen real house prices changed by less than 10% in absoluteterms.

19ECB • S t r u c tu ra l f a c t o r s i n t he EU hous i ng marke t s • March 2003
Chart 2.2Decomposition of the real house price cycle in Finland(real house prices measured as an index: 1995 = 100)
Belgium Denmark Germany Greece Spain France Ireland ItalyPeriod 1980-2001 1980-2001 1980-2001 1994-2001 1987-2001 1980-2001 1980-2001 1980-2001
Country 10.4 14.9 1.8 4.9 11.7 6.7 25.8 12.5Capital 10.5 20.0 - 9.8 12.7 21.1 31.7 16.8
Luxembourg Netherlands Austria Portugal Finland Sweden United KingdomPeriod 1980-2000 1985-2001 1987-1999 1988-2001 1980-2001 1981-2001 1980-2001
Country 7.3 16.9 13.5 4.1 26.2 15.0 16.2Capital - 15.8 - 4.6 34.8 23.4 24.0
Table 2.2Cyclical volatility of real house prices(standard deviation of de-trended series; real house prices measured as an index: 1995=100)
Sources: National sources, ECB calculations. Also see Annex 2.Note: Germany refers to West Germany.
Source: ECB estimation; also see Annex 2.
Ireland and the Netherlands depend heavilyon whether one attributes their recent houseprice growth to a (very long) cycle or to anupward sloping trend. The linear trend usedhere attributes the recent price changes tothe cycle and, consequently, both countriesare ranked among those with high house pricevolatility.24
Table 2.2 also shows that house pricevolatility can vary substantially withincountries. In general, when compared over
the same period of time, house prices incapital cities tend to be much more volatilethan in the rest of the country.25 This may
24 Annual data and a linear trend are used for reasons ofcomparison. Given the very long cycles of house prices and theavailable series of 21 years, other de-trending techniques do notseem appropriate. Volatility statistics across countries are notstrictly comparable because of different periods of observation.
25 Note that capital city prices are deflated here by the nation-wideprivate consumption deflator. Consumer prices may also bemore variable in the capital cities than in the countryside, butthis is unlikely to change the above results significantly. Forexample, the standard deviation of de-trended house prices inRome, deflated with the Rome-specific CPI, is 17.6 for theperiod 1981-2001.
-40
-20
0
20
40
60
80
60
80
100
120
140
160
180
short cycle (left-hand scale)long cycle (right-hand scale)
1983 1985 1987 1989 1991 1993 1995 1997 1999

ECB • S t r u c tu ra l f a c t o r s i n t he EU hous i ng marke t s • March 200320
simply reflect an aggregation bias. Whenaggregating at the national level, many of thelocal effects on housing markets cancel out.Even so, the functioning of local housingmarkets is not irrelevant for the nationalaggregate. To take an often-cited example,differences between house price volatility inGermany and in the United Kingdom may bepartly due to factors such as the distributionof the population and of economic activity inthe national territories. Little is known onhow such regional questions affect nationalhouse price dynamics.
Given the geographical segmentation ofhousing markets, one would expect a priorithat the cycles of house prices in differentcountries are not highly synchronised. This isconfirmed in Table 2.3. The table shows thecorrelation of real house prices in eachcountry (de-trended) with the weightedaverage of real house prices (de-trended) inthe rest of the euro area and the EU(excluding the country in question). Forreasons of comparison, the table also givesthe correlation of the general index of stock
market prices in each country with theweighted average stock market index for therest of the EU (excluding the country inquestion, also de-trended).26
In this case as well, the results for individualcountries should be read with caution. Theydepend on the de-trending method, the serieschosen and the period considered.Nevertheless, there are two generalconclusions that are robust to differentmethodologies. First, cyclical correlationsbetween real house prices tend to besignificantly lower than between real stockmarket prices, as would be expected fromthe geographical segmentation of housingmarkets. Second, given the local character ofhousing markets, it is nevertheless surprisingthat at least some EU countries have had
Belgium Denmark Germany Greece Spain France Ireland ItalyPeriod 1980-2001 1986-2001 1980-2001 1994-2001 1987-2001 1980-2001 1983-2001 1980-2001
House prices ineuro area 0.36 -0.44 0.01 0.80 0.90 0.73 0.19 0.22House prices inthe EU 0.18 -0.20 0.01 0.82 0.91 0.81 0.28 0.07Stock marketprices in the EU 0.81 0.88 0.95 0.78 0.95 0.91 0.86 0.90
Luxembourg Netherlands Austria Portugal Finland Sweden United KingdomPeriod 1985-2000 1985-2001 1987-1999 1988-2001 1980-2001 1980-2001 1980-2001
House prices ineuro area 0.93 -0.15 0.79 0.69 -0.10 0.65 0.27House prices inthe EU 0.78 0.16 0.41 0.93 0.39 0.87 0.34Stock marketprices in the EU 0.94 0.83 0.02 0.91 0.84 0.90 0.89
Table 2.3Correlation of de-trended real house prices and of de-trended real stock marketprices with the respective weighted euro area and EU averages
Sources: National sources, ECB calculations. Also see Annex 2.Notes: All prices are deflated with the private consumption deflator and de-trended using a linear trend. The weighted average of de-trended real house and stock market prices for the euro area and the EU is constructed using the country GDP weights. Thecoefficients reported refer to the correlation between the house prices or stock market prices in each country and the respective euroarea or EU average series excluding the country in question. House price data for Germany refers to West Germany.
26 Annual averages are used for all variables for reasons ofcomparison. The very low correlation of the Austrian stock priceindex with the rest of stock price indices in the EU is mainlyattributable to the developments in period from 1988 to 1990when, unlike the rest of the EU, stock market prices in Austriaincreased sharply.

21ECB • S t r u c tu ra l f a c t o r s i n t he EU hous i ng marke t s • March 2003
Chart 2.3Standard deviation of annual growth rates of real house prices(growth rates measured in %)
Source: ECB calculations; see Annex 2.Note: Excluding Greece, Luxembourg and Austria, due to shorter time series.
relatively synchronous house price cycles inthe past 22 years.27 Chart 2.3 suggests furtherthat the dispersion of growth rates of realhouse prices across the EU and across theeuro area countries has fallen somewhat overthe past 15 years.
The correlation of house prices suggests thathousing markets in some EU countries mayhave been significantly influenced by similardevelopments in macroeconomic factors,such as income growth and interest ratemovements. This interpretation iscorroborated by existing empirical literatureon house prices that finds that disposableincome and mortgage interest rates areamong the most important determinants ofhouse price dynamics.
2.4 Determinants of house pricedynamics
As with other asset prices, explaining houseprice movements econometrically proves tobe a difficult task, given the complex dynamicsand the importance of expectations, in
particular in periods of booms and busts.28
Nevertheless, there are some stylised factsestablished by existing empirical literature.They mostly refer to the United Kingdom,but also find confirmation in studies fromother EU countries.29 In particular, literature
27 Note that for a number of euro area countries (France, Ireland,the Netherlands, Portugal and Finland), the correlation with theweighted EU average turns out to be higher than with theweighted euro area average. This is a consequence of the factthat the house price cycle in these countries has been morecorrelated with the cycle of non-participating EU countries (theUnited Kingdom, in particular) than with the rest of the euroarea (and Germany, in particular).
28 Given the high autocorrelation of house prices (over the “long”cycle), much of the explanatory power of econometric models ofhouse prices derives from the lagged dependent variables, whichare rather uninformative about the underlying mechanism drivinghouse price dynamics. Booms and busts are particularly difficultto account for in an econometric model, even ex post, and areoften attributed to “frenzies”.
29 There are only few attempts to consider house price dynamicsempirically from a cross-country perspective in the EU. SeeN. Kennedy and P. Andersen, “Household savings and real houseprices: an international perspective”, BIS working paper 20,1994; P. Englund and Y. M. Ioannides, “House price dynamics:an international empirical perspective”, Journal of HousingEconomics 6, 1997; M. Iacoviello, “House prices and themacroeconomy in Europe: results from a structural VAR analysis”,ECB working paper 18, 2000; and D. Kasparova and M. White,“The responsiveness of house prices to macroeconomic forces: across-country comparison“, European Journal of Housing Policy1(3), 2001.
0
1
2
3
4
5
6
7
8
9
10
0
1
2
3
4
5
6
7
8
9
10
1989 1990 1991 1992 1993 1994 1995 1996 1997 1998 1999 2000 2001
Euro area 9EU 12

ECB • S t r u c tu ra l f a c t o r s i n t he EU hous i ng marke t s • March 200322
has found that the principal factors affectinghouse price dynamics include:
1. household incomes;2. interest rates (real and possibly also
nominal);3. household formation or other
demographic variables;4. supply side variables;5. financial market institutions and credit
availability; and6. taxes, subsidies and other public policies
directly related to housing.
Macroeconomic factors
Household income is the single most significantexplanatory variable of house prices.
Belgium Denmark Germany Greece Spain France Ireland ItalyPeriod 1995-2001 1995-2001 1995-2001 1995-2001 1995-2001 1995-2001 1995-2001 1995-2001
House prices 1) 3.06 5.99 -0.46 4.27 4.94 3.43 13.05 -0.88Real GDP 1) 2.41 2.37 1.59 3.54 3.64 2.54 9.09 1.86Real mortgagerates 2) -2.20 -2.87 -1.81 -8.23 -3.91 -2.25 -3.56 -3.75Nominal mortgagerates 2) -1.26 -2.66 -1.75 -13.97 -5.44 -2.65 -2.12 -6.91Residentialinvestmentto GDP 3) 5.00 3.96 7.31 5.02 6.37 4.20 6.55 4.52Mortgage debtto GDP 2) 3.70 11.31 8.58 7.48 15.07 1.78 7.46 4.01
Luxembourg 4) Netherlands Austria Portugal Finland Sweden United KingdomPeriod 1995-2001 1995-2001 1995-2001 1995-2001 1995-2001 1995-2001 1995-2001
House prices 1) 3.55 9.53 -3.44 1.64 5.54 6.05 7.65Real GDP 1) 6.76 3.29 2.56 3.45 4.40 2.67 2.74Real mortgagerates 2) -1.41 -4.89 -0.90 -6.56 -5.09 -3.49 0.74Nominal mortgagerates 2) -0.97 -1.66 -2.00 -6.60 -2.60 -4.78 -1.95Residentialinvestmentto GDP 3) 3.38 5.84 6.48 5.71 4.12 1.71 2.98Mortgage debtto GDP 2) -1.82 25.90 5.98 28.51 1.00 -5.32 5.62
Table 2.4Real house prices and candidate determinants: changes 1995-2001
Sources: National sources, ECB calculations. Also see Annex 2.1) Average annual growth rate; house prices for Germany refer to West Germany.2) Cumulative change in percentage points.3) Average over the period.4) In the case of Luxembourg, the change in the mortgage debt-to-GDP ratio refers to the period from 1997 to 2000.
Empirical studies find that, in the long run,the elasticity of house prices with respect toincome is close to or below unity. Asmentioned above, the main reason why houseprices are expected to rise with income inthe long run is that income growth generatesmore demand for living and recreation spaceand drives up the price of construction land.
Chart 2.4 shows the ratio of house prices todisposable income for all EU countries (index1995 = 100). For most countries, the trendover the whole period is constant or falling,which means that, all other things being equal,the affordability of owner-occupied housinghas remained constant or improved over thelong term. In recent times, however, houseprices have risen faster than the disposableincome in a number of countries and the

23ECB • S t r u c tu ra l f a c t o r s i n t he EU hous i ng marke t s • March 2003
Chart 2.4Ratio of house prices to disposable income(index 1995 = 100)
Source: ECB calculations; also see Annex 2.Notes: The series for Germany refers to West Germany. West German disposable income after 1991 was estimated by the DeutscheBundesbank. For Greece and Luxembourg, nominal GDP is used instead of disposable income.
60
80
100
120
140
160
180
200
60
80
100
120
140
160
180
200
60
80
100
120
140
160
180
200
60
80
100
120
140
160
180
200
60
80
100
120
140
160
180
200
60
80
100
120
140
160
180
200
1981 1983 1985 1987 1989 1991 1993 1995 1997 1999 2001
1981 1983 1985 1987 1989 1991 1993 1995 1997 1999 2001
1981 1983 1985 1987 1989 1991 1993 1995 1997 1999 2001
BelgiumSpain
IrelandLuxembourg
NetherlandsGreece
GermanyFrance
ItalyAustria
Portugal
DenmarkFinland
SwedenUnited Kingdom
ECB • S t r u c tu ra l f a c t o r s i n t he EU hous i ng marke t s • March 200324
ratio of house prices to income has been at,or close to, its maximum since 1980.
One of the important factors that explain therecent upsurge in house prices is believed tobe the drop in real and nominal interest rates(see Table 2.4). High nominal interest ratesincrease the initial debt servicing cost,creating a threshold for less affluenthouseholds. Empirical research, mainly on theUnited Kingdom, suggests that a permanentrise of one percentage point in real mortgagerates results to a drop of between around2% and 4% in real house prices. Cross-country empirical studies have givencontradictory results on the strength of theinterest rate effect, but a negative effect hasbeen found in general.
Both real and nominal mortgage rates in theEU fell considerably in the 1990s, after havingincreased in the 1980s.30 Some of thevariation in mortgage rates may have beendue to changes in regulations as well as toinnovation and increased competition in thefinancial markets. For the most part, however,the variation of both nominal and realmortgage rates closely followed that of othermarket rates of the same country. Taking1995 as a reference year, the euro areacountries with the highest market interestrates subsequently posted significant declinesin both nominal and real mortgage rates as aresult of the convergence process (Table 2.4).The latest movements in real mortgage ratesof euro area countries have been dominatedby changes in inflation.
In the long run, apart from disposable income,demand for dwellings depends mainly on therate of household formation.31 For the EU as awhole, household formation decelerated inthe 1990s, but Greece, Spain, Ireland, Italy,Austria and the United Kingdom differed fromthe other countries in this respect.Underlying the overall deceleration inhousehold formation was an even strongerslowdown in the growth of the youngerpopulation, which was only partlycounterbalanced by the fall in the membersper household.
Microeconomic factors
Empirical literature on the United Kingdomand the United States has stressed theimportance of microeconomic factors thatmay affect the price elasticity of the supply ofnew housing in explaining the differences inhouse price volatility and trends in the twocountries.32 According to this literature, thesupply of new housing in the United Kingdomresponds less to house prices, and this isthought to be one of the reasons why houseprices in the United Kingdom both growmore over time and fluctuate more stronglythan in the United States. The responsivenessof the supply of new housing depends largelyon the time it takes to design and construct abuilding. However, it also depends oneconomic and policy factors, such ascompetition in the construction industry, theavailability and cost of specialised labour,building regulations, the land planning system,and taxes and subsidies, particularly for newhousing. Further, given the high irreversibilityof housing investment, the responsiveness ofthe supply to demand shocks will depend, inthe short run, on how volatile housingdemand has been in the past.
Empirical evidence on the responsivenessof supply in different EU countries isunfortunately very sketchy. It tends to suggestthat the supply of new housing is moreresponsive to house prices in Germany thanin the United Kingdom, the Netherlands andsome of the Nordic countries.33 It isinteresting to note in this respect that in thesecond half of the 1990s Sweden and theUnited Kingdom had among the highest houseprice inflation rates and the lowest ratios of
30 Real mortgages are calculated as the difference in nominal ratesminus the change of the private consumption deflator. Given theheterogeneity in mortgage rate definitions across countries, therates in levels are not comparable across countries.
31 In some countries, e.g. Spain, demand for second residences isalso becoming increasingly important.
32 See G. Meen, “The time-series behaviour of house prices: atransatlantic divide?”, Journal of Housing Economics 11, 2002.
33 See J. Swank, J. Kakes and A. F. Tieman, “The housing ladder,taxation, and borrowing constraints”, mimeo, De NederlandscheBank, 2002, and D. Kasparova and M. White, “Theresponsiveness of house prices to macroeconomic forces: across-country comparison”, European Journal of HousingPolicy 1(3), 2001.

25ECB • S t r u c tu ra l f a c t o r s i n t he EU hous i ng marke t s • March 2003
residential investment to GDP in the EU.Germany, on the other hand, had the highestresidential investment-to-GDP ratio, withfalling real house prices (see Table 2.4).34 Thealleged difference in the price elasticity ofsupply between the EU countries has beenattributed to cross-country differences in theland planning systems, although hard evidenceon this is still missing.
Another microeconomic factor that hasreceived much attention is the structure andinstitutions of credit markets. The advent offinancial liberalisation, and the liberalisationof mortgage markets in particular, hasincreased the sensitivity of house prices tointerest rates, as credit constraints werereduced.
It is more difficult to say whether increasedcredit availability has also had a separate,additional effect on house prices. The lastline in Table 2.4 shows the change in themortgage debt-to-GDP ratio (in percentagepoints) since 1995. There does not seem tobe a close relation with house price inflation.Moreover, even if there is a relation betweenthe rise of mortgage debt and of house prices,it is rather difficult to establish the causaldirection of the relationship. The rise ofmortgage debt may be the effect of risingdemand for housing and/or rising houseprices, rather than their cause. Alternatively,any co-movement in house prices and debtmay be due to a third factor such as incomegrowth, interest rates and fiscal factors.Empirically, there have been some attemptsto resolve the endogeneity problem, butgenerally with little success.35 Section 5examines the interrelationship between houseand capital markets in more detail.
Finally, taxes, subsidies and other publicinterventions have had important effects onhouse prices, especially in periods of majorreforms. The tax/subsidy regimes in the EUcountries and their evolution are describedin some detail in Section 4.
2.5 House price fluctuations: somepolicy-related issues
The above overview of data and literatureleads to the following conclusions:
1. House price fluctuations are notnecessarily the sign of “speculative”behaviour or false expectations in themarket. They are often part of thefundamental market mechanism. However,it is often difficult to reconcile large realhouse price increases in successive yearswith the development of underlyingfundamentals. Therefore, the developmentof bubbles in the housing market cannotbe ruled out.
2. There are good reasons to believe thathousing markets vary from location tolocation both in terms of the shocks theyincur and in the way house prices respondto these shocks. This holds true of housingmarkets within a single country and oncomparison with other countries in theEU. One important but relativelyunexplored determinant of house pricedynamics concerns the responsiveness ofthe supply of new housing to demandshocks, which will depend, among otherthings, on local planning systems andregulations. The faster the supply respondsto house price movements, the less roomthere will be for house prices to overshootor undershoot the long-term trend.
3. The apparent differences in house pricevolatility across EU countries have been
34 In particular, the high level of construction activity in Germany inthe 1990s was in response to the massive inflow of populationbetween the end of the 1980s and the beginning of the 1990s,which could otherwise have resulted in a prolonged increase inhouse prices. Only in Germany, Ireland and Austria did thegrowth of the number of housing units accelerate in the 1990s,as compared with the 1980s.
35 For a recent attempt to disentangle the demand and supplyeffects and to construct an indicator of consumer creditconditions, see E. Fernandez-Corugedo and J. Muellbauer,“Modelling consumer credit conditions in the U.K.”, mimeo,Bank of England, 2002.

ECB • S t r u c tu ra l f a c t o r s i n t he EU hous i ng marke t s • March 200326
linked in literature to differences in andreforms of the national institutions andpolicies, notably in the mortgage market,believed to affect the transmission ofmacroeconomic shocks to the housingmarket.36
4. Notwithstanding the importance of localand national factors, macroeconomicdevelopments seem to have beenimportant determinants of house pricedynamics. Mortgage interest rates, inparticular, have moved closely together
with other market rates in the samecountry and, hence, differed substantiallyacross countries in the run-up to StageThree of Economic and Monetary Union(EMU), but one would expect this not tobe a substantial source of asymmetricbehaviour across the euro area countriesin the future. Given the long lags in thematching of demand for and supply ofhousing, however, some countries may stillbe adjusting to the new economicframework characterised by low and lessvolatile interest rates.
3 Rent dynamics
3.1 Introduction
The market for rental accommodation is animportant part of the overall housing market.Depending on the country, between 10% and60% of the stock of dwellings in EU MemberStates is rented (Table 3.1).37 The tax-subsidysystem, the regulation of the rental sector,the provision of “social” rentalaccommodation and the regulation andstructure of financial markets are factorspotentially influencing the relative weights ofrental housing and home ownership.
In most EU countries, the share of renteddwellings in the stock of housing hasdecreased since 1980, in some cases rathersharply so. There seem to be two main
interpretations for this fall. First, thestrictness of rent controls may have reducedthe supply of rental accommodation overtime. Second, the demand for rentalaccommodation may have fallen ashouseholds considered home ownership amore attractive option because of improvedaccess to and a lower cost of mortgage credit,because of favourable tax/subsidy policies and
Table 3.1Share of rented dwellings in the total stock of housing(in %)
Belgium Denmark Germany Greece Spain France Ireland Italy
Around 1980 38 49 61 25 21 45 24 39Around 1990 33 45 61 20 15 42 18 25Around 2000 28 40 60 20 10 42 16 19
Luxembourg Netherlands Austria Portugal Finland Sweden United Kingdom
Around 1980 39 58 43 39 31 42 42Around 1990 30 55 41 28 27 44 35Around 2000 26 47 41 28 32 41 32
Source: ECB calculations; see Annex 2.Notes: For Germany, 1980 and 1990 figures refer to West Germany. In the 1990s, the share of rented dwellings decreased by around1.5 percentage points in West Germany and by more than 5 percentage points in eastern Germany.
36 See, for example, J. Muellbauer, “Anglo-German differences inhousing market dynamics”, European Economic review 36, 1992,and D. Maclennan, J. Muellbauer and M. Stephens, “Asymmetriesin housing and financial market institutions and EMU”, Centrefor Economic Policy Research, working paper 2062, 1999.
37 Note that the percentage share of owner-occupied dwellings(reported in Table 1.1) and that of rented dwellings do notnecessarily add up to 100% in all countries, due to dwellingsclassified as “other” in the relevant statistics. These includevacant dwellings in some countries.

27ECB • S t r u c tu ra l f a c t o r s i n t he EU hous i ng marke t s • March 2003
because of expectations of capital gains fromrising house prices.
Irrespective of whether this process has beendriven by demand or supply, the result hasbeen that the role of the rental market isnow relatively marginal in some countries, inparticular in Spain. Excluding dwellings underdirect ownership or indirect control of thepublic sector (see below), the private rentalmarket probably represents no more thanabout one-fourth of the housing stock in allEU countries, except Germany. EUgovernments have responded over the yearsto the fall in the size (and quality) of themarket for rented dwellings and have tovarious degrees relaxed rent regulations.Finland is an interesting example of a countrythat lifted most rent controls in the 1990sand has seen the share of rentalaccommodation rising, but also (or despiteof) high rent inflation.
The implications of the various regulatoryregimes for the functioning of the wholehousing market and, more generally, forquestions of urban planning, incomedistribution and labour mobility are an issueof some debate. For the purposes of thisreport, the main interest is the relationbetween the rental sector and a well-functioning housing market in general as wellas the relation between rents, consumerprices and house prices. Rents representabout 6% of the HICP basket for the boththe EU and the euro area and are, therefore,of direct interest to the single monetarypolicy.
3.2 The evolution of rent controls andof social renting in EU countries
Historically, rent controls were devised for avariety of social and economic reasons, suchas to provide affordable accommodation toeveryone, to avoid segregation, to redressthe landlord-tenant negotiation power andto limit rent volatility.38 In real terms,controlled rents often fell significantly andover long periods of time. Although hard
evidence is not available for most countries,it is likely that the significant fall of real rentshas led to significant decreases in the supplyof rental accommodation.
The shrinking and mis-functioning of therental sector has been seen as potentiallydamaging the functioning of the whole housingmarket and in the last 20 years, rent controlsystems have been revised in all EU countries(see Table A1 in Annex 1 “Chronology ofmain policy measures”). The revised rentalmarket regulations are more complexsystems governing both permissible rentincreases and a number of other aspects oflandlord-tenant relations. There are threefundamental aspects in rent control systemsthat need to be distinguished, namely thequestion as to:
(i) whether there are regulations governinghow the initial rent in a multi-year rentalcontract will change in the future;
(ii) whether there is some type of controlon the initial rent negotiated for a newrental contract between a landlord anda tenant; and
(iii) whether there are regulations governingcontract termination (eviction).
On the first aspect, most EU countries havemoved towards a system that allows sometype of rent indexation to consumer priceinflation and/or various freely negotiatedadjustment clauses. Even when completelydecontrolled, it would seem that long-termrental contracts are still based on relativelysimple indexation systems, either byconvention or simply in order to avoidcontractual complications and possiblereasons for litigation ex post.39 Thus, thetypical rental contract in most EU countriesis a contract that includes explicitly or bydefault an indexation clause that refers tothe consumer price index or some variantthereof. In Denmark and France, the
38 See R. Arnott, “Time for revisionism on rent controls”, Journal ofEconomic Perspectives, Vol. 9(1), 1995, pages 99-120.
39 In Finland, around 32% of rent contracts, for which informationis publicly available, are indexed to increases in consumer pricelevels.

ECB • S t r u c tu ra l f a c t o r s i n t he EU hous i ng marke t s • March 200328
indexation is linked to housing costs, while itis set in collective negotiations within limitsalso linked to costs in Sweden. In mostcountries, additional adjustments of rents forsitting tenants to housing market conditionsmay take place at the time of the renewalof their contracts (if they have renewablefixed-term contracts), although there areprovisions limiting the renegotiating powerof landlords in most countries. Germany hasan adjustment mechanism that allowsincreases in rents of sitting tenants to newrental contracts and to recently adjustedrents up to a maximum (20% in a three-yearperiod). Such a mechanism provides anupdating of rents of sitting tenants to recenthousing market conditions.40
Concerning the second aspect of rentcontrol, regulations that govern the rentnegotiated in new contracts have beenhistorically justified on the grounds thatlandlords may have some local monopolypower41 and/or that there is a need to limitexcessive temporary rent increases. Ingeneral, there is now widespread agreementamong policy-makers that rents in newcontracts should reflect market conditionsand the passage from the first to the “secondgeneration” of rent controls has been markedby a more or less gradual decontrol of newcontracts mainly for what concerns thenegotiation of the initial rent. Most countrieshave moved towards decontrolling rents innew contracts, but this has sometimes beenlimited to specific segments of the rentalmarket, such as newly built houses (e.g.Denmark) or more expensive segments ofthe market. This has led to a regulatorysegmentation of the rental market. Limits tothe rent of new contracts with reference torents in the vicinity still exist in somecountries (e.g. the Netherlands). Swedenseems to have one of the most restrictiveregimes in this respect, effectively allowingno place for individual negotiation withprospective tenants.
The process of decontrolling rents in newcontracts has been closely linked to a revisionof contract termination rules. In a system
where new contracts can set rents that arevery different from rents paid by sittingtenants, the duration of contracts and theeviction rules become very important forboth sides. Regulation of termination ruleshas been justified on the grounds that tenantsgenerally face more sunk costs of movingthan landlords and these reduce the tenants’power to renegotiate. While the terminationrules can be negotiated ex ante by the parties(before tenants move into the house),complete contracts that foresee all futureeventualities are difficult to write. The needto establish “security of tenure” has in factbeen one of the main arguments in publicpolicy debate. There has also been a tendencyin many EU countries to allow freenegotiation of the duration and contracttermination rules, within some prescribedlegal framework. In a number of countries,however, most contracts continue to beopen-ended, and landlords can only terminatethese under special circumstances.
In many countries, the most difficult policyissue has been the revision of rents andconditions of old contracts dating back toearlier phases of stricter rent control. Apartfrom being an issue of political debate, thevery favourable conditions of these contractsgive tenants very little incentive to move. Inextreme cases, as in Stockholm, an elaboratesystem of sub-letting accommodation rentedunder an old contract has developed. Somecountries, like Spain and Portugal, designedone-off adjustments aimed at bringing therents of old contracts more into line withnew contracts, although the revised rents ofold contracts in the case of Portugal stillremained a small fraction of the value ofequivalent new contracts. In eastern
40 Rent escalation clauses, indexed rents and additional rentincreases for improvement are also admissible in Germany.After the abolition of port-war controls, West Germany neverexperienced a period of strict rent control, a fact which may helpto explain the stability of the substantial share of private rentalhousing.
41 Such local monopoly power may, for example, arise because ofthe combination of high product differentiation, idiosyncraticneeds and high search costs on the part of the prospectivetenants – see R. Arnott and M. Igarashi, “Rent control, mismatchcosts and search efficiency”, Regional Science and UrbanEconomics 30, 2000.
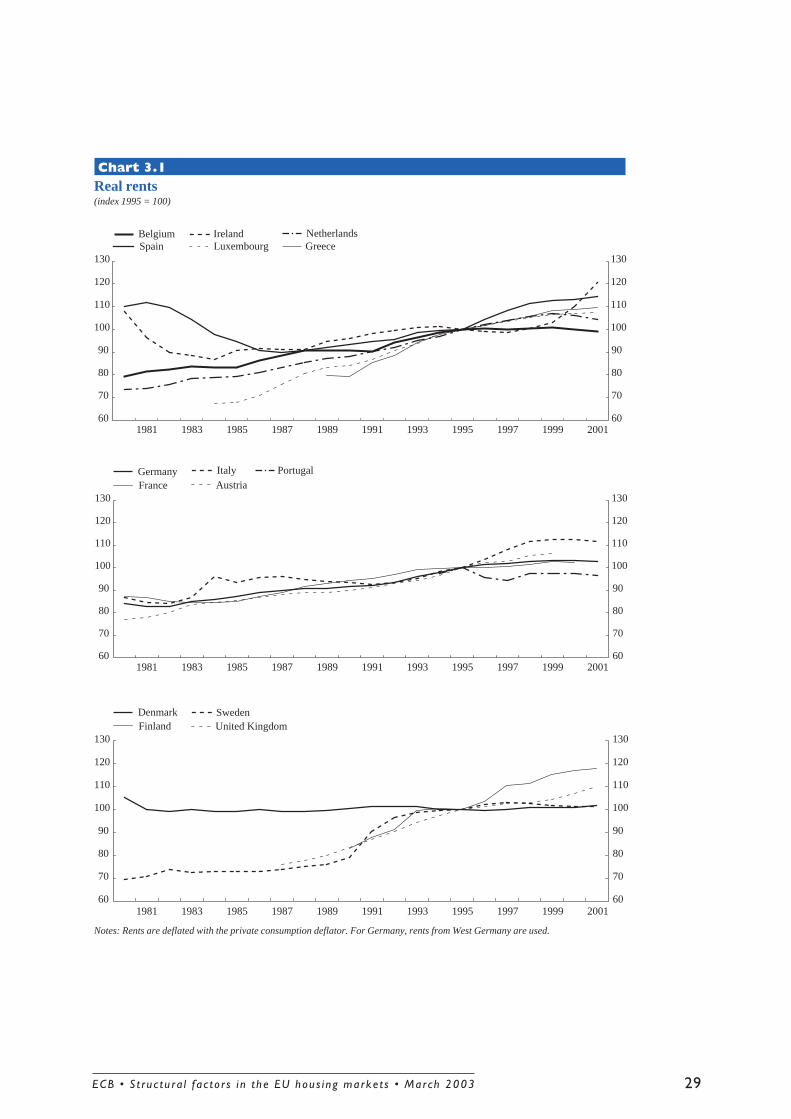
29ECB • S t r u c tu ra l f a c t o r s i n t he EU hous i ng marke t s • March 2003
Chart 3.1Real rents(index 1995 = 100)
Notes: Rents are deflated with the private consumption deflator. For Germany, rents from West Germany are used.
60
70
80
90
100
110
120
130
60
70
80
90
100
110
120
130
1981 1983 1985 1987 1989 1991 1993 1995 1997 1999 2001
1981 1983 1985 1987 1989 1991 1993 1995 1997 1999 2001
1981 1983 1985 1987 1989 1991 1993 1995 1997 1999 2001
60
70
80
90
100
110
120
130
60
70
80
90
100
110
120
130
60
70
80
90
100
110
120
130
60
70
80
90
100
110
120
130
BelgiumSpain
IrelandLuxembourg
NetherlandsGreece
GermanyFrance
ItalyAustria
Portugal
DenmarkFinland
SwedenUnited Kingdom

ECB • S t r u c tu ra l f a c t o r s i n t he EU hous i ng marke t s • March 200330
Germany, following unification, after severaldiscretionary adjustments that raised rentsby more than 500%, the West German systemof rent regulation was introduced. In general,however, a substantial part of the rentalmarket in most countries has remainedeffectively segmented and rationed, while thefunctioning part of the market may actuallyhave faced tight conditions and rapidly risingrents. As time progresses, dwellings with veryold contracts may enter the decontrolledrental market as tenants move, die or areinduced to change the contract, but thetransition is likely to be slow. In Italy, forexample, almost seven years after the 1992regulatory reform of rents, only an estimated24% of all contracts were according to thenew law.
In addition, a large part of the rentalaccommodation in many countries is stilldirectly owned by public authorities or bynon-profit organisations that are subsidisedby the state and/or employ different contractsand specific criteria in the selection oftenants. Unfortunately, figures on “social”renting are not comparable across EUcountries, as the national definitions of“social” rental dwellings vary considerably.42
From the information that exists, it can besaid that in many countries, includingDenmark, France, the Netherlands and theUnited Kingdom, this “public” rentalaccommodation represents roughly half ormore of the total rental sector. Furthermore,there is not much evidence of a substantialreduction in the weight of the “public” rentalsector over time, except in the UnitedKingdom. This kind of intervention of thepublic sector through the direct ownershipor indirect control of the housing stock hasbeen traditionally less widespread in thesouthern EU countries.
3.3 Rents, consumer prices and houseprices
The above observations on standard rentalcontracts and on “public” renting in EU
countries suggest the following two pointson rent inflation:
• for sitting tenants and for the tenants inthe “public” rental sector, rent adjustmentsare unlikely in most EU countries to reflectclosely the housing market conditions. Inmost EU countries, rent adjustment islikely to be closer to the CPI or somehousing cost measure plus or minus somefactor that will reflect, among other things,public housing policy objectives and fiscalpolicy considerations;43 and
• rents on new contracts may reflect moreclosely the tightness in the housing marketand housing market prices, althoughregulations may again set limits on howmuch rents in new contracts can deviatefrom those in existing contracts.
Changes of the overall rent index will reflectboth the adjustment in the rents of sittingtenants and the rents of new contracts.Chart 3.1 shows real rents in the EUcountries (deflated by the privateconsumption deflator). As in the case ofhouse prices, these indices are not strictlycomparable across countries and give a roughapproximation of the evolution of real rents.44
Nevertheless, there are two observationsthat can be made for most countries.
First, with the exception of Denmark andPortugal (for which only short series areavailable), real rents have increased in thelong run. As was the case with real houseprices, one explanation for the long-term
42 Official figures in some countries include dwellings in theownership of households or enterprises in which the tenantreceives some type of rent subsidy. In addition, dwellings ownedby the public sector are sometimes rented subject to the sameconditions as in the private rental sector. This is the case, forexample, in Sweden, where municipal authorities own asignificant part of the stock of rented dwellings, but rents andconditions in these dwellings are not significantly different thanin the rest of the rental sector.
43 Social rents also tend to vary less than market rents acrosslocations in the same country.
44 Harmonised data on rents exist since the mid-1990s and areused below. The longer series presented here sometimes refer toa specific section of the market (e.g. flats in Luxembourg or theprivate sector in Ireland) and sometimes include other housingexpenses (e.g. waste disposal in Germany).
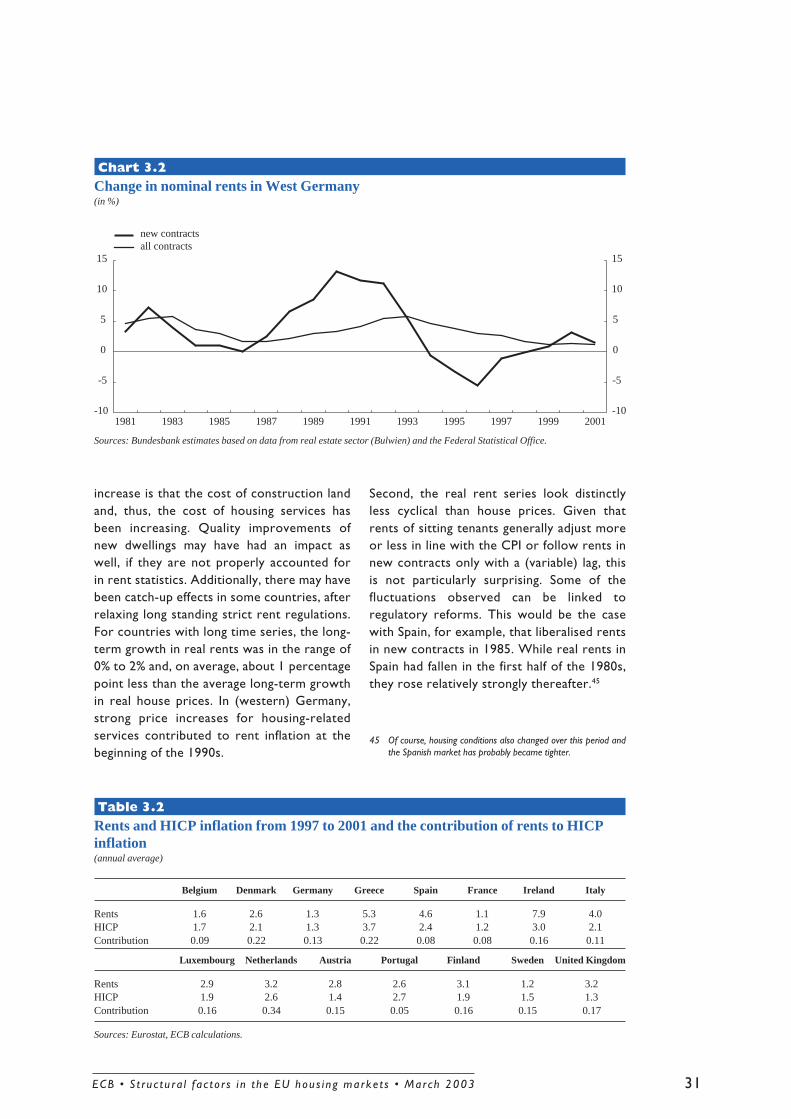
31ECB • S t r u c tu ra l f a c t o r s i n t he EU hous i ng marke t s • March 2003
increase is that the cost of construction landand, thus, the cost of housing services hasbeen increasing. Quality improvements ofnew dwellings may have had an impact aswell, if they are not properly accounted forin rent statistics. Additionally, there may havebeen catch-up effects in some countries, afterrelaxing long standing strict rent regulations.For countries with long time series, the long-term growth in real rents was in the range of0% to 2% and, on average, about 1 percentagepoint less than the average long-term growthin real house prices. In (western) Germany,strong price increases for housing-relatedservices contributed to rent inflation at thebeginning of the 1990s.
Second, the real rent series look distinctlyless cyclical than house prices. Given thatrents of sitting tenants generally adjust moreor less in line with the CPI or follow rents innew contracts only with a (variable) lag, thisis not particularly surprising. Some of thefluctuations observed can be linked toregulatory reforms. This would be the casewith Spain, for example, that liberalised rentsin new contracts in 1985. While real rents inSpain had fallen in the first half of the 1980s,they rose relatively strongly thereafter.45
Chart 3.2Change in nominal rents in West Germany(in %)
45 Of course, housing conditions also changed over this period andthe Spanish market has probably became tighter.
Belgium Denmark Germany Greece Spain France Ireland Italy
Rents 1.6 2.6 1.3 5.3 4.6 1.1 7.9 4.0HICP 1.7 2.1 1.3 3.7 2.4 1.2 3.0 2.1Contribution 0.09 0.22 0.13 0.22 0.08 0.08 0.16 0.11
Luxembourg Netherlands Austria Portugal Finland Sweden United Kingdom
Rents 2.9 3.2 2.8 2.6 3.1 1.2 3.2HICP 1.9 2.6 1.4 2.7 1.9 1.5 1.3Contribution 0.16 0.34 0.15 0.05 0.16 0.15 0.17
Table 3.2Rents and HICP inflation from 1997 to 2001 and the contribution of rents to HICPinflation(annual average)
Sources: Eurostat, ECB calculations.
Sources: Bundesbank estimates based on data from real estate sector (Bulwien) and the Federal Statistical Office.
-10
-5
0
5
10
15
-10
-5
0
5
10
15
1981 1983 1985 1987 1989 1991 1993 1995 1997 1999 2001
new contractsall contracts

ECB • S t r u c tu ra l f a c t o r s i n t he EU hous i ng marke t s • March 200332
It should be mentioned that even whatappear, on average, to be relatively small realrent increases may conceal very importantdistributional effects, in particular for mobilehouseholds that frequently sign newcontracts. For example, a third of the overallrise in rents in France in 2001 was accountedfor by rent rises for new tenants. If rents forsitting tenants adjust in line with the CPI, asis likely to have been the case in some of theEU countries, then even a 0.5% increase inreal rents is entirely attributable to very largeincreases in new contracts. In any single year,these probably represent no more than 10%of all rental contracts, which means that rentsin new contracts would rise by about 5% ormore per annum in real terms.46 Thus,households could have been facing very highcosts of moving, even before considering anytransaction and other fixed moving costs.Mobile households, who are more likely tobe using rental accommodation, would beparticularly penalised (see Box 2 on “Labourmobility, housing tenure and the rental sectorin the EU”).
This is particularly relevant for periods inwhich a demand shock hits the housingmarket as new contracts bear the brunt ofany short-term adjustment of rents tochanging housing market conditions. This canbe seen in Chart 3.2, for example, where thechange in rents of new contracts is comparedwith the change in the overall index of rentsin West Germany. Following the inflow ofimmigrants in the late 1980s and early 1990s,the annual growth of rents in new contractsaccelerated fast, reaching an estimated peakof 13% in 1990, then decelerated andeventually turned negative for some years.Instead, the rise of the overall rent indexreached a maximum of 5.7% three years later,in 1993. Over the full period under review,the total change in rents proves to be nearlyidentical for sitting tenants and in newcontracts.
In recent years, rent inflation has deceleratedin many EU countries, or has stayed relativelyconstant, as result of the fall in consumerprice inflation. In general, it has remained
above the rate of overall HICP inflation.Table 3.2 below shows the average increaseof the rent component in the HICP, overallHICP inflation and the average contributionof rents to HICP inflation in all EU countriesin the period from 1997 to 2001. On averagefrom 1997 to 2001, rents have contributed0.13 percentage point to EU-wide HICPinflation per annum (0.12 percentage point toeuro area HICP inflation).
Notwithstanding the relatively low rentinflation in many countries, for the averagehousehold, it may have become moreeconomical than in the mid-1990s to buyrather than rent because of thecontemporaneous fall in real interest rates.47
The fall in interest rates, combined withfinancial market liberalisation that hasreduced credit constraints, would have madeit cheaper and easier for households tofinance a purchase of a dwelling, in manycases offsetting the rise in house prices.Buoyant expectations about future houseprice increases would have further inducedhouseholds to buy rather than rent. However,as transaction costs in residential propertymarkets tend to be substantially higher thanin a well-developed rental market and giventhe required downpayments when purchasinga house, households with higher mobilityneeds and/or low initial own capital wouldstill have preferred to rent rather than buy.
46 The turnover of contracts is not known, but estimates from theGerman Socio-Economic Panel and the Housing Surveys put thisat 10% per annum. Given that Germany has one of the mostactive and liberalised rental markets, it is unlikely that theturnover will be higher in most of the other EU countries.
47 In theory, house prices are related to rents of new contractsthrough what is effectively an arbitrage condition, i.e. the presentdiscounted value of the rental contract should be equal to thepresent value of buying and keeping the dwelling over the sameperiod. Ignoring transaction costs and financial constraints, thismeans that the average rent paid over the duration of the newcontract will be approximately equal to the user cost of thehousing assets. The user cost is the annual financial cost(opportunity cost of own capital plus after-tax interest onborrowed capital), minus the expected capital gains (losses)from a possible appreciation (depreciation) of the value of thehouse and plus the cost of maintenance, physical depreciation ofthe house, property and other taxes. In practice, the rent indexdoes not capture the average rent paid on a new rental contract,but rather the average current rent of old and new contracts,which may be a very poor proxy in the short run. With strictregulation of rents and eviction rules and a large public sector, alarge part of rents observed may have no relation to averagegoing house prices. Indeed, houses with sitting tenants sell at aconsiderable discount.

33ECB • S t r u c tu ra l f a c t o r s i n t he EU hous i ng marke t s • March 2003
3.4 Rented accommodation: somepolicy issues
Whatever the justification for rentregulations, policy-makers have learned in thepast that the de-linking of rents from housingmarket conditions is not attainable in thelong run without curtailing the size andhindering the functioning of the rental market.The consequences can be reduced efficiencyand liquidity of the whole housing market,with implications also for labour mobility. Thishas led most EU countries to revise theirrental market policies, allowing a wider useof short-term contracts and of rent-escalationclauses and liberalising the new rentalcontracts, albeit with varying strings attached.Nevertheless, important segments of therental market in many EU countries stilloperate under strict control regimes.
The liberalisation of new contracts providesa mechanism of sluggish adjustment of rentsto housing market conditions. But if newcontracts provide the only effective rentadjustment mechanism, there can also benegative side-effects, particularly on labourmobility. It also raises the high initial housingcosts of young households that are oftencash-constrained and cannot buy residential
property. In practice, new tenants may beasked to pay up-front for the potential gainsthey will have from a long-term contract,which only adjusts to the CPI, not to changinghousing market conditions. Clearly, theproblem becomes more severe, the moredifficult it is to sign a short-term contract,the more strict the regulations are for theindexation of existing contracts and, aboveall, the higher are the expected real houseprice increases.48 Unfortunately, this lastfactor also means that the negative side-effects and the need for reforming the rentregulatory system are at their highest whenhouse prices are rising and, thus, when thereform is likely to produce the largest re-distribution effects.
48 One way of addressing the possible adverse effects of rentindexation on labour mobility could be to enable landlords to buythemselves out of an old rental contract by paying the tenant thecapitalised value implicit in the rental contract with a below-market rent. Such payment would then need to be recognised inlaw as an expense for the landlord, tax-deductible from futurerents, and as capital income for the tenant.

ECB • S t r u c tu ra l f a c t o r s i n t he EU hous i ng marke t s • March 200334
Box 2Labour mobility, housing tenure and the rental sector in the EU
Decisions to change residence in order to take up a new job are likely to be influenced by housing market
conditions, given that housing costs (mortgage payments or rents) are typically the largest component of
households’ budgets. In particular, high transaction and search costs when buying/selling and renting/letting
residential property increase mobility costs and may generate inefficient lock-in effects.1 Thus, stamp duties,
high registration fees and inefficient regulation of rental markets can all increase geographical mobility costs.
The efficient functioning of the rental sector can be important in this respect, particularly for the more mobile
households and for households that cannot raise the necessary downpayments to buy residential property, such
as young and unemployed households. As transaction and search costs tend to be lower for rental housing
than for owner-occupied housing, one expects the relative mobility rates to be higher among tenants than
owner-occupiers. Estimates of labour mobility rates from a sample of households in the five largest countries
of the EU tentatively support this hypothesis (see the table below).2
1 P. Lundborg, “Transaction Taxes in a Search Model of the Housing Market”, Journal of Urban Economics, 45, 1999.2 The estimates in the table are drawn from the Ph.D. dissertation “Modelling Housing Tenure and Labour Mobility in the
European Union” by Cristina Barceló, Universidad Complutense de Madrid (2003, expected).3 Housing tenure and labour mobility rates refer to the periods from 1994 to 1996 and 1995 to 1997 respectively. Due to the small
sample size (between 5,000 and 10,000 households per country), the figures reported in this box may not be fully representativeof the countries under review, especially with regard to small sub-populations (e.g. tenants in the United Kingdom).
4 For an overview, see P. A. Fischer, R. Martin and T. Straubhaar “Should I stay or should I go?” in T. Hammar, G. Brochmann,K. Tamas and T. Faist (eds.) “International migration, immobility and development”, Berg, 1997.
United AllHousing tenure Germany Spain France Italy Kingdom countries
Ownership 0.3 0.1 0.2 0.1 1.6 0.4Private rental 4.1 3.0 2.1 1.1 3.1 2.6Social housing 2.8 1.8 1.1 0.5 1.1 1.2All types of tenure 2.0 0.4 0.8 0.2 1.6 0.8
Labour mobility rates broken down by type of housing tenure for the period from 1995 to1997 in several European countries(in %)
Labour mobility rates are computed as the percentage of the number of residential changes associated with the
acceptance of a new job over the total number of observations. The sample is drawn from the European
Community Household Panel (ECHP) and is made up of heads of household with previous labour market
experience aged 25 to 64.3
This tentative evidence suggests that the labour mobility rates in all countries are lower among homeowners
than among tenants in private rental housing. The mobility of tenants in social housing is lower than the
mobility of tenants in private rental housing, but tends to be higher than the mobility of owners. It is important
to note, however, that the estimates presented here do not suggest that overall mobility across countries is
closely related to the tenure structure. Overall mobility depends not only on transaction and search costs, but
also on a wide range of other factors, e.g. wage structures and job entry and exit conditions.4 In conclusion, the
efficient functioning of the rental sector can be particularly important for the more mobile households. In
general, one may conjecture that transaction costs in both the rental sector and the rest of the housing market
can have negative consequences for labour mobility.

35ECB • S t r u c tu ra l f a c t o r s i n t he EU hous i ng marke t s • March 2003
4 Housing taxes, subsidies and transaction costs
4.1 Introduction
The housing markets in EU countries arecharacterised by a wide variety of policyinterventions, in particular tax exemptionson particular types of housing-relatedinvestment or subsidies for housing-relatedactivities. This section examines the varioustypes of housing-related taxes and subsidies,and their evolution over time. It also givessome indication as to the amount of publicspending on housing that has been broughtup by Member States.
Taxes and subsidies regarding the housingmarket can be categorised by the followingthree dimensions:
(i) taxes and subsidies that affect the housingincome or opportunity costs of housinginvestment;
(ii) taxes and subsidies regarding theproperty; and
(iii) indirect taxes, such as VAT, andtransaction taxes, including stamp andregistration duties and inheritance taxes.
Moreover, three types of distortions createdby the housing policy system can be identified:
(i) distortions in decision-making betweeninvestments in housing (immovableproperty) and other assets (movableproperty);
(ii) distortions between owner-occupied-housing and rented housing; and
(iii) distortions between investment in newinstead of existing dwellings.
4.2 Evolution of tax policies andsubsidies in EU countries since 1990
Tax exemptions and subsidies in EU countriesgenerally tend to favour investment in
immovable property (see Table 4.1).49 This isa rather persistent feature of housing policiesin EU countries, although housing policies inmost EU countries underwent sometimessubstantial change in the 1990s (see Table A2in Annex 1 “Chronology of main policymeasures”). Moreover, housing policies inmany EU countries are directed explicitly atpromoting home ownership, in many caseespecially for low-income households.Usually, owner-occupiers benefit fromgenerous tax exemptions related to the valueof their house, from subsidised loans (“0%loans”) or from tax relief related to mortgageinterest payments.50 Finally, some EUcountries promote investment in newdwellings instead of house ownership ingeneral, although the picture with regard tothis dimension of housing market policyseems to be far more heterogeneous.
Looking at the development of housingpolicies in EU Member States over time, nogeneral trend is discernible over the pastdecade (see Table 4.2). However, thereappears to be a reversal of policies in manycountries with respect to earlier periods.Indeed, many EU countries have reduced theheavy subsidies they granted to housinginvestment or have restricted tax exemptionrelated to mortgage interest payments. Forinstance, Sweden decided at the beginning ofthe 1990s to reduce the incentives to investin immovable property by equalising marginaltax rates across types of assets. Moreover,the introduction or gradual increase of realestate taxes has contributed further toreducing some of the distortions in favour ofimmovable property. This trend gained speedin the second half of the 1990s, in line withthe general trend towards budgetconsolidation.
The more neutral stance with regard toinvestment in movable property has been
49 Note that direct subsidies have not been included in Table 4.1.50 Only mortgage interest relief for housing investment has been
retained in the tables.

ECB • S t r u c tu ra l f a c t o r s i n t he EU hous i ng marke t s • March 200336
Tax on Interest Tax on capital Real estateimputed rent relief 1) gains tax
Belgium Y (30%-50% of Y Y (turnover <5 years, = Tax on imputed rent imputed income exemption for
owner-occupiers)
Denmark Y Y Y (tax exemptions for Yowner-occupiers)
Germany N N Y (turnover <10 years, N (land tax, 0.3-1%tax exemptions for of rateable values)owner-occupiers)
Greece Y (for pood) Y (for pood) N 0.025% to 0.035%;for large estates:
0.3% to 0.8%
Spain N (for primary houses) Y Y ( tax exemptions 0.62%for principal
dwellings when reinvested)
France N N Y (no tax for main + residence tax; 7.8%-45%residence) of half cadastral rental
value
Ireland N Y Y (tax exemptions for Nprincipal dwellings)
Italy Y (exception for pood) Y (only for pood) Y (50% tax reduction 0.4%-0.7% of cadastralfor pood) 2 value
Luxembourg Y Y Y (tax exemptions Yfor principal dwellings)
Netherlands Y Y N 0.3%
Austria N na Y (turnover <10 years) 1%-1.5%
Portugal N Y Y (exemptions if proceeds 0.7%-1.3% of taxare reinvested in administration
another residence within appraisal rent2 years)
Finland N Y (flat rate for pood Y (exceptions for pood 0.2% of taxable valueup to a ceiling, 29%) after 2 years)
Sweden Y Y Y (25%) 0% to 1.5% of 75%of the market price
United Kingdom N N Y (tax exemption for pood) 0.2%
Sources: NCB contributions.Notes:1) Mortgage-related.2) Capital gains tax on housing was abolished in Italy on 1 January 2002.Y: Yes.N: No.na: not available.Pood: principal owner-occupied dwelling.
Table 4.1Housing taxes in EU countries (2001)

37ECB • S t r u c tu ra l f a c t o r s i n t he EU hous i ng marke t s • March 2003
Inheritance tax Wealth tax Indirect taxes Stamp dutyon repairs on new homes
Y; same as for N 21% (6% house 21% 10%-12.5% registration Belgiumfinancial assets >5 years and pood fee (lower rates
5%-6% formodest houses)
Y (same as for N 25% 25% Stamp duty Denmarkfinancial assets 1.5% - total trading
costs 7.2%
Lower than for N 16% 16% 3.5% Germanyfinancial assets
0%-65% (progressive) N 18% 0% 11%-13% Greece
7.65%-34% (progressive) 0.2%-2.5% 15% 7% na Spain
5%-40% (progressive) 0.5%-1.5% 5.5% 19.6% 2%-3% France
Y (same as for N 12.5% 12.5% 0%-9% Irelandfinancial assets
N (abolished in 2001) N 10% for pood; 4% for pood; 3% + €258 (pood); Italy19% for others 19% for others 7%, + 2%,
+ 1% for others
Y (same as for 0.5% 3% 3% 7%-10% (lower Luxembourgfinancial assets) rates for first
time buyers, lowincome and
owner-occupiers)
5%-27% (on amount 1.2% 19% 19% 6% Netherlandsabove tax free
threshold)
Y N 10%-20% 10%-20% 6% Austria
4%-25% N 5%; 17% 0%; municipal 0.8% Portugaltransfer tax:
0%-10%(progressive)
Y Progressive in 22% 22% 4% of purchase Finlandwealth, 0% for values (first-time
most households buyers exempted)
Y 1.5% 25% 25% 1.5%-3% Sweden
Y (same as for N 17.5% 0% 1%, 2%, 4% United Kingdomfinancial assets) depending on
house value

ECB • S t r u c tu ra l f a c t o r s i n t he EU hous i ng marke t s • March 200338
accompanied by a number of governmentsintroducing further biases in favour of owner-occupation. In particular, further taxexemptions, interest deductibility and stateguarantees for private housing loans havebeen restricted to owner-occupied housing.At the same time, some of these measuresfavouring owner-occupation became moretargeted towards – mainly – low-incomehouseholds. The Netherlands, for instance,introduced targeted subsidies that areexplicitly designated for low-income, first-time buyers.
While, on average, still favouring new overexisting housing, a tendency towards a moreneutral stance between new and existinghousing is visible in a few countries – includingBelgium and France. This, however, is not ageneral trend as other countries – such asAustria – have continued their policy in favourof new construction.
Finally, while transaction taxes haveundergone considerable reduction over the
last two decades in some countries – such asIreland during the 1990s – the overall pictureremains ambiguous. In particular towards theend of the 1990s, countries like Germanyand Austria have increased their transactionand registration fees or lengthened the periodapplicable to capital gains tax. Othercountries like Ireland have opted for adifferentiated approach, reducing stampduties for first-time buyers and owner-occupiers only.
4.3 Evolution of public expenditure onhousing policies and social housingpolicies
The figures on public expenditure on housingpolicies51 reported in Table 4.3 do not allowcross-country comparisons, given thedifferent methodological approaches used in
51 In principle, data on public support of social housing are available,but only for a limited number of countries. Moreover, data aregenerally not comparable.
Table 4.2Evolution of housing policies(1990-2000)
Towards investment Towards Towards new Transactionin housing 1) owner-occupation 2) housing 3) taxes
Belgium + + - +Denmark - + + +Germany - = + +Greece = + = =Spain - + = =France + + - -Ireland 0 + 0 + 4)
Italy - + - +Luxembourg + + = -Netherlands - 0 - =Austria - na na +Portugal + + 0 0Finland - = = -Sweden - - 0 0United Kingdom - - na +
Sources: NCB contributions.Notes: The columns represent an increase (+) or decrease (-) of policy-induced distortions in favour of a particular asset in theperiod from 1990 to 2000; the equal sign (=) indicates an absence of significant changes; a zero (0) indicates no net changes.1) Distortions in favour of investment in (any kind of) housing assets over investment in other, movable assets.2) Distortions in favour of investment in owner-occupied housing over investment in rental housing.3) Distortions in favour of investment in new housing over investment in existing housing.4) As from 1998, Ireland introduced several two-tier stamp duty systems, favouring transactions for owner-occupation, but raising
transaction taxes for investors in an attempt to slow down speculative housing investment.

39ECB • S t r u c tu ra l f a c t o r s i n t he EU hous i ng marke t s • March 2003
1980 1990 2000
Belgium na 0.8 1.0 3)
Denmark 1.3 1.3 1.4Germany 0.9 0.6 0.9Greece 0.2 0.2 0.2Spain 1.3 1) 2.3 1.4 4)
France na 1.1 1.1 4)
Ireland na na naItaly 0.3 0.14 0.1 5)
Luxembourg na 0.8 2) 0.6Netherlands na 0.9 0.7 4)
Austria 1.4 1.3 1.3 4)
Portugal na 0.3 0.8Finland 1.4 1.6 1.2Sweden 1.0 1.5 0.4United Kingdom na na 0.6
Source: NCB contributions.Notes: The figures for Belgium cover solely the various tax deductions granted by central authorities. The figures for Germanyinclude revenue foregone and public housing allowances. The figures for Portugal refer to revenue forgone due to tax exemptions andinterest relieves as well as to support for public housing. The figures for Sweden include rent and interest allowances.1) 1981.2) 1992.3) 1997.4) 1999.5) 1998.
Table 4.3Public expenditure on housing policies(% of GDP)
Member States. Usually, these numberscomprise tax and interest rate deductionsfor private investment, but may also includesupport for public housing (see thecorresponding notes in the table). Only fewcountries include revenue forgone (Germany,Portugal). This introduces a considerabledownward bias in the numbers. Somecountries – such as Belgium – report onlyfigures for the federal level. Other countries– such as Sweden – report figures thatcomprise expenditure for both the rental andthe property sector, while others concentrateon public spending for owner-occupiedhousing only.
These data limitations may also hinder thecomparison of country-specific developmentsover time. Nevertheless, available figuresseem to indicate that public expenditure as apercentage of GDP has remained stable overthe past two decades in most EU countries.The recent decrease of public housingexpenditure in some Member States appears
to reflect a change of the policy stancetowards more targeted spending.
4.4 The micro-management of housingmarkets
There have been various attempts to micro-manage the housing market through changesin taxes and subsidies. An overall evaluationof these is difficult, given that they have beenimplemented in different circumstances andwith different objectives. Nevertheless, itwould seem that, at times, housing marketfluctuations might themselves have been theresult of policies attempting to micro-managethe housing market, which often proved tobe pro-cyclical.
One example is Sweden at the turn of the1990s. At the end of the 1980s, overlygenerous tax subsidies and interestallowances led to a boom in the Swedishhousing sector, with rapidly increasing house

ECB • S t r u c tu ra l f a c t o r s i n t he EU hous i ng marke t s • March 200340
prices and the creation of excess capacity insome regions. Following a substantial taxreform in 1991 and further cuts in interestsubsidies in 1993, the cycle turned around,with house prices plummeting to their mid-1980 values.
Another example of policies aimed at a micro-management of the housing market isprovided by Ireland. The governmentintervened in the residential housing marketin response to rising property prices duringthe late 1990s and in 2000. A number ofadjustments to the stamp duty system weremade, favouring transactions for first-timebuyers and, to a lesser extent, owner-occupiers, but raising transaction taxes, andimplementing an anti-speculative property taxfor investors. These measures led to aslowdown in house prices as investors exitedthe market, but – at the same time – privaterents accelerated. However, in 2002, manyof these measures implemented to discourageinvestors were reversed, mainly in responseto a shortage in the availability of rentalaccommodation. Consequently, as investorsreturned to the market, house prices againbegan to increase, but private rents began tofall moderately.
Often public interventions in the housingmarket raise the risk of reducing economicefficiency by making transactions moreexpensive and reducing labour mobility. Inrecent discussions, this occasionally compares
with a potential benefit coming from theprevention or slowdown of bubbles in houseprices. Housing policies that increasetransaction costs are sometimes claimed toreduce speculative behaviour in the housingmarket, while still trying to keep incentivesfor long-term and owner-occupied housinginvestment. However, recent researchsuggests that transaction costs may only havea minor impact in preventing asset pricebubbles,52 but that they impact negatively onlabour mobility.
4.5 Housing taxes and subsidies:policy-related issues
In view of the potential importance of therental sector for labour mobility and for theefficient overall functioning of the housingmarket, the bias of tax relief and subsidies infavour of owner-occupation should be re-considered, particularly in countries wherethe share of the rental sector has fallen tovery low levels. A reduction of policy-inducedtransaction costs for owner-occupied housingwould also foster labour market adjustment.
Moreover, given the long horizon of housingdecisions, a predictable tax-subsidy system iscalled for in order to prevent the micro-management of housing related taxes andsubsidies from being an independent sourceof shocks.
5 Mortgage markets
5.1 The interrelationship betweenmortgage and housing markets
Most transactions in the housing marketinvolve a corresponding transaction in themortgage market. Economic literature hashighlighted how the interplay between thesetwo markets can amplify the effects of shockson house prices, strengthen the transmissionof mortgage interest rate changes toeconomic activity and, in extremecircumstances, threaten the financial position
of households (with possible consequencesfor the financial system).
For example, an initial drop in mortgage ratescan give rise to higher house prices andwealth. The increased collateral value of theirassets may give households access to moreloans and at better terms (through theso-called “credit channel”). This, in turn, may
52 See H. Hau, “Estimating the volatility effect of a Tobin tax”,Fondation Banque de France, 2001.

41ECB • S t r u c tu ra l f a c t o r s i n t he EU hous i ng marke t s • March 2003
feed back into more demand for housing anda second round of higher house prices. Whilehousehold debt is rising in this process, themarket value of the housing assets is alsorising, and there is no apparent dis-equilibrium in household portfolios. Indeed,loan-to-value (LTV) or gearing ratios may befalling all along this process, while householdsmay be using the extra liquidity to spend onconsumption goods or to invest in financialassets. After debt has risen, an increase inmortgage rates will have a twofold effect onhousehold finances. It will raise the servicingof the accumulated debt and it will negativelyaffect the market value of the households’housing assets and, hence, the household’snet worth. In the case of highly indebtedhouseholds with few assets other than theirhouse, a rise in interest rates may well have acombined negative income and wealth effect.
There are some well-documented caseswhere the credit channel has beeninstrumental in triggering a boom-bust cyclein the housing market (e.g. Nordic countriesafter financial market liberalisation). Ingeneral, however, it is difficult to say howimportant the effects of the credit channelare. House prices and mortgage liabilities maybe rising together because of other reasons,for example because of improvedexpectations of future growth. Furthermore,the risks to the financial position ofhouseholds can only be judged by looking atall assets and liabilities in their portfolio inrelation to the possible shocks thehouseholds may face in the future. Thus, therisks to the financial position of householdsfrom an increase in interest rates may bemuch reduced. Being a net creditor, thehousehold sector will typically benefit in netterms from a raise in interest rates, althoughsome highly indebted households may facesevere problems.
Even with these caveats in mind,developments in mortgage-backed liabilitiesare worth examining, first, because themortgage and housing markets are sointricately linked and, second, because thehigh safety of these liabilities and their
favourable fiscal treatment make them thedominant source of external financing forhouseholds in most countries. From amonetary policy point of view, the level ofmortgage indebtedness and the contractualcharacteristics of the accumulated stock ofdebt are also of interest because of theireffects on the transmission of monetary policyto economic activity. From a financial stabilitypoint of view, high debt levels do notnecessarily mean high risks for financialstability, but they do render some householdsmore vulnerable to variations of creditconditions, especially if these areaccompanied by income shocks and/or houseprice fluctuations.
In the rest of this section, the characteristicsof existing mortgage contracts anddevelopments in mortgage indebtedness areconsidered first. In the last sub-section,developments in “house equity withdrawal”(the difference between mortgage borrowingand residential investment) are considered.House equity withdrawal is an importantindicator of whether households are tappingtheir housing wealth to finance currentconsumption or the purchase of financialassets. Therefore, it is potentially aninteresting indicator when evaluating thehousing wealth effects on consumption.
5.2 Characteristics of mortgagecontracts
Starting in the early 1980s or, in the case of afew countries, even earlier, the financialsystem was deregulated with different speedsthroughout the EU (see Table A3 in Annex 1on the “Chronology of main policymeasures”). The measures taken included theabolition of interest rate ceilings, therelaxation both of quantitative credit controlsand of contractual restrictions and theremoval of strict barriers to entry into themortgage market. In addition, public mortgageinstitutions scaled back their activities andmeasures were taken to facilitate thesecuritisation of mortgage loans.

ECB • S t r u c tu ra l f a c t o r s i n t he EU hous i ng marke t s • March 200342
These changes increased the integration ofthe housing credit market with the rest ofthe financial system and created conditionsfor a rapid expansion of the range ofmortgage products available. They also raisedcompetition in the mortgage market and arebelieved to have reduced quantitativerationing. It is more difficult to say what theeffects of these changes have been onmortgage interest rates. In some countries,spreads of mortgage interest rates vis-à-visother market rates initially increased in theearly 1980s, as mortgage rate ceilings wereremoved and the mortgage market becamemore closely integrated with the rest of thefinancial system. In the second half of the1990s, spreads tended to decline, particularlyin those countries that achieved largereductions in inflation in the process ofconvergence prior to EMU.
Despite the integration process, housingcredit systems have continued to becharacterised by different types of mortgagecontracts, partly reflecting regulatorydifferences and partly contracts andconventions established in earlier periodswhen inflation rates and interest ratevariability were very different acrosscountries (see Table 5.1 at the end of thissection). The contractual features of theexisting stock of mortgage debt affect thespeed with which a fluctuation of mortgageinterest rates will be passed on tohouseholds’ disposable income. At anymoment in time, the effect of a change in themortgage interest rate on disposable incomewill depend on the share of contracts forwhich the interest rate is fixed (as well as onthe time to maturity of these contracts).Table 5.1 suggests that there are largedifferences on how widely variable or fixedinterest rate contracts are used in eachcountry. It should be said, however, that thechoice of variable versus fixed interest ratecontracts may change over time and can bedependent on current and expected futuremortgage interest rates.53
Other contractual differences may also play arole. For example, early repayment fees will
determine how far households will be willingand able to refinance their mortgage debt inthe case of an interest rate fall. Legal andregulatory restrictions on repayment feesdiffer across countries and one can onlypresume that contractual agreements onrepayment fees differ as well.
The mortgage market liberalisation processhas greatly increased the type of mortgageproducts available in the market and has madethe “typical” contract almost impossible todefine. The available information indicatesthat, rather than converging towards a certaintype of contract, the mortgage loan marketsare characterised by an increased variation inthe contracts used. This implies that theeffects of interest rate changes may vary notonly across countries, but also acrosshouseholds in the same country.
5.3 Mortgage debt
Over the past two decades, most EUcountries have experienced significantchanges in the household mortgage debt-to-GDPratio (or, equivalently, the mortgage debt-to-disposable income ratio). The pattern overthe whole period has differed betweencountries. In Finland, Sweden and the UnitedKingdom, the mortgage debt-to-GDP ratioalready increased fast in the 1980s, possiblyas a result of the early effects of financialderegulation, while the debt-to-GDP ratiorose faster in most other countries in the1990s (see Chart 5.1). In the Netherlandsand Portugal, the debt-to-GDP ratio rose byabout 35 percentage points in less than sevenyears. Germany and Spain also experienced arapid accumulation of debt in the 1990s. Themortgage debt-to-GDP ratio in 2001 is
53 Note that for the purposes of “new business”, i.e. lending withnew contracts, some of these contractual differences may be ofless relevance. The use of fixed interest rate contracts does notshield new borrowers from changes in the mortgage rate (thoughexpectations about the future path of interest rates become farmore important). All other things being equal, the effect of achange in mortgage interest rates on demand for houses is thuslikely to be just as strong in a system using fixed or variablerates.
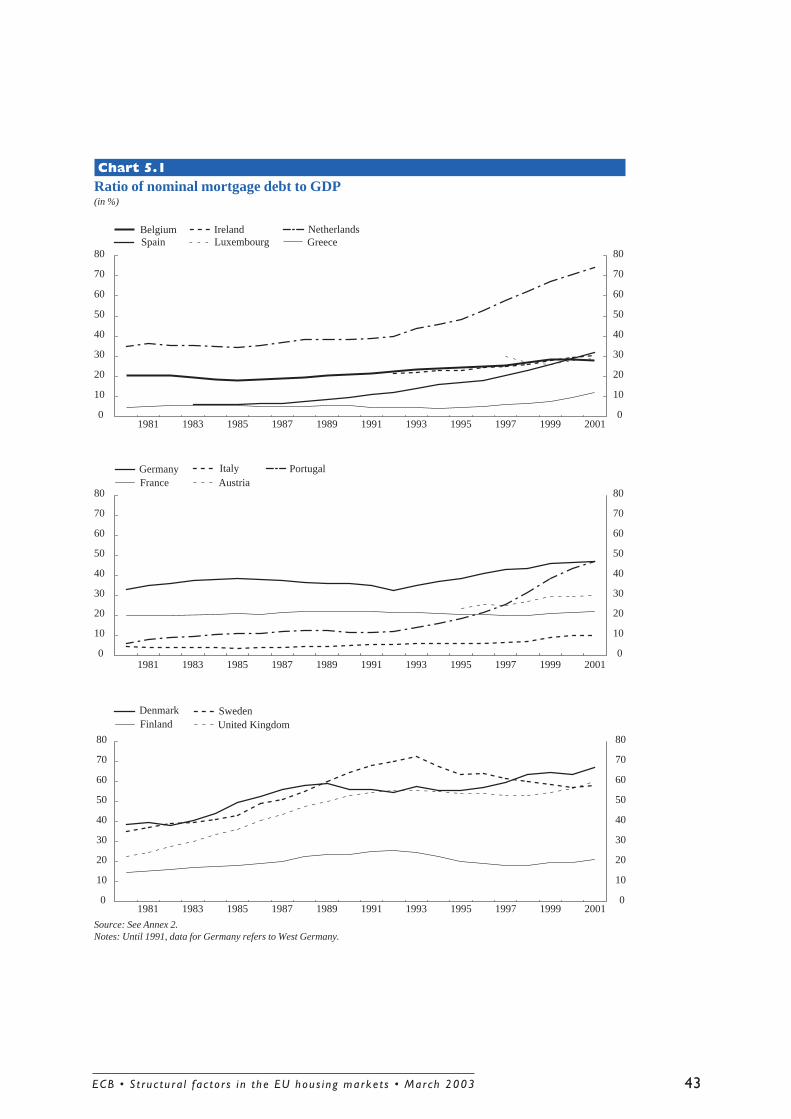
43ECB • S t r u c tu ra l f a c t o r s i n t he EU hous i ng marke t s • March 2003
Chart 5.1Ratio of nominal mortgage debt to GDP(in %)
Source: See Annex 2.Notes: Until 1991, data for Germany refers to West Germany.
0
10
20
30
40
50
60
70
80
0
10
20
30
40
50
60
70
80
0
10
20
30
40
50
60
70
80
0
10
20
30
40
50
60
70
80
0
10
20
30
40
50
60
70
80
0
10
20
30
40
50
60
70
80
1981 1983 1985 1987 1989 1991 1993 1995 1997 1999 2001
1981 1983 1985 1987 1989 1991 1993 1995 1997 1999 2001
1981 1983 1985 1987 1989 1991 1993 1995 1997 1999 2001
BelgiumSpain
IrelandLuxembourg
NetherlandsGreece
GermanyFrance
ItalyAustria
Portugal
DenmarkFinland
SwedenUnited Kingdom

ECB • S t r u c tu ra l f a c t o r s i n t he EU hous i ng marke t s • March 200344
Chart 5.2Estimated ratio of mortgage debt servicing to disposable income(index 1997 = 100)
Source: See Annex 2.Notes: For Greece and Luxembourg, nominal GDP is used instead of disposable income. Until 1991, data for Germany refers to WestGermany.
0
50
100
150
200
250
300
0
50
100
150
200
250
300
1981 1983 1985 1987 1989 1991 1993 1995 1997 1999 2001
1981 1983 1985 1987 1989 1991 1993 1995 1997 1999 2001
1981 1983 1985 1987 1989 1991 1993 1995 1997 1999 2001
0
50
100
150
200
250
300
0
50
100
150
200
250
300
0
50
100
150
200
250
300
0
50
100
150
200
250
300
BelgiumSpain
IrelandLuxembourg
NetherlandsGreece
GermanyFrance
ItalyAustria
Portugal
DenmarkFinland
SwedenUnited Kingdom

45ECB • S t r u c tu ra l f a c t o r s i n t he EU hous i ng marke t s • March 2003
estimated to have been highest in Denmark,the Netherlands, Sweden and the UnitedKingdom, and lowest in Greece and Italy (seeTable 5.1).54
The fragmented evidence available suggeststhat LTV ratios have also risen in mostcountries in recent years, possibly as a resultof the greater availability of mortgageproducts that permit households to bettermatch their income and their debt servicingand, thereby, to be subject to fewer creditconstraints. Changes in the lending criteriaare also likely to have had an impact, forexample, the change that permittedhouseholds in Netherlands to borrow againsta second income or to borrow withoutpermanent employment. On the basis of theavailable information, however, there wouldnot seem to have been a generalised easingof credit standards to which the risingindebtedness of households can beattributed.55 Concerning LTV ratios, most EUcountries have in place some mechanismthat makes it costly for both the borrowerand the lender to agree on LTV ratios above75% to 80%. Beyond this threshold, capitaladequacy ratios are higher, the use ofmortgage-backed bonds is restricted and theborrower may be requested to post extraguaranties.
As suggested above, rising housing prices mayhave contributed to the accumulation ofmortgage debt by raising the collateral valueof the household’s assets. This hypothesisfinds support in empirical literature.56 Housingprices, however, are probably not the mostsignificant reason why mortgage debtincreased rapidly in various EU countriesin the 1990s. High residential capitalaccumulation, improving income expectations,falling mortgage interest rates and a veryfavourable fiscal treatment of mortgage debtare all reasons likely to have contributedto mortgage debt accumulation. A roughestimate of debt servicing (based on theproduct of current mortgage interest ratesand the stock of debt) suggests that,compared with disposable income,households in most EU countries did not face
significant difficulties in servicing their highermortgage debt in the second half of the 1990s(see Chart 5.2).57 Falling nominal mortgagerates and rising income largely offset theeffects of rising mortgage debt. Only sinceabout 1999 is the debt servicing-to-incomeratio estimated to have risen in somecountries, such as Spain, Ireland, Portugal andthe Netherlands.
5.4 Mortgage borrowing as a source ofextra liquidity
The effect of an increase in housing wealthon final consumption, following a rise inhousing prices, depends at least in part onthe ability of households to realise the capitalgains, i.e. to turn wealth gains into extraliquidity that can be spent on goods (orinvested in financial assets). Given that thegreat majority of transactions in the second-hand housing market are betweenhouseholds, the consolidated householdsector cannot in general realise its capitalgains by selling its housing assets. Mosttransactions in the second-hand market andthe ensuing transfer of money net out.Instead, the liquidity of the household sectorcan increase if it can borrow more againstthe increased value of its housing assets.There are two main ways of this taking place:
1. without making any transaction in thehousing market, each household can ask a
54 The ratios of housing loans to GDP reported here are not strictlycomparable across countries. Depending on the country, housingloans may refer to loans to finance house purchases and repairsor, alternatively, to loans secured by housing assets. The coveragemay also vary. In some countries, housing loans in Chart 5.1 andTable 5.1 refer only to loans granted by monetary financialinstitutions (MFIs), while loans granted by all types of lenders areincluded in other countries. For a more detailed picture ofhousing loans from MFIs and other financial intermediaries(OFIs) in the euro area countries, see “Report on financialstructures”, European Central Bank, 2002.
55 See ECB “Report on asset price and banking stability”, 2000.56 See B. Hofmann, “The determinants of private sector credit in
industrialised countries: do property prices matter?”, Bank forInternational Settlements, working paper 108, 2001.
57 This is only a rough estimate of the debt servicing-to-incomeratio, particularly as it applies the mortgage interest rate of newcontracts to the whole stock of mortgage debt. For countrieswith predominantly fixed interest mortgage contracts, this islikely to under-estimate the true debt servicing-to-income ratio inperiods of falling nominal rates, and to over-estimate it inperiods of rising nominal rates.

ECB • S t r u c tu ra l f a c t o r s i n t he EU hous i ng marke t s • March 200346
Chart 5.3Investment in housing financed by households’ own capital over disposable income
Source: ECB estimations; for original data sources see Annex 2.Notes: For Greece and Luxembourg, the nominal GDP is used instead of the disposable income. Until 1991, data for Germany refersto West Germany. For Portugal, estimates of the Banco de Portugal are used.
-0.15
-0.1
-0.05
0.05
0
0.1
0.15
-0.15
-0.1
-0.05
0.05
0
0.1
0.15
-0.15
-0.1
-0.05
0.05
0
0.1
0.15
-0.15
-0.1
-0.05
0.05
0.1
0.15
-0.15
-0.1
-0.05
0.05
0
0.1
0.15
-0.15
-0.1
-0.05
0.05
0 0
0.1
0.15
1981 1983 1985 1987 1989 1991 1993 1995 1997 1999 2001
1981 1983 1985 1987 1989 1991 1993 1995 1997 1999 2001
1981 1983 1985 1987 1989 1991 1993 1995 1997 1999 2001
Belgium SpainIreland
LuxembourgNetherlandsGreece
GermanyFrance
ItalyAustria
Portugal
DenmarkFinland
SwedenUnited Kingdom

47ECB • S t r u c tu ra l f a c t o r s i n t he EU hous i ng marke t s • March 2003
mortgage lender for a higher mortgage loanor can re-finance and in the processincrease its debt once its housing wealthhas increased;
2. when households transact with each otherin the second-hand housing market, theycan reduce their own contribution andborrow more from the credit system whenhouse prices have risen, because thecollateral value of their assets has risen.The liquidity of the household sector willthus increase as a result of the higherhouse prices.58
Literature refers to both effects as “houseequity withdrawal”, although the underlyingmechanisms are rather different.59 The firstchannel is akin to an open credit line with themortgage system. Households can increase(or decrease) their mortgage borrowingrelatively fast after a change in house priceswithout any transaction costs in the housingmarket (though they may still have transactioncosts in the mortgage market). In many EUcountries, such direct borrowing against theincreased housing wealth is not common,except in particular circumstances (seeTable 5.1). Deregulation and increasedcompetition in the mortgage markets seem tohave opened up more possibilities forhouseholds to directly tap their housing wealth.In the United Kingdom, where disaggregatedestimates of house equity withdrawal exist, theimportance of this direct channel is found tohave increased in the past decade.60
The second channel is not necessarily linkedto the institutional setting of the mortgagemarket. For example, house equitywithdrawal can arise every time theownership of a dwelling passes from ahousehold with small outstanding mortgagedebt, for example a last-time seller with littledebt, to a household that borrows much tobuy the dwelling, for example a first-timebuyer with little own capital. Factors such asthe volume of transactions, demographics andthe distribution of wealth and liabilitiesbetween older and younger households mayplay a role.
Whatever the mechanism, if the creditchannel is in operation, one expects to seethat households will be using more external(mortgage) capital and relatively less of theirown capital for housing expenditurewhenever house prices rise.
Chart 5.3 shows an estimate of what theconsolidated household sector spends of itsown capital for housing investment as a ratioof disposable income. The estimate iscalculated as the difference betweenresidential investment (what is spent onhousing after netting out all transactionsbetween households in the second-handmarket) and the change in nominal mortgagedebt (what is received from the mortgagesystem). This estimate is gross of taxes,subsidies and transaction costs.61 A positivenumber suggests that, gross of taxes andsubsidies, the household sector wascontributing some of its own capital to finance
58 An example may better illustrate this point. Consider twohouseholds, each owning a house that costs €100,000 and hasan outstanding mortgage loan of €80,000 (LTV of 80%). Aftera fall in mortgage rates, the price of the houses rises to€120,000 and the two households decide to buy each other’shomes. Each household arranges with its respective bank tohave a new, bigger mortgage loan of €90,000 in view of themore expensive house, pledging to put €30,000 of its ownmoney (new LTV 75%). Each then receives €90,000 from thebank, sells its home for €120,000, extinguishes its old mortgage(for €80,000), pays for the new house (€120,000) and is eachleft with €10,000 extra to spend or invest in another asset.With this double transaction, LTVs of both fell and, at the sametime, both households withdrew housing equity of €10,000.Note moreover that the initial interest rate fall will also havereduced the original debt servicing-to-income ratio, giving moregrounds for the bank to grant the new loan despite the increasein the debt-income ratio.
59 There are additional ways of house equity withdrawal takingplace. For example, households may sell housing assets and landto other sectors of the economy at home or abroad, e.g. to thegovernment (against extra tax liabilities that may be deferred tothe future).
60 See M. Davey, “Mortgage equity withdrawal and consumption”,Quarterly Bulletin, Spring 2001, Bank of England.
61 This is only an approximation of the own capital of the householdsector. Residential investment also includes public investmentand residential investment by sectors other than the householdsector. Furthermore, this estimate is based on the assumptionthat there are no significant transactions of dwellings and landbetween the household sector and other sectors of the economy(e.g., purchases and sales of land and dwellings from thegovernment) and that new houses are primarily bought by thehousehold sector. Transactions with other sectors may beimportant and the value of these transactions may varysystematically with land and house prices. Nevertheless, it isinteresting to note that for the United Kingdom, the house equitywithdrawal over the disposable income estimated with our datais highly correlated with the equivalent series of the Bank ofEngland (the correlation coefficient for the annual data is 0.97).

ECB • S t r u c tu ra l f a c t o r s i n t he EU hous i ng marke t s • March 200348
housing investment expenditure. A negativenumber means that the household sector hasreceived more from the mortgage system thatyear than it invested in housing stock.
For most EU countries most of the time, thehousehold sector is estimated to have“injected” housing equity gross of housingtaxes and subsidies. Moreover, there has beenrelatively little variation in the ratio of ownhousing capital to disposable income overtime. This does not, however, seem to havebeen the case for Sweden in the late 1980s,the United Kingdom and, recently, Denmark,the Netherlands and Portugal. In all fivecountries, it is estimated that, in certainperiods, there has been significant houseequity withdrawal. In Denmark, theNetherlands, Sweden and the UnitedKingdom, house equity withdrawal hasgenerally coincided with significant upturns inhousing prices, as would be expected if the“credit” channel was in operation. All fourcountries have high accumulated debt levelsand in all four the mortgage system offersinstruments that permit households to taptheir housing wealth directly (see Table 5.1).
It is interesting to note that Portugal is anexception in this respect. House equitywithdrawal is estimated to have taken placein Portugal in a period when house priceswere not particularly booming and despitethe fact that direct equity withdrawal (asdescribed above) is not common. The strongrise in mortgage debt reflected the rise ofoverall indebtedness of households in thiscountry, presumably for reasons that had todo with income growth expectations andinterest rates and not with house prices.Starting from low mortgage indebtedness(close to 11% of GDP in 1990), households inPortugal are likely to have found mortgageloans a cheap source of financing.
The house equity “withdrawn” is estimatedhere to have been a substantial source ofextra liquidity for the household sector. Forexample, the estimated house equitywithdrawal in the United Kingdom in 2001was around 4% of disposable income.62 It is
interesting to note, however, that, with theexception of the Netherlands, all of the abovecountries do not have exceptionally high LTVratios. Indeed, the operation of the “credit”channel means that the rising market value ofhousing assets can permit households toborrow more without necessarily raising theLTV ratios or their leverage.
5.5 The housing credit system: somepolicy-related issues
This section focused on questions that aremore narrowly related to the interplaybetween the housing market and themortgage market. Clearly, this is just a sub-set of the more general question on whatdetermines the level of (mortgage)indebtedness and how “sustainable” thepresent levels are likely to be. Three pointsemerge from this section on the housingcredit system:
1. in general, the effect of housing pricefluctuations may be potentially important,but is probably not the determining factorfor the evolution of mortgage indebtedness;
2. having said that, for some countries, suchas Denmark, the Netherlands and theUnited Kingdom, there is some evidencethat the interplay of mortgage and housingmarket developments in recent years mayhave mutually reinforced the upwardmovement of both housing prices andmortgage debt. Instead, in Portugal, therise of mortgage indebtedness may havebeen more a reflection of macroeconomicdevelopments and changes in the financialsystem as a whole;
3. when coincident credit and asset priceexpansions are set in motion, controls overLTV ratios may do relatively little to curbhouseholds’ increasing demand for
62 The Bank of England estimate net of taxes and subsidies for thesame year is 3.5%.

49ECB • S t r u c tu ra l f a c t o r s i n t he EU hous i ng marke t s • March 2003
63 See C. Collyns and A. Senhadji, “Lending booms, real estatebubbles and the Asian crisis”, IMF working paper, January 2002.
mortgages precisely because the value ofthe collateral is increasing concurrently.63
There is thus an increased need to monitorthe evolution of households’ indebtedness
and financial fragility and to strengthen therole of risk assessment procedures.

ECB • S t r u c tu ra l f a c t o r s i n t he EU hous i ng marke t s • March 200350
Country Housing Interest Usual Leagal or Restrictions Estimated Legal and Capital Houseloans to rate length of regulatory on early average regulatory adequacy equity
households adjustment 2) contracts restrictions repayment fees loan-to-value limitations requirement release(% of GDP) 1) (% of all (new on interest (LTV) ratio on the products
new mortgage rate (new LTV availablemortgage loans) adjustment mortgage and/or
loans) loans) permissible
Belgium 28 F (75%) 20 years Variability Maximum 80-85% No 4% equity NoM (19%) cannot be three months’V (6%) less than interest on
a year remaining amount.
Denmark 67 F (75%) 30 years None None 80% 80% 4% equity YesM (10%) (since 1993)V (15%)
Germany 47 Mainly Up to None Lender can ask �70% 60% LTV 4% equity MortgageM and F 30 years compensation for loans if LTV no backed loans
payments for foregone backed by more than may beearnings within the first mortgage 100% used for
ten years of contract bonds consumptionbut not after. purposes or
may beinvested in
privatebusiness, asis often thecase with
SMEs.
Greece 12 F (5%) 15-20 years None No restrictions. 70-80% None 4% equity Yes, butM (15%) Usually the of veryV (80%) fee is 2.5% of limited use.
the remainingloan.
Spain 32 V (more 15-25 years None Maximum 1% �80% 80% LTV 4% equity Yes, butthan 75% and 2.5% for loans if LTV no unusual
cancellation backed by more thancommission for mortgage 80% (same
variable and fixed bonds. thresholdrate mortgage. for lower
provisioningfor non
performingloans)
France 22 F/M/Other Over 5 years None Fees limited to As a general 4% equity Not used(86%) (for 97% of all six months’ rule, 60% for
V (14%) 3) outstanding interest (at the loan toloan contracts average loan rate) be eligible toin December and to 3% the mortgage
2001) of capital still marketto be repaid.
Ireland 30 V (70%) 60-70% None 4% equity YesThe rest if LTV no But so far
mainly M more than limited to100% certain uses
Italy 10 F (28%) 10 to 25 years None No n.a. 80% (or 4% equity Not used100% if other
guaranteesare supplied)
Sources: NCB questionnaires.1) Housing loan-to-GDP ratios are not strictly comparable across countries. See footnote 54.2) Fixed (F): interest rate fixed for more than five years or until final maturity; Mixed (M): interest rate fixed for more than one year and up to five
years; Variable (V): after one year, interest rate renegotiable or tied to market rates or adjustable at the discretion of lender (O): other.3) V: interest rate tied to market rates only (other renegotiable interest rates not included). Flows of new mortgage loans granted by resident credit
institutions in 2001.4) Of existing stock of loans.5) Information refers to the private sector.6) Refers to the period up to 2001. With the abolition of legal restrictions on the maximum length, the usual length may have now increased.
Table 5.1Overview of current mortgage systems in the EU countries

51ECB • S t r u c tu ra l f a c t o r s i n t he EU hous i ng marke t s • March 2003
Country Housing Interest Usual Leagal or Restrictions Estimated Legal and Capital Houseloans to rate length of regulatory on early average regulatory adequacy equity
households adjustment 2) contracts restrictions repayment fees loan-to-value limitations requirement release(% of GDP) 1) (% of all (new on interest (LTV) ratio on the products
new mortgage rate (new LTV availablemortgage loans) adjustment mortgage and/or
loans) loans) permissible
Luxembourg 29 V (90%) 20 to 25 years None None 80% as a None 4% equity Not used maximum, if LTV noexcept in more than
special cases 100%
Netherlands 74 F (74%) 4) 10 years None None 112% None 0% equity YesM (19%) 4) for governmentV (7%) 4) guaranteed
loans (theserequire 30-35%
debt serviceto income
ratio) Otherwise4% equity if
loan up to 75% of real estate’s
liquidation value
Austria 30 Interest rate 60% 80% orcap of 6% 100% if
for loans by unsecuredbuildingand loan
associations
Portugal 47 Mainly V 25-30 years 6) None Cannot exceed 70-80% No 4% equity Though1% of the (for the if LTV legally
corresponding subsidised no more permissible,amount to regime, ended than 75% they are not
be amortised in September explicitlyin the subsidised 2002, there 8% for market by
regimes. (The was an the part bankssubsidised regime upper limit of the
ended in of 50% on loansSeptember 2002. the ratio exceedingThe restriction of capital 75% of the
applies to plus interest housecontracts payments value.
signed until over income)September 2002
under thesubsidisedregime).
Finland 21 F (2%) 15-20 years None Households have 75-80% No 4% equity YesV (97%) the legal right
Other (1%) to repay housingloans prematurely.
For fixed rateloans, consumermust compensatethe creditor forthe interest rate
differentialbetween the loanand the currentmarket interest
rate.
Sweden 5) 58 F (38%) No 80-90% None 4% equity YesM (24%) if LTV noV (38%) more than
100%
United 60 V (72%) 70% 4% equity YesKingdom N (28%) if LTV no
more than100%
Table 5.1 cont’d

ECB • S t r u c tu ra l f a c t o r s i n t he EU hous i ng marke t s • March 200352
Annex 1: Chronology of main policy measures
Table A.1Major reforms of rent regulations since 1980
Belgium 1984: Rent increases linked to CPI.1985-1987: Indexation temporarily suspended.1991: Freely negotiated new rental fixed term contracts introduced.1997: Limits set to new short-term agreements.
Denmark 1990: Condominiums built after 1991 exempt from rent control.
Germany 1983: Introduction of upper limit of 30% in a three-year period on rent increases for sitting tenants;rent escalation clauses and rent contracts linked to a price index permitted.
2001: Upper limit on rent increases in a three-year period reduced to 20%. Period of giving noticefor tenants reduced to three months.
Greece 1997: Freely negotiated rents in new contracts. Minimum duration of contracts of three years.
Spain 1985: Freely negotiated rents in new agreements.1995: Minimum lease of five years (at tenant’s option); CPI indexation. One-off updating of
existing contracts (to be implemented over ten years).
France 1997: New contracts liberalised.
Ireland No significant controls/regulations on rent contracts.
Italy 1992: Freely negotiated new fixed-term contracts introduced.1998: Two types of “free” contracts: freely negotiated at the individual level at the start and
contracts where yearly rent increases are collectively negotiated by landlords and tenants
Luxembourg 1987: Increases in the rents of dwellings built before 10 September 1944 and clarification of themeaning of invested capital for those built after this date.
Netherlands 1994: Liberalised more expensive segment of rental market.
Austria 1986: Partial liberalisation of new tenancies.1994: “Indicative value rent system” introduced.
Portugal 1981: Freely negotiated rent contracts for new tenancies introduced (but no indexation allowed inthese contracts).
1985: Mechanism of updating all rents with CPI; one-off updating of old contracts (but stillremaining very distant to rents in new contracts).
1990: Possibility of setting a limit on the duration of rental contracts.1993: Possibility of introducing different indexation mechanisms under specific circumstances.
Finland 1990-1995: Gradual liberalisation of rent controls.after 1995: rents are practically free from public control; they should not be “excessive”
(in a legal sense).
Sweden No major reforms that could improve the efficiency of allocation in the rental sector have beenundertaken.
United Kingdom 1988: Assured tenancy – eviction easier and initial rent and indexation negotiated.

53ECB • S t r u c tu ra l f a c t o r s i n t he EU hous i ng marke t s • March 2003
Belgium Restriction of property tax reductions to owner-occupiers; continuous increase of transaction taxes(VAT) on new buildings.
Denmark Removed tax incentives for housing investment; continuous increase of stamp duties.
Germany Several measures to reduce tax deductions and subsidies for investment in housing; abolishedproperty tax; increased transaction costs.
Greece Raised property tax and transaction costs through increased administrative value of real propertyfor tax purposes; introduced new tax on large real estate property.
Spain Reduced tax deductions for secondary and rented dwellings; abolished imputed income onprincipal dwellings.
France Raised property tax; abolished taxes on imputed rents; tax reduction for low-income households;reduced transaction taxes.
Ireland Reduced tax deductions for interest payments, abolished for landlords; abolished property tax andhalved capital gains tax.
Italy Introduced local property tax; tax reductions for owner-occupiers and some categories oflandlords; reduced registration tax for owner-occupiers.
Luxembourg 1) Introduced an additional grant for architect’s or consulting engineer’s fees; increase in theamortisation rate applicable to rental dwellings; increase in the amount of mortgage interestdeductible from income taxes; introduced interest allowance that is not subject to any conditionsconcerning useful living space; extension of the state aid to middle-income households;registration tax regime made more favourable; introduced VAT refund for new dwellings andrepairs; increase in the maximum amounts of loans taken into account in the calculation of theinterest allowance and interest subsidy.
Netherlands Reduced tax relief for interest payments and restricted it to principal dwelling; introducedsubsidies for low-income first-time buyers.
Austria Reduced indirect subsidies; establishment of housing construction banks.
Portugal Restriction on and later end of mortgage subsidies for new loans.
Finland Introduced state-guarantees for owner-occupier’s loans.
Sweden Increase of property tax rate; tax reform to neutralise incentives for different forms of housinginvestment.
United Kingdom Phased out interest relief system.
Table A.2Major reforms of housing tax and subsidy policies in the 1990s
Sources: NCB contributions.1) Several important amendments to the Luxembourg legislation were enacted in July 2002: (i) the regime of registration duties was
simplified and a tax credit was introduced; (ii) the VAT regime was made more favourable (e.g. direct application of the low 3%rate); (iii) tax rate on profits from real estate sales reduced by half for 2002, 2003 and 2004; and (iv) improvement of theamortisation regime applicable to rental dwellings.

ECB • S t r u c tu ra l f a c t o r s i n t he EU hous i ng marke t s • March 200354
Belgium 1992 (in force since end of 1994): Law permitting the introduction of variable interest rate loans(“referenced loans”) and reducing the maximum early repayment fee.
1995: Amendment of 1992 law on “referenced loans”.1990s: Wave of mergers and privatisations in the banking sector.
Denmark Early 1990s: Liberalisation of mortgage contract terms and free access to withdrawal of net equityin houses and flats.
1997: Adjustable rate loans introduced.
Germany Interest rate deregulation in the 1970s.
Greece Mid-1980s to early 1990s: Gradual liberalisation of quantitative constraints, interest rates andother terms and conditions on housing loans.
Late 1990s: Liberalisation of mortgage refinancing; expansion of non-specialised commercialbanks into mortgage lending.
Spain 1974-1981 and 1987: Interest rate liberalisation.Early 1980s: Abolition of differences in the activities permitted for different types of banks.1989: Savings banks allowed opening branches outside their home regions.1992: Securitisation of mortgage loans introduced.1994 and 1996: Introduction of upper limits on cancellation fees.
France 1984: Bank specialisation requirements reduced.1987: Elimination of credit controls.1999: Reform of securitisation of mortgage loans.1999: Reduced limits on early repayment fees.
Ireland 1984: Formal guidelines for bank lending to private sector ended.1985: Interest rate deregulation.1991-1999: Reductions in the primary liquidity ratio from 8% to 2%.Second half of 1990s: Securitisation introduced.
Italy 1983: Interest rate deregulation.1983: Credit ceilings eliminated (and temporarily re-imposed in 1986 and 1987).1990: Abolition of administrative controls on branching.1993: Rationalisation of banking regulatory framework. Separation of long-term and short-term
credit institutions abolished.1995: Increase of legally maximum LTV from 75% to 80% (can be raised to 100% if other
guarantees are posted).
Luxembourg None.
Netherlands 1980: Interest rate deregulation.1992: Relaxation of the lending criteria.
Austria 1980: Liberalisation of interest rates,1981: Abolition of credit controls.1985: Re-establishment of interest rate controls through interest rate cartel.1987: Prudential reforms, capital requirements tightened.1993: Interest rate cartel expires.1999: Savings bank reform: banks enjoy more flexibility in their interest rate policies.1992-2000: Privatisation of state-owned banks.
Portugal 1983 onwards: Easing of entry restrictions in the banking and insurance sector.1984-1989: Liberalisation of interest rates (1984 for deposit rates and 1989 for lending rates).1990-1991: Abolition of credit controls and credit guidelines.Early 1990s: Legislation of entry, branching, specialisation and segmentation restrictions.Since 1993: Strengthening of prudential requirements and liberalisation of investment services.
Finland 1986: Abolition of interest rate controls.1987: Government withdrew guidelines on mortgage lending.1989: Securitisation introduced.
Sweden 1983: Mortgage institutions freer to issue bonds for refinancing of old dwellings.1985: Loan ceilings for banks abolished.1986: Portfolio regulations on insurance companies dropped.
United Kingdom 1980: Removal of credit controls. Banks permitted to lend mortgages.1986: Building societies allowed expanding their lending business.1987: Securitisation introduced.
Table A.3Policy changes in EU countries that affect the mortgage market

55ECB • S t r u c tu ra l f a c t o r s i n t he EU hous i ng marke t s • March 2003
Annex 2: Data sources
64 Report data from the various national authorities in charge of housing policies, from Eurostat and the European Mortgage Federation. Seehttp://mrw.wallonie.be/dgatlp/dgatlp/Pages/Log/Pages/accueil/Accueil.htm.
GDP: European Commission Ameco database and ESA 95.
Disposable income: OECD Economic Outlook. For West Germany after 1991, Bundesbankestimates.
Residential investment: ESA 95 and NCBs.
Housing loans to households: NCBs.
House prices: National sources (see Box 1). For West Germany, estimates by the Bundesbankbased on the weighted average of construction prices (70%) and land prices (30%).
House prices in capital cities: NCBs.
Stock market index: Bank for International Settlements.
Private consumption deflator: European Commission Ameco database. For West Germany,Bundesbank.
HICP: Eurostat.
Rents: Bank for International Settlements and NCBs. For data after 1995, Eurostat.
Mortgage interest rates: NCBs.
Construction costs: NCBs and EU Short-term Statistics Regulation (STS-R).
Land prices: NCBs.
Tenure structure: Housing statistics in the European Union 200264 and NCBs.
Number of households: Housing statistics in the European Union 2002.
Population: Eurostat.
Taxes and subsidies: NCBs.