Embed Size (px)
Citation preview

Structural Behavior of Self‐Consolidating Carbon Nanofiber Concrete
By Roberto Rodriguez, REU Student
Rachel Howser, Graduate Mentor
Y. L. Mo, Faculty Advisor
August 2010

Abstract
The purpose of this experimental research was to investigate the effectiveness of
carbon nanofiber being used as a strain monitor when added to a concrete mix while tested
under reversed‐cyclic loading. The two columns tested consisted of a traditional self‐
consolidating reinforced concrete (SCRC) column which served as the control specimen and a
self‐consolidating carbon nanofiber concrete (SCCNFC) column. The SCCNFC column contained
1.0% of carbon nanofibers by volume. Each column’s cross‐section was 304.8 mm (12.0 in.) by
304.8 mm (12.0 in.), and the distance from the columns’ base to the center of the applied load
was approximately 533 mm (21.0 in.). The longitudinal reinforcement (vertical rebar) in each
column consisted of six #8 rebars. The objectives of the experiments included studying the
structural behavior of the materials and examining the self‐sensing abilities of the two
concretes.
The research found that the addition of carbon nanofibers (CNF) to concrete improves
the strength and ductility of concrete columns. It was also proven that SCCNFC can be used as a
reversible strain sensor.
1. Introduction
The addition of carbon nanofibers to concrete has many mechanical and electrical
properties including increased strength, ductility and conductivity (Chen and Chung 1993, Xiao

2003). Because of the tunnel conductivity effect, CNF exhibits properties necessary for strain
monitoring and electromagnetic interference (EMI) shielding. Short‐fiber composites were
found to be a new class of strain sensor based on the concept of short electrically conducting
fiber pull‐out that accompanies slight and reversible crack opening. The electrical conductivity
of the fibers enables the DC electrical resistivity of the concrete to change in response to strain
damage or temperature, allowing sensing (Chen and Chung 1996, Chung 1995, Xiao 2003). The
most difficult issue presented during CNF concrete production is dispersion of the CNF
throughout the mix. It was discovered that CNF disperses better in SCC (Gao, Strum, & Mo,
2009), so a self‐consolidating carbon nanofiber concrete (SCCNFC) column was built and tested
under a reversed‐cyclic load. The structural behavior of the column was examined in addition
to the self‐sensing ability of the concrete. The results were compared to the structural and self‐
sensing ability of the SCRC column, the control specimen.
2. Experimental Program
In this project, researchers compared the behavior of two shear‐critical columns, SCRC
and SCCNFC. Both of the columns were tested by applying an axial load equal to one‐tenth of
the column’s axial capacity and then applying a lateral reversed‐cyclic load at the top of the
column until failure occurred. Linear Voltage Displacement Transducers (LVDTs) were placed in
critical locations to measure displacement and strain (Figure 1). Additionally, wire meshes were
embedded in all of the columns so that the electrical properties of the concrete could be
observed during the test to check the concretes for self‐health monitoring ability.
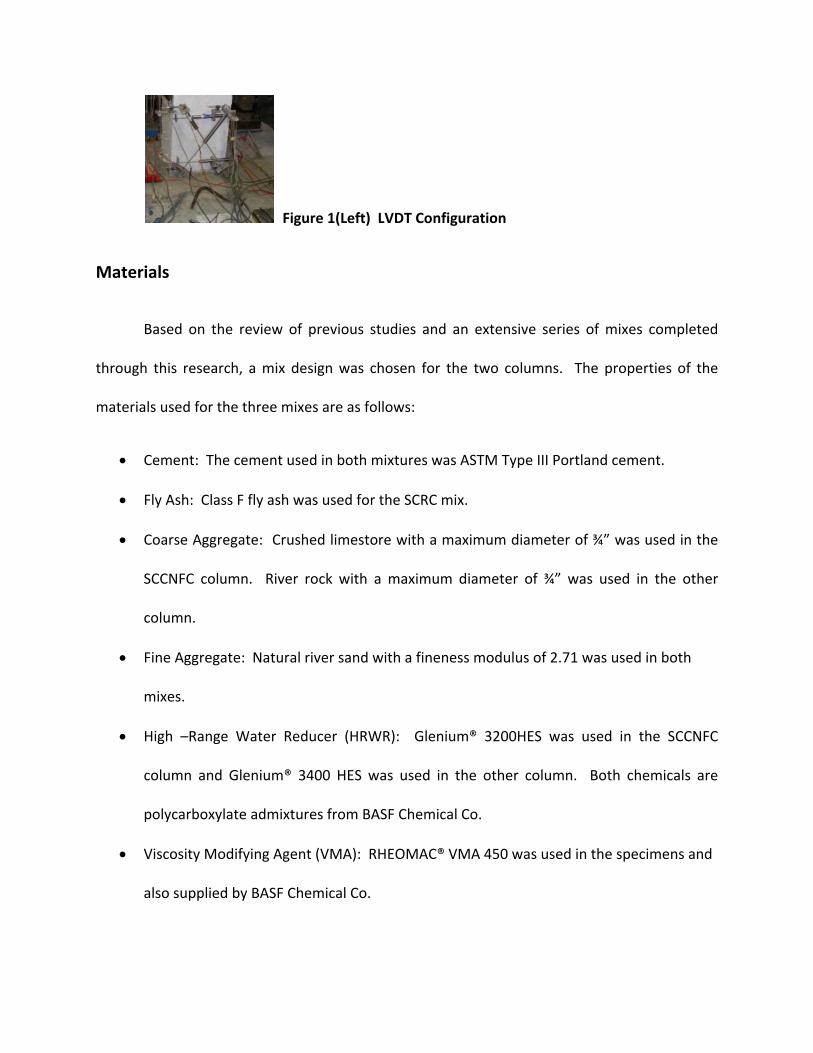
Figure 1(Left) LVDT Configuration
Materials
Based on the review of previous studies and an extensive series of mixes completed
through this research, a mix design was chosen for the two columns. The properties of the
materials used for the three mixes are as follows:
• Cement: The cement used in both mixtures was ASTM Type III Portland cement.
• Fly Ash: Class F fly ash was used for the SCRC mix.
• Coarse Aggregate: Crushed limestore with a maximum diameter of ¾” was used in the
SCCNFC column. River rock with a maximum diameter of ¾” was used in the other
column.
• Fine Aggregate: Natural river sand with a fineness modulus of 2.71 was used in both
mixes.
• High –Range Water Reducer (HRWR): Glenium® 3200HES was used in the SCCNFC
column and Glenium® 3400 HES was used in the other column. Both chemicals are
polycarboxylate admixtures from BASF Chemical Co.
• Viscosity Modifying Agent (VMA): RHEOMAC® VMA 450 was used in the specimens and
also supplied by BASF Chemical Co.

• Carbon Nanofibers: Pyrograf Products, Inc. PR‐19‐XT‐LHT‐OX fibers were used in this
study. The specific gravity of the fibers is 0.0742. The diameter of the fibers is 149 nm
(5.87e‐6 in.) and the length is 19 μm (7.48e‐4 in.) resulting in an aspect ratio of 128.
The mix proportions were as follows:
Table 1 Mix Proportions in kg/m3 (lb/yd3) of Concrete
Material SCRC Mix SCCNFC Mix Cement 446 (752) 457 (771)
Fly Ash (Class C) - - Fly Ash (Class F) 299 (504) - Fine Aggregate 937 (1580) 898 (1514)
Coarse Aggregate (Limestone) - 859 (1448) Coarse Aggregate (River Rock) 491 (827) -
Water 224 (377) 182 (307) Glenium® 3400HES 2.81 (4.73) - Glenium® 7700HES - 2.34 (3.94)
REHEOMAC® VMA 450 5.69 (9.59) - Carbon Nanofibers ‐ 3.23 (5.45)
Specimens
Both cross‐sections of the column were 304.8 mm (12 in.) square and contained six #8
rebar. See Figure 2. The columns contained #2 stirrups with a spacing of 120.7 mm (4.75 in.)
providing transverse reinforcement. See Figures 3a and 3b. Since the columns were designed
to be shear critical, the maximum reinforcement spacing was chosen based on the American
Concrete Institute (ACI) specifications. Number 2 stirrups were chosen to ensure shear failure.
The columns were 507 mm (20 in.) in height. Both of the columns were rigidly connected to the
similar foundations. The foundation dimensions for each specimen were 1525 mm (60 in.) by
1525 mm (60 in.) by 381 mm (15 in.), and the foundation contained two layers of #8 rebar in

one direction spaced at 174 mm (6.84 in.) encompassed by stirrups made of #3 rebar spaced at
164 mm (6.45 in.). See Figures 4 through 6.
Figure 2 Cross‐Section of Columns (all dimensions in inches)

Figure 3a Elevation View of the Weak Axis of the Shear‐Critical SCRC and SCCNFC Columns and Foundations (all dimensions in inches)
Figure 3b Elevation View of the Strong Axis of the Shear‐Critical Columns and Foundations (all dimensions in inches)

Figure 4 Rebar Cage with all Foundation Formwork
Figure 5 Plan and Elevation View of the Foundation (all dimensions in inches)
Figure 6 Typical Foundation Rebar Cage

Constru
Aspecimen
CCo
test, whi
flow is th
cone (Fig
classified
is why it
The test
uction of T
As shown befns:
Tab
MaCe
Fly AshFly AshFine A
oarse Aggreoarse Aggreg
WGleniumGlenium
REHEOMACarbon
Once mixe
ch is similar
he mean dia
gure 7). Gen
d as SCC. A s
is the most
can be used
Figure 7(rigSlump Flow
Test Specim
fore the follo
ble 1 Mix Pr
aterial ement h (Class C) h (Class F) Aggregate egate (Limesgate (River R
Water m® 3400HESm® 7700HESAC® VMA 4
Nanofibers
d workabilit
r to the con
ameter of th
nerally, any c
slump flow t
commonly u
effectively
ght) w Setup
mens
owing mixin
roportions in
stone) Rock)
S S 450
ty and flowa
ventional sl
he horizonta
concrete wit
test is simple
used test. Th
to control th
g proportion
n kg/m3 (lb/
SCRC446 (7
-299 (5
937 (1-
491 (8224 (3
2.81 (4-
5.69 (9-
ability of the
ump test us
al spread of
th a slump f
e, rapid and
he test gives
he consisten
ns were used
/yd3) of Conc
C Mix 752)
504) 1580)
827) 377) 4.73)
9.59)
e mix can be
sed for trad
the concret
flow value g
can easily b
s a good asse
ncy of SCC on
d to constru
crete
SCCNF457
898 (859 (
182
2.34
3.23
tested usin
itional conc
e mass, afte
reater than
be performe
essment of f
n site from b
ct both
FC Mix (771) - -
(1514) (1448) - (307) - (3.94) - (5.45)
g the slump
retes. The s
er lifting Abr
25 inches ca
d on site. W
filling ability
batch‐to‐bat
p flow
slump
ram’s
an be
Which
also.
ch.

The selection of a desired slump flow value can be accomplished using the chart shown
in Table 2 (Daczko & Constantiner, 2001). It is recommended to choose the smallest value
considering all the influencing parameters, such as reinforcement level, depth and length of
casting, coarse aggregate content, etc., which will prevent problem areas, highlighted in dark.
For example, the smallest recommended value of slump flow for a high reinforcement level
would be between 22 or more and less than 22 inches would be problematic. Also from Table 2
it is worth mentioning that a slump flow value greater than 26 inches would be problem‐free in
all the cases mentioned, but the strength would be dependent to the mix proportions.
Table 2 Slump Flow Parameter Determination Chart (PCI, TR‐6‐03, 2003)
Slump Flow

SCC having satisfactory slump flow could be produced easily with high coarse
aggregate content suitable for large depths of casting. The SCRC had a diameter of 22.5 inches
which we then constructed the column with (See Figure 8).
Figure 8 SCRC mix
Rebar and Concrete Construction
Before the concrete was poured and the rebar cage was set in place to cast the columns,
certain precautions and setups were executed. The wooden platform which the columns were
casted on had to be placed properly over the bolt holes in the strong floor so we could then
place the bolts that would going in the foundation during both casting and testing. Precautions
were taken to reinsure the best and most effective casting process. We would place PVC pipe
around the all‐thread rods to ensure easy securing and unsecuring methods (Figure 9). Clay was

also placed around the bottom of the pipe which was also covered with tape to prevent
concrete from leaking out of the form, tightening the pipe down with nuts from the top of the
all‐threads ensured the pipes would not move during the casting process (Figure 8). The wet
part of the form was Shepler’s Form Release agent which makes for an easy de‐molding.
Figure 9 Plywood Formwork with All‐Thread Rods and PVC Pipe
Once the setup was complete, the concrete mixing began which was eagerly followed by
the pouring into the mold (Figure 10).

Figure 10 Pouring concrete into Formwork
Concrete was removed from the area surrounding the base of the column. This area will have
concrete placed when the column is cast to minimize the likelihood of a failure due to a cold
joint. See Figure 11.
Figure 11 Removal of Concrete Near Column Base

Once the foundation was casted, it was then maneuvered into the testing position
which is where the actual column was then casted in the following steps:
a) All‐thread rods for connection to the actuator were placed near the top of the column.
See Figure 12.
Figure 12 All‐Thread for Connection to Actuator and Steel Plate for Support of Column Formwork
b) Two steel plates ware placed over the area of concrete that had been removed from the
foundation to support the column formwork. One plate was placed on each side of the
column. Figure 12 shows one of these plates in place.
c) A steel and plywood formwork provided by Shepler’s was placed around the column
rebar as shown in Figure 13.

Figure 13 Plywood and Steel Formwork around Rebar
d) The wire mesh were then put into place (Figure 14) in the configuration as shown in
Figure 15.
Figure 14 Wire Mesh installation

Figure 15 Wire Mesh Configuration
e) The concrete was poured.
Loading Protocol
Both specimens were tested under a reversed‐cyclic loading process while having an
axial load which remained constant throughout the test. The actuator and axial load were put
together as follows:

1) The yoke which held the actuator in the horizontal position was attached to the vertical
steel frame seen in Figure 16.
Figure 16 Vertical Steel Frame
2) Then the actuator was bolted onto the yoke. See Figure 17
Figure 17 Actuator bolted to yoke
3) The I‐beam was then attached to the actuator head. See Figure 18.

Figure 18 I‐Beam connection
4) The column was secured to the strong floor using 16 2 inch diameter bolts. See Fig. 19.
Figure 19 Bolts securing foundation to strong floor
5) Lateral bracing was then applied to ensure no movement during testing. See Fig. 20.

Figure 20 Lateral Foundation Bracing
6) Finally, the vertical loading application was setup as shown in Figure 21. A lead sheet
was placed on the bare top of the column, followed by a 4‐ball roller, 2 inch thick plate
which was 12inx12in, the jack which was used to apply the vertical load, and then the I‐
beam on the jack. The I‐beam was connected to the foundation using all‐threads (Figure
20) which ran through the I‐beam and attached to the hinges (Figure 22) on the
foundation which are located diagonally across the cross section of the column.
Figure 21 All‐Thread Rods Used in Axial Loading System

Figure 22 Hinges Used in Axial Loading System
After the bracing and securing of the foundation and the axial load system was
complete, we began the load program required for testing.
The first step of the load program was to apply an axial load that would remain constant
throughout the duration of the test. The axial load equaled one‐tenth of each of the columns
calculated axial capacity. Rachel calculated this using an unfactored interaction diagram. The
axial capacity is dependent on the compressive strength of the concrete (fc’), so the axial load
varied for each specimen. After the axial load was applied, a reversed‐cyclic load was added
using a 649 kN (146 kip) capacity actuator (Figure 16). The intended load path was to use force
control to complete two cycles each of ±89 kN (20 k), two cycles each of ±178 kN (40 k), two
cycles each of ±267 kN (60 k). A positive force denotes a push by the actuator while a negative
force represents a pull by the actuator. Once failure occurred, the column was pushed in

displacement control to try to obtain a descending branch on the load versus displacement
curve. See Figure 23 for a visual representation of the force controlled load path.
Figure 23 Horizontal Loading Program
Experimental Results
SCRC Column
The intended load path shown in Figure 23 was followed for the SCRC column. The
actual load path can be seen in Figure 24 with the first cracks, the switch to displacement
control and failure marked.
Figure 24 SCRC Column Load Path
Displacement ControlLoad Control

Unfortunately the hinges on each side of the actuator began to twist during the test.
One of the hinges was stabilized using a small jack which straightened the remaining hinge
which was out of place. Figure 25 shows the actuator with the hinges in the testing position.
The twisting of the hinge caused some torsion to be present in the column. The first crack on
the south side of the column occurred at ‐178 kN (‐40 k) and appeared to be the result of
torsion. The rest of the cracks appeared to be shear or flexural in nature. The first shear crack
formed on the column during the first ‐178 kN (‐40 k) cycle at ‐178(‐40k) on the west side. The
first flexural crack formed on the north side during the second 178 kN (40 k) cycle at 178 kN (40
k). The column failed in shear and crushing of concrete at 276 kN (62.0 k). The west side of the
column underwent crushing of the concrete struts with large shear cracks. The east side had
local crushing at the actuator connection. The maximum displacement at the top of the column
(drift) was 12.7 mm (0.50 in.). Figures 26 through 29 show the east, south, west and north
sides of the column after failure, respectively. Figure 30 shows the load versus displacement
curve for the test.
Figure 25(Left) Position of Actuator during SCRC Test

Figure 26(left) East side of SCRC Column after Failure, Figure 27 (right) South side of SCRC column after Failure
Figure 28(left) West side of SCRC Column after Failure, Figure 29(right) North side of SCRC Column after Failure

Figure 30 Force vs. Displacement Curve
SCCNFC Column
The intended load path shown was supposed to be the same as the one used for the
SCRC column; however, the pump shut down during the test, and the actuator unloaded during
the fifth cycle of the test. The pump was turned back on and the test resumed. The actual load
path can be seen in Figure 31. The first flexural crack formed on the column at 160 kN (36 k) on
the east, west and north sides. The second flexural crack formed on the east, west and south
sides at a load of ‐158 kN (‐35.6 k). The column failed in both shear and crushing at 298 kN
(66.97 k) on the west side of the column. The maximum displacement was 10.16 mm (0.4 in.).
Figures 32 through 35 show the east, south, west and north sides of the column after failure,
respectively. Figure 36 show the load versus displacement curve for the test.
‐80.00‐60.00‐40.00‐20.000.0020.0040.0060.0080.00
‐0.3 ‐0.2 ‐0.1 0.0 0.1 0.2 0.3 0.4 0.5 0.6Force (kips)
Deflection (in)
RC Column Force vs. Displacement Curve

Figure 31 SCCNFC Column Load Path
Figure 32(right) and 33(left) show East and South sides of SCRC column after Failure
36
‐35.55
66.97
‐100
‐50
0
50
100Force (kips)
Time (not to scale, test lasted approximately 6.7 hours)
CNFSCRC Column Load Path

Figure 34(left) and 35(right) show West and North Sides of SCRC Column after Failure
Figure 36 CNFSCRC Column Force vs. Displacement Curve
‐80.00
‐60.00
‐40.00
‐20.00
0.00
20.00
40.00
60.00
80.00
‐0.20 ‐0.10 0.00 0.10 0.20 0.30 0.40 0.50Force (kips)
Deflection (in)
CNFSCRC Column Force vs. Displacement Curve

The structural behavior of the columns differed due to the variation of the contents in
each mix of concrete. The SCCNFC column failed at a higher load, underwent more deflection,
and was stiffer than the SCRC column. A definite yielding of longitudinal steel occurred in both
columns as well.
During each of the column tests, the electrical resistance was determined to check the
self‐sensing ability of the concrete. To measure the electrical properties of the concrete, the
voltage and current were measured as seen in Figure 14 using the meshes in this configuration.
A power supply was attached to the top mesh that provided a 31V DC current. A voltmeter was
attached to the bottom mesh and connected back to the power supply to complete a circuit.
The current measured by the ammeter was recorded continuously during the tests by hand.
Voltmeters were attached to the two middle meshes on both the north and south sides of the
column to measure voltage. The voltage readings were also recorded continuously during the
tests by hand. See Figure 37 for the power supply and voltmeters used. To determine the
electrical resistance, Ohm’s law was used (Eq. 1).
Figure 37 Power Supply & Voltmeter

The electrical readings showed a great correlation between the peaks in the force, strain
and resistance plots for the SCCNFC column and little correlation between the resistance plots
and the force or strain plots for the SCRC column. Figures 38 and 39 show the relationship
between the SCRC column’s force, strain and resistance versus time on the north and south
sides of the column, respectively. The strain was measured using an LVDT rosette. However,
the LVDTs did not record the data properly, figures 40 and 41 show relationship between the
SCCNFC column’s force, strain and resistance versus time on the north and south sides of
column, respectively.
Figure 38(left) and 39(right) Show correlations between strain, resistance, and force

Figure 40(left) and 41(right) Show correlations between strain, resistance, and force
Conclusion
In conclusion, the addition of carbon nanofibers in the concrete mixture increases both
the strength and ductility of the column. It also resulted in a more effective health monitoring
system of the column when measuring the resistance given the relationship between the
voltage and current using Ohm’s Law. Therefore SCCNFC can be used as a reversible strain
sensor. The peaks and valleys in the electrical resistance readings of the concrete match the
peaks and valleys of the applied force and the strain in the concrete. While the peaks and
valleys in the electrical resistance readings of the SCRC specimen occasionally matched, there
was not enough correspondence to safely assume that this concrete could or should be used as
a reversible strain sensor.

References
ACI 318. Building Code Requirements for Structural Concrete. Farmington Hills, Michigan:
American Concrete Institute, 2008.
ACI 544.1R. State‐of‐the‐Art Report on Fiber Reinforced Concrete. Farmington Hills, Michigan:
American Concrete Institute, 1996.
Chen, Pu‐Woei, and D. D. L. Chung. "Concrete as a new strain/stress sensor." Composites Part B:
Engineering 27, no. 1 (1996): 11‐23.
Chen, Pu‐Woei, and D. D. L. Chung. "Concrete reinforced with up to 0.2 vol% of short carbon
fibres." Composites 24, no. 1 (1993): 33‐52.
Chung, D. D. L. "Strain sensors based on the electrical resistance change accompanying the
reversible pull‐out of conducting short fibers in a less conducting matrix." Smart
Materials and Structures 4, no. 1 (1995): 59‐61.
Daczko, J. A., and D. Constantiner. "Rheodynamic Concrete." 43rd Congresso Brasileiro do
Concreto. Brazil, 2001.
Gao, Di, Mariel Strum, and Y. L. Mo. "Electrical resistance of carbon‐nanofiber concrete."
Smart Materials and Structures 18, no. 9 (2009): 1‐7.
Howser, R. N. (2010). Shear Behavior of Bridge Columns with Self‐Consolidating Fiber
Concretes. Houston, Tx: University of Houston.
Xiao, H., C. Lan, X. Ji, and H. Li. "Mechanical and sensing properties of structural materials
with nanophase materials." Pacific Scientific Journal 5 (2003): 11‐17.

Acknowledgements
The research study described herein was sponsored by the National Science Foundation
under the Award No. EEC‐0649163. The opinions expressed in this study are those of the authors and do
not necessarily reflect the views of the sponsor.