Embed Size (px)
Citation preview

STRUCTURAL AND RESIDUAL STRESS ANALYSIS BY X-RAY DIFFRACTION ON POLYMERIC MATERIALS AND COMPOSITES
Viktor Hauk
Institut fiir WerkstofJkunde, R WTH Aachen, D-52056 Aachen, Germany
HISTORICAL REVIEW
Two papers are mentioned [l], [2] which describe basic tests on polymeric materials. Also a lot of publications of Sakurada et al. dealing with the Young’s modulus of polymeric materials are known. But the history of systematic stress analysis by X-ray diffraction starts with papers of Barrett and Predecki [3]. Fig. 1 tells the progress of the development in the studies on polymeric materials and composites. Here and subsequently, a distinction will be made between amorphous and semicrystalline polymers. Small particles are used to get a crystalline phase for strain measurement. Besides this filler of small amount, reinforcing fibers of higher amount are used to increase the strength of the polymers.
Results of different research groups have contributed to the present state of the art. The items listed in Fig. 1 refer to the very first paper on the specific branch of research. For example, the author’s group has studied besides the first paper (1982) [4] primarily the correlation of manufac- turing and structural parameters with the residual stresses (RS) 1989 [5], the micro RS 199 1 [6], the structural and the residual stresses and the RS profiles in reinforced polymeric components 1995 [7].
r
- Hauk
I985-
Nguyen & Noyan
\I amorphous t filler I reinforced
Barrett
Schnack
T semicrystalline
Hauk
Hoffmann
Hauk
t filler
Hauk
reinforced
Hauk
Hoffmann
Hauk
1
Fig. 1: A historical review of the first papers of each branch of research work on polymeric materials and composites.
Copyright(C)JCPDS-International Centre for Diffraction Data 2000, Advances in X-ray Analysis, Vol.42 540Copyright(C)JCPDS-International Centre for Diffraction Data 2000, Advances in X-ray Analysis, Vol.42 540ISSN 1097-0002

This document was presented at the Denver X-ray Conference (DXC) on Applications of X-ray Analysis.
Sponsored by the International Centre for Diffraction Data (ICDD).
This document is provided by ICDD in cooperation with the authors and presenters of the DXC for the express purpose of educating the scientific community.
All copyrights for the document are retained by ICDD.
Usage is restricted for the purposes of education and scientific research.
DXC Website – www.dxcicdd.com
ICDD Website - www.icdd.com
ISSN 1097-0002

POLYMERS
The polymers, amorphous, semicrystalline, amorphous + filler and the semicrystalline polymers + reinforcing fibers are listed in Table 1. References are made to the materials when describing the test results. Most of the results are concerned with injection molded plates.
Table 1: Semicrystalline and amorphous polymers and polymeric composites dealt with in different papers.
polymer
Polyethylene (PE)
Polypropylene PP>
Polybutyleneterephathalate (PBT)
Polyetheretherketone (PEEK)
Polyetherketone (PEK)
II 70 I orthorhombic I
70 I orthorhombic I
Polyamide (PA-6) 65 I monoclinic I
High impact Polystyrene (HI-PS) gg&+ : ::I 61;; PMMA 0 100 Ag : fee
polymer phase
a measurable, crystallinitj
PP a-PP, 45 vol.%
PBT PBT, 30 vol.%
PEK PEK, 30 vol.%
MEASUREMENT
not measurable 1
amorphous, 45vol.% 4 vol.% Al-powder p-PP, 10 vol.% 1 vol.% Cu-powder
amorphous, 7Ovol.% 22 vol.% glass spheres 21 vol.% glass fibers
amorphous, 7Ovol.% 15 vol.% C- fibers 18 vol.% glass fibers
filler reinforcement I
Strain measurements and stress evaluation on polymers are in many respects different from those of studies of RS in metals and ceramics. The different parameters are listed in Table 2. The main points are: suitable peaks are found only in the front reflection zone, large X-ray elastic constants (XEC), lattice distance strongly dependent on temperature, large penetration depth of X-rays, and
Copyright(C)JCPDS-International Centre for Diffraction Data 2000, Advances in X-ray Analysis, Vol.42 541Copyright(C)JCPDS-International Centre for Diffraction Data 2000, Advances in X-ray Analysis, Vol.42 541ISSN 1097-0002

the measurement can be made in reflection and in transmission. Although the texture of crystallites is strong and the exact determination of the peaks is difficult, linear lattice strain dependences are observed. An example is shown in Fig. 2 [S].
The symbols used are shown in Fig. 3. Also the basic formulae are given. For experts, further explanations are not necessary [9]. Table 3 summarizes the possibilities to determine the macro- and microstresses for the three categories of polymers: amorphous + filler, semicrystalline + filler and semicrystalline + fibers. More details of the definition of stresses, the transfer factor and of the compensation of macro- and microstresses can be found in [9].
Table 2: Comparison of the X-ray analysis on polymers or metals.
Structure
Metals
cubic, hexagonal, tetragonal
Amorphous polymers + crystalline fillers
Semicrystalline polymers
triclinic, monoclinic, amorphous rhombic
Suitable peaks back-reflection-zone back-reflection-zone for metal-fillers front-reflection-zone
Young’s modulus large small small
X-ray elastic constant small factor 2 WC) for metal-fillers
large
Lattice parameter strong dependence on temperature
dependence on Texture processing and
strong dependence on
mechanical treatment processing
Reinforcement strength improve- less strength high strength improvement ment by whiskers improvement by fillers by fibers
for all crystal symme- for a11 crysta1 symme tries of metal-fillers
only for PE using
XEC calculation tries using monocrys- monocrystal coefficients,
tal coefficients using monocrystal other polymers using coefficients macroelastic coefficients
Penetration depth low large large
Calibration no correction for correction for large correction for large penetration depth penetration depth penetration depth
Measuring technique reflection reflection reflection and transmission
Diffractometer y- IR-diffractometer Y-, S&diffractometer Y- for reflection technique, 7 for metal fillers IR- for transmission technique
Microstresses between phases in embedded fillers between polymer and reinforcement
Copyright(C)JCPDS-International Centre for Diffraction Data 2000, Advances in X-ray Analysis, Vol.42 542Copyright(C)JCPDS-International Centre for Diffraction Data 2000, Advances in X-ray Analysis, Vol.42 542ISSN 1097-0002

Fig. 2:
]PBTUOOI 20 =23.40 k .E 0.3820
E 0”
z 3 n~nnn
250
15ov IO” 15" 20"
Bragg’s angle 20 sin’v
Debyeogram and lattice distant D( 1OoI versus sin2yl of PBT [8].
Eqp,y = is2 (alcos2rp sin2v + 02sin2q sin2y + 0yxs21y) + s1 (01 + 02 + 03)
1 1 a D,=o,yJ CT, -03 =--
is2 Do d sin2v
1 1 3 qF=,o,, cr2-OS=--
is2 Do a sin2v
D,=o,~=o - Do -s&q +02)
CT3 = DO Sl ++s,
ND
direction of process
TD
1 =
DO(3Sl + +2) D,=o,w=o - Do - +
a D,=o,y 8 D,=,o,yf
zs2 3 sin2v +a.2 sin y
stress free direction 1 ,k+Y +&-J=O Oi independent direction a (&+v ‘4 = o
3 <Ti
phase stress = cJ L + 0 I + 0 E _ dep. + 0 II m - indep. (thermal, process)
macro (m) micro
Fig. 3: Symbols and formulae to calculate stresses from X-ray diffraction results [9].
Copyright(C)JCPDS-International Centre for Diffraction Data 2000, Advances in X-ray Analysis, Vol.42 543Copyright(C)JCPDS-International Centre for Diffraction Data 2000, Advances in X-ray Analysis, Vol.42 543ISSN 1097-0002

Table 3: Formulae to evaluate macro and micro RS on polymeric materials and composites, n. d.: not determinable x: stress compensation using volume ratio [9].
~~~~~. ph=iThousi . filler
--a CJ I( cTL +c+ +&I > f
l experimentally determinable
n.d.
;a-(JL 011 f ( >
( 1 ff-1 d
l
( oL +d +dl Ix’ ) I( oL +d +&I > f l
l
(~‘+cqLJI 1 (c++gIljf -4 (fU’-1)oI 1 (ff-1)o’
(0’ + d1 >a’ _&I (0’ + 011 I )
f - ffo1
semicrystalline reinforcement
l
( cJL +d +dl
> a’
n.d.
--a’ CT - g1 - or1 a’
( > n.d.
(01 +qLI x
(f~‘-l)o’ x
($ +($I > a’ -ffa’gI x
--a o phase stress gL load stress o1 macrostress CP microstress
f stress transfer factor index f filler index a’ crystalline + amorphous phase
Copyright(C)JCPDS-International Centre for Diffraction Data 2000, Advances in X-ray Analysis, Vol.42 544Copyright(C)JCPDS-International Centre for Diffraction Data 2000, Advances in X-ray Analysis, Vol.42 544ISSN 1097-0002
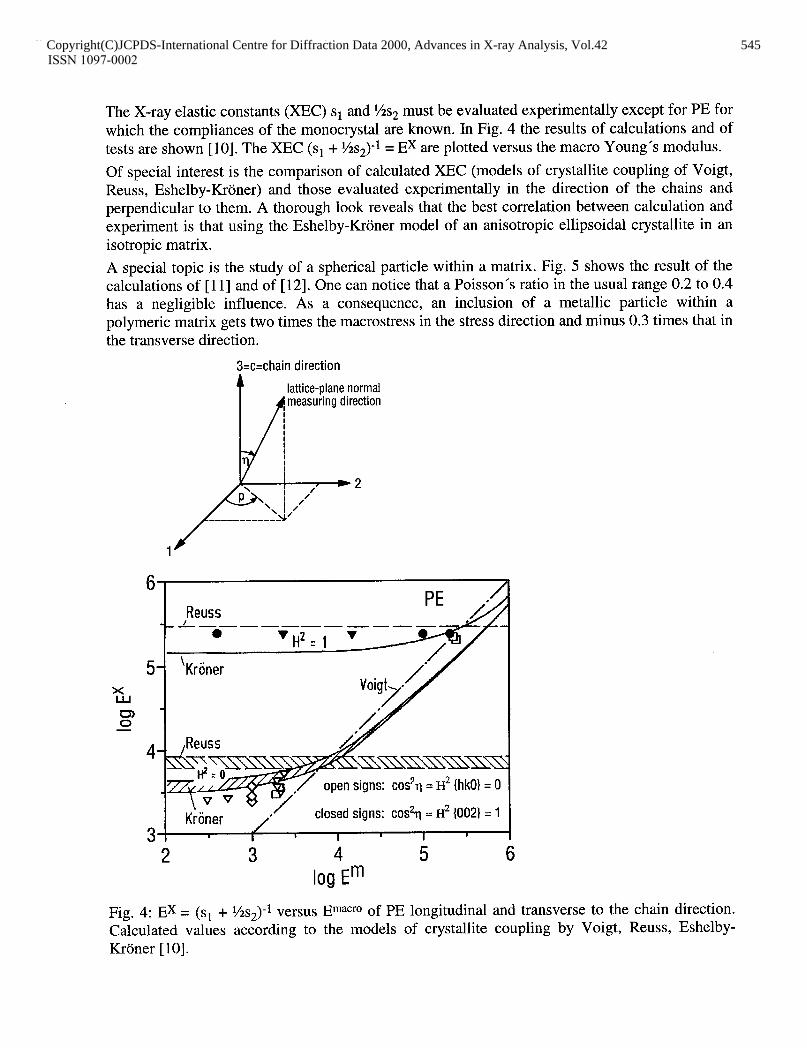
The X-ray elastic constants (XEC) s1 and %s2 must be evaluated experimentally except for PE for which the compliances of the monocrystal are known. In Fig. 4 the results of calculations and of tests are shown [lo]. The XEC (sr + ‘/s-J-r = Ex are plotted versus the macro Young’s modulus.
Of special interest is the comparison of calculated XEC (models of crystallite coupling of Voigt, Reuss, Eshelby-Kroner) and those evaluated experimentally in the direction of the chains and perpendicular to them. A thorough look reveals that the best correlation between calculation and experiment is that using the Eshelby-Kriiner model of an anisotropic ellipsoidal crystallite in an isotropic matrix.
A special topic is the study of a spherical particle within a matrix. Fig. 5 shows the result of the calculations of [ 1 l] and of [ 121. One can notice that a Poisson’s ratio in the usual range 0.2 to 0.4 has a negligible influence. As a consequence, an inclusion of a metallic particle within a polymeric matrix gets two times the macrostress in the stress direction and minus 0.3 times that in the transverse direction.
3=c=chain direction
lattice-plane normal
,?” v open signs: COC?TJ = H2 IhkO} = 0
KrSner ,+’ closed signs: cos% = H* {002) = 1
2 3 4 5 6 IogE"
Fig. 4: Ex = (sl + %s2)-1 versus E macro of PE longitudinal and transverse to the chain direction. Calculated values according to the models of crystallite coupling by Voigt, Reuss, Eshelby- Krijner [lo].
Copyright(C)JCPDS-International Centre for Diffraction Data 2000, Advances in X-ray Analysis, Vol.42 545Copyright(C)JCPDS-International Centre for Diffraction Data 2000, Advances in X-ray Analysis, Vol.42 545ISSN 1097-0002

s 2.0- Ei c I.5 b z c l.O- 2
g 05 L FJ o.o-
WG matrix ’ Gparticle) WE matrix ’ Eparticle 1
Fig. 5: Stress transfer factor versus the ratio macroelastic constants of matrix and embedded particle calculated by [ 1 l] for Poisson’s ratio 0.2,0.3,0.4 and by [ 121 for Al.
RESULTS
Amorphous polymers. Fig. 6 shows the stress in Al particles (10 m.% = 4.1 vol. %) versus the applied stress in the load and in the transverse direction [ 131. The transfer factors of about 2 and -0.3 are well verified. The curve for the stress direction shows some evidence for debonding at the particle - matrix interface. The correlation between the X-ray RS and the mechanically determined macro RS for Al particles in the HI-PS matrix is plotted in Fig. 7 [ 141. There exist micro RS in the Al particles.
30.
cd
2 20, c .-
5? >r, >r 10,
z 2 5
01
-lO-
PS +I0 m.% Al
/ 0 under load, cp=O”
c A under load, (p=90” 0 released
I I
0 IO 20 30 load stress in MPa
Fig. 6: Stress in load and transverse direction Fig. 7: Macro and micro RS of Al particles determined on the Al particles versus the versus the mechanically determined macro RS load stress [13]. in HI-PS injection molded plates [ 141.
4 HI-PStlO m.% Al
= i .-
3
c 0 .- is >r( -2
2
: 5 -4
!
-2.5 -2 -1.5 -1 -0.5
@kech. in MPa
Copyright(C)JCPDS-International Centre for Diffraction Data 2000, Advances in X-ray Analysis, Vol.42 546Copyright(C)JCPDS-International Centre for Diffraction Data 2000, Advances in X-ray Analysis, Vol.42 546ISSN 1097-0002

Systematic studies on epoxy+C fibers laminates were made by Schnack et al. [ 151, [ 161. Powders Systematic studies on epoxy+C fibers laminates were made by Schnack et al. [ 151, [ 161. Powders of Nb or Cd0 were inserted between the first and the second unidirectional reinforced ply. of Nb or Cd0 were inserted between the first and the second unidirectional reinforced ply. Results on different laminates are shown in Fig. 8 and Fig. 9. The stacking series are noted. An Results on different laminates are shown in Fig. 8 and Fig. 9. The stacking series are noted. An evaluation assuming a triaxial stress state results in linear dependences versus the applied load evaluation assuming a triaxial stress state results in linear dependences versus the applied load and at the edges shows evidence of shear stresses. and at the edges shows evidence of shear stresses.
4 0 c .- Q) z .- 5
4 0.2 0.2
0 = 0.0 0.0 .-
: -0.2 -0.2 .-
5 - -0.4 -0.4
0.6 0.6
0.4 0.4 -I 90", Nb, Oo2, 90" I
0 20 40 60
0 200 400 600 laminates versus load stress. The stacking up
load stress in MPa of the unidirectional prepregs are noted II1 llS51.
Fig. 8: Strain of Nb particles in different
159.8
159.7"-
t% 159.6"- u F cd 159.5"- rn ,
load:70 MPa /+-ax load:lOOMPa
-A 'q(90°,-45") \
4 ,H~~F-~:~~zz~~:z
F (90",+45") A q .cl 'a=
45", CdO, -45",,45" *45", CdO, -9W',T45"
I . I * I . I 1 ' I . I ' I . 1 0 12 3 4 0 12 3 4
laminate coordinate in mm
Fig. 9: Shears on the end of laminates, the measurement parameters (9,~) and the stacking series of the plies are given [ 161.
Copyright(C)JCPDS-International Centre for Diffraction Data 2000, Advances in X-ray Analysis, Vol.42 547Copyright(C)JCPDS-International Centre for Diffraction Data 2000, Advances in X-ray Analysis, Vol.42 547ISSN 1097-0002
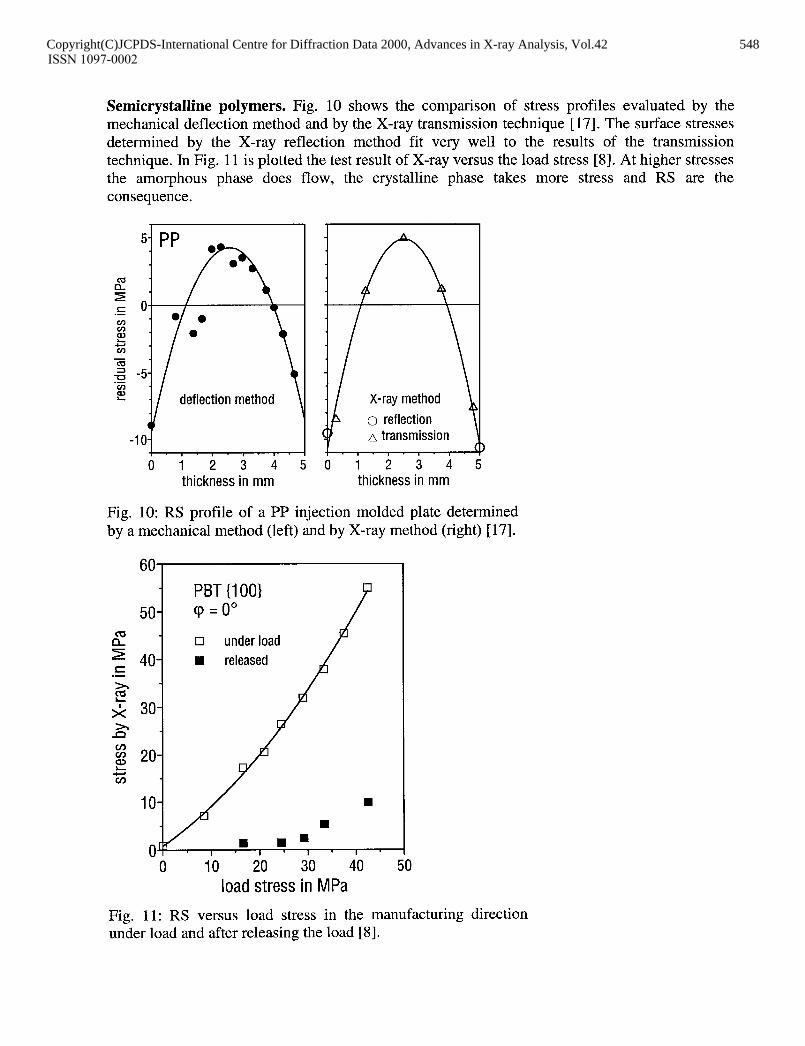
Semicrystalline polymers. Fig. 10 shows the comparison of stress profiles evaluated by the mechanical deflection method and by the X-ray transmission technique [ 171. The surface stresses determined by the X-ray reflection method fit very well to the results of the transmission technique. IJI Fig. 11 is plotted the test result of X-ray versus the load stress [8]. At higher stresses the amorphous phase does flow, the crystalline phase takes more stress and RS are the consequence.
deflection method
( A transmission
0 12 3 4 50 12 3 4 5 thickness in mm thickness in mm
Fig. 10: RS profile of a PP injection molded plate determined by a mechanical method (left) and by X-ray method (right) [ 171.
“V PBT {I 00)
50 cp = 0” a . r”
cl
I= 4o n .-
3 k 30-
2
g 20- L
0 0 IO IO 20 30 40 20 30 40 50 load stress in MPa load stress in MPa
Fig. 11: RS versus load stress in the manufacturing direction under load and after releasing the load [8].
Copyright(C)JCPDS-International Centre for Diffraction Data 2000, Advances in X-ray Analysis, Vol.42 548Copyright(C)JCPDS-International Centre for Diffraction Data 2000, Advances in X-ray Analysis, Vol.42 548ISSN 1097-0002

Results of measurement on the crystalline phase of semicrystalline PP and on the Al particles are plotted in Fig. 12 [5]. Again the stresses in the Al powder are twice of those in the matrix in the longitudinal and -0.3 in the transverse direction, respectively. The stresses in the crystalline phase correlate with the load stress. At higher applied stresses the Al particles start to flow.
When there are RS in the Al particles it is impossible to determine the macro RS by measurements of the strain in the particles. Fig. 13 [ 171 demonstrates the results on a PP matrix with Al or Cu particles. Measurements of the strain in the crystalline phase represent the macro RS. In the particles there are micro RS, too.
LJ
PP -P. .^ ^I -. zuj +lu m.Yo HI /
Cl PP under load, cp =O” 0 Al under load, cp =O” 0 Al released A Al under load, cp 30”
0 I - w
-5 I I I I I 0 5 IO 15 20 25
load stress in MPa
Fig. 12: RS versus load stress in a semicrystalline PP + 10 m.% (3.6 vol.%) Al injection molded plate [5].
aoo PPtlCl m.% Al
-7 -6
Okech. itI MPa
Fig. 13: Micro (top) and micro plus macro (bottom) RS versus macro RS in semi- crystalline PP + 10 m.% Al or Cu (3.6 or 1.1 vo1.%)[17].
Copyright(C)JCPDS-International Centre for Diffraction Data 2000, Advances in X-ray Analysis, Vol.42 549Copyright(C)JCPDS-International Centre for Diffraction Data 2000, Advances in X-ray Analysis, Vol.42 549ISSN 1097-0002

Reinforced semicrystalline polymers. Fig. 14 [18] and Fig. 15 [7] show evaluations of the triaxial RS state versus the load stress. The polymers and the fibers are specified. In the pure polymers the stress state is uniaxial. The reinforcements result in a triaxial stress state and the effect of the fibers can be clearly observed. The relative stress in the load direction is only a small part of the applied stress.
25j-iGG-jP8T(100)
A+ = 0 32 O33
-5 - A unfilled I I I I
0 5 10 15 20 25
251 I
-5 22 vol.% glass spheres
0 5 10 15 20 load stress in MPa
507 40
30
20
10
-10 21 vol.% glass fibers 1 ’ I ’ I a I -
0 10 20 30 40 t jl
Fig. 14: Triaxial study of stress determined by X-ray versus load stress of PBT without and with glass reinforcement [ 181.
PEK 3 __
1 cu !-s I= .- 5? >r, 2 E tj
00
80
60
40
20
-201 0 20 40 60 80 100
load stress in MPa 0 20 40 60 80 100 120 140 160
load stress in MPa
Fig. 15: Study of triaxial stresses determined by X-rays versus load stress of pure PEK and PEK reinforced by 20 m.% (15 vol.%) C fibers [7].
Copyright(C)JCPDS-International Centre for Diffraction Data 2000, Advances in X-ray Analysis, Vol.42 550Copyright(C)JCPDS-International Centre for Diffraction Data 2000, Advances in X-ray Analysis, Vol.42 550ISSN 1097-0002
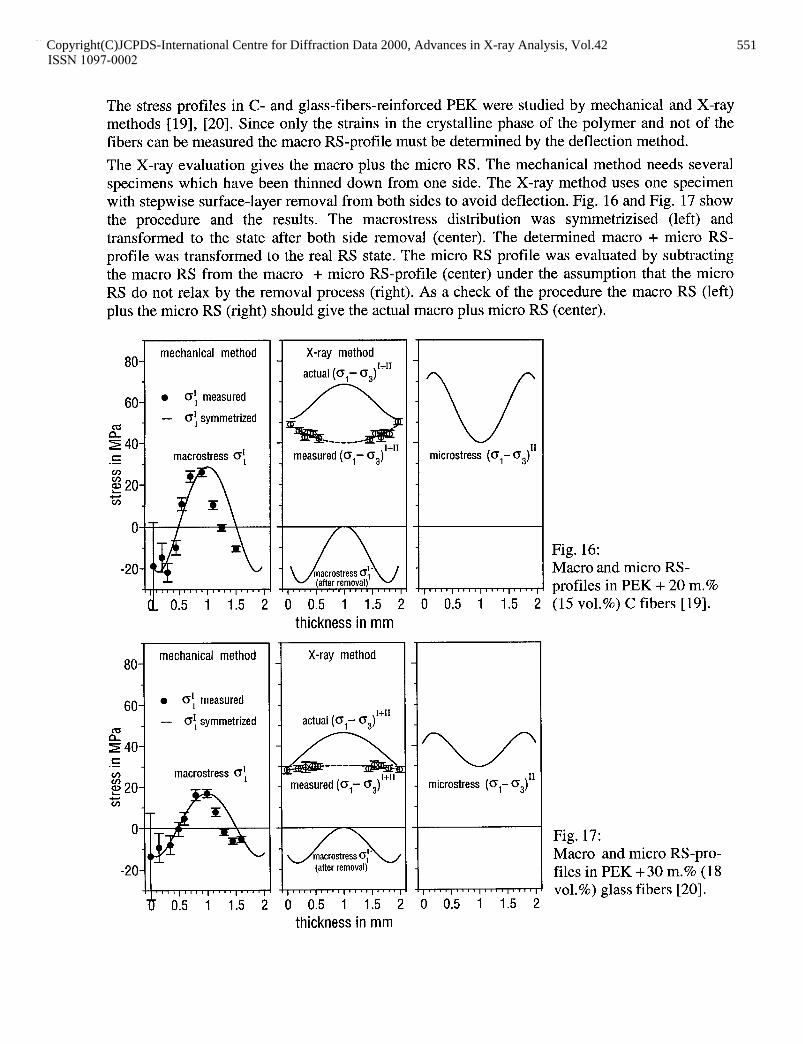
The stress profiles in C- and glass-fibers-reinforced PEK were studied by mechanical and X-ray methods [ 191, [20]. Since only the strains in the crystalline phase of the polymer and not of the fibers can be measured the macro RS-profile must be determined by the deflection method.
The X-ray evaluation gives the macro plus the micro RS. The mechanical method needs several specimens which have been thinned down from one side. The X-ray method uses one specimen with stepwise surface-layer removal from both sides to avoid deflection. Fig. 16 and Fig. 17 show the procedure and the results. The macrostress distribution was symmetrizised (left) and transformed to the state after both side removal (center). The determined macro + micro RS- profile was transformed to the real RS state. The micro RS profile was evaluated by subtracting the macro RS from the macro + micro RS-profile (center) under the assumption that the micro RS do not relax by the removal process (right). As a check of the procedure the macro RS (left) plus the micro RS (right) should give the actual macro plus micro RS (center).
80 mechanical method
60 ' 60- ' 0: measured 0: measured
cd cd
I
_ - 0: symmetrized - 0: symmetrized
%40- 240 c c .- _ .- macrostress 0: macrostress Of
X-ray method
actual (O,- OJ1+”
measured (O,- O,J’+”
~ macrostress Of’ (after removal)
v microstress (O,- 0,)”
Fig. 16: Macro and micro RS- profiles in PEK + 20 m.%
d 0.5 1 1.5 2 0 0.5 1 1.5 2 0 0.5 1 1.5 2 (15 vol.%) Cfibers [19]. thickness in mm
80 mechanical method
60 l 0: measured
- cd
0: symmetrized
240
0 0.5 1 1.5 2 thickness in mm
Fig. 17: Macro and micro RS-pro- files in PEK +30 m.% (18 vol.%) glass fibers [20].
Copyright(C)JCPDS-International Centre for Diffraction Data 2000, Advances in X-ray Analysis, Vol.42 551Copyright(C)JCPDS-International Centre for Diffraction Data 2000, Advances in X-ray Analysis, Vol.42 551ISSN 1097-0002

Special polymers are developed for use at elevated temperatures. Injection molded plates of pure and C reinforced PEK were tested for stability of their RS state [ 191. Each small specimen cut from the plate was tempered 2 hours at different elevated temperatures. The RS state was determined at room temperature on the surface of the small plate. The results are shown in Fig. 18. The pure PEK (left, bottom) shows nearly a stress free state, but the value of the stress free lattice spacing is drastically altered with the temperature (right). This D, versus temperature profile was used to evaluate the 033 component. Specimens of PEK + 20 m.% C fibers show a triaxial RS state as expected, the surface RS components (left, top), decrease slightly with the temperature. A pronounced decrease of the RS component in the thickness direction begins at 200°C. Such results help to understand the stability or the relaxation of the materials characterists at elevated temperatures.
0” PEK t 20 m.% C-fibers
%
60- X B 3L = 22 4 &A
ce
g 40- c .-
i3
>r, 2 20-
%I 42
0 100 200 300 400
annealing temperature in “C
E I PEK !z .- C 8
E 0"
0.4770-
2 .Ej Ei CA
.g 0.4760- s z G= % 2 'j 0.4750-
annealing temperature in “C
Fig. 18: RS state (bottom, left) and lattice spacing (right) of the pure PEK as well as the triaxial RS state of PEK + 20 m.% (18 vol.%) C fibers (left, bottom) versus annealing temperature. Each specimen of injection molded plates was 2 hours tempered at the specific temperature [ 191.
CONCLUSION AND SUMMARY Table 4 summarizes the results of RS studies on injection molded plates. Shown are the macro and micro RS on the surface. The signs minus and plus indicate observed compressive and tensile RS. RS marked with x have been calculated from the balance of stresses using the volume fraction. Of practical interest are the results on reinforced semicrystalline polymers. As indicated, the thermal RS can be calculated using Eshelby’s theory.
The next step should be research work with reinforced composites in which the stresses in both phases, the crystalline one and the fibers, can be determined. Such tests using high modulus C fibers with a strong { 002) peak are underway.
Copyright(C)JCPDS-International Centre for Diffraction Data 2000, Advances in X-ray Analysis, Vol.42 552Copyright(C)JCPDS-International Centre for Diffraction Data 2000, Advances in X-ray Analysis, Vol.42 552ISSN 1097-0002

Table 4: Macro and micro RS in different injection molded plates of polymeric materials and composites, qualitatively. - compression, + tension, x stress compensation using volume ratio, XX calculated
phase amorph. t filler semictyst. t filler semicryst. t reinf.
stress HI-PS Al powder PP Al powder PEK ’ fiber cu glass
4nech. - -
--a CJ - - - t
4 -
total zo +x - z() - t t -X
2 4Lep. so +x - =ot - t -X
z -X .II c- 0 - + t E
(3E-in&p. = 0 t ’ -
thermal t= -xx
process
ACKNOWLEDGEMENT
The Deutsche Forschungsgemeinschaft, Bonn, has thankfully sponsored the activities of the following members of the authors group: Dr. G. Vaessen, Dr. D. Ley, Dr. H. Behnken, Dipl.-Ing. D. Chauhan.
REFERENCES
[I] I. Sakurada, Y. Nukushina, T. Ito, J. Polymer Sci., 57 (1962) 65 l-660
[2] S. I. Kontorovich, K. A. Lavrova, V. V. Davidov, G. M. Plavnik, E. D. Shukin, Strukt. Svoistva Proverkh, Sloev. Polim., (1972) 143-147
[3] C. S. Barrett, P. Predecki, Polym. Eng. Sci., 16 (1976) 602-608 C. S. Barrett, Adv. X-Ray Anal., 20 (1977) 329-336
[4] V. Hauk, A. Troost, G. Vaessen, Materialprtif., 24 (1982) 328-329
[5] V. Hauk, A. Troost, D. Ley, “Nondestructive Characterization of Materials”; Eds. P. Holler, V. Hauk, G. Dobmann, C. 0. Ruud, R. E. Green, Springer Verlag Berlin, Heidelberg a.o., (1989) 207-214
[6] H. Behnken, D. Chauhan, V. Hauk, Mat.-wiss. u. Werkstofftech., 22 (1991) 321-331
[7] D. Chauhan, V. Hauk, VDI Berichte, 1131 (1995) 533-536
[8] D. Chauhan, V. Hauk, Mat. wiss. u. Werkstofftech., 23 (1992) 309-315
Copyright(C)JCPDS-International Centre for Diffraction Data 2000, Advances in X-ray Analysis, Vol.42 553Copyright(C)JCPDS-International Centre for Diffraction Data 2000, Advances in X-ray Analysis, Vol.42 553ISSN 1097-0002

[9] V. Hauk, “Structural and Residual Stress Analysis by Nondestructive Methods”, Elsevier, Amsterdam, Lausanne, New York, a.o., (1997)
[lo] H. Behnken, V. Hauk, Mat.-wiss. u. Werkstofftech., 24 (1993) 356-361
[ 1 l] M. Wortler, Doctorate thesis, Universitat Karlsruhe (TH), (1988)
M. Wortler, VDI-Verlag Dusseldorf, Fortschritt-Berichte VDI, Reihe 1, 169 (1989).
[ 121 H. Behnken, Doctorate thesis, RWTH Aachen, (1992)
[ 131 D. Ley, Doctorate thesis, RWTH Aachen, (1988)
[ 141 D. Chauhan, V. Hauk, Internal report, (1991)
[ 151 M. Wortler, E. Schnack, VDI-Berichte, 631(1987) 163-174
[16] B. Prinz, R. Meyer, E. Schnack, “Residual Stresses”; Eds. V. Hauk, H. P. Hougardy, E. Macherauch, H.-D. Tietz, DGM Informationsgesellschaft Verlag, Oberursel, (1993) 623-632 B. Prinz, E. Schnack, J. Comp. Mat., 31 (1997) 852-873
[17] H. Behnken, D. Chauhan, V. Hauk, Mat.-wiss. u. Werkstofftech., 22 (1991) 321-331 supplemented by the Cu results
[18] H. Hoffmann, H. Kausche, Ch. Walther, R. Androsch, Mat.-wiss. u. Werkstofftech., 22 (1991) 427-433 H. Hoffmann, Ch. Walther, “Residual Stresses”; Eds. V. Hauk, H. P. Hougardy, E. Macherauch, H.-D. Tietz, DGM Informationsgesellschaft Verlag, Oberursel, (1993) 613-623
[19] D. Chauhan, V. Hauk, “Proc. Fourth European Conference on Residual Stresses, ECRS 4”; Eds. S. Denis, J. L. Lebrun, B. Bourniquel, M. Barral, J.-F. Flavenot, Cluny (1996) 891-900
[20] D. Chauhan, V. Hauk, “The Fifth International Conference on Residual Stresses, ICRS-5”; Eds. T. Ericsson, M. Oden, A. Andersson, Linkiipings Universitet, (1997) 892-897
Copyright(C)JCPDS-International Centre for Diffraction Data 2000, Advances in X-ray Analysis, Vol.42 554Copyright(C)JCPDS-International Centre for Diffraction Data 2000, Advances in X-ray Analysis, Vol.42 554ISSN 1097-0002