Embed Size (px)
Citation preview
Structural and Functional Annotation of the Drosophila Melanogaster Genome A case study for the “kinase”annotationSunil Patel∗,Mikhail Velikanovψ.∗Accelrys, 334 Cambridge Science Park, Cambridge, CB4 OWN, UK.ψAccelrys Inc, 9685 Scranton road, San Diego, CA 92121.Accelrys Inc., San Diego, CA
IntroductionRecent advances in genome sequencing have created an immense
opportunity to understand, describe and model whole living organisms.
Several complete new genomes for various organisms including the
Human Genome have been completed. However, functional and
structural characterization of newly sequenced proteins is still
problematic. Using sequence based comparison methods alone (BLAST,
FASTA, PROSITE), it is estimated that the function of a protein can only
be identified about 50% of the time. Currently it is easier to determine
the function of a protein from its structure than sequence alone. Thus,
knowledge of a protein's structure plays a crucial role in the
identification and characterization of a its function.
Using comparative protein structure modeling to generate structural
data for all publicly available sequenced genomes have been
performed through the use of an automated pipeline referred as
GeneAtlasTM,1. This automated pipeline allows creation of database
DS AtlasStoreTM that includes 3D structure prediction as well as
functional annotation of the genomes. DS AtlasStore is a relational
schema based on Oracle. It is designed to store sequence data, family
information, output from GeneAtlas and other annotations. DS
AtlasStore provides a graphical interface that allows visualisation of
both sequence and structural annotation as is implemented on a
desktop.
Here we demonstrate the level of annotation and show some
unique examples of the Drosophila melanogaster genome vs the
GadFly1 genome annotation. This genome is one of the most studied
eukaryotic organisms and is a central model for the human genome.
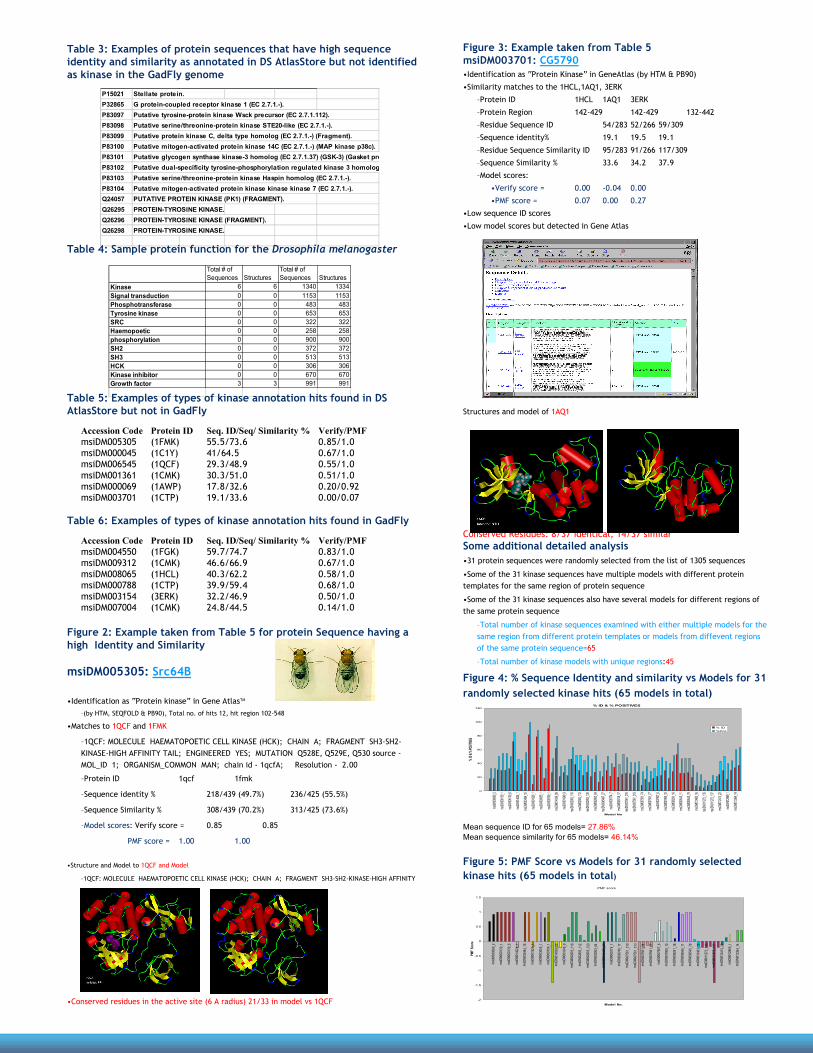
MethodsThe major components of GeneAtlas are shown in figure 1. It
Consists of identification of functional domains of protein sequences,
Homology searching using PSI-BLAST, fold recognition using SeqFold3
High throughput homology modelling using MODELER4, and function
annotation using 3D motif searches5. Based on the observation by J.
Park, et al6, each sequence similarity searching method gives a unique
set of hits which are different from other methods. Therefore, the
GeneAtlas pipeline uses as many methods as possible to extend the
homology recognition between query sequence and sequences with
known structure or function to maximize the function assignment to
the query sequence. Using this strategy in the pipeline increases the
confidence of the assignment when a query sequence has consensus
hits by different methods. The quality of models generated is assessed
against Profiles-3D7 (Verify) scores and Potential Mean Force
(PMF) scores.
Figure 1. The GeneAtlasTM Pipeline
3D Annotations
Sequence Data
DS AtlasStore™
Sequence Similarity Search
Motifs Analysis (LC etc)
HMMs
High-Throughput Modeling
SeqFold
Approximately 14,322 open reading frames (ORF) were
downloaded from FlyBase and were analyzed using the GeneAtlas
pipeline. Using text search as “kinase”, all the sequences that
contained a kinase annotation, were retrieved. All genes that
contained an Interpro domain associated with kinases annotation
were identified in the original GadFly Genome.
The results between the two genomes are compared. Additionally
detailed analysis of 31 protein sequences that were randomly
selected from the list of 1305 sequences were examined. These
results were categorised with PSI-BLAST scores versus PMF scores.
These results were then extrapolated to the total kinase
annotation in DS AltasStore to illustrate the level of annotation.
Results
Drosophila melanogaster14,322 ORFs downloaded from FlyBase
99% of genome is functionally
annotated in AtlasStore
8,442 (59%) of sequences have structural annotations
Annotations cover 646 SCOP superfamilies
3,665 sequences have annotated active sites
Additional 5,797 (40%) of sequences have sequence-based
annotations
Table 1: Using text Search; example “kinase”
Total number of sequences annotated as “Kinase” in FlyBase database=6
• Number of sequences with detected homology with known structures=6
• Total number of sequences annotated as “kinase” in DS AtlasStore=1340
• Number of sequences with detected homology with known structures=1334
• Detected homology with other sequences in NRDB=6
• Total number of unique HTM hits =333
• Total number of Seqfold hits=4
Data from the FlyBase GenomeAll genes that contained an Interpro domain associated with Kinases
were identified in the original GadFly genome. This represented a
total of 385 sequences. Detailed comparison and analysis for the
kinase annotation between the two genomes are presented in table
1to 8, and figures 2 to 5.
Table2: Comparison of kinase annotation
• 385: Number of kinases with the GadFly Genome
• 356 of 385 also annotated as kinases by GeneAtlas (92.4%)
• 20 of 385 annotated but not as a kinase (false negatives)
• 14 of 385 not processed by GeneAtlas no annotation available
– Could be processed separately (but have not done to date) (3.6%)
• 1305 additional sequences annotated as kinases (these did not include sequences that were annotate as phospotransferase other wise the total number of sequences is 1661 (356 + 1305 = 1661)
• Discrepancy of 5 sequences
• 5 of the sequences received from Gadfly data matched not one but 2 sequences in the set of Drosophila melanogaster genomic sequences that GeneAtlas processed.
• In other words, each of these 5 sequences appeared in our data split into 2 segments. As a result, these 5 sequences have double annotation in non-unique list.
Original SS New SS
Hit SearchTotal # of Sequences Structures
Total # of Sequences Structures
Kinase 6 6 1340 1334
Public Data Atlas Store
Total # of Sequences Structures
Total # of Sequences Structures
Kinase 6 6 1340 1334Signal transduction 0 0 1153 1153Phosphotransferase 0 0 483 483Tyrosine kinase 0 0 653 653SRC 0 0 322 322Haemopoetic 0 0 258 258phosphorylation 0 0 900 900SH2 0 0 372 372SH3 0 0 513 513HCK 0 0 306 306Kinase inhibitor 0 0 670 670Growth factor 3 3 991 991
P15021 Stellate protein.P32865 G protein-coupled receptor kinase 1 (EC 2.7.1.-).P83097 Putative tyrosine-protein kinase Wsck precursor (EC 2.7.1.112).P83098 Putative serine/threonine-protein kinase STE20-like (EC 2.7.1.-).P83099 Putative protein kinase C, delta type homolog (EC 2.7.1.-) (Fragment).P83100 Putative mitogen-activated protein kinase 14C (EC 2.7.1.-) (MAP kinase p38c).P83101 Putative glycogen synthase kinase-3 homolog (EC 2.7.1.37) (GSK-3) (Gasket proP83102 Putative dual-specificity tyrosine-phosphorylation regulated kinase 3 homologP83103 Putative serine/threonine-protein kinase Haspin homolog (EC 2.7.1.-).P83104 Putative mitogen-activated protein kinase kinase kinase 7 (EC 2.7.1.-).Q24057 PUTATIVE PROTEIN KINASE (PK1) (FRAGMENT).Q26295 PROTEIN-TYROSINE KINASE.Q26296 PROTEIN-TYROSINE KINASE (FRAGMENT).Q26298 PROTEIN-TYROSINE KINASE.
Table 3: Examples of protein sequences that have high sequence identity and similarity as annotated in DS AtlasStore but not identified as kinase in the GadFly genome
Table 4: Sample protein function for the Drosophila melanogaster
Table 5: Examples of types of kinase annotation hits found in DSAtlasStore but not in GadFly
Accession Code Protein ID Seq. ID/Seq/ Similarity % Verify/PMFmsiDM005305 (1FMK) 55.5/73.6 0.85/1.0msiDM000045 (1C1Y) 41/64.5 0.67/1.0msiDM006545 (1QCF) 29.3/48.9 0.55/1.0msiDM001361 (1CMK) 30.3/51.0 0.51/1.0msiDM000069 (1AWP) 17.8/32.6 0.20/0.92msiDM003701 (1CTP) 19.1/33.6 0.00/0.07
Table 6: Examples of types of kinase annotation hits found in GadFly
Accession Code Protein ID Seq. ID/Seq/ Similarity % Verify/PMFmsiDM004550 (1FGK) 59.7/74.7 0.83/1.0msiDM009312 (1CMK) 46.6/66.9 0.67/1.0msiDM008065 (1HCL) 40.3/62.2 0.58/1.0msiDM000788 (1CTP) 39.9/59.4 0.68/1.0msiDM003154 (3ERK) 32.2/46.9 0.50/1.0msiDM007004 (1CMK) 24.8/44.5 0.14/1.0
Figure 2: Example taken from Table 5 for protein Sequence having a high Identity and Similarity
msiDM005305: Src64B
•Identification as “Protein kinase” in Gene AtlasTM
–(by HTM, SEQFOLD & PB90), Total no. of hits 12, hit region 102-548
•Matches to 1QCF and 1FMK
–1QCF: MOLECULE HAEMATOPOETIC CELL KINASE (HCK); CHAIN A; FRAGMENT SH3-SH2-KINASE-HIGH AFFINITY TAIL; ENGINEERED YES; MUTATION Q528E, Q529E, Q530 source -MOL_ID 1; ORGANISM_COMMON MAN; chain id - 1qcfA; Resolution - 2.00
–Protein ID 1qcf 1fmk
–Sequence identity % 218/439 (49.7%) 236/425 (55.5%)
–Sequence Similarity % 308/439 (70.2%) 313/425 (73.6%)
–Model scores: Verify score = 0.85 0.85
PMF score = 1.00 1.00
•Structure and Model to 1QCF and Model
–1QCF: MOLECULE HAEMATOPOETIC CELL KINASE (HCK); CHAIN A; FRAGMENT SH3-SH2-KINASE-HIGH AFFINITY
•Conserved residues in the active site (6 A radius) 21/33 in model vs 1QCF
Figure 3: Example taken from Table 5msiDM003701: CG5790•Identification as “Protein Kinase” in GeneAtlas (by HTM & PB90)
•Similarity matches to the 1HCL,1AQ1, 3ERK
–Protein ID 1HCL 1AQ1 3ERK
–Protein Region 142-429 142-429 132-442
–Residue Sequence ID 54/283 52/266 59/309
–Sequence identity% 19.1 19.5 19.1
–Residue Sequence Similarity ID 95/283 91/266 117/309
–Sequence Similarity % 33.6 34.2 37.9
–Model scores:
•Verify score = 0.00 -0.04 0.00
•PMF score = 0.07 0.00 0.27
•Low sequence ID scores
•Low model scores but detected in Gene Atlas
Structures and model of 1AQ1
Conserved Residues: 8/37 identical, 14/37 similarSome additional detailed analysis•31 protein sequences were randomly selected from the list of 1305 sequences
•Some of the 31 kinase sequences have multiple models with different protein templates for the same region of protein sequence
•Some of the 31 kinase sequences also have several models for different regions of the same protein sequence
–Total number of kinase sequences examined with either multiple models for the same region from different protein templates or models from diffevent regions of the same protein sequence=65
–Total number of kinase models with unique regions:45
Figure 4: % Sequence Identity and similarity vs Models for 31 randomly selected kinase hits (65 models in total)
Mean sequence ID for 65 models= 27.86%Mean sequence similarity for 65 models= 46.14%
Figure 5: PMF Score vs Models for 31 randomly selected kinase hits (65 models in total)
% ID & % POSITIVES
0
20
40
60
80
100
120
msidM
000069
_2
msiDM
000130
_1
msiDM
000130
_6
msiDM
014024
_1
msiDM
003494
_15
msiDM
001926
_1
msiDM
003055
_1
msiDM
000709
_1
msiDM
014039
_89
msiDM
001049
_9
msiDM
002903
_116
msiDM
02903_
112
msiDM
002903
_120
msiDM
002903
_64
msiDM
004549
7_27
msiDM
005774
_7
msiDM
006748
_17
msiDM
007561
_310
msiDM
007561
_313
msiDM
007561
_74
msiDM
007561
_77
msiDM
007907
_6
msiDM
007909
_10
msiDM
008291
_18
msiDM
009545
_11
msiDM
009545
_79
msiDM
010403
_16
msiDM
011272
_135
msiDM
011272
_137
msiDM
012413
_22
msiDM
012969
_1
msiDM
013364
_14
Model No
% ID &
% PO
SITIVE
S
% ID%Pos
PMF score
-2
-1.5
-1
-0.5
0
0.5
1
1.5
msidM
0 000
69_2
m siD
M 000
130_
1
m siD
M 000
130_
6
m siD
M014
024_
1
m si D
M 00 3
4 94 _
15
m si D
M 00 1
9 26 _
1
m si D
M 00 3
0 55 _
1
msiD
M000
709 _
1
msiD
M014
039 _
8 9
msiD
M 001
0 49 _
9
m siD
M 002
903_
116
m siD
M029
03_1
12
m siD
M002
903_
120
m si D
M 00 2
9 03 _
64
m si D
M 00 4
5 49 7
_27
m si D
M 00 5
7 74 _
7
msiD
M006
748 _
1 7
msiD
M 007
5 61 _
3 10
msiD
M 007
5 61 _
3 13
m siD
M007
561_
74
m siD
M007
561_
77
m siD
M007
907_
6
m si D
M 00 7
9 09 _
10
m si D
M 00 8
2 91 _
18
m siD
M 00 9
5 45_
11
msiD
M 009
5 45 _
7 9
msiD
M 010
4 03 _
1 6
msiD
M 011
2 72 _
1 35
m siD
M011
272_
137
m siD
M012
413_
22
m siD
M012
969_
1
m si D
M 01 3
3 64 _
14
Model No.
PMF S
core
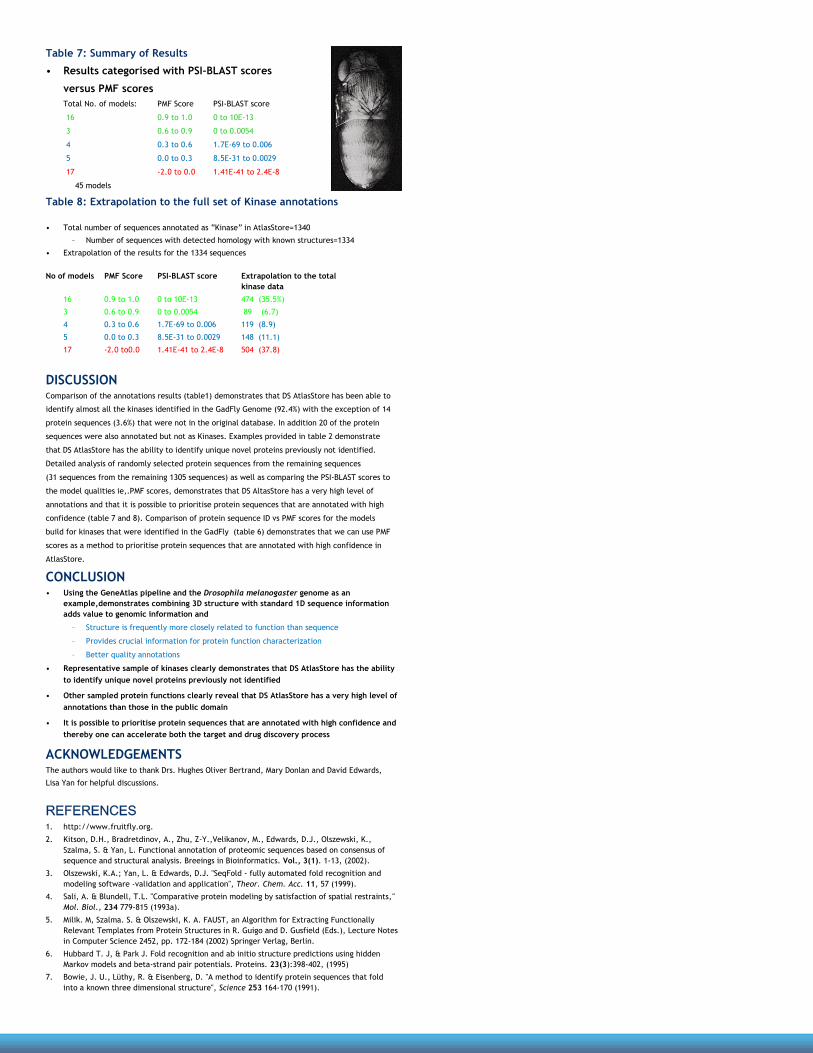
Table 7: Summary of Results
• Results categorised with PSI-BLAST scores
versus PMF scoresTotal No. of models: PMF Score PSI-BLAST score
16 0.9 to 1.0 0 to 10E-13
3 0.6 to 0.9 0 to 0.0054
4 0.3 to 0.6 1.7E-69 to 0.006
5 0.0 to 0.3 8.5E-31 to 0.0029
17 -2.0 to 0.0 1.41E-41 to 2.4E-8
45 models
Table 8: Extrapolation to the full set of Kinase annotations
• Total number of sequences annotated as “Kinase” in AtlasStore=1340
– Number of sequences with detected homology with known structures=1334
• Extrapolation of the results for the 1334 sequences
No of models PMF Score PSI-BLAST score Extrapolation to the totalkinase data
16 0.9 to 1.0 0 to 10E-13 474 (35.5%)
3 0.6 to 0.9 0 to 0.0054 89 (6.7)
4 0.3 to 0.6 1.7E-69 to 0.006 119 (8.9)
5 0.0 to 0.3 8.5E-31 to 0.0029 148 (11.1)
17 -2.0 to0.0 1.41E-41 to 2.4E-8 504 (37.8)
DISCUSSIONComparison of the annotations results (table1) demonstrates that DS AtlasStore has been able to
identify almost all the kinases identified in the GadFly Genome (92.4%) with the exception of 14
protein sequences (3.6%) that were not in the original database. In addition 20 of the protein
sequences were also annotated but not as Kinases. Examples provided in table 2 demonstrate
that DS AtlasStore has the ability to identify unique novel proteins previously not identified.
Detailed analysis of randomly selected protein sequences from the remaining sequences
(31 sequences from the remaining 1305 sequences) as well as comparing the PSI-BLAST scores to
the model qualities ie,.PMF scores, demonstrates that DS AltasStore has a very high level of
annotations and that it is possible to prioritise protein sequences that are annotated with high
confidence (table 7 and 8). Comparison of protein sequence ID vs PMF scores for the models
build for kinases that were identified in the GadFly (table 6) demonstrates that we can use PMF
scores as a method to prioritise protein sequences that are annotated with high confidence in
AtlasStore.
CONCLUSION• Using the GeneAtlas pipeline and the Drosophila melanogaster genome as an
example,demonstrates combining 3D structure with standard 1D sequence information adds value to genomic information and
– Structure is frequently more closely related to function than sequence
– Provides crucial information for protein function characterization
– Better quality annotations
• Representative sample of kinases clearly demonstrates that DS AtlasStore has the ability to identify unique novel proteins previously not identified
• Other sampled protein functions clearly reveal that DS AtlasStore has a very high level of annotations than those in the public domain
• It is possible to prioritise protein sequences that are annotated with high confidence and thereby one can accelerate both the target and drug discovery process
ACKNOWLEDGEMENTSThe authors would like to thank Drs. Hughes Oliver Bertrand, Mary Donlan and David Edwards,
Lisa Yan for helpful discussions.
REFERENCES1. http://www.fruitfly.org.
2. Kitson, D.H., Bradretdinov, A., Zhu, Z-Y.,Velikanov, M., Edwards, D.J., Olszewski, K.,Szalma, S. & Yan, L. Functional annotation of proteomic sequences based on consensus of sequence and structural analysis. Breeings in Bioinformatics. Vol., 3(1). 1-13, (2002).
3. Olszewski, K.A.; Yan, L. & Edwards, D.J. "SeqFold - fully automated fold recognition and modeling software -validation and application", Theor. Chem. Acc. 11, 57 (1999).
4. Sali, A. & Blundell, T.L. "Comparative protein modeling by satisfaction of spatial restraints," Mol. Biol., 234 779-815 (1993a).
5. Milik. M, Szalma. S. & Olszewski, K. A. FAUST, an Algorithm for Extracting Functionally Relevant Templates from Protein Structures in R. Guigo and D. Gusfield (Eds.), Lecture Notes in Computer Science 2452, pp. 172-184 (2002) Springer Verlag, Berlin.
6. Hubbard T. J, & Park J. Fold recognition and ab initio structure predictions using hidden Markov models and beta-strand pair potentials. Proteins. 23(3):398-402, (1995)
7. Bowie, J. U., Lüthy, R. & Eisenberg, D. "A method to identify protein sequences that fold into a known three dimensional structure", Science 253 164-170 (1991).