Embed Size (px)
Citation preview
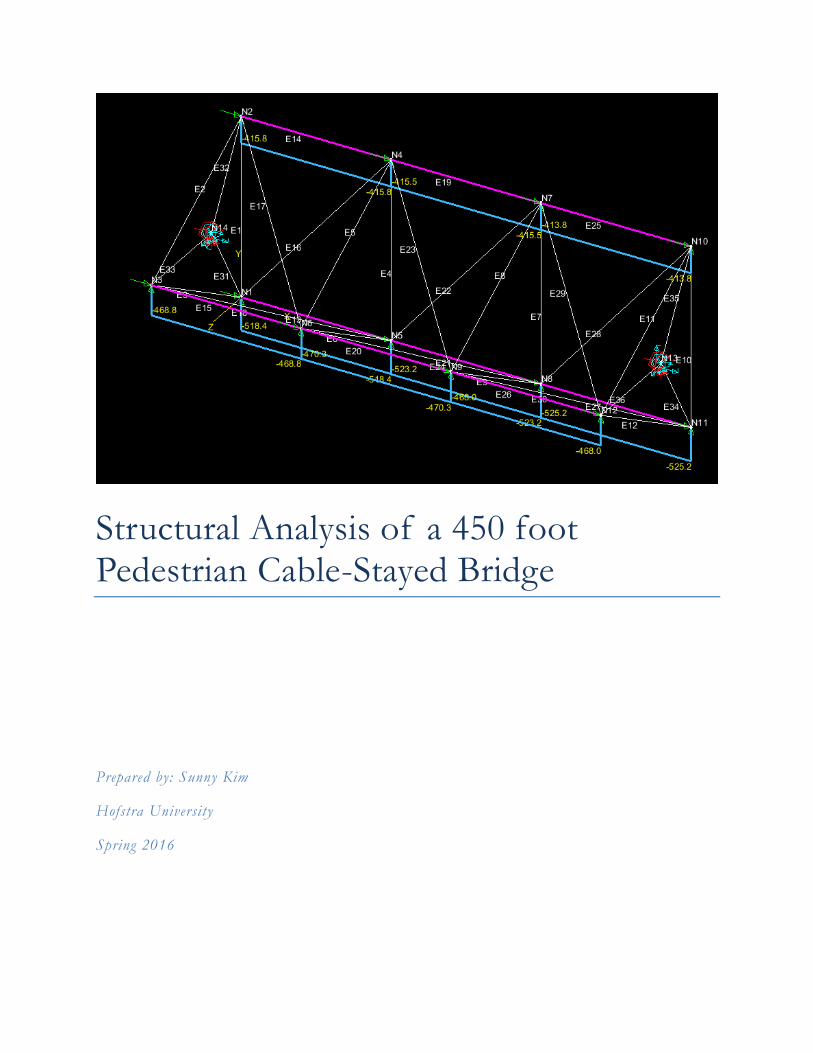
Structural Analysis of a 450 foot Pedestrian Cable-Stayed Bridge
Prepared by: Sunny Kim
Hofstra University
Spring 2016
2
Table of Contents Abstract ......................................................................................................................................................... 3
General Detail ................................................................................................................................................ 4
Design Criteria ............................................................................................................................................... 5
Load Path ...................................................................................................................................................... 6
Structural Members ........................................................................................................................................ 7
Section Properties .......................................................................................................................................... 9
Modelling Cable Pre-Stress ........................................................................................................................... 13
Deflections ................................................................................................................................................... 15
Global Model Summary ............................................................................................................................... 15
Elastic Buckling Analysis .............................................................................................................................. 16
Local Stresses ............................................................................................................................................... 19
Demand to Capacity Ratios .......................................................................................................................... 20
Conclusion ................................................................................................................................................... 22

3
Abstract
This report focuses on a structural analysis and design for DMK Bridge, a proposed 450
foot clear-span pedestrian bridge across the Harlem River which connects Randall’s Island to the
East Harlem section of Manhattan, in New York City. The proposal is intended to allow easier
access to Randall’s Island as a part of New York City Sustainability initiative for parks and open
space.
DMK Bridge consists of a 450-foot long steel-framed deck supported by a system of front
and back cable stays, which are connected to a single steel pylon. This pylon is supported on
concrete columns and struts below the deck level. The foundations consist of two concrete pile caps
with piles that transfer the vertical compression loads from the pylon to the bedrock, as well as two
concrete blocks that act as dead-weights resisting the vertical tension loads from the back cable
stays.

4
General Detail
This pedestrian bridge proposal has a 450 foot clear-span across the Harlem River that
connects Randall’s Island to East Harlem in Manhattan, which is shown in Figure 1. The bridge
itself has a clearance of 30 feet to the water during high tide. Due to the difficulty and cost of
building onto Manhattan, the bulk of construction could only be on Randall’s Island.
Figure 1: Location of DMK Bridge
This scope of this report will consist of analysis of various major components of the
proposed bridge. These include the cables, deck, pylon, transverse strut, and column. The analysis
performed includes stiffness matrix analysis, elastic buckling analysis, as well as local stress checks as
per LRFD design. The model analysis was performed with MASTAN2 (v3.5). This report will not
include details of the physical model, geotechnical evaluation, or cost estimation of design
alternatives. Information on these topics can be found in the senior design project I worked
alongside with Anthony Danza and Anderson Martin.

5
Design Criteria
For our analysis, we focused on dead loads as well as live loads onto the structure. Dead
loads included the self-weight of the structure along with extra amenities such as railings and light
fixtures. For live loads, we assumed 100 pounds per square foot loading as well as 4 kip wheel loads
on a 20 square inch area. Both cases are per ASCE 7-10. For structural steel, the design was done
under AISC 360-10 LRFD. Concrete was designed under ACI 318-11.
Since the loading considered were dead and live loads, the load case considered under LRFD
design was load case 2 as shown below in formula 1. The live load applied onto deck spans as
needed to generate the maximum amount of internal forces and moments on key structural
members.
𝐿𝑜𝑎𝑑 𝐶𝑎𝑠𝑒 2 = 1.2 ∗ 𝐷𝐿 + 1.6 ∗ 𝐿𝐿
Formula 1: Load Case 2 for LRFD Design
The design section loads are shown in Table 1 below. The steel deck dead loads include the
self-weight, concrete deck, railing fixtures, as well as lighting fixtures. The steel lattice pylon, steel
transverse strut, and concrete columns dead load come from the self-weight of the structure. The
live load is only applied onto the steel deck and represents 100 pounds per square foot. Figure 2
provides visualization of DMK Bridge and the location for each major component being examined.
Structure Dead Load (k/ft) Live Load (k/ft)
Steel Deck 1.49 1.2
Steel Lattice Pylon 0.253 N/A
Steel Transverse Strut 0.593 N/A
Concrete Columns 3.600 N/A
Table 1: DL and LL applied onto model
6
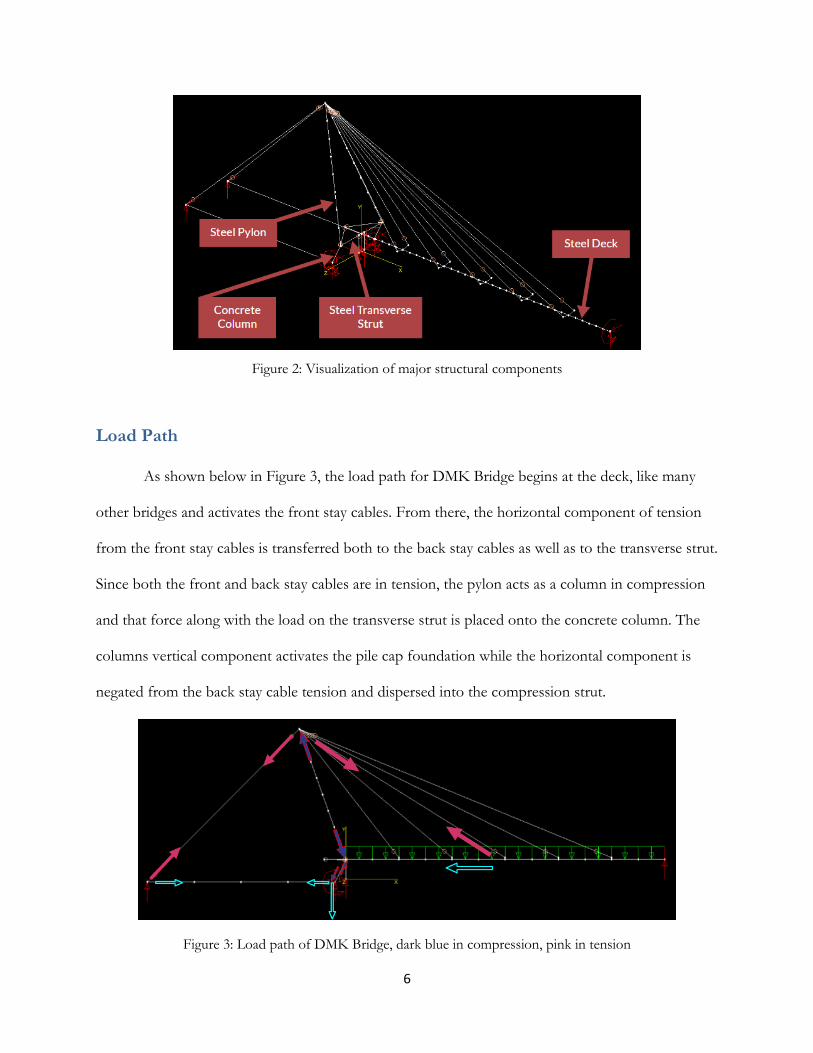
Figure 2: Visualization of major structural components
Load Path
As shown below in Figure 3, the load path for DMK Bridge begins at the deck, like many
other bridges and activates the front stay cables. From there, the horizontal component of tension
from the front stay cables is transferred both to the back stay cables as well as to the transverse strut.
Since both the front and back stay cables are in tension, the pylon acts as a column in compression
and that force along with the load on the transverse strut is placed onto the concrete column. The
columns vertical component activates the pile cap foundation while the horizontal component is
negated from the back stay cable tension and dispersed into the compression strut.
Figure 3: Load path of DMK Bridge, dark blue in compression, pink in tension

7
Structural Members
After obtaining the dead and live loads used for design, we proposed various sections for the
steel deck, steel lattice pylon, steel transverse strut, concrete column, and concrete compression
strut. The details for the foundation are also present in this report, however further information on
these results are located in the senior design report. The proposed structural members represent the
final designs for each section
The steel deck consists of three HSS 10x10x1/2 top chords and two HSS 12x12x1/2
bottom chords. All other connecting members are HSS 6x6x1/4 chords. The concrete topping is a
CMC Joist & Deck inverted B-Lok steel deck with a slab depth of 4.5 in. (Figure 4)
Figure 4: Steel lattice deck cross section details
The steel pylon has a triangular cross section, which each corner section having HSS
10x0.625 tubes and each diagonal member having HSS 4x.0118 tubes. (Figure 5)
Figure 5: Steel lattice pylon cross section details
12x12x1/2
10x10x1/2

8
The steel transverse strut has HSS 10x10x1/2 main chords and HSS 6x6x1/4 diagonal
members. (Figure 6)
Figure 6: Transverse strut cross section details
The concrete column’s cross section represents a cut relative to its angled local plane and not
of the horizontal plane. The section is similar to that of a W beam, with a flange width of 72 inches,
flange depth of 18 inches, web width of 24 inches, and full depth of 72 inches. The concrete
compression strut simply has a square cross section of 36x36 in. Both concrete sections have a 2%
reinforcement ratio. (Figure 7-8)
Figure 7: Concrete column cross section details Figure 8: Concrete compression strut cross section details

9
The pile cap design consists of 20 piles on each side of the concrete column with a concrete
foundation of 26Lx20.W5x4D ft. Information on where the pile caps are located from the center of
the foundation are shown below in Figure 9.
Figure 9: Pile cap and foundation design
Section Properties
After finalizing the proposed sections for our design, local models were created to represent
the members of the global model. For this analysis, we generated a 75 foot segment of the steel
deck, a 24 foot segment of the steel lattice pylon, and the full 39 foot section for the steel transverse
strut. These local models were then utilized to determine the section properties used for the global
model. The elastic beam-column elements in the global model require the area, moment of inertia,
polar moment of inertia, and shear area. These values were calculated utilizing the stiffness matrix
properties of each local model. A section of the matrix is shown in Figure 10. When the model is
displaced or rotated in the x, y, or z axis, the node will have reactionary loads from the said
displacement. From there, the section properties are back calculated in relation to the stiffness
matrix. Since the concrete sections could not be represented in MASTAN2, gross calculations were

10
utilized for their respective global model elements. Table 2 shows all of the section properties
utilized in MASTAN2 for the global model.
[ 𝐹𝑥
𝐹𝑦
𝐹𝑧
𝑀𝑥
𝑀𝑦
𝑀𝑧]
= 𝐸
[ 𝐴 𝐿⁄ 0 0 0 0 0
0 12𝐼𝑧 𝐿3⁄ 0 0 0 6𝐼𝑧 𝐿2⁄
0 0 12𝐼𝑦 𝐿3⁄ 0 −6𝐼𝑦 𝐿2⁄ 0
0 0 0 𝐽 2(1 + 𝜈)𝐿⁄ 0 0
0 0 −6𝐼𝑦 𝐿2⁄ 0 4𝐼𝑦 𝐿⁄ 0
0 6𝐼𝑧 𝐿2⁄ 0 0 0 4𝐼𝑧 𝐿⁄ ]
[ 𝑢
𝑣
𝑤
𝜃𝑥
𝜃𝑦
𝜃𝑧]
Figure 10: Element stiffness matrix
Section Deck Pylon Transverse Strut Column Compression Strut
A (in2) 99.37 52.32 71.78 3456 1296
Ix (in4) 241230.65 124597.18 92204.93 2052864 139968
Iy (in4) 127102.12 124597.18 92204.93 1161216 139968
J (in4) 48365.60 9891.91 10516.17 332061 236546
Asx (in2) 15.62 3.469 9.81 Inf Inf
Asy (in2) 19.82 3.469 9.81 Inf Inf
Table 2: Section Properties
11
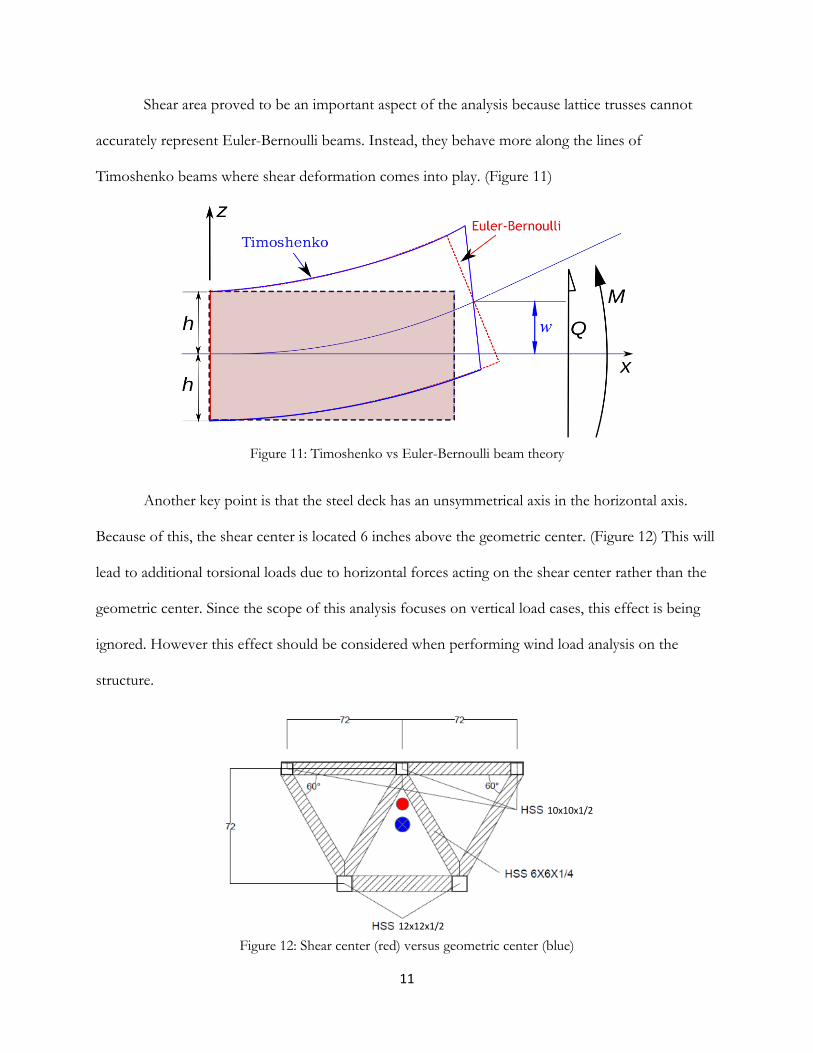
Shear area proved to be an important aspect of the analysis because lattice trusses cannot
accurately represent Euler-Bernoulli beams. Instead, they behave more along the lines of
Timoshenko beams where shear deformation comes into play. (Figure 11)
Figure 11: Timoshenko vs Euler-Bernoulli beam theory
Another key point is that the steel deck has an unsymmetrical axis in the horizontal axis.
Because of this, the shear center is located 6 inches above the geometric center. (Figure 12) This will
lead to additional torsional loads due to horizontal forces acting on the shear center rather than the
geometric center. Since the scope of this analysis focuses on vertical load cases, this effect is being
ignored. However this effect should be considered when performing wind load analysis on the
structure.
Figure 12: Shear center (red) versus geometric center (blue)
10x10x1/2
12x12x1/2

12
Warping, also known as saint venant torsion is another important issue that can significantly
change the polar moment of inertia. This effect occurs because the design is not a perfectly circular
cross section. Because of this, chord members will want to expand or shrink as necessary in order to
resist the torsion acting on the structure. Since the global model cannot represent warping effects,
the local models were checked under both constrained rotation and unconstrained rotation to
consider the effects of warping. (Figure 13) The results show that the steel deck polar moment of
inertia differs by less than 13% as shown in Table 3. Both the steel lattice pylon and the steel
transverse strut polar moment of inertia properties were not closely analyzed because neither is
subject to large torsional loads.
Figure 13: Constrained warping (left) versus unconstrained warping (right) for deck
J - Constrained Warping (in4) 48365.37
J - Free Warping (in4) 42544.10
% difference 12.04%
Table 3: J differences between constrained warping and free warping
13
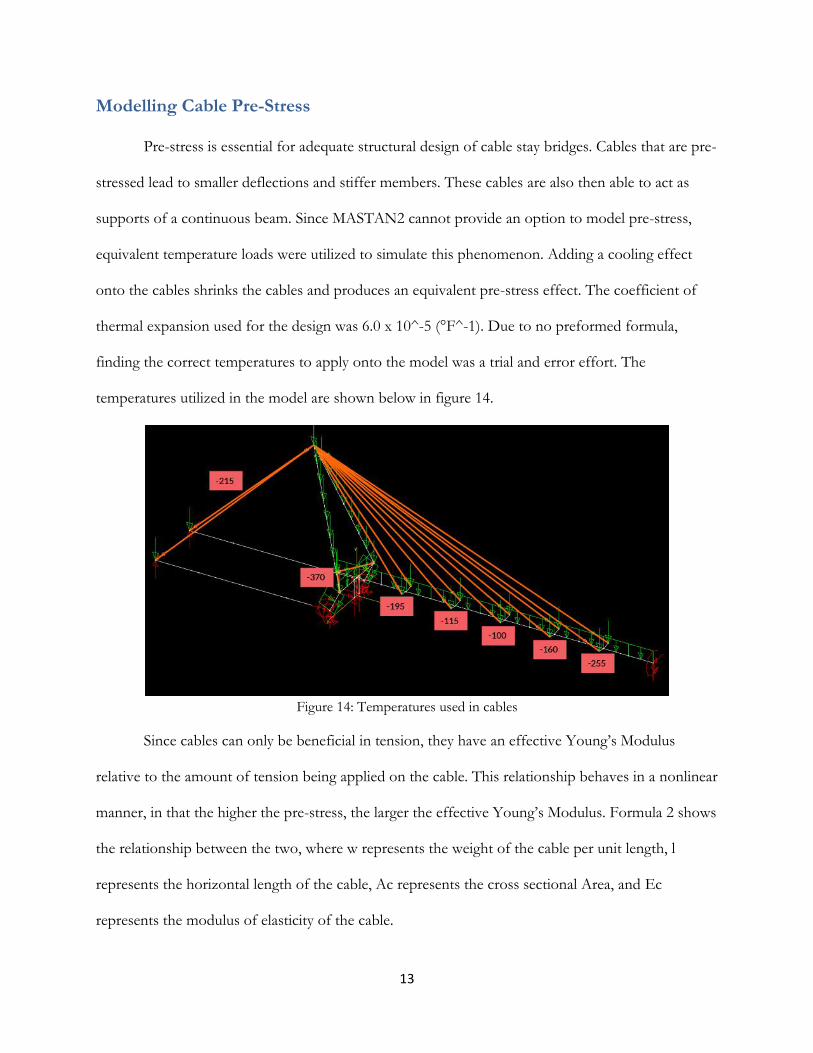
Modelling Cable Pre-Stress
Pre-stress is essential for adequate structural design of cable stay bridges. Cables that are pre-
stressed lead to smaller deflections and stiffer members. These cables are also then able to act as
supports of a continuous beam. Since MASTAN2 cannot provide an option to model pre-stress,
equivalent temperature loads were utilized to simulate this phenomenon. Adding a cooling effect
onto the cables shrinks the cables and produces an equivalent pre-stress effect. The coefficient of
thermal expansion used for the design was 6.0 x 10^-5 (°F^-1). Due to no preformed formula,
finding the correct temperatures to apply onto the model was a trial and error effort. The
temperatures utilized in the model are shown below in figure 14.
Figure 14: Temperatures used in cables
Since cables can only be beneficial in tension, they have an effective Young’s Modulus
relative to the amount of tension being applied on the cable. This relationship behaves in a nonlinear
manner, in that the higher the pre-stress, the larger the effective Young’s Modulus. Formula 2 shows
the relationship between the two, where w represents the weight of the cable per unit length, l
represents the horizontal length of the cable, Ac represents the cross sectional Area, and Ec
represents the modulus of elasticity of the cable.
14
𝐸𝑒𝑞𝑢 = 𝐸𝑐
1 +(𝑤𝑙)2𝐴𝑐𝐸𝑐
12𝑇3
⁄
Formula 2: Ernst formula, used to solve for effective Young’s Modulus
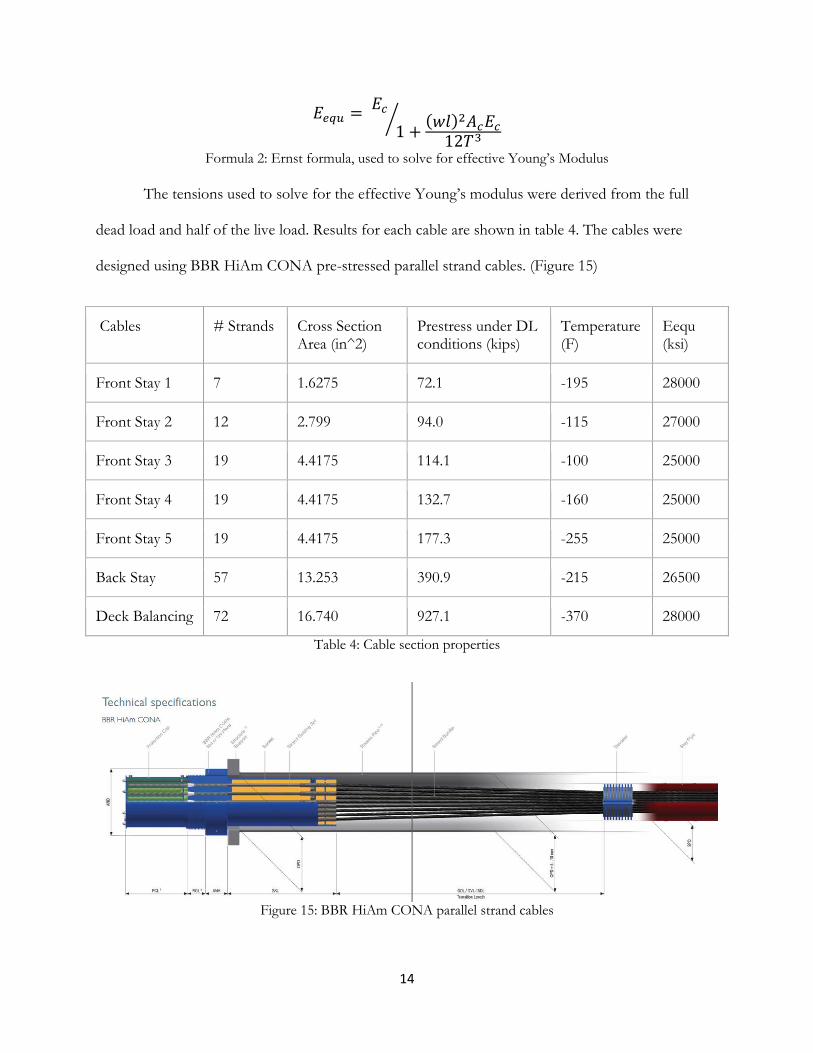
The tensions used to solve for the effective Young’s modulus were derived from the full
dead load and half of the live load. Results for each cable are shown in table 4. The cables were
designed using BBR HiAm CONA pre-stressed parallel strand cables. (Figure 15)
Cables # Strands Cross Section Area (in^2)
Prestress under DL conditions (kips)
Temperature (F)
Eequ (ksi)
Front Stay 1 7 1.6275 72.1 -195 28000
Front Stay 2 12 2.799 94.0 -115 27000
Front Stay 3 19 4.4175 114.1 -100 25000
Front Stay 4 19 4.4175 132.7 -160 25000
Front Stay 5 19 4.4175 177.3 -255 25000
Back Stay 57 13.253 390.9 -215 26500
Deck Balancing 72 16.740 927.1 -370 28000
Table 4: Cable section properties
Figure 15: BBR HiAm CONA parallel strand cables
15
Deflections
Deflections were calculated under live load conditions. There is no formal maximum
deflection limit that a pedestrian bridge must be under. Due to this, we referred to Section 15.17 in
the Steel Designer’s Handbook authored by Walter Podolony. In this handbook, the maximum
deflection limit was stated to be the span over 300 feet. Therefore, the pedestrian bridge’s deflection
limit is 1.5 feet or 18 inches. When running our analysis, the live load worst case deck deflection was
found to be 17.53 inches, making it adequate for design.
Global Model Summary
In summary, all elements in the global model are represented as a one dimensional elastic
beam-column. The steel lattice members are represented by equivalent section properties calculated
from the analysis of local models. The concrete members are represented by the gross section
properties. The cable members also utilize gross section properties and have pin connections on
each end of the model. The pre-stress within the cable were represented with equivalent temperature
effects. There were two analysis files, one of which included dead loads and pre-stress, the other
includes live loads. Analysis results were combined with appropriate load factors for LRFD design
and without load factors for service design. Finally, deflections under live load conditions are okay
for a span over 300 feet criteria.

16
Elastic Buckling Analysis
In order to find the global compression stress limit for each structure, we performed elastic
buckling analysis on DMK Bridge in order to evaluate the effective length factor. This factor was
then utilized to find the effective slenderness of various structural members in the global model
under global buckling conditions. These slenderness values were compared to the critical
compression stress curve in AISC table 4-22 to determine the design compressive stress.
For the deck, the analysis deviates from a traditional column due to loads that are applied
along the length as well as cable bracing that are not fully effective in the vertical direction. Because
of this, it was important to determine whether or not the deck will buckle vertically or horizontally.
In order to find this, we found the elastic critical load for the dead load plus pre-stress case and the
live load case. Both cases reveal that the deck will buckle horizontally before it will vertically. This is
important because horizontal buckling is in the direction of the strong moment of inertia. Further
information between the two modes of failure can be found in table 5 and figure 16. Subsequent
buckling analysis for the deck only considers horizontal buckling because of this.
DL Mode Applied Load Ratio
LL Mode Applied Load Ratio
Horizontal Buckling 17 14.63 17 35.91
Vertical Buckling 22 21.46 18 39.38
Table 5: Mode failures for DL and LL
17
Figure 16: DL horizontal buckling (left) vs DL vertical buckling (right)
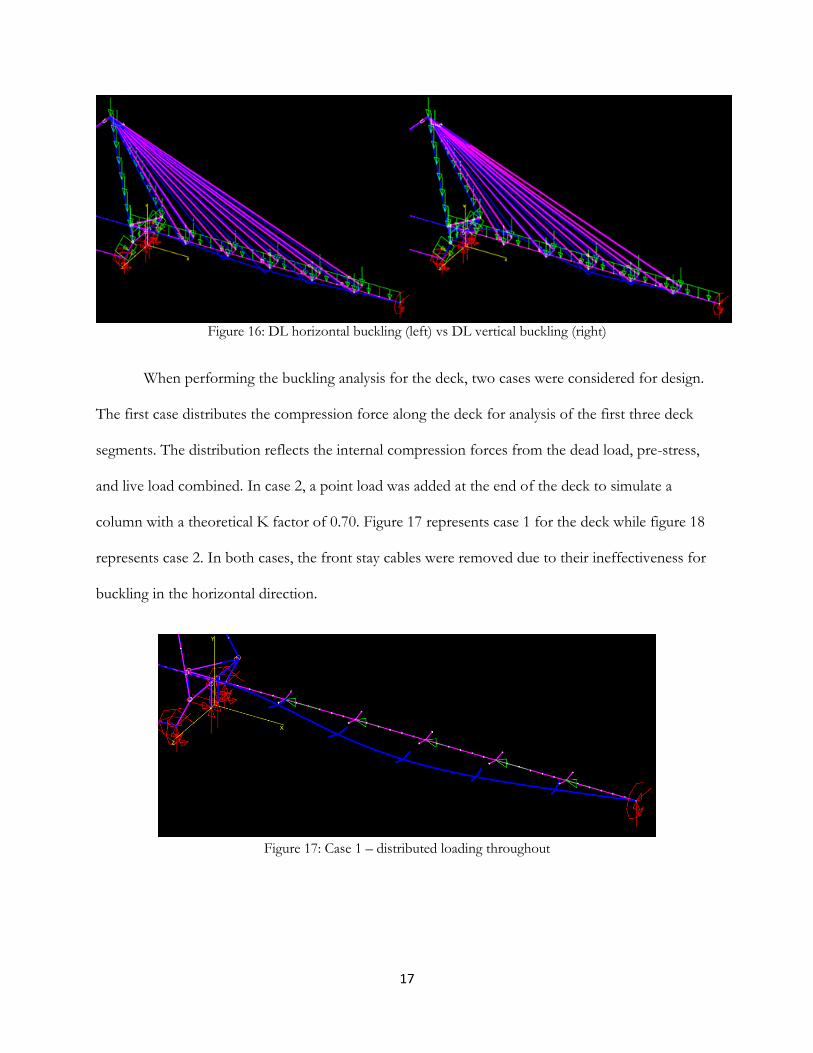
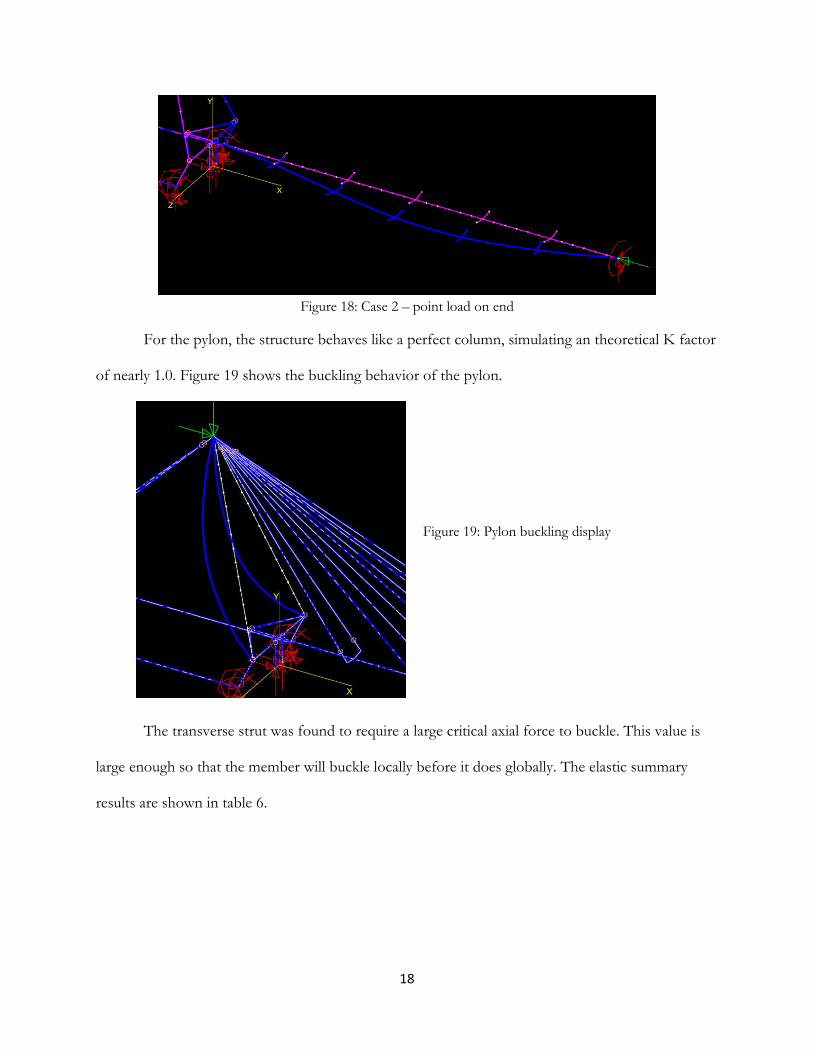
When performing the buckling analysis for the deck, two cases were considered for design.
The first case distributes the compression force along the deck for analysis of the first three deck
segments. The distribution reflects the internal compression forces from the dead load, pre-stress,
and live load combined. In case 2, a point load was added at the end of the deck to simulate a
column with a theoretical K factor of 0.70. Figure 17 represents case 1 for the deck while figure 18
represents case 2. In both cases, the front stay cables were removed due to their ineffectiveness for
buckling in the horizontal direction.
Figure 17: Case 1 – distributed loading throughout
18
Figure 18: Case 2 – point load on end
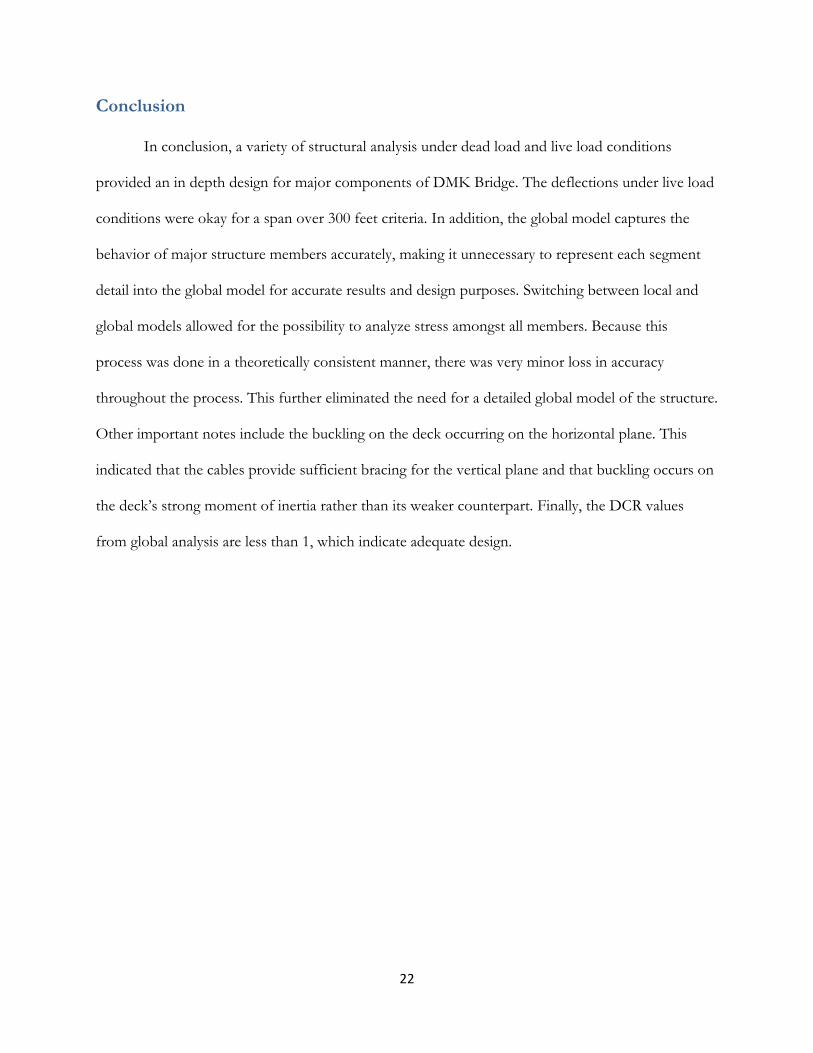
For the pylon, the structure behaves like a perfect column, simulating an theoretical K factor
of nearly 1.0. Figure 19 shows the buckling behavior of the pylon.
Figure 19: Pylon buckling display
The transverse strut was found to require a large critical axial force to buckle. This value is
large enough so that the member will buckle locally before it does globally. The elastic summary
results are shown in table 6.

19
Element Pcr (kips) kL/r (in) Phi * Fcr (ksi)
Deck 1 10240 53 34.3
Deck 2 9305 55 33.8
Deck 3 7512 62 32
Deck 4, 5, 6 4499 80 26.9
Pylon 4836 56 31.2
Transverse Strut 32390 25 39.7
Table 6: Elastic buckling results
Local Stresses
After checking the design compressive stress, the stresses were checked on the local model
pylon and deck by utilizing the global analysis displacement and rotation results. Specifically, the
decks 1 and 5 were examined due to their large positive and negative moments respectively. The
results of load from each main chord for the deck and pylon are shown in table 7 below.
Chord Critical Axial Force (kips)
Area (in2) Critical Stress (ksi)
Deck 1: Top -453.8 17.2 -26.38
Deck 1: Bot -609.3 20.9 -29.15
Deck 5: Top -430.9 17.2 -25.05
Deck 5: Bot 522.1 20.9 24.98
Pylon 525.2 17.2 30.53
Table 7: Critical loading on local model chords

20
Demand to Capacity Ratios
Demand to capacity ratios (DCR) were calculated as per AISC 360-10 specification H1 and
H2. Section H1 DCR is calculated assuming the element is double and singly symmetric. Section H2
DCR is calculated for asymmetric elements. The formulas utilized to solve for the DCR’s are shown
in formulas 3 and 4.
If P/Py >= 0.2 DCR = P/Py + (8/9) * Mpc/Mp If P/Py < 0.2 DCR = 0.5 * P/Py + Mpc/Mp
Formula 3: H1 DCR formula
DCR = |fra/Fca + frbx/Fcb| Formula 4: H2 DCR formula
DCR results shown in tables 8, 9, and 10 are based on global analysis results and for global
section properties.
Deck Max Positive Bending Deck Max Negative Bending
Deck Segment
Section H1.1 Section H2
Deck Segment
Section H1.1 Section H2
Axial+Bending DCR
Axial+Bending DCR
Axial+Bending DCR
Axial+Bending DCR
1 0.60 0.63 1 0.80 0.82
2 0.65 0.68 2 0.71 0.73
3 0.61 0.64 3 0.67 0.70
4 0.76 0.81 4 0.53 0.56
5 0.73 0.82 5 0.12 0.19
6 0.52 0.52 6 N/A N/A
Table 8: DCR for maximum positive and negative bending on deck

21
Deck Max Compression Other Elements
Deck Segment
Section H1.1 Section H2
Element
Section H1.1 Section H2
Axial+Bending DCR
Axial+Bending DCR
Axial+Bending DCR
Axial+Bending DCR
1 0.80 0.82 Pylon Middle
0.97 0.98
2 0.72 0.74 Pylon Bottom
0.92 0.93
3 0.63 0.65 Transverse Deck Strut
0.76 0.80
4 0.76 0.81
5 0.71 0.80
6 0.52 0.52
Table 9: DCR for maximum compression on deck and DCR for maximum load on pylon
Cable Stay Tension
Cable Section Tension (kips) DL + PT + LL DCR
Front Stay 1 120 0.61
Front Stay 2 178 0.53
Front Stay 3 229 0.43
Front Stay 4 222 0.41
Front Stay 5 206 0.38
Back Stay 615 0.38
Deck Balancing 1295 0.64
Table 10: DCR for cable stays
22
Conclusion
In conclusion, a variety of structural analysis under dead load and live load conditions
provided an in depth design for major components of DMK Bridge. The deflections under live load
conditions were okay for a span over 300 feet criteria. In addition, the global model captures the
behavior of major structure members accurately, making it unnecessary to represent each segment
detail into the global model for accurate results and design purposes. Switching between local and
global models allowed for the possibility to analyze stress amongst all members. Because this
process was done in a theoretically consistent manner, there was very minor loss in accuracy
throughout the process. This further eliminated the need for a detailed global model of the structure.
Other important notes include the buckling on the deck occurring on the horizontal plane. This
indicated that the cables provide sufficient bracing for the vertical plane and that buckling occurs on
the deck’s strong moment of inertia rather than its weaker counterpart. Finally, the DCR values
from global analysis are less than 1, which indicate adequate design.


![Purelight 9 - Cable Mount [PL9-C] selux · or T8 (17W 2’, 25W 3’, 32W 4’) lamping by ... Purelight Multi- Mount Form 002 2 foot 003 3 foot 004 4 foot 006 6 foot 008 8 foot RUN1](https://img.dokumen.tips/doc/110x75/5b38b5947f8b9a1a678bbad5/purelight-9-cable-mount-pl9-c-or-t8-17w-2-25w-3-32w-4-lamping.jpg)


![Page Block No. Description of Change · 2019. 11. 4. · 10 Foot Ethernet Crossover Cable (EAI, PN 87-120877-1001) or 25 Foot Ethernet Crossover Cable (EAI, PN 87-120878-1001) [1]](https://img.dokumen.tips/doc/110x75/600d30ce9d1a8b64846f5e39/page-block-no-description-of-2019-11-4-10-foot-ethernet-crossover-cable-eai.jpg)


![[XLS] · Web view450. 90. 450. 900. 900. 225. 450. 450. 900. 450. 225. 270. 4.5. 450. 450. 450. 450. 450. 450. 450. 450. 450. 900. 450. 450. 450. 112.5. 900. 900. 450. 112.5. 450](https://img.dokumen.tips/doc/110x75/5b3c17127f8b9a213f8d0b42/xls-web-view450-90-450-900-900-225-450-450-900-450-225-270-45.jpg)