Embed Size (px)
Citation preview
Research Programme of the Research Fund for Coal and Steel
STROnger Steels in the Built Environment (STROBE)
D1.2
Markus Feldmann, Simon Schaffrath, Helen Bartsch, Carolin Bock
RWTH Aachen University
WP 1 – Development of new ductility and
toughness requirements for HSS
Deliverable 1.2
RFSR-CT-2016-743504

STROBE
2
Version Date Purpose Author Reviewer Approved
V01 For the committee Name Name Name
STROBE
3
EXECUTIVE SUMMARY
The aim of work package 1 within the STROBE project is to detect critical
combinations of geometries and material characteristics which lead to a
component failure before the characteristic bearing capacity according to
Eurocode 3 has been reached. Therefore, a parametric study of different
geometries combining different material characteristics has been conducted to
establish the necessary data base. In order to provide a comprehensive view of
this issue, three types of specimens (CNT, CNT+ and 3NT) as well as four steel
grades (S355, S500, S690 and S960) ranging from conventional steel to high-
strength steel are considered.
To account for a broad material spectrum, true stress-strain curves depending on
yield strength, yield strength ratio, elongation at tensile strength and yield plateau
are derived. The corresponding values can be found in deliverable D1.1. In order
to consider a possible ductile material failure, the Johnson-Cook (JC) damage
model is implemented which describes the critical plastic strain as a function of
the stress triaxiality 𝜂. These so-called damage curves are derived based on
varying parameters as a function of the yield strength ratio and the upper-shelf
toughness and can also be found in deliverable D1.1.
Based on a centrally notched tensile (CNT) specimen, a procedure to derive
ductility demands is developed (section 1) and subsequently transferred to
deviating geometries (section 2) to further investigate the influence of the
geometry. The derived criteria are then compared with the material specifications
(section 3) and finally a conclusion is given (section 4).
STROBE
4
Table of Contents
1 Analysis of CNT reference Geometry 1
Numerical model 1
Numerical results 2
Ductility criteria 11
2 Analysis of the influence of geometry parameters 15
Influence of a concentrated load introduction 15
Influence of a multiple cross-sectional weakening 19
3 Evaluation of ductility requirements 23
4 Conclusion 26
5 References 28
Annex 1 – CNT geometry (AV,US = 100 J) 29
Annex 2 – CNT+ geometry (AV,US = 100 J) 31
Annex 3 – 3NT_2.4 geometry (AV,US = 100 J) 33
Annex 4 – 3NT_3.0 geometry (AV,US = 100 J) 35
STROBE
1
1 ANALYSIS OF CNT REFERENCE GEOMETRY
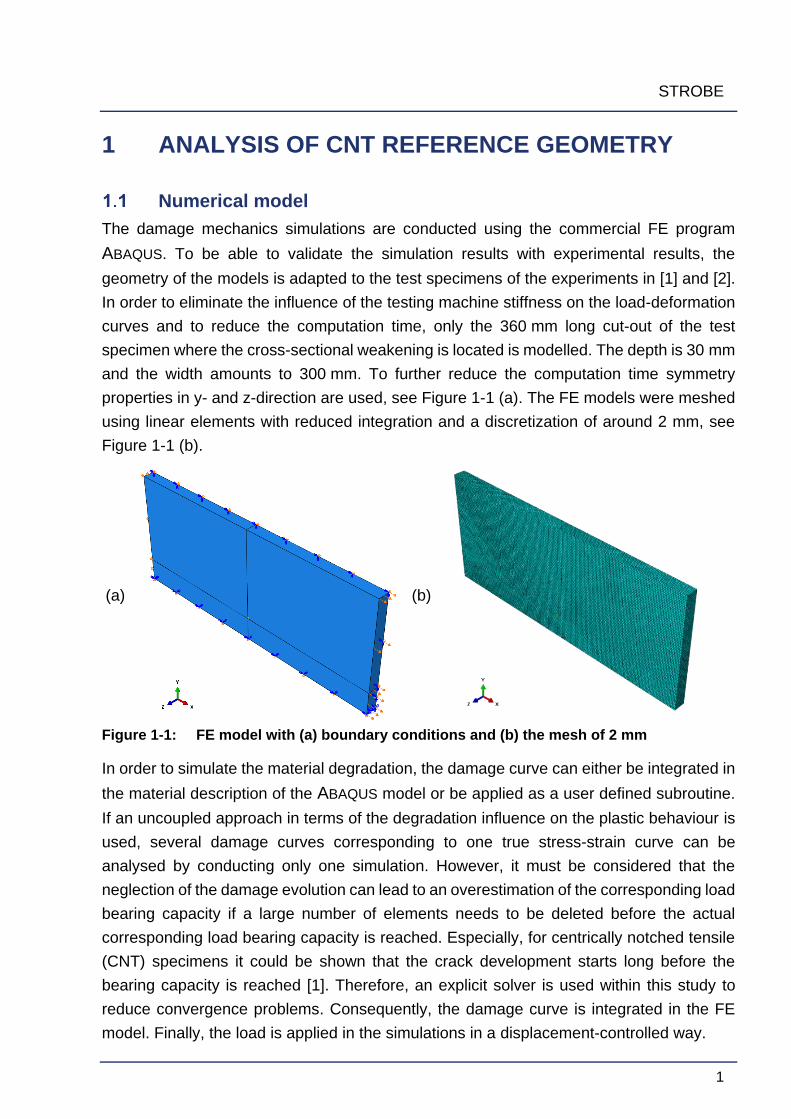
Numerical model
The damage mechanics simulations are conducted using the commercial FE program
ABAQUS. To be able to validate the simulation results with experimental results, the
geometry of the models is adapted to the test specimens of the experiments in [1] and [2].
In order to eliminate the influence of the testing machine stiffness on the load-deformation
curves and to reduce the computation time, only the 360 mm long cut-out of the test
specimen where the cross-sectional weakening is located is modelled. The depth is 30 mm
and the width amounts to 300 mm. To further reduce the computation time symmetry
properties in y- and z-direction are used, see Figure 1-1 (a). The FE models were meshed
using linear elements with reduced integration and a discretization of around 2 mm, see
Figure 1-1 (b).
(a)
(b)
Figure 1-1: FE model with (a) boundary conditions and (b) the mesh of 2 mm
In order to simulate the material degradation, the damage curve can either be integrated in
the material description of the ABAQUS model or be applied as a user defined subroutine.
If an uncoupled approach in terms of the degradation influence on the plastic behaviour is
used, several damage curves corresponding to one true stress-strain curve can be
analysed by conducting only one simulation. However, it must be considered that the
neglection of the damage evolution can lead to an overestimation of the corresponding load
bearing capacity if a large number of elements needs to be deleted before the actual
corresponding load bearing capacity is reached. Especially, for centrically notched tensile
(CNT) specimens it could be shown that the crack development starts long before the
bearing capacity is reached [1]. Therefore, an explicit solver is used within this study to
reduce convergence problems. Consequently, the damage curve is integrated in the FE
model. Finally, the load is applied in the simulations in a displacement-controlled way.

STROBE
2
Numerical results
In the following, the parametric true stress-strain and damage curves are applied to a
centrically notched specimen with a cross-sectional weakening of 2𝑎 𝑊⁄ = 0.2 in order to
investigate the influence of varying material parameters on the net cross-sectional load
bearing capacity. The denotation of the simulations correspond to the true stress-strain
curves whose derivation is explained in deliverable D1.1. Table 1-1 shows the structure of
the names with the possible variables to facilitate the understanding of the diagram
description.
Table 1-1: Denotation with possible variables
Grade _ 𝒇𝒖/𝒇𝒚 _ 𝜺𝒖 _ ∆𝜺𝒍
S355 LB LB LB
S500 MW MW MW
S690 UB UB UB
S960
The corresponding force-displacement curves are evaluated to check if the parametric true
stress-strain curves lead to reasonable results, followed by an analysis of the load bearing
capacities. The verification of the true stress-strain curves is split in two parts. First, the
influence of the yield strength ratio 𝑓𝑢/𝑓𝑦 is analysed with respect to a varying yield plateau
∆𝜀𝑙. Secondly, the force-displacement curves with different elongation at tensile strength
𝜀𝑢 are compared regarding varying yield strength ratio 𝑓𝑢/𝑓𝑦. This part of the verification is
done for the conventional steel S355 as well as for the high-strength steel S690.
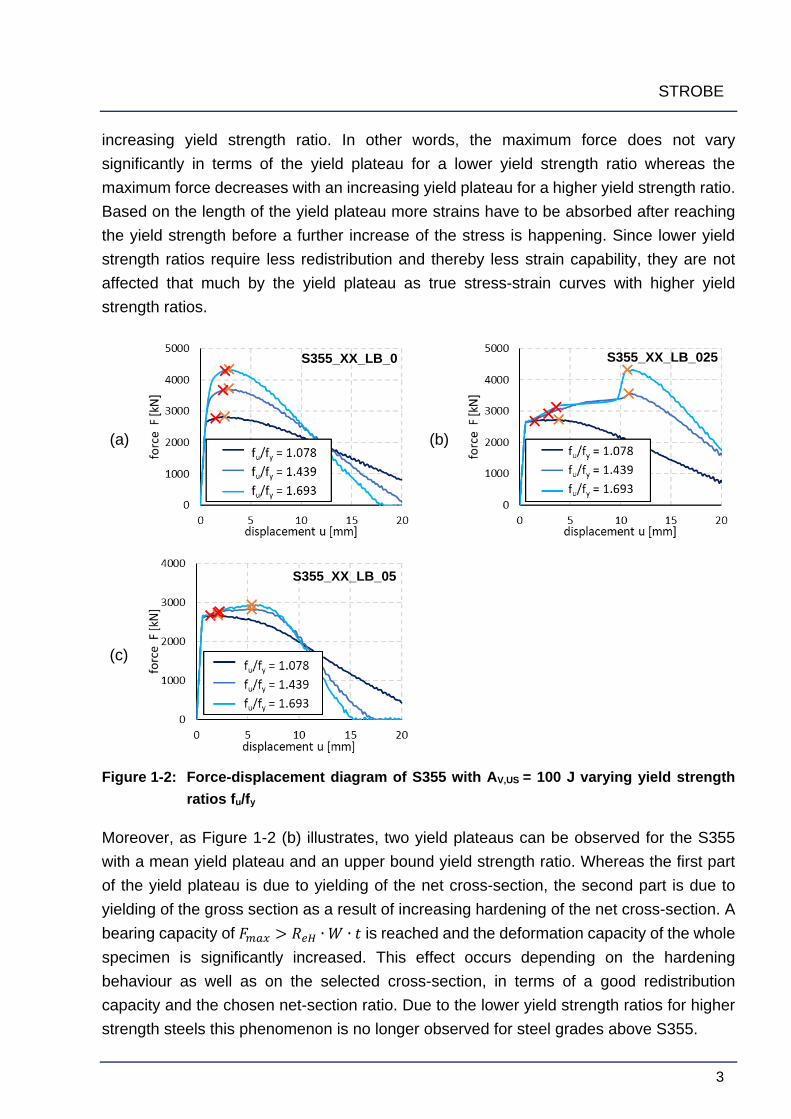
Figure 1-2 illustrates the force-displacement curves with respect to the different yield
strength ratios (LB, MW, UB) and yield plateaus, ∆𝜀𝑙 = 0.0 (a), ∆𝜀𝑙 = 0.025 (b), and
∆𝜀𝑙 = 0.05 (c), for S355 steel. The displayed courses all correspond to a lower bound
elongation at tensile strength (𝜀𝑢 = 0.062) and an upper-shelf toughness of 𝐴𝑉,𝑈𝑆 = 100 𝐽.
As expected, the ultimate force generally increases with an increasing yield strength ratio.
Moreover, it gets obvious that with an increasing yield plateau the displacement between
the damage initiation (indicated by ×) and the maximum force (indicated by ×) increases.
This can be explained by the fact that the yield plateau describes the part of the plastic
deformation where only the elongation decreases whereas the stress state stays
approximately constant.
By comparing diagram (a) with diagram (c) of Figure 1-2, it becomes apparent that with an
increasing yield plateau the difference between the maximum force increases with
STROBE
3
increasing yield strength ratio. In other words, the maximum force does not vary
significantly in terms of the yield plateau for a lower yield strength ratio whereas the
maximum force decreases with an increasing yield plateau for a higher yield strength ratio.
Based on the length of the yield plateau more strains have to be absorbed after reaching
the yield strength before a further increase of the stress is happening. Since lower yield
strength ratios require less redistribution and thereby less strain capability, they are not
affected that much by the yield plateau as true stress-strain curves with higher yield
strength ratios.
(a)
(b)
(c)
Figure 1-2: Force-displacement diagram of S355 with AV,US = 100 J varying yield strength
ratios fu/fy
Moreover, as Figure 1-2 (b) illustrates, two yield plateaus can be observed for the S355
with a mean yield plateau and an upper bound yield strength ratio. Whereas the first part
of the yield plateau is due to yielding of the net cross-section, the second part is due to
yielding of the gross section as a result of increasing hardening of the net cross-section. A
bearing capacity of 𝐹𝑚𝑎𝑥 > 𝑅𝑒𝐻 ∙ 𝑊 ∙ 𝑡 is reached and the deformation capacity of the whole
specimen is significantly increased. This effect occurs depending on the hardening
behaviour as well as on the selected cross-section, in terms of a good redistribution
capacity and the chosen net-section ratio. Due to the lower yield strength ratios for higher
strength steels this phenomenon is no longer observed for steel grades above S355.
S355_XX_LB_0 S355_XX_LB_025
S355_XX_LB_05
STROBE
4
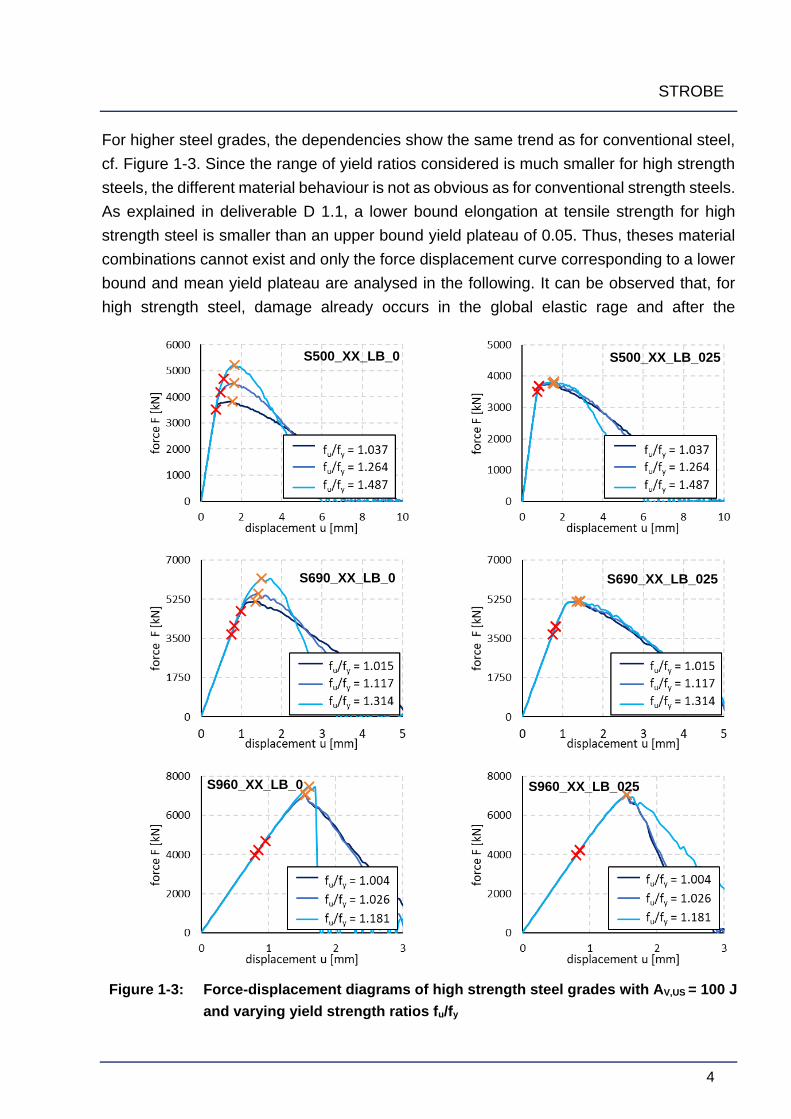
For higher steel grades, the dependencies show the same trend as for conventional steel,
cf. Figure 1-3. Since the range of yield ratios considered is much smaller for high strength
steels, the different material behaviour is not as obvious as for conventional strength steels.
As explained in deliverable D 1.1, a lower bound elongation at tensile strength for high
strength steel is smaller than an upper bound yield plateau of 0.05. Thus, theses material
combinations cannot exist and only the force displacement curve corresponding to a lower
bound and mean yield plateau are analysed in the following. It can be observed that, for
high strength steel, damage already occurs in the global elastic rage and after the
Figure 1-3: Force-displacement diagrams of high strength steel grades with AV,US = 100 J
and varying yield strength ratios fu/fy
S690_XX_LB_025 S690_XX_LB_0
S960_XX_LB_025 S960_XX_LB_0
S500_XX_LB_025 S500_XX_LB_0
STROBE
5
maximum force has been reached the force drops very quickly. This behaviour results due
to the high elastic energy intake of high strength steel. After the maximum force is reached,
this energy is suddenly released and cannot be absorbed by the surrounding material. Even
though this force-displacement curve seems to correspond to a brittle failure, in [1] it could
be shown by analysing the fracture surfaces that on a microscopic scale a ductile failure
happened. Furthermore, the course of the force-displacement curve after the maximum
force has been reached depends on the length of the yield plateau for an upper bound yield
strength ratio. The findings described above can be transferred to all other combinations
of strength properties considered within the framework of this project.
In the following, the influence of the elongation at tensile strength in relation to the yield
strength ratio will be analysed. Figure 1-4 illustrates for all steel grades the resulting force-
displacement curve with varying elongation at tensile strength on the example of a lower
bound yield plateau of ∆𝜀𝑙 = 0.0 and an upper-shelf toughness of 100 J, both for a lower
bound yield strength ratio as well as an upper bound yield strength ratio. As can be seen,
there is almost no influence of the elongation at tensile strength on the maximum force for
a low yield strength ratio. With an increasing yield strength ratio however, the resulting
maximum force decreases with an increase of the elongation at tensile strength. Since the
elongation at tensile strength refers to the residual elongations at the time where the tensile
strength is reached, more hardening and thus a higher amount of redistribution is required
leading to a lower bearing capacity.

STROBE
6
Figure 1-4: Force-displacement diagrams with AV,US = 100 J of all steel grades for varying
elongation at tensile strength εu
S355_LB_XX_0
S690_LB_XX_0
S960_LB_XX_0
S355_UB_XX_0
S690_UB_XX_0
S960_UB_XX_0
S500_LB_XX_0 S500_UB_XX_0
STROBE
7
Since the analysed force-displacement curves can be explained by the material behaviour
of steel and agree with the experimental results in [1], it can be concluded that the derived
true stress-strain curves lead to reasonable results. The corresponding load-bearing
capacities are analysed in the following. First, the focus will be set on an evaluation of the
influence of the strength properties 𝑓𝑢/𝑓𝑦, 𝜀𝑢 and ∆𝜀𝑙, followed by an investigation of the
influence of the upper-shelf toughness on the load bearing capacity reached by the
corresponding true stress-strain curves.
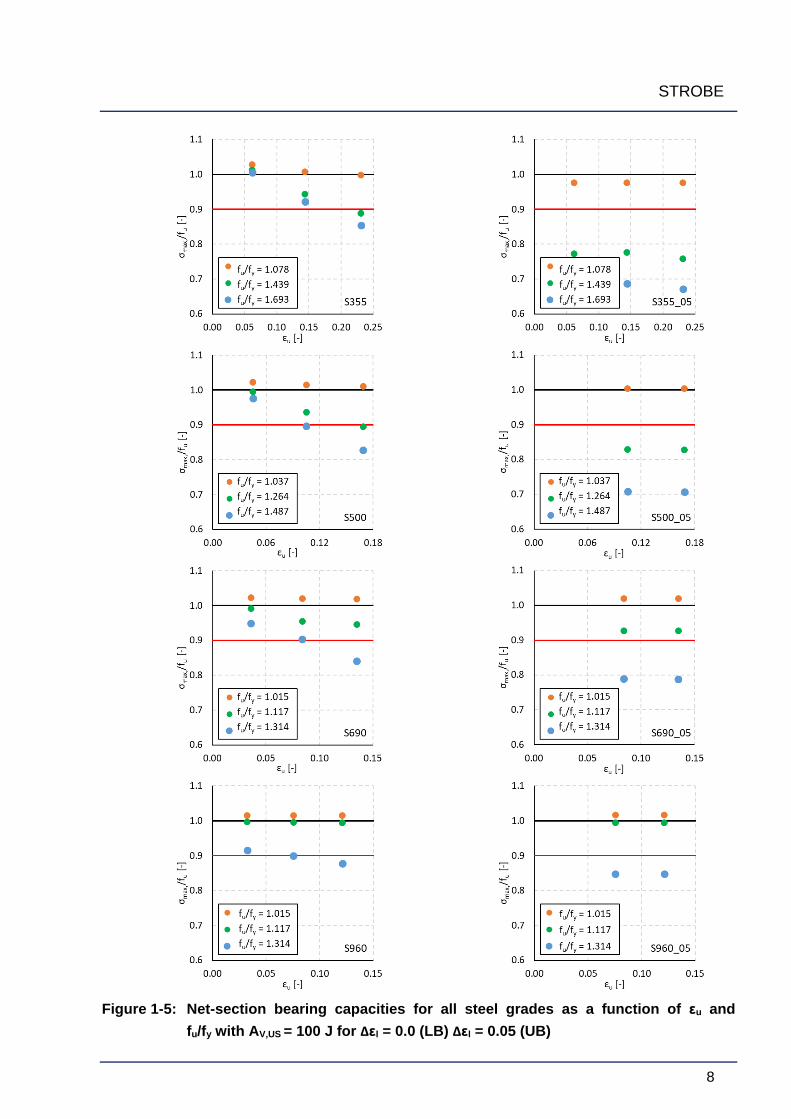
Figure 1-5 summarizes the resulting net-section bearing capacities with an upper-shelf
toughness of 𝐴𝑉,𝑈𝑆 = 100 𝐽 as a function of 𝜀𝑢 on the example of ∆𝜀𝑙 = 0.0 (LB) and ∆𝜀𝑙 =
0.05 (UB). Moreover, the yield strength ratios are considered by different colours.
As expected, the net-section bearing capacity decreases with an increase of the elongation
at tensile strength 𝜀𝑢. This phenomenon is especially distinctive for high yield-strength
ratios and small yield plateaus. If the difference between the yield plateau and the
elongation at tensile strength decreases, less strains are required until 𝜀𝑢 is reached.
Therefore, the influence of 𝜀𝑢 on the load bearing capacity decreases with an increasing
yield plateau. Moreover, a higher load bearing capacity can be reached for materials with
a smaller yield-strength ratio. This can be explained by the fact that the amount of
degradation effects is linked to the ratio between the yield strength (𝑓𝑦) and the tensile
strength (𝑓𝑢). If the difference is small, less hardening is required until the ultimate strength
is reached leading to less required redistribution. Thereby, the material can resist a higher
related loading. Furthermore, the load bearing capacity decreases with an increasing yield
plateau, especially for higher yield- strength ratios, which complies with the evaluated force-
displacement curves. These phenomena can be observed for all steel grades evaluated.
STROBE
8
Figure 1-5: Net-section bearing capacities for all steel grades as a function of εu and
fu/fy with AV,US = 100 J for Δεl = 0.0 (LB) Δεl = 0.05 (UB)
STROBE
9
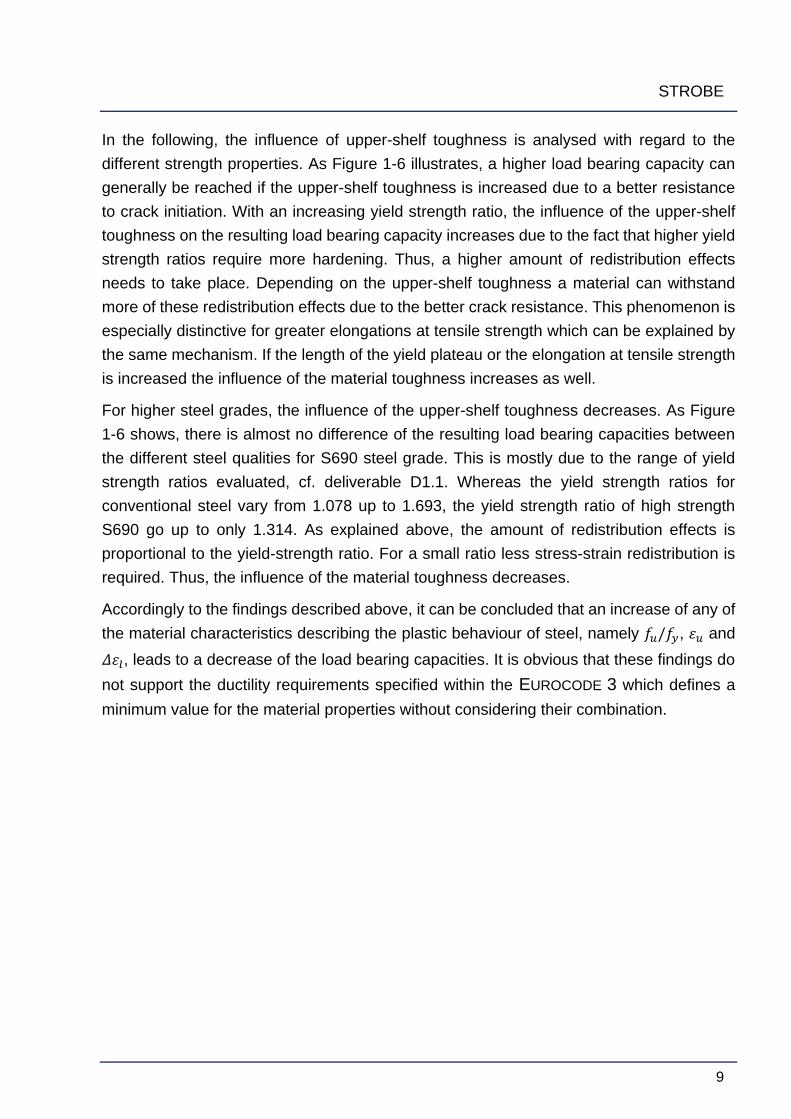
In the following, the influence of upper-shelf toughness is analysed with regard to the
different strength properties. As Figure 1-6 illustrates, a higher load bearing capacity can
generally be reached if the upper-shelf toughness is increased due to a better resistance
to crack initiation. With an increasing yield strength ratio, the influence of the upper-shelf
toughness on the resulting load bearing capacity increases due to the fact that higher yield
strength ratios require more hardening. Thus, a higher amount of redistribution effects
needs to take place. Depending on the upper-shelf toughness a material can withstand
more of these redistribution effects due to the better crack resistance. This phenomenon is
especially distinctive for greater elongations at tensile strength which can be explained by
the same mechanism. If the length of the yield plateau or the elongation at tensile strength
is increased the influence of the material toughness increases as well.
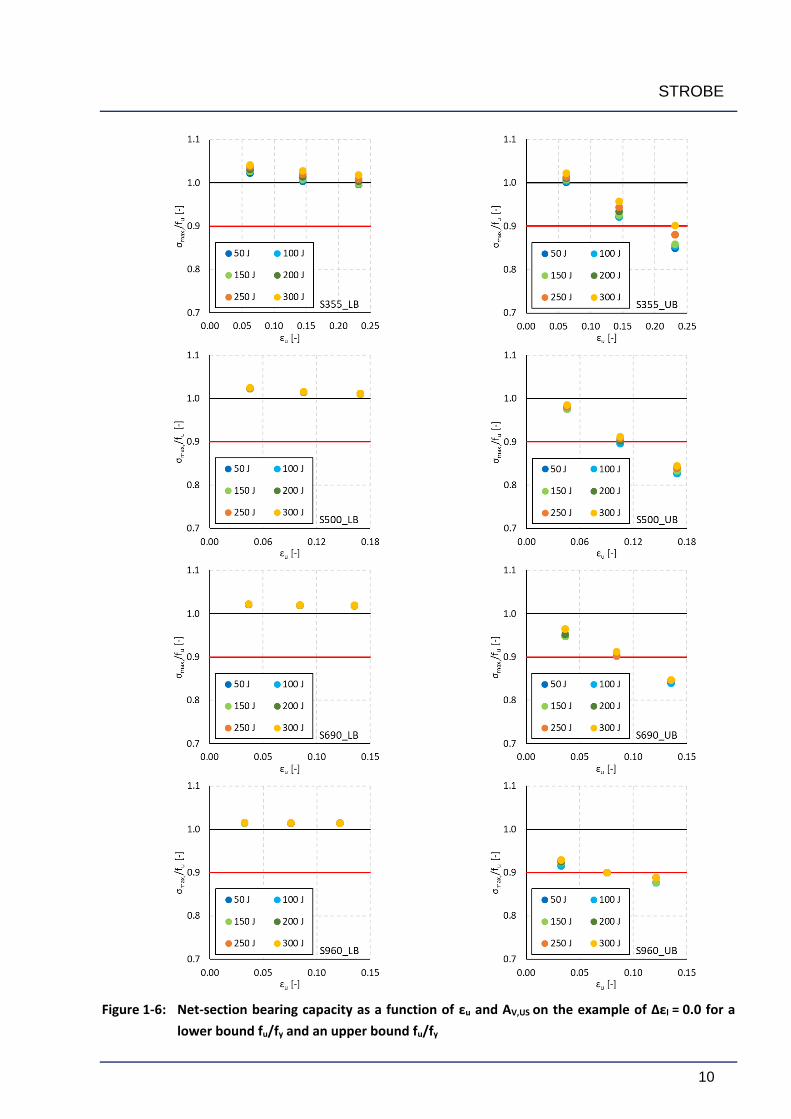
For higher steel grades, the influence of the upper-shelf toughness decreases. As Figure
1-6 shows, there is almost no difference of the resulting load bearing capacities between
the different steel qualities for S690 steel grade. This is mostly due to the range of yield
strength ratios evaluated, cf. deliverable D1.1. Whereas the yield strength ratios for
conventional steel vary from 1.078 up to 1.693, the yield strength ratio of high strength
S690 go up to only 1.314. As explained above, the amount of redistribution effects is
proportional to the yield-strength ratio. For a small ratio less stress-strain redistribution is
required. Thus, the influence of the material toughness decreases.
Accordingly to the findings described above, it can be concluded that an increase of any of
the material characteristics describing the plastic behaviour of steel, namely 𝑓𝑢/𝑓𝑦, 𝜀𝑢 and
𝛥𝜀𝑙, leads to a decrease of the load bearing capacities. It is obvious that these findings do
not support the ductility requirements specified within the EUROCODE 3 which defines a
minimum value for the material properties without considering their combination.
STROBE
10
Figure 1-6: Net-section bearing capacity as a function of εu and AV,US on the example of Δεl = 0.0 for a
lower bound fu/fy and an upper bound fu/fy

STROBE
11
Ductility criteria
The objective of this section is to determine combinations of material strength and
toughness properties which do not comply with the verification of the net-section bearing
capacity stated within the EUROCODE 3. Furthermore, ductility criteria are established
considering the different behaviour of each steel grade. Therefore, a concept of four steps
is developed based on the results of the parametric study, cf. section 1.2. The four steps
are exemplarily presented in Figure 1-7.
Figure 1-7: Concept developed to derive ductility criteria
First, all resulting net-section bearing capacities belonging to the same yield plateau are
plotted in a diagram as a function of 𝜀𝑢 and 𝑓𝑢/𝑓𝑦 representing a scatter plot (step 1).
Thereby, all simulation results corresponding to each yield plateau are represented. Based
on those results, a surface describing the load bearing capacities of each upper-shelf
toughness in terms of 𝜀𝑢 and 𝑓𝑢/𝑓𝑦 is defined for each yield plateau and each steel grade.
To do so, a curve fitting approach using a linear least square method is applied (step 2).
The resulting functional approach will be presented later in this section, see equation (1-1).
STROBE
12
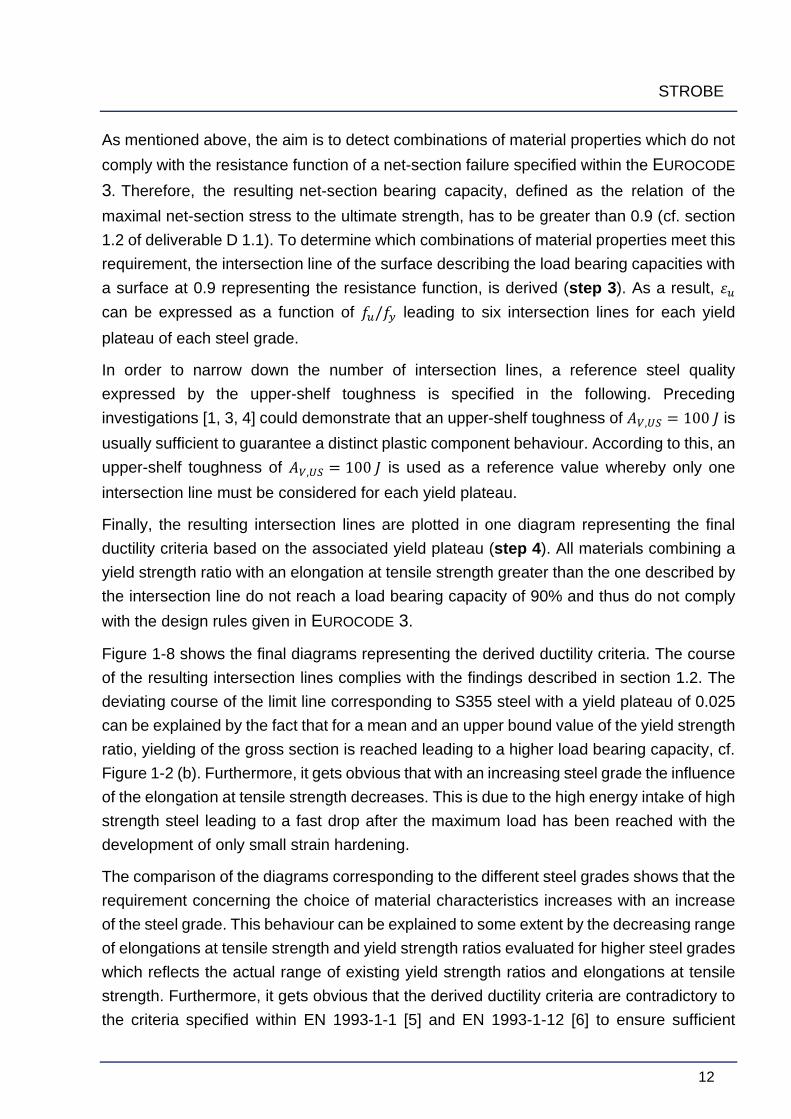
As mentioned above, the aim is to detect combinations of material properties which do not
comply with the resistance function of a net-section failure specified within the EUROCODE
3. Therefore, the resulting net-section bearing capacity, defined as the relation of the
maximal net-section stress to the ultimate strength, has to be greater than 0.9 (cf. section
1.2 of deliverable D 1.1). To determine which combinations of material properties meet this
requirement, the intersection line of the surface describing the load bearing capacities with
a surface at 0.9 representing the resistance function, is derived (step 3). As a result, 𝜀𝑢
can be expressed as a function of 𝑓𝑢/𝑓𝑦 leading to six intersection lines for each yield
plateau of each steel grade.
In order to narrow down the number of intersection lines, a reference steel quality
expressed by the upper-shelf toughness is specified in the following. Preceding
investigations [1, 3, 4] could demonstrate that an upper-shelf toughness of 𝐴𝑉,𝑈𝑆 = 100 𝐽 is
usually sufficient to guarantee a distinct plastic component behaviour. According to this, an
upper-shelf toughness of 𝐴𝑉,𝑈𝑆 = 100 𝐽 is used as a reference value whereby only one
intersection line must be considered for each yield plateau.
Finally, the resulting intersection lines are plotted in one diagram representing the final
ductility criteria based on the associated yield plateau (step 4). All materials combining a
yield strength ratio with an elongation at tensile strength greater than the one described by
the intersection line do not reach a load bearing capacity of 90% and thus do not comply
with the design rules given in EUROCODE 3.
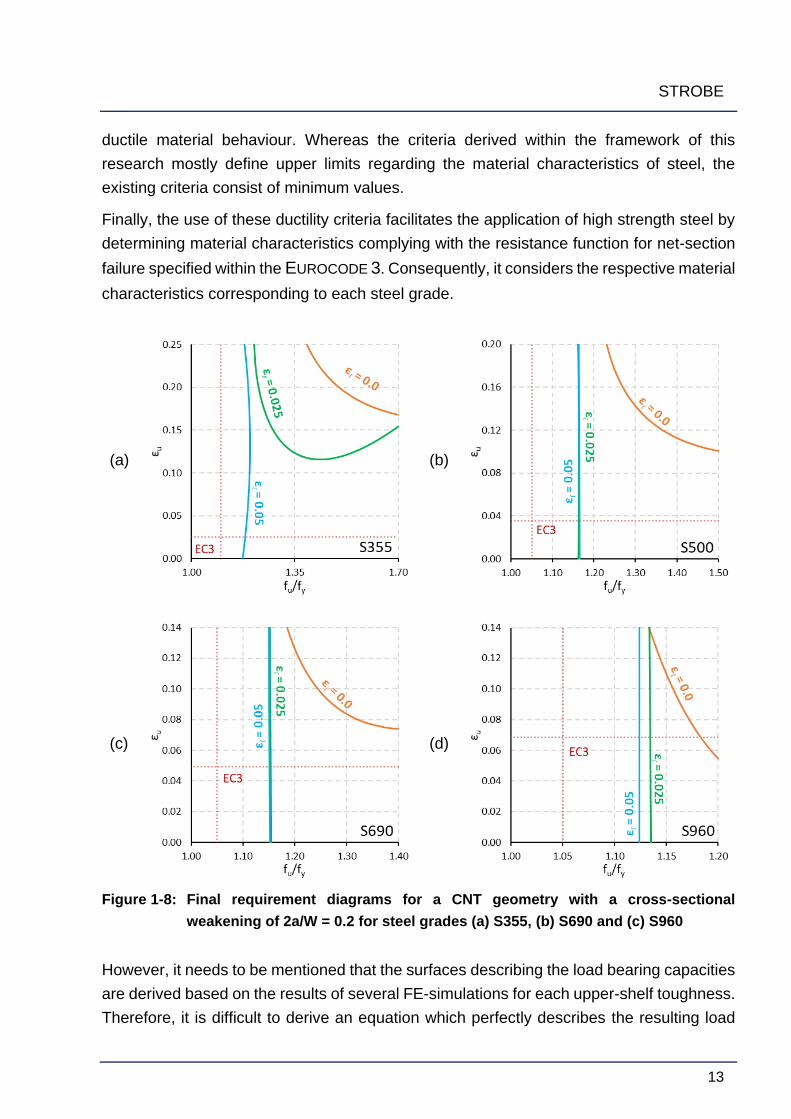
Figure 1-8 shows the final diagrams representing the derived ductility criteria. The course
of the resulting intersection lines complies with the findings described in section 1.2. The
deviating course of the limit line corresponding to S355 steel with a yield plateau of 0.025
can be explained by the fact that for a mean and an upper bound value of the yield strength
ratio, yielding of the gross section is reached leading to a higher load bearing capacity, cf.
Figure 1-2 (b). Furthermore, it gets obvious that with an increasing steel grade the influence
of the elongation at tensile strength decreases. This is due to the high energy intake of high
strength steel leading to a fast drop after the maximum load has been reached with the
development of only small strain hardening.
The comparison of the diagrams corresponding to the different steel grades shows that the
requirement concerning the choice of material characteristics increases with an increase
of the steel grade. This behaviour can be explained to some extent by the decreasing range
of elongations at tensile strength and yield strength ratios evaluated for higher steel grades
which reflects the actual range of existing yield strength ratios and elongations at tensile
strength. Furthermore, it gets obvious that the derived ductility criteria are contradictory to
the criteria specified within EN 1993-1-1 [5] and EN 1993-1-12 [6] to ensure sufficient
STROBE
13
ductile material behaviour. Whereas the criteria derived within the framework of this
research mostly define upper limits regarding the material characteristics of steel, the
existing criteria consist of minimum values.
Finally, the use of these ductility criteria facilitates the application of high strength steel by
determining material characteristics complying with the resistance function for net-section
failure specified within the EUROCODE 3. Consequently, it considers the respective material
characteristics corresponding to each steel grade.
(a)
(b)
(c)
(d)
Figure 1-8: Final requirement diagrams for a CNT geometry with a cross-sectional
weakening of 2a/W = 0.2 for steel grades (a) S355, (b) S690 and (c) S960
However, it needs to be mentioned that the surfaces describing the load bearing capacities
are derived based on the results of several FE-simulations for each upper-shelf toughness.
Therefore, it is difficult to derive an equation which perfectly describes the resulting load
STROBE
14
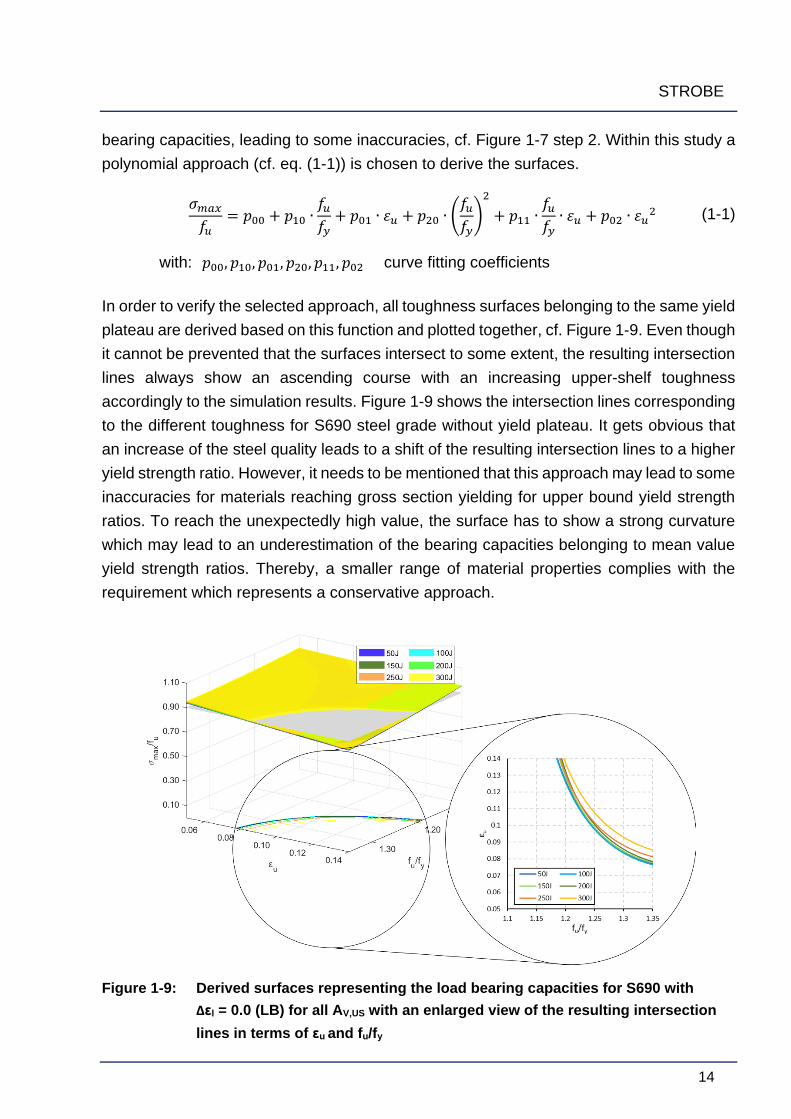
bearing capacities, leading to some inaccuracies, cf. Figure 1-7 step 2. Within this study a
polynomial approach (cf. eq. (1-1)) is chosen to derive the surfaces.
𝜎𝑚𝑎𝑥
𝑓𝑢= 𝑝00 + 𝑝10 ∙
𝑓𝑢
𝑓𝑦+ 𝑝01 ∙ 𝜀𝑢 + 𝑝20 ∙ (
𝑓𝑢
𝑓𝑦)
2
+ 𝑝11 ∙𝑓𝑢
𝑓𝑦∙ 𝜀𝑢 + 𝑝02 ∙ 𝜀𝑢
2 (1-1)
with: 𝑝00, 𝑝10, 𝑝01, 𝑝20, 𝑝11, 𝑝02 curve fitting coefficients
In order to verify the selected approach, all toughness surfaces belonging to the same yield
plateau are derived based on this function and plotted together, cf. Figure 1-9. Even though
it cannot be prevented that the surfaces intersect to some extent, the resulting intersection
lines always show an ascending course with an increasing upper-shelf toughness
accordingly to the simulation results. Figure 1-9 shows the intersection lines corresponding
to the different toughness for S690 steel grade without yield plateau. It gets obvious that
an increase of the steel quality leads to a shift of the resulting intersection lines to a higher
yield strength ratio. However, it needs to be mentioned that this approach may lead to some
inaccuracies for materials reaching gross section yielding for upper bound yield strength
ratios. To reach the unexpectedly high value, the surface has to show a strong curvature
which may lead to an underestimation of the bearing capacities belonging to mean value
yield strength ratios. Thereby, a smaller range of material properties complies with the
requirement which represents a conservative approach.
Figure 1-9: Derived surfaces representing the load bearing capacities for S690 with
Δεl = 0.0 (LB) for all AV,US with an enlarged view of the resulting intersection
lines in terms of εu and fu/fy
STROBE
15
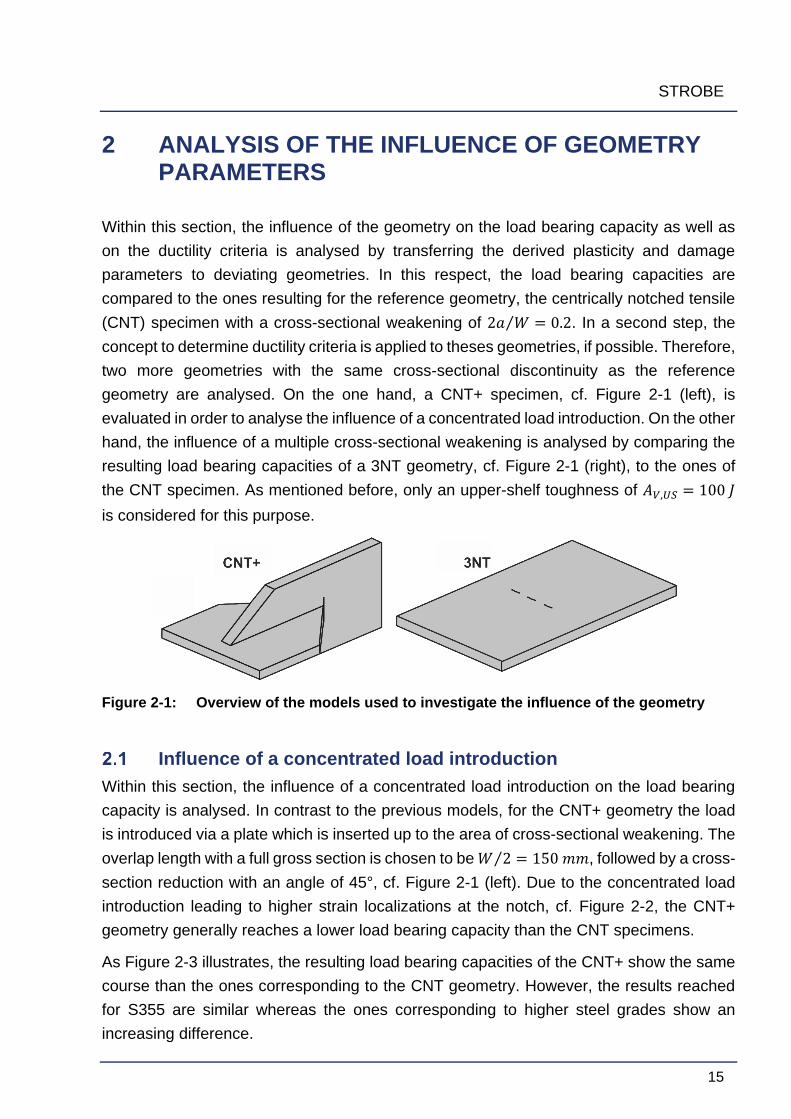
2 ANALYSIS OF THE INFLUENCE OF GEOMETRY PARAMETERS
Within this section, the influence of the geometry on the load bearing capacity as well as
on the ductility criteria is analysed by transferring the derived plasticity and damage
parameters to deviating geometries. In this respect, the load bearing capacities are
compared to the ones resulting for the reference geometry, the centrically notched tensile
(CNT) specimen with a cross-sectional weakening of 2𝑎 𝑊⁄ = 0.2. In a second step, the
concept to determine ductility criteria is applied to theses geometries, if possible. Therefore,
two more geometries with the same cross-sectional discontinuity as the reference
geometry are analysed. On the one hand, a CNT+ specimen, cf. Figure 2-1 (left), is
evaluated in order to analyse the influence of a concentrated load introduction. On the other
hand, the influence of a multiple cross-sectional weakening is analysed by comparing the
resulting load bearing capacities of a 3NT geometry, cf. Figure 2-1 (right), to the ones of
the CNT specimen. As mentioned before, only an upper-shelf toughness of 𝐴𝑉,𝑈𝑆 = 100 𝐽
is considered for this purpose.
Figure 2-1: Overview of the models used to investigate the influence of the geometry
Influence of a concentrated load introduction
Within this section, the influence of a concentrated load introduction on the load bearing
capacity is analysed. In contrast to the previous models, for the CNT+ geometry the load
is introduced via a plate which is inserted up to the area of cross-sectional weakening. The
overlap length with a full gross section is chosen to be 𝑊 2⁄ = 150 𝑚𝑚, followed by a cross-
section reduction with an angle of 45°, cf. Figure 2-1 (left). Due to the concentrated load
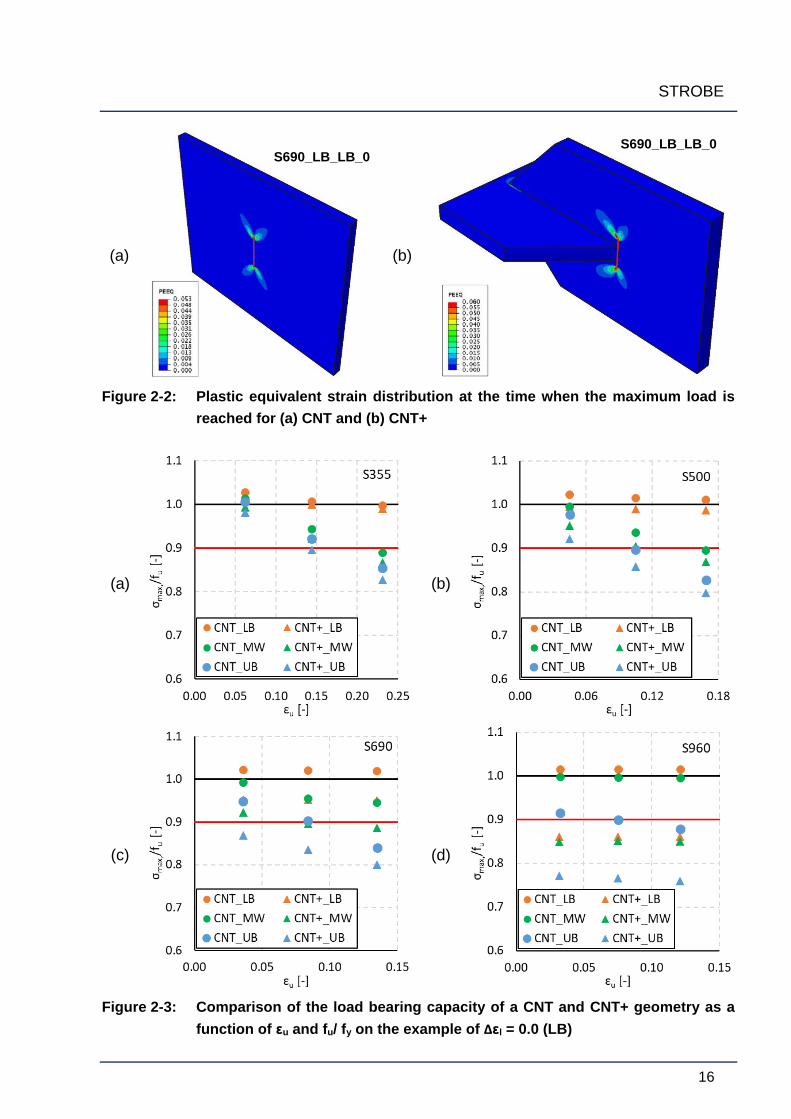
introduction leading to higher strain localizations at the notch, cf. Figure 2-2, the CNT+
geometry generally reaches a lower load bearing capacity than the CNT specimens.
As Figure 2-3 illustrates, the resulting load bearing capacities of the CNT+ show the same
course than the ones corresponding to the CNT geometry. However, the results reached
for S355 are similar whereas the ones corresponding to higher steel grades show an
increasing difference.
STROBE
16
(a)
(b)
Figure 2-2: Plastic equivalent strain distribution at the time when the maximum load is
reached for (a) CNT and (b) CNT+
(a)
(b)
(c)
(d)
Figure 2-3: Comparison of the load bearing capacity of a CNT and CNT+ geometry as a
function of εu and fu/ fy on the example of Δεl = 0.0 (LB)
S690_LB_LB_0 S690_LB_LB_0

STROBE
17
In order to analyse the influence of 𝜀𝑢 and 𝑓𝑢/𝑓𝑦 on the difference of the load bearing
capacities of both geometries, the maximum force achieved for a CNT+ geometry is set in
relation with the corresponding one achieved for a CNT geometry. With an increase of 𝜀𝑢
or 𝑓𝑢/𝑓𝑦 the load bearing capacity of a CNT+ decreases compared to the one of a CNT
specimen for S355, see Table 2-1. This phenomenon can be explained by the fact that a
higher yield strength ratio as well as a higher elongation at tensile strength requires a
greater value of hardening accompanied with more redistribution effects. Since the
concentrated load introduction leads to higher strain localizations at the notch the material
has to withstand more redistribution effects at this area leading to a stronger dependency
of material properties.
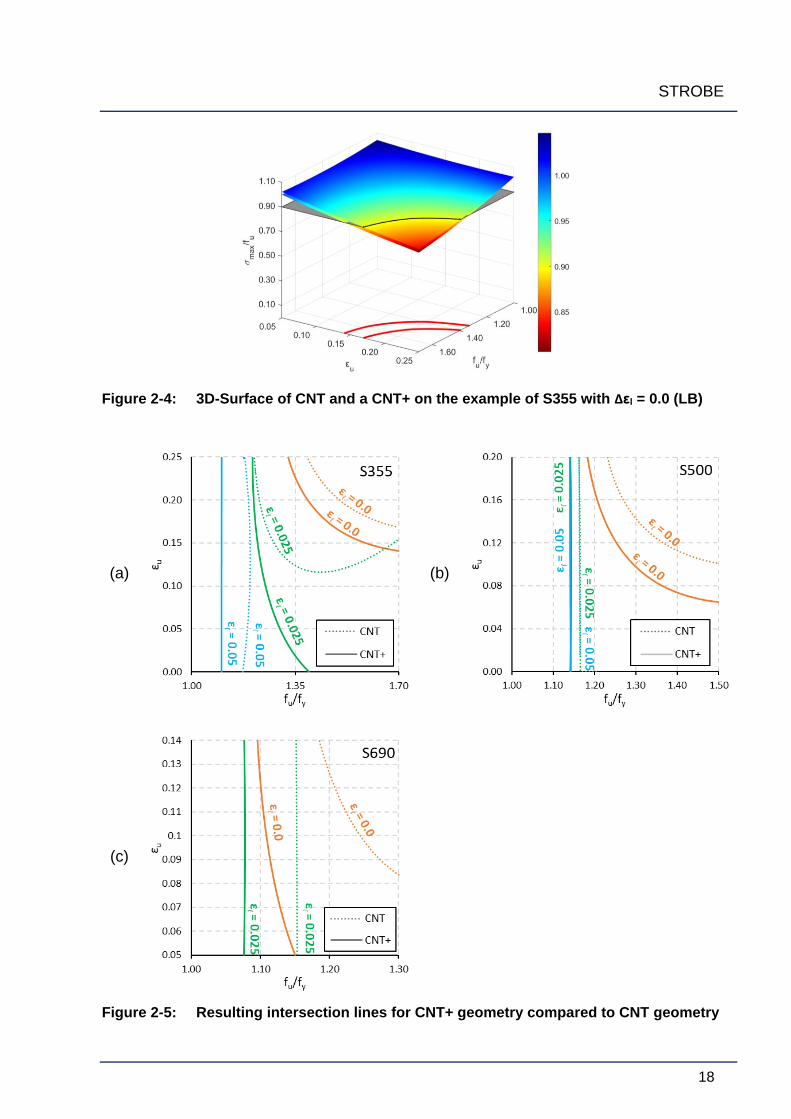
Since the results of the S355 considering CNT+ geometry show the same trend as the CNT
geometry, except that a lower level of the bearing capacity can be reached, cf. Figure 2-4,
additional ductility criteria for specimens with a concentrated load introduction are derived
based on the procedure developed in section 1.3. Due to the fact that all load bearing
capacities of S960 result in less than 90%, no criteria can be derived for this steel grade.
Concerning the S690 no limit line can be derived for a yield plateau of 0.05 due to the same
reason.
The resulting intersection lines of CNT+ specimens corresponding to the S355 and S690
are displayed in Figure 2-5 in comparison to the ones of a CNT specimen. As expected,
the ductility criteria show a similar course which is shifted to a smaller range of permissible
material characteristic combinations. Thereby, the higher requirements for CNT+
specimens due to the concentrated load introduction are represented. The different course
of the intersection lines of S355 corresponding to a yield plateau of 0.025 can be explained
by the fact that yielding of the gross section is reached for the reference geometry leading
to a higher bearing capacity whereas CNT+ specimens do not reach this point.
Generally, it can be stated that the CNT+ specimens reach a lower level of load bearing
capacities. Table 2-1 summarizes the reduction of the load bearing capacities which have
been reached by the CNT+ specimens in relation the CNT specimens for each steel grade.
Table 2-1: Reduction of the load bearing capacities of the CNT+ specimens in relation to
the CNT specimens
S355 S500 S690 S960
Min 0% 1% 5% 13%
Max 18% 6% 9% 16%
STROBE
18
Figure 2-4: 3D-Surface of CNT and a CNT+ on the example of S355 with Δεl = 0.0 (LB)
(a)
(b)
(c)
Figure 2-5: Resulting intersection lines for CNT+ geometry compared to CNT geometry
STROBE
19
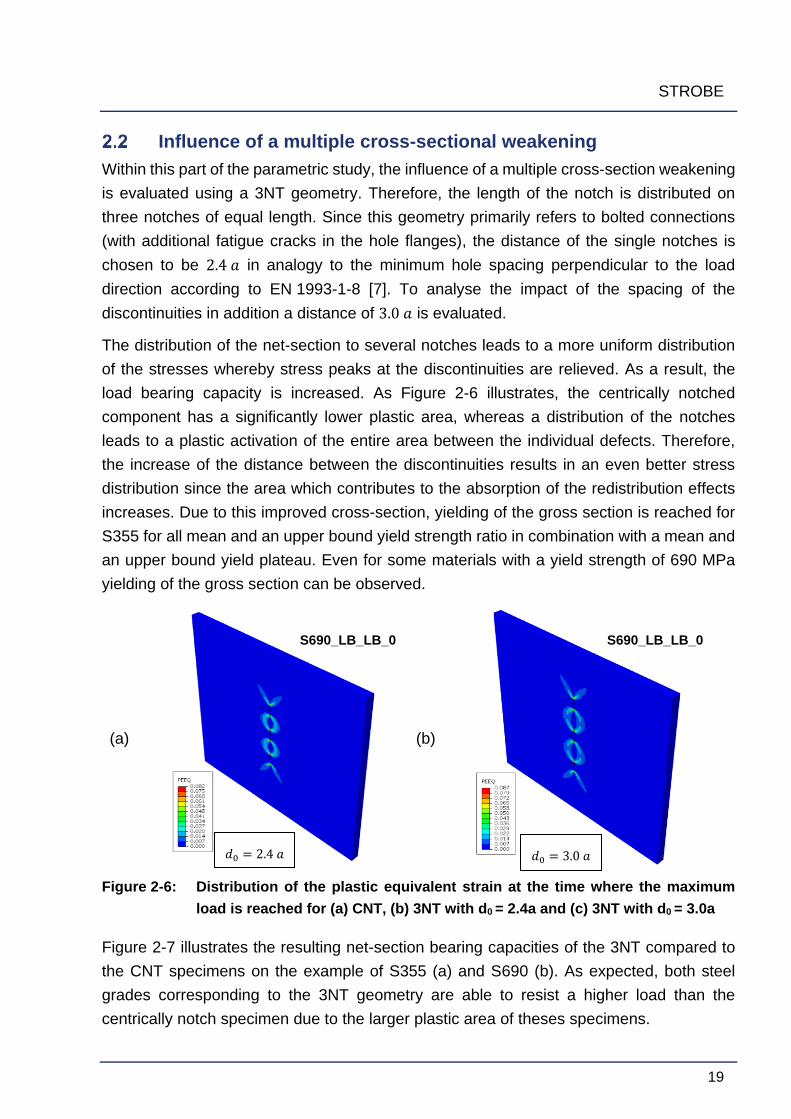
Influence of a multiple cross-sectional weakening
Within this part of the parametric study, the influence of a multiple cross-section weakening
is evaluated using a 3NT geometry. Therefore, the length of the notch is distributed on
three notches of equal length. Since this geometry primarily refers to bolted connections
(with additional fatigue cracks in the hole flanges), the distance of the single notches is
chosen to be 2.4 𝑎 in analogy to the minimum hole spacing perpendicular to the load
direction according to EN 1993-1-8 [7]. To analyse the impact of the spacing of the
discontinuities in addition a distance of 3.0 𝑎 is evaluated.
The distribution of the net-section to several notches leads to a more uniform distribution
of the stresses whereby stress peaks at the discontinuities are relieved. As a result, the
load bearing capacity is increased. As Figure 2-6 illustrates, the centrically notched
component has a significantly lower plastic area, whereas a distribution of the notches
leads to a plastic activation of the entire area between the individual defects. Therefore,
the increase of the distance between the discontinuities results in an even better stress
distribution since the area which contributes to the absorption of the redistribution effects
increases. Due to this improved cross-section, yielding of the gross section is reached for
S355 for all mean and an upper bound yield strength ratio in combination with a mean and
an upper bound yield plateau. Even for some materials with a yield strength of 690 MPa
yielding of the gross section can be observed.
(a)
(b)
Figure 2-6: Distribution of the plastic equivalent strain at the time where the maximum
load is reached for (a) CNT, (b) 3NT with d0 = 2.4a and (c) 3NT with d0 = 3.0a
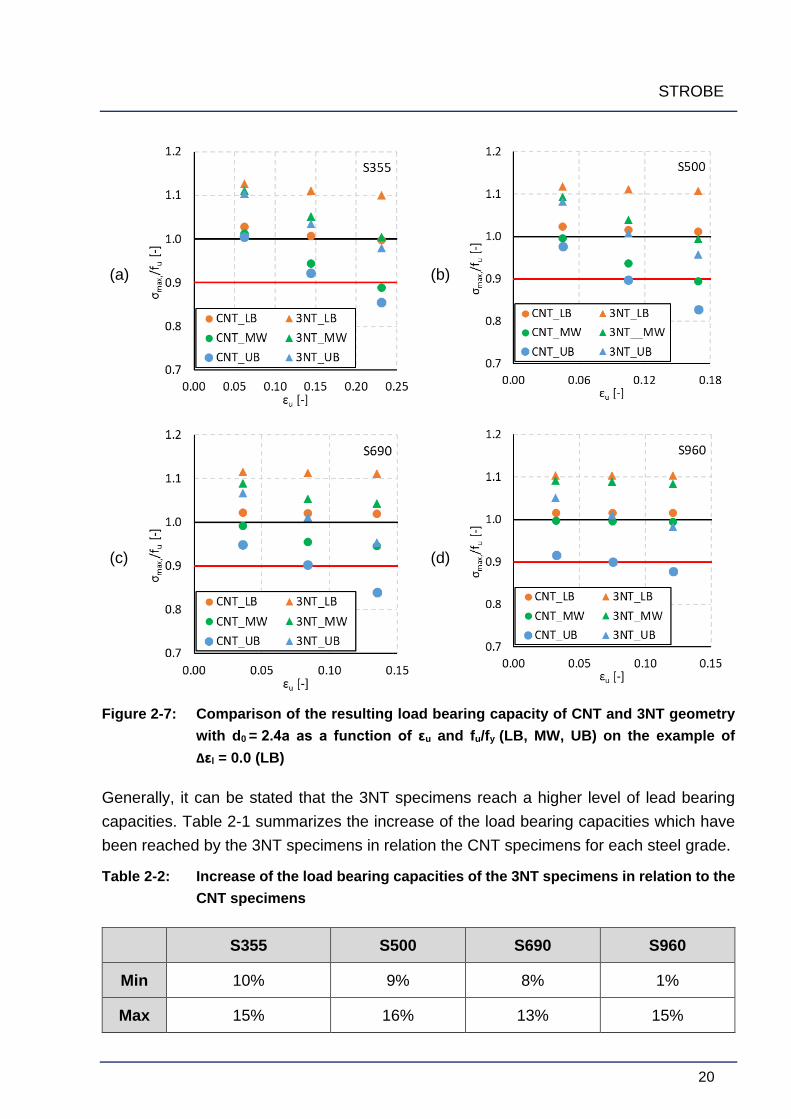
Figure 2-7 illustrates the resulting net-section bearing capacities of the 3NT compared to
the CNT specimens on the example of S355 (a) and S690 (b). As expected, both steel
grades corresponding to the 3NT geometry are able to resist a higher load than the
centrically notch specimen due to the larger plastic area of theses specimens.
𝑑0 = 2.4 𝑎 𝑑0 = 3.0 𝑎
S690_LB_LB_0 S690_LB_LB_0
STROBE
20
(a)
(b)
(c)
(d)
Figure 2-7: Comparison of the resulting load bearing capacity of CNT and 3NT geometry
with d0 = 2.4a as a function of εu and fu/fy (LB, MW, UB) on the example of
Δεl = 0.0 (LB)
Generally, it can be stated that the 3NT specimens reach a higher level of lead bearing
capacities. Table 2-1 summarizes the increase of the load bearing capacities which have
been reached by the 3NT specimens in relation the CNT specimens for each steel grade.
Table 2-2: Increase of the load bearing capacities of the 3NT specimens in relation to the
CNT specimens
S355 S500 S690 S960
Min 10% 9% 8% 1%
Max 15% 16% 13% 15%
STROBE
21
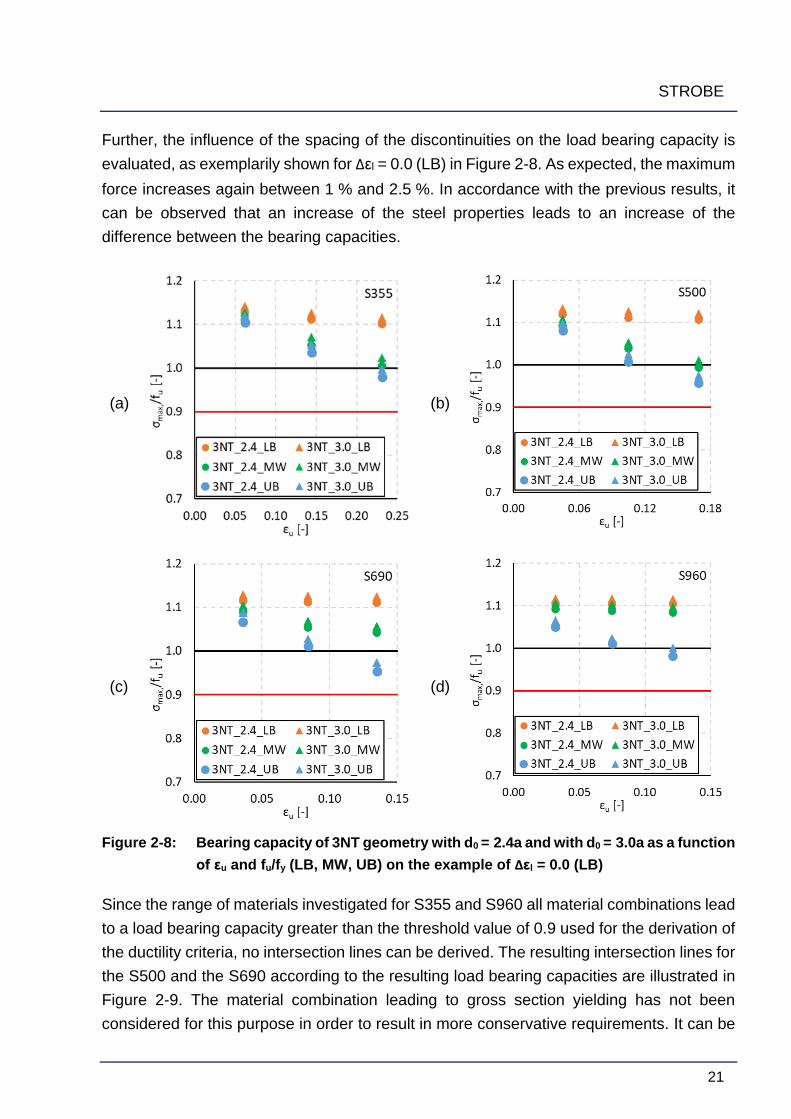
Further, the influence of the spacing of the discontinuities on the load bearing capacity is
evaluated, as exemplarily shown for Δεl = 0.0 (LB) in Figure 2-8. As expected, the maximum
force increases again between 1 % and 2.5 %. In accordance with the previous results, it
can be observed that an increase of the steel properties leads to an increase of the
difference between the bearing capacities.
(a)
(b)
(c)
(d)
Figure 2-8: Bearing capacity of 3NT geometry with d0 = 2.4a and with d0 = 3.0a as a function
of εu and fu/fy (LB, MW, UB) on the example of Δεl = 0.0 (LB)
Since the range of materials investigated for S355 and S960 all material combinations lead
to a load bearing capacity greater than the threshold value of 0.9 used for the derivation of
the ductility criteria, no intersection lines can be derived. The resulting intersection lines for
the S500 and the S690 according to the resulting load bearing capacities are illustrated in
Figure 2-9. The material combination leading to gross section yielding has not been
considered for this purpose in order to result in more conservative requirements. It can be

STROBE
22
seen that the lines show the same course for both 3NT geometries. With an increase of the
distance between the notches, the lines are parallelly shifted to the right.
(a)
(b)
Figure 2-9: Requirement diagram showing the resulting intersection lines corresponding
to 3NT specimens with d0 = 2.4a and with d0 = 3.0a compared to the ones
derived for the CNT
Finally, it can be stated that this type of geometry is covered by the verification of the net-
section bearing capacity given within the EUROCODE 3. However, the net-section bearing
capacity determined by the engineering design model underestimates the actual load
bearing capacity, even if high strength steels are applied, leading to uneconomic results.
STROBE
23
3 EVALUATION OF DUCTILITY REQUIREMENTS
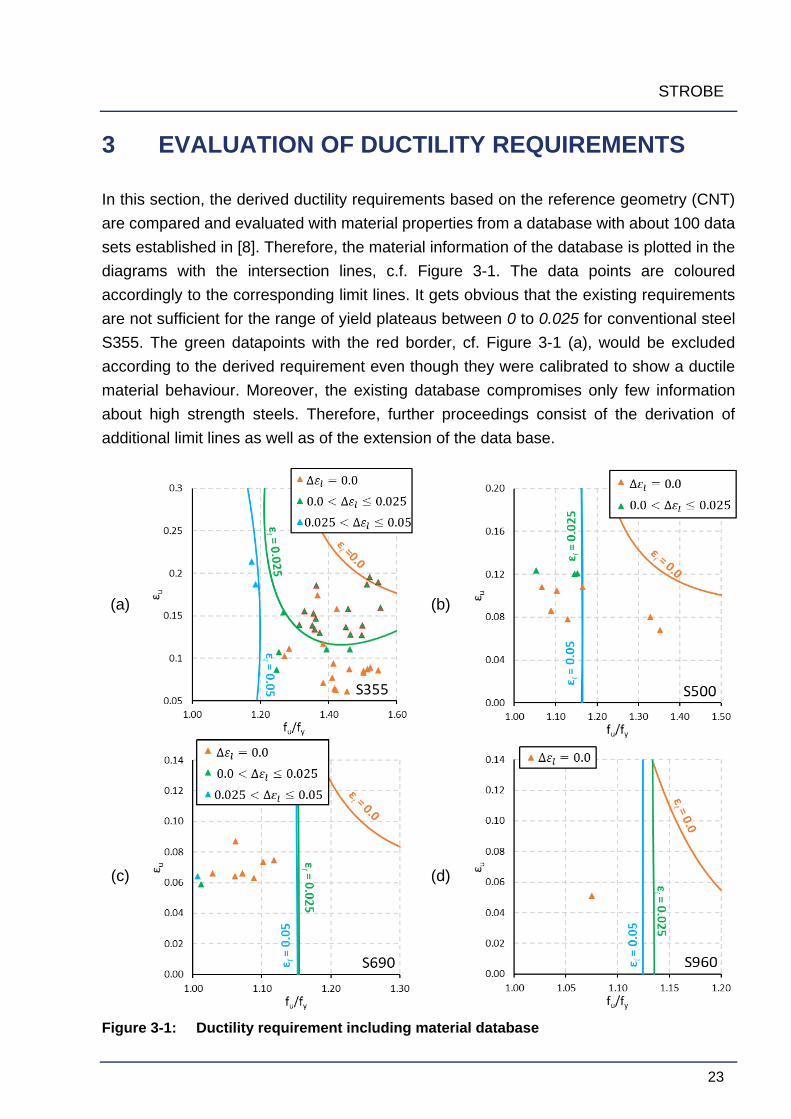
In this section, the derived ductility requirements based on the reference geometry (CNT)
are compared and evaluated with material properties from a database with about 100 data
sets established in [8]. Therefore, the material information of the database is plotted in the
diagrams with the intersection lines, c.f. Figure 3-1. The data points are coloured
accordingly to the corresponding limit lines. It gets obvious that the existing requirements
are not sufficient for the range of yield plateaus between 0 to 0.025 for conventional steel
S355. The green datapoints with the red border, cf. Figure 3-1 (a), would be excluded
according to the derived requirement even though they were calibrated to show a ductile
material behaviour. Moreover, the existing database compromises only few information
about high strength steels. Therefore, further proceedings consist of the derivation of
additional limit lines as well as of the extension of the data base.
(a)
(b)
(c)
(d)
Figure 3-1: Ductility requirement including material database

STROBE
24
In order to derive additional limit lines new true stress-strain curves need to be determined
first for the required yield plateaus. Regarding conventional steel more intersection lines
are derived corresponding on the one hand to a yield plateau of 0.015 and, on the other
hand, to a yield plateau of 0.02. Even though, all existing materials corresponding to S500
and S690 comply with the requirements, an additional limit line for a yield plateau of 0.015
is derived.
In the next step, the corresponding intersection lines are determined based on the
procedure explained in section 1.3. The resulting limit lines are shown in Figure 3-2. As it
can be seen in Figure 3-2 (a) almost all materials corresponding to conventional steel do
comply with the requirement due to the more detailed classification.
(a)
(b)
(c)
(d)
Figure 3-2: Ductility requirements with additional limit lines for (a) S355, (b) S500 and (c)
S690
STROBE
25
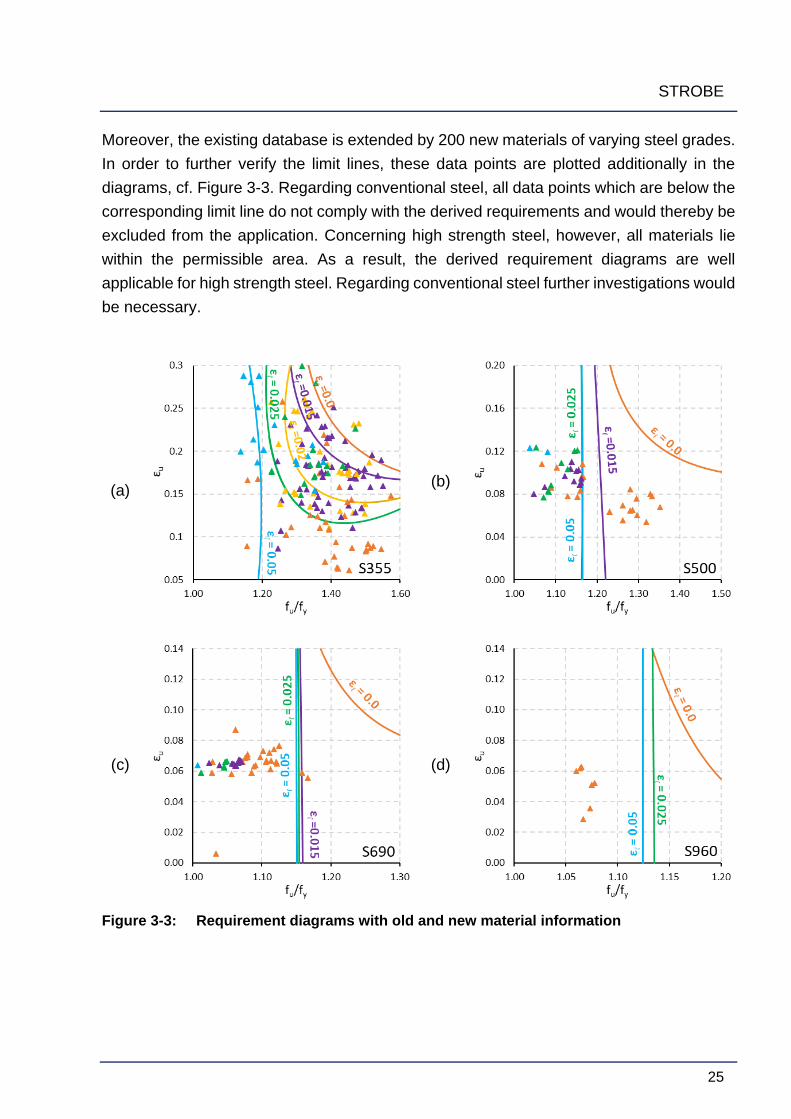
Moreover, the existing database is extended by 200 new materials of varying steel grades.
In order to further verify the limit lines, these data points are plotted additionally in the
diagrams, cf. Figure 3-3. Regarding conventional steel, all data points which are below the
corresponding limit line do not comply with the derived requirements and would thereby be
excluded from the application. Concerning high strength steel, however, all materials lie
within the permissible area. As a result, the derived requirement diagrams are well
applicable for high strength steel. Regarding conventional steel further investigations would
be necessary.
(a)
(b)
(c)
(d)
Figure 3-3: Requirement diagrams with old and new material information
STROBE
26
4 CONCLUSION
The ULS design concept of steel structures according to the EUROCODE 3 is based on load
bearing capacity functions expressed in simplified engineering models which have mainly
been empirically developed on the basis of component tests. Due to high stress and strain
localizations at cross-sectional discontinuities, these specimens require an increased
ductile material behaviour which also depends on sufficient upper-shelf toughness
properties. In order to assure the required redistribution capacity, certain threshold values
regarding the strength properties have been defined in EC3. These simplified ductility
requirements are only based on empirical considerations and have no mechanical
background or relation to the upper-shelf toughness. In order to overcome these
restrictions, the influence of geometric and material (strength and toughness) properties on
the bearing capacity has been investigated within this work package, by applying a modern
damage mechanics concept based on JOHNSON-COOK-model (JC).
Within deliverable D1.1 the derivation of parametric true stress-strain curves, as well as the
model specific damage parameters have already been explained in detail.
Using these model parameters, a parametric study has been conducted in order to analyse
the influence of a broad spectrum of material characteristics on the load bearing capacity.
Within this study, the focus was set on steel components with decisive cross-sectional
discontinuities in terms of sharp notches.
Based on the results of the parametric study, the influence of the strength and toughness
properties on the load bearing capacity was analysed for a centrically notched (CNT)
specimen, followed by the development of a concept for determining mechanically justified
ductility criteria. This concept is based on the derivation of surfaces describing the load-
bearing capacity in terms of the elongation at tensile strength and the yield strength ratio.
Requirements were specified by deriving the intersection lines of these surfaces with the
corresponding net-section resistance function of EC3.
Afterwards the limit lines have been compared with actual material properties of a data
base consisting of 300 data sets. Regarding conventional steel S355, some values did not
comply with the derived requirements and are therefore under some circumstances maybe
problematic for a practical application. Concerning high strength steels, however, all
materials data sets lie within the permissible area. As a result, the derived requirements
are no restriction for HSS.
Finally, the material parameters in terms of true stress-strain and damage curves were
applied to further component geometries. The influence of a concentrated load introduction
as well as the influence of multiple cross-section weakening on the load bearing capacity
STROBE
27
has been analysed. The results illustrate that the simplified engineering model of EC3 used
to determine the net-section bearing capacity does not always adequately describe the
actual component bearing capacity. In most cases, the application of these models leads
to a conservative estimation. However, certain combinations of geometry and material
properties lead to an underestimation of the required load bearing capacity.
STROBE
28
5 REFERENCES
[1] S. Schaffrath, “Analyse des festigkeitsgesteuerten Tragverhaltens ungeschweißter
Stahlbauteile mit Hilfe der Schädigungsmechanik,” Shaker Verlag, Aachen, 2018.
[2] W. Bleck, S. Münstermann, V. Brinnel, M. Feldmann, S. Schaffrath and D. Schäfer, P
950 - Strain based assessment criteria for unfired pressure vessels: Development of
an extended DBF-procedure, 2016.
[3] I. I. f. Welding, Recommendations for assessment of risk of fracture in seismically
affected moment connections, 2002.
[4] M. e. a. Feldmann, Material Choice for Seismic Resistant Structures (MATCH),
Aachen, 2017.
[5] EN 1993-1-1 - Eurocode 3; Design of steel structures – Part 1-1: General rules and
rules for buildings.
[6] EN 1993-1-12 - Eurocode 3: Design of steel structures – Part 1-12: Additional rules for
the extension of EN 1993 up to steel grades S700.
[7] EN 1993-1-8 - Eurocode 3: Design of steel structures – Part 1-8: Design of joints.
[8] B. Eichler, Hochlagenorientierte Werkstoffgütewahl für die plastische Bemessung von
Stahlbauteilen, Aachen: Shaker-Verlag, 2015.
[9] M. Feldmann, S. Schaffrath, W. Bleck, S. Münstermann and V. Brinnel, “Ableitung
neuer, verbesserter Festigkeitskriterien für Stahlbauteile,” Verlag und
Vertriebsgesellschaft mbH, Düsseldorf, 2017.
STROBE
29
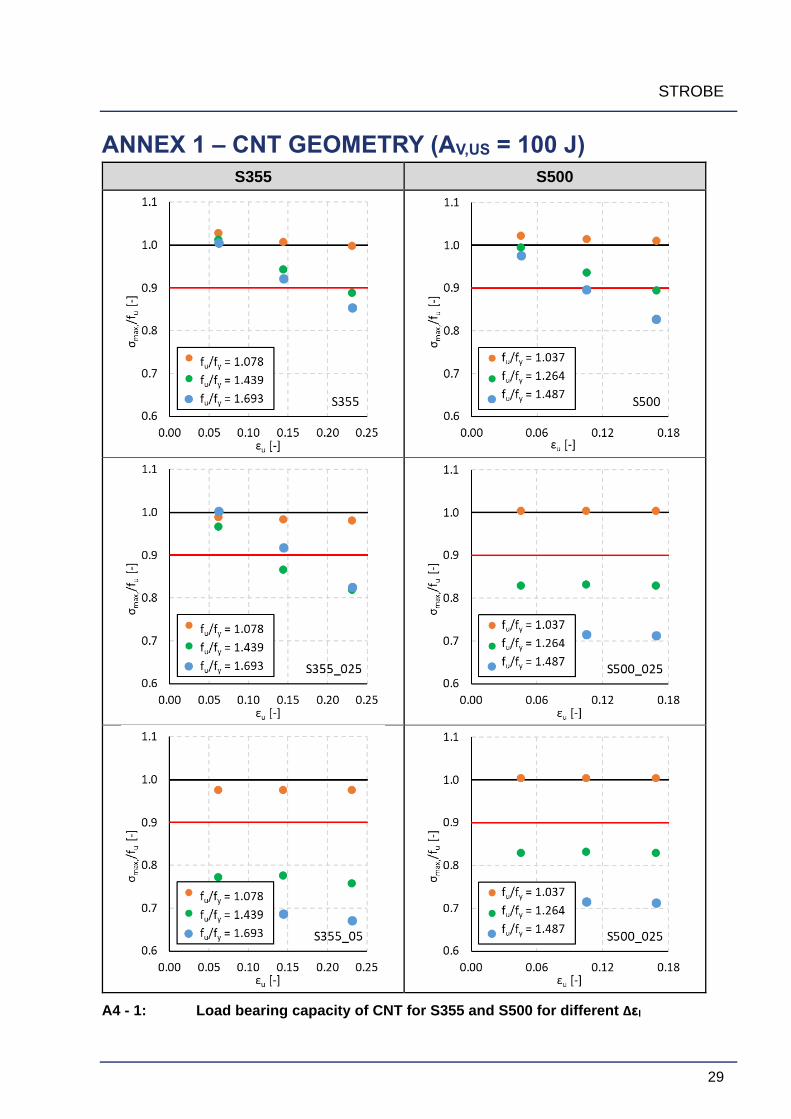
ANNEX 1 – CNT GEOMETRY (AV,US = 100 J)
S355 S500
A4 - 1: Load bearing capacity of CNT for S355 and S500 for different Δεl
STROBE
30
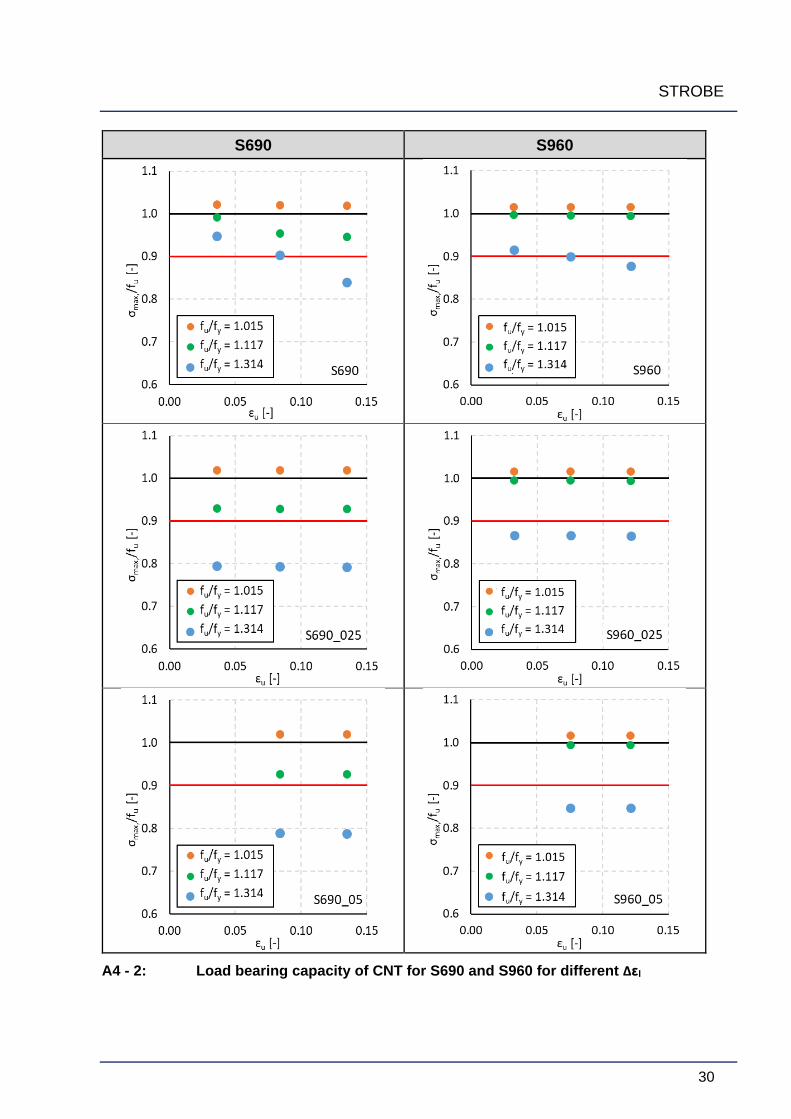
S690 S960
A4 - 2: Load bearing capacity of CNT for S690 and S960 for different Δεl

STROBE
31
ANNEX 2 – CNT+ GEOMETRY (AV,US = 100 J)
S355 S500
A9 - 1: Load bearing capacity of CNT+ compared to CNT for S355 and S960 for
different Δεl
STROBE
32
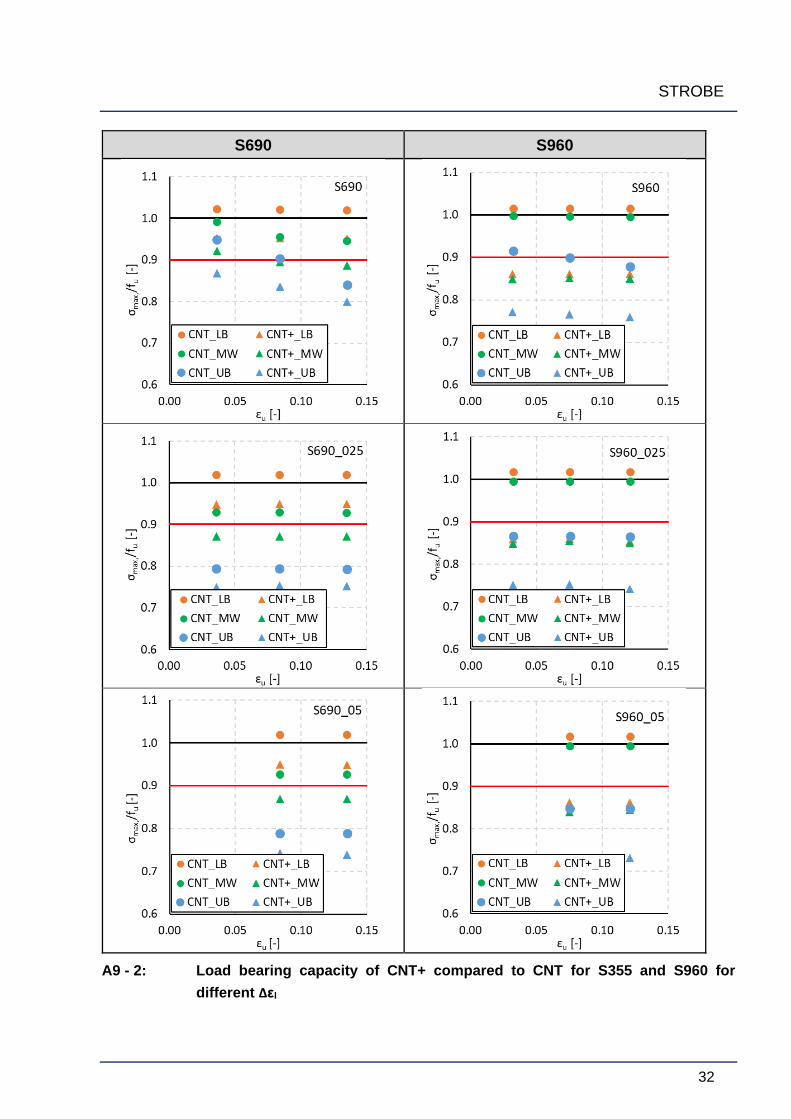
S690 S960
A9 - 2: Load bearing capacity of CNT+ compared to CNT for S355 and S960 for
different Δεl
STROBE
33
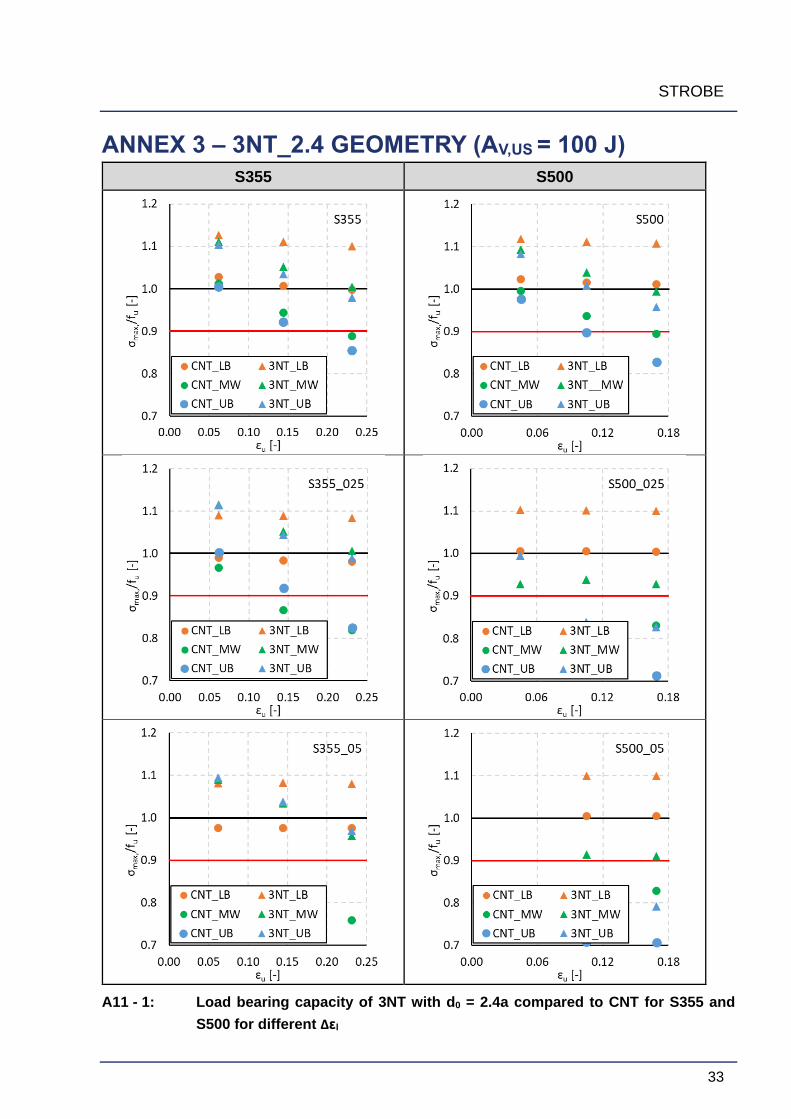
ANNEX 3 – 3NT_2.4 GEOMETRY (AV,US = 100 J)
S355 S500
A11 - 1: Load bearing capacity of 3NT with d0 = 2.4a compared to CNT for S355 and
S500 for different Δεl
STROBE
34
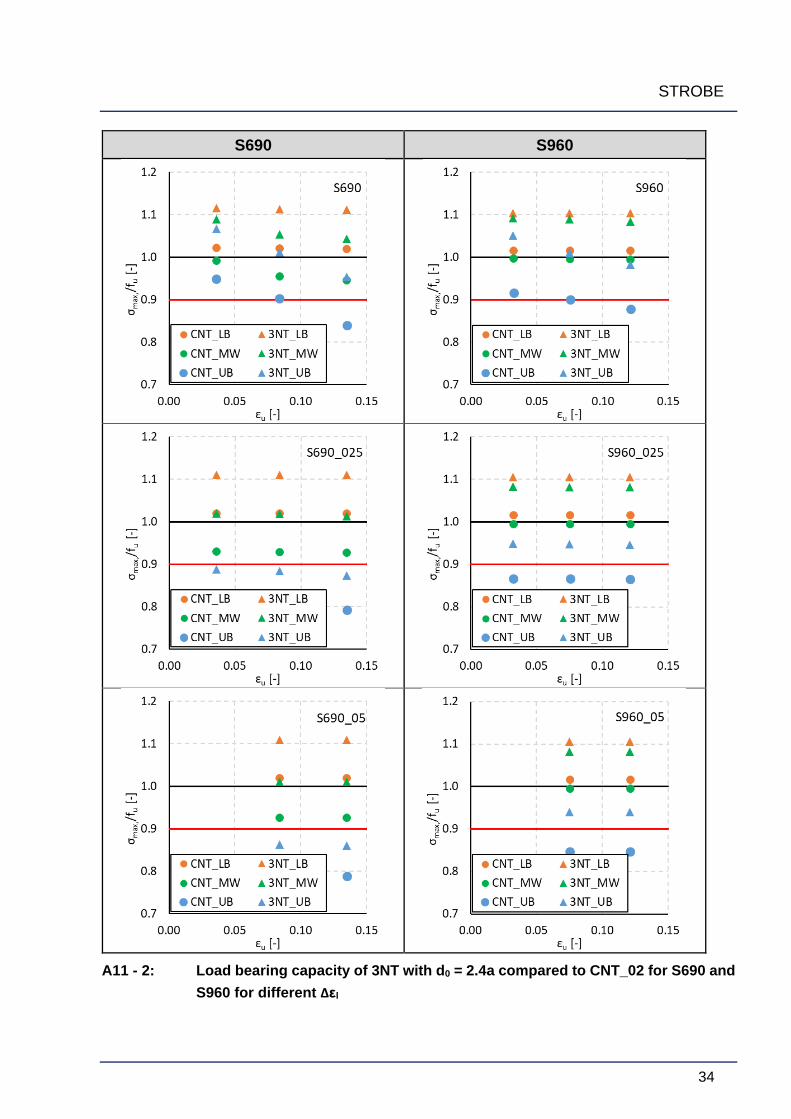
S690 S960
A11 - 2: Load bearing capacity of 3NT with d0 = 2.4a compared to CNT_02 for S690 and
S960 for different Δεl

STROBE
35
ANNEX 4 – 3NT_3.0 GEOMETRY (AV,US = 100 J)
S355 S500
A13 - 1: Load bearing capacity of 3NT with d0 = 3.0a compared to 3NT with d0 = 2.4a for
S355 and S500 for different Δεl
STROBE
36
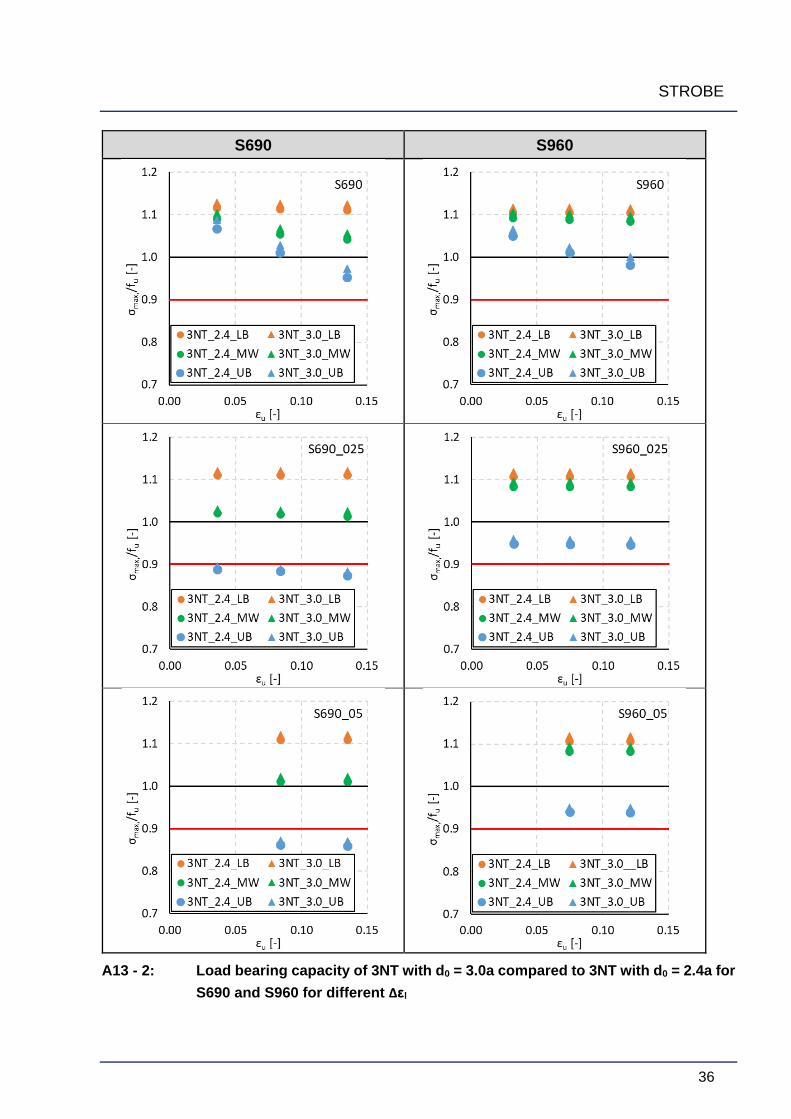
S690 S960
A13 - 2: Load bearing capacity of 3NT with d0 = 3.0a compared to 3NT with d0 = 2.4a for
S690 and S960 for different Δεl