Embed Size (px)
Citation preview
SAS Interim Report November 2016–July 2017 1
STRONG SUMMER LIFTS EARNINGS
MAY 2017–JULY 2017• Income before tax: MSEK 1,973 (1,036)• Income before tax and nonrecurring items: MSEK 1,863 (1,003)• Revenue: MSEK 12,210 (11,133)• EBIT margin: 17.1% (10.4)• Net income for the period: MSEK 1,535 (805) • Earnings per common share: SEK 4.39 (2.17)• The outlook for the full year 2016/2017 has been revised, see page 10.
SIGNIFICANT EVENTS IN MAY–SEPTEMBER 2017• SAS decided to double its target for efficiency measures to SEK 3
billion, with effect in the 2017–2020 period.• Establishment of a new organization at SAS from July 1, 2017.• SAS has received notice of industrial action from September 11,
2017 from the pilot associations in Norway and from September 16, 2017 in Denmark.
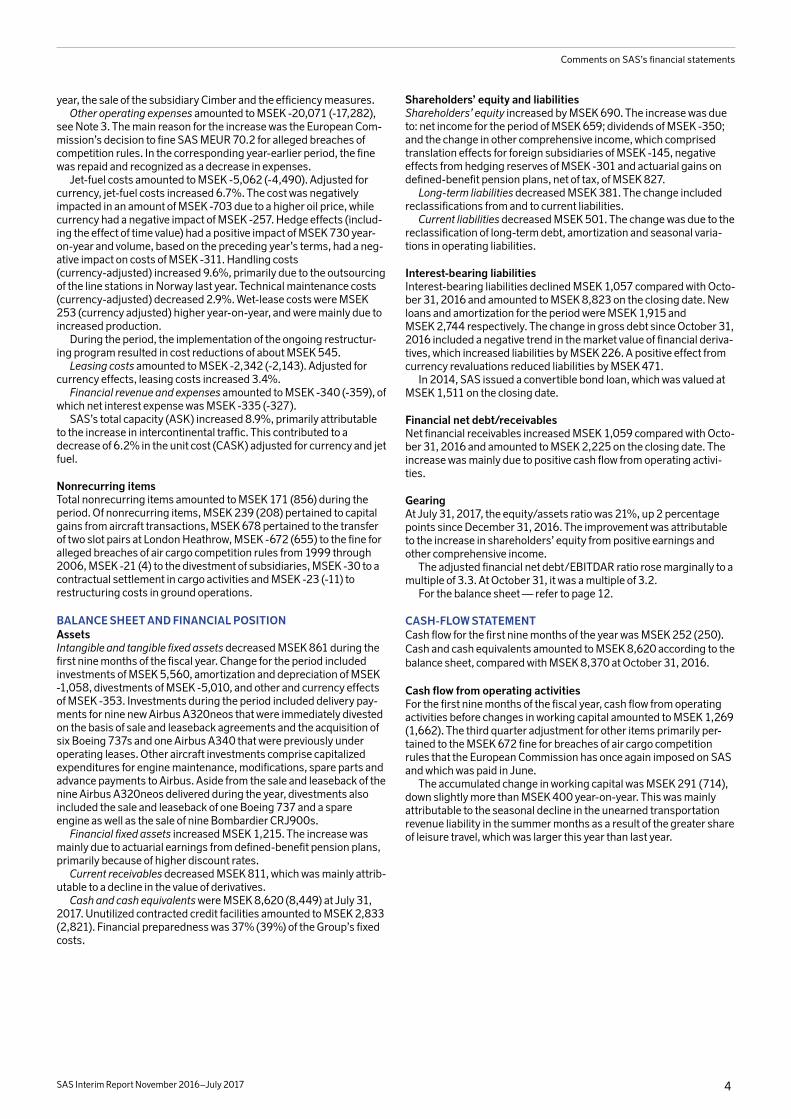
Higher revenue resulted in a significant boost to earnings in the quarter. This is an encouraging trend that motivates our continued change efforts to meet global competition and a volatile macro environment, and to create scope for the neces-sary future operational investments.
Rickard Gustafson, President and CEO
-5.9%UNIT COST VS
PRECEDING YEAR2
+3.4%PASSENGERS VS
PRECEDING YEAR3
-0.4%RASK VS
PRECEDING YEAR1
INCOME AND KEY RATIOS
Key ratios (MSEK) Q3 Q3 Q1–3 Q1–3Rolling
12 monthsRolling
12 months
May–Jul2017
May–Jul2016
Nov–Jul 2016–2017
Nov–Jul 2015–2016
Aug–Jul 2016–2017
Aug–Jul 2015–2016
Revenue 12,210 11,133 31,010 28,324 42,145 39,227
EBIT margin 17.1% 10.4% 4.5% 4.3% 5.0% 6.4%
Income before tax and nonrecurring items 1,863 1,003 897 -2 1,838 1,336
Income before tax, EBT 1,973 1,036 1,068 854 1,645 1,721
Net income for the period 1,535 805 659 730 1,250 1,247
Cash flow from operating activities -27 430 1,560 2,376 2,847 3,809
Jul 31, 2017 Oct 31, 2016 Jul 31, 2016 Jul 31, 2015
Equity/assets ratio 21% 19% 17% 21%
Adjusted financial net debt/EBITDAR, multiple 3.3x 3.2x 2.8x 4.1x
Financial preparedness 37% 41% 39% 35%
Return on invested capital, 12-month rolling 13% 12% 14% 7%
Earnings per common share (SEK), 12-month rolling 2.73 2.94 2.72 -0.67
Shareholders’ equity per common share, SEK 9.21 7.12 4.48 7.95
1) Currency adjusted 2) Currency adjusted and excluding jet fuel 3) Total number of passengers
NOVEMBER 2016–JULY 2017• Income before tax: MSEK 1,068 (854)• Income before tax and nonrecurring items: MSEK 897 (-2)• Revenue: MSEK 31,010 (28,324)• EBIT margin: 4.5% (4.3)• Net income for the period: MSEK 659 (730) • Earnings per common share: SEK 1.20 (1.42)
KEY FIGURES MAY–JULY 2017

Comments by the CEO
SAS Interim Report November 2016–July 2017 2
COMMENTS BY THE CEOSAS delivers a significant year-on-year improvement in earnings in Q3. The improvement was driven by a stronger revenue trend, positive currency effects and implemented efficiency measures. This positive trend motivates our continued extensive transformation efforts to meet global competition and a volatile macro environment, and to create scope for the necessary future operational investments.
SAS operates in a market where airline ticket demand varies substan-tially over the year and where the summer months play an increas-ingly key role in the full-year results as a result of our expanded expo-sure to the leisure market and long-haul routes. It is therefore crucial and satisfying that SAS can look back on a very strong summer. I would like to express my gratitude to all of SAS’s employees and part-ners, who through their dedication, know-how and service, have helped us to conduct more than 75,000 departures, carry almost 30,000 tons of freight and welcome more than 8 million passengers on board.
Income before tax and nonrecurring items amounted to MSEK 1,863 for SAS in Q3. The year-on-year boost in earnings of 85% was driven by increased revenue as a result of more passengers and raised sales of ancillary services. Moreover, earnings were positively impacted by a weaker USD and implemented efficiency measures.
It is gratifying that our investments in continuously developing and expanding our product offering are meeting a favorable response from customers and helped to boost revenue in the quarter. In addi-tion, freight revenue increased by more than 20%. A strong economy and cold summer weather, together with modest capacity growth in Scandinavia also aided the positive earnings trend.
However, capacity will again increase in Scandinavia and, moving forward, many of our competitors are expecting large aircraft deliver-ies and, in parallel, are redeploying their production to their own recently started production companies to meet market price pres-sure. Moreover, I view the proposed Swedish aviation tax with some concern with its attendant risk of undermining profitability and reduc-ing the availability of travel to Sweden — for negligible environmental effects. To meet this development, in June, SAS presented three focus areas which we are now driving forward:1) Further efficiency enhancements to core operations — SEK 3 bil-
lion in efficiency gains by 20202) Establish complementary bases in London and Malaga — starting
at the beginning of the next fiscal year3) Capitalize on the strong SAS brand and 5 million EuroBonus mem-
bers — establish a new company to broaden the revenue base.
COMMERCIAL SUCCESSESSAS continuously develops its offering with a focus on frequent trav-elers to, from and within Scandinavia. Over the last year, we have gradually adjusted our network to better adapt frequencies and desti-nations to customers’ changing year-round demand. In the third quarter of the year, we operated more than 60 seasonal routes and are now offering many new, interesting destinations. This was very positively received by our customers. Leisure route traffic rose more than 15% and, year-on-year, almost 300,000 more passengers trav-eled with SAS during the quarter. The network changes have posi-tively impacted the underlying increase in profitability.
The EuroBonus program is a key component of how we develop and strengthen our customer relationships and provides us with unique knowledge about Scandinavia’s most frequent travelers. During the quarter, the number of members increased by more than 130,000. We have thus passed the five million members milestone — up more than 40% compared with three years ago. On this founda-tion, we are now taking the next step by establishing a new company to create innovative services for our customers aimed at further strengthening loyalty to SAS, broadening the revenue base and increasing financial transparency. Work on establishing the new operations started in the summer and I expect all the pieces to click into place within one year.
We are also continuing to develop our digital sales channels. We are however aware that the user-friendliness of our new website is less than satisfactory and we are working intensively to rectify this. The issue has also led to major challenges for our customer service with, in some cases, unacceptable response times as a consequence. We expect to shortly return to normal service levels and I would like to apologize to those customers afflicted for any inconvenience caused.
EFFICIENCY ENHANCEMENT PROGRAMTo strengthen core operations in Scandinavia and to meet increasing competition and capacity in the market, in June, SAS presented a doubling of the efficiency-enhancement measures to SEK 3 billion with effect in the 2017–2020 period. Around SEK 0.7 billion of these efficiency gains require new agreements with personnel groups. The measures aim to increase productivity and resource utilization across the organization.
The work is being driven at an intensive pace and, during the quarter, the efficiency measures generated a total earnings impact of MSEK 225. Accordingly, we are well on our way toward delivering the SEK 0.7 billion earnings impact planned for the 2016/2017 fiscal year.
In addition to streamlining core operations in Scandinavia, work is ongoing with establishing the complementary bases in London and Malaga. This is to secure the profitability of key traffic flows and actively participate in the growing market with the same preconditions as our competitors. The majority of the administration has been recruited as has some of the flight crew. Preparations are progressing as planned and the first flight is planned for the start of the next fiscal year.
FINANCIAL POSITION AND OUTLOOKSAS’s financial position has improved over the last few years. This remains a prerequisite given ongoing and future aircraft investments, maturing loans and to enable the redemption of the preference shares. Refinancing will create the preconditions to reduce financing costs and various alternatives are actively being evaluated.
As a result of the positive third quarter trend, we are raising our forecast for the 2016/2017 fiscal year, as set out on page 10. In paral-lel, we are entering a period where we will see a lower cabin factor than last year. This is because we are phasing in new Airbus A320neo aircraft with up to 180 seats to replace aircraft with around 120 seats. Initially, we do not expect to fill all of these seats. However, the availability of more seats will have a positive impact when demand increases again next summer.
I am now looking forward to an autumn where we will focus on implementing our efficiency enhancement program, prepare our first flight from the London base and lay the foundation for the company that will broaden our revenue base.
Thank you for following devel-opments at SAS and welcome on board one of our more than 800 daily flights!
Stockholm, September 5, 2017Rickard GustafsonPresident and CEO

SAS Interim Report November 2016–July 2017 3
Comments on SAS’s financial statements
COMMENTS ON SAS’S FINANCIAL STATEMENTS
MARKET AND TRAFFIC TRENDSFollowing high capacity growth in the Scandinavian market in 2015/2016, growth has slowed in 2016/2017. Measured in the num-ber of seats offered, capacity to, from and within Scandinavia increased 2% from November 2016 to July 2017. Capacity growth was largest on routes between Scandinavia and Europe and was equally divided between network airlines and low cost carriers (LCCs). At the same time, the total number of passen-gers rose almost 5%. In the third quarter, the number of passengers rose slightly more than 4.5% and capacity increased around 3.5%. In the forthcoming six-month period, the number of offered seats in the Scandinavian market is expected to increase at a higher pace.
In Q3 2016/2017, SAS’s scheduled traffic, RPK, increased 6.9%. The increase was mainly attributable to SAS opening a new intercon-tinental destination (Miami) compared with last year. Furthermore, SAS increased production of routes to southern Europe, which also contributed to SAS’s traffic growth. Demand in the Swedish market was generally strong. The Norwegian and Danish markets also posted positive growth.
Year-on-year, the currency-adjusted unit revenue (PASK) declined 3.2% in the November 2016 to July 2017 period, and 1.3% in Q3. Unit revenue was negatively impacted by the increased production on SAS’s long-haul routes and on longer, seasonal routes in Europe. The aviation tax introduced in Norway also eroded SAS’s revenues and most was absorbed by SAS through a lower yield. Further details on the traffic trend for SAS are available on page 19.
EARNINGS ANALYSIS MAY 2017–JULY 2017Net income for the periodOperating income was MSEK 2,094 (1,158). Income before tax amounted to MSEK 1,973 (1,036) and income after tax was MSEK 1,535 (805). The tax expense totaled MSEK -438 (-231).
The exchange-rate trend had a positive impact on revenue of MSEK 247 and a negative effect on operating expenses of MSEK -37. Accordingly, the exchange-rate trend had a positive impact on operat-ing income of MSEK 210 and, including net financial items, an impact of MSEK 231.
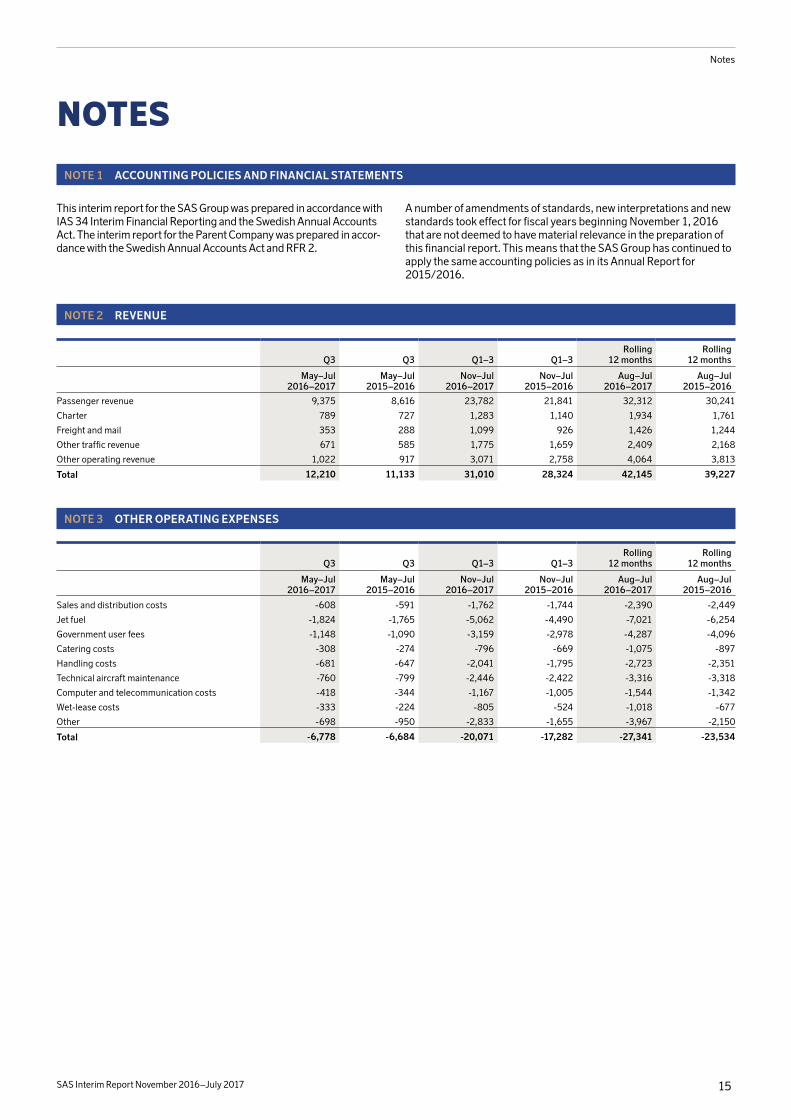
RevenueRevenue totaled MSEK 12,210 (11,133), see Note 2. After adjustment for currency effects, revenue was up MSEK 830 year-on-year. Curren-cy-adjusted passenger revenue rose 6.4%. The increase was a result of higher scheduled capacity (ASK) which, based on the preceding year’s terms, had a positive impact on revenue of MSEK 680. A lower load factor had a negative effect of MSEK -71. Revenue was negatively impacted in an amount of MSEK -48 as a result of the lower yield.
The currency-adjusted revenue from charter and cargo increased 6.6% and 19.3%, respectively. The main reason for these increases was higher volumes. Other traffic revenue (currency-adjusted) rose MSEK 76, mainly due to increased sales of ancillary services.
Other operating revenue (currency-adjusted) climbed MSEK 86, mainly due to increased sales of EuroBonus points and short-term letting of CRJ900s to CityJet.
Operational and financial expensesPayroll expenses amounted to MSEK -2,293 (-2,275) After adjust-ment for currency, payroll expenses declined 1.6% year-on-year. The main reason for the reduction in payroll expenses was the sale of the subsidiary Cimber and the results of efficiency measures.
Other operating expenses amounted to MSEK -6,778 (-6,684), see Note 3. These expenses largely comprised jet fuel, which amounted to MSEK -1,824 (-1,765). Adjusted for currency, jet-fuel costs declined 1.3%. The cost was negatively impacted in an amount of MSEK -105 due to a higher oil price, while currency had a negative
impact of MSEK -84. Hedge effects (including the effect of time value) had a positive impact of MSEK 233 year-on-year and volume, based on the preceding year’s terms, had a negative impact on costs of MSEK -95. Handling costs (currency-adjusted) rose 2.3%. Technical maintenance costs (currency-adjusted) decreased 8.0%. This decrease was mainly attributable to SAS having high costs in the cor-responding year-earlier quarter due to more extensive maintenance, provisions for return requirements on leased aircraft and changed assessments for future engine maintenance. Wet-lease costs were MSEK 98 (currency adjusted) higher for the quarter year-on-year, and were mainly due to increased production.
During the period, the implementation of the ongoing restructur-ing program resulted in cost reductions of about MSEK 225.
Leasing costs amounted to MSEK -808 (-737). Adjusted for cur-rency effects, leasing costs increased 4.7%.
Financial revenue and expenses amounted to MSEK -121 (-122), of which net interest expense was MSEK -129 (-113).
SAS’s total capacity (ASK) increased 7.5%, primarily attributable to the increase in intercontinental traffic and leisure routes in Europe. This was the main reason for the decrease of 5.9% in the unit cost (CASK), adjusted for currency and jet fuel.
Nonrecurring itemsTotal nonrecurring items amounted to MSEK 110 (33) during the period. Of nonrecurring items, MSEK 110 (33) pertained to capital gains from aircraft transactions.
EARNINGS ANALYSIS NOVEMBER 2016–JULY 2017Net income for the periodOperating income was MSEK 1,407 (1,212). Income before tax amounted to MSEK 1,068 (854) and income after tax was MSEK 659 (730). The tax expense totaled MSEK -409 (-124) and the relatively high cost for the period was primarily attributable to the European Commission’s fine not being tax deductible.
The exchange-rate trend had a positive impact on revenue of MSEK 922 and a negative effect on operating expenses of MSEK -778. Accordingly, the exchange-rate trend had a positive impact on operat-ing income of MSEK 144 and, including net financial items, an impact of MSEK 177.
RevenueRevenue totaled MSEK 31,020 (28,324), see Note 2. After adjust-ment for currency effects, revenue was up MSEK 1,764 year-on-year. Currency-adjusted passenger revenue rose 5.4%. The increase was a result of higher scheduled capacity (ASK) which, based on the pre-ceding year’s terms, had a positive impact on revenue of MSEK 3,756. A higher load factor had a positive impact of MSEK 338. Revenue was negatively impacted in an amount of MSEK -2,958 as a result of the lower yield.
The currency-adjusted revenue from charter and cargo increased 9.6% and 14.4%, respectively. The main reason for these increases was higher volumes.
Other traffic revenue (currency-adjusted) rose MSEK 74. The increased sales of ancillary services had a positive effect on other traf-fic revenue.
Other operating revenue (currency-adjusted) climbed MSEK 231, mainly due to increased sales of EuroBonus points and short-term letting of CRJ900s to CityJet.
Operational and financial expensesPayroll expenses amounted to MSEK -7,016 (-6,920) After adjust-ment for currency and restructuring costs, payroll expenses declined 2.3% year-on-year. The main reasons for the reduced payroll expenses were the outsourcing of the line stations in Norway last
SAS Interim Report November 2016–July 2017 4
Comments on SAS’s financial statements
year, the sale of the subsidiary Cimber and the efficiency measures. Other operating expenses amounted to MSEK -20,071 (-17,282),
see Note 3. The main reason for the increase was the European Com-mission’s decision to fine SAS MEUR 70.2 for alleged breaches of competition rules. In the corresponding year-earlier period, the fine was repaid and recognized as a decrease in expenses.
Jet-fuel costs amounted to MSEK -5,062 (-4,490). Adjusted for currency, jet-fuel costs increased 6.7%. The cost was negatively impacted in an amount of MSEK -703 due to a higher oil price, while currency had a negative impact of MSEK -257. Hedge effects (includ-ing the effect of time value) had a positive impact of MSEK 730 year-on-year and volume, based on the preceding year’s terms, had a neg-ative impact on costs of MSEK -311. Handling costs (currency-adjusted) increased 9.6%, primarily due to the outsourcing of the line stations in Norway last year. Technical maintenance costs (currency-adjusted) decreased 2.9%. Wet-lease costs were MSEK 253 (currency adjusted) higher year-on-year, and were mainly due to increased production.
During the period, the implementation of the ongoing restructur-ing program resulted in cost reductions of about MSEK 545.
Leasing costs amounted to MSEK -2,342 (-2,143). Adjusted for currency effects, leasing costs increased 3.4%.
Financial revenue and expenses amounted to MSEK -340 (-359), of which net interest expense was MSEK -335 (-327).
SAS’s total capacity (ASK) increased 8.9%, primarily attributable to the increase in intercontinental traffic. This contributed to a decrease of 6.2% in the unit cost (CASK) adjusted for currency and jet fuel.
Nonrecurring itemsTotal nonrecurring items amounted to MSEK 171 (856) during the period. Of nonrecurring items, MSEK 239 (208) pertained to capital gains from aircraft transactions, MSEK 678 pertained to the transfer of two slot pairs at London Heathrow, MSEK -672 (655) to the fine for alleged breaches of air cargo competition rules from 1999 through 2006, MSEK -21 (4) to the divestment of subsidiaries, MSEK -30 to a contractual settlement in cargo activities and MSEK -23 (-11) to restructuring costs in ground operations.
BALANCE SHEET AND FINANCIAL POSITION AssetsIntangible and tangible fixed assets decreased MSEK 861 during the first nine months of the fiscal year. Change for the period included investments of MSEK 5,560, amortization and depreciation of MSEK -1,058, divestments of MSEK -5,010, and other and currency effects of MSEK -353. Investments during the period included delivery pay-ments for nine new Airbus A320neos that were immediately divested on the basis of sale and leaseback agreements and the acquisition of six Boeing 737s and one Airbus A340 that were previously under operating leases. Other aircraft investments comprise capitalized expenditures for engine maintenance, modifications, spare parts and advance payments to Airbus. Aside from the sale and leaseback of the nine Airbus A320neos delivered during the year, divestments also included the sale and leaseback of one Boeing 737 and a spare engine as well as the sale of nine Bombardier CRJ900s.
Financial fixed assets increased MSEK 1,215. The increase was mainly due to actuarial earnings from defined-benefit pension plans, primarily because of higher discount rates.
Current receivables decreased MSEK 811, which was mainly attrib-utable to a decline in the value of derivatives.
Cash and cash equivalents were MSEK 8,620 (8,449) at July 31, 2017. Unutilized contracted credit facilities amounted to MSEK 2,833 (2,821). Financial preparedness was 37% (39%) of the Group’s fixed costs.
Shareholders’ equity and liabilitiesShareholders’ equity increased by MSEK 690. The increase was due to: net income for the period of MSEK 659; dividends of MSEK -350; and the change in other comprehensive income, which comprised translation effects for foreign subsidiaries of MSEK -145, negative effects from hedging reserves of MSEK -301 and actuarial gains on defined-benefit pension plans, net of tax, of MSEK 827.
Long-term liabilities decreased MSEK 381. The change included reclassifications from and to current liabilities.
Current liabilities decreased MSEK 501. The change was due to the reclassification of long-term debt, amortization and seasonal varia-tions in operating liabilities.
Interest-bearing liabilitiesInterest-bearing liabilities declined MSEK 1,057 compared with Octo-ber 31, 2016 and amounted to MSEK 8,823 on the closing date. New loans and amortization for the period were MSEK 1,915 and MSEK 2,744 respectively. The change in gross debt since October 31, 2016 included a negative trend in the market value of financial deriva-tives, which increased liabilities by MSEK 226. A positive effect from currency revaluations reduced liabilities by MSEK 471.
In 2014, SAS issued a convertible bond loan, which was valued at MSEK 1,511 on the closing date.
Financial net debt/receivables Net financial receivables increased MSEK 1,059 compared with Octo-ber 31, 2016 and amounted to MSEK 2,225 on the closing date. The increase was mainly due to positive cash flow from operating activi-ties.
Gearing At July 31, 2017, the equity/assets ratio was 21%, up 2 percentage points since December 31, 2016. The improvement was attributable to the increase in shareholders’ equity from positive earnings and other comprehensive income.
The adjusted financial net debt/EBITDAR ratio rose marginally to a multiple of 3.3. At October 31, it was a multiple of 3.2.
For the balance sheet — refer to page 12.
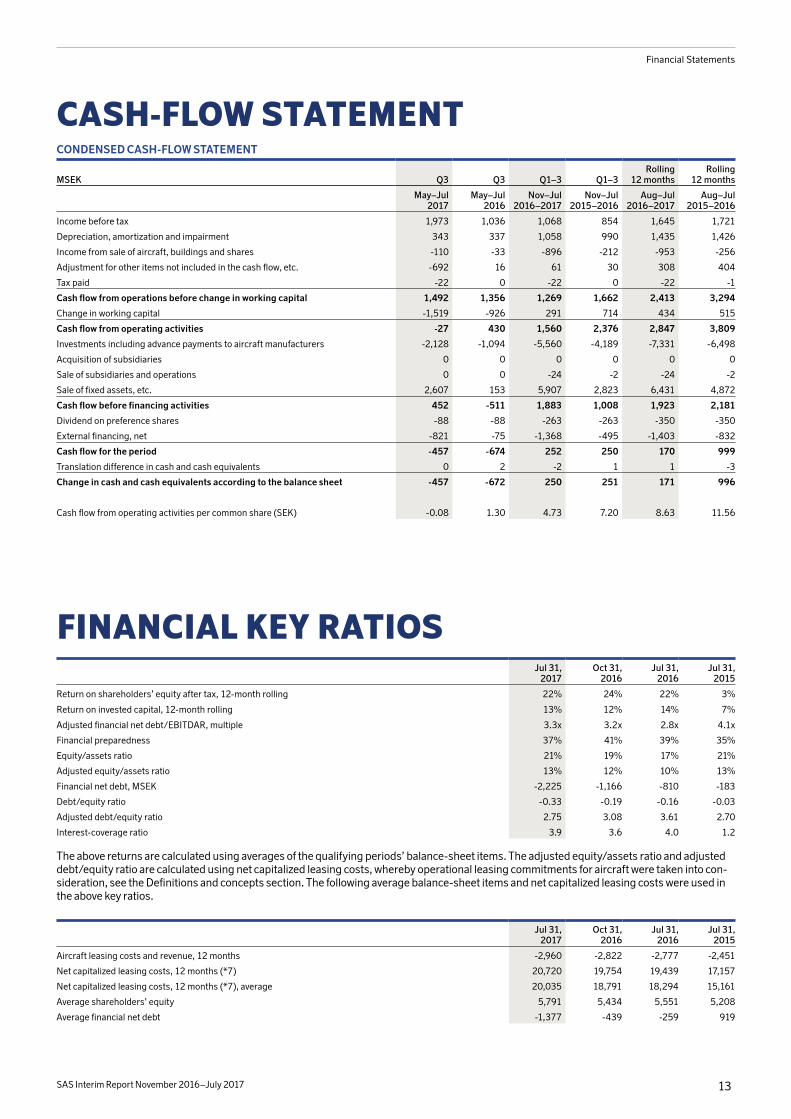
CASH-FLOW STATEMENTCash flow for the first nine months of the year was MSEK 252 (250). Cash and cash equivalents amounted to MSEK 8,620 according to the balance sheet, compared with MSEK 8,370 at October 31, 2016.
Cash flow from operating activitiesFor the first nine months of the fiscal year, cash flow from operating activities before changes in working capital amounted to MSEK 1,269 (1,662). The third quarter adjustment for other items primarily per-tained to the MSEK 672 fine for breaches of air cargo competition rules that the European Commission has once again imposed on SAS and which was paid in June.
The accumulated change in working capital was MSEK 291 (714), down slightly more than MSEK 400 year-on-year. This was mainly attributable to the seasonal decline in the unearned transportation revenue liability in the summer months as a result of the greater share of leisure travel, which was larger this year than last year.

SAS Interim Report November 2016–July 2017 5
Comments on SAS’s financial statements
Investing activitiesInvestments totaled MSEK 5,560 (4,189) of which MSEK 5,467 (3,987) pertained to aircraft. These included delivery payments for nine new Airbus A320neos that were immediately divested on the basis of sale and leaseback agreements and the purchase of six Boe-ing 737s and one Airbus A340 that were previously under operating leases. Other aircraft investments comprised capitalized expendi-tures for engine maintenance, modifications, spare parts and advance payments to Airbus.
In January, the subsidiary Cimber was divested, which had a nega-tive impact on the Group’s cash and cash equivalents of MSEK 24.
The divestment of fixed assets concerns the sale and leaseback of the nine Airbus A320neos and one spare engine acquired during the period and one Boeing 737. Moreover, nine Bombardier CRJ900s were sold. In addition, MSEK 678 was received for the slot pairs at London Heathrow that were divested by SAS in March.
Financing activitiesCash flow before financing activities was MSEK 1,883 (1,008).
New loans for the period amounted to MSEK 1,915 (635), while repayments totaled MSEK 2,744 (903). In addition, cash flow from financing activities was negatively impacted by financial derivatives and increased deposits for aircraft and pensions in blocked accounts.
For the cash-flow statement — refer to page 13.
SEASONAL VARIATIONSDemand, measured as revenue passenger kilometers (RPK), in SAS’s markets is seasonally low from November to April and at its peak from May to October. However, the share of advance bookings is greatest from January to May, which has a positive effect on working capital.
Seasonal fluctuations in demand impact cash flow and earnings differently. Passenger revenue is recognized when customers actu-ally travel, while cash flow is positively impacted during months in which bookings increase. This means increased revenue in the high-traffic months from May to October. Since a substantial share of an airline’s costs is fixed, earnings are impacted by fluctuations in rev-enue levels.
As traffic is lower in the November to April period, the first and sec-ond quarters are seasonally the weakest quarters in terms of earnings in SAS’s fiscal year. However, cash flow from operating activities is seasonally weak in the first and third quarters.
FINANCIAL TARGETS SAS’s overriding goal is to create shareholder value. To reach this goal, SAS pursues three strategic priorities to meet trends and indus-try developments, to ensure competitiveness and to provide the pre-requisites for long-term sustainable profitability.
We operate in a capital-intensive industry that requires optimization of the capital structure. We therefore introduced two financial targets in June 2017, which pertain to profitability/return and to gearing in relation to SAS’s total capital. In parallel, we updated the financial pre-paredness target.
SAS’s financial targets are:• Return on invested capital (ROIC): to exceed 12% measured over a
business cycle.• Adjusted financial net debt/EBITDAR: to be a multiple of less than
three (3x).• Financial preparedness: cash and cash equivalents and available
credit facilities must exceed 25% of SAS’s annual fixed costs.
The ROIC target corresponds with the capital markets’ and SAS’s internal assessment of SAS’s weighted average cost of capital (WACC). This is also linked to SAS’s dividend policy for holders of common shares, which stipulates that dividends can be paid when value is created through SAS’s ROIC exceeding its WACC.
Gearing target — adjusted financial net debt/EBITDAR is a key ratio used by credit rating agencies and banks for assessing credit-worthiness and includes the value of leased aircraft. The aim with maintaining a ratio with a multiple of less than three (3x) is aligned with SAS’s ambition of improving the financial position and credit rat-ing, and thereby lowering financing costs.
In June 2017, SAS also raised the financial preparedness target from 20% to 25% of annual fixed costs. The reason for the above is SAS’s increased production on long-haul routes and leisure routes, where the proportion of advance bookings is larger. This leads to an increase in obligations to customers for SAS, which should be reflected in the liquidity reserve.
Considerable uncertainty continues in the macro environment with regard to exchange-rate trends, jet-fuel prices and changes within the European airline industry, with intensified competition, which means that SAS is not setting a date for reaching these targets. However, the aim is to reach the targets in a medium-term horizon. The targets depend on the structural measures being fully implemented. In con-junction with the transition to IFRS 16 from 2019, under which the lessee recognizes an asset (the right to use an asset) and a financial liability in the balance sheet, SAS will review the targets to ensure their continued relevance.
EVENTS AFTER JULY 31, 2017• SAS has received notice of industrial action from September 11,
2017 from the pilot associations in Norway and from September 16, 2017 in Denmark.
FINANCIAL PREPAREDNESSSAS has a target for financial preparedness, which is to exceed 25% of annual fixed costs. At July 31, the financial preparedness was 37%.
FINANCIAL PREPAREDNESS, %
ADJUSTED FINANCIAL NET DEBT/ EBITDAR, MULTIPLESAS has a target for the adjusted financial net debt/EBITDAR ratio to be a multiple of less than three. At July 31, the ratio was 3.3x.
RETURN ON INVESTED CAPITAL (ROIC)SAS has a target for the return on invested capital (ROIC) to exceed 12% measured over a business cycle. Over the last 12 months up until the third quarter, ROIC was 13%.
ADJUSTED FINANCIAL NET DEBT/EBITDAR, MULTIPLE
ROIC, 12-MONTH ROLLING, %
Q3 - 2016
Q4 - 2016
Q1 - 2017
Q2 - 2017
Q3 - 2017
0
10
20
30
40
50
39 41
3337 37
0
1
2
3
4
5
2.8x
3,5x
3.2x
4.0x
3.3x
Q3 - 2016
Q4 - 2016
Q1 - 2017
Q2 - 2017
Q3 - 2017
3.4x
0
5
10
15
20
14 1210 9
13
Q3 - 2016
Q4 - 2016
Q1 - 2017
Q2 - 2017
Q3 - 2017
TargetTargetTarget

SAS Interim Report November 2016–July 2017 6
Strategic priorities for SAS
STRATEGIC PRIORITIES FOR SAS
SAS focuses on people who travel frequently to, from and within Scandinavia. Focusing on this target group, we work with three strategic priority areas to strengthen competitiveness and to meet the challenges in the industry.
WIN SCANDINAVIA’S FREQUENT TRAVELERS
SALES VIA DIGITAL CHANNELS Q3 FY17 VS Q3 FY16
+4%
EUROBONUS MEMBERSHIP TREND
Q3 FY17 VS Q3 FY16
+11%
SAS PLUS AND BUSINESS REVENUE Q3 FY17 VS Q3 FY16
+7%The most frequent travelers are also the most demanding in terms of a smooth travel experience and that we take care of their time in the best possible way. This is the driving force when we develop our cus-tomer offering in order to strengthen our position as the first choice for Scandinavia’s frequent travelers.
Digitalization is a key element of the strategy and entails possibili-ties to simplify processes for the customer, to offer time-saving ser-vices as well as to enhance the efficiency of our internal processes. We are therefore investing in an upgrade of our IT platform, which aims to enhance the customer experience and manage the lower unit revenue trend. By developing new ancillary services, we can offer a more clearly differentiated product and a more tailored offering. SAS’s new website and app will continue to be developed and will comprise key sales channels for the above.
At the start of 2016/2017, SAS launched the new website in the Scandinavian market. It is based on a modern IT platform, which is a precondition for the development of new services and customer enhancements. However, the user-friendliness of the new website is as yet less than satisfactory and we are working intensively to rectify this based on customer feedback. The new platform enables us, for exam-ple, to more simply and rapidly add new services and products that are in demand by our customers. In late spring, we also changed the IT platform for our EuroBonus program, which will allow us to further expand the program and launch improvements for our customers.
EuroBonus, which celebrated 25 years in spring 2017, is at the core of strengthening relationships and loyalty between SAS and its customers. The loyalty program now has more than 5 million mem-bers and the number of members increased by more than 130,000 in the third quarter. EuroBonus provides us with unique knowledge about our customers’ travel patterns and their wishes — areas we intend to become even better at meeting.
Over the last few years, we have increasingly made seasonal adap-tations to our network in line with customers’ changed travel pat-terns. This was illustrated during the quarter by our substantial pro-duction increase in leisure routes, primarily to Southern Europe. The capacity of our leisure routes was almost twice as high in July than for an average month in the second quarter. This is appreciated by our customers and in the third quarter, there was a 15% year-on-year increase in passenger numbers on our seasonal routes. We achieved this through increased productivity and redeployment of the larger aircraft, from Scandinavia to leisure destinations, where demand was greatest. Our wet-lease production means we were also able to main-tain our frequencies in Scandinavia.
As part of efforts to improve the travel experience, we are investing in our aircraft fleet. In Q3 2016/2017, four Airbus A320neos were deliv-ered. We will also upgrade our existing aircraft with new cabin interi-ors and the first aircraft with high-speed Wi-Fi will enter service in the autumn.
In May 2017, to meet the wishes of our primary target group, we launched New Nordic by SAS, a new innovative concept for food and drink where we focus on functionality and locally produced high qual-ity ingredients as well as on more and improved choices. The concept has been created in consultation with SAS’s customers and cabin crew, and was well received.
We have also invested over the last few years in SAS lounges in Stockholm, Gothenburg and Oslo to further adapt the customer offer-ing and increase its relevance for our passengers. As a continuation of the above, we are now focusing on international lounges and, in sum-mer 2017, expanded and improved the SAS lounge in New York. The lounges in Chicago and Paris will also be enhanced.
Investments in the customer offering are appreciated by custom-ers and SAS has also received a number of independent awards including first place in the categories: “Best airline in Europe” and “Best Domestic Transportation” at the Grand Travel Awards in Swe-den. SAS has also been crowned the business traveler’s choice with wins at the Business Travel Awards: “Best Domestic Transportation” and “Best International Airline.”
New growth initiativesEuroBonus provides us with unique knowledge about Scandinavia’s most frequent travelers and their preferences. The last few years’ invest-ments in our customer offering and EuroBonus improvements have contributed to the 1.5 million increase in the number of program mem-bers over the last two years and we now have five million members.
In the third quarter, we initiated work on establishing a new com-pany, which will develop new services and create new growth initia-tives and shareholder value. Work started in the summer and we expect all the pieces to click into place within one year. The aim of the new company is to:• Strengthen core operations: Based on the five million members of
EuroBonus, we will use CRM and big data analyses to create offer-ings that, together with new partners, broaden and strengthen loy-alty to SAS.
• Create new growth initiatives: We will increase revenue by continuing the development of existing business models, including more credit cards linked to EuroBonus and other partnerships. Through new business models based on the sale of EuroBonus points and differ-ing forms of commission, we can broaden our offering to include package holidays, conferences and other types of experience.
• Increase financial transparency: The new independent company will demonstrate the value of the loyalty program and our customer data.
Moving forward, we aim to considerably increase our other cus-tomer revenue.
WIN SCANDINAVIA’S FREQUENT TRAVELERS
CREATE AN EFFICIENT OPERATING PLATFORM
SECURE THE RIGHT CAPABILITIES

SAS Interim Report November 2016–July 2017 7
Strategic priorities for SAS
CREATE AN EFFICIENT OPERATING PLATFORM
PRODUCTIVITY: AIRCRAFT
Q3 FY17 VS Q3 FY16
+4%
PRODUCTIVITY: PILOTS
Q3 FY17 VS Q3 FY16
+4%
PRODUCTIVITY: CABIN CREW
Q3 FY17 VS Q3 FY16
+8%SAS works continuously to enhance the efficiency of the operational platform and in the 2013–2016 period improved operational effi-ciency by SEK 4.3 billion. In the third quarter of 2016/2017, the earn-ings impact from efficiency enhancements was MSEK 225 and con-tributed to a 5.9% fall in the currency-adjusted unit cost, excluding jet fuel. Aircraft productivity continued to rise as a result of increased production on long-haul routes and European leisure routes. Follow-ing a decline in flight crew productivity in winter 2016/2017, as planned, pilot and cabin crew productivity improved year-on-year in Q3, mainly due to flying longer distances.
Operating environmentThe airline industry is undergoing changes that continuously set new requirements for all participants. One major challenge for the indus-try and for SAS is the trend of declining unit revenue and willingness to pay for air travel. Many of SAS’s competitors are receiving large air-craft deliveries in the coming years, in parallel with an increasing number of airlines redeploying their production to their own start-up production companies — not just in Europe — but also on interconti-nental routes. Moreover, personnel are increasingly sourced from manning companies with the aim of creating more flexible produc-tion. Many network airlines are also simplifying their core offering and lowering prices even further, at the same time as customers are being offered more ancillary services. Together, this indicates that pressure on yield will continue.
In addition, Norway introduced a national aviation tax in 2016 and the introduction of a similar tax has been proposed in Sweden. These will generate marginal environmental effects but threaten to under-mine profitability, since the intense competition in the industry means the airlines will have to absorb the tax and will be unable to corre-spondingly raise ticket prices. This could therefore have a consider-able negative impact on Scandinavian airlines that already suffer from inadequate profitability and face intense international pressure.
In parallel with the above, the air travel market is growing — pri-marily leisure travel and the intercontinental markets. With SAS’s extensive network, frequent departures and substantial customer base, SAS holds a strong market position in Scandinavia. Provided SAS can improve its efficiency, we have major possibilities for leverag-ing market growth, not least in terms of leisure travel in Europe, where SAS currently has a low market share.
Efficiency enhancement programWe are working on implementing an efficiency enhancement pro-gram for our core operations based in Scandinavia to meet develop-ments in our operating environment. We have identified a total of more than 200 new initiatives that together mean we can realize effi-ciency gains of SEK 3 billion for SAS, with effect in the 2017–2020 period. The actions are measured in gross amounts and before infla-tion effects. Around SEK 0.7 billion of these gains require changed agreements with personnel groups. Several of the initiatives also depend on changed agreements with suppliers. These measures encompass the entire organization.
EARNINGS IMPACT (SEK BILLION)
2016/2017Achievedto date
2017/2018 2018/2019 2019/20200,0
3,0
0,7
0,54
0,9
1,0
0,4
Overview of efficiency enhancement program
MSEK Target Realized
Flight operations, incl. wet lease, government user fees and jet fuel
1,200 190
Ground Handling & technical maintenance
900 180
Commercial functions 500 35
Administration, Facility, Support and IT 400 140
A few examples of the efficiency enhancement measures we are working on in the program:
Flight operations, incl. wet lease, government user fees and jet fuel. The aim is to increase productivity by measures including better adaptation of resources to seasonal variations and by reducing staff-ing on our charter and long-haul flights. We can achieve this through more flexible planning and new scheduling, by adjusting our network and through increased use of a resource pool for cabin crew. The roll-out of iPads to flight crew means we can raise productivity through strong internal communication and simplified check-in procedures. In addition, in the short and long terms, we will work on balancing the age demographics among staff.
Ground handling operations and technical maintenance. In Ground Handling, we are working on improving planning and broadening work duties as well as renegotiating agreements with our sub-con-tractors. Moreover, we will streamline processes and raise quality in terms of irregularity management, which is also a key parameter for customer satisfaction. We will achieve efficiency enhancements in technical maintenance by implementing Lean across the technical areas, which will generate productivity and quality improvements. In addition, we will change scheduling and renegotiate sub-contractor agreements for heavy maintenance, including engine maintenance. A changed and centralized organization will enable us to achieve syner-gies between countries and thereby reduce administrative technical resources.
Commercial functions. To ensure that we offer what customers want most, we will simplify the base offering and expand options by adding more ancillary services. These will help us partially compen-sate for the pressure on unit revenue. SAS Go Light will also be expanded to more markets to strengthen competitiveness in the lower price segment. We will also continue efforts to lower SAS’s dis-tribution and credit card expenses as well as further decrease logis-tics costs for our on-board service. We will also streamline the back office and customer center functions.
Administration, Facility, Support and IT. We will streamline internal processes, through measures including enhancing systems support for network planning, general staffing reductions and reducing the number of consulting hours. At the same time as we are developing and investing in IT in terms of our digitalization, we will simplify our infrastructure, optimize the use of our licenses and transform legacy platforms into modern cloud services.
Examples of measures that have generated MSEK 225 in the quarter:
• Outsourcing of Cimber to CityJet.
• Reduced manning with cabin crew on intercontinental routes and increased use of the resource pool.
• Improved planning with fewer administration days for pilots.
• Continued implementation of Lean in technical maintenance in Copenhagen and Stockholm.
• New agreement covering property-related services.
• Improved planning at Ground Handling, whereby individual employees perform more duties.
• Optimization of engine maintenance.

SAS Interim Report November 2016–July 2017 8
Strategic priorities for SAS
Restructuring costsThe efficiency program is expected to result in restructuring costs and non-recurring items amounting to about SEK 1 billion in the 2017–2019 period. The restructuring costs relate to personnel, orga-nizational changes in the administration and the termination of prop-erty agreements. Other non-recurring expenses mainly relate to the development of IT systems.
Bases outside ScandinaviaAll of SAS’s competitors on traffic flows to and from Europe use almost exclusively crew based in EU countries outside of Scandinavia and as a result have a lower total cost for labor. If SAS is to secure the long-term profitability of key traffic flows and actively participate in the growing market, SAS must have the same preconditions. Other-wise, SAS will be forced to reduce its production and discontinue routes.
In parallel with the implementation of the efficiency enhancements in our core operations, in January 2017, SAS decided to establish a new air operator certificate (AOC) in Ireland. We have decided to establish bases in London and Malaga, where a total of nine Airbus A320neos will be deployed, starting in the 2017–2018 period.
The bases will complement our production in Scandinavia, which will continue to account for the main share of our business. We have now established a structure for SAS Ireland, applied for a new AOC in Ireland and recruited the management team for the airline. In Q3, we also recruited most of the administrative staff and some of the flight crew. The first flight is planned for the start of the next fiscal year.
Start-up costs for the new AOC and the new bases are expected to impact earnings to begin with and have been very low to date. Initially, the financial effects from operations at these bases will be small, but will gradually increase as operations grow. When the bases are fully operational, we expect them to have the same underlying unit cost as our low cost competitors.
SECURE THE RIGHT CAPABILITIES
SICK LEAVE Q3 FY17 VS Q3 FY16
-6%
EMPLOYEES Q3 FY17 VS Q3 FY16
-4%
CARBON DIOXIDE/ PASSENGER KILOMETER
Q3 FY17 VS Q3 FY16
-1%New organizationOn July 1, 2017, we established a new organization with the following objectives to create the right preconditions for implementing the structural measures:• to ensure delivery of the efficiency measures until 2020;• to increase internal transparency and ownership; and• to create the preconditions for identifying new growth initiatives and
broadening the revenue base.
In the new organization, the commercial organization will be split into two parts: Product, Network & Revenue will develop and maintain our products and network, while Sales & Marketing will optimize sales. In Operations, which delivers SAS’s products, a clearer division will be made between the various production platforms to ensure that pro-duction units are measured in an equivalent manner. IT and digital development will be merged into one unit with overall responsibility for SAS to secure the necessary preconditions for initiatives/projects that depend on IT and digitalization. We are also establishing a new independent company, currently named SAS Growth Initiatives, with a focus on strengthening loyalty to SAS and creating new growth ini-tiatives based on the strong SAS brand and EuroBonus.
As a result of the new organization, changes have been made in SAS Group Management. On July 1, 2017, Annelie Nässén took up her position as the new Executive Vice President for Sales & Marketing and Karl Sandlund started as Executive Vice President for Product, Network & Revenue. As Executive Vice President & CEO, Eivind Roald is leading efforts to establish SAS Growth Initiatives and is tasked with creating new revenue streams and new partnerships that will strengthen SAS’s core operations. The intent is to establish opera-tions in a separate company to create financial transparency.
Change management and leadershipSAS is now in the implementation phase of the efficiency enhance-ment program, which requires considerable effort across the entire organization. Success will require structured change management and a leadership that targets the full range of stakeholders, including employees, trade unions and suppliers.
To ensure the implementation of the structural measures and to build the right foundation for the future, in a continuously changing world, we will focus on the following:• Communicative leadership. Delegated responsibility and a mandate
for communication and change, and taking decisions at the appro-priate level of the organization.
• Clearer structures and processes. Establish the new organization structure and secure a solid reporting structure with clear objec-tives.
• Competence and ability to implement. Secure the skills supply in the identified focus areas, for example, project management, digitaliza-tion, automation and business control, and improve succession and career planning. Moreover, we will promote a performance manage-ment culture that helps increase employee motivation and commit-ment.
The annual SAS People Review process was completed in the quarter and presented to the Board.
SustainabilityThe priority for the sustainability area is the transition to lower green-house gas emissions. In the November 2016–July 2017 period, CO2 emissions per passenger kilometer were reduced by 3.9% year-on-year. The improvement can be traced to the ongoing renewal of the aircraft fleet, active efficiency enhancement efforts in daily operations within the ISO14001 framework for the certified environmental man-agement system and a higher load factor.
By July 31, 2017, SAS put ten Airbus A320neos into service to replace older aircraft. The Airbus 320neo has CO2 emissions per pas-senger kilometer that are around 18% lower than a comparable previ-ous generation aircraft. The aircraft also generates significantly less noise than the aircraft it is replacing. An analysis of SAS Airbus 320neo CO2 emissions per passenger kilometer noted that emis-sions amounted to 60 gram in July 2017. This was the lowest monthly result ever for SAS from a single aircraft type.
During the period, SAS has also added biofuel to fuel for flights from Oslo and Arlanda. At present the offering is limited. SAS actively promotes more rapid commercialization and creating the precondi-tions to allow upgrading one’s flight from jet fuel to biofuel.
SAS has a long-term target of reducing CO2 emissions per passen-ger kilometer by 20% between 2010 and 2020. At the end of Q3 (roll-ing 12 months), CO2 emissions per passenger kilometer had decreased 12.1% compared with 2010.

SAS Interim Report November 2016–July 2017 9
Risks and uncertainties
RISKS AND UNCERTAINTIES
CURRENCY AND JET-FUEL HEDGINGFinancial risks pertaining to changes in exchange rates and fuel prices are hedged with derivatives, which aim to counter short-term negative fluctuations and provide scope for adapting operations to long-term changes in levels. Another aim of SAS’s hedging strategy is to enable SAS to act quickly when changes in exchange rates and fuel prices are advantageous.
The policy for jet-fuel hedging states that jet fuel should be hedged at an interval of 40–80% of anticipated volumes for the coming 12 months. The policy also allows hedging of up to 50% of the antici-pated volumes for the period, 12–18 months.
As of July 31, 2017, the hedging of SAS’s future jet-fuel consump-tion for the remainder of the fiscal year was conducted through a com-bination of swaps and capped options. The hedging ratio for the next 12 months amounts to 52% and no hedges were undertaken for the next six-month period. Under current plans for flight capacity, the cost of jet fuel during the 2016/2017 fiscal year is expected to be in line with the table below, taking into account different fuel prices and USD rates and including jet-fuel hedging.
The jet-fuel cost in the statement of income does not include the effects from SAS’s USD currency hedging. The effects from SAS’s currency hedging are recognized in profit or loss under “Other oper-ating expenses,” since SAS’s currency hedging is performed sepa-rately and is not linked specifically to its jet-fuel purchases.
For foreign currency, the policy is to hedge 40–80%. At July 31, 2017, SAS had hedged 59% of its anticipated USD deficit for the next 12 months. SAS has hedged the USD deficit using forward contracts. In terms of NOK, which is SAS’s largest surplus currency, 60% was hedged for the next 12 months. Based on the currency exposure for 2015/2016, a weakening of the NOK against the SEK of 1% would generate a negative earnings impact of MSEK 65, excluding hedge effects. A weakening of the USD against the SEK of 1% would gener-ate a positive earnings impact of MSEK 100, excluding hedge effects.
Hedging of jet fuel at July 31, 2017
Hedge level (max price)
Aug-Oct 2017
Nov 2017 –Jan 2018
Feb–Apr 2018
May–July 2018
USD 480-510/tonne 95% 67% 45% 0%
Vulnerability matrix, jet-fuel cost November 2016 to October 2017, SEK billion1
Exchange rate SEK/USD
Market price 7.00 8.00 9.00 10.00
USD 300/tonne 6.4 6.6 6.7 6.9
USD 400/tonne 6.4 6.6 6.8 7.0
USD 600/tonne 6.6 6.8 7.0 7.2
USD 800/tonne 6.6 6.8 7.1 7.3
USD 1,000/tonne 6.6 6.9 7.1 7.3
1) SAS’s current hedging contracts for jet fuel at July 31, 2017 have been taken into account.
LEGAL ISSUESThe European Commission’s decision in November 2010 found SAS and many other airlines guilty of alleged participation in a global air cargo cartel in the 1999–2006 period and ordered SAS to pay a fine of MEUR 70.2.
SAS works strategically to refine and improve its risk management. Risk management includes identifying both new risks and known risks, such as changes in jet-fuel prices or exchange rates. SAS monitors general risks centrally, while portions of risk management are conducted in the operations and include identification, action plans and policies. For further information about risk management at SAS, refer to the most recently published annual report.
SAS appealed the decision in January 2011 and in December 2015, the Court of Justice of the European Union (CJEU) annulled the Euro-pean Commission’s decision including the MEUR 70.2 fine. The CJEU’s ruling entered force and the MEUR 70.2 fine was repaid to SAS at the beginning of March 2016, and was recognized as a nonre-curring item in Q2 of the 2015/2016 fiscal year. The European Com-mission took a new decision on the same issue in March 2017 and again imposed fines on SAS and many other airlines for alleged par-ticipation in a global air cargo cartel from 1999–2006. The fine of MEUR 70.2 was the same as that imposed under the 2010 decision. The fine was recognized as a nonrecurring item by SAS in its Q2 earn-ings for the 2016/2017 fiscal year. SAS has appealed the European Commission’s decision. The appeal process could take several years.
As a consequence of the European Commission’s decision in the cargo investigation in November 2010 and the renewal of that deci-sion in March 2017, SAS and other airlines fined by the Commission are involved in various civil lawsuits initiated by cargo customers in countries including the UK, the Netherlands and Norway. SAS con-tests its responsibility in all of these legal processes. Unfavorable out-comes in these disputes could have a significantly negative financial impact on SAS. Further lawsuits by cargo customers cannot be ruled out. No provisions have been made.
A group of former Braathens cabin crew have, through the Parat trade union, initiated a legal process against SAS at a general court in Norway with a claim for correction of a work time factor (part-time percentage) in the calculation of pension rights in the occupational pension plan in accordance with the Norwegian Occupational Pen-sions Act. The lawsuit contains no specified demand for compensa-tion. SAS contests the claim. SAS won the initial case, however the judgment has been appealed by the counterparty and is expected to be heard in the next instance in 2017. The financial exposure is diffi-cult to quantify, but SAS considers the risk of a negative outcome to be limited and no provisions have been made.
A large number of former cabin crew of SAS in Denmark are pursu-ing a class action against SAS at a Danish court, demanding addi-tional payments from SAS to the Pension Improvements Fund for Cabin Crew (the CAU fund) citing that the CAU fund is a defined-ben-efit supplementary plan. In autumn 2016, the case was heard by the City Court of Copenhagen, which, in its judgment in December 2016, rejected the cabin crew’s demand for further payments into the CAU fund by SAS. The cabin crew appealed the judgment in January 2017.
On February 20, 2017, SAS has together with the International Air Transport Association (IATA) filed a complaint with the Danish Trans-port, Construction and Housing Authority about excessively high fees at Copenhagen Airport, and demanded a reduction in fees. The posi-tion taken by SAS and the IATA is supported by the Danish govern-ment’s aviation strategy, which was presented in summer 2017. The parties have corresponded through spring and summer 2017 and the case is expected to be decided in March 2018.
OTHER DISPUTESIn addition to the above, the labor unions at SAS are pursuing some 20 claims against SAS in Denmark, Norway and Sweden for smaller amounts, which mainly pertain to interpretation of labor legislation and collective agreements. SAS contests the claims of the labor unions in all of these legal processes.

SAS Interim Report November 2016–July 2017 10
Risks and uncertainties
OUTLOOK FOR 2016/2017Uncertainty in the macro environment remains considerable with vol-atile exchange rates and jet-fuel prices, and national aviation taxes are being considered. A strong economy together with modest capacity growth in Scandinavia over the spring and summer also aided the positive earnings trend and the underlying positive trend in unit reve-nue in Q3.
The increase in market capacity is once again expected to acceler-ate in autumn and winter 2017. In parallel, SAS is entering a period where we will see a lower load factor than last year. This is partly because we are phasing in Airbus A320neo aircraft with up to 180 seats to replace aircraft with around 120 seats. Initially, we do not expect to fill all of these new seats. However, the availability of more seats will have a positive impact when demand increases again next summer.
To meet the increase in market capacity and the market’s long-term yield pressure trend, SAS is endeavoring to strengthen competi-tiveness by further increasing the production platform’s efficiency and flexibility.
To sum up, SAS is raising its forecasts in the outlook for 2016/2017 as follows:
SAS expects income before tax and nonrecurring items for the 2016/2017 fiscal year to be higher than for the last fiscal year. The outlook is based on no unexpected events occurring.
In the interim report for November 2016–April 2017, SAS stated:Despite market uncertainty and a weak start to the fiscal year, SAS expects to be able to deliver a positive income before tax and nonre-curring items for the 2016/2017 fiscal year. The outlook is based on no unexpected events occurring.
CAPACITY OUTLOOK FOR 2017/2018SAS has an indicative plan to increase capacity (ASK) in 2017/2018 by around 1–3%, primarily as a result of increased capacity on longer, European routes and the fact that the Airbus A320neo has more seats than the aircraft it will be replacing. The increase in the number of seats offered is expected to be 0–2%.
OUTLOOK
THE OUTLOOK IS BASED ON THE FOLLOWING PRECONDITIONS AT JULY 31, 2017:• SAS’s scheduled capacity growth (ASK) in 2016/2017 will be
lower year-on-year and amount to around 8%. Growth will be greatest on the intercontinental routes and on the European leisure routes. The number of flights is expected to increase by about 1%.
• A lower PASK in 2016/2017 compared with 2015/2016 as a result of longer average flight distances and continued under-lying yield pressure.
• A lower unit cost through intense focus on efficiency mea-sures, which in 2016/2017 are expected to generate effects of about SEK 0.7 billion.
• Net investment is expected to be almost zero in 2016/2017. The downward adjustment compared with the previous out-look was mainly attributable to the transfer of two slot pairs at London Heathrow. In addition, a major engine maintenance program will be implemented in 2016/2017 and 2017/2018 and a provision has already been made for most of these costs.
• No industrial action by the pilot associations with material financial effects.
SAS Interim Report November 2016–July 2017 11
Financial Statements
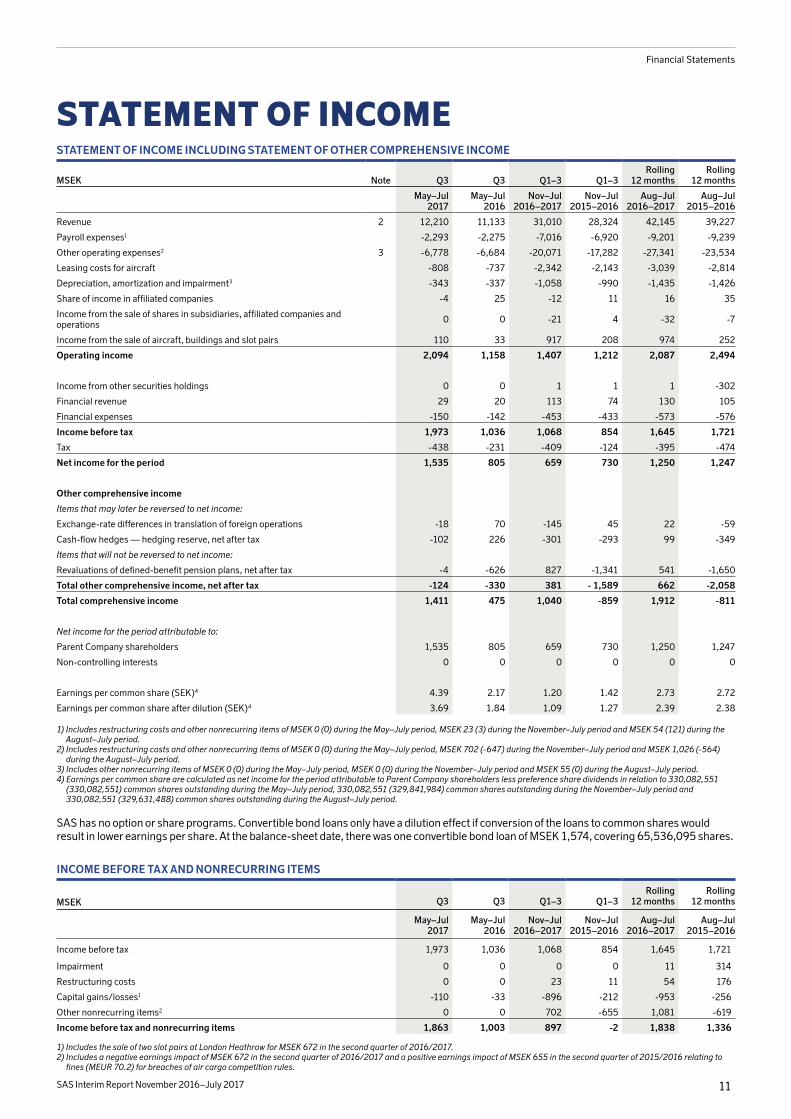
STATEMENT OF INCOMESTATEMENT OF INCOME INCLUDING STATEMENT OF OTHER COMPREHENSIVE INCOME
MSEK Note Q3 Q3 Q1–3 Q1–3Rolling
12 monthsRolling
12 months
May–Jul 2017
May–Jul 2016
Nov–Jul 2016–2017
Nov–Jul 2015–2016
Aug–Jul 2016–2017
Aug–Jul 2015–2016
Revenue 2 12,210 11,133 31,010 28,324 42,145 39,227
Payroll expenses1 -2,293 -2,275 -7,016 -6,920 -9,201 -9,239
Other operating expenses2 3 -6,778 -6,684 -20,071 -17,282 -27,341 -23,534
Leasing costs for aircraft -808 -737 -2,342 -2,143 -3,039 -2,814
Depreciation, amortization and impairment3 -343 -337 -1,058 -990 -1,435 -1,426
Share of income in affiliated companies -4 25 -12 11 16 35
Income from the sale of shares in subsidiaries, affiliated companies and operations 0 0 -21 4 -32 -7
Income from the sale of aircraft, buildings and slot pairs 110 33 917 208 974 252
Operating income 2,094 1,158 1,407 1,212 2,087 2,494
Income from other securities holdings 0 0 1 1 1 -302
Financial revenue 29 20 113 74 130 105
Financial expenses -150 -142 -453 -433 -573 -576
Income before tax 1,973 1,036 1,068 854 1,645 1,721
Tax -438 -231 -409 -124 -395 -474
Net income for the period 1,535 805 659 730 1,250 1,247
Other comprehensive income
Items that may later be reversed to net income:
Exchange-rate differences in translation of foreign operations -18 70 -145 45 22 -59
Cash-flow hedges — hedging reserve, net after tax -102 226 -301 -293 99 -349
Items that will not be reversed to net income:
Revaluations of defined-benefit pension plans, net after tax -4 -626 827 -1,341 541 -1,650
Total other comprehensive income, net after tax -124 -330 381 - 1,589 662 -2,058
Total comprehensive income 1,411 475 1,040 -859 1,912 -811
Net income for the period attributable to:
Parent Company shareholders 1,535 805 659 730 1,250 1,247
Non-controlling interests 0 0 0 0 0 0
Earnings per common share (SEK)4 4.39 2.17 1.20 1.42 2.73 2.72
Earnings per common share after dilution (SEK)4 3.69 1.84 1.09 1.27 2.39 2.38
1) Includes restructuring costs and other nonrecurring items of MSEK 0 (0) during the May–July period, MSEK 23 (3) during the November–July period and MSEK 54 (121) during the August–July period.
2) Includes restructuring costs and other nonrecurring items of MSEK 0 (0) during the May–July period, MSEK 702 (-647) during the November–July period and MSEK 1,026 (-564) during the August–July period.
3) Includes other nonrecurring items of MSEK 0 (0) during the May–July period, MSEK 0 (0) during the November–July period and MSEK 55 (0) during the August–July period.4) Earnings per common share are calculated as net income for the period attributable to Parent Company shareholders less preference share dividends in relation to 330,082,551
(330,082,551) common shares outstanding during the May–July period, 330,082,551 (329,841,984) common shares outstanding during the November–July period and 330,082,551 (329,631,488) common shares outstanding during the August–July period.
SAS has no option or share programs. Convertible bond loans only have a dilution effect if conversion of the loans to common shares would result in lower earnings per share. At the balance-sheet date, there was one convertible bond loan of MSEK 1,574, covering 65,536,095 shares.
INCOME BEFORE TAX AND NONRECURRING ITEMS
MSEK Q3 Q3 Q1–3 Q1–3Rolling
12 monthsRolling
12 months
May–Jul 2017
May–Jul 2016
Nov–Jul 2016–2017
Nov–Jul 2015–2016
Aug–Jul 2016–2017
Aug–Jul 2015–2016
Income before tax 1,973 1,036 1,068 854 1,645 1,721
Impairment 0 0 0 0 11 314
Restructuring costs 0 0 23 11 54 176
Capital gains/losses1 -110 -33 -896 -212 -953 -256
Other nonrecurring items2 0 0 702 -655 1,081 -619
Income before tax and nonrecurring items 1,863 1,003 897 -2 1,838 1,336
1) Includes the sale of two slot pairs at London Heathrow for MSEK 672 in the second quarter of 2016/2017.2) Includes a negative earnings impact of MSEK 672 in the second quarter of 2016/2017 and a positive earnings impact of MSEK 655 in the second quarter of 2015/2016 relating to
fines (MEUR 70.2) for breaches of air cargo competition rules.

SAS Interim Report November 2016–July 2017 12
Financial Statements
BALANCE SHEETCONDENSED BALANCE SHEET
MSEKJul 31,
2017Oct 31,
2016Jul 31,
2016Jul 31,
2015
Intangible assets 1,804 1,923 1,880 1,867
Tangible fixed assets 10,453 11,195 10,160 9,482
Financial fixed assets 7,416 6,201 6,130 7,905
Total fixed assets 19,673 19,319 18,170 19,254
Other current assets 327 312 304 360
Current receivables 2,942 3,753 3,126 3,380
Cash and cash equivalents1 8,620 8,370 8,449 7,453
Total current assets 11,889 12,435 11,879 11,193
Total assets 31,562 31,754 30,049 30,447
Shareholders’ equity2 6,716 6,026 5,154 6,291
Long-term liabilities 9,441 9,822 9,388 10,495
Current liabilities 15,405 15,906 15,507 13,661
Total shareholders’ equity and liabilities 31,562 31,754 30,049 30,447
Shareholders’ equity per common share, (SEK)3 9.21 7.12 4.48 7.95
Interest-bearing assets 15,075 13,661 13,659 14,475
Interest-bearing liabilities 8,823 9,880 9,921 9,763
Working capital -12,146 -11,274 -10,985 -10,444
1) At July 31, 2017, including receivables from other financial institutions, MSEK 948 (1,436). 2) Including non-controlling interests.3) Shareholders’ equity attributable to Parent Company shareholders excluding total preference share capital in relation to the 330,082,551 (330,082,551) common shares outstanding.
The SAS Group has not carried out any buyback programs.
SPECIFICATION OF FINANCIAL NET DEBT, JULY 31, 2017
According to balance sheet
Of which financial net debt
Financial fixed assets 7,416 2,027
Current receivables 2,942 401
Cash and cash equivalents 8,620 8,620
Long-term liabilities 9,441 5,368
Current liabilities 15,405 3,455
Financial net debt -2,225
Information relating to financial net debt in the comparative periods is available in the Financial Key Ratios section. For a specification of finan-cial net debt for the respective periods, please refer to www.sasgroup.net where each interim report is published.
CONDENSED CHANGES IN SHAREHOLDERS’ EQUITY
MSEKShare
capital1
Other contributed
capital2Hedging reserves
Transla-tion
reserve
Retained earnings3
Total shareholders’ equity attributable
to Parent Company shareholders
Non- controlling
interests
Total share-
holders’ equity
Opening shareholders’ equity in accordance with approved balance sheet, November 1, 2015 6,754 327 1,218 -286 -1,674 6,339 0 6,339
Conversion of convertible bond loan 22 2 24 24
Preference share dividend -350 -350 -350
Comprehensive income, November–July -293 45 -611 -859 -859
Closing balance, July 31, 2016 6,776 327 925 -241 -2,633 5,154 0 5,154
Comprehensive income, August–October 400 167 305 872 872
Closing balance, October 31, 2016 6,776 327 1,325 -74 -2,328 6,026 0 6,026
Preference share dividend -350 -350 -350
Comprehensive income, November–July -301 -145 1,486 1,040 1,040
Closing balance, July 31, 2017 6,776 327 1,024 -219 -1,192 6,716 0 6,716
1) Number of shares in SAS AB: 330,082,551 common shares with a quotient value of SEK 20.10 and 7,000,000 preference shares with a quotient value of SEK 20.10.2) The amount comprises share premium reserves and the equity share of convertible loans.3) No dividends were paid on common shares for 2015/2016.
SAS Interim Report November 2016–July 2017 13
Financial Statements
CASH-FLOW STATEMENTCONDENSED CASH-FLOW STATEMENT
MSEK Q3 Q3 Q1–3 Q1–3Rolling
12 monthsRolling
12 months
May–Jul 2017
May–Jul 2016
Nov–Jul 2016–2017
Nov–Jul 2015–2016
Aug–Jul 2016–2017
Aug–Jul 2015–2016
Income before tax 1,973 1,036 1,068 854 1,645 1,721
Depreciation, amortization and impairment 343 337 1,058 990 1,435 1,426
Income from sale of aircraft, buildings and shares -110 -33 -896 -212 -953 -256
Adjustment for other items not included in the cash flow, etc. -692 16 61 30 308 404
Tax paid -22 0 -22 0 -22 -1
Cash flow from operations before change in working capital 1,492 1,356 1,269 1,662 2,413 3,294
Change in working capital -1,519 -926 291 714 434 515
Cash flow from operating activities -27 430 1,560 2,376 2,847 3,809
Investments including advance payments to aircraft manufacturers -2,128 -1,094 -5,560 -4,189 -7,331 -6,498
Acquisition of subsidiaries 0 0 0 0 0 0
Sale of subsidiaries and operations 0 0 -24 -2 -24 -2
Sale of fixed assets, etc. 2,607 153 5,907 2,823 6,431 4,872
Cash flow before financing activities 452 -511 1,883 1,008 1,923 2,181
Dividend on preference shares -88 -88 -263 -263 -350 -350
External financing, net -821 -75 -1,368 -495 -1,403 -832
Cash flow for the period -457 -674 252 250 170 999
Translation difference in cash and cash equivalents 0 2 -2 1 1 -3
Change in cash and cash equivalents according to the balance sheet -457 -672 250 251 171 996
Cash flow from operating activities per common share (SEK) -0.08 1.30 4.73 7.20 8.63 11.56
Jul 31, 2017
Oct 31, 2016
Jul 31, 2016
Jul 31, 2015
Aircraft leasing costs and revenue, 12 months -2,960 -2,822 -2,777 -2,451
Net capitalized leasing costs, 12 months (*7) 20,720 19,754 19,439 17,157
Net capitalized leasing costs, 12 months (*7), average 20,035 18,791 18,294 15,161
Average shareholders’ equity 5,791 5,434 5,551 5,208
Average financial net debt -1,377 -439 -259 919
FINANCIAL KEY RATIOSJul 31,
2017Oct 31,
2016Jul 31,
2016Jul 31,
2015
Return on shareholders’ equity after tax, 12-month rolling 22% 24% 22% 3%
Return on invested capital, 12-month rolling 13% 12% 14% 7%
Adjusted financial net debt/EBITDAR, multiple 3.3x 3.2x 2.8x 4.1x
Financial preparedness 37% 41% 39% 35%
Equity/assets ratio 21% 19% 17% 21%
Adjusted equity/assets ratio 13% 12% 10% 13%
Financial net debt, MSEK -2,225 -1,166 -810 -183
Debt/equity ratio -0.33 -0.19 -0.16 -0.03
Adjusted debt/equity ratio 2.75 3.08 3.61 2.70
Interest-coverage ratio 3.9 3.6 4.0 1.2
The above returns are calculated using averages of the qualifying periods’ balance-sheet items. The adjusted equity/assets ratio and adjusted debt/equity ratio are calculated using net capitalized leasing costs, whereby operational leasing commitments for aircraft were taken into con-sideration, see the Definitions and concepts section. The following average balance-sheet items and net capitalized leasing costs were used in the above key ratios.

SAS Interim Report November 2016–July 2017 14
Financial Statements
PARENT COMPANY SAS ABThe number of common and preference shareholders in SAS AB amounted to 60,165 at July 31, 2017. The average number of employees amounted to 4 (4). In the second quarter of 2016/2017, an impairment charge of MSEK 125 was recognized against shares in subsidiaries. An expense of MSEK 63 pertaining to a guarantee commitment was charged to earnings for the first quarter of 2015/2016. The valuation of SAS AB’s shareholding is based on the assumption that the structural measures set out in the report are implemented.
CONDENSED STATEMENT OF INCOME
MSEK Q1–3 Q1–3
Nov–Jul 2016–2017
Nov–Jul 2015–2016
Revenue 3 6
Payroll expenses -26 -21
Other operating expenses -54 -104
Operating income -77 -119
Income from participations in Group companies -122 0
Income from other securities holdings 1 1
Net financial items -27 -28
Income before tax -225 -146
Tax 23 28
Net income for the period -202 -118
Net income for the period attributable to:
Parent Company shareholders -202 -118
Net income for the period also corresponds with total comprehensive income.
CONDENSED BALANCE SHEET
MSEKJul 31,
2017Oct 31,
2016Jul 31,
2016
Financial fixed assets 14,661 14,790 14,789
Other current assets 465 769 874
Cash and cash equivalents 2 0 0
Total assets 15,128 15,559 15,663
Shareholders’ equity 11,765 12,317 12,335
Long-term liabilities 1,532 3,010 3,002
Current liabilities 1,831 232 326
Total shareholders’ equity and liabilities 15,128 15,559 15,663
CHANGES IN SHAREHOLDERS’ EQUITY
MSEKShare
capital1Restricted
reservesUnrestricted
equity2
Total shareholders’
equity
Opening balance, November 1, 2016 6,776 306 5,235 12,317
Preference share dividend -350 -350
Net income for the period -202 -202
Shareholders’ equity, July 31, 2017 6,776 306 4,683 11,765
1) Number of shares: 330,082,551 common shares with a quotient value of SEK 20.10 and 7,000,000 preference shares with a quotient value of SEK 20.10.2) No dividends were paid on common shares for 2015/2016.
SAS Interim Report November 2016–July 2017 15
Notes
NOTE 1 ACCOUNTING POLICIES AND FINANCIAL STATEMENTS
NOTES
NOTE 2 REVENUE
Q3 Q3 Q1–3 Q1–3Rolling
12 monthsRolling
12 months
May–Jul 2016–2017
May–Jul 2015–2016
Nov–Jul2016–2017
Nov–Jul2015–2016
Aug–Jul2016–2017
Aug–Jul2015–2016
Passenger revenue 9,375 8,616 23,782 21,841 32,312 30,241
Charter 789 727 1,283 1,140 1,934 1,761
Freight and mail 353 288 1,099 926 1,426 1,244
Other traffic revenue 671 585 1,775 1,659 2,409 2,168
Other operating revenue 1,022 917 3,071 2,758 4,064 3,813
Total 12,210 11,133 31,010 28,324 42,145 39,227
NOTE 3 OTHER OPERATING EXPENSES
Q3 Q3 Q1–3 Q1–3Rolling
12 monthsRolling
12 months
May–Jul2016–2017
May–Jul 2015–2016
Nov–Jul2016–2017
Nov–Jul2015–2016
Aug–Jul2016–2017
Aug–Jul2015–2016
Sales and distribution costs -608 -591 -1,762 -1,744 -2,390 -2,449
Jet fuel -1,824 -1,765 -5,062 -4,490 -7,021 -6,254
Government user fees -1,148 -1,090 -3,159 -2,978 -4,287 -4,096
Catering costs -308 -274 -796 -669 -1,075 -897
Handling costs -681 -647 -2,041 -1,795 -2,723 -2,351
Technical aircraft maintenance -760 -799 -2,446 -2,422 -3,316 -3,318
Computer and telecommunication costs -418 -344 -1,167 -1,005 -1,544 -1,342
Wet-lease costs -333 -224 -805 -524 -1,018 -677
Other -698 -950 -2,833 -1,655 -3,967 -2,150
Total -6,778 -6,684 -20,071 -17,282 -27,341 -23,534
This interim report for the SAS Group was prepared in accordance with IAS 34 Interim Financial Reporting and the Swedish Annual Accounts Act. The interim report for the Parent Company was prepared in accor-dance with the Swedish Annual Accounts Act and RFR 2.
A number of amendments of standards, new interpretations and new standards took effect for fiscal years beginning November 1, 2016 that are not deemed to have material relevance in the preparation of this financial report. This means that the SAS Group has continued to apply the same accounting policies as in its Annual Report for 2015/2016.

SAS Interim Report November 2016–July 2017 16
Notes
NOTE 4 QUARTERLY BREAKDOWN
STATEMENT OF INCOME
MSEK 2014–2015 2015–2016 2016–2017
Q3 Q4 Full-year Q1 Q2 Q3 Q4 Full-year Q1 Q2 Q3
May–Jul Aug–Oct Nov–Oct Nov–Jan Feb–Apr May–Jul Aug–Oct Nov–Oct Nov–Jan Feb–Apr May–Jul
Revenue 10,973 10,903 39,650 8,275 8,916 11,133 11,135 39,459 8,957 9,843 12,210
Payroll expenses -2,386 -2,319 -9,622 -2,334 -2,311 -2,275 -2,185 -9,105 -2,421 -2,302 -2,293
Other operating expenses -6,503 -6,252 -24,558 -5,169 -5,429 -6,684 -7,270 -24,552 -6,105 -7,188 -6,778
Leasing costs for aircraft -659 -671 -2,593 -700 -706 -737 -697 -2,840 -733 -801 -808
Depreciation, amortization and impair-ment -343 -436 -1,466 -341 -312 -337 -377 -1,367 -327 -388 -343
Share of income in affiliated companies 25 24 37 -12 -2 25 28 39 -11 3 -4
Income from the sale of shares in subsidiaries, affiliated companies and operations 0 -11 0 0 4 0 -11 -7 -21 0 0
Income from the sale of aircraft, buildings and slot pairs 35 44 777 95 80 33 57 265 84 723 110
Operating income 1,142 1,282 2,225 -186 240 1,158 680 1,892 -577 -110 2,094
Income from other securities holdings 0 -303 -300 1 0 0 0 1 0 1 0
Financial revenue 30 31 124 22 32 20 17 91 41 43 29
Financial expenses -141 -143 -632 -146 -145 -142 -120 -553 -161 -142 -150
Income before tax 1,031 867 1,417 -309 127 1,036 577 1,431 -697 -208 1,973
Tax -231 -350 -461 63 44 -231 14 -110 141 -112 -438
Net income for the period 800 517 956 -246 171 805 591 1,321 -556 -320 1,535
Attributable to:
Parent Company shareholders 799 517 956 -246 171 805 591 1,321 -556 -320 1,535
Non-controlling interests 1 0 0 0 0 0 0 0 0 0 0
MSEK Q1 Q1 Q2 Q2 Q3 Q3 Q4 Q4Rolling
12 monthsRolling
12 months
Nov–Jan2016–2017
Nov–Jan2015–2016
Feb–Apr2017
Feb–Apr 2016
May–Jul2017
May–Jul2016
Aug–Oct2016
Aug–Oct2015
Aug–Jul2016–2017
Aug–Jul2015–2016
Revenue 8,957 8,275 9,843 8,916 12,210 11,133 11,135 10,903 42,145 39,227
EBITDAR 431 772 353 1,176 3,139 2,174 1,680 2,332 5,603 6,454
EBITDAR margin 4.8% 9.3% 3.6% 13.2% 25.7% 19.5% 15.1% 21.4% 13.3% 16.5%
EBIT -577 -186 -110 240 2,094 1,158 680 1,282 2,087 2,494
EBIT margin -6.4% -2.2% -1.1% 2.7% 17.1% 10.4% 6.1% 11.8% 5.0% 6.4%
Income before tax and nonrecurring items -707 -404 -259 -601 1,863 1,003 941 1,338 1,838 1,336
Income before tax -697 -309 -208 127 1,973 1,036 577 867 1,645 1,721
Net income for the period -556 -246 -320 171 1,535 805 591 517 1,250 1,247
Earnings per common share (SEK) -1.95 -1.01 -1.23 0.25 4.39 2.17 1.53 1.31 2.73 2.72
Cash flow before financing activities -368 -728 1,799 2,247 452 -511 40 1,173 1,923 2,181
Average number of employees (FTE) 10,538 10,932 10,155 10,339 10,404 10,815 10,753 11,167 10,462 10,813
EARNINGS-RELATED KEY RATIOS AND AVERAGE NUMBER OF EMPLOYEES

SAS Interim Report November 2016–July 2017 17
Notes
NOTE 5 FINANCIAL ASSETS AND LIABILITIES
FAIR VALUES AND CARRYING AMOUNTS OF FINANCIAL ASSETS AND LIABILITIES
Jul 31, 2017 Oct 31, 2016
MSEK Carrying amount Fair value Carrying amount Fair value
Financial assets
Financial assets at fair value 318 318 651 651
Financial assets held for trading 6,172 6,172 5,801 5,801
Other assets 4,558 4,558 4,594 4,594
Total 11,048 11,048 11,046 11,046
Financial liabilities
Financial liabilities at fair value 382 382 222 222
Financial liabilities held for trading 70 70 34 34
Financial liabilities at amortized cost 8,371 7,914 9,624 8,975
Total 8,823 8,366 9,880 9,231
FAIR VALUE HIERARCHY
Jul 31, 2017 Oct 31, 2016
MSEK Level 1 Level 2 Total Level 1 Level 2 Total
Financial assets
Financial assets at fair value - 318 318 - 651 651
Financial assets held for trading 3,322 2,850 6,172 2,752 3,049 5,801
Total 3,322 3,168 6,490 2,752 3,700 6,452
Financial liabilities
Financial liabilities at fair value - 382 382 - 222 222
Financial liabilities held for trading - 70 70 - 34 34
Total 0 452 452 0 256 256
Fair value is generally determined by using official market quotes. When market quotes are not available, the fair value is determined using generally accepted valuation methods such as discounted future cash flows based on observable market inputs.
The Group’s financial assets and liabilities are measured at fair value as stated below:
Level 1: Financial instruments for which fair value is based on observable (unadjusted) quoted prices in active markets for identical assets and liabilities. This category includes mainly treasury bills and standardized derivatives, where the quoted price is used in the valua-tion. Cash and bank balances are also categorized as level 1.
Level 2: Financial instruments for which fair value is based on valua-tion models that utilize other observable data for the asset or liability other than the quoted prices included within level 1, either directly (i.e. as prices) or indirectly (i.e. derived from prices).
Level 3: Financial instruments for which fair value is based on valu-ation models, whereby significant input is based on unobservable data. At present, SAS has no financial assets or liabilities where the valuation is essentially based on unobservable data.

SAS Interim Report November 2016–July 2017 18
Signatures
The Board of Directors and President hereby assure that this interim report provides a true and fair overview of the performance of the Parent Company’s and the Group’s operations, financial position and earnings, and describes the significant risks and
uncertainty factors to which the Parent Company and the companies included in the Group are exposed.
Stockholm, September 5, 2017
Fritz H. SchurChairman of the Board
Jacob WallenbergFirst Vice Chairman
Dag MejdellSecond Vice Chairman
Monica Caneman Board member
Lars-Johan JarnheimerBoard member
Berit SvendsenBoard member
Sanna Suvanto-HarsaaeBoard member
Carsten DillingBoard member
Jens LippestadBoard member
Cecilia van der MeulenBoard member
Janne WegebergBoard member
Rickard GustafsonPresident and CEO
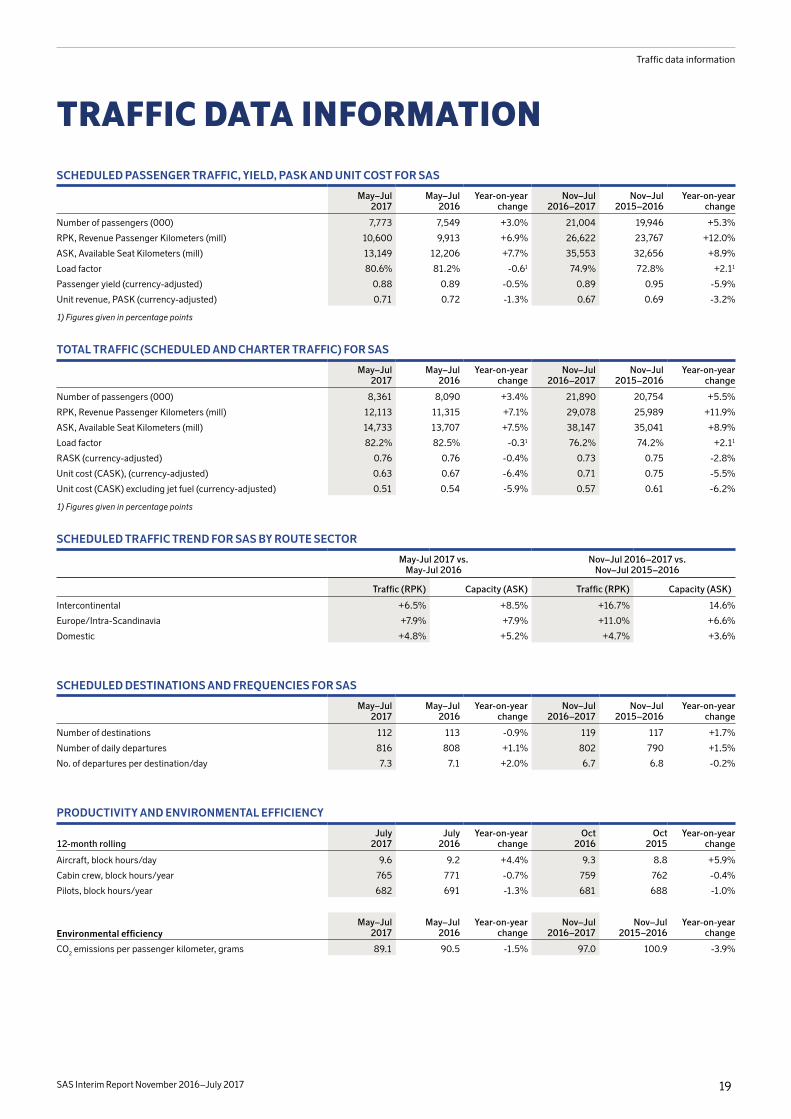
SAS Interim Report November 2016–July 2017 19
Traffic data information
SCHEDULED PASSENGER TRAFFIC, YIELD, PASK AND UNIT COST FOR SAS
May–Jul2017
May–Jul2016
Year-on-year change
Nov–Jul 2016–2017
Nov–Jul 2015–2016
Year-on-year change
Number of passengers (000) 7,773 7,549 +3.0% 21,004 19,946 +5.3%
RPK, Revenue Passenger Kilometers (mill) 10,600 9,913 +6.9% 26,622 23,767 +12.0%
ASK, Available Seat Kilometers (mill) 13,149 12,206 +7.7% 35,553 32,656 +8.9%
Load factor 80.6% 81.2% -0.61 74.9% 72.8% +2.11
Passenger yield (currency-adjusted) 0.88 0.89 -0.5% 0.89 0.95 -5.9%
Unit revenue, PASK (currency-adjusted) 0.71 0.72 -1.3% 0.67 0.69 -3.2%
1) Figures given in percentage points
TOTAL TRAFFIC (SCHEDULED AND CHARTER TRAFFIC) FOR SAS
May–Jul2017
May–Jul2016
Year-on-year change
Nov–Jul 2016–2017
Nov–Jul 2015–2016
Year-on-year change
Number of passengers (000) 8,361 8,090 +3.4% 21,890 20,754 +5.5%
RPK, Revenue Passenger Kilometers (mill) 12,113 11,315 +7.1% 29,078 25,989 +11.9%
ASK, Available Seat Kilometers (mill) 14,733 13,707 +7.5% 38,147 35,041 +8.9%
Load factor 82.2% 82.5% -0.31 76.2% 74.2% +2.11
RASK (currency-adjusted) 0.76 0.76 -0.4% 0.73 0.75 -2.8%
Unit cost (CASK), (currency-adjusted) 0.63 0.67 -6.4% 0.71 0.75 -5.5%
Unit cost (CASK) excluding jet fuel (currency-adjusted) 0.51 0.54 -5.9% 0.57 0.61 -6.2%
1) Figures given in percentage points
SCHEDULED TRAFFIC TREND FOR SAS BY ROUTE SECTOR
May-Jul 2017 vs. May-Jul 2016
Nov–Jul 2016–2017 vs. Nov–Jul 2015–2016
Traffic (RPK) Capacity (ASK) Traffic (RPK) Capacity (ASK)
Intercontinental +6.5% +8.5% +16.7% 14.6%
Europe/Intra-Scandinavia +7.9% +7.9% +11.0% +6.6%
Domestic +4.8% +5.2% +4.7% +3.6%
SCHEDULED DESTINATIONS AND FREQUENCIES FOR SAS
May–Jul2017
May–Jul2016
Year-on-year change
Nov–Jul 2016–2017
Nov–Jul 2015–2016
Year-on-year change
Number of destinations 112 113 -0.9% 119 117 +1.7%
Number of daily departures 816 808 +1.1% 802 790 +1.5%
No. of departures per destination/day 7.3 7.1 +2.0% 6.7 6.8 -0.2%
PRODUCTIVITY AND ENVIRONMENTAL EFFICIENCY
12-month rollingJuly
2017July
2016Year-on-year
changeOct
2016Oct
2015Year-on-year
change
Aircraft, block hours/day 9.6 9.2 +4.4% 9.3 8.8 +5.9%
Cabin crew, block hours/year 765 771 -0.7% 759 762 -0.4%
Pilots, block hours/year 682 691 -1.3% 681 688 -1.0%
Environmental efficiencyMay–Jul
2017May–Jul
2016Year-on-year
changeNov–Jul
2016–2017Nov–Jul
2015–2016Year-on-year
change
CO2 emissions per passenger kilometer, grams 89.1 90.5 -1.5% 97.0 100.9 -3.9%
TRAFFIC DATA INFORMATION
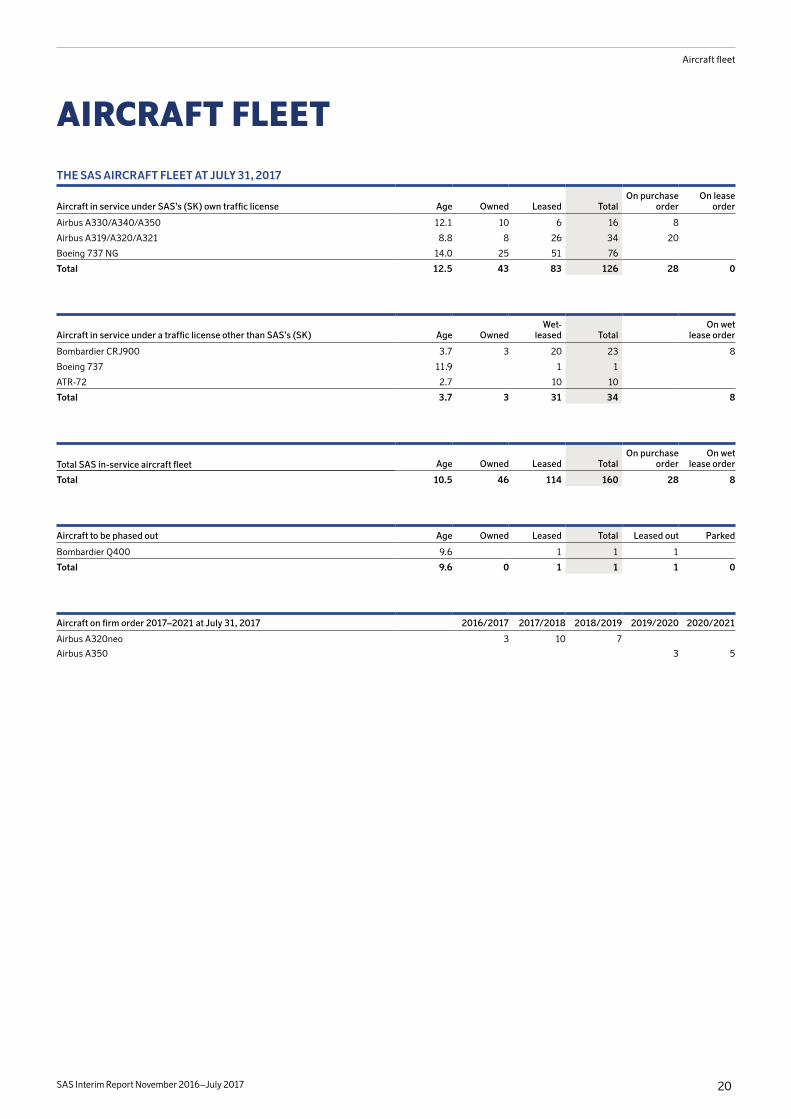
SAS Interim Report November 2016–July 2017 20
Aircraft fleet
THE SAS AIRCRAFT FLEET AT JULY 31, 2017
Aircraft in service under SAS’s (SK) own traffic license Age Owned Leased TotalOn purchase
orderOn lease
order
Airbus A330/A340/A350 12.1 10 6 16 8
Airbus A319/A320/A321 8.8 8 26 34 20
Boeing 737 NG 14.0 25 51 76
Total 12.5 43 83 126 28 0
Aircraft in service under a traffic license other than SAS’s (SK) Age OwnedWet-
leased Total On wet
lease order
Bombardier CRJ900 3.7 3 20 23 8
Boeing 737 11.9 1 1
ATR-72 2.7 10 10
Total 3.7 3 31 34 8
Total SAS in-service aircraft fleet Age Owned Leased Total On purchase
orderOn wet
lease order
Total 10.5 46 114 160 28 8
Aircraft to be phased out Age Owned Leased Total Leased out Parked
Bombardier Q400 9.6 1 1 1
Total 9.6 0 1 1 1 0
Aircraft on firm order 2017–2021 at July 31, 2017 2016/2017 2017/2018 2018/2019 2019/2020 2020/2021
Airbus A320neo 3 10 7
Airbus A350 3 5
AIRCRAFT FLEET

SAS Interim Report November 2016–July 2017 21
SAS destinations
Gran Canaria
Las Palmas
Malaga
Faro Alicante
Palma de Mallorca
Barcelona
Olbia
Cagliari
Palermo
PisaNice
Montpellier
BiarritzPulaBologna
Split
Dubrovnik Pristina
Thessaloniki
Chania
Santorini
Alanya
Tokyo
Shanghai
Vilnius
Poznan
Berlin
Wroclaw
Stuttgart
Frankfurt
Paris
Düsseldorf
Bremen
Hamburg
Amsterdam
Malmö
Gdansk
Palanga
RonnebyKalmar
Visby
St. Petersburg
Kiruna Kittila
Luleå
Skellefteå
Umeå
Sundsvall
Trondheim
Östersund
Bodø
Narvik/Evenes
Bergen
Haugesund
Stavanger
Helsingborg/Ängelholm
Billund
Birmingham
London
Manchester
Aberdeen
Edinburgh
Newcastle
Dublin
Chicago
New YorkWashington D.C.San Francisco
Reykjavik
Longyearbyen
Malta
Kirkenes
TromsøAlta
KristiansundMolde
Ålesund
SalzburgInnsbruckZürich
Riga
Los Angeles Miami
Wien
Tallinn
Mykonos
Krakow
Beijing
Gothenburg
Hanover
Aalborg
Aarhus
Bucharest
Munich
Helsinki
Prague
Geneva
Warsaw
Turku
Tampere
Vaasa
Brussels
Rome
Milan
Athens
Tenerife
Venice
Stockholm
Copenhagen
Oslo
Naples
Oulu
Hong Kong
Boston
Singapore*
Faroe Islands
Kristiansand
Lisbon
Shannon
Madeira
Eilat
Chambéry
Fuertuventura
Ibiza
SAS DESTINATIONS Existing routes New routes for 2017–2018
1) Operated by Singapore Airlines as a joint venture with SAS.

SAS Interim Report November 2016–July 2017 22
Definitions & concepts
Adjusted debt/equity ratio — The net of financial net debt plus capi-talized leasing costs (*7) in relation to equity.Adjusted equity/assets ratio — The net of equity in relation to total assets plus capitalized leasing costs (*7).Adjusted financial net debt/EBITDAR — The sum of average net financial debt and average LTM net capitalized leasing costs in rela-tion to EBITDAR. ASK, Available Seat Kilometers — The total number of seats available for passengers multiplied by the number of kilometers which they are flown.Capital employed — Total capital according to the balance sheet less non-interest-bearing liabilities. Capitalized leasing costs (*7) — The net annual operating lease costs for aircraft multiplied by seven. Debt/equity ratio — Financial net debt in relation to equity.Earnings per common share (EPS) — Net income for the period attributable to Parent Company shareholders less preference share dividends in relation to the average number of common shares out-standing.EBIT — Operating income.EBIT margin — EBIT divided by revenue.EBITDA — Operating income before tax, net financial items, income from the sale of fixed assets, share of income in affiliated companies, and depreciation and amortization.EBITDA margin — EBITDA divided by revenue.EBITDAR — Operating income before tax, net financial items, income from the sale of fixed assets, share of income in affiliated companies, depreciation and amortization, and leasing costs for aircraft.EBITDAR margin — EBITDAR divided by revenue.Equity/assets ratio — Equity in relation to total assets.Equity method — Shares in affiliated companies are taken up at the SAS Group’s share of equity, taking acquired surplus and deficit val-ues into account.Financial net debt — Interest-bearing liabilities less interest-bearing assets excluding net pension funds.
Financial preparedness — Cash and cash equivalents, excluding receivables from other financial institutions, plus unutilized credit facilities in relation to fixed costs. In this ratio, fixed costs are defined as payroll and other operating expenses, except jet-fuel costs and government user fees, as well as leasing costs for aircraft.FTE — Full-time equivalents.Interest-coverage ratio — Operating income plus financial revenue in relation to financial expenses.Load factor — RPK divided by ASK. Describes the capacity utilization of available seats.PASK, Unit revenue — Passenger revenue/ASK (scheduled).RASK — Total traffic revenue/total ASK (scheduled+charter).Return on Invested Capital (ROIC) — EBIT plus the standard inter-est portion corresponding to 33% of net operating leasing costs in relation to average shareholders’ equity, net financial debt and net capitalized leasing costs (*7).Return on shareholders’ equity — Net income for the period attrib-utable to shareholders in the Parent Company in relation to average equity excluding non-controlling interests.RPK, Revenue passenger kilometers — Number of paying passen-gers multiplied by the distance they are flown in kilometers.Sale and leaseback — Sale of an asset (aircraft, building, etc.) that is then leased back.Unit cost, CASK — Total payroll expenses, other operating expenses, leasing costs for aircraft and depreciation adjusted for currency and nonrecurring items, less other operating revenue per ASK (scheduled and charter).Working capital — The total of non-interest-bearing current assets and non-interest-bearing financial fixed assets excluding equity in affiliated companies and other securities holdings less non-inter-est-bearing liabilities.Yield — Passenger revenue divided by RPK (scheduled).
A more detailed list of definitions & concepts is available at www.sasgroup.net under Investor Relations/Financial data/Financial definitions.
SAS is Scandinavia’s leading airline and has an attractive offering to frequent travelers. SAS offered 813 flights daily in 2015/2016 and more than 29 million passengers traveled with SAS to 118 destina-tions in Europe, the US and Asia. Membership in Star Alliance™ pro-vides SAS’s customers with access to a far-reaching network and smooth connections.
In addition to airline operations, activities at SAS include ground
handling services (SAS Ground Handling), technical maintenance (SAS Technical) and air cargo services (SAS Cargo).
SAS AB is the Parent Company of SAS and is listed on the stock exchanges in Stockholm (primary listing), Copenhagen and Oslo. The majority of the operations and assets are included in the SAS Consor-tium, with the exception of SAS Cargo and SAS Ground Handling, which are directly owned by SAS AB.
DEFINITIONS & CONCEPTS
SAS uses various key figures, including alternative performance measures (APM), for internal analysis purposes and for external com-munication of the operations’ results, performance and financial position.
The key figures support stakeholders in their assessment of SAS’s earnings and performance. In the APMs based on capitalized leas-ing costs (*7), SAS’s level of debt is raised to a level that would correspond to a situation where aircraft under operating leases would instead be owned or under finance leases. In the airline industry, capitalized leasing costs (*7) is an established method for estimating unrecognized liabilities pertaining to operating leases for aircraft.
The aim of the APMs is to illustrate the performance measures tailored to operations that, in addition to the other key figures, enable various stakeholders to more accurately assess and value SAS’s historical, current and future performance and positions.

SAS Interim Report November 2016–July 2017 23
Significant events
FIRST QUARTER 2016/2017 • SAS sold its subsidiary Cimber to CityJet and signed an agreement
for the sale of eleven CRJ900s as part of SAS’s strategy to let smaller traffic streams and regional traffic be handled by partners.
• SAS signed agreements for the financing of 18 Airbus A320neos through sale and leaseback.
• SAS contracted the financing of two Boeing 737s and four Airbus A319s until 2018 through a MUSD 75 credit facility.
SECOND QUARTER 2016/2017 • SAS decided to supplement its production in Scandinavia with bases
in London and Spain and to establish a new air operator certificate (AOC) in Ireland.
• The AGM resolved to pay a maximum dividend to preference share-holders over the period until the next AGM of SEK 50 per preference share. The AGM resolved not to pay a dividend to holders of common shares for the 2015/2016 fiscal year. The AGM also resolved to re-elect the Board.
• The European Commission revised its earlier decision and once again fined ten airlines for alleged breaches of competition rules during the 1999–2006 period. SAS was ordered to pay a fine of MEUR 70.2, the same amount that was repaid by the European Commission in 2016.
• SAS sold two slot pairs at London Heathrow, which resulted in a pos-itive earnings impact of MUSD 75.
• SAS completed the financing of seven Boeing 737s valued at MUSD 101. The transaction had no earnings impact.
THIRD QUARTER 2016/2017• SAS decided to double its target for efficiency measures to SEK 3
billion, with effect in the 2017–2020 period, and to focus on new rev-enue streams.
• A new internal organization was established on July 1, 2017 and Annelie Nässén joined SAS Group Management as the new Sales and Marketing Director.
EVENTS AFTER JULY 31, 2017• SAS has received notice of industrial action from September 11,
2017 from the pilot associations in Norway and from September 16, 2017 in Denmark.
FINANCIAL CALENDAR Q4 Interim report, 2017 (August–October) December 12, 2017Annual Report 2016/2017 January 30, 2018Q1 Interim report, 2018 (November–January) February 27, 20182018 AGM March 5, 2018Q2 Interim report, 2018 (February–April) May 30, 2018Q3 Interim report, 2018 (May–July) August 31, 2018Q4 Interim report, 2018 (August–October) December 4, 2018
All reports are available in English and Swedish and can be down-loaded at www.sasgroup.net. SAS’s monthly traffic data informa-tion is normally issued on the fifth business day of the following month. A complete financial calendar can be found at: www.sasgroup.net under Investor Relations.
For further definitions, refer to the Annual Report or www.sasgroup.net, under Investor Relations/Financial data/Financial definitions.
PRESS/INVESTOR RELATIONSTelephone conference at 10:00 a.m., September 5, 2017.Investor presentation in Oslo at 12:00 noon, September 5, 2017.Analyst meeting in Oslo at 1:15 p.m., September 5, 2017 Investor presentation in Stockholm at 8:00 a.m., September 6, 2017 Analyst meeting in London at 8:00 a.m., September 11, 2017
This information is information that SAS AB is obliged to disclose pursuant to the EU Market Abuse Regulation and the Securities Market Act. The information was submitted for publication, through the agency of the contact person set out above, at 8.00 a.m. CEST on September 5, 2017.
Any questions about the report can be addressed to Björn Tibell, Head of Investor Relations, +46 70 997 1437 or alternatively to [email protected].
SIGNIFICANT EVENTS