Embed Size (px)
Citation preview

Strong Start for Mothers and Newborns Evaluation: YEAR 2 ANNUAL REPORT
Volume 2 – Awardee Specific Reports
Prepared for:
Caitlin Cross-Barnet and William Clark Center for Medicare and Medicaid Innovation, DHHS Contract No.: HHSM-500-T0004 Deliverable No.: 4.1
Prepared by:
Ian Hill (Project Director), Sarah Benatar, Brigette Courtot, Lisa Dubay, Fred Blavin, Bowen Garrett, Embry Howell, Margaret Wilkinson, Morgan Cheeks, Sarah Gadsden, Nikhil Holla and Mayookha Mitra-Majumdar— Urban InstituteJennifer Edwards, Sharon Silow-Carroll, and Diana Rodin–Health Management AssociatesLee Thompson, Brandy Farrar and Kathryn Paez—American Institutes for ResearchMark Rouse, Benita Sinnarajah, and Lynn Paquin–Briljent
March 2016

Contents
Introduction .................................................................................................................................................. 1
Access Community Health Network ............................................................................................................. 2
Albert Einstein Healthcare Network ............................................................................................................. 9
American Association of Birth Centers ....................................................................................................... 15
Amerigroup Corporation ............................................................................................................................. 22
Central Jersey Family Health Consortium ................................................................................................... 29
Florida Association of Healthy Start Coalitions ........................................................................................... 36
Grady Memorial Hospital Corporation ....................................................................................................... 43
Harris County Hospital District .................................................................................................................... 50
HealthInsight of Nevada ............................................................................................................................. 56
Johns Hopkins University ............................................................................................................................ 62
Los Angeles County Department of Health Services .................................................................................. 68
Maricopa Integrated Health System ........................................................................................................... 75
Medical University of South Carolina ......................................................................................................... 82
Meridian Health Plan .................................................................................................................................. 88
Mississippi Primary Health Care Association .............................................................................................. 94
Oklahoma Health Care Authority .............................................................................................................. 100
Providence Health Foundation of Providence Hospital ............................................................................ 106
Signature Medical Group .......................................................................................................................... 113
St. John Providence Health System ........................................................................................................... 120
Texas Tech University Health Sciences Center ......................................................................................... 127
United Neighborhood Health Services ..................................................................................................... 134
University of Alabama at Birmingham ...................................................................................................... 141
University of Kentucky Research Foundation ........................................................................................... 147
University of Puerto Rico .......................................................................................................................... 154
University of South Alabama .................................................................................................................... 161
University of Tennessee Health Sciences Center ...................................................................................... 168
Virginia Commonwealth University .......................................................................................................... 175

1
Introduction
The Strong Start for Mothers and Newborns Evaluation Annual Report Volume 2 presents awardee-
specific findings for each of the 27 Strong Start awards. Findings presented are based on case studies,
participant-level process evaluation forms (Intake Form, Third Trimester Survey, and Exit Form), and
State Data Linkage Technical Assistance (TA) information.
The case study analysis summarizes findings from telephone interviews conducted by the evaluation
team between March and July 2015 (with a site visit to University of Puerto Rico, which was not visited
in-person during evaluation Year 1) as well as information obtained from other background documents.
Participant-level process evaluation data being collected for each woman enrolled in Strong Start inform
an analysis of the sociodemographic characteristics of participants, and provide an additional layer of
information regarding participant risk profiles, early outcomes, and satisfaction with the care they have
received. Available data from program inception through Quarter 1 20151 are presented for each
awardee and by enhanced prenatal care approach. We have not reported on data in cases where an
awardee has submitted fewer than 25 forms.
The State Data Linkage Technical Assistance (TA) task of Strong Start is working to obtain birth
certificate, Medicaid eligibility, and Medicaid claims/encounter data from selected states with Strong
Start awardees to assess Strong Start’s impact on birth outcomes and Medicaid costs. Data on a limited
set of outcomes are also extracted from quarterly monitoring reports collected for Quarter 2 2014
through Quarter 1 2015, which present an overview of each awardee’s progress in implementing Strong
Start during this second evaluation year, as well as a summary of the characteristics of women enrolling
in Strong Start.
1 Strong Start program quarters follow the traditional calendar year. That is, Q1 2015 is the period from January 1, 2015 through March 31, 2015.

2
Access Community Health Network
CASE STUDY
ACCESS Community Health Network (ACCESS) is a large, multi-site Federally Qualified Health Center
(FQHC) in Chicago, Illinois. At the time of evaluation Y2 data collection, ACCESS was implementing the
maternity care home approach at 31 sites, and had enrolled 1,076 women in Strong Start. Informants
report that Strong Start implementation continues to go well, with progress in a number of program
areas.
Highlights from the second round of case study data collection include:
The number of Strong Start sites has grown over the last year; Strong Start is now being offered
at all 31 sites offering prenatal care within the ACCESS system, up from 23 sites in 2014.
ACCESS has slightly modified its staffing structure to include seven care coordinators, including
five full-time social workers and two RNs, as well as a care coordinator manager, a part-time
outreach worker, and a data entry clerk. Previously, program staff included six care coordinators
(three RNs and two social workers), a program manager, and an internal evaluation specialist.
ACCESS adopted modified program eligibility criteria, which has led to a slight increase in
enrollment. To ensure that the limited number of care coordinators are providing support to
patients with the greatest risk, women must still have a second risk factor for preterm birth (in
addition to Medicaid enrollment) to qualify for Strong Start. ACCESS has been enrolling a small
proportion of women in their third trimester—generally these are patients who had been
receiving prenatal care at ACCESS but only developed a medical risk factor for preterm birth in
their third trimester.
Though enrollment continues to be lower than anticipated, it has increased considerably from
325 during the first round of case studies to 1076 participants when Y2 data was collected. New
enrollment methods, including an electronic referral process that facilitates provider referrals,
have contributed to this trend. However, the fact that care coordinators are responsible for
multiple sites and are not always able to be physically present when potential enrollees present
for appointments has continued to pose enrollment challenges.
Care coordination services have remained largely unchanged, and care coordinators work with
each participant to develop a “care plan” and provide support (typically between three and
eight encounters) during pregnancy. However, reflecting Illinois Medicaid’s increasing reliance
on managed care organizations, care coordinators report spending a growing share of their time
negotiating with health plans to ensure patients gain approval for services they need. This, in
turn, has impeded their ability to provide other kinds of support to patients.
Key informants are universally pleased with program outcomes so far, which include lower than
average (for the ACCESS network) rates of preterm birth and low birth weight, which stand at

3
seven to eight percent and nine percent, respectively. In addition, Strong Start participants have
reportedly been very responsive to the care coordinators and are appreciative of the additional
support. The care coordinators have also been working more closely with providers to develop
patient-friendly materials on targeted issues, such as 17 alpha hydroxyprogesterone caproate
(17P) treatments to prevent preterm birth.
ACCESS has placed additional emphasis on improving enrollment, and care coordinators are
expected to enroll and maintain a caseload of 120 women (up from 70-90). Many are concerned
that this will impact the care coordinators’ abilities to provide responsive and high quality
support to Strong Start enrollees.
PARTICIPANT-LEVEL PROCESS EVALUATION
The information presented below is based on data submitted from the four evaluation forms through
Quarter 1 2015. By March 2015, ACCESS Community Health Network had Intake Forms for 92 percent of
participants enrolled through Quarter 1 2015 (1,260 Intake Forms for 1,375 participants). In addition,
ACCESS submitted 686 Third Trimester Surveys, 532 Postpartum Surveys, and 12 Exit Forms. The tables
below present data collected on ACCESS’ participants with aggregated rates by approach for the
purpose of comparison.
Table 1. Enrollment and Forms Submitted, through Quarter 1 2015
Data Element N or
%
ACCESS (Maternity Care
Home)
Birth Center
Group Prenatal Care
Maternity Care Home
Total
Newly Enrolled in Q1 2015 N 270 739 948 2638 4325
Total Ever Enrolled through Q1 2015 N 1375 4739 5576 13232 23547
Number of Women Delivered through Q1 2015 N 609 2275 2755 6189 11219
Intake Forms Received through Q1 2015 N 1260 2993 4401 11761 19155
Received through Q1 2015 as a percentage of the number of women ever enrolled
% 91.6 63.2 78.9 88.9 81.3
Third Trimester Surveys Received through Q1 2015
N 686 1876 2145 4683 8704
Received through Q1 2015 as a percentage of the number of women delivered
% 112.6 82.5 77.9 75.7 77.6
Postpartum Surveys Received through Q1 2015 N 532 1533 1416 4000 6949
Received through Q1 2015 as a percentage of the number of women delivered
% 87.4 67.4 51.4 64.6 61.9
Exit Forms Received through Q1 2015 N + 2133 1433 3103 6669
Received through Q1 2015 as a percentage of the number of women delivered
% + 93.8 52.0 50.1 59.4
Notes: Gray cells labeled with a plus symbol indicate that fewer than 25 forms had been received during the reporting period. Statistics were calculated only if there were at least 25 forms received. Rows labeled with an “N” indicate the number of observations from which percentages have been calculated.

4
Table 2. Sociodemographic Risk Factors, through Quarter 1 2015
Data Element N or
%
ACCESS (Maternity Care
Home)
Birth Center
Group Prenatal Care
Maternity Care Home
Total
Mother’s Age at Intake N 1260 2993 4401 11761 19155
Less than 18 years of age % 6.7 3.4 6.7 5.8 5.6
18 through 34 years of age % 71.6 86.1 75.0 81.4 80.7
35 years and older % 8.4 6.2 4.9 6.0 5.8
Missing % 13.3 4.3 13.4 6.8 7.9
Race and Ethnicity N 1260 2993 4401 11761 19155
Hispanic % 47.9 25.7 39.2 22.9 27.1
Non-Hispanic white % 4.4 53.3 13.7 26.2 27.6
Non-Hispanic black % 44.1 14.8 39.2 46.3 39.8
Non-Hispanic Asian % 0.8 1.1 1.2 1.2 1.2
Non-Hispanic other % 0.6 0.6 1.6 0.7 0.9
Non-Hispanic multiple race % 0.4 3.6 2.3 1.2 1.8
Missing % 1.8 0.9 2.8 1.5 1.7
Employed at Intake N 1260 2993 4401 11761 19155
Yes % 37.1 39.7 34.6 38.8 38
No % 61.7 59.1 60.9 60.0 60.0
Missing % 1.1 1.2 4.5 1.2 2.0
Education Level at Intake N 1260 2993 4401 11761 19155
Less than high school % 27.0 14.3 23.7 24.5 22.7
High school graduate or GED % 43.1 52.3 46.2 52.0 50.7
Bachelor’s degree % 1.9 10.1 3.1 2.5 3.9
Other college degree(s) % 6.1 12.7 7.2 6.0 7.3
Missing % 21.9 10.7 19.8 15.0 15.4
Relationship Status at Intake N 1260 2993 4401 11761 19155
Married, living with spouse % 19.2 40.7 18.6 17.2 21.2
Married, not living with spouse % 1.8 1.7 2.1 1.9 1.9
Living with a partner % 31.1 32.2 31.3 30.6 31.0
In a relationship but not living together % 30.0 12.9 24.6 30.5 26.4
Not in a relationship right now % 16.1 11.1 17.0 17.8 16.6
Missing % 1.7 1.3 6.4 2.0 2.9
Smokes Cigarettes at Intake N 1260 2993 4401 11761 19155
Yes % 9.0 10.1 7.8 14.1 12
No % 83.4 77.1 71.7 77.8 76.3
Missing % 7.5 12.9 20.4 8.1 11.7
Food Insecure at Intake N 1260 2993 4401 11761 19155
Yes % 28.0 18.1 18.5 16.1 16.9
No % 63.9 76.9 61.4 76.2 72.9
Missing*
% 8.0 5.0 20.0 7.7 10.1
Exhibiting Depressive Symptoms at Intake** N 1260 2993 4401 11761 19155
Yes % 21.4 21.8 25.2 23.4 23.5
No % 69.7 69.3 57.0 69.3 66.4
Missing* % 8.9 9.0 17.9 7.3 10.0
Have Experienced Intimate Partner Violence in a Relationship***
N 1260 2993 4401 11761 19155

5
Data Element N or
%
ACCESS (Maternity Care
Home)
Birth Center
Group Prenatal Care
Maternity Care Home
Total
Yes % 19.7 20.6 17.1 19.0 18.8
No % 78.3 77.2 68.4 78.5 76.0
Missing* % 2.0 2.1 14.5 2.4 5.1
Notes: Cells that contain one asterisk indicate that the ‘Missing’ category includes respondents who did not answer all of the items required to calculate this measure. Cells that contain two asterisks indicate that this is as measured by a shortened version of the CES-D. Cells that contain three asterisks indicate that this is as measured by the Slapped, Threatened, and Throw (STaT) screener. Rows labeled with an “N” indicate the number of observations from which percentages have been calculated.
Table 3. Medical Risk Factors Prior to Current Pregnancy, through Quarter 1 2015
Data Element N or
%
ACCESS (Maternity Care
Home)
Birth Center
Group Prenatal Care
Maternity Care Home
Total
Inter-Pregnancy Interval with Current Pregnancy Since Last Birth
N + 1127 700 1914 3741
<18 months % + 24.3 18.0 19.5 20.7
≥18 months % + 39.8 48.3 51.9 47.6
Missing % + 35.9 33.7 28.6 31.8
Previous Preterm Birth(s) Between 20 and 36 weeks, 6 days EGA
N + 1127 700 1914 3741
Yes % + 10.7 11.4 18.9 15.0
No % + 89.3 63.9 63.2 71.2
Not Known % + 0 18.6 14.9 11.1
Missing % + 0 6.1 3.0 2.7
Previous Birth(s) Less than 2,500 grams N + 1127 700 1914 3741
Yes % + 1.9 8.6 14.8 9.7
No % + 95.8 60.4 61.7 71.7
Not Known % + 0 24.7 19.2 14.5
Missing % + 2.3 6.3 4.3 4.1
Pre-Pregnancy Diagnosis of Type I Diabetes N + 2133 1433 3103 6669
Yes % + 0.5 1.3 1.5 1.1
No % + 99.5 74.2 84.4 87
Not Known % + 0 7.7 11.1 6.8
Missing % + 0 16.7 3.1 5.0
Pre-Pregnancy Diagnosis of Type II Diabetes N + 2133 1433 3103 6669
Yes % + 0 2.6 1.9 1.5
No % + 5 72.9 83.3 56.1
Not Known % + 0 7.7 11.1 6.8
Missing % + 94.9 16.7 3.7 35.7
Pre-Pregnancy Diagnosis of Hypertension N + 2133 1433 3103 6669
Yes % + 0.5 6 9.5 5.9
No % + 99.5 66.7 77.4 82.2
Not Known % + 0 7.6 10.2 6.4
Missing % + 0 19.7 2.9 5.6
Notes: Gray cells labeled with a plus symbol indicate that fewer than 25 forms had been received during the reporting period. Statistics were calculated only if there were at least 25 forms received. Rows labeled with an “N” indicate the number of observations from which percentages have been calculated.

6
Table 4. Medical Risk Factors during the Current Pregnancy, through Quarter 1 2015
Data Element N or
%
ACCESS (Maternity Care
Home)
Birth Center
Group Prenatal Care
Maternity Care Home
Total
Gestational Diabetes N + 2133 1433 3103 6669
Yes % + 2.7 4.2 5.3 4.2
No % + 97.3 65.4 76 80.6
Not Known % + 0 10.3 15.9 9.6
Missing % + 0 20.1 2.8 5.6
Pregnancy-Related Hypertension N + 2133 1433 3103 6669
Yes % + 1.3 7.8 7.7 5.7
No % + 98.7 62.6 74.8 79.8
Not Known % + 0 9.4 14.6 8.8
Missing % + 0 20.2 2.9 5.7
Notes: Gray cells labeled with a plus symbol indicate that fewer than 25 forms had been received during the reporting period. Statistics were calculated only if there were at least 25 forms received. Rows labeled with an “N” indicate the number of observations from which percentages have been calculated.
Table 5. Birth and Delivery Methods, through Quarter 1 2015
Data Element N or
%
ACCESS (Maternity Care
Home)
Birth Center
Group Prenatal Care
Maternity Care Home
Total
Total Number of Exit Forms with Valid Birth Information
N + 2125 1103 2740 5968
Number of Babies Born N + 2128 1125 2801 6054
Induction of Labor Excluding Planned C-Sections
N + 2133 1297 2826 6256
Yes % + 14.4 23.8 17.2 17.6
No % + 85.3 42.8 35.5 54
Not known % + 0 10.6 37.8 19.3
Missing % + 0.3 22.7 9.6 9.1
Delivery Method from Exit Data N + 2133 1433 3103 6669
Vaginal delivery % + 87.3 49.1 52.0 62.7
C-Section % + 12.4 24.3 29.6 23
Vaginal and C-Section % + 0 0 0 0
Missing % + 0.2 26.7 18.3 14.3
Women Who Had a Vaginal Birth as a Percentage of Women Who Planned to Deliver Vaginally
% + 90.9 80.2 81.6 85.4
VBAC2 N + 90 161 418 669
Yes % + 30.0 19.9 13.9 17.5
Repeat C-Section N + 90 161 418 669
Yes % + 70.0 80.1 86.1 82.5
Scheduled C-Section N + 265 348 920 1533
Yes % + 0 39.1 29.2 26.4
2 The denominator for VBAC and repeat C-section are calculated by adding the total respondents in both categories since we cannot confidently know who else had a previous C-section.
Notes: Gray cells labeled with a plus symbol indicate that fewer than 25 forms had been received during the reporting period. Statistics were calculated only if there were at least 25 forms received. Rows labeled with an “N” indicate the number of observations from which percentages have been calculated

7
Table 6. Infant Outcomes, through Quarter 1 2015
Data Element N or
%
ACCESS (Maternity Care
Home)
Birth Center
Group Prenatal Care
Maternity Care Home
Total
Number of Live Births by Estimated Gestational Age (EGA)
N + 2115 1140 2617 5872
Preterm Births, <37 weeks EGA N + 112 131 461 704
% + 5.3 11.5 17.6 12.0
Non-Preterm Births, ≥37 weeks EGA N + 1994 823 1945 4762
% + 94.3 72.2 74.3 81.1
Missing N + – 186 211 406
% + – 16.3 8.1 6.9
Number of Live Births by Birth Weight N + 2115 1140 2617 5872
Low Birth Weight, <2500 grams N + 75 147 412 634
% + 3.5 12.9 15.7 10.8
Not Low Birth Weight, ≥ 2500 grams N + 1810 993 2019 4822
% + 85.6 87.1 77.2 82.1
Missing N + 240 13 197 450
% + 11.3 1.1 7.5 7.7
Notes: Gray cells labeled with a plus symbol indicate that fewer than 25 forms had been received during the reporting period. Statistics were calculated only if there were at least 25 forms received. Yellow cells labeled with a dash symbol indicate that between 0 and 11 responses had been received during the reporting period. Statistics were only calculated for items with at least 11 responses. Rows labeled with an “N” indicate the number of observations from which percentages have been calculated.
Table 7. Breastfeeding and Family Planning, through Quarter 1 2015
Data Element N or
%
ACCESS (Maternity Care
Home)
Birth Center
Group Prenatal Care
Maternity Care Home
Total
Breastfeeding After Delivery from Postpartum Survey Data
N 532 1533 1416 4000 6949
Yes % 67.5 86.4 64.7 61.5 67.7
No % 26.3 7.4 9.5 25.6 18.3
Prefer not to answer % 1.5 0.7 1.8 0.5 0.8
Missing % 4.7 5.6 24.0 12.3 13.2
Women Who Breastfed As a Percentage of Women Who Planned to Breastfeed
% 101.7 100.2 97.4 100.7 99.9
Had Birth Control Counseling After Delivery N 532 1533 1416 4000 6949
Yes % 60.9 71.6 60.8 69.7 68.3
No % 27.4 19.4 12.3 15.2 15.5
Unsure % 4.7 2.8 2.4 1.8 2.1
Missing % 7.0 6.2 24.5 13.3 14.0
Note: Rows labeled with an “N” indicate the number of observations from which percentages have been calculated.
TECHNICAL ASSISTANCE
In January 2015, the evaluation team spoke with officials from the Illinois Department of Healthcare and
Family Services (HFS) and the Illinois Department of Public Health (IDPH) to learn about the state’s
willingness to and process for releasing state Medicaid and birth certificate data (respectively) to the

8
Urban Institute in support of the impact analysis of the Strong Start evaluation. State officials were
receptive to supporting the evaluation, and HFS staff plan to link the Medicaid and birth certificate data.
Applications requesting Medicaid and birth certificate data were submitted to HFS and IDPH in February
and March 2015, respectively. In April, the evaluation team received provisional approval from HFS, but
is currently awaiting approval from IDPH. The team hopes to begin receiving data in late 2015.

9
Albert Einstein Healthcare Network
CASE STUDY
Albert Einstein Healthcare Network (Einstein) is a private, nonprofit health system with three acute-care
hospitals and many outpatient centers throughout the greater Philadelphia region. Einstein has
implemented the group prenatal care approach at two Strong Start sites: the Paley Clinic in the Einstein
Medical Center, Philadelphia (a large teaching hospital with a Level One Trauma center) and the
Genuardi clinic in suburban Montgomery County where another Einstein hospital (newly built in 2012) is
located. Both sites are high-volume maternity care practices, with approximately 3,000 births annually
at Einstein Medical Center Philadelphia and 1,600 at Einstein Medical Center Montgomery. Both serve a
large proportion of Medicaid beneficiaries; 70 percent of the Einstein Healthcare Network’s births across
facilities are Medicaid-funded. Both of Einstein’s Strong Start sites are following CHI’s
CenteringPregnancy approach.
Highlights from the second round of case study data collection include:
A new intake process was initiated in response to lower-than-expected enrollment. Initial
prenatal care visits are now scheduled simultaneously so that patients can be introduced to the
approach as a group (in the group prenatal care meeting space) rather than during individual
appointments.
Einstein providers were trained by the March of Dimes about the benefits of group prenatal care
for birth outcomes and encouraged to refer their patients to the Strong Start program. Ongoing
“in-reach” to providers continues, including at faculty meetings.
Though the awardee discontinued external marketing for its group prenatal care program
(including billboards and bus ads) in 2014 and shifted its focus to internal campaigns, it plans to
resume external marketing in 2015 after observing a 30 percent drop in enrollment (from 109
enrollees in the last quarter of 2014 to 69 newly enrolled participants in the first quarter of
2015) that was attributed to the marketing change.
Einstein has been awarded a HRSA Healthy Start grant. Key informants described several ways in
which the Healthy Start project complements Strong Start services. For example, the awardee
will use Healthy Start funding to add social worker support at outpatient clinics. Previously,
social workers were only available to pregnant women during inpatient stays. In addition, a
patient navigator funded by Healthy Start has been in place since March of 2015. She conducts
outreach to Strong Start enrollees to improve appointment attendance. The new intervention
may create some complexity for the evaluation in teasing out the effects of Strong Start on birth
outcomes.
In response to ongoing enrollment challenges, there is a plan for a new Strong Start Centering
site called Rising Sun. Providers at the site are currently being trained in the approach.

10
Though the program is not currently enrolling new participants in their third trimester, there has
been consideration of a “late to care” group (for those who enter care in the third trimester)
that would condense the material covered earlier in the program.
PARTICIPANT-LEVEL PROCESS EVALUATION
The information presented below is based on data submitted from the four evaluation forms through
Quarter 1 2015. By March 2015, Albert Einstein Healthcare Network had Intake Forms for 62 percent of
participants enrolled through Quarter 1 2015 (354 Intake Forms for 572 participants). In addition, Albert
Einstein Healthcare Network submitted 202 Third Trimester Surveys, 127 Postpartum Surveys, and 267
Exit Forms. The tables below present data collected on Albert Einstein Healthcare Network’s
participants with aggregated rates by approach for the purpose of comparison.
Table 1. Enrollment and Forms Submitted, through Quarter 1 2015
Data Element N or
% EINSTEIN (Group
Prenatal Care) Birth
Center Group
Prenatal Care Maternity Care Home
Total
Newly Enrolled in Q1 2015 N 69 739 948 2638 4325
Total Ever Enrolled through Q1 2015 N 572 4739 5576 13232 23547
Number of Women Delivered through Q1 2015 N 399 2275 2755 6189 11219
Intake Forms Received through Q1 2015 N 354 2993 4401 11761 19155
Received through Q1 2015 as a percentage of the number of women ever enrolled
% 61.9 63.2 78.9 88.9 81.3
Third Trimester Surveys Received through Q1 2015
N 202 1876 2145 4683 8704
Received through Q1 2015 as a percentage of the number of women delivered
% 50.6 82.5 77.9 75.7 77.6
Postpartum Surveys Received through Q1 2015 N 127 1533 1416 4000 6949
Received through Q1 2015 as a percentage of the number of women delivered
% 31.8 67.4 51.4 64.6 61.9
Exit Forms Received through Q1 2015 N 267 2133 1433 3103 6669
Received through Q1 2015 as a percentage of the number of women delivered
% 66.9 93.8 52.0 50.1 59.4
Note: Rows labeled with an “N” indicate the number of observations from which percentages have been calculated.
Table 2. Sociodemographic Risk Factors, through Quarter 1 2015
Data Element N or
% EINSTEIN (Group
Prenatal Care) Birth
Center Group
Prenatal Care Maternity Care Home
Total
Mother’s Age at Intake N 354 2993 4401 11761 19155
Less than 18 years of age % 8.2 3.4 6.7 5.8 5.6
18 through 34 years of age % 86.2 86.1 75 81.4 80.7
35 years and older % 2.0 6.2 4.9 6.0 5.8
Missing % 3.7 4.3 13.4 6.8 7.9
Race and Ethnicity N 354 2993 4401 11761 19155
Hispanic % 15.5 25.7 39.2 22.9 27.1
Non-Hispanic white % 12.1 53.3 13.7 26.2 27.6
Non-Hispanic black % 65.5 14.8 39.2 46.3 39.8
Non-Hispanic Asian % 1.1 1.1 1.2 1.2 1.2

11
Data Element N or
% EINSTEIN (Group
Prenatal Care) Birth
Center Group
Prenatal Care Maternity Care Home
Total
Non-Hispanic other % 0.3 0.6 1.6 0.7 0.9
Non-Hispanic multiple race % 4.8 3.6 2.3 1.2 1.8
Missing % 0.6 0.9 2.8 1.5 1.7
Employed at Intake N 354 2993 4401 11761 19155
Yes % 37.3 39.7 34.6 38.8 38
No % 61.3 59.1 60.9 60.0 60.0
Missing % 1.4 1.2 4.5 1.2 2.0
Education Level at Intake N 354 2993 4401 11761 19155
Less than high school % 22.0 14.3 23.7 24.5 22.7
High school graduate or GED % 59.6 52.3 46.2 52.0 50.7
Bachelor’s degree % 2.5 10.1 3.1 2.5 3.9
Other college degree(s) % 5.7 12.7 7.2 6.0 7.3
Missing % 10.2 10.7 19.8 15.0 15.4
Relationship Status at Intake N 354 2993 4401 11761 19155
Married, living with spouse % 10.7 40.7 18.6 17.2 21.2
Married, not living with spouse % 1.7 1.7 2.1 1.9 1.9
Living with a partner % 31.6 32.2 31.3 30.6 31.0
In a relationship but not living together % 35.0 12.9 24.6 30.5 26.4
Not in a relationship right now % 16.7 11.1 17.0 17.8 16.6
Missing % 4.2 1.3 6.4 2.0 2.9
Smokes Cigarettes at Intake N 354 2993 4401 11761 19155
Yes % 11.0 10.1 7.8 14.1 12.0
No % 72.3 77.1 71.7 77.8 76.3
Missing % 16.7 12.9 20.4 8.1 11.7
Food Insecure at Intake N 354 2993 4401 11761 19155
Yes % 20.3 18.1 18.5 16.1 16.9
No % 69.8 76.9 61.4 76.2 72.9
Missing* % 9.9 5.0 20.0 7.7 10.1
Exhibiting Depressive Symptoms at Intake** N 354 2993 4401 11761 19155
Yes % 34.7 21.8 25.2 23.4 23.5
No % 47.2 69.3 57.0 69.3 66.4
Missing* % 18.0 9.0 17.9 7.3 10.0
Have Experienced Intimate Partner Violence in a Relationship***
N 354 2993 4401 11761 19155
Yes % 19.2 20.6 17.1 19.0 18.8
No % 78.8 77.2 68.4 78.5 76.0
Missing* % 2.0 2.1 14.5 2.4 5.1
Notes: Cells that contain one asterisk indicate that the ‘Missing’ category includes respondents who did not answer all of the items required to calculate this measure. Cells that contain two asterisks indicate that this is as measured by a shortened version of the CES-D. Cells that contain three asterisks indicate that this is as measured by the Slapped, Threatened, and Throw (STaT) screener. Rows labeled with an “N” indicate the number of observations from which percentages have been calculated.
Table 3. Medical Risk Factors Prior to Current Pregnancy, through Quarter 1 2015
Data Element N or
% EINSTEIN (Group
Prenatal Care) Birth
Center Group
Prenatal Care Maternity Care Home
Total
Inter-Pregnancy Interval with Current Pregnancy Since Last Birth
N 152 1127 700 1914 3741

12
Data Element N or
% EINSTEIN (Group
Prenatal Care) Birth
Center Group
Prenatal Care Maternity Care Home
Total
<18 months % 12.4 24.3 18.0 19.5 20.7
≥18 months % 38.2 39.8 48.3 51.9 47.6
Missing % 49.3 35.9 33.7 28.6 31.8
Previous Preterm Birth(s) Between 20 and 36 weeks, 6 days EGA
N 152 1127 700 1914 3741
Yes % 22.4 10.7 11.4 18.9 15.0
No % 69.7 89.3 63.9 63.2 71.2
Not Known % 5.3 0 18.6 14.9 11.1
Missing % 2.6 0 6.1 3.0 2.7
Previous Birth(s) Less than 2,500 grams N 152 1127 700 1914 3741
Yes % 19.7 1.9 8.6 14.8 9.7
No % 70.4 95.8 60.4 61.7 71.7
Not Known % 8.6 0 24.7 19.2 14.5
Missing % 1.3 2.3 6.3 4.3 4.1
Pre-Pregnancy Diagnosis of Type I Diabetes N 267 2133 1433 3103 6669
Yes % 1.1 0.5 1.3 1.5 1.1
No % 96.6 99.5 74.2 84.4 87.0
Not Known % 0.7 0 7.7 11.1 6.8
Missing % 1.5 0 16.7 3.1 5.0
Pre-Pregnancy Diagnosis of Type II Diabetes N 267 2133 1433 3103 6669
Yes % 1.5 0 2.6 1.9 1.5
No % 96.3 5.0 72.9 83.3 56.1
Not Known % 0.7 0 7.7 11.1 6.8
Missing % 1.5 94.9 16.7 3.7 35.7
Pre-Pregnancy Diagnosis of Hypertension N 267 2133 1433 3103 6669
Yes % 7.5 0.5 6.0 9.5 5.9
No % 89.9 99.5 66.7 77.4 82.2
Not Known % 1.1 0 7.6 10.2 6.4
Missing % 1.5 0 19.7 2.9 5.6
Note: Rows labeled with an “N” indicate the number of observations from which percentages have been calculated.
Table 4. Medical Risk Factors during the Current Pregnancy, through Quarter 1 2015
Data Element N or
% EINSTEIN (Group
Prenatal Care) Birth
Center Group
Prenatal Care Maternity Care Home
Total
Gestational Diabetes N 267 2133 1433 3103 6669
Yes % 2.6 2.7 4.2 5.3 4.2
No % 88.8 97.3 65.4 76.0 80.6
Not Known % 4.9 0 10.3 15.9 9.6
Missing % 3.7 0 20.1 2.8 5.6
Pregnancy-Related Hypertension N 267 2133 1433 3103 6669
Yes % 12.0 1.3 7.8 7.7 5.7
No % 77.2 98.7 62.6 74.8 79.8
Not Known % 6.4 0 9.4 14.6 8.8
Missing % 4.5 0 20.2 2.9 5.7
Note: Rows labeled with an “N” indicate the number of observations from which percentages have been calculated.

13
Table 5. Birth and Delivery Methods, through Quarter 1 2015
Data Element N or
% EINSTEIN (Group
Prenatal Care) Birth
Center Group
Prenatal Care Maternity Care Home
Total
Total Number of Exit Forms with Valid Birth Information
N 264 2125 1103 2740 5968
Number of Babies Born N 266 2128 1125 2801 6054
Induction of Labor Excluding Planned C-Sections
N 241 2133 1297 2826 6256
Yes % 29.9 14.4 23.8 17.2 17.6
No % 54.8 85.3 42.8 35.5 54.0
Not known % 12.0 0 10.6 37.8 19.3
Missing % 3.3 0.3 22.7 9.6 9.1
Delivery Method from Exit Data N 267 2133 1433 3103 6669
Vaginal delivery % 67.0 87.3 49.1 52.0 62.7
C-Section % 24.7 12.4 24.3 29.6 23.0
Vaginal and C-Section % 0 0 0 0 0
Missing % 8.2 0.2 26.7 18.3 14.3
Women Who Had a Vaginal Birth as a Percentage of Women Who Planned to Deliver Vaginally
% 84.4 90.9 80.2 81.6 85.4
VBAC3 N 37 90 161 418 669
Yes % 32.4 30.0 19.9 13.9 17.5
Repeat C-Section N 37 90 161 418 669
Yes % 67.6 70.0 80.1 86.1 82.5
Scheduled C-Section N 66 265 348 920 1533
Yes % 39.4 0 39.1 29.2 26.4
3 The denominator for VBAC and repeat C-section are calculated by adding the total respondents in both categories since we cannot confidently know who else had a previous C-section.
Note: Rows labeled with an “N” indicate the number of observations from which percentages have been calculated.
Table 6. Infant Outcomes, through Quarter 1 2015
Data Element N or
% EINSTEIN (Group
Prenatal Care) Birth
Center Group
Prenatal Care Maternity Care Home
Total
Number of Live Births by Estimated Gestational Age (EGA)
N 243 2115 1140 2617 5872
Preterm Births, <37 weeks EGA N 25 112 131 461 704
% 10.3 5.3 11.5 17.6 12.0
Non-Preterm Births, ≥37 weeks EGA N 204 1994 823 1945 4762
% 84.0 94.3 72.2 74.3 81.1
Missing N 14 – 186 211 406
% 5.8 – 16.3 8.1 6.9
Number of Live Births by Birth Weight N 243 2115 1140 2617 5872
Low Birth Weight, <2500 grams N 25 75 147 412 634
% 10.3 3.5 12.9 15.7 10.8
Not Low Birth Weight, ≥ 2500 grams N 221 1810 993 2019 4822
% 90.9 85.6 87.1 77.2 82.1
Missing N – 240 13 197 450
% – 11.3 1.1 7.5 7.7

14
Note: Yellow cells labeled with a dash symbol indicate that between 0 and 11 responses had been received during the reporting period. Statistics were only calculated for items with at least 11 responses. Rows labeled with an “N” indicate the number of observations from which percentages have been calculated.
Table 7. Breastfeeding and Family Planning, through Quarter 1 2015
Data Element N or
% EINSTEIN (Group
Prenatal Care) Birth
Center Group
Prenatal Care Maternity Care Home
Total
Breastfeeding After Delivery from Postpartum Survey Data
N 127 1533 1416 4000 6949
Yes % 38.6 86.4 64.7 61.5 67.7
No % 4.7 7.4 9.5 25.6 18.3
Prefer not to answer % 1.6 0.7 1.8 0.5 0.8
Missing % 55.1 5.6 24.0 12.3 13.2
Women Who Breastfed As a Percentage of Women Who Planned to Breastfeed
% 106.1 100.2 97.4 100.7 99.9
Had Birth Control Counseling After Delivery N 127 1533 1416 4000 6949
Yes % 35.4 71.6 60.8 69.7 68.3
No % 7.9 19.4 12.3 15.2 15.5
Unsure % 0.8 2.8 2.4 1.8 2.1
Missing % 55.9 6.2 24.5 13.3 14.0
Note: Rows labeled with an “N” indicate the number of observations from which percentages have been calculated.
TECHNICAL ASSISTANCE
In March 2015, the evaluation team spoke with officials from the Pennsylvania Department of Human
Services (DHS) and the Pennsylvania Department of Health (DOH) to learn about the state’s willingness
to and process for releasing state Medicaid and birth certificate data to the Urban Institute for the
impact analysis of the Strong Start evaluation. State officials were receptive to supporting the
evaluation, and DHS staff plan to link the Medicaid and birth certificate data for the impact analysis.
Applications requesting Medicaid and birth certificate data were submitted to DHS and DOH in March
and April 2015, respectively. In April 2015, the evaluation team received approval from DOH but is
currently awaiting approval from DHS following our submission of responses to questions from its legal
department. The team hopes to begin receiving data in late 2015.

15
American Association of Birth Centers
CASE STUDY
American Association of Birth Centers (AABC) is the national trade association for birth centers in the
United States, with a mission to support and promote birth centers as a model of maternity care. AABC
operates the largest number of Strong Start sites; at the time of Y2 data collection, AABC was operating
41 sites in 18 states across the country. AABC operates all but one of the Strong Start initiative’s birth
center approach sites. Overall, awardee and site-level staff involved in AABC’s Strong Start program
indicate that implementation has been going well, with progress on many fronts.
Highlights from the second round of case study data collection include:
Though enrollment continues to lag at some sites, overall it increased considerably in the
second program year. Enrollment was around 1200 participants (ever enrolled) at the start of
the Y1 case studies, compared to nearly 4,000 participants enrolled at the start of Y2 case study
data collection.
Changes to the Strong Start eligibility criteria (in June 2014) contributed to the enrollment
increase by both expanding the pool of eligible patients and simplifying enrollment for sites.
More specifically, all pregnant women who are enrolled or eligible for Medicaid or CHIP can
enroll in Strong Start at AABC sites with no additional preterm risk factor. For a period of about
one year (June 2014-June 2015), AABC allowed sites to enroll patients at any gestational age.
Even during this time, however, some sites chose not to enroll women past 36 weeks gestation
because it would be difficult to complete the three peer counselor visits that are required during
the prenatal period. [In the months since Y2 case study data collection, AABC has reinstated a
gestational age cutoff of 28 weeks in general, with enrollment of women up to 32 weeks
gestation in special circumstances.]
No longer requiring a second risk factor has boosted enrollment particularly at birth centers
with low-risk patient populations. The sites still complete the AABC-developed risk assessment
form when patients are enrolled in the program. This information is needed for Strong Start
program monitoring reports, and is also generally used by peer counselors to identify patient
needs and prioritize education and supportive services.
Data collection has improved over the past year. In addition to providing individualized technical
assistance to sites on data collection and use of AABC’s Perinatal Data Registry, the awardee
recently implemented a policy of withholding Strong Start payments until sites are current with
data collection.
The overall number of AABC sites has been stable. A few are expected to leave the program this
year, but several others will begin Strong Start operations in the coming months.

16
AABC’s peer counseling services have remained unchanged (four encounters per pregnancy—
three prenatal encounters, and one postpartum encounter), though program staff are now
tracking service delivery mode and type of counselor (nurse or non-nurse) and plan to use this
information when analyzing program outcomes.
Most peer counselor encounters currently occur in person at the birth center. This represents a
shift for some birth centers that began their programs by conducting visits by phone, in the
participants’ home, or in local restaurants and coffee shops. Some sites made this shift because
peer counselors became more available and others wished to make it more convenient for
participants to schedule and attend the visits.
In between formal encounters, peer counselors are typically available to participants via phone
and email. Some peer counselors also communicate with participants via text messages and
have found this to be an effective way to maintain contact.
Birth centers and Strong Start participants have access to some new resources, including a
website, a blog, and two web-based tools called Maternity Neighborhood Care Guides and the
AABC Maternity Surveys. AABC has also worked to increase its social media presence for Strong
Start.
Program staff are pleased with program outcomes so far, such as low rates of preterm birth and
Cesarean section, and report that Strong Start participants are satisfied with their care, which is
verified by the evaluation’s Participant-Level Process Evaluation data. Strong Start has also
improved birth centers’ capacity to support patients and has increased knowledge about the
birth center approach more generally.
PARTICIPANT-LEVEL PROCESS EVALUATION
The information presented below is based on data submitted from the four evaluation forms through
Quarter 1 2015. By March 2015, American Association of Birth Centers (AABC) had Intake Forms for 62
percent of participants enrolled through Quarter 1 2015 (2842 Intake Forms for 4557 participants). In
addition, American Association of Birth Centers submitted 1772 Third Trimester Surveys, 1441
Postpartum Surveys, and 2133 Exit Forms. The tables below present data collected on American
Association of Birth Centers’ participants with aggregated rates by approach for the purpose of
comparison.
Table 1. Enrollment and Forms Submitted, through Quarter 1 2015
Data Element N or
% AABC (Birth
Center) Birth
Center Group
Prenatal Care Maternity Care Home
Total
Newly Enrolled in Q1 2015 N 694 739 948 2638 4325
Total Ever Enrolled through Q1 2015 N 4557 4739 5576 13232 23547
Number of Women Delivered through Q1 2015
N 2174 2275 2755 6189 11219
Intake Forms Received through Q1 2015 N 2842 2993 4401 11761 19155

17
Data Element N or
% AABC (Birth
Center) Birth
Center Group
Prenatal Care Maternity Care Home
Total
Received through Q1 2015 as a percentage of the number of women ever enrolled
% 62.4 63.2 78.9 88.9 81.3
Third Trimester Surveys Received through Q1 2015
N 1772 1876 2145 4683 8704
Received through Q1 2015 as a percentage of the number of women delivered
% 81.5 82.5 77.9 75.7 77.6
Postpartum Surveys Received through Q1 2015
N 1441 1533 1416 4000 6949
Received through Q1 2015 as a percentage of the number of women delivered
% 66.3 67.4 51.4 64.6 61.9
Exit Forms Received through Q1 2015 N 2133 2133 1433 3103 6669
Received through Q1 2015 as a percentage of the number of women delivered
% 98.1 93.8 52.0 50.1 59.4
Note: Rows labeled with an “N” indicate the number of observations from which percentages have been calculated.
Table 2. Sociodemographic Risk Factors, through Quarter 1 2015
Data Element N or
% AABC (Birth
Center) Birth
Center Group
Prenatal Care Maternity Care Home
Total
Mother’s Age at Intake N 2842 2993 4401 11761 19155
Less than 18 years of age % 3.3 3.4 6.7 5.8 5.6
18 through 34 years of age % 86.2 86.1 75.0 81.4 80.7
35 years and older % 6.2 6.2 4.9 6.0 5.8
Missing % 4.3 4.3 13.4 6.8 7.9
Race and Ethnicity N 2842 2993 4401 11761 19155
Hispanic % 26.7 25.7 39.2 22.9 27.1
Non-Hispanic white % 56.0 53.3 13.7 26.2 27.6
Non-Hispanic black % 11.1 14.8 39.2 46.3 39.8
Non-Hispanic Asian % 1.1 1.1 1.2 1.2 1.2
Non-Hispanic other % 0.6 0.6 1.6 0.7 0.9
Non-Hispanic multiple race % 3.5 3.6 2.3 1.2 1.8
Missing % 0.9 0.9 2.8 1.5 1.7
Employed at Intake N 2842 2993 4401 11761 19155
Yes % 39.9 39.7 34.6 38.8 38
No % 58.9 59.1 60.9 60.0 60.0
Missing % 1.2 1.2 4.5 1.2 2
Education Level at Intake N 2842 2993 4401 11761 19155
Less than high school % 13.8 14.3 23.7 24.5 22.7
High school graduate or GED % 52.1 52.3 46.2 52.0 50.7
Bachelor’s degree % 10.4 10.1 3.1 2.5 3.9
Other college degree(s) % 13.0 12.7 7.2 6.0 7.3
Missing % 10.7 10.7 19.8 15.0 15.4
Relationship Status at Intake N 2842 2993 4401 11761 19155
Married, living with spouse % 42.4 40.7 18.6 17.2 21.2
Married, not living with spouse % 1.8 1.7 2.1 1.9 1.9
Living with a partner % 32.4 32.2 31.3 30.6 31.0
In a relationship but not living together % 11.9 12.9 24.6 30.5 26.4
Not in a relationship right now % 10.3 11.1 17.0 17.8 16.6

18
Data Element N or
% AABC (Birth
Center) Birth
Center Group
Prenatal Care Maternity Care Home
Total
Missing % 1.1 1.3 6.4 2.0 2.9
Smokes Cigarettes at Intake N 2842 2993 4401 11761 19155
Yes % 9.9 10.1 7.8 14.1 12.0
No % 77.3 77.1 71.7 77.8 76.3
Missing % 12.8 12.9 20.4 8.1 11.7
Food Insecure at Intake N 2842 2993 4401 11761 19155
Yes % 17.2 18.1 18.5 16.1 16.9
No % 77.8 76.9 61.4 76.2 72.9
Missing*
% 5.0 5.0 20.0 7.7 10.1
Exhibiting Depressive Symptoms at Intake** N 2842 2993 4401 11761 19155
Yes % 21.0 21.8 25.2 23.4 23.5
No % 70.1 69.3 57.0 69.3 66.4
Missing* % 8.9 9.0 17.9 7.3 10.0
Have Experienced Intimate Partner Violence in a Relationship***
N 2842 2993 4401 11761 19155
Yes % 20.3 20.6 17.1 19.0 18.8
No % 77.6 77.2 68.4 78.5 76.0
Missing* % 2.2 2.1 14.5 2.4 5.1
Notes: Cells that contain one asterisk indicate that the ‘Missing’ category includes respondents who did not answer all of the items required to calculate this measure. Cells that contain two asterisks indicate that this is as measured by a shortened version of the CES-D. Cells that contain three asterisks indicate that this is as measured by the Slapped, Threatened, and Throw (STaT) screener. Rows labeled with an “N” indicate the number of observations from which percentages have been calculated.
Table 3. Medical Risk Factors Prior to Current Pregnancy, through Quarter 1 2015
Data Element N or
% AABC (Birth
Center) Birth
Center Group
Prenatal Care Maternity Care Home
Total
Inter-Pregnancy Interval with Current Pregnancy Since Last Birth
N 1127 1127 700 1914 3741
<18 months % 24.3 24.3 18.0 19.5 20.7
≥18 months % 39.8 39.8 48.3 51.9 47.6
Missing % 35.9 35.9 33.7 28.6 31.8
Previous Preterm Birth(s) Between 20 and 36 weeks, 6 days EGA
N 1127 1127 700 1914 3741
Yes % 10.7 10.7 11.4 18.9 15.0
No % 89.3 89.3 63.9 63.2 71.2
Not Known % 0 0 18.6 14.9 11.1
Missing % 0 0 6.1 3.0 2.7
Previous Birth(s) Less than 2,500 grams N 1127 1127 700 1914 3741
Yes % 1.9 1.9 8.6 14.8 9.7
No % 95.8 95.8 60.4 61.7 71.7
Not Known % 0 0 24.7 19.2 14.5
Missing % 2.3 2.3 6.3 4.3 4.1
Pre-Pregnancy Diagnosis of Type I Diabetes N 2133 2133 1433 3103 6669
Yes % 0.5 0.5 1.3 1.5 1.1
No % 99.5 99.5 74.2 84.4 87
Not Known % 0 0 7.7 11.1 6.8
Missing % 0 0 16.7 3.1 5.0

19
Data Element N or
% AABC (Birth
Center) Birth
Center Group
Prenatal Care Maternity Care Home
Total
Pre-Pregnancy Diagnosis of Type II Diabetes N 2133 2133 1433 3103 6669
Yes % 0 0 2.6 1.9 1.5
No % 5.0 5.0 72.9 83.3 56.1
Not Known % 0 0 7.7 11.1 6.8
Missing % 94.9 94.9 16.7 3.7 35.7
Pre-Pregnancy Diagnosis of Hypertension N 2133 2133 1433 3103 6669
Yes % 0.5 0.5 6.0 9.5 5.9
No % 99.5 99.5 66.7 77.4 82.2
Not Known % 0 0 7.6 10.2 6.4
Missing % 0 0 19.7 2.9 5.6
Note: Rows labeled with an “N” indicate the number of observations from which percentages have been calculated.
Table 4. Medical Risk Factors during the Current Pregnancy, through Quarter 1 2015
Data Element N or
% AABC (Birth
Center) Birth
Center Group
Prenatal Care Maternity Care Home
Total
Gestational Diabetes N 2133 2133 1433 3103 6669
Yes % 2.7 2.7 4.2 5.3 4.2
No % 97.3 97.3 65.4 76.0 80.6
Not Known % 0 0 10.3 15.9 9.6
Missing % 0 0 20.1 2.8 5.6
Pregnancy-Related Hypertension N 2133 2133 1433 3103 6669
Yes % 1.3 1.3 7.8 7.7 5.7
No % 98.7 98.7 62.6 74.8 79.8
Not Known % 0 0 9.4 14.6 8.8
Missing % 0 0 20.2 2.9 5.7
Note: Rows labeled with an “N” indicate the number of observations from which percentages have been calculated.
Table 5. Birth and Delivery Methods, through Quarter 1 2015
Data Element N or
% AABC (Birth
Center) Birth
Center Group
Prenatal Care Maternity Care Home
Total
Total Number of Exit Forms with Valid Birth Information
N 2125 2125 1103 2740 5968
Number of Babies Born N 2128 2128 1125 2801 6054
Induction of Labor Excluding Planned C-Sections
N 2133 2133 1297 2826 6256
Yes % 14.4 14.4 23.8 17.2 17.6
No % 85.3 85.3 42.8 35.5 54.0
Not known % 0 0 10.6 37.8 19.3
Missing % 0.3 0.3 22.7 9.6 9.1
Delivery Method from Exit Data N 2133 2133 1433 3103 6669
Vaginal delivery % 87.3 87.3 49.1 52.0 62.7
C-Section % 12.4 12.4 24.3 29.6 23.0
Vaginal and C-Section % 0 0 0 0 0
Missing % 0.2 0.2 26.7 18.3 14.3
Women Who Had a Vaginal Birth as a Percentage of Women Who Planned to Deliver Vaginally
% 90.9 90.9 80.2 81.6 85.4

20
Data Element N or
% AABC (Birth
Center) Birth
Center Group
Prenatal Care Maternity Care Home
Total
VBAC4 N 90 90 161 418 669
Yes % 30.0 30.0 19.9 13.9 17.5
Repeat C-Section N 90 90 161 418 669
Yes % 70.0 70.0 80.1 86.1 82.5
Scheduled C-Section N 265 265 348 920 1533
Yes % 0 0 39.1 29.2 26.4
4 The denominator for VBAC and repeat C-section are calculated by adding the total respondents in both categories since we cannot confidently know who else had a previous C-section.
Note: Rows labeled with an “N” indicate the number of observations from which percentages have been calculated.
Table 6. Infant Outcomes, through Quarter 1 2015
Data Element N or
% AABC (Birth
Center) Birth
Center Group
Prenatal Care Maternity Care Home
Total
Number of Live Births by Estimated Gestational Age (EGA)
N 2115 2115 1140 2617 5872
Preterm Births, <37 weeks EGA N 112 112 131 461 704
% 5.3 5.3 11.5 17.6 12.0
Non-Preterm Births, ≥37 weeks EGA N 1994 1994 823 1945 4762
% 94.3 94.3 72.2 74.3 81.1
Missing N – – 186 211 406
% – – 16.3 8.1 6.9
Number of Live Births by Birth Weight N 2115 2115 1140 2617 5872
Low Birth Weight, <2500 grams N 75 75 147 412 634
% 3.5 3.5 12.9 15.7 10.8
Not Low Birth Weight, ≥ 2500 grams N 1810 1810 993 2019 4822
% 85.6 85.6 87.1 77.2 82.1
Missing N 240 240 13 197 450
% 11.3 11.3 1.1 7.5 7.7
Notes: Yellow cells labeled with a dash symbol indicate that between 0 and 11 responses had been received during the reporting period. Statistics were only calculated for items with at least 11 responses. Rows labeled with an “N” indicate the number of observations from which percentages have been calculated.
Table 7. Breastfeeding and Family Planning, through Quarter 1 2015
Data Element N or
% AABC (Birth
Center) Birth
Center Group
Prenatal Care Maternity Care Home
Total
Breastfeeding After Delivery from Postpartum Data
N 1441 1533 1416 4000 6949
Yes % 86.5 86.4 64.7 61.5 67.7
No % 7.2 7.4 9.5 25.6 18.3
Prefer not to answer % 0.7 0.7 1.8 0.5 0.8
Missing % 5.6 5.6 24.0 12.3 13.2
Women Who Breastfed As a Percentage of Women Who Planned to Breastfeed
% 100.1 100.2 97.4 100.7 99.9
Had Birth Control Counseling After Delivery N 1441 1533 1416 4000 6949
Yes % 70.3 71.6 60.8 69.7 68.3
No % 20.4 19.4 12.3 15.2 15.5
Unsure % 3.0 2.8 2.4 1.8 2.1

21
Data Element N or
% AABC (Birth
Center) Birth
Center Group
Prenatal Care Maternity Care Home
Total
Missing % 6.3 6.2 24.5 13.3 14
Note: Rows labeled with an “N” indicate the number of observations from which percentages have been calculated.
TECHNICAL ASSISTANCE
Of the 20 states in which we are seeking data, AABC has sites in the following states: Arizona, California,
Florida, Illinois, Maryland, Pennsylvania, South Carolina, Tennessee and Texas. Please see the following
awardee sections for more information regarding our efforts in these states: Maricopa Integrated Health
System (AZ), Los Angeles County Department of Healthcare Services (CA), Florida Association of Healthy
Start Coalitions (FL), ACCESS Community Health Network (IL), Johns Hopkins University (MD), Albert
Einstein Healthcare Network (PA), Medical University of South Carolina (SC), University of Tennessee
Health Science Center (TN) and Harris Health System (TX).

22
Amerigroup Corporation
CASE STUDY
Amerigroup Corporation (Amerigroup), a wholly-owned subsidiary of Anthem, Inc., is a national
managed care organization that works extensively with state-sponsored health programs (like
Medicaid) across the U.S. Amerigroup and Anthem’s other affiliate health plans serve more than 5.6
million people in state-sponsored health plans across 19 states, including seniors, individuals with
disabilities, and low-income families. Though Amerigroup led the development of the Strong Start
proposal in Louisiana, the Southeast Louisiana Area Health Education Center (SELAHEC) manages the
day-to-day operations of the award. Amerigroup assists with many of Strong Start’s administrative
aspects, including the budget, while SELAHEC is responsible for “on the ground” implementation and
management which includes working directly with the providers and sites involved in Strong Start,
collecting and reporting evaluation data, and managing the grant funds. Key informants noted progress
in a number of areas since the Y1 site visit:
At the time of this writing, the awardee was managing seven Strong Start sites in Louisiana.5
5 The seven sites were: LSU New Orleans—Carrolton Clinic, LSU Shreveport Clinic, LSU New Orleans—Perdido Clinic, Ochsner Women’s Services, Ochsner—St. Charles Clinic, Woman’s Health Center for OB/GYN at Woman’s Hospital and Woman’s Hospital at Gonzales.
In
addition to the five sites reported in Year 1, the awardee has added a new site in Gentilly
affiliated with Daughters of Charity, as well as an OB/GYN clinic at Woman’s Hospital in Baton
Rouge, affiliated with the Louisiana State University Health System. All sites provide group
prenatal care using the CenteringPregnancy model , and are working with the Centering
Healthcare Institute (CHI) to obtain CenteringPregnancy site certification. Data specialists have
been hired for most of the Strong Start sites to reduce the data collection burden on employees
working with group prenatal care.
The awardee has increased its efforts to facilitate cross-site collaboration by, for example,
initiating a standard bimonthly call with all provider sites encouraged to participate. SELAHEC
also planned and convened a Learning Collaborative, held in Baton Rouge in February 2015,
which brought together Strong Start providers and partners to brainstorm on issues surrounding
enrollment, recruitment, and retention.
Because of CMMI’s change in program eligibility criteria in June 2014, sites no longer require a
preterm birth risk factor (in addition to Medicaid eligibility) as a prerequisite for enrollment into
Strong Start. Sites generally enroll Medicaid women up to 28 weeks gestation, but some have
been enrolled by the sites past that benchmark to boost patient volume. In these cases, one of
the facilitators will provide late-enrollees with additional information needed one-on-one at the
beginning of their first session.
The Centering Pregnancy curriculum has been fairly consistently followed by provider sites over
the last year, with 10 two-hour sessions over the course of seven months, as well as a

23
postpartum session. All sites emphasize breastfeeding education and family planning support,
with community partners such as Healthy Start, the Women, Infants, and Children (WIC)
program, the Greater New Orleans Breastfeeding Awareness Coalition (GNOBAC), and the
Nurse-Family Partnership providing additional support as needed.
LSU-affiliated sites are soliciting help from LSU’s marketing department for Strong Start
outreach. Strong Start funding has also provided for AHEC to hire a research assistant to support
sites with recruitment and outreach efforts which include assisting with community events,
developing a Facebook page, and showcasing sites’ progress and activities on the Centering
Louisiana website.
All sites are using modified forms of opt-in enrollment—essentially giving pregnant women the
option of participating in group prenatal care—with different procedures for recruitment and
enrollment.
Low enrollment numbers have prompted some sites to combine Centering groups of women of
different gestational ages, which informants have stated is not ideal for the educational goals of
Centering Pregnancy.
Sites continue to experience problems with provider buy-in, citing the extra time it takes to
explain Centering to patients, a reluctance to lose patients, and concerns about whether
reimbursement rates will sufficiently compensate for the time spent conducting group prenatal
care. Amerigroup Louisiana health plan included enhanced reimbursement for group prenatal
care as part of its re-bid to continue participation in Bayou Health (Louisiana’s Medicaid
managed care initiative), which was awarded by the state Medicaid agency. AHEC has provided
information to Strong Start sites on how to engage the Amerigroup Louisiana health plan to
learn more about this opportunity. Another Bayou Health plan is also developing a pilot program
for enhanced reimbursement for CenteringPregnancy providers. The availability of these
incentives may be helpful to sites as they work on sustainability efforts in the coming months.
Sites are continuing to try to integrate medical residents into Strong Start enrollment and
Centering groups, but these efforts have been complicated by residents’ relatively short
obstetrical rotations and CHI’s recommendation against introducing new providers into existing
Centering groups.
PARTICIPANT-LEVEL PROCESS EVALUATION
The information presented below is based on data submitted from the four evaluation forms through
Quarter 1 2015. By March 2015, Amerigroup Corporation had Intake Forms for 89 percent of
participants enrolled through Quarter 1 2015 (283 Intake Forms for 317 participants). In addition,
Amerigroup Corporation submitted 170 Third Trimester Surveys, 44 Postpartum Surveys, and 60 Exit
Forms. The tables below present data collected on Amerigroup Corporation’s participants with
aggregated rates by approach for the purpose of comparison.

24
Table 1. Enrollment and Forms Submitted, through Quarter 1 2015
Data Element N or
%
AMERIGROUP (Group Prenatal
Care)
Birth Center
Group Prenatal Care
Maternity Care Home
Total
Newly Enrolled in Q1 2015 N 78 739 948 2638 4325
Total Ever Enrolled through Q1 2015 N 317 4739 5576 13232 23547
Number of Women Delivered through Q1 2015
N 102 2275 2755 6189 11219
Intake Forms Received through Q1 2015 N 283 2993 4401 11761 19155
Received through Q1 2015 as a percentage of the number of women ever enrolled
% 89.3 63.2 78.9 88.9 81.3
Third Trimester Surveys Received through Q1 2015
N 170 1876 2145 4683 8704
Received through Q1 2015 as a percentage of the number of women delivered
% 166.7 82.5 77.9 75.7 77.6
Postpartum Surveys Received through Q1 2015
N 44 1533 1416 4000 6949
Received through Q1 2015 as a percentage of the number of women delivered
% 43.1 67.4 51.4 64.6 61.9
Exit Forms Received through Q1 2015 N 60 2133 1433 3103 6669
Received through Q1 2015 as a percentage of the number of women delivered
% 58.8 93.8 52.0 50.1 59.4
Note: Rows labeled with an “N” indicate the number of observations from which percentages have been calculated.
Table 2. Sociodemographic Risk Factors, through Quarter 1 2015
Data Element N or
%
AMERIGROUP (Group Prenatal
Care)
Birth Center
Group Prenatal Care
Maternity Care Home
Total
Mother’s Age at Intake N 283 2993 4401 11761 19155
Less than 18 years of age % 1.4 3.4 6.7 5.8 5.6
18 through 34 years of age % 39.6 86.1 75.0 81.4 80.7
35 years and older % 2.1 6.2 4.9 6.0 5.8
Missing % 56.9 4.3 13.4 6.8 7.9
Race and Ethnicity N 283 2993 4401 11761 19155
Hispanic % 6.0 25.7 39.2 22.9 27.1
Non-Hispanic white % 19.8 53.3 13.7 26.2 27.6
Non-Hispanic black % 71.0 14.8 39.2 46.3 39.8
Non-Hispanic Asian % 1.1 1.1 1.2 1.2 1.2
Non-Hispanic other % 0 0.6 1.6 0.7 0.9
Non-Hispanic multiple race % 2.1 3.6 2.3 1.2 1.8
Missing % 0 0.9 2.8 1.5 1.7
Employed at Intake N 283 2993 4401 11761 19155
Yes % 44.5 39.7 34.6 38.8 38.0
No % 54.8 59.1 60.9 60.0 60.0
Missing % 0.7 1.2 4.5 1.2 2.0
Education Level at Intake N 283 2993 4401 11761 19155
Less than high school % 21.2 14.3 23.7 24.5 22.7
High school graduate or GED % 60.8 52.3 46.2 52.0 50.7
Bachelor’s degree % 3.2 10.1 3.1 2.5 3.9

25
Data Element N or
%
AMERIGROUP (Group Prenatal
Care)
Birth Center
Group Prenatal Care
Maternity Care Home
Total
Other college degree(s) % 8.2 12.7 7.2 6.0 7.3
Missing % 6.7 10.7 19.8 15.0 15.4
Relationship Status at Intake N 283 2993 4401 11761 19155
Married, living with spouse % 11.7 40.7 18.6 17.2 21.2
Married, not living with spouse % 2.1 1.7 2.1 1.9 1.9
Living with a partner % 32.9 32.2 31.3 30.6 31.0
In a relationship but not living together % 32.9 12.9 24.6 30.5 26.4
Not in a relationship right now % 17.7 11.1 17.0 17.8 16.6
Missing % 2.8 1.3 6.4 2.0 2.9
Smokes Cigarettes at Intake N 283 2993 4401 11761 19155
Yes % 9.5 10.1 7.8 14.1 12.0
No % 74.9 77.1 71.7 77.8 76.3
Missing % 15.5 12.9 20.4 8.1 11.7
Food Insecure at Intake N 283 2993 4401 11761 19155
Yes % 24.0 18.1 18.5 16.1 16.9
No % 69.3 76.9 61.4 76.2 72.9
Missing*
% 6.7 5.0 20.0 7.7 10.1
Exhibiting Depressive Symptoms at Intake**
N 283 2993 4401 11761 19155
Yes % 32.5 21.8 25.2 23.4 23.5
No % 54.1 69.3 57.0 69.3 66.4
Missing* % 13.4 9.0 17.9 7.3 10.0
Have Experienced Intimate Partner Violence in a Relationship***
N 283 2993 4401 11761 19155
Yes % 20.8 20.6 17.1 19.0 18.8
No % 77.0 77.2 68.4 78.5 76.0
Missing* % 2.2 2.1 14.5 2.4 5.1
Notes: Cells that contain one asterisk indicate that the ‘Missing’ category includes respondents who did not answer all of the items required to calculate this measure. Cells that contain two asterisks indicate that this is as measured by a shortened version of the CES-D. Cells that contain three asterisks indicate that this is as measured by the Slapped, Threatened, and Throw (STaT) screener. Rows labeled with an “N” indicate the number of observations from which percentages have been calculated.
Table 3. Medical Risk Factors Prior to Current Pregnancy, through Quarter 1 2015
Data Element N or
%
AMERIGROUP (Group Prenatal
Care)
Birth Center
Group Prenatal Care
Maternity Care Home
Total
Inter-Pregnancy Interval with Current Pregnancy Since Last Birth
N 28 1127 700 1914 3741
<18 months % 7.1 24.3 18.0 19.5 20.7
≥18 months % 67.9 39.8 48.3 51.9 47.6
Missing % 25.0 35.9 33.7 28.6 31.8
Previous Preterm Birth(s) Between 20 and 36 weeks, 6 days EGA
N 28 1127 700 1914 3741
Yes % 7.1 10.7 11.4 18.9 15.0
No % 28.6 89.3 63.9 63.2 71.2
Not Known % 0 0 18.6 14.9 11.1
Missing % 64.3 0 6.1 3.0 2.7

26
Data Element N or
%
AMERIGROUP (Group Prenatal
Care)
Birth Center
Group Prenatal Care
Maternity Care Home
Total
Previous Birth(s) Less than 2,500 grams N 28 1127 700 1914 3741
Yes % 10.7 1.9 8.6 14.8 9.7
No % 28.6 95.8 60.4 61.7 71.7
Not Known % 0 0 24.7 19.2 14.5
Missing % 60.7 2.3 6.3 4.3 4.1
Pre-Pregnancy Diagnosis of Type I Diabetes N 60 2133 1433 3103 6669
Yes % 0 0.5 1.3 1.5 1.1
No % 31.7 99.5 74.2 84.4 87.0
Not Known % 0 0 7.7 11.1 6.8
Missing % 68.3 0 16.7 3.1 5.0
Pre-Pregnancy Diagnosis of Type II Diabetes N 60 2133 1433 3103 6669
Yes % 0 0 2.6 1.9 1.5
No % 31.7 5.0 72.9 83.3 56.1
Not Known % 0 0 7.7 11.1 6.8
Missing % 68.3 94.9 16.7 3.7 35.7
Pre-Pregnancy Diagnosis of Hypertension N 60 2133 1433 3103 6669
Yes % 0 0.5 6.0 9.5 5.9
No % 31.7 99.5 66.7 77.4 82.2
Not Known % 0 0 7.6 10.2 6.4
Missing % 68.3 0 19.7 2.9 5.6
Note: Rows labeled with an “N” indicate the number of observations from which percentages have been calculated.
Table 4. Medical Risk Factors during the Current Pregnancy, through Quarter 1 2015
Data Element N or
%
AMERIGROUP (Group Prenatal
Care)
Birth Center
Group Prenatal Care
Maternity Care Home
Total
Gestational Diabetes N 60 2133 1433 3103 6669
Yes % 3.3 2.7 4.2 5.3 4.2
No % 28.3 97.3 65.4 76.0 80.6
Not Known % 0 0 10.3 15.9 9.6
Missing % 68.3 0 20.1 2.8 5.6
Pregnancy-Related Hypertension N 60 2133 1433 3103 6669
Yes % 3.3 1.3 7.8 7.7 5.7
No % 25.0 98.7 62.6 74.8 79.8
Not Known % 0 0 9.4 14.6 8.8
Missing % 71.7 0 20.2 2.9 5.7
Note: Rows labeled with an “N” indicate the number of observations from which percentages have been calculated.
Table 5. Birth and Delivery Methods, through Quarter 1 2015
Data Element N or
%
AMERIGROUP (Group Prenatal
Care)
Birth Center
Group Prenatal Care
Maternity Care Home
Total
Total Number of Exit Forms with Valid Birth Information
N 30 2125 1103 2740 5968
Number of Babies Born N 31 2128 1125 2801 6054

27
Data Element N or
%
AMERIGROUP (Group Prenatal
Care)
Birth Center
Group Prenatal Care
Maternity Care Home
Total
Induction of Labor Excluding Planned C-Sections
N 57 2133 1297 2826 6256
Yes % 8.8 14.4 23.8 17.2 17.6
No % 31.6 85.3 42.8 35.5 54.0
Not known % 0 0 10.6 37.8 19.3
Missing % 59.6 0.3 22.7 9.6 9.1
Delivery Method from Exit Data N 60 2133 1433 3103 6669
Vaginal delivery % 41.7 87.3 49.1 52.0 62.7
C-Section % 8.3 12.4 24.3 29.6 23.0
Vaginal and C-Section % 0 0 0 0 0
Missing % 50.0 0.2 26.7 18.3 14.3
Women Who Had a Vaginal Birth as a Percentage of Women Who Planned to Deliver Vaginally
% 95.5 90.9 80.2 81.6 85.4
VBAC6 N – 90 161 418 669
Yes % – 30.0 19.9 13.9 17.5
Repeat C-Section N – 90 161 418 669
Yes % – 70.0 80.1 86.1 82.5
Scheduled C-Section N – 265 348 920 1533
Yes % – 0 39.1 29.2 26.4
6 The denominator for VBAC and repeat C-section are calculated by adding the total respondents in both categories since we cannot confidently know who else had a previous C-section.
Notes: Rows labeled with an “N” indicate the number of observations from which percentages have been calculated. Yellow cells labeled with a dash symbol indicate that between 0 and 11 responses had been received during the reporting period. Statistics were only calculated for items with at least 11 responses.
Table 6. Infant Outcomes, through Quarter 1 2015
Data Element N or
%
AMERIGROUP (Group Prenatal
Care)
Birth Center
Group Prenatal Care
Maternity Care Home
Total
Number of Live Births for Estimated Gestational Birth (EGA)
N 30 2115 1140 2617 5872
Preterm Births, <37 weeks EGA N 0 112 131 461 704
% 0 5.3 11.5 17.6 12.0
Non-Preterm Births, ≥37 weeks EGA N 0 1994 823 1945 4762
% 0 94.3 72.2 74.3 81.1
Missing N 30 – 186 211 406
% 100.0 – 16.3 8.1 6.9
Number of Live Births for Birth Weight N 30 2115 1140 2617 5872
Low Birth Weight, <2500 grams N – 75 147 412 634
% – 3.5 12.9 15.7 10.8
Not Low Birth Weight, ≥ 2500 grams N 22 1810 993 2019 4822
% 73.3 85.6 87.1 77.2 82.1
Missing N – 240 13 197 450
% – 11.3 1.1 7.5 7.7

28
Notes: Rows labeled with an “N” indicate the number of observations from which percentages have been calculated. Yellow cells labelled with a dash symbol indicate that between 0 and 11 responses had been received during the reporting period. Statistics were only calculated for items with at least 11 responses.
Table 7. Breastfeeding and Family Planning, through Quarter 1 2015
Data Element N or
%
AMERIGROUP (Group Prenatal
Care)
Birth Center
Group Prenatal Care
Maternity Care Home
Total
Breastfeeding After Delivery from Postpartum Data
N 44 1533 1416 4000 6949
Yes % 59.1 86.4 64.7 61.5 67.7
No % 22.7 7.4 9.5 25.6 18.3
Prefer not to answer % 0 0.7 1.8 0.5 0.8
Missing % 18.2 5.6 24.0 12.3 13.2
Women Who Breastfed As a Percentage of Women Who Planned to Breastfeed
% 99.9 100.2 97.4 100.7 99.9
Had Birth Control Counseling After Delivery N 44 1533 1416 4000 6949
Yes % 81.8 71.6 60.8 69.7 68.3
No % 0 19.4 12.3 15.2 15.5
Unsure % 0 2.8 2.4 1.8 2.1
Missing % 18.2 6.2 24.5 13.3 14.0
Note: Rows labeled with an “N” indicate the number of observations from which percentages have been calculated.
TECHNICAL ASSISTANCE
Louisiana’s Department of Health and Hospitals, which houses the State Registrar and Vital Records,
discussed the process for vital records data requests with the evaluation team in late March of 2015. We
submitted to the department information about the evaluation protocol, our data confidentiality
protocols, and the variables we are requesting. An application for birth certificate data was submitted in
July; the request is currently under review and, pending approval, will allow the evaluation team access
to the birth certificate data needed to merge participant data with Medicaid eligibility and claims data.
The Department of Health and Hospitals also oversees the state’s Medicaid program and we are working
closely with the department’s Medicaid administrators to develop an Institutional Review Board
application to be submitted to their academic partner who coordinates Medicaid data requests. As of
July of 2015, we have received an IRB application from the Department of Health and Hospitals’
Medicaid administrators and are in the process of completing it for submission.

29
Central Jersey Family Health Consortium
CASE STUDY
Central Jersey Family Health Consortium (Central Jersey) is a nonprofit organization that supports a
regional network of maternal and child health services, with emphasis on prevention and community-
based activities. The Consortium’s mission is to disseminate public health initiatives with a maternal
child focus across central New Jersey. With a staff of nearly 100, Central Jersey’s efforts reach an
estimated 30,000 mother-infant pairs in its six-county service area. Central Jersey serves in a convener
role for its Strong Start project. It has recruited seven sites, including hospital-based clinics and federally
qualified health centers (FQHCs), to implement group prenatal care under Strong Start. These sites have
enrolled 602 participants as of Quarter 1 2015.
Highlights from the second round of case study data collection include:
One site coordinator has been added to the team. This person works part-time (.5 FTE) and
supports the Newark site in developing and maintaining enrollment, retention, and scheduling
practices that will allow the site to succeed at Strong Start and to facilitate the transition to
group prenatal care as the health center’s “standard care.” Central Jersey also added a medical
chart reviewer who works approximately 15 hours per week to help with chart audits for the
evaluation’s Exit forms.
While the number of total sites currently participating in Central Jersey’s Strong Start program is
still seven, the number of sites participating in the program has fluctuated over the past year.
Several sites halted participation temporarily, and one discontinued participation. One new site
will begin participating in Central Jersey’s Strong Start program by summer 2015.
Sites have not changed their general approach to Strong Start enrollment; two sites continue to
use an opt-out approach while the remainder uses an opt-in approach.
Central Jersey’s strong pre-existing partnerships with WIC, Medicaid offices, Central Intake, and
other programs that focus on maternal and child health are a source of referrals for Strong
Start-eligible women. However, recruitment within participating Strong Start sites remains the
primary outreach strategy.
Most sites have eliminated the gestational age cutoff for their Strong Start program; however,
one site continues to impose a limit of 18 weeks gestational age for women without previous
prenatal care and 20 weeks gestational age for women with previous prenatal care. All sites
continue to require a second preterm risk factor in addition to Medicaid eligibility or
enrollment.7
7 Since Year 2 case study data collection, the program team has re-instituted the less than 29 weeks gestational age criteria for enrollment in Strong Start. Even when the program operated without any gestational age cutoff, key informants noted that the vast majority of participants enrolled between 13-19 weeks and no participants enrolled past 29 weeks gestation.

30
All sites continue to use CHI’s CenteringPregnancy model for their group prenatal care.
Meeting enrollment goals continues to be challenging for Central Jersey. At the time of data
collection, the awardee was working on strategies to increase enrollment and intended to
reduce its enrollment target to a more attainable goal.
The awardee has observed many positive outcomes associated with Strong Start, including
lower rates of preterm birth and low birth weight and higher rates of breastfeeding compared to
Medicaid beneficiaries across the state. In addition, they have observed that compared to
patients who do not participate in the program. group prenatal care participants are more likely
to attend prenatal care visits regularly, return for their postpartum visit, and seek follow up care
for their newborns.
Central Jersey has had several conversations with stakeholders in the state about providing
financial support for group prenatal care once grant funding ends and hopes to use program
evaluation data to help “make the business case” for continuing the approach.
PARTICIPANT-LEVEL PROCESS EVALUATION
The information presented below is based on data submitted from the four evaluation forms through
Quarter 1 2015. By February 2015, Central Jersey Family Health Consortium had Intake Forms for 98
percent of participants enrolled through Quarter 1 2015 (588 Intake Forms for 602 participants). In
addition, Central Jersey Family Health Consortium submitted 243 Third Trimester Surveys, 171
Postpartum Surveys, and 231 Exit Forms. The tables below present data collected on Central Jersey
Family Health Consortium’s participants with aggregated rates by approach for the purpose of
comparison.
Table 1. Enrollment and Forms Submitted, through Quarter 1 2015
Data Element N or
% CJFHC (Group Prenatal Care)
Birth Center
Group Prenatal Care
Maternity Care Home
Total
Newly Enrolled in Q1, 2015 N 76 739 948 2638 4325
Total Ever Enrolled through Q1, 2015 N 602 4739 5576 13232 23547
Number of Women Delivered through Q1, 2015
N 284 2275 2755 6189 11219
Intake Forms Received through Q1, 2015 N 588 2993 4401 11761 19155
Received through Q1, 2015 as a percentage of the number of women ever enrolled
% 97.7 63.2 78.9 88.9 81.3
Third Trimester Surveys Received through Q1, 2015
N 243 1876 2145 4683 8704
Received through Q1, 2015 as a percentage of the number of women delivered
% 85.6 82.5 77.9 75.7 77.6
Postpartum Surveys Received through Q1, 2015
N 171 1533 1416 4000 6949
Received through Q1, 2015 as a percentage of the number of women delivered
% 60.2 67.4 51.4 64.6 61.9
Exit Forms Received through Q1, 2015 N 231 2133 1433 3103 6669

31
Data Element N or
% CJFHC (Group Prenatal Care)
Birth Center
Group Prenatal Care
Maternity Care Home
Total
Received through Q1, 2015 as a percentage of the number of women delivered
% 81.3 93.8 52.0 50.1 59.4
Note: Rows labeled with an “N” indicate the number of observations from which percentages have been calculated.
Table 2. Sociodemographic Risk Factors, through Quarter 1 2015
Data Element N or
% CJFHC (Group Prenatal Care)
Birth Center
Group Prenatal Care
Maternity Care Home
Total
Mother’s Age at Intake N 588 2993 4401 11761 19155
Less than 18 years of age % 6.3 3.4 6.7 5.8 5.6
18 through 34 years of age % 83.8 86.1 75.0 81.4 80.7
35 years and older % 4.9 6.2 4.9 6.0 5.8
Missing % 4.9 4.3 13.4 6.8 7.9
Race and Ethnicity N 588 2993 4401 11761 19155
Hispanic % 43.5 25.7 39.2 22.9 27.1
Non-Hispanic white % 10.9 53.3 13.7 26.2 27.6
Non-Hispanic black % 37.8 14.8 39.2 46.3 39.8
Non-Hispanic Asian % 1.7 1.1 1.2 1.2 1.2
Non-Hispanic other % 1.9 0.6 1.6 0.7 0.9
Non-Hispanic multiple race % 1.5 3.6 2.3 1.2 1.8
Missing % 2.7 0.9 2.8 1.5 1.7
Employed at Intake N 588 2993 4401 11761 19155
Yes % 40.5 39.7 34.6 38.8 38.0
No % 58.0 59.1 60.9 60.0 60.0
Missing % 1.5 1.2 4.5 1.2 2.0
Education Level at Intake N 588 2993 4401 11761 19155
Less than high school % 14.5 14.3 23.7 24.5 22.7
High school graduate or GED % 52.7 52.3 46.2 52.0 50.7
Bachelor’s degree % 4.1 10.1 3.1 2.5 3.9
Other college degree(s) % 7.5 12.7 7.2 6.0 7.3
Missing % 21.3 10.7 19.8 15.0 15.4
Relationship Status at Intake N 588 2993 4401 11761 19155
Married, living with spouse % 16.2 40.7 18.6 17.2 21.2
Married, not living with spouse % 3.4 1.7 2.1 1.9 1.9
Living with a partner % 28.4 32.2 31.3 30.6 31.0
In a relationship but not living together % 28.9 12.9 24.6 30.5 26.4
Not in a relationship right now % 18.2 11.1 17.0 17.8 16.6
Missing % 4.9 1.3 6.4 2.0 2.9
Smokes Cigarettes at Intake N 588 2993 4401 11761 19155
Yes % 4.6 10.1 7.8 14.1 12.0
No % 75.0 77.1 71.7 77.8 76.3
Missing % 20.4 12.9 20.4 8.1 11.7
Food Insecure at Intake N 588 2993 4401 11761 19155
Yes % 22.6 18.1 18.5 16.1 16.9
No % 65.1 76.9 61.4 76.2 72.9
Missing*
% 12.3 5.0 20.0 7.7 10.1
Exhibiting Depressive Symptoms at Intake** N 588 2993 4401 11761 19155

32
Data Element N or
% CJFHC (Group Prenatal Care)
Birth Center
Group Prenatal Care
Maternity Care Home
Total
Yes % 22.4 21.8 25.2 23.4 23.5
No % 54.8 69.3 57.0 69.3 66.4
Missing* % 22.8 9.0 17.9 7.3 10.0
Have Experienced Intimate Partner Violence in a Relationship***
N 588 2993 4401 11761 19155
Yes % 17.7 20.6 17.1 19.0 18.8
No % 78.2 77.2 68.4 78.5 76.0
Missing* % 4.1 2.1 14.5 2.4 5.1
Notes: Cells that contain one asterisk indicate that the ‘Missing’ category includes respondents who did not answer all of the items required to calculate this measure. Cells that contain two asterisks indicate that this is as measured by a shortened version of the CES-D. Cells that contain three asterisks indicate that this is as measured by the Slapped, Threatened, and Throw (STaT) screener. Rows labeled with an “N” indicate the number of observations from which percentages have been calculated.
Table 3. Medical Risk Factors Prior to Current Pregnancy, through Quarter 1 2015
Data Element N or
% CJFHC (Group Prenatal Care)
Birth Center
Group Prenatal Care
Maternity Care Home
Total
Inter-Pregnancy Interval with Current Pregnancy Since Last Birth
N 78 1127 700 1914 3741
<18 months % 15.3 24.3 18.0 19.5 20.7
≥18 months % 61.5 39.8 48.3 51.9 47.6
Missing % 23.1 35.9 33.7 28.6 31.8
Previous Preterm Birth(s) Between 20 and 36 weeks, 6 days EGA
N 78 1127 700 1914 3741
Yes % 12.8 10.7 11.4 18.9 150
No % 84.6 89.3 63.9 63.2 71.2
Not Known % 1.3 0 18.6 14.9 11.1
Missing % 1.3 0 6.1 3.0 2.7
Previous Birth(s) Less than 2,500 grams N 78 1127 700 1914 3741
Yes % 6.4 1.9 8.6 14.8 9.7
No % 89.7 95.8 60.4 61.7 71.7
Not Known % 1.3 0 24.7 19.2 14.5
Missing % 2.6 2.3 6.3 4.3 4.1
Pre-Pregnancy Diagnosis of Type I Diabetes N 231 2133 1433 3103 6669
Yes % 0 0.5 1.3 1.5 1.1
No % 97.8 99.5 74.2 84.4 87.0
Not Known % 1.7 0 7.7 11.1 6.8
Missing % 0.4 0 16.7 3.1 5.0
Pre-Pregnancy Diagnosis of Type II Diabetes N 231 2133 1433 3103 6669
Yes % 0 0 2.6 1.9 1.5
No % 97.8 5.0 72.9 83.3 56.1
Not Known % 1.7 0 7.7 11.1 6.8
Missing % 0.4 94.9 16.7 3.7 35.7
Pre-Pregnancy Diagnosis of Hypertension N 231 2133 1433 3103 6669
Yes % 2.2 0.5 6.0 9.5 5.9
No % 95.7 99.5 66.7 77.4 82.2
Not Known % 1.7 0 7.6 10.2 6.4
Missing % 0.4 0 19.7 2.9 5.6

33
Note: Rows labeled with an “N” indicate the number of observations from which percentages have been calculated.
Table 4. Medical Risk Factors during the Current Pregnancy, through Quarter 1 2015
Data Element N or
% CJFHC (Group Prenatal Care)
Birth Center
Group Prenatal Care
Maternity Care Home
Total
Gestational Diabetes N 231 2133 1433 3103 6669
Yes % 7.8 2.7 4.2 5.3 4.2
No % 86.1 97.3 65.4 76.0 80.6
Not Known % 6.1 0 10.3 15.9 9.6
Missing % 0 0 20.1 2.8 5.6
Pregnancy-Related Hypertension N 231 2133 1433 3103 6669
Yes % 12.6 1.3 7.8 7.7 5.7
No % 80.5 98.7 62.6 74.8 79.8
Not Known % 6.9 0 9.4 14.6 8.8
Missing % 0 0 20.2 2.9 5.7
Note: Rows labeled with an “N” indicate the number of observations from which percentages have been calculated.
Table 5. Birth and Delivery Methods, through Quarter 1 2015
Data Element N or
% CJFHC (Group Prenatal Care)
Birth Center
Group Prenatal Care
Maternity Care Home
Total
Total Number of Exit Forms with Valid Birth Information
N 230 2125 1103 2740 5968
Number of Babies Born N 232 2128 1125 2801 6054
Induction of Labor Excluding Planned C-Sections
N 216 2133 1297 2826 6256
Yes % 36.1 14.4 23.8 17.2 17.6
No % 39.8 85.3 42.8 35.5 54.0
Not known % 24.1 0 10.6 37.8 19.3
Missing % 0 0.3 22.7 9.6 9.1
Delivery Method from Exit Data N 231 2133 1433 3103 6669
Vaginal delivery % 58.9 87.3 49.1 52.0 62.7
C-Section % 32.0 12.4 24.3 29.6 23.0
Vaginal and C-Section % 0 0 0 0 0
Missing % 9.1 0.2 26.7 18.3 14.3
Women Who Had a Vaginal Birth as a Percentage of Women Who Planned to Deliver Vaginally
% 69.2 90.9 80.2 81.6 85.4
VBAC8 N 18 90 161 418 669
Yes % 11.1 30.0 19.9 13.9 17.5
Repeat C-Section N 18 90 161 418 669
Yes % 88.9 70.0 80.1 86.1 82.5
Scheduled C-Section N 74 265 348 920 1533
Yes % 20.3 0 39.1 29.2 26.4
8 The denominator for VBAC and repeat C-section are calculated by adding the total respondents in both categories since we cannot confidently know who else had a previous C-section.
Note: Rows labeled with an “N” indicate the number of observations from which percentages have been calculated.

34
Table 6. Infant Outcomes, through Quarter 1 2015
Data Element N or
% CJFHC (Group Prenatal Care)
Birth Center
Group Prenatal Care
Maternity Care Home
Total
Number of Live Births for Estimated Gestational Birth (EGA)
N 210 2115 1140 2617 5872
Preterm Births, <37 weeks EGA N 15 112 131 461 704
% 7.1 5.3 11.5 17.6 12.0
Non-Preterm Births, ≥37 weeks EGA N 175 1994 823 1945 4762
% 83.3 94.3 72.2 74.3 81.1
Missing N 20 – 186 211 406
% 9.5 – 16.3 8.1 6.9
Number of Live Births for Birth Weight N 210 2115 1140 2617 5872
Low Birth Weight, <2500 grams N 17 75 147 412 634
% 8.1 3.5 12.9 15.7 10.8
Not Low Birth Weight, ≥ 2500 grams N 190 1810 993 2019 4822
% 90.5 85.6 87.1 77.2 82.1
Missing N – 240 13 197 450
% – 11.3 1.1 7.5 7.7
Notes: Rows labeled with an “N” indicate the number of observations from which percentages have been calculated. Yellow cells labeled with a dash symbol indicate that between 0 and 11 responses had been received during the reporting period. Statistics were only calculated for items with at least 11 responses.
Table 7. Breastfeeding and Family Planning, through Quarter 1 2015
Data Element N or
% CJFHC (Group Prenatal Care)
Birth Center
Group Prenatal Care
Maternity Care Home
Total
Breastfeeding After Delivery from Postpartum Data
N 171 1533 1416 4000 6949
Yes % 70.2 86.4 64.7 61.5 67.7
No % 9.4 7.4 9.5 25.6 18.3
Prefer not to answer % 1.2 0.7 1.8 0.5 0.8
Missing % 19.3 5.6 24.0 12.3 13.2
Women Who Breastfed As a Percentage of Women Who Planned to Breastfeed
% 94.6 100.2 97.4 100.7 99.9
Had Birth Control Counseling After Delivery N 171 1533 1416 4000 6949
Yes % 66.7 71.6 60.8 69.7 68.3
No % 9.4 19.4 12.3 15.2 15.5
Unsure % 3.5 2.8 2.4 1.8 2.1
Missing % 20.5 6.2 24.5 13.3 14.0
Note: Rows labeled with an “N” indicate the number of observations from which percentages have been calculated.
TECHNICAL ASSISTANCE
The New Jersey Division of Medical Assistance and Health Services was enthusiastic about inclusion in
the Strong Start for Mothers and Newborns Evaluation when we first communicated with the agency in
March of 2015. At the time, the NJ Medicaid agency indicated that access to merged birth certificate
and Medicaid eligibility/claims data would be facilitated by addition of an amendment to a Data Use
Agreement in development between the New Jersey Division of Medical Assistance and Health Services
and the New Jersey Department of Health. As of June of 2015, the submission and review of the Data

35
Use Agreement is ongoing and currently under review by the New Jersey Department of Health. We
anticipate receiving a linked data file for analysis in late 2015.
36
Florida Association of Healthy Start
Coalitions
CASE STUDY
The Florida Association of Healthy Start Coalitions (FAHSC) directs the state’s Healthy Start home visiting
program as well as the Strong Start Maternity Care Home initiative in the Tampa Bay area. FAHSC
initiated maternity care homes at seven dissimilar sites to test the fit of the approach in different health
care settings. There are four locations that are part of a Medicaid-only obstetrics group practice (one of
which is new since last year), one FQHC, one hospital-affiliated high-risk obstetrical clinic, and one public
health department. Another small FQHC site closed in the second year of the program because of low
Medicaid enrollment. Maternal Health Specialists (MHS’s) provide care management, conduct patient
education, assist with doctor-patient communication, and provide referrals and follow-up. In the first
quarter of 2015, the awardee had enrolled a total of 716 participants in Strong Start.
Highlights from the second round of case study data collection include:
MHS integration in the workflow at each site has continued to evolve and improve. Staff and
clinicians have a greater understanding of how the MHS’s can support maternity care for their
patients.
MHS’s are receiving additional training and materials to help them provide more comprehensive
support related to breastfeeding, family planning, and diabetes.
With supplemental Strong Start funding, FAHSC hired a data specialist who collects and reports
program and evaluation data for all the sites.
FAHSC has experienced some staff turnover among the MHS’s, which key informants ascribed to
the nature of a grant-funded, temporary position and to moves out of the area.
FAHSC’s eligibility criteria require that women be Medicaid eligible and present with at least one
additional preterm risk factor. MHS’s are enrolling women with some risk factors that were
excluded during evaluation Y1, such as women with a short inter-pregnancy period, BMI over
30, multiple gestations, unintended pregnancy, and primiparous women.
Further, women up to 28 weeks gestation may now be enrolled in the program, though about
80 percent enroll before 20 weeks. As a policy, FAHSC program sites try to limit enrollment to
women below 24 weeks but will enroll women up to 28 weeks if they are considered medically
needy.
Key informants believe women are benefitting from the additional continuity that MHS’s
provide, increased health education, and the referrals to community services. Retention through

37
the postpartum visit is high and as a result, Strong Start participants are receiving education
about access to contraception and ongoing women’s health services.
FAHSC believes there is support among sites for continuing the MHS role after the Strong Start
grant ends. Staff are exploring ways they could integrate Strong Start and Healthy Start to
provide the range of services women need during pregnancy and postpartum.
FAHSC engaged in a “re-planning” phase that focused on increasing program enrollment. Key
informants noted that this process was informative and beneficial, but also increased the
complexity of contract renegotiations with their community partners.
PARTICIPANT-LEVEL PROCESS EVALUATION
The information presented below is based on data submitted from the four evaluation forms through
Quarter 1 2015. By March 2015, Florida Association of Healthy Start Coalitions had Intake Forms for 98
percent of participants enrolled through Quarter 1 2015 (699 Intake Forms for 716 participants). In
addition, Florida Association of Health Start Coalitions submitted 335 Third Trimester Surveys, 328
Postpartum Surveys, and 275 Exit Forms. The tables below present data collected on Florida Association
of Healthy Start Coalitions’ participants with aggregated rates by approach for the purpose of
comparison.
Table 1. Enrollment and Forms Submitted, through Quarter 1 2015
Data Element N or
%
FLORIDA (Maternity Care
Home)
Birth Center
Group Prenatal Care
Maternity Care Home
Total
Newly Enrolled in Q1 2015 N 161 739 948 2638 4325
Total Ever Enrolled through Q1 2015 N 716 4739 5576 13232 23547
Number of Women Delivered through Q1 2015 N 344 2275 2755 6189 11219
Intake Forms Received through Q1 2015 N 699 2993 4401 11761 19155
Received through Q1, 2015 as a percentage of the number of women ever enrolled
% 97.6 63.2 78.9 88.9 81.3
Third Trimester Surveys Received through Q1 2015
N 335 1876 2145 4683 8704
Received through Q1 2015 as a percentage of the number of women delivered
% 97.4 82.5 77.9 75.7 77.6
Postpartum Surveys Received through Q1 2015 N 328 1533 1416 4000 6949
Received through Q1 2015 as a percentage of the number of women delivered
% 95.3 67.4 51.4 64.6 61.9
Exit Forms Received through Q1 2015 N 275 2133 1433 3103 6669
Received through Q1 2015 as a percentage of the number of women delivered
% 79.9 93.8 52.0 50.1 59.4
Note: Rows labeled with an “N” indicate the number of observations from which percentages have been calculated.
Table 2. Sociodemographic Risk Factors, through Quarter 1 2015
Data Element N or
%
FLORIDA (Maternity Care
Home)
Birth Center
Group Prenatal Care
Maternity Care Home
Total
Mother’s Age at Intake N 699 2993 4401 11761 19155

38
Data Element N or
%
FLORIDA (Maternity Care
Home)
Birth Center
Group Prenatal Care
Maternity Care Home
Total
Less than 18 years of age % 6.6 3.4 6.7 5.8 5.6
18 through 34 years of age % 90.1 86.1 75 81.4 80.7
35 years and older % 3.1 6.2 4.9 6.0 5.8
Missing % 0.1 4.3 13.4 6.8 7.9
Race and Ethnicity N 699 2993 4401 11761 19155
Hispanic % 21.2 25.7 39.2 22.9 27.1
Non-Hispanic white % 29.8 53.3 13.7 26.2 27.6
Non-Hispanic black % 44.5 14.8 39.2 46.3 39.8
Non-Hispanic Asian % 0.4 1.1 1.2 1.2 1.2
Non-Hispanic other % 0.6 0.6 1.6 0.7 0.9
Non-Hispanic multiple race % 3.4 3.6 2.3 1.2 1.8
Missing % 0.1 0.9 2.8 1.5 1.7
Employed at Intake N 699 2993 4401 11761 19155
Yes % 38.9 39.7 34.6 38.8 38.0
No % 60.7 59.1 60.9 60.0 60.0
Missing % 0.4 1.2 4.5 1.2 2.0
Education Level at Intake N 699 2993 4401 11761 19155
Less than high school % 31.8 14.3 23.7 24.5 22.7
High school graduate or GED % 46.2 52.3 46.2 52 50.7
Bachelor’s degree % 1.0 10.1 3.1 2.5 3.9
Other college degree(s) % 8.4 12.7 7.2 6.0 7.3
Missing % 12.6 10.7 19.8 15.0 15.4
Relationship Status at Intake N 699 2993 4401 11761 19155
Married, living with spouse % 14.3 40.7 18.6 17.2 21.2
Married, not living with spouse % 1.4 1.7 2.1 1.9 1.9
Living with a partner % 34.6 32.2 31.3 30.6 31.0
In a relationship but not living together % 30.3 12.9 24.6 30.5 26.4
Not in a relationship right now % 19.2 11.1 17.0 17.8 16.6
Missing % 0.1 1.3 6.4 2.0 2.9
Smokes Cigarettes at Intake N 699 2993 4401 11761 19155
Yes % 19.2 10.1 7.8 14.1 12.0
No % 79.4 77.1 71.7 77.8 76.3
Missing % 1.4 12.9 20.4 8.1 11.7
Food Insecure at Intake N 699 2993 4401 11761 19155
Yes % 22.6 18.1 18.5 16.1 16.9
No % 74.7 76.9 61.4 76.2 72.9
Missing*
% 2.7 5.0 20.0 7.7 10.1
Exhibiting Depressive Symptoms at Intake** N 699 2993 4401 11761 19155
Yes % 32.6 21.8 25.2 23.4 23.5
No % 63.9 69.3 57.0 69.3 66.4
Missing* % 3.4 9.0 17.9 7.3 10.0
Have Experienced Intimate Partner Violence in a Relationship***
N 699 2993 4401 11761 19155
Yes % 36.5 20.6 17.1 19.0 18.8
No % 59.7 77.2 68.4 78.5 76.0

39
Data Element N or
%
FLORIDA (Maternity Care
Home)
Birth Center
Group Prenatal Care
Maternity Care Home
Total
Missing* % 3.8 2.1 14.5 2.4 5.1
Notes: Cells that contain one asterisk indicate that the ‘Missing’ category includes respondents who did not answer all of the items required to calculate this measure. Cells that contain two asterisks indicate that this is as measured by a shortened version of the CES-D. Cells that contain three asterisks indicate that this is as measured by the Slapped, Threatened, and Throw (STaT) screener. Rows labeled with an “N” indicate the number of observations from which percentages have been calculated.
Table 3. Medical Risk Factors Prior to Current Pregnancy, through Quarter 1 2015
Data Element N or
%
FLORIDA (Maternity Care
Home)
Birth Center
Group Prenatal Care
Maternity Care Home
Total
Inter-Pregnancy Interval with Current Pregnancy Since Last Birth
N 170 1127 700 1914 3741
<18 months % 31.1 24.3 18.0 19.5 20.7
≥18 months % 62.4 39.8 48.3 51.9 47.6
Missing % 6.5 35.9 33.7 28.6 31.8
Previous Preterm Birth(s) Between 20 and 36 weeks, 6 days EGA
N 170 1127 700 1914 3741
Yes % 23.5 10.7 11.4 18.9 15.0
No % 72.4 89.3 63.9 63.2 71.2
Not Known % 3.5 0 18.6 14.9 11.1
Missing % 0.6 0 6.1 3.0 2.7
Previous Birth(s) Less than 2,500 grams N 170 1127 700 1914 3741
Yes % 14.7 1.9 8.6 14.8 9.7
No % 72.9 95.8 60.4 61.7 71.7
Not Known % 10.6 0 24.7 19.2 14.5
Missing % 1.8 2.3 6.3 4.3 4.1
Pre-Pregnancy Diagnosis of Type I Diabetes N 275 2133 1433 3103 6669
Yes % 2.2 0.5 1.3 1.5 1.1
No % 96.4 99.5 74.2 84.4 87
Not Known % 0.4 0 7.7 11.1 6.8
Missing % 1.1 0 16.7 3.1 5.0
Pre-Pregnancy Diagnosis of Type II Diabetes N 275 2133 1433 3103 6669
Yes % 1.5 0 2.6 1.9 1.5
No % 97.5 5.0 72.9 83.3 56.1
Not Known % 0.4 0 7.7 11.1 6.8
Missing % 0.7 94.9 16.7 3.7 35.7
Pre-Pregnancy Diagnosis of Hypertension N 275 2133 1433 3103 6669
Yes % 9.1 0.5 6.0 9.5 5.9
No % 89.5 99.5 66.7 77.4 82.2
Not Known % 0.7 0 7.6 10.2 6.4
Missing % 0.7 0 19.7 2.9 5.6
Note: Rows labeled with an “N” indicate the number of observations from which percentages have been calculated.

40
Table 4. Medical Risk Factors during the Current Pregnancy, through Quarter 1 2015
Data Element N or
%
FLORIDA (Maternity Care
Home)
Birth Center
Group Prenatal Care
Maternity Care Home
Total
Gestational Diabetes N 275 2133 1433 3103 6669
Yes % 13.1 2.7 4.2 5.3 4.2
No % 69.5 97.3 65.4 76.0 80.6
Not Known % 16.7 0 10.3 15.9 9.6
Missing % 0.7 0 20.1 2.8 5.6
Pregnancy-Related Hypertension N 275 2133 1433 3103 6669
Yes % 6.9 1.3 7.8 7.7 5.7
No % 74.5 98.7 62.6 74.8 79.8
Not Known % 17.8 0 9.4 14.6 8.8
Missing % 0.7 0 20.2 2.9 5.7
Note: Rows labeled with an “N” indicate the number of observations from which percentages have been calculated.
Table 5. Birth and Delivery Methods, through Quarter 1 2015
Data Element N or
%
FLORIDA (Maternity Care
Home)
Birth Center
Group Prenatal Care
Maternity Care Home
Total
Total Number of Exit Forms with Valid Birth Information
N 219 2125 1103 2740 5968
Number of Babies Born N 227 2128 1125 2801 6054
Induction of Labor Excluding Planned C-Sections
N 258 2133 1297 2826 6256
Yes % 9.3 14.4 23.8 17.2 17.6
No % 7.0 85.3 42.8 35.5 54
Not known % 65.1 0 10.6 37.8 19.3
Missing % 18.6 0.3 22.7 9.6 9.1
Delivery Method from Exit Data N 275 2133 1433 3103 6669
Vaginal delivery % 40.7 87.3 49.1 52.0 62.7
C-Section % 24.4 12.4 24.3 29.6 23.0
Vaginal and C-Section % 0 0 0 0 0
Missing % 34.9 0.2 26.7 18.3 14.3
Women Who Had a Vaginal Birth as a Percentage of Women Who Planned to Deliver Vaginally
% 79.9 90.9 80.2 81.6 85.4
VBAC9 N 36 90 161 418 669
Yes % 19.4 30.0 19.9 13.9 17.5
Repeat C-Section N 36 90 161 418 669
Yes % 80.6 70.0 80.1 86.1 82.5
Scheduled C-Section N 67 265 348 920 1533
Yes % 25.4 0 39.1 29.2 26.4
9 The denominator for VBAC and repeat C-section are calculated by adding the total respondents in both categories since we cannot confidently know who else had a previous C-section.
Note: Rows labeled with an “N” indicate the number of observations from which percentages have been calculated.

41
Table 6. Infant Outcomes, through Quarter 1 2015
Data Element N or
%
FLORIDA (Maternity Care
Home)
Birth Center
Group Prenatal Care
Maternity Care Home
Total
Number of Live Births by Estimated Gestational Birth (EGA)
N 197 2115 1140 2617 5872
Preterm Births, <37 weeks EGA N 47 112 131 461 704
% 23.9 5.3 11.5 17.6 12.0
Non-Preterm Births, ≥37 weeks EGA N 150 1994 823 1945 4762
% 76.1 94.3 72.2 74.3 81.1
Missing N 0 – 186 211 406
% 0 – 16.3 8.1 6.9
Number of Live Births by Birth Weight N 197 2115 1140 2617 5872
Low Birth Weight, <2500 grams N 42 75 147 412 634
% 21.3 3.5 12.9 15.7 10.8
Not Low Birth Weight, ≥ 2500 grams N 149 1810 993 2019 4822
% 75.6 85.6 87.1 77.2 82.1
Missing N – 240 13 197 450
% – 11.3 1.1 7.5 7.7
Note: Rows labeled with an “N” indicate the number of observations from which percentages have been calculated. Yellow cells labeled with a dash symbol indicate that between 0 and 11 responses had been received during the reporting period. Statistics were only calculated for items with at least 11 responses.
Table 7. Breastfeeding and Family Planning, through Quarter 1 2015
Data Element N or
%
FLORIDA (Maternity Care
Home)
Birth Center
Group Prenatal Care
Maternity Care Home
Total
Breastfeeding After Delivery from Postpartum Survey Data
N 328 1533 1416 4000 6949
Yes % 48.5 86.4 64.7 61.5 67.7
No % 22.3 7.4 9.5 25.6 18.3
Prefer not to answer % 0.6 0.7 1.8 0.5 0.8
Missing % 28.7 5.6 24.0 12.3 13.2
Women Who Breastfed As a Percentage of Women Who Planned to Breastfeed
% 98.6 100.2 97.4 100.7 99.9
Had Birth Control Counseling After Delivery N 328 1533 1416 4000 6949
Yes % 50.6 71.6 60.8 69.7 68.3
No % 15.2 19.4 12.3 15.2 15.5
Unsure % 2.7 2.8 2.4 1.8 2.1
Missing % 31.4 6.2 24.5 13.3 14.0
Note: Rows labeled with an “N” indicate the number of observations from which percentages have been calculated.
TECHNICAL ASSISTANCE
In March of 2015, we contacted the Bureau of Vital Statistics in the Florida Department of Health and
the Florida Agency for Health Care Administration (AHCA). Both were receptive to providing data for the
Strong Start Evaluation pending submission of formal applications for data requests. In May of 2015, we
submitted our completed applications to both Florida AHCA and Florida DOH. We received initial
feedback on our applications from both agencies and requests for supplementary documentation. We

42
are currently completing the required supplements to our applications which largely focus on providing
greater specificity in the variables requested, the research protocol, and the expertise of the evaluation
team. While the application process requires two to three months to review, we are optimistic our
applications are consistent with the state’s goals for sharing by supporting Medicaid policy
development. We hope to access the requested data in late 2015.

43
Grady Memorial Hospital Corporation
CASE STUDY
Grady Health System (Grady) has convened maternity care providers who were already offering group
prenatal care to participate in the Strong Start program. All sites had implemented the
CenteringPregnancy model prior to receiving the Strong Start award and have used funding to expand
and enhance their existing programs. Group care is offered through four providers. Grady Hospital’s
Nurse Midwifery Service, a joint program of Emory University and Morehouse College, has offered group
prenatal care for over a decade and is now the service’s sole approach of prenatal care. The Dougherty
County Health Department (DCHD) site in Albany serves a very low-income rural region approximately
200 miles south of Atlanta. Group prenatal care is the sole approach of care at the clinic, and there are
few alternatives serving Medicaid women in the area. The Southside Medical Center is located in a
suburb on Atlanta’s south side, primarily serves Medicaid-insured women, and is part of a large health
system. Finally, the Providence Women’s Health Care site has three locations north of Atlanta and has a
mix of publically and privately insured women. Grady sites enrolled a total of 540 participants in 2014,
and an additional 87 women were enrolled in the first quarter of 2015.
Highlights from the second round of case study data collection include:
Since evaluation Y1, the awardee has made a few changes related to recruitment, as well as
some minor changes to the content and scope of the group prenatal care sessions. However, the
sites and staff have remained stable. Each site has augmented its efforts toward Strong Start
enrollment, including use of site-specific brochures that describe Strong Start. Sites also use
connections with community partners and local health departments to recruit potential Strong
Start participants.
To improve attendance and retention, Southside now conducts phone follow-up to increase
attendance at the first session, Providence has adjusted meeting times to meet the needs of
working women, and DCHD focuses on educating other staff within the health department
about the program to better take advantage of internal referrals.
DCHD key informants felt very optimistic about the postpartum session that was added shortly
after the evaluation’s Y1 site visit, stating it has provided a “great opportunity” not only for
women to receive needed postpartum services, but also to reconnect with members of their
group cohort.
The awardee’s group prenatal care coordinator is assuming a bigger role in making sure the
Strong Start evaluation forms get completed by participants, thereby improving data collection.
The awardee also added a receptionist to the program team, who has been credited with
improving follow up with patients who miss sessions.

44
Awardee staff are pleased with program outcomes so far (e.g., low rates of preterm birth and
high rates of breastfeeding) and report that Strong Start participants are satisfied with their
care. Strong Start has also improved the awardee’s capacity to support patients and has
increased knowledge, both within the organization and amongst patients, about group prenatal
care, specifically the CenteringPregnancy model.
At the time of evaluation Y2 interviews, awardee staff felt confident their enrollment goals could
be met, through additional outreach opportunities with community partners, and by setting
monthly enrollment targets.
PARTICIPANT-LEVEL PROCESS EVALUATION
The information presented below is based on data submitted from the four evaluation forms through
Quarter 1 2015. By March 2015, Grady Memorial Hospital Corporation (Grady) had Intake Forms for 46
percent of participants enrolled through Quarter 1 2015 (285 Intake Forms for 627 participants). In
addition, Grady Memorial Hospital Corporation submitted 179 Third Trimester Surveys, 29 Postpartum
Surveys, but no Exit Forms. The tables below present data collected on Grady’s participants with
aggregated rates by approach for the purpose of comparison.
Table 1. Enrollment and Forms Submitted, through Quarter 1 2015
Data Element N or
% GRADY (Group Prenatal Care)
Birth Center
Group Prenatal Care
Maternity Care Home
Total
Newly Enrolled in Q1 2015 N 87 739 948 2638 4325
Total Ever Enrolled through Q1 2015 N 627 4739 5576 13232 23547
Number of Women Delivered through Q1 2015
N 292 2275 2755 6189 11219
Intake Forms Received through Q1 2015 N 285 2993 4401 11761 19155
Received through Q1 2015 as a percentage of the number of women ever enrolled
% 45.5 63.2 78.9 88.9 81.3
Third Trimester Surveys Received through Q1 2015
N 179 1876 2145 4683 8704
Received through Q1 2015 as a percentage of the number of women delivered
% 61.3 82.5 77.9 75.7 77.6
Postpartum Surveys Received through Q1 2015
N 29 1533 1416 4000 6949
Received through Q1 2015 as a percentage of the number of women delivered
% 9.9 67.4 51.4 64.6 61.9
Exit Forms Received through Q1 2015 N + 2133 1433 3103 6669
Received through Q1 2015 as a percentage of the number of women delivered
% + 93.8 52.0 50.1 59.4
Notes: Rows labeled with an “N” indicate the number of observations from which percentages have been calculated. Gray cells labeled with a plus symbol indicate that fewer than 25 forms had been received during the reporting period. Statistics were calculated only if there were at least 25 forms received.
Table 2. Sociodemographic Risk Factors, through Quarter 1 2015
Data Element N or
% GRADY (Group Prenatal Care)
Birth Center
Group Prenatal Care
Maternity Care Home
Total
Mother’s Age at Intake N 285 2993 4401 11761 19155

45
Data Element N or
% GRADY (Group Prenatal Care)
Birth Center
Group Prenatal Care
Maternity Care Home
Total
Less than 18 years of age % 9.8 3.4 6.7 5.8 5.6
18 through 34 years of age % 84.2 86.1 75.0 81.4 80.7
35 years and older % 2.1 6.2 4.9 6.0 5.8
Missing % 3.9 4.3 13.4 6.8 7.9
Race and Ethnicity N 285 2993 4401 11761 19155
Hispanic % 4.6 25.7 39.2 22.9 27.1
Non-Hispanic white % 4.2 53.3 13.7 26.2 27.6
Non-Hispanic black % 89.5 14.8 39.2 46.3 39.8
Non-Hispanic Asian % 0.7 1.1 1.2 1.2 1.2
Non-Hispanic other % 0 0.6 1.6 0.7 0.9
Non-Hispanic multiple race % 1.1 3.6 2.3 1.2 1.8
Missing % 0 0.9 2.8 1.5 1.7
Employed at Intake N 285 2993 4401 11761 19155
Yes % 41.1 39.7 34.6 38.8 38
No % 57.2 59.1 60.9 60.0 60.0
Missing % 1.8 1.2 4.5 1.2 2.0
Education Level at Intake N 285 2993 4401 11761 19155
Less than high school % 24.2 14.3 23.7 24.5 22.7
High school graduate or GED % 55.8 52.3 46.2 52 50.7
Bachelor’s degree % 2.8 10.1 3.1 2.5 3.9
Other college degree(s) % 7.8 12.7 7.2 6.0 7.3
Missing % 9.5 10.7 19.8 15 15.4
Relationship Status at Intake N 285 2993 4401 11761 19155
Married, living with spouse % 9.5 40.7 18.6 17.2 21.2
Married, not living with spouse % 1.4 1.7 2.1 1.9 1.9
Living with a partner % 30.9 32.2 31.3 30.6 31.0
In a relationship but not living together % 29.8 12.9 24.6 30.5 26.4
Not in a relationship right now % 26.0 11.1 17.0 17.8 16.6
Missing % 2.5 1.3 6.4 2.0 2.9
Smokes Cigarettes at Intake N 285 2993 4401 11761 19155
Yes % 4.2 10.1 7.8 14.1 12.0
No % 84.9 77.1 71.7 77.8 76.3
Missing % 10.9 12.9 20.4 8.1 11.7
Food Insecure at Intake N 285 2993 4401 11761 19155
Yes % 17.2 18.1 18.5 16.1 16.9
No % 73.7 76.9 61.4 76.2 72.9
Missing*
% 9.2 5.0 20.0 7.7 10.1
Exhibiting Depressive Symptoms at Intake** N 285 2993 4401 11761 19155
Yes % 30.2 21.8 25.2 23.4 23.5
No % 59.3 69.3 57.0 69.3 66.4
Missing* % 10.5 9.0 17.9 7.3 10.0
Have Experienced Intimate Partner Violence in a Relationship***
N 285 2993 4401 11761 19155
Yes % 13.7 20.6 17.1 19.0 18.8
No % 84.2 77.2 68.4 78.5 76.0
Missing* % 2.2 2.1 14.5 2.4 5.1

46
Notes: Cells that contain one asterisk indicate that the ‘Missing’ category includes respondents who did not answer all of the items required to calculate this measure. Cells that contain two asterisks indicate that this is as measured by a shortened version of the CES-D. Cells that contain three asterisks indicate that this is as measured by the Slapped, Threatened, and Throw (STaT) screener. Rows labeled with an “N” indicate the number of observations from which percentages have been calculated.
Table 3. Medical Risk Factors Prior to Current Pregnancy, through Quarter 1 2015
Data Element N or
% GRADY (Group Prenatal Care)
Birth Center
Group Prenatal Care
Maternity Care Home
Total
Inter-Pregnancy Interval with Current Pregnancy Since Last Birth
N + 1127 700 1914 3741
<18 months % + 24.3 18.0 19.5 20.7
≥18 months % + 39.8 48.3 51.9 47.6
Missing % + 35.9 33.7 28.6 31.8
Previous Preterm Birth(s) Between 20 and 36 weeks, 6 days EGA
N + 1127 700 1914 3741
Yes % + 10.7 11.4 18.9 15.0
No % + 89.3 63.9 63.2 71.2
Not Known % + 0 18.6 14.9 11.1
Missing % + 0 6.1 3.0 2.7
Previous Birth(s) Less than 2,500 grams N + 1127 700 1914 3741
Yes % + 1.9 8.6 14.8 9.7
No % + 95.8 60.4 61.7 71.7
Not Known % + 0 24.7 19.2 14.5
Missing % + 2.3 6.3 4.3 4.1
Pre-Pregnancy Diagnosis of Type I Diabetes N + 2133 1433 3103 6669
Yes % + 0.5 1.3 1.5 1.1
No % + 99.5 74.2 84.4 87.0
Not Known % + 0 7.7 11.1 6.8
Missing % + 0 16.7 3.1 5.0
Pre-Pregnancy Diagnosis of Type II Diabetes N + 2133 1433 3103 6669
Yes % + 0 2.6 1.9 1.5
No % + 5.0 72.9 83.3 56.1
Not Known % + 0 7.7 11.1 6.8
Missing % + 94.9 16.7 3.7 35.7
Pre-Pregnancy Diagnosis of Hypertension N + 2133 1433 3103 6669
Yes % + 0.5 6.0 9.5 5.9
No % + 99.5 66.7 77.4 82.2
Not Known % + 0 7.6 10.2 6.4
Missing % + 0 19.7 2.9 5.6
Notes: Rows labeled with an “N” indicate the number of observations from which percentages have been calculated. Gray cells labeled with a plus symbol indicate that fewer than 25 forms had been received during the reporting period. Statistics were calculated only if there were at least 25 forms received.
Table 4. Medical Risk Factors during the Current Pregnancy, through Quarter 1 2015
Data Element N or
% GRADY (Group Prenatal Care)
Birth Center
Group Prenatal Care
Maternity Care Home
Total
Gestational Diabetes N + 2133 1433 3103 6669
Yes % + 2.7 4.2 5.3 4.2
No % + 97.3 65.4 76.0 80.6
Not Known % + 0 10.3 15.9 9.6

47
Data Element N or
% GRADY (Group Prenatal Care)
Birth Center
Group Prenatal Care
Maternity Care Home
Total
Missing % + 0 20.1 2.8 5.6
Pregnancy-Related Hypertension N + 2133 1433 3103 6669
Yes % + 1.3 7.8 7.7 5.7
No % + 98.7 62.6 74.8 79.8
Not Known % + 0 9.4 14.6 8.8
Missing % + 0 20.2 2.9 5.7
Notes: Rows labeled with an “N” indicate the number of observations from which percentages have been calculated. Gray cells labeled with a plus symbol indicate that fewer than 25 forms had been received during the reporting period. Statistics were calculated only if there were at least 25 forms received.
Table 5. Birth and Delivery Methods, through Quarter 1 2015
Data Element N or
% GRADY (Group Prenatal Care)
Birth Center
Group Prenatal Care
Maternity Care Home
Total
Total Number of Exit Forms with Valid Birth Information
N + 2125 1103 2740 5968
Number of Babies Born N + 2128 1125 2801 6054
Induction of Labor Excluding Planned C-Sections
N + 2133 1297 2826 6256
Yes % + 14.4 23.8 17.2 17.6
No % + 85.3 42.8 35.5 54.0
Not known % + 0 10.6 37.8 19.3
Missing % + 0.3 22.7 9.6 9.1
Delivery Method from Exit Data N + 2133 1433 3103 6669
Vaginal delivery % + 87.3 49.1 52.0 62.7
C-Section % + 12.4 24.3 29.6 23.0
Vaginal and C-Section % + 0 0 0 0
Missing % + 0.2 26.7 18.3 14.3
Women Who Had a Vaginal Birth as a Percentage of Women Who Planned to Deliver Vaginally
% + 90.9 80.2 81.6 85.4
VBAC10
N + 90 161 418 669
Yes % + 30.0 19.9 13.9 17.5
Repeat C-Section N + 90 161 418 669
Yes % + 70.0 80.1 86.1 82.5
Scheduled C-Section N + 265 348 920 1533
Yes % + 0 39.1 29.2 26.4
10 The denominator for VBAC and repeat C-section are calculated by adding the total respondents in both categories since we cannot confidently know who else had a previous C-section.
Notes: Rows labeled with an “N” indicate the number of observations from which percentages have been calculated. Gray cells labeled with a plus symbol indicate that fewer than 25 forms had been received during the reporting period. Statistics were calculated only if there were at least 25 forms received.
Table 6. Infant Outcomes, through Quarter 1 2015
Data Element N or
% GRADY (Group Prenatal Care)
Birth Center
Group Prenatal Care
Maternity Care Home
Total
Number of Live Births by Estimated Gestational Birth (EGA)
N + 2115 1140 2617 5872

48
Data Element N or
% GRADY (Group Prenatal Care)
Birth Center
Group Prenatal Care
Maternity Care Home
Total
Preterm Births, <37 weeks EGA N + 112 131 461 704
% + 5.3 11.5 17.6 12.0
Non-Preterm Births, ≥37 weeks EGA N + 1994 823 1945 4762
% + 94.3 72.2 74.3 81.1
Missing N + – 186 211 406
% + – 16.3 8.1 6.9
Number of Live Births by Birth Weight N + 2115 1140 2617 5872
Low Birth Weight, <2500 grams N + 75 147 412 634
% + 3.5 12.9 15.7 10.8
Not Low Birth Weight, ≥ 2500 grams N + 1810 993 2019 4822
% + 85.6 87.1 77.2 82.1
Missing N + 240 13 197 450
% + 11.3 1.1 7.5 7.7
Notes: Rows labeled with an “N” indicate the number of observations from which percentages have been calculated. Gray cells labeled with a plus symbol indicate that fewer than 25 forms had been received during the reporting period. Statistics were calculated only if there were at least 25 forms received. Yellow cells labeled with a dash symbol indicate that between 0 and 11 responses had been received during the reporting period. Statistics were only calculated for items with at least 11 responses.
Table 7. Breastfeeding and Family Planning, through Quarter 1 2015
Data Element N or
% GRADY (Group Prenatal Care)
Birth Center
Group Prenatal Care
Maternity Care Home
Total
Breastfeeding After Delivery from Postpartum Survey Data
N 29 1533 1416 4000 6949
Yes % 93.1 86.4 64.7 61.5 67.7
No % 3.4 7.4 9.5 25.6 18.3
Prefer not to answer % 3.4 0.7 1.8 0.5 0.8
Missing % 0 5.6 24.0 12.3 13.2
Women Who Breastfed As a Percentage of Women Who Planned to Breastfeed
% 100.0 100.2 97.4 100.7 99.9
Had Birth Control Counseling After Delivery N 29 1533 1416 4000 6949
Yes % 79.3 71.6 60.8 69.7 68.3
No % 13.8 19.4 12.3 15.2 15.5
Unsure % 3.4 2.8 2.4 1.8 2.1
Missing % 3.4 6.2 24.5 13.3 14.0
Note: Rows labeled with an “N” indicate the number of observations from which percentages have been calculated.
TECHNICAL ASSISTANCE
In January 2015, the evaluation team contacted the Georgia Department of Public Health (DPH) and was
directed to contact the state’s Medicaid agency, the Department of Community Health (DCH), to obtain
Medicaid data first before placing a request for birth certificate data. Because of significant turnover at
DCH, it took several months to initiate contact with the right person. In May of 2015 we introduced state
officials at DCH to the Strong Start for Mothers and Newborns Evaluation. State officials were receptive
to supporting the evaluation and requested further detail regarding the method for identifying which
Medicaid enrolled women would be sampled from their files. We were directed back to DPH as a first
step to identify women based on the birth certificate data pull. DPH has directed us to submit our

49
application to them, and we will discuss next steps after they review. We hope to determine how best to
meet both agencies’ concerns regarding privacy provisions and responsibility for data matching before
proceeding with a data request from DCH.

50
Harris County Hospital District
CASE STUDY
Harris Health System, the county public health system in Houston, Texas, has had a group prenatal care
program that implements CHI’s CenteringPregnancy since 2005. The awardee has used Strong Start
funds to enhance its group prenatal care program by hiring Community Health Workers (CHWs) and
social workers who recruit Medicaid and CHIP-eligible patients for group care enrollment at multiple
sites and also provide prenatal and postpartum counseling, education, and referrals. A total of 774
women had ever been enrolled in Harris Health System’s Strong Start program as of March 2015.
Highlights from the second round of case study data collection include:
Harris Health has hired an additional (third) social worker to ease caseloads and allow for longer
encounters with participants. Another social worker was replaced, and one of the three Strong
Start CHWs left the program.
With the loss of one CHW who previously focused on outreach, the remaining CHWs have
become more involved with community outreach but still focus mainly on “in-reach” to women
who come to the Harris Health clinics for pregnancy tests or prenatal care.
The sites continue to provide CHW and social worker visits to supplement group prenatal care,
either before or after sessions, or during a separate appointment as needed. CHW and social
worker strategies vary slightly by site, but workers often attend the first group session to ensure
that women know they are available throughout the prenatal and postpartum period. In
addition to providing emotional support and practical advice, CHWs make reminder calls about
group sessions, which is especially valuable at the beginning of each session cycle.
Harris Health’s Strong Start eligibility requirements have changed so that Medicaid or CHIP
eligibility alone is sufficient to qualify a pregnant patient for the program; an additional preterm
risk factor is no longer required. Key informants reported that the gestational age cutoff for
Strong Start is 20 or 24 weeks (responses varied).
Using Strong Start funding, the awardee hired a data specialist to complete the evaluation Exit
forms and provide other support for Strong Start administration.
Turnover among group facilitators has had a negative effect on attendance and retention. At the
time of the Y2 case study, one site had temporarily halted new group enrollment for three
months until a new facilitator can be hired.
Despite these challenges, program enrollment has grown; group size increased and some sites
have had to employ waiting lists for group prenatal care.
Key informants believe Strong Start is extending the benefits of group prenatal care to more
patients, which include meeting medical, contraception, and psychosocial needs; reducing

51
preterm deliveries and NICU stays; increasing breastfeeding rates; and improving continuity of
care.
Harris Health reduced its total enrollment target from 3,000 to about 1,600 enrollees (a “more
realistic” target according to key informants) in evaluation Y1; this continues to be the goal in
Y2.
PARTICIPANT-LEVEL PROCESS EVALUATION
The information presented below is based on data submitted from the four evaluation forms through
Quarter 1 2015. By March 2015, Harris County Hospital District (Harris) had Intake Forms for 92 percent
of participants enrolled through Quarter 1 2015 (715 Intake Forms for 774 participants). In addition,
Harris County Hospital District submitted 415 Third Trimester Surveys, 408 Postpartum Surveys, and 139
Exit Forms. The tables below present data collected on Harris County Hospital District’s participants
with aggregated rates by approach for the purpose of comparison.
Table 1. Enrollment and Forms Submitted, through Quarter 1 2015
Data Element N or
% HARRIS (Group Prenatal Care)
Birth Center
Group Prenatal Care
Maternity Care Home
Total
Newly Enrolled in Q1 2015 N 158 739 948 2638 4325
Total Ever Enrolled through Q1 2015 N 774 4739 5576 13232 23547
Number of Women Delivered through Q1 2015
N 472 2275 2755 6189 11219
Intake Forms Received through Q1 2015 N 715 2993 4401 11761 19155
Received through Q1 2015 as a percentage of the number of women ever enrolled
% 92.4 63.2 78.9 88.9 81.3
Third Trimester Surveys Received through Q1 2015
N 415 1876 2145 4683 8704
Received through Q1 2015 as a percentage of the number of women delivered
% 87.9 82.5 77.9 75.7 77.6
Postpartum Surveys Received through Q1 2015
N 408 1533 1416 4000 6949
Received through Q1 2015 as a percentage of the number of women delivered
% 86.4 67.4 51.4 64.6 61.9
Exit Forms Received through Q1 2015 N 139 2133 1433 3103 6669
Received through Q1 2015 as a percentage of the number of women delivered
% 29.4 93.8 52.0 50.1 59.4
Note: Rows labeled with an “N” indicate the number of observations from which percentages have been calculated.
Table 2. Sociodemographic Risk Factors, through Quarter 1 2015
Data Element N or
% HARRIS (Group Prenatal Care)
Birth Center
Group Prenatal Care
Maternity Care Home
Total
Mother’s Age at Intake N 715 2993 4401 11761 19155
Less than 18 years of age % 10.1 3.4 6.7 5.8 5.6
18 through 34 years of age % 79.9 86.1 75.0 81.4 80.7
35 years and older % 9.9 6.2 4.9 6.0 5.8
Missing % 0.1 4.3 13.4 6.8 7.9
Race and Ethnicity N 715 2993 4401 11761 19155

52
Data Element N or
% HARRIS (Group Prenatal Care)
Birth Center
Group Prenatal Care
Maternity Care Home
Total
Hispanic % 83.4 25.7 39.2 22.9 27.1
Non-Hispanic white % 2.0 53.3 13.7 26.2 27.6
Non-Hispanic black % 13.6 14.8 39.2 46.3 39.8
Non-Hispanic Asian % 0.4 1.1 1.2 1.2 1.2
Non-Hispanic other % 0.3 0.6 1.6 0.7 0.9
Non-Hispanic multiple race % 0.0 3.6 2.3 1.2 1.8
Missing % 0.4 0.9 2.8 1.5 1.7
Employed at Intake N 715 2993 4401 11761 19155
Yes % 24.1 39.7 34.6 38.8 38.0
No % 75.4 59.1 60.9 60.0 60.0
Missing % 0.6 1.2 4.5 1.2 2.0
Education Level at Intake N 715 2993 4401 11761 19155
Less than high school % 59.6 14.3 23.7 24.5 22.7
High school graduate or GED % 27.4 52.3 46.2 52.0 50.7
Bachelor’s degree % 0.3 10.1 3.1 2.5 3.9
Other college degree(s) % 0.2 12.7 7.2 6.0 7.3
Missing % 12.4 10.7 19.8 15.0 15.4
Relationship Status at Intake N 715 2993 4401 11761 19155
Married, living with spouse % 28.8 40.7 18.6 17.2 21.2
Married, not living with spouse % 2.1 1.7 2.1 1.9 1.9
Living with a partner % 31.3 32.2 31.3 30.6 31.0
In a relationship but not living together % 19.4 12.9 24.6 30.5 26.4
Not in a relationship right now % 17.6 11.1 17.0 17.8 16.6
Missing % 0.7 1.3 6.4 2.0 2.9
Smokes Cigarettes at Intake N 715 2993 4401 11761 19155
Yes % 0.6 10.1 7.8 14.1 12.0
No % 89.9 77.1 71.7 77.8 76.3
Missing % 9.5 12.9 20.4 8.1 11.7
Food Insecure at Intake N 715 2993 4401 11761 19155
Yes % 11.5 18.1 18.5 16.1 16.9
No % 87.6 76.9 61.4 76.2 72.9
Missing*
% 1.0 5.0 20.0 7.7 10.1
Exhibiting Depressive Symptoms at Intake**
N 715 2993 4401 11761 19155
Yes % 13.6 21.8 25.2 23.4 23.5
No % 83.6 69.3 57.0 69.3 66.4
Missing* % 2.8 9.0 17.9 7.3 10.0
Have Experienced Intimate Partner Violence in a Relationship***
N 715 2993 4401 11761 19155
Yes % 18.3 20.6 17.1 19.0 18.8
No % 81.3 77.2 68.4 78.5 76.0
Missing* % 0.4 2.1 14.5 2.4 5.1
Notes: Cells that contain one asterisk indicate that the ‘Missing’ category includes respondents who did not answer all of the items required to calculate this measure. Cells that contain two asterisks indicate that this is as measured by a shortened version of the CES-D. Cells that contain three asterisks indicate that this is as measured by the Slapped, Threatened, and Throw (STaT) screener. Rows labeled with an “N” indicate the number of observations from which percentages have been calculated.

53
Table 3. Medical Risk Factors Prior to Current Pregnancy, through Quarter 1 2015
Data Element N or
% HARRIS (Group Prenatal Care)
Birth Center
Group Prenatal Care
Maternity Care Home
Total
Inter-Pregnancy Interval with Current Pregnancy Since Last Birth
N 62 1127 700 1914 3741
<18 months % 32.3 24.3 18.0 19.5 20.7
≥18 months % 46.8 39.8 48.3 51.9 47.6
Missing % 21.0 35.9 33.7 28.6 31.8
Previous Preterm Birth(s) Between 20 and 36 weeks, 6 days EGA
N 62 1127 700 1914 3741
Yes % 8.1 10.7 11.4 18.9 15.0
No % 75.8 89.3 63.9 63.2 71.2
Not Known % 12.9 0 18.6 14.9 11.1
Missing % 3.2 0 6.1 3.0 2.7
Previous Birth(s) Less than 2,500 grams N 62 1127 700 1914 3741
Yes % 14.5 1.9 8.6 14.8 9.7
No % 69.4 95.8 60.4 61.7 71.7
Not Known % 12.9 0 24.7 19.2 14.5
Missing % 3.2 2.3 6.3 4.3 4.1
Pre-Pregnancy Diagnosis of Type I Diabetes N 139 2133 1433 3103 6669
Yes % 0 0.5 1.3 1.5 1.1
No % 46.8 99.5 74.2 84.4 87.0
Not Known % 50.4 0 7.7 11.1 6.8
Missing % 2.9 0 16.7 3.1 5.0
Pre-Pregnancy Diagnosis of Type II Diabetes N 139 2133 1433 3103 6669
Yes % 2.2 0 2.6 1.9 1.5
No % 44.6 5.0 72.9 83.3 56.1
Not Known % 50.4 0 7.7 11.1 6.8
Missing % 2.9 94.9 16.7 3.7 35.7
Pre-Pregnancy Diagnosis of Hypertension N 139 2133 1433 3103 6669
Yes % 0.7 0.5 6.0 9.5 5.9
No % 46.0 99.5 66.7 77.4 82.2
Not Known % 50.4 0 7.6 10.2 6.4
Missing % 2.9 0 19.7 2.9 5.6
Note: Rows labeled with an “N” indicate the number of observations from which percentages have been calculated.
Table 4. Medical Risk Factors during the Current Pregnancy, through Quarter 1 2015
Data Element N or
% HARRIS (Group Prenatal Care)
Birth Center
Group Prenatal Care
Maternity Care Home
Total
Gestational Diabetes N 139 2133 1433 3103 6669
Yes % 5.8 2.7 4.2 5.3 4.2
No % 41.0 97.3 65.4 76.0 80.6
Not Known % 51.8 0 10.3 15.9 9.6
Missing % 1.4 0 20.1 2.8 5.6
Pregnancy-Related Hypertension N 139 2133 1433 3103 6669
Yes % 1.4 1.3 7.8 7.7 5.7
No % 46.0 98.7 62.6 74.8 79.8
Not Known % 51.8 0 9.4 14.6 8.8

54
Data Element N or
% HARRIS (Group Prenatal Care)
Birth Center
Group Prenatal Care
Maternity Care Home
Total
Missing % 0.7 0 20.2 2.9 5.7
Note: Rows labeled with an “N” indicate the number of observations from which percentages have been calculated.
Table 5. Birth and Delivery Methods, through Quarter 1 2015
Data Element N or
% HARRIS (Group Prenatal Care)
Birth Center
Group Prenatal Care
Maternity Care Home
Total
Total Number of Exit Forms with Valid Birth Information
N 102 2125 1103 2740 5968
Number of Babies Born N 105 2128 1125 2801 6054
Induction of Labor Excluding Planned C-Sections
N 135 2133 1297 2826 6256
Yes % 35.6 14.4 23.8 17.2 17.6
No % 20.0 85.3 42.8 35.5 54.0
Not known % 15.6 0 10.6 37.8 19.3
Missing % 28.9 0.3 22.7 9.6 9.1
Delivery Method from Exit Data N 139 2133 1433 3103 6669
Vaginal delivery % 58.3 87.3 49.1 52.0 62.7
C-Section % 14.4 12.4 24.3 29.6 23.0
Vaginal and C-Section % 0 0 0 0 0
Missing % 27.3 0.2 26.7 18.3 14.3
Women Who Had a Vaginal Birth as a Percentage of Women Who Planned to Deliver Vaginally
% 93.7 90.9 80.2 81.6 85.4
VBAC11
N – 90 161 418 669
Yes % – 30.0 19.9 13.9 17.5
Repeat C-Section N – 90 161 418 669
Yes % – 70.0 80.1 86.1 82.5
Scheduled C-Section N 20 265 348 920 1533
Yes % 20.0 0 39.1 29.2 26.4
11 The denominator for VBAC and repeat C-section are calculated by adding the total respondents in both categories since we cannot confidently know who else had a previous C-section.
Notes: Rows labeled with an “N” indicate the number of observations from which percentages have been calculated. Yellow cells labeled with a dash symbol indicate that between 0 and 11 responses had been received during the reporting period. Statistics were only calculated for items with at least 11 responses.
Table 6. Infant Outcomes, through Quarter 1 2015
Data Element N or
% HARRIS (Group Prenatal Care)
Birth Center
Group Prenatal Care
Maternity Care Home
Total
Number of Live Births by Estimated Gestational Birth (EGA)
N 105 2115 1140 2617 5872
Preterm Births, <37 weeks EGA N 20 112 131 461 704
% 19.0 5.3 11.5 17.6 12.0
Non-Preterm Births, ≥37 weeks EGA N 84 1994 823 1945 4762
% 80.0 94.3 72.2 74.3 81.1
Missing N – – 186 211 406
% – – 16.3 8.1 6.9
Number of Live Births by Birth Weight N 105 2115 1140 2617 5872

55
Data Element N or
% HARRIS (Group Prenatal Care)
Birth Center
Group Prenatal Care
Maternity Care Home
Total
Low Birth Weight, <2500 grams N – 75 147 412 634
% – 3.5 12.9 15.7 10.8
Not Low Birth Weight, ≥ 2500 grams N 94 1810 993 2019 4822
% 89.6 85.6 87.1 77.2 82.1
Missing N – 240 13 197 450
% – 11.3 1.1 7.5 7.7
Notes: Rows labeled with an “N” indicate the number of observations from which percentages have been calculated. Yellow cells labeled with a dash symbol indicate that between 0 and 11 responses had been received during the reporting period. Statistics were only calculated for items with at least 11 responses.
Table 7. Breastfeeding and Family Planning, through Quarter 1 2015
Data Element N or
% HARRIS (Group Prenatal Care)
Birth Center
Group Prenatal Care
Maternity Care Home
Total
Breastfeeding After Delivery from Postpartum Survey Data
N 408 1533 1416 4000 6949
Yes % 57.8 86.4 64.7 61.5 67.7
No % 4.7 7.4 9.5 25.6 18.3
Prefer not to answer % 0.2 0.7 1.8 0.5 0.8
Missing % 37.3 5.6 24.0 12.3 13.2
Women Who Breastfed As a Percentage of Women Who Planned to Breastfeed
% 98.3 100.2 97.4 100.7 99.9
Had Birth Control Counseling After Delivery N 408 1533 1416 4000 6949
Yes % 57.4 71.6 60.8 69.7 68.3
No % 4.2 19.4 12.3 15.2 15.5
Unsure % 1.0 2.8 2.4 1.8 2.1
Missing % 37.5 6.2 24.5 13.3 14.0
Note: Rows labeled with an “N” indicate the number of observations from which percentages have been calculated.
TECHNICAL ASSISTANCE
The Texas Health and Human Services Commission (HHSC) was receptive to supporting the Strong Start
Evaluation when introduced to the project in March of 2015. HHSC has had previous experience in
creating linked data files that employ birth certificate and Medicaid data but identified the linking of
birth certificate data for infants with their respective mothers as a challenge. In April of 2015,
administrators at HHSC introduced the Strong Start Evaluation to the Texas Department of State Health
Services (DSHS) who agreed to assist with the linking of Strong Start participant and comparison group
demographic information with infant birth certificate data and then merging these data with Medicaid
eligibility and claims data to be furnished by HHSC. After some deliberation between HHSC and DSHS we
received notice that we would need to submit applications to the Department of State Health Services’
Institutional Review Board and Committee on Requests for Personal Data. The submitted applications
must also be approved by HHSC. The evaluation team has decided to seek comparable data from the
Texas Children’s Health Insurance Program and is pursuing the request for this additional data.

56
HealthInsight of Nevada
CASE STUDY
HealthInsight of Nevada (HealthInsight) is a private, non-profit Quality Improvement Organization (QIO)
working on numerous state, federal, and foundation-funded activities in Utah, Nevada, and New
Mexico. HealthInsight of Nevada, the Strong Start grantee, is headquartered in Las Vegas and has
recruited a number of providers in the Las Vegas and Reno areas to implement the Strong Start group
prenatal care approach. The sites involved have changed over the course of the award period, and at the
time of evaluation Y2 data collection, HealthInsight was operating five sites. These included Renown
Pregnancy Center, St. Mary’s Regional Medical Center (St. Mary’s), the University of Nevada School of
Medicine (UNSOM), Women's Health Associates of Southern Nevada (WHASN), and Nevada Health
Centers. St Mary’s and Nevada Health Centers are newer sites that have joined the Strong Start program
in the past year. As of March 2015, a total of 401 Strong Start participants had ever enrolled in
HealthInsight’s program.
Highlights from the second round of case study data collection include:
Key informants report that implementation has been a “slow go,” with turnover among program
staff, both at the site and awardee level. The Strong Start project coordinator and data analyst
left in late 2014. Program staff felt the transition to a new project coordinator in December
went smoothly.
Despite the support of some physician champions, all sites have experienced physician
resistance to the approach, which continues to be a significant barrier to referrals and
enrollment. Physicians are reportedly concerned that group care sessions are less profitable
than individual appointments (particularly if group cohorts are small), and that Strong Start
participants will leave their practices before delivery.
HealthInsight also continues to experience enrollment-related challenges including a substantial
proportion of low-income patients who are late to or receive no prenatal care (hence shrinking
the pool of eligible patients), and a 60 to 90-day processing time for Medicaid applications.
The sites continue to implement varying approaches of group care. Renown and St. Mary’s use
the CenteringPregnancy program and are CHI-certified and the other three sites use different
approaches of group care that deviate from the CHI approach, including group prenatal care
programs that involve fewer sessions that are shorter in length.
Strong Start eligibility criteria have not changed since evaluation Y1, though they vary between
sites. The gestational age cutoff was shifted from 20 weeks to 24 weeks in the program’s first
year and has not changed since. The awardee decided to begin enrolling patients under age 18
to increase enrollment and meet the needs of the large number of pregnant teens.

57
After incentives for referrals failed to boost enrollment, the awardee and sites are exploring
more effective outreach strategies and plan to launch a Strong Start marketing campaign that
involves ads on bus shelters and elsewhere in the community.
Key informants believe that Strong Start is improving the psychosocial health of enrollees by
providing valuable peer support, which has made participants better prepared for birth and has
led to higher rates of breastfeeding.
HealthInsight reduced its enrollment target from 3,600 to 1,500, though the revised enrollment
target is still seen as very ambitious.
PARTICIPANT-LEVEL PROCESS EVALUATION
The information presented below is based on data submitted from the four evaluation forms through
Quarter 1 2015. By March 2015, HealthInsight of Nevada had Intake Forms for 65 percent of participants
enrolled through Quarter 1 2015 (261 Intake Forms for 401 participants). In addition, HealthInsight of
Nevada submitted 192 Third Trimester Surveys, 128 Postpartum Surveys, and 129 Exit Forms. The tables
below present data collected on HealthInsight of Nevada’s participants with aggregated rates by
approach for the purpose of comparison.
Table 1. Enrollment and Forms Submitted, through Quarter 1 2015
Data Element N or
% NEVADA (Group Prenatal Care)
Birth Center
Group Prenatal Care
Maternity Care Home
Total
Newly Enrolled in Q1 2015 N 65 739 948 2638 4325
Total Ever Enrolled through Q1 2015 N 401 4739 5576 13232 23547
Number of Women Delivered through Q1 2015 N 156 2275 2755 6189 11219
Intake Forms Received through Q1 2015 N 261 2993 4401 11761 19155
Received through Q1 2015 as a percentage of the number of women ever enrolled
% 65.1 63.2 78.9 88.9 81.3
Third Trimester Surveys Received through Q1 2015
N 192 1876 2145 4683 8704
Received through Q1 2015 as a percentage of the number of women delivered
% 123.1 82.5 77.9 75.7 77.6
Postpartum Surveys Received through Q1 2015 N 128 1533 1416 4000 6949
Received through Q1 2015 as a percentage of the number of women delivered
% 82.1 67.4 51.4 64.6 61.9
Exit Forms Received through Q1 2015 N 129 2133 1433 3103 6669
Received through Q1 2015 as a percentage of the number of women delivered
% 82.7 93.8 52.0 50.1 59.4
Note: Rows labeled with an “N” indicate the number of observations from which percentages have been calculated.
Table 2. Sociodemographic Risk Factors, through Quarter 1 2015
Data Element N or
% NEVADA (Group Prenatal Care)
Birth Center
Group Prenatal Care
Maternity Care Home
Total
Mother’s Age at Intake N 261 2993 4401 11761 19155
Less than 18 years of age % 1.9 3.4 6.7 5.8 5.6
18 through 34 years of age % 87.7 86.1 75.0 81.4 80.7

58
Data Element N or
% NEVADA (Group Prenatal Care)
Birth Center
Group Prenatal Care
Maternity Care Home
Total
35 years and older % 3.8 6.2 4.9 6.0 5.8
Missing % 6.5 4.3 13.4 6.8 7.9
Race and Ethnicity N 261 2993 4401 11761 19155
Hispanic % 44.8 25.7 39.2 22.9 27.1
Non-Hispanic white % 30.7 53.3 13.7 26.2 27.6
Non-Hispanic black % 13.4 14.8 39.2 46.3 39.8
Non-Hispanic Asian % 2.7 1.1 1.2 1.2 1.2
Non-Hispanic other % 3.4 0.6 1.6 0.7 0.9
Non-Hispanic multiple race % 3.4 3.6 2.3 1.2 1.8
Missing % 1.5 0.9 2.8 1.5 1.7
Employed at Intake N 261 2993 4401 11761 19155
Yes % 34.5 39.7 34.6 38.8 38.0
No % 64.4 59.1 60.9 60.0 60.0
Missing % 1.1 1.2 4.5 1.2 2.0
Education Level at Intake N 261 2993 4401 11761 19155
Less than high school % 24.1 14.3 23.7 24.5 22.7
High school graduate or GED % 55.6 52.3 46.2 52.0 50.7
Bachelor’s degree % 2.3 10.1 3.1 2.5 3.9
Other college degree(s) % 7.7 12.7 7.2 6.0 7.3
Missing % 10.3 10.7 19.8 15.0 15.4
Relationship Status at Intake N 261 2993 4401 11761 19155
Married, living with spouse % 21.8 40.7 18.6 17.2 21.2
Married, not living with spouse % 2.3 1.7 2.1 1.9 1.9
Living with a partner % 44.1 32.2 31.3 30.6 31.0
In a relationship but not living together % 18.4 12.9 24.6 30.5 26.4
Not in a relationship right now % 12.3 11.1 17.0 17.8 16.6
Missing % 1.1 1.3 6.4 2.0 2.9
Smokes Cigarettes at Intake N 261 2993 4401 11761 19155
Yes % 9.6 10.1 7.8 14.1 12.0
No % 79.3 77.1 71.7 77.8 76.3
Missing % 11.1 12.9 20.4 8.1 11.7
Food Insecure at Intake N 261 2993 4401 11761 19155
Yes % 26.8 18.1 18.5 16.1 16.9
No % 65.1 76.9 61.4 76.2 72.9
Missing*
% 8.1 5.0 20.0 7.7 10.1
Exhibiting Depressive Symptoms at Intake**
N 261 2993 4401 11761 19155
Yes % 24.5 21.8 25.2 23.4 23.5
No % 59.4 69.3 57.0 69.3 66.4
Missing* % 16.1 9.0 17.9 7.3 10.0
Have Experienced Intimate Partner Violence in a Relationship***
N 261 2993 4401 11761 19155
Yes % 23.0 20.6 17.1 19.0 18.8
No % 74.7 77.2 68.4 78.5 76.0
Missing* % 2.3 2.1 14.5 2.4 5.1

59
Notes: Cells that contain one asterisk indicate that the ‘Missing’ category includes respondents who did not answer all of the items required to calculate this measure. Cells that contain two asterisks indicate that this is as measured by a shortened version of the CES-D. Cells that contain three asterisks indicate that this is as measured by the Slapped, Threatened, and Throw (STaT) screener. Rows labeled with an “N” indicate the number of observations from which percentages have been calculated.
Table 3. Medical Risk Factors Prior to Current Pregnancy, through Quarter 1 2015
Data Element N or
% NEVADA (Group Prenatal Care)
Birth Center
Group Prenatal Care
Maternity Care Home
Total
Inter-Pregnancy Interval with Current Pregnancy Since Last Birth
N 63 1127 700 1914 3741
<18 months % 25.3 24.3 18.0 19.5 20.7
≥18 months % 46.0 39.8 48.3 51.9 47.6
Missing % 28.6 35.9 33.7 28.6 31.8
Previous Preterm Birth(s) Between 20 and 36 weeks, 6 days EGA
N 63 1127 700 1914 3741
Yes % 0 10.7 11.4 18.9 15.0
No % 93.7 89.3 63.9 63.2 71.2
Not Known % 0 0 18.6 14.9 11.1
Missing % 6.3 0 6.1 3.0 2.7
Previous Birth(s) Less than 2,500 grams N 63 1127 700 1914 3741
Yes % 1.6 1.9 8.6 14.8 9.7
No % 85.7 95.8 60.4 61.7 71.7
Not Known % 0 0 24.7 19.2 14.5
Missing % 12.7 2.3 6.3 4.3 4.1
Pre-Pregnancy Diagnosis of Type I Diabetes N 129 2133 1433 3103 6669
Yes % 0 0.5 1.3 1.5 1.1
No % 96.9 99.5 74.2 84.4 87.0
Not Known % 0 0 7.7 11.1 6.8
Missing % 3.1 0 16.7 3.1 5.0
Pre-Pregnancy Diagnosis of Type II Diabetes N 129 2133 1433 3103 6669
Yes % 0 0 2.6 1.9 1.5
No % 96.9 5.0 72.9 83.3 56.1
Not Known % 0 0 7.7 11.1 6.8
Missing % 3.1 94.9 16.7 3.7 35.7
Pre-Pregnancy Diagnosis of Hypertension N 129 2133 1433 3103 6669
Yes % 3.9 0.5 6.0 9.5 5.9
No % 93.8 99.5 66.7 77.4 82.2
Not Known % 0 0 7.6 10.2 6.4
Missing % 2.3 0 19.7 2.9 5.6
Note: Rows labeled with an “N” indicate the number of observations from which percentages have been calculated.
Table 4. Medical Risk Factors during the Current Pregnancy, through Quarter 1 2015
Data Element N or
% NEVADA (Group Prenatal Care)
Birth Center
Group Prenatal Care
Maternity Care Home
Total
Gestational Diabetes N 129 2133 1433 3103 6669
Yes % 1.6 2.7 4.2 5.3 4.2
No % 89.1 97.3 65.4 76.0 80.6
Not Known % 0 0 10.3 15.9 9.6
Missing % 9.3 0 20.1 2.8 5.6

60
Data Element N or
% NEVADA (Group Prenatal Care)
Birth Center
Group Prenatal Care
Maternity Care Home
Total
Pregnancy-Related Hypertension N 129 2133 1433 3103 6669
Yes % 3.1 1.3 7.8 7.7 5.7
No % 88.4 98.7 62.6 74.8 79.8
Not Known % 0 0 9.4 14.6 8.8
Missing % 8.5 0 20.2 2.9 5.7
Note: Rows labeled with an “N” indicate the number of observations from which percentages have been calculated.
Table 5. Birth and Delivery Methods, through Quarter 1 2015
Data Element N or
% NEVADA (Group Prenatal Care)
Birth Center
Group Prenatal Care
Maternity Care Home
Total
Total Number of Exit Forms with Valid Birth Information
N 120 2125 1103 2740 5968
Number of Babies Born N 121 2128 1125 2801 6054
Induction of Labor Excluding Planned C-Sections
N 116 2133 1297 2826 6256
Yes % 24.1 14.4 23.8 17.2 17.6
No % 67.2 85.3 42.8 35.5 54.0
Not known % 0.9 0 10.6 37.8 19.3
Missing % 7.8 0.3 22.7 9.6 9.1
Delivery Method from Exit Data N 129 2133 1433 3103 6669
Vaginal delivery % 66.7 87.3 49.1 52.0 62.7
C-Section % 25.6 12.4 24.3 29.6 23.0
Vaginal and C-Section % 0 0 0 0 0
Missing % 7.8 0.2 26.7 18.3 14.3
Women Who Had a Vaginal Birth as a Percentage of Women Who Planned to Deliver Vaginally
% 85.8 90.9 80.2 81.6 85.4
VBAC12
N 12 90 161 418 669
Yes % 25.0 30.0 19.9 13.9 17.5
Repeat C-Section N 12 90 161 418 669
Yes % 75.0 70.0 80.1 86.1 82.5
Scheduled C-Section N 33 265 348 920 1533
Yes % 39.4 0 39.1 29.2 26.4
12 The denominator for VBAC and repeat C-section are calculated by adding the total respondents in both categories since we cannot confidently know who else had a previous C-section.
Note: Rows labeled with an “N” indicate the number of observations from which percentages have been calculated.
Table 6. Infant Outcomes, through Quarter 1 2015
Data Element N or
% NEVADA (Group Prenatal Care)
Birth Center
Group Prenatal Care
Maternity Care Home
Total
Number of Live Births by Estimated Gestational Birth (EGA)
N 119 2115 1140 2617 5872
Preterm Births, <37 weeks EGA N – 112 131 461 704
% – 5.3 11.5 17.6 12.0
Non-Preterm Births, ≥37 weeks EGA N 105 1994 823 1945 4762
% 88.2 94.3 72.2 74.3 81.1

61
Data Element N or
% NEVADA (Group Prenatal Care)
Birth Center
Group Prenatal Care
Maternity Care Home
Total
Missing N – – 186 211 406
% – – 16.3 8.1 6.9
Number of Live Births by Birth Weight N 119 2115 1140 2617 5872
Low Birth Weight, <2500 grams N 12 75 147 412 634
% 10.1 3.5 12.9 15.7 10.8
Not Low Birth Weight, ≥ 2500 grams N 107 1810 993 2019 4822
% 89.9 85.6 87.1 77.2 82.1
Missing N 0 240 13 197 450
% 0 11.3 1.1 7.5 7.7
Notes: Rows labeled with an “N” indicate the number of observations from which percentages have been calculated. Yellow cells labeled with a dash symbol indicate that between 0 and 11 responses had been received during the reporting period. Statistics were only calculated for items with at least 11 responses.
Table 7. Breastfeeding and Family Planning, through Quarter 1 2015
Data Element N or
% NEVADA (Group Prenatal Care)
Birth Center
Group Prenatal Care
Maternity Care Home
Total
Breastfeeding After Delivery from Postpartum Data
N 128 1533 1416 4000 6949
Yes % 90.6 86.4 64.7 61.5 67.7
No % 5.5 7.4 9.5 25.6 18.3
Prefer not to answer % 0.8 0.7 1.8 0.5 0.8
Missing % 3.1 5.6 24.0 12.3 13.2
Women Who Breastfed As a Percentage of Women Who Planned to Breastfeed
% 103.9 100.2 97.4 100.7 99.9
Had Birth Control Counseling After Delivery N 128 1533 1416 4000 6949
Yes % 59.4 71.6 60.8 69.7 68.3
No % 30.5 19.4 12.3 15.2 15.5
Unsure % 7.0 2.8 2.4 1.8 2.1
Missing % 3.1 6.2 24.5 13.3 14.0
Note: Rows labeled with an “N” indicate the number of observations from which percentages have been calculated.
TECHNICAL ASSISTANCE
In February 2015, the evaluation team spoke with officials from the Nevada Division of Welfare and
Supportive Services (DWSS) and the Nevada Division of Public and Behavioral Health (DPBH) to discuss
the state’s willingness to and process for releasing state Medicaid and birth certificate data
(respectively) to the Urban Institute for the impact analysis of the Strong Start evaluation. State officials
were receptive to supporting the evaluation, and although they originally preferred that the Urban
Institute link the data, DWSS staff recently indicated that they will link the Medicaid and birth certificate
data on our behalf. A fully executed data use agreement (DUA) was sent to the Urban Institute from
DWSS in July 2015. The evaluation team is currently awaiting approval from DPBH, and hopes to begin
receiving data in late 2015.

62
Johns Hopkins University
CASE STUDY
Johns Hopkins University School of Medicine in Baltimore, Maryland has implemented the maternity
care home approach of Strong Start in partnership with Priority Partners, the Hopkins-affiliated
Medicaid managed care organization (MCO). At the time of evaluation Y2 data collection, there were an
estimated 400 women participating in the program across five sites in Baltimore. Awardee and site staff
report that Strong Start implementation has been going well with progress on many fronts, including
expansion of the approach and improved participant outcomes.
Highlights from the second round of case study data collection include:
Though enrollment continues to fall short of the awardee’s target, Hopkins has made a number
of changes to the program in an effort to increase enrollment. Two new sites were added in
early 2015 (Wyman Park and the Center for Addiction and Pregnancy), and all five sites enroll
patients with gestational age up to 30 weeks, a change from their gestational age cut-off at 28
weeks in evaluation Y1.
Strong Start staff are confident that they are reaching all of the eligible women at each site. Key
informants felt that recent implementation of Strong Start at two new sites was smoother than
earlier launches as a result of that prior experience and the identification of best practices to
develop a more formalized workflow.
The awardee now provides more support to site staff for data collection, including through
regular meetings and increased communication about the data collection process and by
establishing a standardized approach to report submission.
Hopkins uses a detailed protocol for service delivery to ensure that enhanced services are
provided consistently across all sites. The standardized protocol helps to clarify Strong Start staff
roles and responsibilities and better integrate the program into the clinic flow. Three nurse case
managers and community health worker (CHW) teams are embedded at each site to provide
care coordination and resource referrals for Strong Start enrollees.
Based on Hopkins’ own tracking of outcomes for Strong Start participants, key informants note
significant improvements in preterm birth rates, NICU admissions, birth weight, and gestational
age at birth.
Priority Partners has seen the cost savings associated with Strong Start and has expressed plans
to continue the program. Ongoing support for the program is part of current budget discussions.

63
PARTICIPANT-LEVEL PROCESS EVALUATION
The information presented below is based on data submitted from the four evaluation forms through
Quarter 1 2015. By March 2015, Johns Hopkins University (Hopkins) had Intake Forms for 94 percent of
participants enrolled through Quarter 1 2015 (908 Intake Forms for 965 participants). In addition,
Hopkins submitted 373 Third Trimester Surveys, 420 Postpartum Surveys, and 205 Exit Forms. The tables
below present data collected on Johns Hopkins University’s participants with aggregated rates by
approach for the purpose of comparison.
Table 1. Enrollment and Forms Submitted, through Quarter 1 2015
Data Element N or
% JHU (Maternity
Care Home) Birth
Center Group
Prenatal Care Maternity Care Home
Total
Newly Enrolled in Q1 2015 N 140 739 948 2638 4325
Total Ever Enrolled through Q1 2015 N 965 4739 5576 13232 23547
Number of Women Delivered through Q1 2015
N 555 2275 2755 6189 11219
Intake Forms Received through Q1 2015 N 908 2993 4401 11761 19155
Received through Q1 2015 as a percentage of the number of women ever enrolled
% 94.1 63.2 78.9 88.9 81.3
Third Trimester Surveys Received through Q1 2015
N 373 1876 2145 4683 8704
Received through Q1 2015 as a percentage of the number of women delivered
% 67.2 82.5 77.9 75.7 77.6
Postpartum Surveys Received through Q1 2015
N 420 1533 1416 4000 6949
Received through Q1 2015 as a percentage of the number of women delivered
% 75.7 67.4 51.4 64.6 61.9
Exit Forms Received through Q1 2015 N 205 2133 1433 3103 6669
Received through Q1 2015 as a percentage of the number of women delivered
% 36.9 93.8 52.0 50.1 59.4
Note: Rows labeled with an “N” indicate the number of observations from which percentages have been calculated.
Table 2. Sociodemographic Risk Factors, through Quarter 1 2015
Data Element N or
% JHU (Maternity
Care Home) Birth
Center Group
Prenatal Care Maternity Care Home
Total
Mother’s Age at Intake N 908 2993 4401 11761 19155
Less than 18 years of age % 7.7 3.4 6.7 5.8 5.6
18 through 34 years of age % 68.9 86.1 75.0 81.4 80.7
35 years and older % 4.1 6.2 4.9 6.0 5.8
Missing % 19.3 4.3 13.4 6.8 7.9
Race and Ethnicity N 908 2993 4401 11761 19155
Hispanic % 7.7 25.7 39.2 22.9 27.1
Non-Hispanic white % 13.5 53.3 13.7 26.2 27.6
Non-Hispanic black % 71.8 14.8 39.2 46.3 39.8
Non-Hispanic Asian % 1.9 1.1 1.2 1.2 1.2
Non-Hispanic other % 1.3 0.6 1.6 0.7 0.9
Non-Hispanic multiple race % 3.4 3.6 2.3 1.2 1.8
Missing % 0.3 0.9 2.8 1.5 1.7

64
Data Element N or
% JHU (Maternity
Care Home) Birth
Center Group
Prenatal Care Maternity Care Home
Total
Employed at Intake N 908 2993 4401 11761 19155
Yes % 37.9 39.7 34.6 38.8 38.0
No % 61.9 59.1 60.9 60.0 60.0
Missing % 0.2 1.2 4.5 1.2 2.0
Education Level at Intake N 908 2993 4401 11761 19155
Less than high school % 29.4 14.3 23.7 24.5 22.7
High school graduate or GED % 59.0 52.3 46.2 52.0 50.7
Bachelor’s degree % 2.3 10.1 3.1 2.5 3.9
Other college degree(s) % 3.8 12.7 7.2 6.0 7.3
Missing % 5.5 10.7 19.8 15.0 15.4
Relationship Status at Intake N 908 2993 4401 11761 19155
Married, living with spouse % 10.8 40.7 18.6 17.2 21.2
Married, not living with spouse % 2.1 1.7 2.1 1.9 1.9
Living with a partner % 34.5 32.2 31.3 30.6 31.0
In a relationship but not living together % 29.7 12.9 24.6 30.5 26.4
Not in a relationship right now % 21.4 11.1 17.0 17.8 16.6
Missing % 1.5 1.3 6.4 2.0 2.9
Smokes Cigarettes at Intake N 908 2993 4401 11761 19155
Yes % 15.1 10.1 7.8 14.1 12.0
No % 71.4 77.1 71.7 77.8 76.3
Missing % 13.5 12.9 20.4 8.1 11.7
Food Insecure at Intake N 908 2993 4401 11761 19155
Yes % 15.2 18.1 18.5 16.1 16.9
No % 82.7 76.9 61.4 76.2 72.9
Missing*
% 2.1 5.0 20.0 7.7 10.1
Exhibiting Depressive Symptoms at Intake**
N 908 2993 4401 11761 19155
Yes % 33.0 21.8 25.2 23.4 23.5
No % 63.8 69.3 57.0 69.3 66.4
Missing* % 3.2 9.0 17.9 7.3 10.0
Have Experienced Intimate Partner Violence in a Relationship***
% 908 2993 4401 11761 19155
Yes % 14.0 20.6 17.1 19.0 18.8
No % 85.7 77.2 68.4 78.5 76.0
Missing* % 0.3 2.1 14.5 2.4 5.1
Notes: Cells that contain one asterisk indicate that the ‘Missing’ category includes respondents who did not answer all of the items required to calculate this measure. Cells that contain two asterisks indicate that this is as measured by a shortened version of the CES-D. Cells that contain three asterisks indicate that this is as measured by the Slapped, Threatened, and Throw (STaT) screener. Rows labeled with an “N” indicate the number of observations from which percentages have been calculated.
Table 3. Medical Risk Factors Prior to Current Pregnancy, through Quarter 1 2015
Data Element N or
% JHU (Maternity
Care Home) Birth
Center Group
Prenatal Care Maternity Care Home
Total
Inter-Pregnancy Interval with Current Pregnancy Since Last Birth
N 135 1127 700 1914 3741
<18 months % 20.7 24.3 18.0 19.5 20.7
≥18 months % 59.3 39.8 48.3 51.9 47.6
Missing % 20.0 35.9 33.7 28.6 31.8

65
Data Element N or
% JHU (Maternity
Care Home) Birth
Center Group
Prenatal Care Maternity Care Home
Total
Previous Preterm Birth(s) Between 20 and 36 weeks, 6 days EGA
N 135 1127 700 1914 3741
Yes % 20.7 10.7 11.4 18.9 15.0
No % 74.1 89.3 63.9 63.2 71.2
Not Known % 4.4 0 18.6 14.9 11.1
Missing % 0.7 0 6.1 3.0 2.7
Previous Birth(s) Less than 2,500 grams N 135 1127 700 1914 3741
Yes % 12.6 1.9 8.6 14.8 9.7
No % 64.4 95.8 60.4 61.7 71.7
Not Known % 14.8 0 24.7 19.2 14.5
Missing % 8.1 2.3 6.3 4.3 4.1
Pre-Pregnancy Diagnosis of Type I Diabetes N 205 2133 1433 3103 6669
Yes % 0.5 0.5 1.3 1.5 1.1
No % 89.8 99.5 74.2 84.4 87.0
Not Known % 2.9 0 7.7 11.1 6.8
Missing % 6.8 0 16.7 3.1 5.0
Pre-Pregnancy Diagnosis of Type II Diabetes N 205 2133 1433 3103 6669
Yes % 2.0 0 2.6 1.9 1.5
No % 88.8 5.0 72.9 83.3 56.1
Not Known % 2.9 0 7.7 11.1 6.8
Missing % 6.3 94.9 16.7 3.7 35.7
Pre-Pregnancy Diagnosis of Hypertension N 205 2133 1433 3103 6669
Yes % 8.8 0.5 6.0 9.5 5.9
No % 82.4 99.5 66.7 77.4 82.2
Not Known % 2.9 0 7.6 10.2 6.4
Missing % 5.9 0 19.7 2.9 5.6
Note: Rows labeled with an “N” indicate the number of observations from which percentages have been calculated.
Table 4. Medical Risk Factors during the Current Pregnancy, through Quarter 1 2015
Data Element N or
% JHU (Maternity
Care Home) Birth
Center Group
Prenatal Care Maternity Care Home
Total
Gestational Diabetes N 205 2133 1433 3103 6669
Yes % 6.8 2.7 4.2 5.3 4.2
No % 83.9 97.3 65.4 76.0 80.6
Not Known % 1.5 0 10.3 15.9 9.6
Missing % 7.8 0 20.1 2.8 5.6
Pregnancy-Related Hypertension N 205 2133 1433 3103 6669
Yes % 12.7 1.3 7.8 7.7 5.7
No % 78.0 98.7 62.6 74.8 79.8
Not Known % 1.5 0 9.4 14.6 8.8
Missing % 7.8 0 20.2 2.9 5.7
Note: Rows labeled with an “N” indicate the number of observations from which percentages have been calculated.

66
Table 5. Birth and Delivery Methods, through Quarter 1 2015
Data Element N or
% JHU (Maternity
Care Home) Birth
Center Group
Prenatal Care Maternity Care Home
Total
Total Number of Exit Forms with Valid Birth Information
N 194 2125 1103 2740 5968
Number of Babies Born N 196 2128 1125 2801 6054
Induction of Labor Excluding Planned C-Sections
N 187 2133 1297 2826 6256
Yes % 28.9 14.4 23.8 17.2 17.6
No % 62.0 85.3 42.8 35.5 54.0
Not known % 5.3 0 10.6 37.8 19.3
Missing % 3.7 0.3 22.7 9.6 9.1
Delivery Method from Exit Data N 205 2133 1433 3103 6669
Vaginal delivery % 65.4 87.3 49.1 52.0 62.7
C-Section % 27.8 12.4 24.3 29.6 23.0
Vaginal and C-Section % 0 0 0 0 0
Missing % 6.8 0.2 26.7 18.3 14.3
Women Who Had a Vaginal Birth as a Percentage of Women Who Planned to Deliver Vaginally
% 83.7 90.9 80.2 81.6 85.4
VBAC13
N 33 90 161 418 669
Yes % 21.2 30.0 19.9 13.9 17.5
Repeat C-Section N 33 90 161 418 669
Yes % 78.8 70.0 80.1 86.1 82.5
Scheduled C-Section N 57 265 348 920 1533
Yes % 31.6 0 39.1 29.2 26.4
13 The denominator for VBAC and repeat C-section are calculated by adding the total respondents in both categories since we cannot confidently know who else had a previous C-section.
Note: Rows labeled with an “N” indicate the number of observations from which percentages have been calculated.
Table 6. Infant Outcomes, through Quarter 1 2015
Data Element N or
% JHU (Maternity
Care Home) Birth
Center Group
Prenatal Care Maternity Care Home
Total
Number of Live Births by Estimated Gestational Birth (EGA)
N 193 2115 1140 2617 5872
Preterm Births, <37 weeks EGA N 41 112 131 461 704
% 21.2 5.3 11.5 17.6 12.0
Non-Preterm Births, ≥37 weeks EGA N 146 1994 823 1945 4762
% 75.6 94.3 72.2 74.3 81.1
Missing N – – 186 211 406
% – – 16.3 8.1 6.9
Number of Live Births by Birth Weight N 193 2115 1140 2617 5872
Low Birth Weight, <2500 grams N 38 75 147 412 634
% 19.7 3.5 12.9 15.7 10.8
Not Low Birth Weight, ≥ 2500 grams N 154 1810 993 2019 4822
% 79.7 85.6 87.1 77.2 82.1
Missing N – 240 13 197 450
% – 11.3 1.1 7.5 7.7

67
Notes: Rows labeled with an “N” indicate the number of observations from which percentages have been calculated. Yellow cells labeled with a dash symbol indicate that between 0 and 11 responses had been received during the reporting period. Statistics were only calculated for items with at least 11 responses.
Table 7. Breastfeeding and Family Planning, through Quarter 1 2015
Data Element N or
% JHU (Maternity
Care Home) Birth
Center Group
Prenatal Care Maternity Care Home
Total
Breastfeeding After Delivery from Postpartum Survey Data
N 420 1533 1416 4000 6949
Yes % 43.3 86.4 64.7 61.5 67.7
No % 28.3 7.4 9.5 25.6 18.3
Prefer not to answer % 0.2 0.7 1.8 0.5 0.8
Missing % 28.1 5.6 24.0 12.3 13.2
Women Who Breastfed As a Percentage of Women Who Planned to Breastfeed
% 103.6 100.2 97.4 100.7 99.9
Had Birth Control Counseling After Delivery N 420 1533 1416 4000 6949
Yes % 67.6 71.6 60.8 69.7 68.3
No % 3.6 19.4 12.3 15.2 15.5
Unsure % 0.7 2.8 2.4 1.8 2.1
Missing % 28.1 6.2 24.5 13.3 14.0
Note: Rows labeled with an “N” indicate the number of observations from which percentages have been calculated.
TECHNICAL ASSISTANCE
In March and April 2015, the evaluation team spoke with officials from the Maryland Department of
Health and Mental Hygiene, which houses the Maryland Medicaid Assistance Programs and the Vital
Statistics Administration, to learn about the state’s willingness to and process for releasing state
Medicaid and birth certificate data (respectively) to the Urban Institute for the impact analysis of the
Strong Start evaluation. State officials were initially receptive to supporting the evaluation; however, the
Maryland Vital Statistics Administration later indicated that they do not have the capacity to share or
link data at this time. The evaluation team followed up with agency officials to clarify the option that the
state could simply share birth certificate data, rather than take on the more labor-intensive linking role,
but we received no response. Therefore, we plan to follow-up with the Vital Statistics Administration in
late 2015 to determine whether or not we can obtain data at a later point.

68
Los Angeles County Department of
Health Services
CASE STUDY
Los Angeles Department of Health Services (LADHS) is a large public health care system that treats over
800,000 patients each year at 19 community-based clinics and four hospitals located throughout Los
Angeles County. LADHS hospitals and clinics are the primary safety net provider in the county, with an
annual budget of approximately $4 billion. The majority of LADHS patients are enrolled in Medi-Cal (the
state’s Medicaid program), Healthy Families (the state’s CHIP program), or are uninsured. Several of the
county facilities offer opportunities for training physicians, including two of the county’s Strong Start
sites: Harbor-UCLA Medical Center and LAC+USC Medical Center. LADHS is implementing the maternity
care home approach at six sites, including the two mentioned above as well as: Martin Luther King Jr.
Ambulatory Care Center (MLK), Hubert Humphrey Comprehensive Health Center, Wilmington Medical
Center and Olive View-UCLA Medical Center. LADHS calls its Strong Start Program MAMA’s (Maternity
Assessment, Management, Access and Service) Neighborhood. Overall, the awardee is pleased with its
progress in implementing Strong Start, which includes expansions in the number of staff, sites and
services offered.
Highlights from the second round of case study data collection include:
In the past year, LADHS has hired three new staff members (an additional social worker and
health educator, as well as a nurse manager) and begun offering Strong Start services at
LAC+USC Medical Center. The awardee plans to expand to Olive View Hospital in June 2015.
Although care coordination services continue to focus on identifying participants’ areas of need
and providing them with linked referrals to both in-house and community resources, care
coordinators now use the automated risk scoring system developed by the awardee to
determine the intervention intensity each participant receives.
The awardee has integrated a health education curriculum into the resiliency classes LADHS (in
partnership with Healthy African American Families) developed for Strong Start during the first
year of implementation. These newly combined classes have been launched at Harbor and MLK
with plans to expand to remaining sites in the coming year.
The awardee has enrolled approximately 1,200 women to date and has discharged between 400
and 500 participants. At the time of the Year 2 interviews, there were approximately 700
women currently enrolled in the program.
While no changes have been made to the awardee’s enrollment strategies yet, LADHS plans to
move toward an opt-out enrollment approach. Key informants feel this would better suit its
program since so few women decline to participate and given the awardee’s plan for the Strong

69
Start enhanced services to become the standard of care offered to all pregnant patients in the
county health system.
The county is implementing a new electronic medical record system that will eventually allow
physicians at all LADHS facilities access to any LADHS patient’s records. The “Online Real-Time
Centralized Health Information Database” (ORCHID) was launched in March 2013 and
implementation is expected to be complete in March 2016.
Based on anecdotal observation, the awardee is confident that together, the components of its
Strong Start program are improving the psychosocial health of participants which should, in
turn, positively affect their physical health. Importantly, the awardee feels the program is
improving provider awareness of the need for behavioral health integration.
PARTICIPANT-LEVEL PROCESS EVALUATION
The information presented below is based on data submitted from the four evaluation forms through
Quarter 1 2015. Through March 2015, Los Angeles County Department of Health Services had Intake
Forms for 101 percent of participants enrolled through Quarter 1 2015 (1177 Intake Forms for 1166
participants). In addition, Los Angeles County Department of Health Services submitted 42 Third
Trimester Surveys, 84 Postpartum Surveys, and 64 Exit Forms. The tables below present data collected
on Los Angeles County Department of Health Services’ participants with aggregated rates by approach
for the purpose of comparison.
Table 1. Enrollment and Forms Submitted, through Quarter 1 2015
Data Element N or
% LA (Maternity Care Home)
Birth Center
Group Prenatal Care
Maternity Care Home
Total
Newly Enrolled in Q1 2015 N 267 739 948 2638 4325
Total Ever Enrolled through Q1 2015 N 1166 4739 5576 13232 23547
Number of Women Delivered through Q1 2015
N 272 2275 2755 6189 11219
Intake Forms Received through Q1 2015 N 1177 2993 4401 11761 19155
Received through Q1 2015 as a percentage of the number of women ever enrolled
% 100.9 63.2 78.9 88.9 81.3
Third Trimester Surveys Received through Q1 2015
N 42 1876 2145 4683 8704
Received through Q1 2015 as a percentage of the number of women delivered
% 15.4 82.5 77.9 75.7 77.6
Postpartum Surveys Received through Q1 2015
N 84 1533 1416 4000 6949
Received through Q1 2015 as a percentage of the number of women delivered
% 30.9 67.4 51.4 64.6 61.9
Exit Forms Received through Q1 2015 N 64 2133 1433 3103 6669
Received through Q1 2015 as a percentage of the number of women delivered
% 23.5 93.8 52.0 50.1 59.4
Note: Rows labeled with an “N” indicate the number of observations from which percentages have been calculated.

70
Table 2. Sociodemographic Risk Factors, through Quarter 1 2015
Data Element N or
% LA (Maternity Care Home)
Birth Center
Group Prenatal Care
Maternity Care Home
Total
Mother’s Age at Intake N 1177 2993 4401 11761 19155
Less than 18 years of age % 3.1 3.4 6.7 5.8 5.6
18 through 34 years of age % 82.9 86.1 75.0 81.4 80.7
35 years and older % 13.1 6.2 4.9 6.0 5.8
Missing % 0.9 4.3 13.4 6.8 7.9
Race and Ethnicity N 1177 2993 4401 11761 19155
Hispanic % 60.2 25.7 39.2 22.9 27.1
Non-Hispanic white % 5.4 53.3 13.7 26.2 27.6
Non-Hispanic black % 23.2 14.8 39.2 46.3 39.8
Non-Hispanic Asian % 5.6 1.1 1.2 1.2 1.2
Non-Hispanic other % 1.4 0.6 1.6 0.7 0.9
Non-Hispanic multiple race % 1.3 3.6 2.3 1.2 1.8
Missing % 3.1 0.9 2.8 1.5 1.7
Employed at Intake N 1177 2993 4401 11761 19155
Yes % 43.8 39.7 34.6 38.8 38.0
No % 54.4 59.1 60.9 60.0 60.0
Missing % 1.9 1.2 4.5 1.2 2.0
Education Level at Intake N 1177 2993 4401 11761 19155
Less than high school % 24.2 14.3 23.7 24.5 22.7
High school graduate or GED % 45.5 52.3 46.2 52.0 50.7
Bachelor’s degree % 4.8 10.1 3.1 2.5 3.9
Other college degree(s) % 4.5 12.7 7.2 6.0 7.3
Missing % 21.1 10.7 19.8 15.0 15.4
Relationship Status at Intake N 1177 2993 4401 11761 19155
Married, living with spouse % 21.3 40.7 18.6 17.2 21.2
Married, not living with spouse % 2.5 1.7 2.1 1.9 1.9
Living with a partner % 34.2 32.2 31.3 30.6 31.0
In a relationship but not living together % 30.6 12.9 24.6 30.5 26.4
Not in a relationship right now % 10.5 11.1 17.0 17.8 16.6
Missing % 0.8 1.3 6.4 2.0 2.9
Smokes Cigarettes at Intake N 1177 2993 4401 11761 19155
Yes % 5.1 10.1 7.8 14.1 12.0
No % 89.6 77.1 71.7 77.8 76.3
Missing % 5.3 12.9 20.4 8.1 11.7
Food Insecure at Intake N 1177 2993 4401 11761 19155
Yes % 16.3 18.1 18.5 16.1 16.9
No % 63.8 76.9 61.4 76.2 72.9
Missing*
% 19.9 5.0 20.0 7.7 10.1
Exhibiting Depressive Symptoms at Intake**
N 1177 2993 4401 11761 19155
Yes % 23.7 21.8 25.2 23.4 23.5
No % 74.2 69.3 57.0 69.3 66.4
Missing* % 2.2 9.0 17.9 7.3 10.0
Have Experienced Intimate Partner Violence in a Relationship***
N 1177 2993 4401 11761 19155
Yes % 27.0 20.6 17.1 19.0 18.8

71
Data Element N or
% LA (Maternity Care Home)
Birth Center
Group Prenatal Care
Maternity Care Home
Total
No % 70.2 77.2 68.4 78.5 76.0
Missing* % 2.8 2.1 14.5 2.4 5.1
Notes: Cells that contain one asterisk indicate that the ‘Missing’ category includes respondents who did not answer all of the items required to calculate this measure. Cells that contain two asterisks indicate that this is as measured by a shortened version of the CES-D. Cells that contain three asterisks indicate that this is as measured by the Slapped, Threatened, and Throw (STaT) screener. Rows labeled with an “N” indicate the number of observations from which percentages have been calculated.
Table 3. Medical Risk Factors Prior to Current Pregnancy, through Quarter 1 2015
Data Element N or
% LA (Maternity Care Home)
Birth Center
Group Prenatal Care
Maternity Care Home
Total
Inter-Pregnancy Interval with Current Pregnancy Since Last Birth
N 32 1127 700 1914 3741
<18 months % 15.6 24.3 18.0 19.5 20.7
≥18 months % 43.8 39.8 48.3 51.9 47.6
Missing % 40.6 35.9 33.7 28.6 31.8
Previous Preterm Birth(s) Between 20 and 36 weeks, 6 days EGA
N 32 1127 700 1914 3741
Yes % 3.1 10.7 11.4 18.9 15.0
No % 90.6 89.3 63.9 63.2 71.2
Not Known % 6.2 0 18.6 14.9 11.1
Missing % 0 0 6.1 3.0 2.7
Previous Birth(s) Less than 2,500 grams N 32 1127 700 1914 3741
Yes % 6.2 1.9 8.6 14.8 9.7
No % 78.1 95.8 60.4 61.7 71.7
Not Known % 15.6 0 24.7 19.2 14.5
Missing % 0 2.3 6.3 4.3 4.1
Pre-Pregnancy Diagnosis of Type I Diabetes N 64 2133 1433 3103 6669
Yes % 0 0.5 1.3 1.5 1.1
No % 90.6 99.5 74.2 84.4 87.0
Not Known % 9.4 0 7.7 11.1 6.8
Missing % 0 0 16.7 3.1 5.0
Pre-Pregnancy Diagnosis of Type II Diabetes N 64 2133 1433 3103 6669
Yes % 1.6 0 2.6 1.9 1.5
No % 89.1 5.0 72.9 83.3 56.1
Not Known % 9.4 0 7.7 11.1 6.8
Missing % 0 94.9 16.7 3.7 35.7
Pre-Pregnancy Diagnosis of Hypertension N 64 2133 1433 3103 6669
Yes % 3.1 0.5 6.0 9.5 5.9
No % 85.9 99.5 66.7 77.4 82.2
Not Known % 10.9 0 7.6 10.2 6.4
Missing % 0 0 19.7 2.9 5.6
Note: Rows labeled with an “N” indicate the number of observations from which percentages have been calculated.
Table 4. Medical Risk Factors during the Current Pregnancy, through Quarter 1 2015
Data Element N or
% LA (Maternity Care Home)
Birth Center
Group Prenatal Care
Maternity Care Home
Total
Gestational Diabetes N 64 2133 1433 3103 6669

72
Data Element N or
% LA (Maternity Care Home)
Birth Center
Group Prenatal Care
Maternity Care Home
Total
Yes % 6.2 2.7 4.2 5.3 4.2
No % 64.1 97.3 65.4 76.0 80.6
Not Known % 26.6 0 10.3 15.9 9.6
Missing % 3.1 0 20.1 2.8 5.6
Pregnancy-Related Hypertension N 64 2133 1433 3103 6669
Yes % 10.9 1.3 7.8 7.7 5.7
No % 56.2 98.7 62.6 74.8 79.8
Not Known % 29.7 0 9.4 14.6 8.8
Missing % 3.1 0 20.2 2.9 5.7
Note: Rows labeled with an “N” indicate the number of observations from which percentages have been calculated.
Table 5. Birth and Delivery Methods, through Quarter 1 2015
Data Element N or
% LA (Maternity Care Home)
Birth Center
Group Prenatal Care
Maternity Care Home
Total
Total Number of Exit Forms with Valid Birth Information
N 42 2125 1103 2740 5968
Number of Babies Born N 43 2128 1125 2801 6054
Induction of Labor Excluding Planned C-Sections
N 64 2133 1297 2826 6256
Yes % 15.9 14.4 23.8 17.2 17.6
No % 47.6 85.3 42.8 35.5 54.0
Not known % 30.2 0 10.6 37.8 19.3
Missing % 6.3 0.3 22.7 9.6 9.1
Delivery Method from Exit Data N 64 2133 1433 3103 6669
Vaginal delivery % 45.3 87.3 49.1 52.0 62.7
C-Section % 18.8 12.4 24.3 29.6 23.0
Vaginal and C-Section % 0 0 0 0 0
Missing % 35.9 0.2 26.7 18.3 14.3
Women Who Had a Vaginal Birth as a Percentage of Women Who Planned to Deliver Vaginally
% – 90.9 80.2 81.6 85.4
VBAC14
N – 90 161 418 669
Yes % – 30.0 19.9 13.9 17.5
Repeat C-Section N – 90 161 418 669
Yes % – 70.0 80.1 86.1 82.5
Scheduled C-Section N 12 265 348 920 1533
Yes % 8.3 0 39.1 29.2 26.4
14 The denominator for VBAC and repeat C-section are calculated by adding the total respondents in both categories since we cannot confidently know who else had a previous C-section.
Notes: Rows labeled with an “N” indicate the number of observations from which percentages have been calculated. Yellow cells labeled with a dash symbol indicate that between 0 and 11 responses had been received during the reporting period. Statistics were only calculated for items with at least 11 responses.
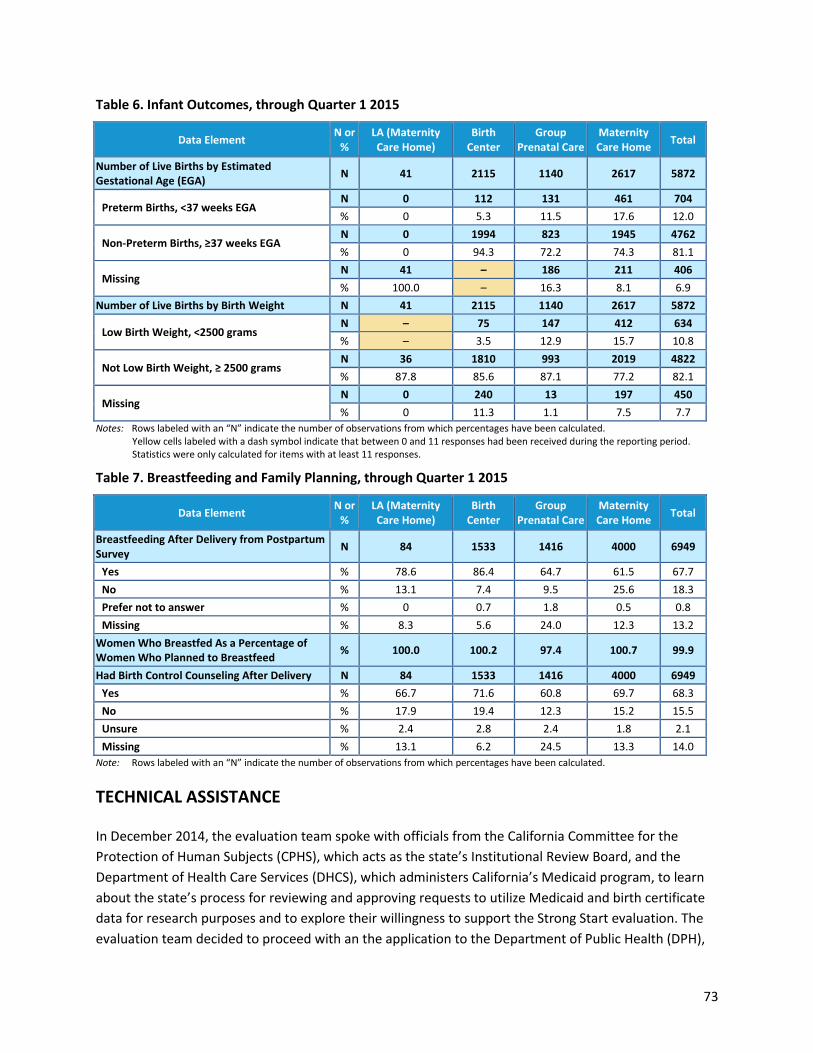
73
Table 6. Infant Outcomes, through Quarter 1 2015
Data Element N or
% LA (Maternity Care Home)
Birth Center
Group Prenatal Care
Maternity Care Home
Total
Number of Live Births by Estimated Gestational Age (EGA)
N 41 2115 1140 2617 5872
Preterm Births, <37 weeks EGA N 0 112 131 461 704
% 0 5.3 11.5 17.6 12.0
Non-Preterm Births, ≥37 weeks EGA N 0 1994 823 1945 4762
% 0 94.3 72.2 74.3 81.1
Missing N 41 – 186 211 406
% 100.0 – 16.3 8.1 6.9
Number of Live Births by Birth Weight N 41 2115 1140 2617 5872
Low Birth Weight, <2500 grams N – 75 147 412 634
% – 3.5 12.9 15.7 10.8
Not Low Birth Weight, ≥ 2500 grams N 36 1810 993 2019 4822
% 87.8 85.6 87.1 77.2 82.1
Missing N 0 240 13 197 450
% 0 11.3 1.1 7.5 7.7
Notes: Rows labeled with an “N” indicate the number of observations from which percentages have been calculated. Yellow cells labeled with a dash symbol indicate that between 0 and 11 responses had been received during the reporting period. Statistics were only calculated for items with at least 11 responses.
Table 7. Breastfeeding and Family Planning, through Quarter 1 2015
Data Element N or
% LA (Maternity Care Home)
Birth Center
Group Prenatal Care
Maternity Care Home
Total
Breastfeeding After Delivery from Postpartum Survey
N 84 1533 1416 4000 6949
Yes % 78.6 86.4 64.7 61.5 67.7
No % 13.1 7.4 9.5 25.6 18.3
Prefer not to answer % 0 0.7 1.8 0.5 0.8
Missing % 8.3 5.6 24.0 12.3 13.2
Women Who Breastfed As a Percentage of Women Who Planned to Breastfeed
% 100.0 100.2 97.4 100.7 99.9
Had Birth Control Counseling After Delivery N 84 1533 1416 4000 6949
Yes % 66.7 71.6 60.8 69.7 68.3
No % 17.9 19.4 12.3 15.2 15.5
Unsure % 2.4 2.8 2.4 1.8 2.1
Missing % 13.1 6.2 24.5 13.3 14.0
Note: Rows labeled with an “N” indicate the number of observations from which percentages have been calculated.
TECHNICAL ASSISTANCE
In December 2014, the evaluation team spoke with officials from the California Committee for the
Protection of Human Subjects (CPHS), which acts as the state’s Institutional Review Board, and the
Department of Health Care Services (DHCS), which administers California’s Medicaid program, to learn
about the state’s process for reviewing and approving requests to utilize Medicaid and birth certificate
data for research purposes and to explore their willingness to support the Strong Start evaluation. The
evaluation team decided to proceed with an the application to the Department of Public Health (DPH),

74
the vital records agency in California, without an initial phone call because of our previous experience
working with this agency. In general, state officials were receptive to supporting the Strong Start
evaluation, and staff from DHCS told us that they will be responsible for linking the Medicaid and birth
certificate data. Applications requesting Medicaid and birth certificate data were submitted to CPHS,
DHCS and DPH, in March 2015. In April, the evaluation team received approval from CPHS, but at the
time of this writing was still awaiting official approval from DHCS and DPH. We hope to receive 2014
birth data in late 2015.

75
Maricopa Integrated Health System
CASE STUDY
Maricopa Integrated Health System (MIHS) is the largest public safety net health system in Arizona and
operates a Medicaid managed care plan. MIHS serves predominantly low-income, minority residents in
Maricopa County, which contains the city of Phoenix. The health system is piloting Strong Start’s
maternity care home approach in 5 of its 11 family health clinics. As of Quarter 1 2015, MIHS had
enrolled 575 women into its Strong Start program.
Highlights from the second round of case study data collection include:
Supplemental Strong Start funding has allowed MIHS to increase staff resources. Specifically, the
Registered Nurse Care Coordinator (RNCC), community health worker (CHW), and the Vice
President of Grants and Research are able to devote more time to the project, and the awardee
also added a second full-time RNCC position. As a result, MIHS resumed Strong Start operations
at two sites that were previously discontinued because of staffing concerns.
The enhanced services offered to Strong Start participants at MIHS remain the same. RNCCs and
CHWs provide care coordination, health education and social support, and referrals to
supplementary services and resources such as substance abuse treatment, mental health care,
pregnancy/birth/breastfeeding education, and social services.
Strong Start outreach continues to occur both internally (through flagging eligible women in the
system’s electronic medical record) and externally (through partnering with community
organizations to refer eligible women to MIHS).
MIHS has made two changes to its Strong Start program eligibility criteria. First, the awardee no
longer requires a second preterm risk factor beyond Medicaid enrollment. Second, MIHS is now
offering Strong Start to Maricopa Health Plan patients receiving care at the Comprehensive
Health Center (a preexisting site) who were previously excluded because they already had
access to a RNCC through the health plan.
From implementation of the program to the time of the case study, MIHS has been enrolling
Medicaid-eligible women with gestational ages up to 33 weeks and 6 days, using an opt-in
enrollment approach.
Since receiving supplemental funding that allowed them to expand their staff capacity, Strong
Start enrollment has increased steadily at MIHS sites.
Key informants have begun to observe positive physical and psychosocial outcomes for Strong
Start participants, such as high rates of vaginal deliveries, healthy birth weights and receipt of
mental health and substance abuse treatment (though no comparison points were provided).

76
MIHS has already initiated conversations with health plans about providing financial support to
sustain Strong Start. One approach that has been discussed is a pay-for-performance program.
For example, a plan could create financial incentives for meeting thresholds for postpartum visit
attendance rates.
PARTICIPANT-LEVEL PROCESS EVALUATION
The information presented below is based on data submitted from the four evaluation forms through
Quarter 1 2015. Through March 2015, Maricopa Special Health Care District had Intake Forms for 66
percent of participants enrolled through Quarter 1 2015 (381 Intake Forms for 575 participants).15 In
addition, Maricopa Special Health Care District submitted 177 Third Trimester Surveys, 114 Postpartum
Surveys, but no Exit Forms. The tables below present data collected on Maricopa Special Health Care
District’s participants with aggregated rates by approach for the purpose of comparison.
Table 1. Enrollment and Forms Submitted, through Quarter 1 2015
15 Some enrollees will not have Intake Forms because they were enrolled prior to the awardee receiving IRB approval to administer the form.
Data Element N or
%
MARICOPA (Maternity Care
Home)
Birth Center
Group Prenatal Care
Maternity Care Home
Total
Newly Enrolled in Q1 2015 N 102 739 948 2638 4325
Total Ever Enrolled through Q1 2015 N 575 4739 5576 13232 23547
Number of Women Delivered through Q1 2015 N 297 2275 2755 6189 11219
Intake Forms Received through Q1 2015 N 381 2993 4401 11761 19155
Received through Q1 2015 as a percentage of the number of women ever enrolled
% 66.3 63.2 78.9 88.9 81.3
Third Trimester Surveys Received through Q1 2015
N 177 1876 2145 4683 8704
Received through Q1 2015 as a percentage of the number of women delivered
% 59.6 82.5 77.9 75.7 77.6
Postpartum Surveys Received through Q1 2015 N 114 1533 1416 4000 6949
Received through Q1 2015 as a percentage of the number of women delivered
% 38.4 67.4 51.4 64.6 61.9
Exit Forms Received through Q1 2015 N + 2133 1433 3103 6669
Received through Q1 2015 as a percentage of the number of women delivered
% + 93.8 52.0 50.1 59.4
Notes: Rows labeled with an “N” indicate the number of observations from which percentages have been calculated. Gray cells labeled with a plus symbol indicate that fewer than 25 forms had been received during the reporting period. Statistics were calculated only if there were at least 25 forms received.
Table 2. Sociodemographic Risk Factors, through Quarter 1 2015
Data Element N or
%
MARICOPA (Maternity Care
Home)
Birth Center
Group Prenatal Care
Maternity Care Home
Total
Mother’s Age at Intake N 381 2993 4401 11761 19155
Less than 18 years of age % 13.1 3.4 6.7 5.8 5.6
18 through 34 years of age % 80.8 86.1 75.0 81.4 80.7
35 years and older % 5.0 6.2 4.9 6.0 5.8

77
Data Element N or
%
MARICOPA (Maternity Care
Home)
Birth Center
Group Prenatal Care
Maternity Care Home
Total
Missing % 1.0 4.3 13.4 6.8 7.9
Race and Ethnicity N 381 2993 4401 11761 19155
Hispanic % 63.3 25.7 39.2 22.9 27.1
Non-Hispanic white % 13.4 53.3 13.7 26.2 27.6
Non-Hispanic black % 20.5 14.8 39.2 46.3 39.8
Non-Hispanic Asian % 0.5 1.1 1.2 1.2 1.2
Non-Hispanic other % 0.8 0.6 1.6 0.7 0.9
Non-Hispanic multiple race % 1.0 3.6 2.3 1.2 1.8
Missing % 0.5 0.9 2.8 1.5 1.7
Employed at Intake N 381 2993 4401 11761 19155
Yes % 32.8 39.7 34.6 38.8 38.0
No % 66.7 59.1 60.9 60 60.0
Missing % 0.5 1.2 4.5 1.2 2.0
Education Level at Intake N 381 2993 4401 11761 19155
Less than high school % 38.1 14.3 23.7 24.5 22.7
High school graduate or GED % 44.6 52.3 46.2 52 50.7
Bachelor’s degree % 0.8 10.1 3.1 2.5 3.9
Other college degree(s) % 3.1 12.7 7.2 6.0 7.3
Missing % 13.4 10.7 19.8 15 15.4
Relationship Status at Intake N 381 2993 4401 11761 19155
Married, living with spouse % 13.6 40.7 18.6 17.2 21.2
Married, not living with spouse % 1.3 1.7 2.1 1.9 1.9
Living with a partner % 36.5 32.2 31.3 30.6 31.0
In a relationship but not living together % 30.4 12.9 24.6 30.5 26.4
Not in a relationship right now % 17.3 11.1 17.0 17.8 16.6
Missing % 0.8 1.3 6.4 2.0 2.9
Smokes Cigarettes at Intake N 381 2993 4401 11761 19155
Yes % 13.1 10.1 7.8 14.1 12.0
No % 85.3 77.1 71.7 77.8 76.3
Missing % 1.6 12.9 20.4 8.1 11.7
Food Insecure at Intake N 381 2993 4401 11761 19155
Yes % 2.1 18.1 18.5 16.1 16.9
No % 89.2 76.9 61.4 76.2 72.9
Missing*
% 8.6 5.0 20.0 7.7 10.1
Exhibiting Depressive Symptoms at Intake**
N 381 2993 4401 11761 19155
Yes % 9.2 21.8 25.2 23.4 23.5
No % 86.6 69.3 57.0 69.3 66.4
Missing* % 4.2 9.0 17.9 7.3 10.0
Have Experienced Intimate Partner Violence in a Relationship***
N 381 2993 4401 11761 19155
Yes % 21.8 20.6 17.1 19 18.8
No % 76.6 77.2 68.4 78.5 76.0
Missing* % 1.6 2.1 14.5 2.4 5.1

78
Notes: Cells that contain one asterisk indicate that the ‘Missing’ category includes respondents who did not answer all of the items required to calculate this measure. Cells that contain two asterisks indicate that this is as measured by a shortened version of the CES-D. Cells that contain three asterisks indicate that this is as measured by the Slapped, Threatened, and Throw (STaT) screener. Rows labeled with an “N” indicate the number of observations from which percentages have been calculated.
Table 3. Medical Risk Factors Prior to Current Pregnancy, through Quarter 1 2015
Data Element N or
%
MARICOPA (Maternity Care
Home)
Birth Center
Group Prenatal Care
Maternity Care Home
Total
Inter-Pregnancy Interval with Current Pregnancy Since Last Birth
N + 1127 700 1914 3741
<18 months % + 24.3 18.0 19.5 20.7
≥18 months % + 39.8 48.3 51.9 47.6
Missing % + 35.9 33.7 28.6 31.8
Previous Preterm Birth(s) Between 20 and 36 weeks, 6 days EGA
N + 1127 700 1914 3741
Yes % + 10.7 11.4 18.9 15.0
No % + 89.3 63.9 63.2 71.2
Not Known % + 0 18.6 14.9 11.1
Missing % + 0 6.1 3.0 2.7
Previous Birth(s) Less than 2,500 grams N + 1127 700 1914 3741
Yes % + 1.9 8.6 14.8 9.7
No % + 95.8 60.4 61.7 71.7
Not Known % + 0 24.7 19.2 14.5
Missing % + 2.3 6.3 4.3 4.1
Pre-Pregnancy Diagnosis of Type I Diabetes N + 2133 1433 3103 6669
Yes % + 0.5 1.3 1.5 1.1
No % + 99.5 74.2 84.4 87.0
Not Known % + 0 7.7 11.1 6.8
Missing % + 0 16.7 3.1 5.0
Pre-Pregnancy Diagnosis of Type II Diabetes N + 2133 1433 3103 6669
Yes % + 0 2.6 1.9 1.5
No % + 5.0 72.9 83.3 56.1
Not Known % + 0 7.7 11.1 6.8
Missing % + 94.9 16.7 3.7 35.7
Pre-Pregnancy Diagnosis of Hypertension N + 2133 1433 3103 6669
Yes % + 0.5 6.0 9.5 5.9
No % + 99.5 66.7 77.4 82.2
Not Known % + 0 7.6 10.2 6.4
Missing % + 0 19.7 2.9 5.6
Notes: Rows labeled with an “N” indicate the number of observations from which percentages have been calculated. Gray cells labeled with a plus symbol indicate that fewer than 25 forms had been received during the reporting period. Statistics were calculated only if there were at least 25 forms received.
Table 4. Medical Risk Factors during the Current Pregnancy, through Quarter 1 2015
Data Element N or
%
MARICOPA (Maternity Care
Home)
Birth Center
Group Prenatal Care
Maternity Care Home
Total
Gestational Diabetes N + 2133 1433 3103 6669
Yes % + 2.7 4.2 5.3 4.2

79
Data Element N or
%
MARICOPA (Maternity Care
Home)
Birth Center
Group Prenatal Care
Maternity Care Home
Total
No % + 97.3 65.4 76.0 80.6
Not Known % + 0 10.3 15.9 9.6
Missing % + 0 20.1 2.8 5.6
Pregnancy-Related Hypertension N + 2133 1433 3103 6669
Yes % + 1.3 7.8 7.7 5.7
No % + 98.7 62.6 74.8 79.8
Not Known % + 0 9.4 14.6 8.8
Missing % + 0 20.2 2.9 5.7
Notes: Rows labeled with an “N” indicate the number of observations from which percentages have been calculated. Gray cells labeled with a plus symbol indicate that fewer than 25 forms had been received during the reporting period. Statistics were calculated only if there were at least 25 forms received.
Table 5. Birth and Delivery Methods, through Quarter 1 2015
Data Element N or
%
MARICOPA (Maternity Care
Home)
Birth Center
Group Prenatal Care
Maternity Care Home
Total
Total Number of Exit Forms with Valid Birth Information
N + 2125 1103 2740 5968
Number of Babies Born N + 2128 1125 2801 6054
Induction of Labor Excluding Planned C-Sections
N + 2133 1297 2826 6256
Yes % + 14.4 23.8 17.2 17.6
No % + 85.3 42.8 35.5 54.0
Not known % + 0 10.6 37.8 19.3
Missing % + 0.3 22.7 9.6 9.1
Delivery Method from Exit Data N + 2133 1433 3103 6669
Vaginal delivery % + 87.3 49.1 52.0 62.7
C-Section % + 12.4 24.3 29.6 23.0
Vaginal and C-Section % + 0 0 0 0
Missing % + 0.2 26.7 18.3 14.3
Women Who Had a Vaginal Birth as a Percentage of Women Who Planned to Deliver Vaginally
% + 90.9 80.2 81.6 85.4
VBAC16
N + 90 161 418 669
Yes % + 30.0 19.9 13.9 17.5
Repeat C-Section N + 90 161 418 669
Yes % + 70.0 80.1 86.1 82.5
Scheduled C-Section N + 265 348 920 1533
Yes % + 0 39.1 29.2 26.4
16 The denominator for VBAC and repeat C-section are calculated by adding the total respondents in both categories since we cannot confidently know who else had a previous C-section.
Notes: Rows labeled with an “N” indicate the number of observations from which percentages have been calculated. Gray cells labeled with a plus symbol indicate that fewer than 25 forms had been received during the reporting period. Statistics were calculated only if there were at least 25 forms received.

80
Table 6. Infant Outcomes, through Quarter 1 2015
Data Element N or
%
MARICOPA (Maternity Care
Home)
Birth Center
Group Prenatal Care
Maternity Care Home
Total
Number of Live Births by Estimated Gestational Birth (EGA)
N + 2115 1140 2617 5872
Preterm Births, <37 weeks EGA N + 112 131 461 704
% + 5.3 11.5 17.6 12.0
Non-Preterm Births, ≥37 weeks EGA N + 1994 823 1945 4762
% + 94.3 72.2 74.3 81.1
Missing N + – 186 211 406
% + – 16.3 8.1 6.9
Number of Live Births by Birth Weight N + 2115 1140 2617 5872
Low Birth Weight, <2500 grams N + 75 147 412 634
% + 3.5 12.9 15.7 10.8
Not Low Birth Weight, ≥ 2500 grams N + 1810 993 2019 4822
% + 85.6 87.1 77.2 82.1
Missing N + 240 13 197 450
% + 11.3 1.1 7.5 7.7
Notes: Rows labeled with an “N” indicate the number of observations from which percentages have been calculated. Gray cells labeled with a plus symbol indicate that fewer than 25 forms had been received during the reporting period. Statistics were calculated only if there were at least 25 forms received. Yellow cells labeled with a dash symbol indicate that between 0 and 11 responses had been received during the reporting period. Statistics were only calculated for items with at least 11 responses.
Table 7. Breastfeeding and Family Planning, through Quarter 1 2015
Data Element N or
%
MARICOPA (Maternity Care
Home)
Birth Center
Group Prenatal Care
Maternity Care Home
Total
Breastfeeding After Delivery from Postpartum Data
N 114 1533 1416 4000 6949
Yes % 77.2 86.4 64.7 61.5 67.7
No % 21.1 7.4 9.5 25.6 18.3
Prefer not to answer % 0 0.7 1.8 0.5 0.8
Missing % 1.8 5.6 24.0 12.3 13.2
Women Who Breastfed As a Percentage of Women Who Planned to Breastfeed
% 92.3 100.2 97.4 100.7 99.9
Had Birth Control Counseling After Delivery N 114 1533 1416 4000 6949
Yes % 82.5 71.6 60.8 69.7 68.3
No % 13.2 19.4 12.3 15.2 15.5
Unsure % 0.9 2.8 2.4 1.8 2.1
Missing % 3.5 6.2 24.5 13.3 14.0
Note: Rows labeled with an “N” indicate the number of observations from which percentages have been calculated.
TECHNICAL ASSISTANCE
In late March of 2015, the evaluation team contacted the Arizona Department of Health Services and
was directed to contact the state’s Medicaid agency, the Arizona Health Care Cost Containment System
(AHCCCS) before placing a request for birth certificate data. In April of 2015 we introduced states

81
officials at Arizona AHCCCS to the Strong Start for Mothers and Newborns Evaluation. State officials
were receptive to supporting the evaluation and requested further detail regarding the privacy
protections utilized by the evaluation. We were directed to the agency’s legal counsel with whom we
have recently reestablished communication. We hope to determine how best to meet the privacy
provisions required in the Medicaid eligibility and claims data request for the state before proceeding
with a data request to the Department of Health Services.

82
Medical University of South Carolina
CASE STUDY
The Medical University of South Carolina (MUSC) is a state university with a large academic medical
center and a statewide network of more than 750 primary and specialty care providers. MUSC is
implementing the Strong Start maternity care home approach at seven sites across the state, with a
particular focus in the Charleston area, and as of March 2015 had enrolled 735 women in the program.
Enhanced services include care coordination and social support, which are administered telephonically
by care navigators. A secondary component of MUSC’s Strong Start program aims to promote evidence-
based prenatal care at OB practice sites throughout the state.
Highlights from the second round of case study data collection include:
Implementation continues to be smooth, and the awardee is particularly pleased with the
addition of a social worker to the Strong Start team. The social worker addresses the
psychosocial needs of enrollees, which has allowed the care navigators, who are registered
nurses, to focus on participants’ medical needs.
MUSC modified Strong Start eligibility criteria in mid-2014 and at the time of Y2 data collection
enrolled any obstetrical patient with Medicaid coverage whose pregnancy is less than 32 weeks
gestation (i.e., no additional preterm risk factor is required). Key informants estimate that
enrollment has increased by 10 to 12 percent as a result of the criteria changes.
MUSC has maintained the five Strong Start sites reported during evaluation Y1. The majority of
Strong Start participants are from the three sites in the Charleston area (with few enrollees
coming from sites in the Columbia and Florence areas).
Key informants believe that Strong Start has contributed to reductions in the preterm birth rate,
emergency room admissions, early inductions, loss to follow-up, and NICU admissions. They also
report a positive impact on the psychosocial health of participants.
Despite reports of the program’s positive effects and unanimous interest in sustaining Strong
Start, key informants were not confident that MUSC would be able to continue providing
maternity care home services once the award period ends. The awardee was not able to sustain
a similar March of Dimes pilot program that was implemented in 2006, and key informants were
dubious that South Carolina’s Medicaid program would expand prenatal care benefits to
incorporate services like care coordination.
PARTICIPANT-LEVEL PROCESS EVALUATION
The information presented below is based on data submitted from the four evaluation forms through
Quarter 1 2015. By March 2015, Medical University of South Carolina (MUSC) had Intake Forms for 78

83
percent of participants enrolled through Quarter 1 2015 (576 Intake Forms for 735 participants). In
addition, Medical University of South Carolina submitted 312 Third Trimester Surveys, 403 Postpartum
Surveys, and 331 Exit Forms. The tables below present data collected on Medical University of South
Carolina’s participants with aggregated rates by approach for the purpose of comparison.
Table 1. Enrollment and Forms Submitted, through Quarter 1 2015
Data Element N or
% MUSC (Maternity
Care Home) Birth
Center Group
Prenatal Care Maternity Care Home
Total
Newly Enrolled in Q1 2015 N 123 739 948 2638 4325
Total Ever Enrolled through Q1 2015 N 735 4739 5576 13232 23547
Number of Women Delivered through Q1 2015
N 532 2275 2755 6189 11219
Intake Forms Received through Q1 2015 N 576 2993 4401 11761 19155
Received through Q1 2015 as a percentage of the number of women ever enrolled
% 78.4 63.2 78.9 88.9 81.3
Third Trimester Surveys Received through Q1 2015
N 312 1876 2145 4683 8704
Received through Q1 2015 as a percentage of the number of women delivered
% 58.6 82.5 77.9 75.7 77.6
Postpartum Surveys Received through Q1 2015
N 403 1533 1416 4000 6949
Received through Q1 2015 as a percentage of the number of women delivered
% 75.8 67.4 51.4 64.6 61.9
Exit Forms Received through Q1 2015 N 331 2133 1433 3103 6669
Received through Q1 2015 as a percentage of the number of women delivered
% 62.2 93.8 52.0 50.1 59.4
Note: Rows labeled with an “N” indicate the number of observations from which percentages have been calculated.
Table 2. Sociodemographic Risk Factors, through Quarter 1 2015
Data Element N or
% MUSC (Maternity
Care Home) Birth
Center Group
Prenatal Care Maternity Care Home
Total
Mother’s Age at Intake N 576 2993 4401 11761 19155
Less than 18 years of age % 2.1 3.4 6.7 5.8 5.6
18 through 34 years of age % 90.6 86.1 75.0 81.4 80.7
35 years and older % 6.4 6.2 4.9 6.0 5.8
Missing % 0.9 4.3 13.4 6.8 7.9
Race and Ethnicity N 576 2993 4401 11761 19155
Hispanic % 3.8 25.7 39.2 22.9 27.1
Non-Hispanic white % 24.8 53.3 13.7 26.2 27.6
Non-Hispanic black % 69.3 14.8 39.2 46.3 39.8
Non-Hispanic Asian % 0 1.1 1.2 1.2 1.2
Non-Hispanic other % 0.2 0.6 1.6 0.7 0.9
Non-Hispanic multiple race % 1.2 3.6 2.3 1.2 1.8
Missing % 0.7 0.9 2.8 1.5 1.7
Employed at Intake N 576 2993 4401 11761 19155
Yes % 40.5 39.7 34.6 38.8 38
No % 59.5 59.1 60.9 60 60
Missing % 0 1.2 4.5 1.2 2
Education Level at Intake N 576 2993 4401 11761 19155

84
Data Element N or
% MUSC (Maternity
Care Home) Birth
Center Group
Prenatal Care Maternity Care Home
Total
Less than high school % 22.2 14.3 23.7 24.5 22.7
High school graduate or GED % 62.0 52.3 46.2 52.0 50.7
Bachelor’s degree % 3.3 10.1 3.1 2.5 3.9
Other college degree(s) % 7.8 12.7 7.2 6.0 7.3
Missing % 4.7 10.7 19.8 15.0 15.4
Relationship Status at Intake N 576 2993 4401 11761 19155
Married, living with spouse % 14.8 40.7 18.6 17.2 21.2
Married, not living with spouse % 2.4 1.7 2.1 1.9 1.9
Living with a partner % 26.6 32.2 31.3 30.6 31.0
In a relationship but not living together % 40.8 12.9 24.6 30.5 26.4
Not in a relationship right now % 15.5 11.1 17.0 17.8 16.6
Missing % 0 1.3 6.4 2.0 2.9
Smokes Cigarettes at Intake N 576 2993 4401 11761 19155
Yes % 11.6 10.1 7.8 14.1 12.0
No % 88.2 77.1 71.7 77.8 76.3
Missing % 0.2 12.9 20.4 8.1 11.7
Food Insecure at Intake N 576 2993 4401 11761 19155
Yes % 16.8 18.1 18.5 16.1 16.9
No % 82.1 76.9 61.4 76.2 72.9
Missing*
% 1.0 5.0 20.0 7.7 10.1
Exhibiting Depressive Symptoms at Intake**
N 576 2993 4401 11761 19155
Yes % 13.7 21.8 25.2 23.4 23.5
No % 85.2 69.3 57.0 69.3 66.4
Missing* % 1.1 9.0 17.9 7.3 10.0
Have Experienced Intimate Partner Violence in a Relationship***
N 576 2993 4401 11761 19155
Yes % 11.8 20.6 17.1 19.0 18.8
No % 88.2 77.2 68.4 78.5 76.0
Missing* % 0 2.1 14.5 2.4 5.1
Notes: Cells that contain one asterisk indicate that the ‘Missing’ category includes respondents who did not answer all of the items required to calculate this measure. Cells that contain two asterisks indicate that this is as measured by a shortened version of the CES-D. Cells that contain three asterisks indicate that this is as measured by the Slapped, Threatened, and Throw (STaT) screener. Rows labeled with an “N” indicate the number of observations from which percentages have been calculated.
Table 3. Medical Risk Factors Prior to Current Pregnancy, through Quarter 1 2015
Data Element N or
% MUSC (Maternity
Care Home) Birth
Center Group
Prenatal Care Maternity Care Home
Total
Inter-Pregnancy Interval with Current Pregnancy Since Last Birth
N 217 1127 700 1914 3741
<18 months % 17.6 24.3 18.0 19.5 20.7
≥18 months % 70.0 39.8 48.3 51.9 47.6
Missing % 12.4 35.9 33.7 28.6 31.8
Previous Preterm Birth(s) Between 20 and 36 weeks, 6 days EGA
N 217 1127 700 1914 3741
Yes % 34.1 10.7 11.4 18.9 15.0
No % 65.4 89.3 63.9 63.2 71.2
Not Known % 0.5 0 18.6 14.9 11.1

85
Data Element N or
% MUSC (Maternity
Care Home) Birth
Center Group
Prenatal Care Maternity Care Home
Total
Missing % 0 0 6.1 3.0 2.7
Previous Birth(s) Less than 2,500 grams N 217 1127 700 1914 3741
Yes % 27.2 1.9 8.6 14.8 9.7
No % 55.8 95.8 60.4 61.7 71.7
Not Known % 16.1 0 24.7 19.2 14.5
Missing % 0.9 2.3 6.3 4.3 4.1
Pre-Pregnancy Diagnosis of Type I Diabetes N 331 2133 1433 3103 6669
Yes % 1.5 0.5 1.3 1.5 1.1
No % 93.7 99.5 74.2 84.4 87.0
Not Known % 4.2 0 7.7 11.1 6.8
Missing % 0.6 0 16.7 3.1 5.0
Pre-Pregnancy Diagnosis of Type II Diabetes N 331 2133 1433 3103 6669
Yes % 5.1 0 2.6 1.9 1.5
No % 90.0 5 72.9 83.3 56.1
Not Known % 4.2 0 7.7 11.1 6.8
Missing % 0.6 94.9 16.7 3.7 35.7
Pre-Pregnancy Diagnosis of Hypertension N 331 2133 1433 3103 6669
Yes % 18.1 0.5 6.0 9.5 5.9
No % 76.1 99.5 66.7 77.4 82.2
Not Known % 5.1 0 7.6 10.2 6.4
Missing % 0.6 0 19.7 2.9 5.6
Note: Rows labeled with an “N” indicate the number of observations from which percentages have been calculated.
Table 4. Medical Risk Factors during the Current Pregnancy, through Quarter 1 2015
Data Element N or
% MUSC (Maternity
Care Home) Birth
Center Group
Prenatal Care Maternity Care Home
Total
Gestational Diabetes N 331 2133 1433 3103 6669
Yes % 8.5 2.7 4.2 5.3 4.2
No % 81.0 97.3 65.4 76.0 80.6
Not Known % 10.6 0 10.3 15.9 9.6
Missing % 0 0 20.1 2.8 5.6
Pregnancy-Related Hypertension N 331 2133 1433 3103 6669
Yes % 8.8 1.3 7.8 7.7 5.7
No % 80.1 98.7 62.6 74.8 79.8
Not Known % 11.2 0 9.4 14.6 8.8
Missing % 0 0 20.2 2.9 5.7
Note: Rows labeled with an “N” indicate the number of observations from which percentages have been calculated.
Table 5. Birth and Delivery Methods, through Quarter 1 2015
Data Element N or
% MUSC (Maternity
Care Home) Birth
Center Group
Prenatal Care Maternity Care Home
Total
Total Number of Exit Forms with Valid Birth Information
N 323 2125 1103 2740 5968
Number of Babies Born N 334 2128 1125 2801 6054
Induction of Labor Excluding Planned C-Sections
N 279 2133 1297 2826 6256
Yes % 34.8 14.4 23.8 17.2 17.6

86
Data Element N or
% MUSC (Maternity
Care Home) Birth
Center Group
Prenatal Care Maternity Care Home
Total
No % 57.7 85.3 42.8 35.5 54.0
Not known % 7.2 0 10.6 37.8 19.3
Missing % 0.4 0.3 22.7 9.6 9.1
Delivery Method from Exit Data N 331 2133 1433 3103 6669
Vaginal delivery % 60.1 87.3 49.1 52.0 62.7
C-Section % 36.3 12.4 24.3 29.6 23.0
Vaginal and C-Section % 0 0 0 0 0
Missing % 3.6 0.2 26.7 18.3 14.3
Women Who Had a Vaginal Birth as a Percentage of Women Who Planned to Deliver Vaginally
% 83.2 90.9 80.2 81.6 85.4
VBAC17
N 76 90 161 418 669
Yes % 17.1 30.0 19.9 13.9 17.5
Repeat C-Section N 76 90 161 418 669
Yes % 82.9 70.0 80.1 86.1 82.5
Scheduled C-Section N 120 265 348 920 1533
Yes % 43.3 0 39.1 29.2 26.4
17 The denominator for VBAC and repeat C-section are calculated by adding the total respondents in both categories since we cannot confidently know who else had a previous C-section.
Note: Rows labeled with an “N” indicate the number of observations from which percentages have been calculated.
Table 6. Infant Outcomes, through Quarter 1 2015
Data Element N or
% MUSC (Maternity
Care Home) Birth
Center Group
Prenatal Care Maternity Care Home
Total
Number of Live Births by Estimated Gestational Birth (EGA)
N 323 2115 1140 2617 5872
Preterm Births, <37 weeks EGA N 81 112 131 461 704
% 25.1 5.3 11.5 17.6 12.0
Non-Preterm Births, ≥37 weeks EGA N 238 1994 823 1945 4762
% 73.7 94.3 72.2 74.3 81.1
Missing N – – 186 211 406
% – – 16.3 8.1 6.9
Number of Live Births by Birth Weight N 323 2115 1140 2617 5872
Low Birth Weight, <2500 grams N 74 75 147 412 634
% 22.9 3.5 12.9 15.7 10.8
Not Low Birth Weight, ≥ 2500 grams N 246 1810 993 2019 4822
% 76.2 85.6 87.1 77.2 82.1
Missing N – 240 13 197 450
% – 11.3 1.1 7.5 7.7
Notes: Rows labeled with an “N” indicate the number of observations from which percentages have been calculated. Yellow cells labeled with a dash symbol indicate that between 0 and 11 responses had been received during the reporting period. Statistics were only calculated for items with at least 11 responses.

87
Table 7. Breastfeeding and Family Planning, through Quarter 1 2015
Data Element N or
% MUSC (Maternity
Care Home) Birth
Center Group
Prenatal Care Maternity Care Home
Total
Breastfeeding After Delivery from Postpartum Data
N 403 1533 1416 4000 6949
Yes % 56.8 86.4 64.7 61.5 67.7
No % 18.9 7.4 9.5 25.6 18.3
Prefer not to answer % 0 0.7 1.8 0.5 0.8
Missing % 24.3 5.6 24.0 12.3 13.2
Women Who Breastfed As a Percentage of Women Who Planned to Breastfeed
% 100.0 100.2 97.4 100.7 99.9
Had Birth Control Counseling After Delivery N 403 1533 1416 4000 6949
Yes % 76.2 71.6 60.8 69.7 68.3
No % 0.5 19.4 12.3 15.2 15.5
Unsure % 0.2 2.8 2.4 1.8 2.1
Missing % 23.1 6.2 24.5 13.3 14.0
Note: Rows labeled with an “N” indicate the number of observations from which percentages have been calculated.
TECHNICAL ASSISTANCE
The South Carolina Division of Biostatistics, a part of the South Carolina Department of Health and
Environmental Control (DHEC), discussed the process of obtaining vital statistics data with our
evaluation team in the January of 2015. Following a productive conversation, we were forwarded a vital
statistics data request application and list of birth certificate variables and were told to reach out to the
South Carolina Revenue and Fiscal Affairs Office (RFA) to obtain information on the application process
for Medicaid data. The RFA official we spoke to was receptive to our request and was confident in South
Carolina’s ability to link Medicaid and vital statistics data. Furthermore, this official would function as
our liaison to the Medicaid Review Committee that would review our Medicaid data request. The official
forwarded us the application for use of Medicaid data and list of available Medicaid variables. We
submitted both the vital statistics and Medicaid data request applications to DHEC and RFA respectively
in the March of 2015. As of July 2015, we have obtained approval from the Medicaid review committee
and currently await approval from DHEC before proceeding. We hope to receive a linked file in the
coming months once DHEC approval has been granted.

88
Meridian Health Plan
CASE STUDY
Meridian Health Plan (Meridian) operates the Strong Start maternity care home approach in five
counties including Jackson County (west of Detroit), the site visited in evaluation Y1. Participation in
Strong Start is initiated when a pregnant Medicaid beneficiary enrolled in Meridian Health Plan is
identified through claims or a provider referral. Participants are screened for risk of having a poor birth
outcome, and the Strong Start intervention is tailored based on risk level. Low-risk participants receive
periodic telephonic care coordination. A care plan is developed for higher-risk participants, and there is
more clinical involvement in the telephonic care coordination these participants receive. Patients must
opt out of Strong Start if they wish to stop receiving telephonic support. High-risk participants who
cannot be reached by phone or who are not receiving prenatal care (as measured by claims data) are
visited by a Community Health Outreach Worker (CHOW), who assists them in getting needed medical
and social services.
Highlights from the second round of case study data collection include:
Meridian Strong Start staff includes two telephone care coordinators and the CHOW. Telephone
care coordinators communicate with obstetric practices to hand off information from the risk
assessment, an interaction that occurs more frequently than in evaluation Y1. The CHOW,
however, continues to have very little contact with prenatal care provider offices.
Allegiance Health, the largest health system in Jackson, plans to co-fund (with the awardee) a
nurse educator to work directly with patients, including pregnant women visiting the emergency
department. Beginning this summer (2015) the nurse educator will provide education and
referral to a prenatal care provider if the patient has not already selected one. Patients may also
be referred to the nurse educator by an obstetrician. The awardee has replaced its initially-
implemented group health education approach, which reached very few women, with one-on-
one education.
Meridian is working to increase access to behavioral health services for Strong Start enrollees in
the Jackson County area. The CHOW now receives referrals from the Meridian phone
coordinators so that she can assist in meeting patients’ behavioral health care needs..
Meridian’s Strong Start enrollment dipped in the fall of 2014 because of staff turnover.
Following recent hiring and training, enrollment is higher in April 2015 than it was in recent
months. Overall, Meridian Health Plan has been reaching enrollment targets.
A Meridian Health Plan-organized focus group (not part of the Strong Start evaluation) revealed
that plan enrollees are uncertain about their contraceptive choices. Meridian has eliminated
pre-authorization for long-acting reversible contraceptives in order to address one of the
barriers that may be influencing provider decisions about prescribing these forms of

89
contraception. Similarly, the awardee no longer requires prior authorization for the prescription
of breast pumps to pregnant Medicaid beneficiaries.
Because of the perceived successes of Strong Start to date, informants report that Meridian
Health Plan is exploring how Strong Start-like services can be offered in other regions of
Michigan and in other states where the health plan operates.
PARTICIPANT-LEVEL PROCESS EVALUATION
The information presented below is based on data submitted from the four evaluation forms through
Quarter 1 2015. Through March 2015, Meridian Health Plan had Intake Forms for 100.2 percent of
participants enrolled through Quarter 1 2015 (1540 Intake Forms for 1537 participants). In addition,
Meridian Health Plan submitted 817 Third Trimester Surveys, 714 Postpartum Surveys, and 331 Exit
Forms. The tables below present data collected on Meridian Health Plan’s participants with aggregated
rates by approach for the purpose of comparison.
Table 1. Enrollment and Forms Submitted, through Quarter 1 2015
Data Element N or
%
MERIDIAN (Maternity Care
Home)
Birth Center
Group Prenatal Care
Maternity Care Home
Total
Newly Enrolled in Q1 2015 N 322 739 948 2638 4325
Total Ever Enrolled through Q1 2015 N 1537 4739 5576 13232 23547
Number of Women Delivered through Q1 2015 N 995 2275 2755 6189 11219
Intake Forms Received through Q1 2015 N 1540 2993 4401 11761 19155
Received through Q1 2015 as a percentage of the number of women ever enrolled
% 100.2 63.2 78.9 88.9 81.3
Third Trimester Surveys Received through Q1 2015
N 817 1876 2145 4683 8704
Received through Q1 2015 as a percentage of the number of women delivered
% 82.1 82.5 77.9 75.7 77.6
Postpartum Surveys Received through Q1 2015 N 714 1533 1416 4000 6949
Received through Q1 2015 as a percentage of the number of women delivered
% 71.8 67.4 51.4 64.6 61.9
Exit Forms Received through Q1 2015 N 331 2133 1433 3103 6669
Received through Q1 2015 as a percentage of the number of women delivered
% 33.3 93.8 52.0 50.1 59.4
Note: Rows labeled with an “N” indicate the number of observations from which percentages have been calculated.
Table 2. Sociodemographic Risk Factors, through Quarter 1 2015
Data Element N or
%
MERIDIAN (Maternity Care
Home)
Birth Center
Group Prenatal Care
Maternity Care Home
Total
Mother’s Age at Intake N 1540 2993 4401 11761 19155
Less than 18 years of age % 2.7 3.4 6.7 5.8 5.6
18 through 34 years of age % 92.8 86.1 75 81.4 80.7
35 years and older % 3.2 6.2 4.9 6.0 5.8
Missing % 1.2 4.3 13.4 6.8 7.9
Race and Ethnicity N 1540 2993 4401 11761 19155

90
Data Element N or
%
MERIDIAN (Maternity Care
Home)
Birth Center
Group Prenatal Care
Maternity Care Home
Total
Hispanic % 3.6 25.7 39.2 22.9 27.1
Non-Hispanic white % 83.4 53.3 13.7 26.2 27.6
Non-Hispanic black % 11.2 14.8 39.2 46.3 39.8
Non-Hispanic Asian % 0.5 1.1 1.2 1.2 1.2
Non-Hispanic other % 0.2 0.6 1.6 0.7 0.9
Non-Hispanic multiple race % 0.6 3.6 2.3 1.2 1.8
Missing % 0.5 0.9 2.8 1.5 1.7
Employed at Intake N 1540 2993 4401 11761 19155
Yes % 38.2 39.7 34.6 38.8 38.0
No % 61.6 59.1 60.9 60.0 60.0
Missing % 0.1 1.2 4.5 1.2 2.0
Education Level at Intake N 1540 2993 4401 11761 19155
Less than high school % 22.3 14.3 23.7 24.5 22.7
High school graduate or GED % 61.9 52.3 46.2 52.0 50.7
Bachelor’s degree % 3.4 10.1 3.1 2.5 3.9
Other college degree(s) % 7.2 12.7 7.2 6.0 7.3
Missing % 5.1 10.7 19.8 15.0 15.4
Relationship Status at Intake N 1540 2993 4401 11761 19155
Married, living with spouse % 25.6 40.7 18.6 17.2 21.2
Married, not living with spouse % 1.2 1.7 2.1 1.9 1.9
Living with a partner % 32.0 32.2 31.3 30.6 31.0
In a relationship but not living together % 24.8 12.9 24.6 30.5 26.4
Not in a relationship right now % 15.8 11.1 17.0 17.8 16.6
Missing % 0.5 1.3 6.4 2.0 2.9
Smokes Cigarettes at Intake N 1540 2993 4401 11761 19155
Yes % 23.9 10.1 7.8 14.1 12.0
No % 74.9 77.1 71.7 77.8 76.3
Missing % 1.2 12.9 20.4 8.1 11.7
Food Insecure at Intake N 1540 2993 4401 11761 19155
Yes % 3.1 18.1 18.5 16.1 16.9
No % 93.8 76.9 61.4 76.2 72.9
Missing*
% 3.2 5.0 20.0 7.7 10.1
Exhibiting Depressive Symptoms at Intake**
N 1540 2993 4401 11761 19155
Yes % 7.9 21.8 25.2 23.4 23.5
No % 86.8 69.3 57.0 69.3 66.4
Missing* % 5.3 9.0 17.9 7.3 10.0
Have Experienced Intimate Partner Violence in a Relationship***
N 1540 2993 4401 11761 19155
Yes % 14.6 20.6 17.1 19.0 18.8
No % 84.3 77.2 68.4 78.5 76.0
Missing* % 1.1 2.1 14.5 2.4 5.1
Notes: Cells that contain one asterisk indicate that the ‘Missing’ category includes respondents who did not answer all of the items required to calculate this measure. Cells that contain two asterisks indicate that this is as measured by a shortened version of the CES-D. Cells that contain three asterisks indicate that this is as measured by the Slapped, Threatened, and Throw (STaT) screener. Rows labeled with an “N” indicate the number of observations from which percentages have been calculated.
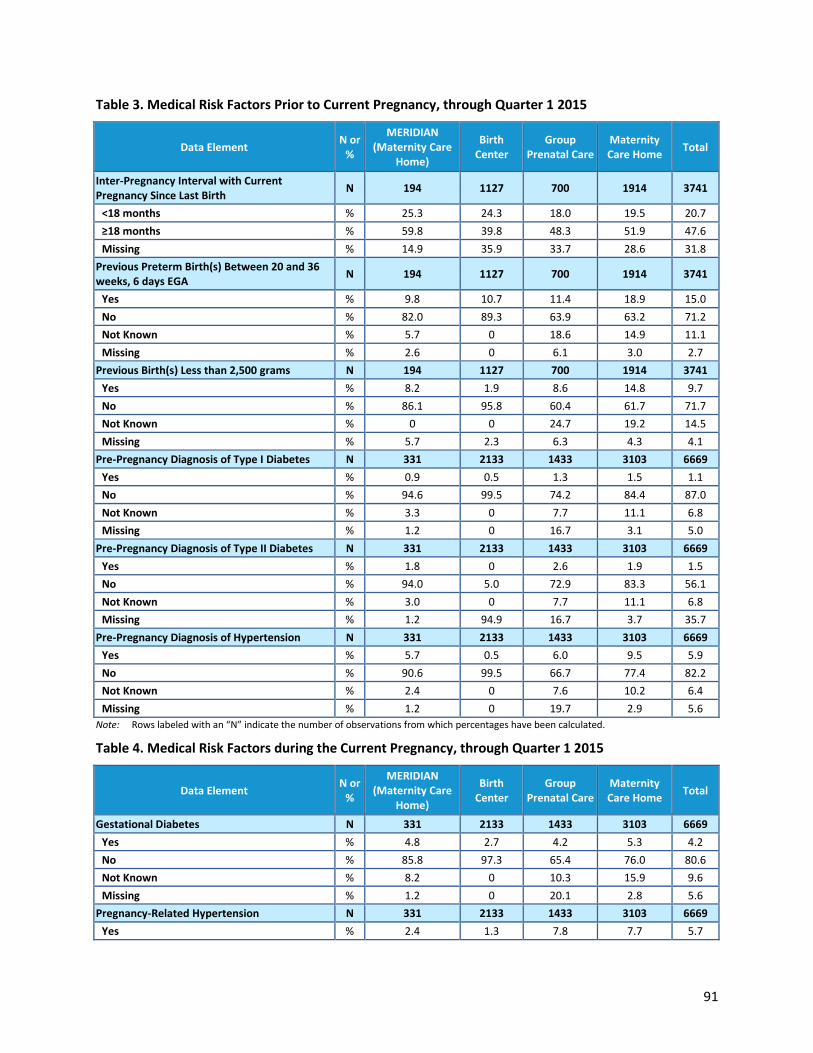
91
Table 3. Medical Risk Factors Prior to Current Pregnancy, through Quarter 1 2015
Data Element N or
%
MERIDIAN (Maternity Care
Home)
Birth Center
Group Prenatal Care
Maternity Care Home
Total
Inter-Pregnancy Interval with Current Pregnancy Since Last Birth
N 194 1127 700 1914 3741
<18 months % 25.3 24.3 18.0 19.5 20.7
≥18 months % 59.8 39.8 48.3 51.9 47.6
Missing % 14.9 35.9 33.7 28.6 31.8
Previous Preterm Birth(s) Between 20 and 36 weeks, 6 days EGA
N 194 1127 700 1914 3741
Yes % 9.8 10.7 11.4 18.9 15.0
No % 82.0 89.3 63.9 63.2 71.2
Not Known % 5.7 0 18.6 14.9 11.1
Missing % 2.6 0 6.1 3.0 2.7
Previous Birth(s) Less than 2,500 grams N 194 1127 700 1914 3741
Yes % 8.2 1.9 8.6 14.8 9.7
No % 86.1 95.8 60.4 61.7 71.7
Not Known % 0 0 24.7 19.2 14.5
Missing % 5.7 2.3 6.3 4.3 4.1
Pre-Pregnancy Diagnosis of Type I Diabetes N 331 2133 1433 3103 6669
Yes % 0.9 0.5 1.3 1.5 1.1
No % 94.6 99.5 74.2 84.4 87.0
Not Known % 3.3 0 7.7 11.1 6.8
Missing % 1.2 0 16.7 3.1 5.0
Pre-Pregnancy Diagnosis of Type II Diabetes N 331 2133 1433 3103 6669
Yes % 1.8 0 2.6 1.9 1.5
No % 94.0 5.0 72.9 83.3 56.1
Not Known % 3.0 0 7.7 11.1 6.8
Missing % 1.2 94.9 16.7 3.7 35.7
Pre-Pregnancy Diagnosis of Hypertension N 331 2133 1433 3103 6669
Yes % 5.7 0.5 6.0 9.5 5.9
No % 90.6 99.5 66.7 77.4 82.2
Not Known % 2.4 0 7.6 10.2 6.4
Missing % 1.2 0 19.7 2.9 5.6
Note: Rows labeled with an “N” indicate the number of observations from which percentages have been calculated.
Table 4. Medical Risk Factors during the Current Pregnancy, through Quarter 1 2015
Data Element N or
%
MERIDIAN (Maternity Care
Home)
Birth Center
Group Prenatal Care
Maternity Care Home
Total
Gestational Diabetes N 331 2133 1433 3103 6669
Yes % 4.8 2.7 4.2 5.3 4.2
No % 85.8 97.3 65.4 76.0 80.6
Not Known % 8.2 0 10.3 15.9 9.6
Missing % 1.2 0 20.1 2.8 5.6
Pregnancy-Related Hypertension N 331 2133 1433 3103 6669
Yes % 2.4 1.3 7.8 7.7 5.7

92
Data Element N or
%
MERIDIAN (Maternity Care
Home)
Birth Center
Group Prenatal Care
Maternity Care Home
Total
No % 87.0 98.7 62.6 74.8 79.8
Not Known % 9.1 0 9.4 14.6 8.8
Missing % 1.5 0 20.2 2.9 5.7
Note: Rows labeled with an “N” indicate the number of observations from which percentages have been calculated.
Table 5. Birth and Delivery Methods, through Quarter 1 2015
Data Element N or
%
MERIDIAN (Maternity Care
Home)
Birth Center
Group Prenatal Care
Maternity Care Home
Total
Total Number of Exit Forms with Valid Birth Information
N 275 2125 1103 2740 5968
Number of Babies Born N 277 2128 1125 2801 6054
Induction of Labor Excluding Planned C-Sections
N 309 2133 1297 2826 6256
Yes % 16.8 14.4 23.8 17.2 17.6
No % 36.2 85.3 42.8 35.5 54.0
Not known % 42.4 0 10.6 37.8 19.3
Missing % 4.5 0.3 22.7 9.6 9.1
Delivery Method from Exit Data N 331 2133 1433 3103 6669
Vaginal delivery % 50.5 87.3 49.1 52.0 62.7
C-Section % 36.3 12.4 24.3 29.6 23.0
Vaginal and C-Section % 0 0 0 0 0
Missing % 13.3 0.2 26.7 18.3 14.3
Women Who Had a Vaginal Birth as a Percentage of Women Who Planned to Deliver Vaginally
% 79.1 90.9 80.2 81.6 85.4
VBAC18
N 21 90 161 418 669
Yes % 14.3 30.0 19.9 13.9 17.5
Repeat C-Section N 21 90 161 418 669
Yes % 85.7 70.0 80.1 86.1 82.5
Scheduled C-Section N 120 265 348 920 1533
Yes % 12.5 0 39.1 29.2 26.4
18 The denominator for VBAC and repeat C-section are calculated by adding the total respondents in both categories since we cannot confidently know who else had a previous C-section.
Note: Rows labeled with an “N” indicate the number of observations from which percentages have been calculated.
Table 6. Infant Outcomes, through Quarter 1 2015
Data Element N or
%
MERIDIAN (Maternity Care
Home)
Birth Center
Group Prenatal Care
Maternity Care Home
Total
Number of Live Births by Estimated Gestational Age (EGA)
N 273 2115 1140 2617 5872
Preterm Births, <37 weeks EGA N 29 112 131 461 704
% 10.6 5.3 11.5 17.6 12.0
Non-Preterm Births, ≥37 weeks EGA N 231 1994 823 1945 4762
% 84.6 94.3 72.2 74.3 81.1

93
Data Element N or
%
MERIDIAN (Maternity Care
Home)
Birth Center
Group Prenatal Care
Maternity Care Home
Total
Missing N 13 – 186 211 406
% 4.8 – 16.3 8.1 6.9
Number of Live Births by Birth Weight N 273 2115 1140 2617 5872
Low Birth Weight, <2500 grams N 19 75 147 412 634
% 7.0 3.5 12.9 15.7 10.8
Not Low Birth Weight, ≥ 2500 grams N 193 1810 993 2019 4822
% 70.7 85.6 87.1 77.2 82.1
Missing N 61 240 13 197 450
% 22.3 11.3 1.1 7.5 7.7
Notes: Rows labeled with an “N” indicate the number of observations from which percentages have been calculated. Yellow cells labeled with a dash symbol indicate that between 0 and 11 responses had been received during the reporting period. Statistics were only calculated for items with at least 11 responses.
Table 7. Breastfeeding and Family Planning, through Quarter 1 2015
Data Element N or
%
MERIDIAN (Maternity Care
Home)
Birth Center
Group Prenatal Care
Maternity Care Home
Total
Breastfeeding After Delivery from Postpartum Survey
N 714 1533 1416 4000 6949
Yes % 72.3 86.4 64.7 61.5 67.7
No % 27.2 7.4 9.5 25.6 18.3
Prefer not to answer % 0 0.7 1.8 0.5 0.8
Missing % 0.6 5.6 24.0 12.3 13.2
Women Who Breastfed As a Percentage of Women Who Planned to Breastfeed
% 100.8 100.2 97.4 100.7 99.9
Had Birth Control Counseling After Delivery N 714 1533 1416 4000 6949
Yes % 68.8 71.6 60.8 69.7 68.3
No % 28.6 19.4 12.3 15.2 15.5
Unsure % 1.5 2.8 2.4 1.8 2.1
Missing % 1.1 6.2 24.5 13.3 14
Note: Rows labeled with an “N” indicate the number of observations from which percentages have been calculated.
TECHNICAL ASSISTANCE
In January 2015, the evaluation team spoke with officials from the Michigan Department of Health and
Human Services (MDHHS) to learn about the state’s willingness to and process for releasing state
Medicaid and birth certificate data to the Urban Institute for the impact analysis of the Strong Start
evaluation. In Michigan, both Medicaid and birth certificate data are housed under MDHHS, and thus we
are working with one person within the agency who is coordinating our data request. Michigan is
receptive to supporting the evaluation, and MDHHS staff plan to link the Medicaid and birth certificate
data. An application requesting Medicaid and birth certificate data was submitted to MDHHS in June
2015. The evaluation team is currently awaiting approval from MDHHS but hopes to begin receiving data
in late 2015.

94
Mississippi Primary Health Care
Association
CASE STUDY
The Mississippi Primary Health Care Association (MPHCA) administers the Strong Start award across
eight community health centers (CHCs) in Mississippi. Sites are a mix of urban, suburban and rural
health centers. Total enrollment through the end of 2014 was 1,819. Very few changes in program
content or administration were reported at the time of Y2 data collection. Significant updates are
highlighted below.
Highlights from the second round of case study data collection include:
Key informants generally felt that Strong Start implementation was going well, although one site
(Pearl) plans to end its participation in October 2015 because of the administrative burden. The
evaluation team has subsequently been informed that all remaining sites will stop enrolling new
patients on September 30, 2015 in preparation for the end of their award period in early 2016.
Both sites studied appear to be more proactive and energetic with more defined processes in
their care coordination, social service referrals, and tracking of patients than on our site visit in
2014.
CHCs have improved relationships with delivering hospitals and private obstetricians compared
to 2014 when they were not able to track referrals or birth outcomes. Improved provider
relationships have facilitated CHC access to birth outcomes data, which subsequently improves
continuity of care for their patients.
Eligibility criteria appear to vary among the sites. For example, the Pearl site, which had already
stopped enrolling new patients at the time of the Y2 data collection, attempted to enroll all
Medicaid-eligible pregnant women in Strong Start regardless of gestational age, while the Laurel
site requires an additional preterm risk factor and imposes a 20-week gestational age limit. The
awardee noted that preterm risk factors are identified in 99 percent of Medicaid patients and
that the challenge lies in recruiting and enrolling patients prior to 20-24 weeks gestation.
Key informants from both sites studied in evaluation Y2 believe Strong Start services positively
affect outcomes. For instance, the Laurel site reported an estimated 5 to 7 percent reduction in
preterm births (compared to pre-Strong Start rates), out-performing the MPHCA target of a 3
percent reduction.
Total enrollment projections have been revised downward from 4,000 enrollees (during
evaluation Y1) to 2,640 for the duration of the program, which informants view as more realistic
given the available funding.

95
PARTICIPANT-LEVEL PROCESS EVALUATION
The information presented below is based on data submitted from the four evaluation forms through
Quarter 1 2015. By March 2015, Mississippi Primary Health Care Association had Intake Forms for 79
percent of participants enrolled through Quarter 1 2015 (1666 Intake Forms for 2098 participants). In
addition, Mississippi Primary Health Care Association submitted 694 Third Trimester Surveys, 572
Postpartum Surveys, and 1066 Exit Forms. The tables below present data collected on Mississippi
Primary Health Care Association’s participants with aggregated rates by approach for the purpose of
comparison.
Table 1. Enrollment and Forms Submitted, through Quarter 1 2015
Data Element N or
%
MISSISSIPPI (Maternity Care
Home)
Birth Center
Group Prenatal Care
Maternity Care Home
Total
Newly Enrolled in Q1 2015 N 280 739 948 2638 4325
Total Ever Enrolled through Q1 2015 N 2098 4739 5576 13232 23547
Number of Women Delivered through Q1 2015 N 957 2275 2755 6189 11219
Intake Forms Received through Q1 2015 N 1666 2993 4401 11761 19155
Received through Q1 2015 as a percentage of the number of women ever enrolled
% 79.4 63.2 78.9 88.9 81.3
Third Trimester Surveys Received through Q1 2015
N 694 1876 2145 4683 8704
Received through Q1 2015 as a percentage of the number of women delivered
% 72.5 82.5 77.9 75.7 77.6
Postpartum Surveys Received through Q1 2015 N 572 1533 1416 4000 6949
Received through Q1 2015 as a percentage of the number of women delivered
% 59.8 67.4 51.4 64.6 61.9
Exit Forms Received through Q1 2015 N 1066 2133 1433 3103 6669
Received through Q1 2015 as a percentage of the number of women delivered
% 111.4 93.8 52.0 50.1 59.4
Note: Rows labeled with an “N” indicate the number of observations from which percentages have been calculated.
Table 2. Sociodemographic Risk Factors, through Quarter 1 2015
Data Element N or
%
MISSISSIPPI (Maternity Care
Home)
Birth Center
Group Prenatal Care
Maternity Care Home
Total
Mother’s Age at Intake N 1666 2993 4401 11761 19155
Less than 18 years of age % 9.1 3.4 6.7 5.8 5.6
18 through 34 years of age % 78.5 86.1 75.0 81.4 80.7
35 years and older % 3.8 6.2 4.9 6.0 5.8
Missing % 8.6 4.3 13.4 6.8 7.9
Race and Ethnicity N 1666 2993 4401 11761 19155
Hispanic % 1.0 25.7 39.2 22.9 27.1
Non-Hispanic white % 8.3 53.3 13.7 26.2 27.6
Non-Hispanic black % 87.9 14.8 39.2 46.3 39.8
Non-Hispanic Asian % 0.2 1.1 1.2 1.2 1.2
Non-Hispanic other % 0.2 0.6 1.6 0.7 0.9
Non-Hispanic multiple race % 0.4 3.6 2.3 1.2 1.8

96
Data Element N or
%
MISSISSIPPI (Maternity Care
Home)
Birth Center
Group Prenatal Care
Maternity Care Home
Total
Missing % 2.0 0.9 2.8 1.5 1.7
Employed at Intake N 1666 2993 4401 11761 19155
Yes % 35.7 39.7 34.6 38.8 38.0
No % 62.4 59.1 60.9 60.0 60.0
Missing % 1.9 1.2 4.5 1.2 2.0
Education Level at Intake N 1666 2993 4401 11761 19155
Less than high school % 16.8 14.3 23.7 24.5 22.7
High school graduate or GED % 51.1 52.3 46.2 52.0 50.7
Bachelor’s degree % 1.3 10.1 3.1 2.5 3.9
Other college degree(s) % 7.1 12.7 7.2 6.0 7.3
Missing % 23.6 10.7 19.8 15.0 15.4
Relationship Status at Intake N 1666 2993 4401 11761 19155
Married, living with spouse % 7.6 40.7 18.6 17.2 21.2
Married, not living with spouse % 2.4 1.7 2.1 1.9 1.9
Living with a partner % 19.7 32.2 31.3 30.6 31.0
In a relationship but not living together % 40.5 12.9 24.6 30.5 26.4
Not in a relationship right now % 23.8 11.1 17.0 17.8 16.6
Missing % 6.0 1.3 6.4 2.0 2.9
Smokes Cigarettes at Intake N 1666 2993 4401 11761 19155
Yes % 14.0 10.1 7.8 14.1 12.0
No % 61.9 77.1 71.7 77.8 76.3
Missing % 24.0 12.9 20.4 8.1 11.7
Food Insecure at Intake N 1666 2993 4401 11761 19155
Yes % 14.1 18.1 18.5 16.1 16.9
No % 79.1 76.9 61.4 76.2 72.9
Missing*
% 6.8 5.0 20.0 7.7 10.1
Exhibiting Depressive Symptoms at Intake**
N 1666 2993 4401 11761 19155
Yes % 29.7 21.8 25.2 23.4 23.5
No % 58.6 69.3 57.0 69.3 66.4
Missing* % 11.7 9.0 17.9 7.3 10.0
Have Experienced Intimate Partner Violence in a Relationship***
N 1666 2993 4401 11761 19155
Yes % 14.5 20.6 17.1 19.0 18.8
No % 83.9 77.2 68.4 78.5 76.0
Missing* % 1.6 2.1 14.5 2.4 5.1
Notes: Cells that contain one asterisk indicate that the ‘Missing’ category includes respondents who did not answer all of the items required to calculate this measure. Cells that contain two asterisks indicate that this is as measured by a shortened version of the CES-D. Cells that contain three asterisks indicate that this is as measured by the Slapped, Threatened, and Throw (STaT) screener. Rows labeled with an “N” indicate the number of observations from which percentages have been calculated.
Table 3. Medical Risk Factors Prior to Current Pregnancy, through Quarter 1 2015
Data Element N or
%
MISSISSIPPI (Maternity Care
Home)
Birth Center
Group Prenatal Care
Maternity Care Home
Total
Inter-Pregnancy Interval with Current Pregnancy Since Last Birth
N 639 1127 700 1914 3741
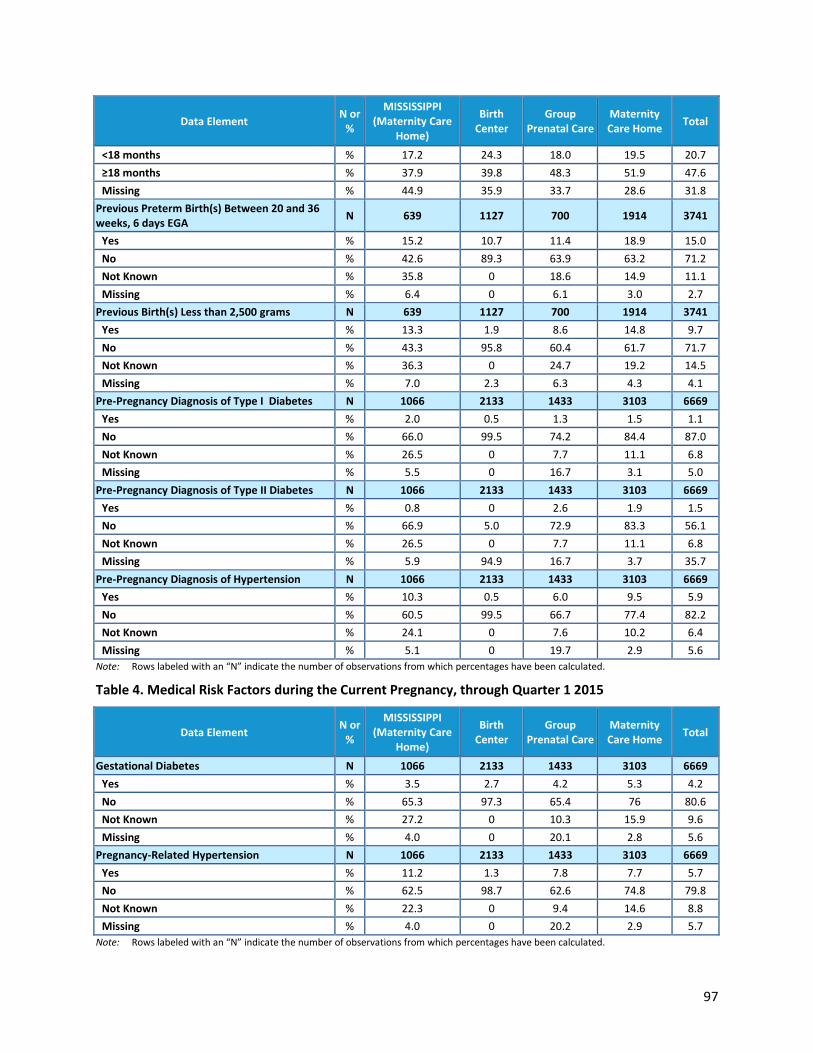
97
Data Element N or
%
MISSISSIPPI (Maternity Care
Home)
Birth Center
Group Prenatal Care
Maternity Care Home
Total
<18 months % 17.2 24.3 18.0 19.5 20.7
≥18 months % 37.9 39.8 48.3 51.9 47.6
Missing % 44.9 35.9 33.7 28.6 31.8
Previous Preterm Birth(s) Between 20 and 36 weeks, 6 days EGA
N 639 1127 700 1914 3741
Yes % 15.2 10.7 11.4 18.9 15.0
No % 42.6 89.3 63.9 63.2 71.2
Not Known % 35.8 0 18.6 14.9 11.1
Missing % 6.4 0 6.1 3.0 2.7
Previous Birth(s) Less than 2,500 grams N 639 1127 700 1914 3741
Yes % 13.3 1.9 8.6 14.8 9.7
No % 43.3 95.8 60.4 61.7 71.7
Not Known % 36.3 0 24.7 19.2 14.5
Missing % 7.0 2.3 6.3 4.3 4.1
Pre-Pregnancy Diagnosis of Type I Diabetes N 1066 2133 1433 3103 6669
Yes % 2.0 0.5 1.3 1.5 1.1
No % 66.0 99.5 74.2 84.4 87.0
Not Known % 26.5 0 7.7 11.1 6.8
Missing % 5.5 0 16.7 3.1 5.0
Pre-Pregnancy Diagnosis of Type II Diabetes N 1066 2133 1433 3103 6669
Yes % 0.8 0 2.6 1.9 1.5
No % 66.9 5.0 72.9 83.3 56.1
Not Known % 26.5 0 7.7 11.1 6.8
Missing % 5.9 94.9 16.7 3.7 35.7
Pre-Pregnancy Diagnosis of Hypertension N 1066 2133 1433 3103 6669
Yes % 10.3 0.5 6.0 9.5 5.9
No % 60.5 99.5 66.7 77.4 82.2
Not Known % 24.1 0 7.6 10.2 6.4
Missing % 5.1 0 19.7 2.9 5.6
Note: Rows labeled with an “N” indicate the number of observations from which percentages have been calculated.
Table 4. Medical Risk Factors during the Current Pregnancy, through Quarter 1 2015
Data Element N or
%
MISSISSIPPI (Maternity Care
Home)
Birth Center
Group Prenatal Care
Maternity Care Home
Total
Gestational Diabetes N 1066 2133 1433 3103 6669
Yes % 3.5 2.7 4.2 5.3 4.2
No % 65.3 97.3 65.4 76 80.6
Not Known % 27.2 0 10.3 15.9 9.6
Missing % 4.0 0 20.1 2.8 5.6
Pregnancy-Related Hypertension N 1066 2133 1433 3103 6669
Yes % 11.2 1.3 7.8 7.7 5.7
No % 62.5 98.7 62.6 74.8 79.8
Not Known % 22.3 0 9.4 14.6 8.8
Missing % 4.0 0 20.2 2.9 5.7
Note: Rows labeled with an “N” indicate the number of observations from which percentages have been calculated.

98
Table 5. Birth and Delivery Methods, through Quarter 1 2015
Data Element N or
%
MISSISSIPPI (Maternity Care
Home)
Birth Center
Group Prenatal Care
Maternity Care Home
Total
Total Number of Exit Forms with Valid Birth Information
N 928 2125 1103 2740 5968
Number of Babies Born N 953 2128 1125 2801 6054
Induction of Labor Excluding Planned C-Sections
N 989 2133 1297 2826 6256
Yes % 6.6 14.4 23.8 17.2 17.6
No % 24.7 85.3 42.8 35.5 54.0
Not known % 57.9 0 10.6 37.8 19.3
Missing % 10.8 0.3 22.7 9.6 9.1
Delivery Method from Exit Data N 1066 2133 1433 3103 6669
Vaginal delivery % 49.0 87.3 49.1 52.0 62.7
C-Section % 28.9 12.4 24.3 29.6 23.0
Vaginal and C-Section % 0.0 0 0 0 0
Missing % 22.1 0.2 26.7 18.3 14.3
Women Who Had a Vaginal Birth as a Percentage of Women Who Planned to Deliver Vaginally
% 85.0 90.9 80.2 81.6 85.4
VBAC19
N 117 90 161 418 669
Yes % 8.5 30.0 19.9 13.9 17.5
Repeat C-Section N 117 90 161 418 669
Yes % 91.5 70.0 80.1 86.1 82.5
Scheduled C-Section N 308 265 348 920 1533
Yes % 25.0 0 39.1 29.2 26.4
19 The denominator for VBAC and repeat C-section are calculated by adding the total respondents in both categories since we cannot confidently know who else had a previous C-section.
Note: Rows labeled with an “N” indicate the number of observations from which percentages have been calculated.
Table 6. Infant Outcomes, through Quarter 1 2015
Data Element N or
%
MISSISSIPPI (Maternity Care
Home)
Birth Center
Group Prenatal Care
Maternity Care Home
Total
Number of Live Births by Estimated Gestational Birth (EGA)
N 898 2115 1140 2617 5872
Preterm Births, <37 weeks EGA N 158 112 131 461 704
% 17.6 5.3 11.5 17.6 12.0
Non-Preterm Births, ≥37 weeks EGA N 612 1994 823 1945 4762
% 68.2 94.3 72.2 74.3 81.1
Missing N 128 – 186 211 406
% 14.3 – 16.3 8.1 6.9
Number of Live Births by Birth Weight N 898 2115 1140 2617 5872
Low Birth Weight, <2500 grams N 132 75 147 412 634
% 14.7 3.5 12.9 15.7 10.8
Not Low Birth Weight, ≥ 2500 grams N 663 1810 993 2019 4822
% 73.9 85.6 87.1 77.2 82.1

99
Data Element N or
%
MISSISSIPPI (Maternity Care
Home)
Birth Center
Group Prenatal Care
Maternity Care Home
Total
Missing N 105 240 13 197 450
% 11.7 11.3 1.1 7.5 7.7
Notes: Rows labeled with an “N” indicate the number of observations from which percentages have been calculated. Yellow cells labeled with a dash symbol indicate that between 0 and 11 responses had been received during the reporting period. Statistics were only calculated for items with at least 11 responses.
Table 7. Breastfeeding and Family Planning, through Quarter 1 2015
Data Element N or
%
MISSISSIPPI (Maternity Care
Home)
Birth Center
Group Prenatal Care
Maternity Care Home
Total
Breastfeeding After Delivery from Postpartum Data
N 572 1533 1416 4000 6949
Yes % 51.2 86.4 64.7 61.5 67.7
No % 37.8 7.4 9.5 25.6 18.3
Prefer not to answer % 1.7 0.7 1.8 0.5 0.8
Missing % 9.3 5.6 24.0 12.3 13.2
Women Who Breastfed As a Percentage of Women Who Planned to Breastfeed
% 101.8 100.2 97.4 100.7 99.9
Had Birth Control Counseling After Delivery N 572 1533 1416 4000 6949
Yes % 76.0 71.6 60.8 69.7 68.3
No % 12.8 19.4 12.3 15.2 15.5
Unsure % 1.6 2.8 2.4 1.8 2.1
Missing % 9.6 6.2 24.5 13.3 14.0
Note: Rows labeled with an “N” indicate the number of observations from which percentages have been calculated.
TECHNICAL ASSISTANCE
In March and April 2015, the evaluation team spoke with officials from the Mississippi Division of
Medicaid (DOM) and the Mississippi Department of Health (MSDH) to learn about the state’s willingness
to and process for releasing state Medicaid and birth certificate data (respectively) to the Urban
Institute for the impact analysis of the Strong Start evaluation. State officials were receptive to
supporting the evaluation, and staff from MSDH plan to link the Medicaid and birth certificate data for
the impact analysis. MSDH has sent the Urban Institute a Business Associate Agreement (BAA) to review
and sign. DOM is in the process of drafting a BAA for the Urban Institute to sign. The evaluation team
hopes to begin receiving data in early 2016.

100
Oklahoma Health Care Authority
CASE STUDY
Oklahoma Health Care Authority (OKHCA) is Oklahoma’s State Medicaid Agency located in Oklahoma
City. Initially OKHCA operated three Strong Start sites that each adopted the group prenatal care
approach, using a modified version of CHI’s CenteringPregnancy approach. At the time of evaluation Y2
data collection, however, OKHCA had two active sites with plans to begin Strong Start operations at two
new sites (for a total of four) in July 2015. Of the four sites now included in OKHCA’s program, two are
implementing the maternity care home approach and two are implementing group prenatal care.
Highlights from the second round of case study data collection include:
One site, the Oklahoma State University-Tulsa, exited the program after struggling to establish
an effective enrollment process and experiencing considerable difficulty engaging and building
support among providers.
Two federally qualified health centers (FQHCs) in Oklahoma City were preparing to begin
operations as new Strong Start sites. The Mary Mahoney Memorial Medical Center (which
serves a largely African-American population) will implement the maternity care home approach
featuring enhanced education services delivered by on-site providers (e.g. dentists,
pediatricians, behavioral health specialists). The Variety Care Center (which serves a largely
Hispanic population) will implement the group prenatal care approach and offer after-hours
sessions to facilitate participation by pregnant teens.
Choctaw Nation Medical Center (a site that existed in evaluation Y1) continues to face
enrollment-related challenges including limited interest in the program among eligible patients.
Still, key informants have observed that retention and visit attendance are high among patients
who do opt-in to group care, and that the approach has contributed to increased knowledge
about pregnancy and childbirth as well as improved receptivity to breastfeeding.
Another original site—the Oklahoma City Indian Clinic—transitioned from group prenatal care to
a maternity care home approach in the second program year. This transition was in process at
the time of Y2 data collection. The site plans to use the educational components of their group
care approach (which built off the Centering curriculum) to structure the content of the three
prenatal and one postpartum encounters that are planned for maternity care home enrollees.
To help boost program enrollment, the site adopted an opt-out enrollment approach and has
also placed the enrollment coordinator within the prenatal care clinic so that she can interact
more directly with participants.
Lagging Strong Start enrollment has been a major challenge for the awardee (with roughly 150
participants ever enrolled at the time of Y2 data collection) but OKHCA is hopeful that adding
the maternity care home approach to its program will improve enrollment and provide a

101
foundation for a sustainable intervention. Despite enrollment-related problems, feedback from
Strong Start participants has been positive and satisfaction with the enhanced services is high.
PARTICIPANT-LEVEL PROCESS EVALUATION
The information presented below is based on data submitted from the four evaluation forms through
Quarter 1 2015. By March 2015, Oklahoma Health Care Authority had Intake Forms for 80 percent of
participants enrolled through Quarter 1 2015 (111 Intake Forms for 138 participants). In addition,
Oklahoma Health Care Authority submitted 42 Third Trimester Surveys, 34 Postpartum Surveys, and 72
Exit Forms. The tables below present data collected on Oklahoma Health Care Authority’s participants
with aggregated rates by approach for the purpose of comparison.
Table 1. Enrollment and Forms Submitted, through Quarter 1 2015
Data Element N or
%
OKLAHOMA (Group Prenatal
Care)
Birth Center
Group Prenatal Care
Maternity Care Home
Total
Newly Enrolled in Q1 2015 N 17 739 948 2638 4325
Total Ever Enrolled through Q1 2015 N 138 4739 5576 13232 23547
Number of Women Delivered through Q1 2015 N 93 2275 2755 6189 11219
Intake Forms Received through Q1 2015 N 111 2993 4401 11761 19155
Received through Q1 2015 as a percentage of the number of women ever enrolled
% 80.4 63.2 78.9 88.9 81.3
Third Trimester Surveys Received through Q1 2015
N 42 1876 2145 4683 8704
Received through Q1 2015 as a percentage of the number of women delivered
% 45.2 82.5 77.9 75.7 77.6
Postpartum Surveys Received through Q1 2015 N 34 1533 1416 4000 6949
Received through Q1 2015 as a percentage of the number of women delivered
% 36.6 67.4 51.4 64.6 61.9
Exit Forms Received through Q1 2015 N 72 2133 1433 3103 6669
Received through Q1 2015 as a percentage of the number of women delivered
% 77.4 93.8 52.0 50.1 59.4
Note: Rows labeled with an “N” indicate the number of observations from which percentages have been calculated.
Table 2. Sociodemographic Risk Factors, through Quarter 1 2015
Data Element N or
%
OKLAHOMA (Group Prenatal
Care)
Birth Center
Group Prenatal Care
Maternity Care Home
Total
Mother’s Age at Intake N 111 2993 4401 11761 19155
Less than 18 years of age % 9.9 3.4 6.7 5.8 5.6
18 through 34 years of age % 64.9 86.1 75.0 81.4 80.7
35 years and older % 0.9 6.2 4.9 6.0 5.8
Missing % 24.3 4.3 13.4 6.8 7.9
Race and Ethnicity N 111 2993 4401 11761 19155
Hispanic % 10.8 25.7 39.2 22.9 27.1
Non-Hispanic white % 24.3 53.3 13.7 26.2 27.6
Non-Hispanic black % 7.2 14.8 39.2 46.3 39.8
Non-Hispanic Asian % 0 1.1 1.2 1.2 1.2

102
Data Element N or
%
OKLAHOMA (Group Prenatal
Care)
Birth Center
Group Prenatal Care
Maternity Care Home
Total
Non-Hispanic other % 37.8 0.6 1.6 0.7 0.9
Non-Hispanic multiple race % 19.8 3.6 2.3 1.2 1.8
Missing % 0.0 0.9 2.8 1.5 1.7
Employed at Intake N 111 2993 4401 11761 19155
Yes % 45.9 39.7 34.6 38.8 38.0
No % 54.1 59.1 60.9 60.0 60.0
Missing % 0 1.2 4.5 1.2 2.0
Education Level at Intake N 111 2993 4401 11761 19155
Less than high school % 13.5 14.3 23.7 24.5 22.7
High school graduate or GED % 50.5 52.3 46.2 52.0 50.7
Bachelor’s degree % 2.7 10.1 3.1 2.5 3.9
Other college degree(s) % 16.2 12.7 7.2 6.0 7.3
Missing % 17.1 10.7 19.8 15 15.4
Relationship Status at Intake N 111 2993 4401 11761 19155
Married, living with spouse % 29.7 40.7 18.6 17.2 21.2
Married, not living with spouse % 0 1.7 2.1 1.9 1.9
Living with a partner % 36.9 32.2 31.3 30.6 31.0
In a relationship but not living together % 18.0 12.9 24.6 30.5 26.4
Not in a relationship right now % 12.6 11.1 17.0 17.8 16.6
Missing % 2.7 1.3 6.4 2.0 2.9
Smokes Cigarettes at Intake N 111 2993 4401 11761 19155
Yes % 11.7 10.1 7.8 14.1 12.0
No % 65.8 77.1 71.7 77.8 76.3
Missing % 22.5 12.9 20.4 8.1 11.7
Food Insecure at Intake N 111 2993 4401 11761 19155
Yes % 22.5 18.1 18.5 16.1 16.9
No % 73.0 76.9 61.4 76.2 72.9
Missing*
% 4.5 5.0 20.0 7.7 10.1
Exhibiting Depressive Symptoms at Intake**
N 111 2993 4401 11761 19155
Yes % 27.0 21.8 25.2 23.4 23.5
No % 66.7 69.3 57.0 69.3 66.4
Missing* % 6.3 9.0 17.9 7.3 10.0
Have Experienced Intimate Partner Violence in a Relationship***
N 111 2993 4401 11761 19155
Yes % 27.0 20.6 17.1 19.0 18.8
No % 73.0 77.2 68.4 78.5 76.0
Missing* % 0 2.1 14.5 2.4 5.1
Notes: Cells that contain one asterisk indicate that the ‘Missing’ category includes respondents who did not answer all of the items required to calculate this measure. Cells that contain two asterisks indicate that this is as measured by a shortened version of the CES-D. Cells that contain three asterisks indicate that this is as measured by the Slapped, Threatened, and Throw (STaT) screener. Rows labeled with an “N” indicate the number of observations from which percentages have been calculated.

103
Table 3. Medical Risk Factors Prior to Current Pregnancy, through Quarter 1 2015
Data Element N or
%
OKLAHOMA (Group Prenatal
Care)
Birth Center
Group Prenatal Care
Maternity Care Home
Total
Inter-Pregnancy Interval with Current Pregnancy Since Last Birth
N 37 1127 700 1914 3741
<18 months % 43.2 24.3 18.0 19.5 20.7
≥18 months % 24.3 39.8 48.3 51.9 47.6
Missing % 32.4 35.9 33.7 28.6 31.8
Previous Preterm Birth(s) Between 20 and 36 weeks, 6 days EGA
N 37 1127 700 1914 3741
Yes % 8.1 10.7 11.4 18.9 15.0
No % 64.9 89.3 63.9 63.2 71.2
Not Known % 18.9 0 18.6 14.9 11.1
Missing % 8.1 0 6.1 3.0 2.7
Previous Birth(s) Less than 2,500 grams N 37 1127 700 1914 3741
Yes % 0 1.9 8.6 14.8 9.7
No % 45.9 95.8 60.4 61.7 71.7
Not Known % 51.4 0 24.7 19.2 14.5
Missing % 2.7 2.3 6.3 4.3 4.1
Pre-Pregnancy Diagnosis of Type I Diabetes N 72 2133 1433 3103 6669
Yes % 1.4 0.5 1.3 1.5 1.1
No % 73.6 99.5 74.2 84.4 87
Not Known % 13.9 0 7.7 11.1 6.8
Missing % 11.1 0 16.7 3.1 5.0
Pre-Pregnancy Diagnosis of Type II Diabetes N 72 2133 1433 3103 6669
Yes % 1.4 0 2.6 1.9 1.5
No % 72.2 5 72.9 83.3 56.1
Not Known % 15.3 0 7.7 11.1 6.8
Missing % 11.1 94.9 16.7 3.7 35.7
Pre-Pregnancy Diagnosis of Hypertension N 72 2133 1433 3103 6669
Yes % 1.4 0.5 6.0 9.5 5.9
No % 72.2 99.5 66.7 77.4 82.2
Not Known % 15.3 0 7.6 10.2 6.4
Missing % 11.1 0 19.7 2.9 5.6
Note: Rows labeled with an “N” indicate the number of observations from which percentages have been calculated.
Table 4. Medical Risk Factors during the Current Pregnancy, through Quarter 1 2015
Data Element N or
%
OKLAHOMA (Group Prenatal
Care)
Birth Center
Group Prenatal Care
Maternity Care Home
Total
Gestational Diabetes N 72 2133 1433 3103 6669
Yes % 5.6 2.7 4.2 5.3 4.2
No % 69.4 97.3 65.4 76.0 80.6
Not Known % 15.3 0 10.3 15.9 9.6
Missing % 9.7 0 20.1 2.8 5.6
Pregnancy-Related Hypertension N 72 2133 1433 3103 6669
Yes % 2.8 1.3 7.8 7.7 5.7

104
Data Element N or
%
OKLAHOMA (Group Prenatal
Care)
Birth Center
Group Prenatal Care
Maternity Care Home
Total
No % 72.2 98.7 62.6 74.8 79.8
Not Known % 15.3 0 9.4 14.6 8.8
Missing % 9.7 0 20.2 2.9 5.7
Note: Rows labeled with an “N” indicate the number of observations from which percentages have been calculated.
Table 5. Birth and Delivery Methods, through Quarter 1 2015
Data Element N or
%
OKLAHOMA (Group Prenatal
Care)
Birth Center
Group Prenatal Care
Maternity Care Home
Total
Total Number of Exit Forms with Valid Birth Information
N 60 2125 1103 2740 5968
Number of Babies Born N 60 2128 1125 2801 6054
Induction of Labor Excluding Planned C-Sections
N 67 2133 1297 2826 6256
Yes % 22.4 14.4 23.8 17.2 17.6
No % 56.7 85.3 42.8 35.5 54.0
Not known % 9.0 0 10.6 37.8 19.3
Missing % 11.9 0.3 22.7 9.6 9.1
Delivery Method from Exit Data N 72 2133 1433 3103 6669
Vaginal delivery % 56.9 87.3 49.1 52.0 62.7
C-Section % 25.0 12.4 24.3 29.6 23.0
Vaginal and C-Section % 0 0 0 0 0
Missing % 18.1 0.2 26.7 18.3 14.3
Women Who Had a Vaginal Birth as a Percentage of Women Who Planned to Deliver Vaginally
% 70.5 90.9 80.2 81.6 85.4
VBAC20
N – 90 161 418 669
Yes % – 30.0 19.9 13.9 17.5
Repeat C-Section N – 90 161 418 669
Yes % – 70.0 80.1 86.1 82.5
Scheduled C-Section N 18 265 348 920 1533
Yes % 27.8 0 39.1 29.2 26.4
20 The denominator for VBAC and repeat C-section are calculated by adding the total respondents in both categories since we cannot confidently know who else had a previous C-section.
Note: Rows labeled with an “N” indicate the number of observations from which percentages have been calculated. Yellow cells labeled with a dash symbol indicate that between 0 and 11 responses had been received during the reporting period. Statistics were only calculated for items with at least 11 responses.
Table 6. Infant Outcomes, through Quarter 1 2015
Data Element N or
%
OKLAHOMA (Group Prenatal
Care)
Birth Center
Group Prenatal Care
Maternity Care Home
Total
Number of Live Births by Estimated Gestational Birth (EGA)
N 59 2115 1140 2617 5872
Preterm Births, <37 weeks EGA N – 112 131 461 704
% – 5.3 11.5 17.6 12.0

105
Data Element N or
%
OKLAHOMA (Group Prenatal
Care)
Birth Center
Group Prenatal Care
Maternity Care Home
Total
Non-Preterm Births, ≥37 weeks EGA N 52 1994 823 1945 4762
% 88.1 94.3 72.2 74.3 81.1
Missing N – – 186 211 406
% – – 16.3 8.1 6.9
Number of Live Births by Birth Weight N 59 2115 1140 2617 5872
Low Birth Weight, <2500 grams N – 75 147 412 634
% – 3.5 12.9 15.7 10.8
Not Low Birth Weight, ≥ 2500 grams N 56 1810 993 2019 4822
% 94.9 85.6 87.1 77.2 82.1
Missing N 0 240 13 197 450
% 0 11.3 1.1 7.5 7.7
Notes: Rows labeled with an “N” indicate the number of observations from which percentages have been calculated. Yellow cells labeled with a dash symbol indicate that between 0 and 11 responses had been received during the reporting period. Statistics were only calculated for items with at least 11 responses.
Table 7. Breastfeeding and Family Planning, through Quarter 1 2015
Data Element N or
%
OKLAHOMA (Group Prenatal
Care)
Birth Center
Group Prenatal Care
Maternity Care Home
Total
Breastfeeding After Delivery from Postpartum Data
N 34 1533 1416 4000 6949
Yes % 82.4 86.4 64.7 61.5 67.7
No % 17.6 7.4 9.5 25.6 18.3
Prefer not to answer % 0 0.7 1.8 0.5 0.8
Missing % 0 5.6 24.0 12.3 13.2
Women Who Breastfed As a Percentage of Women Who Planned to Breastfeed
% 96.2 100.2 97.4 100.7 99.9
Had Birth Control Counseling After Delivery N 34 1533 1416 4000 6949
Yes % 73.5 71.6 60.8 69.7 68.3
No % 26.5 19.4 12.3 15.2 15.5
Unsure % 0 2.8 2.4 1.8 2.1
Missing % 0 6.2 24.5 13.3 14.0
Note: Rows labeled with an “N” indicate the number of observations from which percentages have been calculated.
TECHNICAL ASSISTANCE
The evaluation team is not seeking data in Oklahoma because total Strong Start enrollment in the state
is too low to warrant the large investment of time and resources required to obtain data.

106
Providence Health Foundation of
Providence Hospital
CASE STUDY
The National Capital Strong Start award, convened by the Center for Perinatal Advocacy of the
Providence Health Foundation at Providence Hospital (Providence), is operating five Strong Start sites in
Washington, D.C. The participating sites include three maternity care homes, a birth center and a group
prenatal care site. At the time of Y2 case study data collection, the awardee was on target to reach its Y2
enrollment goal of 1,380 women. Y2 case study interviews focused on two maternity care home sites
not studied during evaluation Y1: Unity Healthcare and Mary’s Center.
Highlights from the second round of data collection include:
Unity Healthcare is a federally qualified health center (FQHC) and level-three Patient-Centered
Medical Home (PCMH) that has implemented Strong Start at seven of its 29 clinic locations.
Unity recently began offering prenatal care classes and has hired four prenatal care associates
who provide patient education and case management services. The program initially focused on
enrolling all existing patients, which included a number of women between 35 and 38 weeks
gestation; however, once existing patients were enrolled, it shifted to focus on enrolling new
prenatal care patients who are generally earlier in their pregnancies.
Mary’s Center is also an FQCH and certified PCMH. Mary’s Center’s maternity care home
enhanced services are delivered by family support workers with college degrees, who provide
education and referrals to resources. Key informants noted that implementation has gone
smoothly because Mary’s Center offered these services prior to the award, and the only
significant change under Strong Start is the data collection component. Mary’s Center also offers
group prenatal care that is not funded by the Strong Start award.
A site that had implemented group prenatal care via Strong Start, Washington Hospital Center,
left the program this past year because of enrollment challenges. A recent change in managed
care contracting has significantly reduced their Medicaid patient population. All other sites have
remained in the program, which include Unity, Mary’s Center, and the three sites visited in Y1:
Community of Hope Family Health and Birth Center (which implemented the birth center
approach), Howard University (maternity care home approach), and Providence Hospital (group
prenatal care approach).
Overall, Providence is pleased with enrollment, the bulk of which is from the maternity care
home sites.
A District-wide initiative to support hospitals seeking Baby Friendly certification is underway at
most hospitals serving Medicaid beneficiaries. According to key informants, FQHCs and WIC

107
have both reported that more Medicaid enrollees across the city are now receiving
breastfeeding support.
Key informants reported a number of positive outcomes associated with their Strong Start
program, including high satisfaction with care and feeling more supported. They feel that their
process of identifying and addressing patient needs has potential to improve both physical and
psychosocial health among Strong Start participants.
The birth center and group prenatal care sites are expected to sustain their enhanced prenatal
care approaches after the award funding expires. However, the outlook for maternity care home
sites was mixed: while Mary’s Center will continue offering the family support worker services
(which they already offered before Strong Start) sustainable funding for Unity and Howard
University is uncertain.
PARTICIPANT-LEVEL PROCESS EVALUATION
The information presented below is based on data submitted from the four evaluation forms through
Quarter 1 2015. By March 2015, Providence Health Foundation had Intake Forms for 90 percent of
participants enrolled through Quarter 1 2015 (1193 Intake Forms for 1328 participants). In addition,
Providence Health Foundation submitted 462 Third Trimester Surveys, 247 Postpartum Surveys, and 46
Exit Forms. The tables below present data collected on Providence Health Foundation’s participants
with aggregated rates by approach for the purpose of comparison.
Table 1. Enrollment and Forms Submitted, through Quarter 1 2015
Data Element N or
% PROVIDENCE (All
Approaches) Birth
Center Group
Prenatal Care Maternity Care Home
Total
Newly Enrolled in Q1 2015 N 387 739 948 2638 4325
Total Ever Enrolled through Q1 2015 N 1328 4739 5576 13232 23547
Number of Women Delivered through Q1 2015 N 389 2275 2755 6189 11219
Intake Forms Received through Q1 2015 N 1193 2993 4401 11761 19155
Received through Q1 2015 as a percentage of the number of women ever enrolled
% 89.8 63.2 78.9 88.9 81.3
Third Trimester Surveys Received through Q1 2015
N 462 1876 2145 4683 8704
Received through Q1 2015 as a percentage of the number of women delivered
% 118.8 82.5 77.9 75.7 77.6
Postpartum Surveys Received through Q1 2015 N 247 1533 1416 4000 6949
Received through Q1 2015 as a percentage of the number of women delivered
% 63.5 67.4 51.4 64.6 61.9
Exit Forms Received through Q1 2015 N 46 2133 1433 3103 6669
Received through Q1 2015 as a percentage of the number of women delivered
% 11.8 93.8 52.0 50.1 59.4
Note: Rows labeled with an “N” indicate the number of observations from which percentages have been calculated.

108
Table 2. Sociodemographic Risk Factors, through Quarter 1 2015
Data Element N or
% PROVIDENCE (All
Approaches) Birth
Center Group
Prenatal Care Maternity Care Home
Total
Mother’s Age at Intake N 1193 2993 4401 11761 19155
Less than 18 years of age % 6.4 3.4 6.7 5.8 5.6
18 through 34 years of age % 82.1 86.1 75.0 81.4 80.7
35 years and older % 8.0 6.2 4.9 6.0 5.8
Missing % 3.4 4.3 13.4 6.8 7.9
Race and Ethnicity N 1193 2993 4401 11761 19155
Hispanic % 32.4 25.7 39.2 22.9 27.1
Non-Hispanic white % 1.1 53.3 13.7 26.2 27.6
Non-Hispanic black % 61.4 14.8 39.2 46.3 39.8
Non-Hispanic Asian % 0.8 1.1 1.2 1.2 1.2
Non-Hispanic other % 0.6 0.6 1.6 0.7 0.9
Non-Hispanic multiple race % 1.8 3.6 2.3 1.2 1.8
Missing % 1.8 0.9 2.8 1.5 1.7
Employed at Intake N 1193 2993 4401 11761 19155
Yes % 39.7 39.7 34.6 38.8 38.0
No % 59.3 59.1 60.9 60.0 60.0
Missing % 0.9 1.2 4.5 1.2 2.0
Education Level at Intake N 1193 2993 4401 11761 19155
Less than high school % 29.0 14.3 23.7 24.5 22.7
High school graduate or GED % 48.1 52.3 46.2 52.0 50.7
Bachelor’s degree % 3.0 10.1 3.1 2.5 3.9
Other college degree(s) % 4.1 12.7 7.2 6.0 7.3
Missing % 15.8 10.7 19.8 15.0 15.4
Relationship Status at Intake N 1193 2993 4401 11761 19155
Married, living with spouse % 14.6 40.7 18.6 17.2 21.2
Married, not living with spouse % 1.9 1.7 2.1 1.9 1.9
Living with a partner % 30.4 32.2 31.3 30.6 31.0
In a relationship but not living together % 30.7 12.9 24.6 30.5 26.4
Not in a relationship right now % 19.8 11.1 17 17.8 16.6
Missing % 2.6 1.3 6.4 2.0 2.9
Smokes Cigarettes at Intake N 1193 2993 4401 11761 19155
Yes % 6.4 10.1 7.8 14.1 12.0
No % 84.9 77.1 71.7 77.8 76.3
Missing % 8.7 12.9 20.4 8.1 11.7
Food Insecure at Intake N 1193 2993 4401 11761 19155
Yes % 24.8 18.1 18.5 16.1 16.9
No % 69.4 76.9 61.4 76.2 72.9
Missing*
% 5.8 5.0 20.0 7.7 10.1
Exhibiting Depressive Symptoms at Intake**
N 1193 2993 4401 11761 19155
Yes % 27.0 21.8 25.2 23.4 23.5
No % 60.8 69.3 57.0 69.3 66.4
Missing* % 12.2 9.0 17.9 7.3 10.0
Have Experienced Intimate Partner Violence in a Relationship***
N 1193 2993 4401 11761 19155
Yes % 17.4 20.6 17.1 19.0 18.8

109
Data Element N or
% PROVIDENCE (All
Approaches) Birth
Center Group
Prenatal Care Maternity Care Home
Total
No % 80.6 77.2 68.4 78.5 76.0
Missing* % 2.1 2.1 14.5 2.4 5.1
Notes: Cells that contain one asterisk indicate that the ‘Missing’ category includes respondents who did not answer all of the items required to calculate this measure. Cells that contain two asterisks indicate that this is as measured by a shortened version of the CES-D. Cells that contain three asterisks indicate that this is as measured by the Slapped, Threatened, and Throw (STaT) screener. Rows labeled with an “N” indicate the number of observations from which percentages have been calculated.
Table 3. Medical Risk Factors Prior to Current Pregnancy, through Quarter 1 2015
Data Element N or
% PROVIDENCE (All
Approaches) Birth
Center Group
Prenatal Care Maternity Care Home
Total
Inter-Pregnancy Interval with Current Pregnancy Since Last Birth
N 24 1127 700 1914 3741
<18 months % 16.7 24.3 18.0 19.5 20.7
≥18 months % 62.5 39.8 48.3 51.9 47.6
Missing % 20.8 35.9 33.7 28.6 31.8
Previous Preterm Birth(s) Between 20 and 36 weeks, 6 days EGA
N 24 1127 700 1914 3741
Yes % 16.7 10.7 11.4 18.9 15.0
No % 62.5 89.3 63.9 63.2 71.2
Not Known % 8.3 0 18.6 14.9 11.1
Missing % 12.5 0 6.1 3.0 2.7
Previous Birth(s) Less than 2,500 grams N 24 1127 700 1914 3741
Yes % 4.2 1.9 8.6 14.8 9.7
No % 66.7 95.8 60.4 61.7 71.7
Not Known % 16.7 0 24.7 19.2 14.5
Missing % 12.5 2.3 6.3 4.3 4.1
Pre-Pregnancy Diagnosis of Type I Diabetes N 46 2133 1433 3103 6669
Yes % 0 0.5 1.3 1.5 1.1
No % 76.1 99.5 74.2 84.4 87.0
Not Known % 2.2 0 7.7 11.1 6.8
Missing % 21.7 0 16.7 3.1 5.0
Pre-Pregnancy Diagnosis of Type II Diabetes N 46 2133 1433 3103 6669
Yes % 0 0 2.6 1.9 1.5
No % 76.1 5.0 72.9 83.3 56.1
Not Known % 2.2 0 7.7 11.1 6.8
Missing % 21.7 94.9 16.7 3.7 35.7
Pre-Pregnancy Diagnosis of Hypertension N 46 2133 1433 3103 6669
Yes % 0 0.5 6.0 9.5 5.9
No % 80.4 99.5 66.7 77.4 82.2
Not Known % 0 0 7.6 10.2 6.4
Missing % 19.6 0 19.7 2.9 5.6
Note: Rows labeled with an “N” indicate the number of observations from which percentages have been calculated.
Table 4. Medical Risk Factors during the Current Pregnancy, through Quarter 1 2015
Data Element N or
% PROVIDENCE (All
Approaches) Birth
Center Group
Prenatal Care Maternity Care Home
Total
Gestational Diabetes N 46 2133 1433 3103 6669

110
Data Element N or
% PROVIDENCE (All
Approaches) Birth
Center Group
Prenatal Care Maternity Care Home
Total
Yes % 2.2 2.7 4.2 5.3 4.2
No % 78.3 97.3 65.4 76.0 80.6
Not Known % 0 0 10.3 15.9 9.6
Missing % 19.6 0 20.1 2.8 5.6
Pregnancy-Related Hypertension N 46 2133 1433 3103 6669
Yes % 4.3 1.3 7.8 7.7 5.7
No % 73.9 98.7 62.6 74.8 79.8
Not Known % 0 0 9.4 14.6 8.8
Missing % 21.7 0 20.2 2.9 5.7
Note: Rows labeled with an “N” indicate the number of observations from which percentages have been calculated.
Table 5. Birth and Delivery Methods, through Quarter 1 2015
Data Element N or
% PROVIDENCE (All
Approaches) Birth
Center Group
Prenatal Care Maternity Care Home
Total
Total Number of Exit Forms with Valid Birth Information
N 37 2125 1103 2740 5968
Number of Babies Born N 37 2128 1125 2801 6054
Induction of Labor Excluding Planned C-Sections
N 45 2133 1297 2826 6256
Yes % 13.3 14.4 23.8 17.2 17.6
No % 57.8 85.3 42.8 35.5 54.0
Not known % 6.7 0 10.6 37.8 19.3
Missing % 22.2 0.3 22.7 9.6 9.1
Delivery Method from Exit Data N 46 2133 1433 3103 6669
Vaginal delivery % 54.3 87.3 49.1 52.0 62.7
C-Section % 26.1 12.4 24.3 29.6 23.0
Vaginal and C-Section % 0 0 0 0 0
Missing % 19.6 0.2 26.7 18.3 14.3
Women Who Had a Vaginal Birth as a Percentage of Women Who Planned to Deliver Vaginally
% 73.3 90.9 80.2 81.6 85.4
VBAC21
N – 90 161 418 669
Yes % – 30.0 19.9 13.9 17.5
Repeat C-Section N – 90 161 418 669
Yes % – 70.0 80.1 86.1 82.5
Scheduled C-Section N 12 265 348 920 1533
Yes % 8.3 0 39.1 29.2 26.4
21 The denominator for VBAC and repeat C-section are calculated by adding the total respondents in both categories since we cannot confidently know who else had a previous C-section.
Notes: Rows labeled with an “N” indicate the number of observations from which percentages have been calculated. Yellow cells labeled with a dash symbol indicate that between 0 and 11 responses had been received during the reporting period. Statistics were only calculated for items with at least 11 responses.

111
Table 6. Infant Outcomes, through Quarter 1 2015
Data Element N or
% PROVIDENCE (All
Approaches) Birth
Center Group
Prenatal Care Maternity Care Home
Total
Number of Live Births by Estimated Gestational Birth (EGA)
N 37 2115 1140 2617 5872
Preterm Births, <37 weeks EGA N – 112 131 461 704
% – 5.3 11.5 17.6 12.0
Non-Preterm Births, ≥37 weeks EGA N 31 1994 823 1945 4762
% 83.8 94.3 72.2 74.3 81.1
Missing N – – 186 211 406
% – – 16.3 8.1 6.9
Number of Live Births by Birth Weight N 37 2115 1140 2617 5872
Low Birth Weight, <2500 grams N – 75 147 412 634
% – 3.5 12.9 15.7 10.8
Not Low Birth Weight, ≥ 2500 grams N 30 1810 993 2019 4822
% 81.1 85.6 87.1 77.2 82.1
Missing N 0 240 13 197 450
% 0 11.3 1.1 7.5 7.7
Notes: Rows labeled with an “N” indicate the number of observations from which percentages have been calculated. Yellow cells labeled with a dash symbol indicate that between 0 and 11 responses had been received during the reporting period. Statistics were only calculated for items with at least 11 responses.
Table 7. Breastfeeding and Family Planning, through Quarter 1 2015
Data Element N or
% PROVIDENCE (All
Approaches) Birth
Center Group
Prenatal Care Maternity Care Home
Total
Breastfeeding After Delivery from Postpartum Data
N 247 1533 1416 4000 6949
Yes % 85 86.4 64.7 61.5 67.7
No % 11.3 7.4 9.5 25.6 18.3
Prefer not to answer % 0 0.7 1.8 0.5 0.8
Missing % 3.6 5.6 24.0 12.3 13.2
Women Who Breastfed As a Percentage of Women Who Planned to Breastfeed
% 101.1 100.2 97.4 100.7 99.9
Had Birth Control Counseling After Delivery N 247 1533 1416 4000 6949
Yes % 81.4 71.6 60.8 69.7 68.3
No % 13.8 19.4 12.3 15.2 15.5
Unsure % 0.4 2.8 2.4 1.8 2.1
Missing % 4.5 6.2 24.5 13.3 14
Note: Rows labeled with an “N” indicate the number of observations from which percentages have been calculated.
TECHNICAL ASSISTANCE
In April 2015, the evaluation team spoke with the Department of Health Care Finance to discuss their
willingness to and process for releasing Medicaid data to the Urban Institute for the impact analysis of
the Strong Start evaluation. State officials were receptive to the project and are developing a
Memorandum of Understanding (MOU) between the Urban Institute and the Department of Health
Care Finance. We also spoke with the Department of Health regarding the possibility of accessing birth
certificate data, and submitted a data request application in July 2015. The state plans to link Medicaid

112
and birth certificate data in support of the Strong Start evaluation. We hope to begin receiving data in
early 2016, as developing and approving the MOU reportedly can take up to six months.

113
Signature Medical Group
CASE STUDY
Signature Medical Group (Signature) is a large, physician-owned multi-specialty group that serves the St.
Louis and Kansas City areas as well as parts of southwestern Missouri. Much of Signature’s patient
population is urban and suburban; however, there are practices in rural parts of the region. Signature is
implementing the Strong Start maternity care home approach at nine OB/GYN practices. As of Quarter 1
of 2015, 843 patients had been enrolled in Signature’s Strong Start program. Overall, key informants
reported that Strong Start implementation has been going well so far, and they have been able to
overcome some of the challenges they faced during the first program year.
Highlights from the second round of case study data collection include:
The original Strong Start program coordinator is no longer with the program; a prenatal care
coordinator is assuming her role.
Signature has added one site, for a total of nine sites.
Prenatal care coordinators are now well-integrated within participating OB/GYN offices, which
has resulted in increased communication amongst the prenatal care team.
Signature’s enhanced services have not changed. Services include home visits, patient
education, medical advice in between prenatal visits, brief interpersonal therapy and
counseling, care coordination, and case management services.
The awardee has increased outreach and partnership with community groups to help identify
potential participants and to build a “brand” for the program.
There have been no changes to program eligibility criteria or enrollment methods; Signature
sites continue to use an opt-out enrollment approach.
One of the biggest changes since the program’s first year is quicker enrollment in Medicaid. The
state’s processing time for Medicaid applications is now 30 days at most, compared to up to
seven months (reported during the first evaluation site visit). In addition to improvements in the
state’s processing time, the number of Signature care coordinators who enroll patients in
Medicaid has increased from one to four. Quicker Medicaid enrollment has improved
Signature’s Strong Start enrollment because many participating providers would not care for
patients whose Medicaid was pending.
Through enhanced communication strategies, Strong Start staff are able to retain most patients
in the program. The most common reasons patients leave the program are because they have
moved or because of pregnancy loss.

114
Some implementation challenges remain. These include coordinating program and evaluation
data collection and documentation across sites’ different electronic medical record systems and
trying to retrieve data from hospitals (e.g. length of NICU stay).
Key informants attributed improved patient outcomes over the past year, especially reduced
preterm births and improved mental health and education, to participation in Strong Start.
Key informants agreed that they would like to sustain Strong Start services after the funding
period ends, based on the success they have had with the program thus far.
PARTICIPANT-LEVEL PROCESS EVALUATION
The information presented below is based on data submitted from the four evaluation forms through
Quarter 1 2015. By March 2015, Signature Medical Group had Intake Forms for 86 percent of
participants enrolled through Quarter 1 2015 (722 Intake Forms for 843 participants). In addition,
Signature Medical Group submitted 217 Third Trimester Surveys, 183 Postpartum Surveys, and 249 Exit
Forms. The tables below present data collected on Signature Medical Group’s participants with
aggregated rates by approach for the purpose of comparison.
Table 1. Enrollment and Forms Submitted, through Quarter 1 2015
Data Element N or
%
SIGNATURE (Maternity Care
Home)
Birth Center
Group Prenatal Care
Maternity Care Home
Total
Newly Enrolled in Q1 2015 N 191 739 948 2638 4325
Total Ever Enrolled through Q1 2015 N 843 4739 5576 13232 23547
Number of Women Delivered through Q1 2015 N 382 2275 2755 6189 11219
Intake Forms Received through Q1 2015 N 722 2993 4401 11761 19155
Received through Q1 2015 as a percentage of the number of women ever enrolled
% 85.6 63.2 78.9 88.9 81.3
Third Trimester Surveys Received through Q1 2015
N 217 1876 2145 4683 8704
Received through Q1 2015 as a percentage of the number of women delivered
% 56.8 82.5 77.9 75.7 77.6
Postpartum Surveys Received through Q1 2015 N 183 1533 1416 4000 6949
Received through Q1 2015 as a percentage of the number of women delivered
% 47.9 67.4 51.4 64.6 61.9
Exit Forms Received through Q1 2015 N 249 2133 1433 3103 6669
Received through Q1 2015 as a percentage of the number of women delivered
% 65.2 93.8 52.0 50.1 59.4
Note: Rows labeled with an “N” indicate the number of observations from which percentages have been calculated.
Table 2. Sociodemographic Risk Factors, through Quarter 1 2015
Data Element N or
%
SIGNATURE (Maternity Care
Home)
Birth Center
Group Prenatal Care
Maternity Care Home
Total
Mother’s Age at Intake N 722 2993 4401 11761 19155
Less than 18 years of age % 4.6 3.4 6.7 5.8 5.6
18 through 34 years of age % 89.1 86.1 75 81.4 80.7

115
Data Element N or
%
SIGNATURE (Maternity Care
Home)
Birth Center
Group Prenatal Care
Maternity Care Home
Total
35 years and older % 5.7 6.2 4.9 6.0 5.8
Missing % 0.7 4.3 13.4 6.8 7.9
Race and Ethnicity N 722 2993 4401 11761 19155
Hispanic % 3.2 25.7 39.2 22.9 27.1
Non-Hispanic white % 75.2 53.3 13.7 26.2 27.6
Non-Hispanic black % 15.8 14.8 39.2 46.3 39.8
Non-Hispanic Asian % 1.2 1.1 1.2 1.2 1.2
Non-Hispanic other % 0.7 0.6 1.6 0.7 0.9
Non-Hispanic multiple race % 2.2 3.6 2.3 1.2 1.8
Missing % 1.7 0.9 2.8 1.5 1.7
Employed at Intake N 722 2993 4401 11761 19155
Yes % 45.2 39.7 34.6 38.8 38.0
No % 53.6 59.1 60.9 60.0 60.0
Missing % 1.2 1.2 4.5 1.2 2.0
Education Level at Intake N 722 2993 4401 11761 19155
Less than high school % 13.0 14.3 23.7 24.5 22.7
High school graduate or GED % 65.9 52.3 46.2 52.0 50.7
Bachelor’s degree % 5.5 10.1 3.1 2.5 3.9
Other college degree(s) % 8.6 12.7 7.2 6.0 7.3
Missing % 6.9 10.7 19.8 15.0 15.4
Relationship Status at Intake N 722 2993 4401 11761 19155
Married, living with spouse % 27.3 40.7 18.6 17.2 21.2
Married, not living with spouse % 0.8 1.7 2.1 1.9 1.9
Living with a partner % 35.6 32.2 31.3 30.6 31.0
In a relationship but not living together % 20.8 12.9 24.6 30.5 26.4
Not in a relationship right now % 14.8 11.1 17.0 17.8 16.6
Missing % 0.7 1.3 6.4 2.0 2.9
Smokes Cigarettes at Intake N 722 2993 4401 11761 19155
Yes % 15.7 10.1 7.8 14.1 12.0
No % 80.2 77.1 71.7 77.8 76.3
Missing % 4.2 12.9 20.4 8.1 11.7
Food Insecure at Intake N 722 2993 4401 11761 19155
Yes % 9.1 18.1 18.5 16.1 16.9
No % 84.1 76.9 61.4 76.2 72.9
Missing* % 6.8 5.0 20.0 7.7 10.1
Exhibiting Depressive Symptoms at Intake** N 722 2993 4401 11761 19155
Yes % 20.9 21.8 25.2 23.4 23.5
No % 74.5 69.3 57.0 69.3 66.4
Missing* % 4.6 9.0 17.9 7.3 10.0
Have Experienced Intimate Partner Violence in a Relationship***
N 722 2993 4401 11761 19155
Yes % 24.2 20.6 17.1 19.0 18.8
No % 71.1 77.2 68.4 78.5 76.0
Missing* % 4.7 2.1 14.5 2.4 5.1

116
Notes: Cells that contain one asterisk indicate that the ‘Missing’ category includes respondents who did not answer all of the items required to calculate this measure. Cells that contain two asterisks indicate that this is as measured by a shortened version of the CES-D. Cells that contain three asterisks indicate that this is as measured by the Slapped, Threatened, and Throw (STaT) screener. Rows labeled with an “N” indicate the number of observations from which percentages have been calculated.
Table 3. Medical Risk Factors Prior to Current Pregnancy, through Quarter 1 2015
Data Element N or
%
SIGNATURE (Maternity Care
Home)
Birth Center
Group Prenatal Care
Maternity Care Home
Total
Inter-Pregnancy Interval with Current Pregnancy Since Last Birth
N 150 1127 700 1914 3741
<18 months % 15.4 24.3 18.0 19.5 20.7
≥18 months % 26.7 39.8 48.3 51.9 47.6
Missing % 58.0 35.9 33.7 28.6 31.8
Previous Preterm Birth(s) Between 20 and 36 weeks, 6 days EGA
N 150 1127 700 1914 3741
Yes % 14.0 10.7 11.4 18.9 15.0
No % 84.0 89.3 63.9 63.2 71.2
Not Known % 0.7 0 18.6 14.9 11.1
Missing % 1.3 0 6.1 3.0 2.7
Previous Birth(s) Less than 2,500 grams N 150 1127 700 1914 3741
Yes % 10.7 1.9 8.6 14.8 9.7
No % 83.3 95.8 60.4 61.7 71.7
Not Known % 4.0 0 24.7 19.2 14.5
Missing % 2.0 2.3 6.3 4.3 4.1
Pre-Pregnancy Diagnosis of Type I Diabetes N 249 2133 1433 3103 6669
Yes % 0 0.5 1.3 1.5 1.1
No % 98.4 99.5 74.2 84.4 87.0
Not Known % 0.8 0 7.7 11.1 6.8
Missing % 0.8 0 16.7 3.1 5.0
Pre-Pregnancy Diagnosis of Type II Diabetes N 249 2133 1433 3103 6669
Yes % 0.4 0 2.6 1.9 1.5
No % 91.6 5.0 72.9 83.3 56.1
Not Known % 0.8 0 7.7 11.1 6.8
Missing % 7.2 94.9 16.7 3.7 35.7
Pre-Pregnancy Diagnosis of Hypertension N 249 2133 1433 3103 6669
Yes % 0.4 0.5 6.0 9.5 5.9
No % 97.6 99.5 66.7 77.4 82.2
Not Known % 0.8 0 7.6 10.2 6.4
Missing % 1.2 0 19.7 2.9 5.6
Note: Rows labeled with an “N” indicate the number of observations from which percentages have been calculated.
Table 4. Medical Risk Factors during the Current Pregnancy, through Quarter 1 2015
Data Element N or
%
SIGNATURE (Maternity Care
Home)
Birth Center
Group Prenatal Care
Maternity Care Home
Total
Gestational Diabetes N 249 2133 1433 3103 6669
Yes % 1.2 2.7 4.2 5.3 4.2
No % 90.4 97.3 65.4 76.0 80.6

117
Data Element N or
%
SIGNATURE (Maternity Care
Home)
Birth Center
Group Prenatal Care
Maternity Care Home
Total
Not Known % 4.0 0 10.3 15.9 9.6
Missing % 4.4 0 20.1 2.8 5.6
Pregnancy-Related Hypertension N 249 2133 1433 3103 6669
Yes % 2.8 1.3 7.8 7.7 5.7
No % 88.8 98.7 62.6 74.8 79.8
Not Known % 4.0 0 9.4 14.6 8.8
Missing % 4.4 0 20.2 2.9 5.7
Note: Rows labeled with an “N” indicate the number of observations from which percentages have been calculated.
Table 5. Birth and Delivery Methods, through Quarter 1 2015
Data Element N or
%
SIGNATURE (Maternity Care
Home)
Birth Center
Group Prenatal Care
Maternity Care Home
Total
Total Number of Exit Forms with Valid Birth Information
N 218 2125 1103 2740 5968
Number of Babies Born N 220 2128 1125 2801 6054
Induction of Labor Excluding Planned C-Sections
N 210 2133 1297 2826 6256
Yes % 29.5 14.4 23.8 17.2 17.6
No % 51.0 85.3 42.8 35.5 54.0
Not known % 3.8 0 10.6 37.8 19.3
Missing % 15.7 0.3 22.7 9.6 9.1
Delivery Method from Exit Data N 249 2133 1433 3103 6669
Vaginal delivery % 57.0 87.3 49.1 52.0 62.7
C-Section % 29.3 12.4 24.3 29.6 23.0
Vaginal and C-Section % 0.4 0 0 0 0
Missing % 13.3 0.2 26.7 18.3 14.3
Women Who Had a Vaginal Birth as a Percentage of Women Who Planned to Deliver Vaginally
% 80.6 90.9 80.2 81.6 85.4
VBAC22
N 42 90 161 418 669
Yes % 7.1 30.0 19.9 13.9 17.5
Repeat C-Section N 42 90 161 418 669
Yes % 92.9 70.0 80.1 86.1 82.5
Scheduled C-Section N 74 265 348 920 1533
Yes % 51.4 0 39.1 29.2 26.4
22 The denominator for VBAC and repeat C-section are calculated by adding the total respondents in both categories since we cannot confidently know who else had a previous C-section.
Note: Rows labeled with an “N” indicate the number of observations from which percentages have been calculated.
Table 6. Infant Outcomes, through Quarter 1 2015
Data Element N or
%
SIGNATURE (Maternity Care
Home)
Birth Center
Group Prenatal Care
Maternity Care Home
Total
Number of Live Births by Estimated Gestational Birth (EGA)
N 219 2115 1140 2617 5872

118
Data Element N or
%
SIGNATURE (Maternity Care
Home)
Birth Center
Group Prenatal Care
Maternity Care Home
Total
Preterm Births, <37 weeks EGA N 18 112 131 461 704
% 8.2 5.3 11.5 17.6 12.0
Non-Preterm Births, ≥37 weeks EGA N 190 1994 823 1945 4762
% 86.8 94.3 72.2 74.3 81.1
Missing N 11 – 186 211 406
% 5.0 – 16.3 8.1 6.9
Number of Live Births by Birth Weight N 219 2115 1140 2617 5872
Low Birth Weight, <2500 grams N 16 75 147 412 634
% 7.3 3.5 12.9 15.7 10.8
Not Low Birth Weight, ≥ 2500 grams N 198 1810 993 2019 4822
% 90.4 85.6 87.1 77.2 82.1
Missing N – 240 13 197 450
% – 11.3 1.1 7.5 7.7
Notes: Rows labeled with an “N” indicate the number of observations from which percentages have been calculated. Yellow cells labeled with a dash symbol indicate that between 0 and 11 responses had been received during the reporting period. Statistics were only calculated for items with at least 11 responses.
Table 7. Breastfeeding and Family Planning, through Quarter 1 2015
Data Element N or
%
SIGNATURE (Maternity Care
Home)
Birth Center
Group Prenatal Care
Maternity Care Home
Total
Breastfeeding After Delivery from Postpartum Data
N 183 1533 1416 4000 6949
Yes % 76.5 86.4 64.7 61.5 67.7
No % 16.4 7.4 9.5 25.6 18.3
Prefer not to answer % 0 0.7 1.8 0.5 0.8
Missing % 7.1 5.6 24.0 12.3 13.2
Women Who Breastfed As a Percentage of Women Who Planned to Breastfeed
% 98.6 100.2 97.4 100.7 99.9
Had Birth Control Counseling After Delivery N 183 1533 1416 4000 6949
Yes % 75.4 71.6 60.8 69.7 68.3
No % 15.8 19.4 12.3 15.2 15.5
Unsure % 1.1 2.8 2.4 1.8 2.1
Missing % 7.7 6.2 24.5 13.3 14.0
Note: Rows labeled with an “N” indicate the number of observations from which percentages have been calculated.
TECHNICAL ASSISTANCE
In May 2015, the evaluation team spoke with officials at the Section of Epidemiology for Public Health
Practices, Missouri Department of Health and Senior Services (which houses Vital Records), about their
willingness to and process for releasing birth certificate data to the Urban Institute for the impact
analysis of the Strong Start evaluation. State officials were receptive to supporting the evaluation, and
will likely link Medicaid and birth certificate data, possibly with some technical assistance from the
Urban Institute. We plan to follow-up with the state officials in the near future to discuss next steps,

119
including submitting materials to the state’s Institutional Review Board (IRB) and contacting Medicaid
officials.

120
St. John Providence Health System
CASE STUDY
St. John Providence Health System (St. John) is one of the largest health systems in the Detroit
Metropolitan area and includes five hospitals and 125 medical facilities. St. John uses Strong Start
funding to offer group prenatal support sessions at two sites in the Detroit Metropolitan area.23 The
“West Side” location is a primary care and obstetric clinic in Southfield, west of Detroit. The “East Side”
location is the 772-bed St. John Providence Hospital and Medical Center on the east edge of Detroit. In
addition, St. John began group prenatal care following the CenteringPregnancy model at one new Strong
Start site—Hurley Medical Center in Flint, MI. The awardee continues to struggle with numerous
administrative challenges in evaluation Y2, contributing to low enrollment and retention. However,
program staff remain committed to group prenatal care and continue to feel positive about potential
program outcomes.
Highlights from the second round of case study data collection include:
With just 19 women participating in Strong Start at the time of data collection (and 69 women
ever enrolled), St. John has not been able to meet its enrollment goals. Constraints on outreach
methods put in place by the awardee’s internal Institutional Review Board continue to interfere
with the awardee’s plan to conduct recruitment during home visits. In Y1, the awardee elected
to begin outreach during home visits, instead of outreach via a letter, which had a low yield.
The awardee made changes to the Strong Start eligibility criteria by eliminating the requirement
for a second preterm risk factor (effectively expanding eligibility). The current eligibility criteria
include Medicaid eligibility and being up to 28 weeks gestation.
Retention barriers include transportation, life events that supersede group attendance, and the
duration of two separate prenatal appointments (i.e. since group prenatal support sessions are a
supplement rather than an alternative to individual prenatal visits, participants continue to
receive both types of services).
A change in leadership at the West Side site led prenatal care group operations to cease
temporarily, but recruitment efforts for a new group have now resumed. The East Side site
continues to operate group prenatal support sessions using an internally developed approach
focused on support and education, coordinating outreach efforts and sharing space with the
breastfeeding support group. Hospital leadership has not provided any additional support for
the program (e.g., dedicated space) since evaluation Y1.
23 At St. John’s, Strong Start participants enroll in group prenatal support sessions, which are a supplement rather than an alternative to individual prenatal visits. Since participants continue to receive traditional prenatal care visits and the group sessions are supportive and not the primary means for providing prenatal care to Strong Start enrollees, this report refers to St. John’s approach as “group prenatal support sessions” rather than group prenatal care.

121
The awardee recently launched a new site within Hurley Medical Center which follows the
CenteringPregnancy approach closely. Participants in Centering and in all other St. John prenatal
care groups are scheduled for a total of ten group prenatal sessions.
The program coordinator (also a social worker and prenatal care group facilitator) is leaving her
position in June. The awardee will likely refill this position with one of the other social workers
on staff at St. John.
Even with limited enrollment numbers, key informants emphasized that both approaches, group
prenatal care and group support sessions, have had positive effects. Specifically, they report
that the approaches have increased patient knowledge about health and nutrition and that
Strong Start participants benefit greatly from the peer support and bonding associated with
group prenatal care and support sessions.
St. John continues to focus on improving enrollment and strengthening the Strong Start
program’s relationship with the health system.
PARTICIPANT-LEVEL PROCESS EVALUATION
The information presented below is based on data submitted from the four evaluation forms through
Quarter 1 2015. By March 2015, St. John Community Health Investment Corporation had Intake Forms
for 73 percent of participants enrolled through Quarter 1 2015 (50 Intake Forms for 69 participants). In
addition, St. John Community Health Investment Corp. submitted 24 Third Trimester Surveys, 54
Postpartum Surveys, and 39 Exit Forms. The tables below present data collected on St. John Community
Health Investment Corporation participants with aggregated rates by approach for the purpose of
comparison.
Table 1. Enrollment and Forms Submitted, through Quarter 1 2015
Data Element N or
% ST. JOHN (Group
Prenatal Care) Birth
Center Group
Prenatal Care Maternity Care Home
Total
Newly Enrolled in Q1 2015 N 12 739 948 2638 4325
Total Ever Enrolled through Q1 2015 N 69 4739 5576 13232 23547
Number of Women Delivered through Q1 2015 N 31 2275 2755 6189 11219
Intake Forms Received through Q1 2015 N 50 2993 4401 11761 19155
Received through Q1 2015 as a percentage of the number of women ever enrolled
% 72.5 63.2 78.9 88.9 81.3
Third Trimester Surveys Received through Q1 2015
N 24 1876 2145 4683 8704
Received through Q1 2015 as a percentage of the number of women delivered
% 77.4 82.5 77.9 75.7 77.6
Postpartum Surveys Received through Q1 2015 N 54 1533 1416 4000 6949
Received through Q1 2015 as a percentage of the number of women delivered
% 174.2 67.4 51.4 64.6 61.9
Exit Forms Received through Q1 2015 N 39 2133 1433 3103 6669
Received through Q1 2015 as a percentage of the number of women delivered
% 125.8 93.8 52.0 50.1 59.4
Note: Rows labeled with an “N” indicate the number of observations from which percentages have been calculated.

122
Table 2. Sociodemographic Risk Factors, through Quarter 1 2015
Data Element N or
% ST. JOHN (Group
Prenatal Care) Birth
Center Group
Prenatal Care Maternity Care Home
Total
Mother’s Age at Intake N 50 2993 4401 11761 19155
Less than 18 years of age % 2.0 3.4 6.7 5.8 5.6
18 through 34 years of age % 90.0 86.1 75.0 81.4 80.7
35 years and older % 8.0 6.2 4.9 6.0 5.8
Missing % 0 4.3 13.4 6.8 7.9
Race and Ethnicity N 50 2993 4401 11761 19155
Hispanic % 2.0 25.7 39.2 22.9 27.1
Non-Hispanic white % 8.0 53.3 13.7 26.2 27.6
Non-Hispanic black % 88.0 14.8 39.2 46.3 39.8
Non-Hispanic Asian % 0 1.1 1.2 1.2 1.2
Non-Hispanic other % 0 0.6 1.6 0.7 0.9
Non-Hispanic multiple race % 2.0 3.6 2.3 1.2 1.8
Missing % 0 0.9 2.8 1.5 1.7
Employed at Intake N 50 2993 4401 11761 19155
Yes % 32.0 39.7 34.6 38.8 38.0
No % 68.0 59.1 60.9 60.0 60.0
Missing % 0 1.2 4.5 1.2 2.0
Education Level at Intake N 50 2993 4401 11761 19155
Less than high school % 24.0 14.3 23.7 24.5 22.7
High school graduate or GED % 62.0 52.3 46.2 52 50.7
Bachelor’s degree % 2.0 10.1 3.1 2.5 3.9
Other college degree(s) % 4.0 12.7 7.2 6.0 7.3
Missing % 8.0 10.7 19.8 15 15.4
Relationship Status at Intake N 50 2993 4401 11761 19155
Married, living with spouse % 2.0 40.7 18.6 17.2 21.2
Married, not living with spouse % 6.0 1.7 2.1 1.9 1.9
Living with a partner % 30.0 32.2 31.3 30.6 31.0
In a relationship but not living together % 26.0 12.9 24.6 30.5 26.4
Not in a relationship right now % 36.0 11.1 17.0 17.8 16.6
Missing % 0 1.3 6.4 2.0 2.9
Smokes Cigarettes at Intake N 50 2993 4401 11761 19155
Yes % 10.0 10.1 7.8 14.1 12.0
No % 90.0 77.1 71.7 77.8 76.3
Missing % 0 12.9 20.4 8.1 11.7
Food Insecure at Intake N 50 2993 4401 11761 19155
Yes % 34.0 18.1 18.5 16.1 16.9
No % 64.0 76.9 61.4 76.2 72.9
Missing*
% 2.0 5.0 20.0 7.7 10.1
Exhibiting Depressive Symptoms at Intake**
N 50 2993 4401 11761 19155
Yes % 50.0 21.8 25.2 23.4 23.5
No % 50.0 69.3 57.0 69.3 66.4
Missing* % 0 9.0 17.9 7.3 10.0
Have Experienced Intimate Partner Violence in a Relationship***
N 50 2993 4401 11761 19155
Yes % 40.0 20.6 17.1 19.0 18.8

123
Data Element N or
% ST. JOHN (Group
Prenatal Care) Birth
Center Group
Prenatal Care Maternity Care Home
Total
No % 60.0 77.2 68.4 78.5 76.0
Missing* % 0 2.1 14.5 2.4 5.1
Notes: Cells that contain one asterisk indicate that the ‘Missing’ category includes respondents who did not answer all of the items required to calculate this measure. Cells that contain two asterisks indicate that this is as measured by a shortened version of the CES-D. Cells that contain three asterisks indicate that this is as measured by the Slapped, Threatened, and Throw (STaT) screener. Rows labeled with an “N” indicate the number of observations from which percentages have been calculated.
Table 3. Medical Risk Factors Prior to Current Pregnancy, through Quarter 1 2015
Data Element N or
% ST. JOHN (Group
Prenatal Care) Birth
Center Group
Prenatal Care Maternity Care Home
Total
Inter-Pregnancy Interval with Current Pregnancy Since Last Birth
N 33 1127 700 1914 3741
<18 months % 15.2 24.3 18.0 19.5 20.7
≥18 months % 48.5 39.8 48.3 51.9 47.6
Missing % 36.4 35.9 33.7 28.6 31.8
Previous Preterm Birth(s) Between 20 and 36 weeks, 6 days EGA
N 33 1127 700 1914 3741
Yes % 3.0 10.7 11.4 18.9 15.0
No % 60.6 89.3 63.9 63.2 71.2
Not Known % 36.4 0 18.6 14.9 11.1
Missing % 0 0 6.1 3.0 2.7
Previous Birth(s) Less than 2,500 grams N 33 1127 700 1914 3741
Yes % 3.0 1.9 8.6 14.8 9.7
No % 3.0 95.8 60.4 61.7 71.7
Not Known % 93.9 0 24.7 19.2 14.5
Missing % 0 2.3 6.3 4.3 4.1
Pre-Pregnancy Diagnosis of Type I Diabetes N 39 2133 1433 3103 6669
Yes % 5.1 0.5 1.3 1.5 1.1
No % 51.3 99.5 74.2 84.4 87.0
Not Known % 43.6 0 7.7 11.1 6.8
Missing % 0 0 16.7 3.1 5.0
Pre-Pregnancy Diagnosis of Type II Diabetes N 39 2133 1433 3103 6669
Yes % 0 0 2.6 1.9 1.5
No % 56.4 5.0 72.9 83.3 56.1
Not Known % 43.6 0 7.7 11.1 6.8
Missing % 0 94.9 16.7 3.7 35.7
Pre-Pregnancy Diagnosis of Hypertension N 39 2133 1433 3103 6669
Yes % 12.8 0.5 6.0 9.5 5.9
No % 46.2 99.5 66.7 77.4 82.2
Not Known % 41 0 7.6 10.2 6.4
Missing % 0 0 19.7 2.9 5.6
Note: Rows labeled with an “N” indicate the number of observations from which percentages have been calculated.
Table 4. Medical Risk Factors during the Current Pregnancy, through Quarter 1 2015
Data Element N or
% ST. JOHN (Group
Prenatal Care) Birth
Center Group
Prenatal Care Maternity Care Home
Total
Gestational Diabetes N 39 2133 1433 3103 6669

124
Data Element N or
% ST. JOHN (Group
Prenatal Care) Birth
Center Group
Prenatal Care Maternity Care Home
Total
Yes % 2.6 2.7 4.2 5.3 4.2
No % 10.3 97.3 65.4 76.0 80.6
Not Known % 87.2 0 10.3 15.9 9.6
Missing % 0 0 20.1 2.8 5.6
Pregnancy-Related Hypertension N 39 2133 1433 3103 6669
Yes % 17.9 1.3 7.8 7.7 5.7
No % 41.0 98.7 62.6 74.8 79.8
Not Known % 41.0 0 9.4 14.6 8.8
Missing % 0 0 20.2 2.9 5.7
Note: Rows labeled with an “N” indicate the number of observations from which percentages have been calculated.
Table 5. Birth and Delivery Methods, through Quarter 1 2015
Data Element N or
% ST. JOHN (Group
Prenatal Care) Birth
Center Group
Prenatal Care Maternity Care Home
Total
Total Number of Exit Forms with Valid Birth Information
N 0 2125 1103 2740 5968
Number of Babies Born N 0 2128 1125 2801 6054
Induction of Labor Excluding Planned C-Sections
N 35 2133 1297 2826 6256
Yes % 25.7 14.4 23.8 17.2 17.6
No % 25.7 85.3 42.8 35.5 54.0
Not known % 48.6 0 10.6 37.8 19.3
Missing % 0 0.3 22.7 9.6 9.1
Delivery Method from Exit Data N 39 2133 1433 3103 6669
Vaginal delivery % 38.5 87.3 49.1 52.0 62.7
C-Section % 20.5 12.4 24.3 29.6 23.0
Vaginal and C-Section % 0 0 0 0 0
Missing % 41.0 0.2 26.7 18.3 14.3
Women Who Had a Vaginal Birth as a Percentage of Women Who Planned to Deliver Vaginally
% 57.1 90.9 80.2 81.6 85.4
VBAC24
N – 90 161 418 669
Yes % – 30.0 19.9 13.9 17.5
Repeat C-Section N – 90 161 418 669
Yes % – 70.0 80.1 86.1 82.5
Scheduled C-Section N – 265 348 920 1533
Yes % – 0 39.1 29.2 26.4
24 The denominator for VBAC and repeat C-section are calculated by adding the total respondents in both categories since we cannot confidently know who else had a previous C-section.
Notes: Rows labeled with an “N” indicate the number of observations from which percentages have been calculated. Yellow cells labeled with a dash symbol indicate that between 0 and 11 responses had been received during the reporting period. Statistics were only calculated for items with at least 11 responses.

125
Table 6. Infant Outcomes, through Quarter 1 2015
Data Element N or
% ST. JOHN (Group
Prenatal Care) Birth
Center Group
Prenatal Care Maternity Care Home
Total
Number of Live Births by Estimated Gestational Birth (EGA)
N 27 2115 1140 2617 5872
Preterm Births, <37 weeks EGA N – 112 131 461 704
% – 5.3 11.5 17.6 12.0
Non-Preterm Births, ≥37 weeks EGA N 23 1994 823 1945 4762
% 85.2 94.3 72.2 74.3 81.1
Missing N 0 – 186 211 406
% 0 – 16.3 8.1 6.9
Number of Live Births by Birth Weight N 27 2115 1140 2617 5872
Low Birth Weight, <2500 grams N – 75 147 412 634
% – 3.5 12.9 15.7 10.8
Not Low Birth Weight, ≥ 2500 grams N 19 1810 993 2019 4822
% 70.4 85.6 87.1 77.2 82.1
Missing N – 240 13 197 450
% – 11.3 1.1 7.5 7.7
Notes: Rows labeled with an “N” indicate the number of observations from which percentages have been calculated. Yellow cells labeled with a dash symbol indicate that between 0 and 11 responses had been received during the reporting period. Statistics were only calculated for items with at least 11 responses.
Table 7. Breastfeeding and Family Planning, through Quarter 1 2015
Data Element N or
% ST. JOHN (Group
Prenatal Care) Birth
Center Group
Prenatal Care Maternity Care Home
Total
Breastfeeding After Delivery from Postpartum Data
N 54 1533 1416 4000 6949
Yes % 9.3 86.4 64.7 61.5 67.7
No % 5.6 7.4 9.5 25.6 18.3
Prefer not to answer % 0 0.7 1.8 0.5 0.8
Missing % 85.2 5.6 24.0 12.3 13.2
Women Who Breastfed As a Percentage of Women Who Planned to Breastfeed
% 83.3 100.2 97.4 100.7 99.9
Had Birth Control Counseling After Delivery N 54 1533 1416 4000 6949
Yes % 11.1 71.6 60.8 69.7 68.3
No % 3.7 19.4 12.3 15.2 15.5
Unsure % 0 2.8 2.4 1.8 2.1
Missing % 85.2 6.2 24.5 13.3 14.0
Note: Rows labeled with an “N” indicate the number of observations from which percentages have been calculated.
TECHNICAL ASSISTANCE
In January 2015, the evaluation team spoke with officials from the Michigan Department of Health and
Human Services (MDHHS) to learn about the state’s willingness to and process for releasing state
Medicaid and birth certificate data to the Urban Institute for the impact analysis of the Strong Start
evaluation. In Michigan, both Medicaid and birth certificate data are housed under MDHHS, and thus we
are working with one person within the agency who is coordinating our data request. Michigan is
receptive to supporting the evaluation, and MDHHS staff plan to link the Medicaid and birth certificate

126
data. An application requesting Medicaid and birth certificate data was submitted to MDHHS in June
2015. The evaluation team is currently awaiting approval from MDHHS but hopes to begin receiving data
in late 2015.

127
Texas Tech University Health Sciences
Center
CASE STUDY
Texas Tech University Health Sciences Center (Texas Tech) is composed of health professions graduate
schools and health care facilities affiliated with Texas Tech University in Lubbock, Texas. Initially, Texas
Tech implemented the Maternity Care Home (MCH) approach using two community health workers
(CHWs) in its large Pavilion OB clinic and a smaller neighborhood clinic, Grand Expectations. During the
past year the awardee also implemented group prenatal care at its Larry Combest Community Health &
Wellness Center (Combest Center), which just began offering prenatal services. At the time of evaluation
Y2 data collection, there were about 145 active Strong Start participants, the vast majority in the MCH
approach. Since implementation, there have been 362 total participants.
Highlights from the second round of case study data collection include:
One of the program’s two CHWs left and was later replaced; enrollment slowed during the
transition.
To help relieve significant administrative burdens on the CHWs (which had infringed on their
time spent with participants), a new data collector was recently hired to complete and enter
Strong Start evaluation Exit forms.
The awardee has employed multiple strategies to address low enrollment. Both CHWs now
attend the OB clinic every Friday (which is devoted to new OB visits), and they screen every new
patient for Strong Start eligibility.
Referrals from clinic nurses have grown as relationships between Strong Start staff and clinic
staff improved through frequent interaction, deliberate re-engagement with the Grand
Expectations nurse practitioner, and gift cards for clinic nurses who refer the most women to
Strong Start.
Texas Tech modified its Strong Start eligibility criteria, including by eliminating the requirement
for an additional preterm risk factor (Medicaid/CHIP eligibility alone is sufficient) and shifting
the gestational age cutoff from 20 weeks to 28 weeks. In rare cases, the maternity care home
sites may enroll a patient with gestational age up to 36 weeks; such patients receive very
frequent visits for the remainder of their pregnancy (once or twice weekly).
The awardee is reaching out to other providers in Lubbock to increase referral sources, but is
finding that having different electronic medical record systems is a barrier to referrals.
The CHWs continue to provide health education and social service referrals. They have
increased phone contact and texting with participants to improve retention, resulting in an

128
increase in total encounters (clinic visits, phone, home visits), from three to between six and ten
on average.
Texas Tech has expanded use of the Strong Start database developed specifically for the
program; staff now use the database to track and review enrollment and service delivery
progress on a weekly basis, promoting accountability.
Group prenatal care enrollment has been slow and groups are small in size; the first group
cohort included eight women, the second group involved seven, and a group being formed at
the time of data collection had just three participants (with more expected).
The awardee is working to increase enrollment (through the above strategies), and reduced the
initial enrollment target, described now as “unrealistic.”
Key informants perceive that Strong Start enhanced services have helped Texas Tech patients—
particularly those who are young or who have many risk factors—meet critical needs (e.g., food,
housing, jobs) and learn how to better manage their lives.
PARTICIPANT-LEVEL PROCESS EVALUATION
The information presented below is based on data submitted from the four evaluation forms through
Quarter 1 2015. By March 2015, Texas Tech University Health Sciences had Intake Forms for 80 percent
of participants enrolled through Quarter 1 2015 (302 Intake Forms for 380 participants). In addition,
Texas Tech University Health Sciences submitted 116 Third Trimester Surveys, 73 Postpartum Surveys,
but no Exit Forms. The tables below present data collected on Texas Tech University Health Sciences’
participants with aggregated rates by approach for the purpose of comparison.
Table 1. Enrollment and Forms Submitted, through Quarter 1 2015
Data Element N or
% TTU (Maternity
Care Home) Birth
Center Group
Prenatal Care Maternity Care Home
Total
Newly Enrolled in Q1 2015 N 90 739 948 2638 4325
Total Ever Enrolled through Q1 2015 N 380 4739 5576 13232 23547
Number of Women Delivered through Q1 2015
N 164 2275 2755 6189 11219
Intake Forms Received through Q1 2015 N 302 2993 4401 11761 19155
Received through Q1 2015 as a percentage of the number of women ever enrolled
% 79.5 63.2 78.9 88.9 81.3
Third Trimester Surveys Received through Q1 2015
N 116 1876 2145 4683 8704
Received through Q1 2015 as a percentage of the number of women delivered
% 70.7 82.5 77.9 75.7 77.6
Postpartum Surveys Received through Q1 2015
N 73 1533 1416 4000 6949
Received through Q1 2015 as a percentage of the number of women delivered
% 44.5 67.4 51.4 64.6 61.9
Exit Forms Received through Q1 2015 N + 2133 1433 3103 6669
Received through Q1 2015 as a percentage of the number of women delivered
% + 93.8 52.0 50.1 59.4

129
Note: Rows labeled with an “N” indicate the number of observations from which percentages have been calculated. Gray cells labeled with a plus symbol indicate that fewer than 25 forms had been received during the reporting period. Statistics were calculated only if there were at least 25 forms received.
Table 2. Sociodemographic Risk Factors, through Quarter 1 2015
Data Element N or
% TTU (Maternity
Care Home) Birth
Center Group
Prenatal Care Maternity Care Home
Total
Mother’s Age at Intake N 302 2993 4401 11761 19155
Less than 18 years of age % 1.3 3.4 6.7 5.8 5.6
18 through 34 years of age % 40.1 86.1 75.0 81.4 80.7
35 years and older % 2.6 6.2 4.9 6.0 5.8
Missing % 56.0 4.3 13.4 6.8 7.9
Race and Ethnicity N 302 2993 4401 11761 19155
Hispanic % 54.6 25.7 39.2 22.9 27.1
Non-Hispanic white % 24.5 53.3 13.7 26.2 27.6
Non-Hispanic black % 13.2 14.8 39.2 46.3 39.8
Non-Hispanic Asian % 0 1.1 1.2 1.2 1.2
Non-Hispanic other % 0.3 0.6 1.6 0.7 0.9
Non-Hispanic multiple race % 0.7 3.6 2.3 1.2 1.8
Missing % 6.6 0.9 2.8 1.5 1.7
Employed at Intake N 302 2993 4401 11761 19155
Yes % 38.1 39.7 34.6 38.8 38.0
No % 54.6 59.1 60.9 60.0 60.0
Missing % 7.3 1.2 4.5 1.2 2.0
Education Level at Intake N 302 2993 4401 11761 19155
Less than high school % 22.5 14.3 23.7 24.5 22.7
High school graduate or GED % 41.4 52.3 46.2 52.0 50.7
Bachelor’s degree % 1.0 10.1 3.1 2.5 3.9
Other college degree(s) % 6.6 12.7 7.2 6.0 7.3
Missing % 28.5 10.7 19.8 15.0 15.4
Relationship Status at Intake N 302 2993 4401 11761 19155
Married, living with spouse % 14.6 40.7 18.6 17.2 21.2
Married, not living with spouse % 1.3 1.7 2.1 1.9 1.9
Living with a partner % 37.7 32.2 31.3 30.6 31.0
In a relationship but not living together % 20.5 12.9 24.6 30.5 26.4
Not in a relationship right now % 21.5 11.1 17.0 17.8 16.6
Missing % 4.3 1.3 6.4 2.0 2.9
Smokes Cigarettes at Intake N 302 2993 4401 11761 19155
Yes % 13.2 10.1 7.8 14.1 12.0
No % 70.9 77.1 71.7 77.8 76.3
Missing % 15.9 12.9 20.4 8.1 11.7
Food Insecure at Intake N 302 2993 4401 11761 19155
Yes % 17.9 18.1 18.5 16.1 16.9
No % 56.6 76.9 61.4 76.2 72.9
Missing*
% 25.5 5.0 20.0 7.7 10.1
Exhibiting Depressive Symptoms at Intake**
N 302 2993 4401 11761 19155
Yes % 23.2 21.8 25.2 23.4 23.5
No % 50.3 69.3 57.0 69.3 66.4
Missing* % 26.5 9.0 17.9 7.3 10.0

130
Data Element N or
% TTU (Maternity
Care Home) Birth
Center Group
Prenatal Care Maternity Care Home
Total
Have Experienced Intimate Partner Violence in a Relationship***
N 302 2993 4401 11761 19155
Yes % 19.2 20.6 17.1 19.0 18.8
No % 64.9 77.2 68.4 78.5 76.0
Missing* % 15.9 2.1 14.5 2.4 5.1
Notes: Cells that contain one asterisk indicate that the ‘Missing’ category includes respondents who did not answer all of the items required to calculate this measure. Cells that contain two asterisks indicate that this is as measured by a shortened version of the CES-D. Cells that contain three asterisks indicate that this is as measured by the Slapped, Threatened, and Throw (STaT) screener. Rows labeled with an “N” indicate the number of observations from which percentages have been calculated.
Table 3. Medical Risk Factors Prior to Current Pregnancy, through Quarter 1 2015
Data Element N or
% TTU (Maternity
Care Home) Birth
Center Group
Prenatal Care Maternity Care Home
Total
Inter-Pregnancy Interval with Current Pregnancy Since Last Birth
N + 1127 700 1914 3741
<18 months % + 24.3 18.0 19.5 20.7
≥18 months % + 39.8 48.3 51.9 47.6
Missing % + 35.9 33.7 28.6 31.8
Previous Preterm Birth(s) Between 20 and 36 weeks, 6 days EGA
N + 1127 700 1914 3741
Yes % + 10.7 11.4 18.9 15.0
No % + 89.3 63.9 63.2 71.2
Not Known % + 0 18.6 14.9 11.1
Missing % + 0 6.1 3.0 2.7
Previous Birth(s) Less than 2,500 grams N + 1127 700 1914 3741
Yes % + 1.9 8.6 14.8 9.7
No % + 95.8 60.4 61.7 71.7
Not Known % + 0 24.7 19.2 14.5
Missing % + 2.3 6.3 4.3 4.1
Pre-Pregnancy Diagnosis of Type I Diabetes N + 2133 1433 3103 6669
Yes % + 0.5 1.3 1.5 1.1
No % + 99.5 74.2 84.4 87.0
Not Known % + 0 7.7 11.1 6.8
Missing % + 0 16.7 3.1 5.0
Pre-Pregnancy Diagnosis of Type II Diabetes N + 2133 1433 3103 6669
Yes % + 0 2.6 1.9 1.5
No % + 5.0 72.9 83.3 56.1
Not Known % + 0 7.7 11.1 6.8
Missing % + 94.9 16.7 3.7 35.7
Pre-Pregnancy Diagnosis of Hypertension N + 2133 1433 3103 6669
Yes % + 0.5 6.0 9.5 5.9
No % + 99.5 66.7 77.4 82.2
Not Known % + 0 7.6 10.2 6.4
Missing % + 0 19.7 2.9 5.6
Notes: Rows labeled with an “N” indicate the number of observations from which percentages have been calculated. Gray cells labeled with a plus symbol indicate that fewer than 25 forms had been received during the reporting period. Statistics were calculated only if there were at least 25 forms received.

131
Table 4. Medical Risk Factors during the Current Pregnancy, through Quarter 1 2015
Data Element N or
% TTU (Maternity
Care Home) Birth
Center Group
Prenatal Care Maternity Care Home
Total
Gestational Diabetes N + 2133 1433 3103 6669
Yes % + 2.7 4.2 5.3 4.2
No % + 97.3 65.4 76.0 80.6
Not Known % + 0 10.3 15.9 9.6
Missing % + 0 20.1 2.8 5.6
Pregnancy-Related Hypertension N + 2133 1433 3103 6669
Yes % + 1.3 7.8 7.7 5.7
No % + 98.7 62.6 74.8 79.8
Not Known % + 0 9.4 14.6 8.8
Missing % + 0 20.2 2.9 5.7
Notes: Rows labeled with an “N” indicate the number of observations from which percentages have been calculated. Gray cells labeled with a plus symbol indicate that fewer than 25 forms had been received during the reporting period. Statistics were calculated only if there were at least 25 forms received.
Table 5. Birth and Delivery Methods, through Quarter 1 2015
Data Element N or
% TTU (Maternity
Care Home) Birth
Center Group
Prenatal Care Maternity Care Home
Total
Total Number of Exit Forms with Valid Birth Information
N + 2125 1103 2740 5968
Number of Babies Born N + 2128 1125 2801 6054
Induction of Labor Excluding Planned C-Sections
N + 2133 1297 2826 6256
Yes % + 14.4 23.8 17.2 17.6
No % + 85.3 42.8 35.5 54.0
Not known % + 0 10.6 37.8 19.3
Missing % + 0.3 22.7 9.6 9.1
Delivery Method from Exit Data N + 2133 1433 3103 6669
Vaginal delivery % + 87.3 49.1 52.0 62.7
C-Section % + 12.4 24.3 29.6 23.0
Vaginal and C-Section % + 0 0 0 0
Missing % + 0.2 26.7 18.3 14.3
Women Who Had a Vaginal Birth as a Percentage of Women Who Planned to Deliver Vaginally
% + 90.9 80.2 81.6 85.4
VBAC25
N + 90 161 418 669
Yes % + 30.0 19.9 13.9 17.5
Repeat C-Section N + 90 161 418 669
Yes % + 70.0 80.1 86.1 82.5
Scheduled C-Section N + 265 348 920 1533
Yes % + 0 39.1 29.2 26.4
25 The denominator for VBAC and repeat C-section are calculated by adding the total respondents in both categories since we cannot confidently know who else had a previous C-section.
Notes: Rows labeled with an “N” indicate the number of observations from which percentages have been calculated. Gray cells labeled with a plus symbol indicate that fewer than 25 forms had been received during the reporting period. Statistics were calculated only if there were at least 25 forms received.

132
Table 6. Infant Outcomes, through Quarter 1 2015
Data Element N or
% TTU (Maternity
Care Home) Birth
Center Group
Prenatal Care Maternity Care Home
Total
Number of Live Births by Estimated Gestational Birth (EGA)
N + 2115 1140 2617 5872
Preterm Births, <37 weeks EGA N + 112 131 461 704
% + 5.3 11.5 17.6 12.0
Non-Preterm Births, ≥37 weeks EGA N + 1994 823 1945 4762
% + 94.3 72.2 74.3 81.1
Missing N + – 186 211 406
% + – 16.3 8.1 6.9
Number of Live Births by Birth Weight N + 2115 1140 2617 5872
Low Birth Weight, <2500 grams N + 75 147 412 634
% + 3.5 12.9 15.7 10.8
Not Low Birth Weight, ≥ 2500 grams N + 1810 993 2019 4822
% + 85.6 87.1 77.2 82.1
Missing N + 240 13 197 450
% + 11.3 1.1 7.5 7.7
Notes: Rows labeled with an “N” indicate the number of observations from which percentages have been calculated. Gray cells labeled with a plus symbol indicate that fewer than 25 forms had been received during the reporting period. Statistics were calculated only if there were at least 25 forms received. Yellow cells labeled with a dash symbol indicate that between 0 and 11 responses had been received during the reporting period. Statistics were only calculated for items with at least 11 responses.
Table 7. Breastfeeding and Family Planning, through Quarter 1 2015
Data Element N or
% TTU (Maternity
Care Home) Birth
Center Group
Prenatal Care Maternity Care Home
Total
Breastfeeding After Delivery from Postpartum Data
N 73 1533 1416 4000 6949
Yes % 58.9 86.4 64.7 61.5 67.7
No % 38.4 7.4 9.5 25.6 18.3
Prefer not to answer % 1.4 0.7 1.8 0.5 0.8
Missing % 1.4 5.6 24.0 12.3 13.2
Women Who Breastfed As a Percentage of Women Who Planned to Breastfeed
% 90.8 100.2 97.4 100.7 99.9
Had Birth Control Counseling After Delivery N 73 1533 1416 4000 6949
Yes % 78.1 71.6 60.8 69.7 68.3
No % 19.2 19.4 12.3 15.2 15.5
Unsure % 0 2.8 2.4 1.8 2.1
Missing % 2.7 6.2 24.5 13.3 14
Note: Rows labeled with an “N” indicate the number of observations from which percentages have been calculated.
TECHNICAL ASSISTANCE
The Texas Health and Human Services Commission (HHSC) was receptive to supporting the Strong Start
Evaluation when introduced to the project in March of 2015. HHSC has had previous experience in
creating linked data files that employ birth certificate and Medicaid data but identified the linking of
birth certificate data for infants with their respective mothers as a challenge. In April of 2015,
administrators at HHSC introduced the Strong Start Evaluation to the Texas Department of State Health

133
Services (DSHS), who agreed to assist with the linking of Strong Start participant and comparison group
demographic information with infant birth certificate data and then merge these data with Medicaid
eligibility and claims data to be furnished by HHSC. After some deliberation between HHSC and DSHS we
received notice that we would need to submit applications to the Department of State Health Services’
Institutional Review Board and Committee on Requests for Personal Data. The submitted applications
must also be approved by HHSC. The evaluation team has decided to seek comparable data from the
Texas Children’s Health Insurance Program and is pursuing the request for this additional data

134
United Neighborhood Health Services
CASE STUDY
United Neighborhood Health Services (United) is a Federally Qualified Health Center (FQHC) operating
11 clinics in Davidson County, Tennessee and the surrounding area. Eight of the United clinics provide
prenatal care. At the time of evaluation Y2 data collection, United was implementing the Strong Start
maternity care home approach at seven of its clinics in Davidson County, primarily in Nashville. A total of
588 women were ever enrolled in Strong Start at United as of March 2015.
Highlights from the second round of case study data collection include:
Key informants consider their Strong Start program a success, citing growing enrollment;
improvements in implementation; positive changes in birth outcomes; and satisfaction among
enrollees, staff and providers.
Strong Start enrollees continue to receive a minimum of three prenatal encounters with a health
coach (coordinated with patients’ prenatal care visits) and a postpartum encounter conducted
either in the clinic or at the patient’s home.
United made changes to its Strong Start leadership team in late 2014, transitioning the role of
project director to two staff members who divide responsibilities for clinical and administrative
coordination.
One site left Strong Start in Y2 because of low enrollment, reducing the number of sites to
seven.
United used Strong Start supplemental funding to add several staff to the program team,
including a third health coach who is bilingual, two data specialists, and an interpreter who
works with the health coaches.
United also changed its approach of care in January 2015 so that prenatal patients receive
continuous prenatal care in the clinic up until delivery (instead of being transferred at 28 to 32
weeks) and give birth attended by hospitalist residents at a single partner hospital. Key
informants reported that the change has enabled longer-lasting relationships with the health
coaches and has led to a nearly 25 percent increase in rates of postpartum visit attendance and
newborns receiving postpartum care. A shared electronic health record (EHR) implemented in
January 2015 facilitates smooth patient transfers between United and the delivering hospital.
The awardee continues to focus on maintaining robust enrollment. United currently enrolls
approximately 58 women per month, double the average monthly enrollment at the time of the
Y1 evaluation site visit in August 2014.

135
Health coaches have become more engaged in outreach and enrollment, and now enroll
patients into Strong Start when they first visit the clinic for a pregnancy test as opposed to
waiting for physician referrals or conducting enrollment at the first OB visit.
United made some modifications to Strong Start eligibility criteria. Pregnant women who are
eligible for Medicaid or CHIP can now enroll in Strong Start, and no additional preterm risk
factor is required. In addition, the program’s gestational age cutoff was raised to 28 weeks in
evaluation Y1, but was reportedly reduced to 24 weeks again in Y2.
Key informants credit Strong Start with improvements in a number of maternal and infant
health outcomes including reductions in the rate of miscarriages, preterm births, and low birth
weight. They also noted improvements in psychosocial health as a result of the extra support
Strong Start participants receive from health coaches.
PARTICIPANT-LEVEL PROCESS EVALUATION
The information presented below is based on data submitted from the four evaluation forms through
Quarter 1 2015. By March 2015, United Neighborhood Health Services had Intake Forms for 92 percent
of participants enrolled through Quarter 1 2015 (541 Intake Forms for 588 participants). In addition,
United Neighborhood Health Services submitted 223 Third Trimester Surveys, 157 Postpartum Surveys,
and 288 Exit Forms. The tables below present data collected on United Neighborhood Health Services’
participants with aggregated rates by approach for the purpose of comparison.
Table 1. Enrollment and Forms Submitted, through Quarter 1 2015
Data Element N or
%
UNITED (Maternity Care
Home)
Birth Center
Group Prenatal Care
Maternity Care Home
Total
Newly Enrolled in Q1 2015 N 127 739 948 2638 4325
Total Ever Enrolled through Q1 2015 N 588 4739 5576 13232 23547
Number of Women Delivered through Q1 2015
N 229 2275 2755 6189 11219
Intake Forms Received through Q1 2015 N 541 2993 4401 11761 19155
Received through Q1 2015 as a percentage of the number of women ever enrolled
% 92.0 63.2 78.9 88.9 81.3
Third Trimester Surveys Received through Q1 2015
N 223 1876 2145 4683 8704
Received through Q1 2015 as a percentage of the number of women delivered
% 97.4 82.5 77.9 75.7 77.6
Postpartum Surveys Received through Q1 2015
N 157 1533 1416 4000 6949
Received through Q1 2015 as a percentage of the number of women delivered
% 68.6 67.4 51.4 64.6 61.9
Exit Forms Received through Q1 2015 N 288 2133 1433 3103 6669
Received through Q1 2015 as a percentage of the number of women delivered
% 125.8 93.8 52.0 50.1 59.4
Note: Rows labeled with an “N” indicate the number of observations from which percentages have been calculated.

136
Table 2. Sociodemographic Risk Factors, through Quarter 1 2015
Data Element N or
%
UNITED (Maternity Care
Home)
Birth Center
Group Prenatal Care
Maternity Care Home
Total
Mother’s Age at Intake N 541 2993 4401 11761 19155
Less than 18 years of age % 5.0 3.4 6.7 5.8 5.6
18 through 34 years of age % 86.3 86.1 75 81.4 80.7
35 years and older % 8.3 6.2 4.9 6.0 5.8
Missing % 0.4 4.3 13.4 6.8 7.9
Race and Ethnicity N 541 2993 4401 11761 19155
Hispanic % 49.9 25.7 39.2 22.9 27.1
Non-Hispanic white % 11.8 53.3 13.7 26.2 27.6
Non-Hispanic black % 33.6 14.8 39.2 46.3 39.8
Non-Hispanic Asian % 0.9 1.1 1.2 1.2 1.2
Non-Hispanic other % 1.1 0.6 1.6 0.7 0.9
Non-Hispanic multiple race % 0 3.6 2.3 1.2 1.8
Missing % 2.6 0.9 2.8 1.5 1.7
Employed at Intake N 541 2993 4401 11761 19155
Yes % 36.0 39.7 34.6 38.8 38.0
No % 63.2 59.1 60.9 60.0 60.0
Missing % 0.7 1.2 4.5 1.2 2.0
Education Level at Intake N 541 2993 4401 11761 19155
Less than high school % 28.8 14.3 23.7 24.5 22.7
High school graduate or GED % 39.6 52.3 46.2 52 50.7
Bachelor’s degree % 1.8 10.1 3.1 2.5 3.9
Other college degree(s) % 2.5 12.7 7.2 6.0 7.3
Missing % 27.2 10.7 19.8 15 15.4
Relationship Status at Intake N 541 2993 4401 11761 19155
Married, living with spouse % 28.7 40.7 18.6 17.2 21.2
Married, not living with spouse % 0.7 1.7 2.1 1.9 1.9
Living with a partner % 33.5 32.2 31.3 30.6 31.0
In a relationship but not living together % 22.6 12.9 24.6 30.5 26.4
Not in a relationship right now % 12.9 11.1 17.0 17.8 16.6
Missing % 1.7 1.3 6.4 2.0 2.9
Smokes Cigarettes at Intake N 541 2993 4401 11761 19155
Yes % 11.6 10.1 7.8 14.1 12.0
No % 84.1 77.1 71.7 77.8 76.3
Missing % 4.3 12.9 20.4 8.1 11.7
Food Insecure at Intake N 541 2993 4401 11761 19155
Yes % 14.0 18.1 18.5 16.1 16.9
No % 76.3 76.9 61.4 76.2 72.9
Missing*
% 9.6 5.0 20.0 7.7 10.1
Exhibiting Depressive Symptoms at Intake**
N 541 2993 4401 11761 19155
Yes % 17.2 21.8 25.2 23.4 23.5
No % 74.3 69.3 57.0 69.3 66.4
Missing* % 8.5 9.0 17.9 7.3 10.0
Have Experienced Intimate Partner Violence in a Relationship***
N 541 2993 4401 11761 19155

137
Data Element N or
%
UNITED (Maternity Care
Home)
Birth Center
Group Prenatal Care
Maternity Care Home
Total
Yes % 16.3 20.6 17.1 19.0 18.8
No % 78.0 77.2 68.4 78.5 76.0
Missing* % 5.7 2.1 14.5 2.4 5.1
Notes: Cells that contain one asterisk indicate that the ‘Missing’ category includes respondents who did not answer all of the items required to calculate this measure. Cells that contain two asterisks indicate that this is as measured by a shortened version of the CES-D. Cells that contain three asterisks indicate that this is as measured by the Slapped, Threatened, and Throw (STaT) screener. Rows labeled with an “N” indicate the number of observations from which percentages have been calculated.
Table 3. Medical Risk Factors Prior to Current Pregnancy, through Quarter 1 2015
Data Element N or
%
UNITED (Maternity Care
Home)
Birth Center
Group Prenatal Care
Maternity Care Home
Total
Inter-Pregnancy Interval with Current Pregnancy Since Last Birth
N 208 1127 700 1914 3741
<18 months % 15.4 24.3 18.0 19.5 20.7
≥18 months % 68.3 39.8 48.3 51.9 47.6
Missing % 16.3 35.9 33.7 28.6 31.8
Previous Preterm Birth(s) Between 20 and 36 weeks, 6 days EGA
N 208 1127 700 1914 3741
Yes % 12.0 10.7 11.4 18.9 15.0
No % 74.5 89.3 63.9 63.2 71.2
Not Known % 12.0 0 18.6 14.9 11.1
Missing % 1.4 0 6.1 3.0 2.7
Previous Birth(s) Less than 2,500 grams N 208 1127 700 1914 3741
Yes % 12.0 1.9 8.6 14.8 9.7
No % 71.6 95.8 60.4 61.7 71.7
Not Known % 15.4 0 24.7 19.2 14.5
Missing % 1.0 2.3 6.3 4.3 4.1
Pre-Pregnancy Diagnosis of Type I Diabetes N 288 2133 1433 3103 6669
Yes % 0.3 0.5 1.3 1.5 1.1
No % 93.4 99.5 74.2 84.4 87.0
Not Known % 5.9 0 7.7 11.1 6.8
Missing % 0.3 0 16.7 3.1 5.0
Pre-Pregnancy Diagnosis of Type II Diabetes N 288 2133 1433 3103 6669
Yes % 2.4 0 2.6 1.9 1.5
No % 91.3 5 72.9 83.3 56.1
Not Known % 5.9 0 7.7 11.1 6.8
Missing % 0.3 94.9 16.7 3.7 35.7
Pre-Pregnancy Diagnosis of Hypertension N 288 2133 1433 3103 6669
Yes % 6.9 0.5 6.0 9.5 5.9
No % 87.8 99.5 66.7 77.4 82.2
Not Known % 4.9 0 7.6 10.2 6.4
Missing % 0.3 0 19.7 2.9 5.6
Note: Rows labeled with an “N” indicate the number of observations from which percentages have been calculated.

138
Table 4. Medical Risk Factors during the Current Pregnancy, through Quarter 1 2015
Data Element N or
%
UNITED (Maternity Care
Home)
Birth Center
Group Prenatal Care
Maternity Care Home
Total
Gestational Diabetes N 288 2133 1433 3103 6669
Yes % 5.6 2.7 4.2 5.3 4.2
No % 77.1 97.3 65.4 76.0 80.6
Not Known % 17.4 0 10.3 15.9 9.6
Missing % 0 0 20.1 2.8 5.6
Pregnancy-Related Hypertension N 288 2133 1433 3103 6669
Yes % 3.1 1.3 7.8 7.7 5.7
No % 79.2 98.7 62.6 74.8 79.8
Not Known % 17.7 0 9.4 14.6 8.8
Missing % 0 0 20.2 2.9 5.7
Note: Rows labeled with an “N” indicate the number of observations from which percentages have been calculated.
Table 5. Birth and Delivery Methods, through Quarter 1 2015
Data Element N or
%
UNITED (Maternity Care
Home)
Birth Center
Group Prenatal Care
Maternity Care Home
Total
Total Number of Exit Forms with Valid Birth Information
N 280 2125 1103 2740 5968
Number of Babies Born N 284 2128 1125 2801 6054
Induction of Labor Excluding Planned C-Sections
N 262 2133 1297 2826 6256
Yes % 13.7 14.4 23.8 17.2 17.6
No % 29.0 85.3 42.8 35.5 54.0
Not known % 48.9 0 10.6 37.8 19.3
Missing % 8.4 0.3 22.7 9.6 9.1
Delivery Method from Exit Data N 288 2133 1433 3103 6669
Vaginal delivery % 50.0 87.3 49.1 52.0 62.7
C-Section % 25.0 12.4 24.3 29.6 23.0
Vaginal and C-Section % 0 0 0 0 0
Missing % 25.0 0.2 26.7 18.3 14.3
Women Who Had a Vaginal Birth as a Percentage of Women Who Planned to Deliver Vaginally
% 79.9 90.9 80.2 81.6 85.4
VBAC26
N 46 90 161 418 669
Yes % 13.0 30.0 19.9 13.9 17.5
Repeat C-Section N 46 90 161 418 669
Yes % 87.0 70.0 80.1 86.1 82.5
Scheduled C-Section N 72 265 348 920 1533
Yes % 36.1 0 39.1 29.2 26.4
26 The denominator for VBAC and repeat C-section are calculated by adding the total respondents in both categories since we cannot confidently know who else had a previous C-section.
Note: Rows labeled with an “N” indicate the number of observations from which percentages have been calculated.
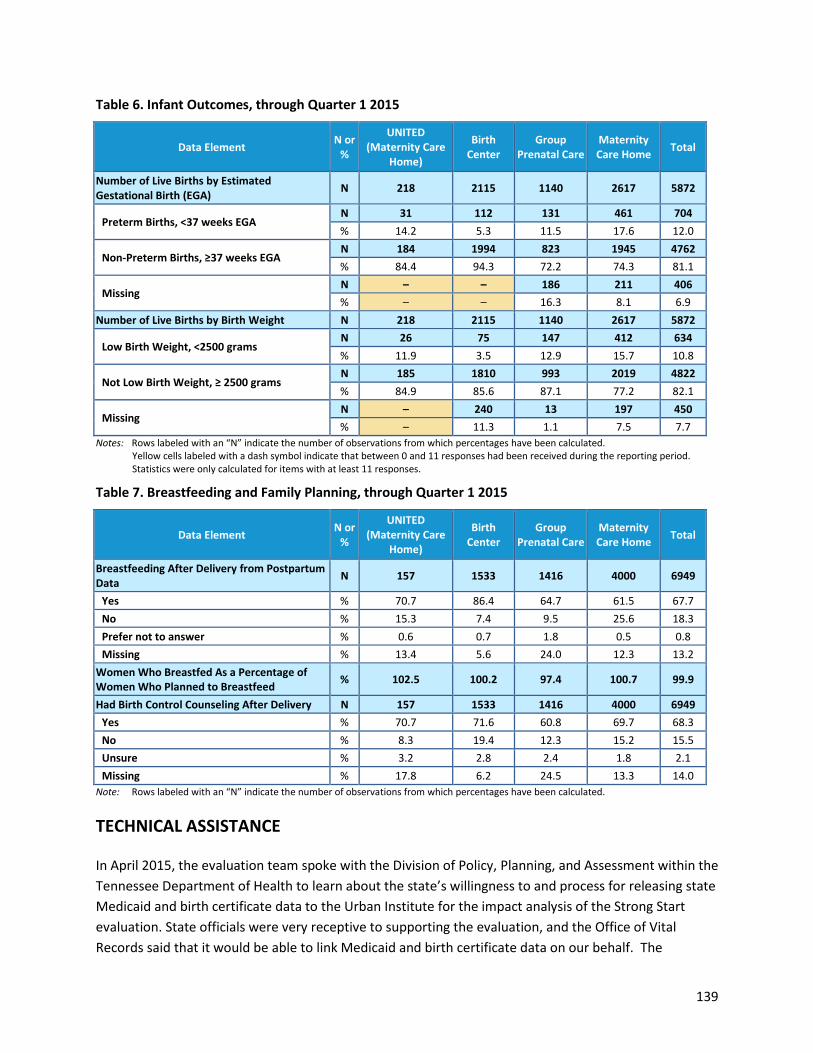
139
Table 6. Infant Outcomes, through Quarter 1 2015
Data Element N or
%
UNITED (Maternity Care
Home)
Birth Center
Group Prenatal Care
Maternity Care Home
Total
Number of Live Births by Estimated Gestational Birth (EGA)
N 218 2115 1140 2617 5872
Preterm Births, <37 weeks EGA N 31 112 131 461 704
% 14.2 5.3 11.5 17.6 12.0
Non-Preterm Births, ≥37 weeks EGA N 184 1994 823 1945 4762
% 84.4 94.3 72.2 74.3 81.1
Missing N – – 186 211 406
% – – 16.3 8.1 6.9
Number of Live Births by Birth Weight N 218 2115 1140 2617 5872
Low Birth Weight, <2500 grams N 26 75 147 412 634
% 11.9 3.5 12.9 15.7 10.8
Not Low Birth Weight, ≥ 2500 grams N 185 1810 993 2019 4822
% 84.9 85.6 87.1 77.2 82.1
Missing N – 240 13 197 450
% – 11.3 1.1 7.5 7.7
Notes: Rows labeled with an “N” indicate the number of observations from which percentages have been calculated. Yellow cells labeled with a dash symbol indicate that between 0 and 11 responses had been received during the reporting period. Statistics were only calculated for items with at least 11 responses.
Table 7. Breastfeeding and Family Planning, through Quarter 1 2015
Data Element N or
%
UNITED (Maternity Care
Home)
Birth Center
Group Prenatal Care
Maternity Care Home
Total
Breastfeeding After Delivery from Postpartum Data
N 157 1533 1416 4000 6949
Yes % 70.7 86.4 64.7 61.5 67.7
No % 15.3 7.4 9.5 25.6 18.3
Prefer not to answer % 0.6 0.7 1.8 0.5 0.8
Missing % 13.4 5.6 24.0 12.3 13.2
Women Who Breastfed As a Percentage of Women Who Planned to Breastfeed
% 102.5 100.2 97.4 100.7 99.9
Had Birth Control Counseling After Delivery N 157 1533 1416 4000 6949
Yes % 70.7 71.6 60.8 69.7 68.3
No % 8.3 19.4 12.3 15.2 15.5
Unsure % 3.2 2.8 2.4 1.8 2.1
Missing % 17.8 6.2 24.5 13.3 14.0
Note: Rows labeled with an “N” indicate the number of observations from which percentages have been calculated.
TECHNICAL ASSISTANCE
In April 2015, the evaluation team spoke with the Division of Policy, Planning, and Assessment within the
Tennessee Department of Health to learn about the state’s willingness to and process for releasing state
Medicaid and birth certificate data to the Urban Institute for the impact analysis of the Strong Start
evaluation. State officials were very receptive to supporting the evaluation, and the Office of Vital
Records said that it would be able to link Medicaid and birth certificate data on our behalf. The

140
evaluation team submitted a data request form to the Office of Vital Records in June 2015, and is in the
process of submitting materials to the state’s Institutional Review Board (IRB). Additionally, the
evaluation team is in the process of completing the application for Medicaid and CHIP data, which are
overseen by TennCare.

141
University of Alabama at Birmingham
CASE STUDY
The University of Alabama at Birmingham (UAB) Department of Maternal and Fetal Medicine has
implemented a maternity care home approach under Strong Start, with a focus on identifying
depression, making referrals, offering education, and providing enhanced nutritional support. In the
second year of the program, two UAB sites merged and relocated to a newly-constructed clinic, reducing
the number of Strong Start sites from four to three. Currently, two sites are housed within county health
department space (with Strong Start staffing by UAB employees) and the third, the Obstetrics
Complications Clinic, is part of the UAB campus and serves as the primary site of referrals for high risk
pregnancies in Alabama. UAB has enrolled 675 Strong Start participants since implementation.
Highlights from the second round of case study data collection include:
UAB hired a second nurse practitioner in April 2015. She works at the Obstetrics Complications
Clinic and shares responsibilities for recruitment and enrollment with the program’s other
Clinical Research Nurse, who splits her time between clinics.
UAB continues to use the same eligibility criteria as in Y1 (up to 26 weeks gestation, eligible for
Medicaid, and possessing at least one additional preterm risk factor), but is now recruiting
women with pending Medicaid applications rather than waiting until the Medicaid applications
are approved.
The awardee continues to use an opt-in enrollment approach to meet the University
Institutional Review Board’s requirements for informed consent. Key informants reported that
around 73 percent of eligible patients choose to participate in the program.
Rather than using a full depression screening instrument at intake, the Strong Start nurses now
prescreen women using the depression-related questions on the Strong Start intake form, and if
indicated, refer women to a social worker for a full depression screening.
As a result of low participation in group educational sessions during the program’s first year,
Strong Start staff created a series of educational videos that patients can access from home or
on a smartphone using an individual log-in ID. The videos address nutrition, contraception, early
child care, and other topics. Staff are disappointed, however, that very few women have
accessed the videos to date. On a few occasions, program staff have played the videos during
Strong Start encounters but remarked that there is often not enough time for this, particularly
given the lengthy intake process.
The nurses and project director have taken on more responsibility for Strong Start data
collection because other UAB staff did not complete the forms consistently. Key informants
reported that the paperwork continues to be time-consuming, which prevents the awardee
from enrolling as many women as are eligible.

142
Key informants felt that higher-need participants could benefit from more follow up than they
are able to provide with program resources but have otherwise received positive feedback
about the program from participants.
Program strengths include identifying and referring women to mental health services and
providing preventive, pre-diabetic dietician services.
In the month after the second nurse was hired, enrollment at the three UAB sites increased
from an average of 27 women per month to 50 women per month. Key informants expect to
reach their goal of 55-60 per month because of the additional nurse.
PARTICIPANT-LEVEL PROCESS EVALUATION
The information presented below is based on data submitted from the four evaluation forms through
Quarter 1 2015. By March 2015, University of Alabama at Birmingham had Intake Forms for 81 percent
of participants enrolled through Quarter 1 2015 (456 Intake Forms for 563 participants). In addition,
University of Alabama at Birmingham submitted 210 Third Trimester Surveys, 213 Postpartum Surveys,
and 146 Exit Forms. The tables below present data collected on University of Alabama at Birmingham’s
participants with aggregated rates by approach for the purpose of comparison.
Table 1. Enrollment and Forms Submitted, through Quarter 1 2015
Data Element N or
% UAB (Maternity
Care Home) Birth
Center Group
Prenatal Care Maternity Care Home
Total
Newly Enrolled in Q1 2015 N 78 739 948 2638 4325
Total Ever Enrolled through Q1 2015 N 563 4739 5576 13232 23547
Number of Women Delivered through Q1 2015
N 394 2275 2755 6189 11219
Intake Forms Received through Q1 2015 N 456 2993 4401 11761 19155
Received through Q1 2015 as a percentage of the number of women ever enrolled
% 81.0 63.2 78.9 88.9 81.3
Third Trimester Surveys Received through Q1 2015
N 210 1876 2145 4683 8704
Received through Q1 2015 as a percentage of the number of women delivered
% 53.3 82.5 77.9 75.7 77.6
Postpartum Surveys Received through Q1 2015
N 213 1533 1416 4000 6949
Received through Q1 2015 as a percentage of the number of women delivered
% 54.1 67.4 51.4 64.6 61.9
Exit Forms Received through Q1 2015 N 146 2133 1433 3103 6669
Received through Q1 2015 as a percentage of the number of women delivered
% 37.1 93.8 52.0 50.1 59.4
Note: Rows labeled with an “N” indicate the number of observations from which percentages have been calculated.
Table 2. Sociodemographic Risk Factors, through Quarter 1 2015
Data Element N or
% UAB (Maternity
Care Home) Birth
Center Group
Prenatal Care Maternity Care Home
Total
Mother’s Age at Intake N 456 2993 4401 11761 19155
Less than 18 years of age % 5.9 3.4 6.7 5.8 5.6

143
Data Element N or
% UAB (Maternity
Care Home) Birth
Center Group
Prenatal Care Maternity Care Home
Total
18 through 34 years of age % 88.4 86.1 75 81.4 80.7
35 years and older % 4.4 6.2 4.9 6.0 5.8
Missing % 1.3 4.3 13.4 6.8 7.9
Race and Ethnicity N 456 2993 4401 11761 19155
Hispanic % 2.6 25.7 39.2 22.9 27.1
Non-Hispanic white % 16.2 53.3 13.7 26.2 27.6
Non-Hispanic black % 80.5 14.8 39.2 46.3 39.8
Non-Hispanic Asian % 0 1.1 1.2 1.2 1.2
Non-Hispanic other % 0.2 0.6 1.6 0.7 0.9
Non-Hispanic multiple race % 0.4 3.6 2.3 1.2 1.8
Missing % 0 0.9 2.8 1.5 1.7
Employed at Intake N 456 2993 4401 11761 19155
Yes % 37.9 39.7 34.6 38.8 38
No % 61.8 59.1 60.9 60.0 60.0
Missing % 0.2 1.2 4.5 1.2 2.0
Education Level at Intake N 456 2993 4401 11761 19155
Less than high school % 26.5 14.3 23.7 24.5 22.7
High school graduate or GED % 56.4 52.3 46.2 52.0 50.7
Bachelor’s degree % 2.4 10.1 3.1 2.5 3.9
Other college degree(s) % 5.7 12.7 7.2 6.0 7.3
Missing % 9.0 10.7 19.8 15.0 15.4
Relationship Status at Intake N 456 2993 4401 11761 19155
Married, living with spouse % 10.5 40.7 18.6 17.2 21.2
Married, not living with spouse % 1.5 1.7 2.1 1.9 1.9
Living with a partner % 23.9 32.2 31.3 30.6 31.0
In a relationship but not living together % 41.4 12.9 24.6 30.5 26.4
Not in a relationship right now % 21.5 11.1 17 17.8 16.6
Missing % 1.1 1.3 6.4 2.0 2.9
Smokes Cigarettes at Intake N 456 2993 4401 11761 19155
Yes % 18.2 10.1 7.8 14.1 12.0
No % 80.7 77.1 71.7 77.8 76.3
Missing % 1.1 12.9 20.4 8.1 11.7
Food Insecure at Intake N 456 2993 4401 11761 19155
Yes % 30.7 18.1 18.5 16.1 16.9
No % 65.4 76.9 61.4 76.2 72.9
Missing*
% 3.9 5.0 20.0 7.7 10.1
Exhibiting Depressive Symptoms at Intake**
N 456 2993 4401 11761 19155
Yes % 45.8 21.8 25.2 23.4 23.5
No % 43.2 69.3 57.0 69.3 66.4
Missing* % 11 9.0 17.9 7.3 10.0
Have Experienced Intimate Partner Violence in a Relationship***
N 456 2993 4401 11761 19155
Yes % 24.1 20.6 17.1 19 18.8
No % 75.4 77.2 68.4 78.5 76.0
Missing* % 0.4 2.1 14.5 2.4 5.1

144
Notes: Cells that contain one asterisk indicate that the ‘Missing’ category includes respondents who did not answer all of the items required to calculate this measure. Cells that contain two asterisks indicate that this is as measured by a shortened version of the CES-D. Cells that contain three asterisks indicate that this is as measured by the Slapped, Threatened, and Throw (STaT) screener. Rows labeled with an “N” indicate the number of observations from which percentages have been calculated.
Table 3. Medical Risk Factors Prior to Current Pregnancy, through Quarter 1 2015
Data Element N or
% UAB (Maternity
Care Home) Birth
Center Group
Prenatal Care Maternity Care Home
Total
Inter-Pregnancy Interval with Current Pregnancy Since Last Birth
N 78 1127 700 1914 3741
<18 months % 17.9 24.3 18.0 19.5 20.7
≥18 months % 62.8 39.8 48.3 51.9 47.6
Missing % 19.2 35.9 33.7 28.6 31.8
Previous Preterm Birth(s) Between 20 and 36 weeks, 6 days EGA
N 78 1127 700 1914 3741
Yes % 34.6 10.7 11.4 18.9 15.0
No % 62.8 89.3 63.9 63.2 71.2
Not Known % 0 0 18.6 14.9 11.1
Missing % 2.6 0 6.1 3.0 2.7
Previous Birth(s) Less than 2,500 grams N 78 1127 700 1914 3741
Yes % 28.2 1.9 8.6 14.8 9.7
No % 67.9 95.8 60.4 61.7 71.7
Not Known % 1.3 0 24.7 19.2 14.5
Missing % 2.6 2.3 6.3 4.3 4.1
Pre-Pregnancy Diagnosis of Type I Diabetes N 146 2133 1433 3103 6669
Yes % 4.1 0.5 1.3 1.5 1.1
No % 94.5 99.5 74.2 84.4 87
Not Known % 0 0 7.7 11.1 6.8
Missing % 1.4 0 16.7 3.1 5
Pre-Pregnancy Diagnosis of Type II Diabetes N 146 2133 1433 3103 6669
Yes % 7.5 0 2.6 1.9 1.5
No % 91.1 5 72.9 83.3 56.1
Not Known % 0 0 7.7 11.1 6.8
Missing % 1.4 94.9 16.7 3.7 35.7
Pre-Pregnancy Diagnosis of Hypertension N 146 2133 1433 3103 6669
Yes % 16.4 0.5 6 9.5 5.9
No % 81.5 99.5 66.7 77.4 82.2
Not Known % 0 0 7.6 10.2 6.4
Missing % 2.1 0 19.7 2.9 5.6
Note: Rows labeled with an “N” indicate the number of observations from which percentages have been calculated.
Table 4. Medical Risk Factors during the Current Pregnancy, through Quarter 1 2015
Data Element N or
% UAB (Maternity
Care Home) Birth
Center Group
Prenatal Care Maternity Care Home
Total
Gestational Diabetes N 146 2133 1433 3103 6669
Yes % 3.4 2.7 4.2 5.3 4.2
No % 92.5 97.3 65.4 76 80.6
Not Known % 3.4 0 10.3 15.9 9.6
Missing % 0.7 0 20.1 2.8 5.6

145
Data Element N or
% UAB (Maternity
Care Home) Birth
Center Group
Prenatal Care Maternity Care Home
Total
Pregnancy-Related Hypertension N 146 2133 1433 3103 6669
Yes % 5.5 1.3 7.8 7.7 5.7
No % 89 98.7 62.6 74.8 79.8
Not Known % 4.8 0 9.4 14.6 8.8
Missing % 0.7 0 20.2 2.9 5.7
Note: Rows labeled with an “N” indicate the number of observations from which percentages have been calculated.
Table 5. Birth and Delivery Methods, through Quarter 1 2015
Data Element N or
% UAB (Maternity
Care Home) Birth
Center Group
Prenatal Care Maternity Care Home
Total
Total Number of Exit Forms with Valid Birth Information
N 132 2125 1103 2740 5968
Number of Babies Born N 138 2128 1125 2801 6054
Induction of Labor Excluding Planned C-Sections
N 132 2133 1297 2826 6256
Yes % 39.4 14.4 23.8 17.2 17.6
No % 51.5 85.3 42.8 35.5 54
Not known % 1.5 0 10.6 37.8 19.3
Missing % 7.6 0.3 22.7 9.6 9.1
Delivery Method from Exit Data N 146 2133 1433 3103 6669
Vaginal delivery % 63.7 87.3 49.1 52.0 62.7
C-Section % 25.0 12.4 24.3 29.6 23
Vaginal and C-Section % 0 0 0 0 0
Missing % 6.8 0.2 26.7 18.3 14.3
Women Who Had a Vaginal Birth as a Percentage of Women Who Planned to Deliver Vaginally
% 80.0 90.9 80.2 81.6 85.4
VBAC27
N 23 90 161 418 669
Yes % 26.1 30.0 19.9 13.9 17.5
Repeat C-Section N 23 90 161 418 669
Yes % 73.9 70.0 80.1 86.1 82.5
Scheduled C-Section N 43 265 348 920 1533
Yes % 32.6 0 39.1 29.2 26.4
27 The denominator for VBAC and repeat C-section are calculated by adding the total respondents in both categories since we cannot confidently know who else had a previous C-section.
Note: Rows labeled with an “N” indicate the number of observations from which percentages have been calculated.
Table 6. Infant Outcomes, through Quarter 1 2015
Data Element N or
% UAB (Maternity
Care Home) Birth
Center Group
Prenatal Care Maternity Care Home
Total
Number of Live by Estimated Gestational Birth (EGA)
N 133 2115 1140 2617 5872
Preterm Births, <37 weeks EGA N 27 112 131 461 704
% 20.3 5.3 11.5 17.6 12.0
Non-Preterm Births, ≥37 weeks EGA N 105 1994 823 1945 4762
% 78.9 94.3 72.2 74.3 81.1

146
Data Element N or
% UAB (Maternity
Care Home) Birth
Center Group
Prenatal Care Maternity Care Home
Total
Missing N – – 186 211 406
% – – 16.3 8.1 6.9
Number of Live Births by Birth Weight N 133 2115 1140 2617 5872
Low Birth Weight, <2500 grams N 32 75 147 412 634
% 24.1 3.5 12.9 15.7 10.8
Not Low Birth Weight, ≥ 2500 grams N 101 1810 993 2019 4822
% 75.9 85.6 87.1 77.2 82.1
Missing N – 240 13 197 450
% – 11.3 1.1 7.5 7.7
Notes: Rows labeled with an “N” indicate the number of observations from which percentages have been calculated. Yellow cells labeled with a dash symbol indicate that between 0 and 11 responses had been received during the reporting period. Statistics were only calculated for items with at least 11 responses.
Table 7. Breastfeeding and Family Planning, through Quarter 1 2015
Data Element N or
% UAB (Maternity
Care Home) Birth
Center Group
Prenatal Care Maternity Care Home
Total
Breastfeeding After Delivery from Postpartum Data
N 213 1533 1416 4000 6949
Yes % 70.0 86.4 64.7 61.5 67.7
No % 23.9 7.4 9.5 25.6 18.3
Prefer not to answer % 0 0.7 1.8 0.5 0.8
Missing % 6.1 5.6 24.0 12.3 13.2
Women Who Breastfed As a Percentage of Women Who Planned to Breastfeed
% 102.5 100.2 97.4 100.7 99.9
Had Birth Control Counseling After Delivery N 213 1533 1416 4000 6949
Yes % 91.1 71.6 60.8 69.7 68.3
No % 1.9 19.4 12.3 15.2 15.5
Unsure % 0.9 2.8 2.4 1.8 2.1
Missing % 6.1 6.2 24.5 13.3 14
Note: Rows labeled with an “N” indicate the number of observations from which percentages have been calculated.
TECHNICAL ASSISTANCE
In March 2015, the evaluation team spoke with officials from the Alabama Medicaid Agency and the
Alabama Department of Public Health (ADPH) to learn about the state’s willingness to and process for
releasing state Medicaid and birth certificate data (respectively) to the Urban Institute for the impact
analysis of the Strong Start evaluation. State officials were receptive to supporting the evaluation, but
said that they would prefer having the Urban Institute link the Medicaid and birth certificate data. In
June 2015, the evaluation team received approval from the Alabama Medicaid Agency. A data request
application was submitted to ADPH in April 2015, and we are currently awaiting approval from ADPH.
The team hopes to begin receiving data in late 2015.

147
University of Kentucky Research
Foundation
CASE STUDY
The University of Kentucky Research Foundation (UKRF) is affiliated with the academic medical center at
the University of Kentucky (UK) and is responsible for managing all external grants and contracts at the
university. UKRF is implementing group prenatal care with the CenteringPregnancy model at five sites
across the state, and at the time of Y2 data collection had enrolled 551 women in Strong Start. Overall,
informants were pleased with Strong Start implementation over the last year.
Highlights from the second round of case study data collection include:
The number of Strong Start sites has grown from four sites in evaluation Y1 to five in Y2. One
site withdrew from Strong Start because of increased enrollment expectations and staff
turnover, but two new sites affiliated with a local health department located south of Lexington
are now part of the program. The site that withdrew continues to offer group prenatal care.
The Polk Dalton site implemented a new EMPOWR (Efforts to Maximize Perinatal Outcomes in
Women at Risk) group targeting pregnant women with substance abuse issues, using a group
care approach that differs significantly from the Centering curriculum. Women meet every two
weeks for group prenatal care, at which time they also receive prescription treatment for opioid
addiction. Thus far, both providers and patients have been very responsive to and engaged in
the group.
Though enrollment continues to be a challenge, it has increased considerably from 121
participants at the end of the first program year to 380 participants a year later. The expansion
of gestational age criteria in June 2014 (with a new cutoff of 30 weeks gestation) has led to a
slight increase in enrollment, however only a small proportion of patients are enrolled in their
third trimester. A significant proportion of women continue to decline participation in Strong
Start at several sites, most often because of child care issues.
UKRF is placing additional emphasis on increasing enrollment. The awardee has developed new
site-specific enrollment targets based on the percentage of Medicaid participants receiving care
before 26 weeks at each site. Key informants feel these are “more realistic” than the initial
targets. In addition, UKRF has increased its outreach efforts to bring more attention to the group
prenatal care approach and increase referrals to participating sites.
UKRF has adopted several strategies to improve retention, particularly between the screening
and enrollment process and the first group session, which can be weeks or even months apart.
The awardee is beginning a pre-group meeting at the local health department to re-familiarize

148
participants with the program before it begins, and site-level staff continue to rely heavily on
text messaging as a way to improve group attendance and retention.
Key informants are pleased with program outcomes thus far, which include rates of preterm
birth that are lower than state and national averages and improvements in breastfeeding rates,
glucose control, and smoking cessation. Strong Start participants reportedly enjoy the group
sessions and benefit from the additional support of their peers and the facilitators.
Awardee staff has begun to discuss sustainability of the Strong Start approach with participating
sites, which have expressed interest in continuing the group prenatal care approach.
PARTICIPANT-LEVEL PROCESS EVALUATION
The information presented below is based on data submitted from the four evaluation forms through
Quarter 1 2015. By March 2015, University of Kentucky Research Foundation had Intake Forms for 100.8
percent of participants enrolled through Quarter 1 2015 (391 Intake Forms for 388 participants). In
addition, University of Kentucky Research Foundation submitted 170 Third Trimester Surveys, 95
Postpartum Surveys, but no Exit Forms. The tables below present data collected on University of
Kentucky Research Foundation’s participants with aggregated rates by approach for the purpose of
comparison.
Table 1. Enrollment and Forms Submitted, through Quarter 1 2015
Data Element N or
% UKY (Group
Prenatal Care) Birth
Center Group
Prenatal Care Maternity Care Home
Total
Newly Enrolled in Q1 2015 N 85 739 948 2638 4325
Total Ever Enrolled through Q1 2015 N 388 4739 5576 13232 23547
Number of Women Delivered through Q1 2015
N 211 2275 2755 6189 11219
Intake Forms Received through Q1 2015 N 391 2993 4401 11761 19155
Received through Q1 2015 as a percentage of the number of women ever enrolled
% 100.8 63.2 78.9 88.9 81.3
Third Trimester Surveys Received through Q1 2015
N 170 1876 2145 4683 8704
Received through Q1 2015 as a percentage of the number of women delivered
% 80.6 82.5 77.9 75.7 77.6
Postpartum Surveys Received through Q1 2015
N 95 1533 1416 4000 6949
Received through Q1 2015 as a percentage of the number of women delivered
% 45.0 67.4 51.4 64.6 61.9
Exit Forms Received through Q1 2015 N + 2133 1433 3103 6669
Received through Q1 2015 as a percentage of the number of women delivered
% + 93.8 52.0 50.1 59.4
Notes: Rows labeled with an “N” indicate the number of observations from which percentages have been calculated. Gray cells labeled with a plus symbol indicate that fewer than 25 forms had been received during the reporting period. Statistics were calculated only if there were at least 25 forms received.

149
Table 2. Sociodemographic Risk Factors, through Quarter 1 2015
Data Element N or
% UKY (Group
Prenatal Care) Birth
Center Group
Prenatal Care Maternity Care Home
Total
Mother’s Age at Intake N 391 2993 4401 11761 19155
Less than 18 years of age % 5.1 3.4 6.7 5.8 5.6
18 through 34 years of age % 85.2 86.1 75 81.4 80.7
35 years and older % 4.9 6.2 4.9 6.0 5.8
Missing % 4.9 4.3 13.4 6.8 7.9
Race and Ethnicity N 391 2993 4401 11761 19155
Hispanic % 32.2 25.7 39.2 22.9 27.1
Non-Hispanic white % 43.2 53.3 13.7 26.2 27.6
Non-Hispanic black % 14.3 14.8 39.2 46.3 39.8
Non-Hispanic Asian % 1.0 1.1 1.2 1.2 1.2
Non-Hispanic other % 0 0.6 1.6 0.7 0.9
Non-Hispanic multiple race % 3.6 3.6 2.3 1.2 1.8
Missing % 5.6 0.9 2.8 1.5 1.7
Employed at Intake N 391 2993 4401 11761 19155
Yes % 34.8 39.7 34.6 38.8 38.0
No % 59.8 59.1 60.9 60.0 60.0
Missing % 5.4 1.2 4.5 1.2 2.0
Education Level at Intake N 391 2993 4401 11761 19155
Less than high school % 0 14.3 23.7 24.5 22.7
High school graduate or GED % 47.3 52.3 46.2 52.0 50.7
Bachelor’s degree % 3.6 10.1 3.1 2.5 3.9
Other college degree(s) % 6.9 12.7 7.2 6.0 7.3
Missing % 42.2 10.7 19.8 15.0 15.4
Relationship Status at Intake N 391 2993 4401 11761 19155
Married, living with spouse % 31.2 40.7 18.6 17.2 21.2
Married, not living with spouse % 0.8 1.7 2.1 1.9 1.9
Living with a partner % 36.1 32.2 31.3 30.6 31.0
In a relationship but not living together % 15.1 12.9 24.6 30.5 26.4
Not in a relationship right now % 11.3 11.1 17.0 17.8 16.6
Missing % 5.6 1.3 6.4 2.0 2.9
Smokes Cigarettes at Intake N 391 2993 4401 11761 19155
Yes % 25.3 10.1 7.8 14.1 12.0
No % 74.7 77.1 71.7 77.8 76.3
Missing % 0 12.9 20.4 8.1 11.7
Food Insecure at Intake N 391 2993 4401 11761 19155
Yes % 9.5 18.1 18.5 16.1 16.9
No % 0 76.9 61.4 76.2 72.9
Missing*
% 90.5 5.0 20.0 7.7 10.1
Exhibiting Depressive Symptoms at Intake**
N 391 2993 4401 11761 19155
Yes % 28.6 21.8 25.2 23.4 23.5
No % 53.2 69.3 57.0 69.3 66.4
Missing* % 18.2 9.0 17.9 7.3 10.0
Have Experienced Intimate Partner Violence in a Relationship***
N 391 2993 4401 11761 19155
Yes % 12.8 20.6 17.1 19 18.8

150
Data Element N or
% UKY (Group
Prenatal Care) Birth
Center Group
Prenatal Care Maternity Care Home
Total
No % 0 77.2 68.4 78.5 76
Missing* % 87.2 2.1 14.5 2.4 5.1
Notes: Cells that contain one asterisk indicate that the ‘Missing’ category includes respondents who did not answer all of the items required to calculate this measure. Cells that contain two asterisks indicate that this is as measured by a shortened version of the CES-D. Cells that contain three asterisks indicate that this is as measured by the Slapped, Threatened, and Throw (STaT) screener. Rows labeled with an “N” indicate the number of observations from which percentages have been calculated.
Table 3. Medical Risk Factors Prior to Current Pregnancy, through Quarter 1 2015
Data Element N or
% UKY (Group
Prenatal Care) Birth
Center Group
Prenatal Care Maternity Care Home
Total
Inter-Pregnancy Interval with Current Pregnancy Since Last Birth
N + 1127 700 1914 3741
<18 months % + 24.3 18 19.5 20.7
≥18 months % + 39.8 48.3 51.9 47.6
Missing % + 35.9 33.7 28.6 31.8
Previous Preterm Birth(s) Between 20 and 36 weeks, 6 days EGA
N + 1127 700 1914 3741
Yes % + 10.7 11.4 18.9 15
No % + 89.3 63.9 63.2 71.2
Not Known % + 0 18.6 14.9 11.1
Missing % + 0 6.1 3 2.7
Previous Birth(s) Less than 2,500 grams N + 1127 700 1914 3741
Yes % + 1.9 8.6 14.8 9.7
No % + 95.8 60.4 61.7 71.7
Not Known % + 0 24.7 19.2 14.5
Missing % + 2.3 6.3 4.3 4.1
Pre-Pregnancy Diagnosis of Type I Diabetes N + 2133 1433 3103 6669
Yes % + 0.5 1.3 1.5 1.1
No % + 99.5 74.2 84.4 87
Not Known % + 0 7.7 11.1 6.8
Missing % + 0 16.7 3.1 5
Pre-Pregnancy Diagnosis of Type II Diabetes N + 2133 1433 3103 6669
Yes % + 0 2.6 1.9 1.5
No % + 5 72.9 83.3 56.1
Not Known % + 0 7.7 11.1 6.8
Missing % + 94.9 16.7 3.7 35.7
Pre-Pregnancy Diagnosis of Hypertension N + 2133 1433 3103 6669
Yes % + 0.5 6 9.5 5.9
No % + 99.5 66.7 77.4 82.2
Not Known % + 0 7.6 10.2 6.4
Missing % + 0 19.7 2.9 5.6
Notes: Rows labeled with an “N” indicate the number of observations from which percentages have been calculated. Gray cells labeled with a plus symbol indicate that fewer than 25 forms had been received during the reporting period. Statistics were calculated only if there were at least 25 forms received.

151
Table 4. Medical Risk Factors during the Current Pregnancy, through Quarter 1 2015
Data Element N or
% UKY (Group
Prenatal Care) Birth
Center Group
Prenatal Care Maternity Care Home
Total
Gestational Diabetes N + 2133 1433 3103 6669
Yes % + 2.7 4.2 5.3 4.2
No % + 97.3 65.4 76.0 80.6
Not Known % + 0 10.3 15.9 9.6
Missing % + 0 20.1 2.8 5.6
Pregnancy-Related Hypertension N + 2133 1433 3103 6669
Yes % + 1.3 7.8 7.7 5.7
No % + 98.7 62.6 74.8 79.8
Not Known % + 0 9.4 14.6 8.8
Missing % + 0 20.2 2.9 5.7
Notes: Rows labeled with an “N” indicate the number of observations from which percentages have been calculated. Gray cells labeled with a plus symbol indicate that fewer than 25 forms had been received during the reporting period. Statistics were calculated only if there were at least 25 forms received.
Table 5. Birth and Delivery Methods, through Quarter 1 2015
Data Element N or
% UKY (Group
Prenatal Care) Birth
Center Group
Prenatal Care Maternity Care Home
Total
Total Number of Exit Forms with Valid Birth Information
N + 2125 1103 2740 5968
Number of Babies Born N + 2128 1125 2801 6054
Induction of Labor Excluding Planned C-Sections
N + 2133 1297 2826 6256
Yes % + 14.4 23.8 17.2 17.6
No % + 85.3 42.8 35.5 54.0
Not known % + 0 10.6 37.8 19.3
Missing % + 0.3 22.7 9.6 9.1
Delivery Method from Exit Data N + 2133 1433 3103 6669
Vaginal delivery % + 87.3 49.1 52.0 62.7
C-Section % + 12.4 24.3 29.6 23.0
Vaginal and C-Section % + 0 0 0 0
Missing % + 0.2 26.7 18.3 14.3
Women Who Had a Vaginal Birth as a Percentage of Women Who Planned to Deliver Vaginally
% + 90.9 80.2 81.6 85.4
VBAC28
N + 90 161 418 669
Yes % + 30.0 19.9 13.9 17.5
Repeat C-Section N + 90 161 418 669
Yes % + 70.0 80.1 86.1 82.5
Scheduled C-Section N + 265 348 920 1533
Yes % + 0 39.1 29.2 26.4
28 The denominator for VBAC and repeat C-section are calculated by adding the total respondents in both categories since we cannot confidently know who else had a previous C-section.
Notes: Rows labeled with an “N” indicate the number of observations from which percentages have been calculated. Gray cells labeled with a plus symbol indicate that fewer than 25 forms had been received during the reporting period. Statistics were calculated only if there were at least 25 forms received.

152
Table 6. Infant Outcomes, through Quarter 1 2015
Data Element N or
% UKY (Group
Prenatal Care) Birth
Center Group
Prenatal Care Maternity Care Home
Total
Number of Live Births by Estimated Gestational Birth (EGA)
N + 2115 1140 2617 5872
Preterm Births, <37 weeks EGA N + 112 131 461 704
% + 5.3 11.5 17.6 12.0
Non-Preterm Births, ≥37 weeks EGA N + 1994 823 1945 4762
% + 94.3 72.2 74.3 81.1
Missing N + – 186 211 406
% + – 16.3 8.1 6.9
Number of Live Births by Birth Weight N + 2115 1140 2617 5872
Low Birth Weight, <2500 grams N + 75 147 412 634
% + 3.5 12.9 15.7 10.8
Not Low Birth Weight, ≥ 2500 grams N + 1810 993 2019 4822
% + 85.6 87.1 77.2 82.1
Missing N + 240 13 197 450
% + 11.3 1.1 7.5 7.7
Notes: Rows labeled with an “N” indicate the number of observations from which percentages have been calculated. Gray cells labeled with a plus symbol indicate that fewer than 25 forms had been received during the reporting period. Statistics were calculated only if there were at least 25 forms received. Yellow cells labeled with a dash symbol indicate that between 0 and 11 responses had been received during the reporting period. Statistics were only calculated for items with at least 11 responses.
Table 7. Breastfeeding and Family Planning, through Quarter 1 2015
Data Element N or
% UKY (Group
Prenatal Care) Birth
Center Group
Prenatal Care Maternity Care Home
Total
Breastfeeding After Delivery from Postpartum Data
N 95 1533 1416 4000 6949
Yes % 81.1 86.4 64.7 61.5 67.7
No % 0 7.4 9.5 25.6 18.3
Prefer not to answer % 18.9 0.7 1.8 0.5 0.8
Missing % 0 5.6 24.0 12.3 13.2
Women Who Breastfed As a Percentage of Women Who Planned to Breastfeed
% 98.3 100.2 97.4 100.7 99.9
Had Birth Control Counseling After Delivery N 95 1533 1416 4000 6949
Yes % 90.5 71.6 60.8 69.7 68.3
No % 0 19.4 12.3 15.2 15.5
Unsure % 9.5 2.8 2.4 1.8 2.1
Missing % 0 6.2 24.5 13.3 14
Note: Rows labeled with an “N” indicate the number of observations from which percentages have been calculated.
TECHNICAL ASSISTANCE
In May 2015, the evaluation team spoke with officials from the Division of Epidemiology and Health
Planning, which houses the Vital Statistics Branch, about the state’s willingness to and process for
releasing state birth certificate data to the Urban Institute for the impact analysis of the Strong Start
evaluation. State officials were receptive to supporting the evaluation, and they have access to and
experience with linking birth certificates with Medicaid data. Therefore, the state will likely link the

153
Medicaid and birth certificate data for the Strong Start evaluation. In the meantime the evaluation team
has reached out to Kentucky Medicaid to assess their willingness to share Medicaid data, but has not
established a primary contact as of yet. We plan to follow-up with Vital Statistics in the near future to
discuss next steps, including submitting materials to the state’s Institutional Review Board (IRB).

154
University of Puerto Rico
CASE STUDY
The University of Puerto Rico (UPR) Medical Sciences Campus in San Juan is one of eleven UPR campuses
and includes the Schools of Medicine, Pharmacy, Dentistry, Nursing, Public Health, and Health-Related
Professions. UPR is a publicly-operated health system that has implemented the Strong Start group
prenatal care approach at one of its two prenatal care sites, the University Hospital prenatal care clinic,
which is on the campus grounds in San Juan. The University Hospital site is the sole public clinic in
Puerto Rico caring for patients with high-risk pregnancies, and prenatal patients are referred there from
all parts of the island. The awardee would eventually like to extend group prenatal care to its second
prenatal clinic, which is in a community hospital about 30 minutes away from campus (still within the
San Juan metropolitan area).
Because it did not receive an in-person site visit in year one, unlike the other awardees included in this
volume UPR received an in-person visit in year two. The visit involved in-person interviews, focus
groups, and structured observations of group prenatal care sessions. Highlights from this round of data
collection include:
In early summer 2015, group prenatal care became the standard approach of prenatal care at
University Hospital. The awardee shifted from an opt-in to an opt-out enrollment approach as
part of this transition, so that all patients (those who are and are not Strong Start eligible) are
now enrolled in group care by default.
The awardee follows CHI’s CenteringPregnancy approach with some notable distinctions, such
as the addition of two sessions to the curriculum (i.e., for a total of 12 rather than 10 sessions);
inclusion of patients who begin care with the clinic after 20 weeks gestation; allowing patients
who miss their group session to attend another group’s session on a “drop-in” basis; and
involvement of three facilitators and often other hospital staff members or visitors in the
sessions. The latter two features contribute to a more fluid group composition than is
recommended by CHI, though focus group participants suggested they were comfortable with
this fluidity.
UPR operates a specialized prenatal care group for women living with HIV. This group follows
the same 12-session cycle and curriculum as other group cohorts, but gestational age is more
varied among group participants and sessions incorporate some additional topics that are
relevant to HIV-positive women (e.g., administration of prophylactic antiretroviral drug therapy
for infants).
Strong support from University leadership has facilitated Strong Start implementation and the
transition to group prenatal care as the clinic’s standard approach of care. At the same time, the
awardee has experienced some challenges, including lack of support from prenatal clinic nurses,

155
space constraints and scheduling (particularly related to a wide range of gestational ages at
entry into University Hospital prenatal care), and Medicaid enrollment delays.
Key informants and focus group participants alike report that group prenatal care has helped
patients build stronger relationships with their peers and providers. The opportunity to include
partners in group sessions (a contrast from UPR’s traditional care approach) is a significant
benefit and widely appreciated by group participants.
Focus group participants expressed great satisfaction with the group care approach. They
especially appreciate the fact that sessions start at a designated time without no long waits in
the clinic waiting room (as was typical under UPR’s traditional prenatal care approach) as well as
the opportunity to receive more education and participate in discussions about topics such as
family planning, C-section deliveries, and breastfeeding.
Awardee program staff described plans to sustain group prenatal care at the University Hospital
site once the award period has ended, with the expectation that it will continue as the standard
approach of care for the clinic.
PARTICIPANT-LEVEL PROCESS EVALUATION
The information presented below is based on data submitted from the four evaluation forms through
Quarter 1 2015. By March 2015, University of Puerto Rico Medical Sciences Campus had Intake Forms
for 100.3 percent of participants enrolled through Quarter 1 2015 (379 Intake Forms for 378
participants). In addition, University of Puerto Rico Medical Sciences Campus submitted 228 Third
Trimester Surveys, 159 Postpartum Surveys, and 230 Exit Forms. The tables below present data
collected on University of Puerto Rico Medical Sciences Campus’ participants with aggregated rates by
approach for the purpose of comparison.
Table 1. Enrollment and Forms Submitted, through Quarter 1 2015
Data Element N or
%
PUERTO RICO (Group Prenatal
Care)
Birth Center
Group Prenatal Care
Maternity Care Home
Total
Newly Enrolled in Q1 2015 N 124 739 948 2638 4325
Total Ever Enrolled through Q1 2015 N 378 4739 5576 13232 23547
Number of Women Delivered through Q1 2015 N 255 2275 2755 6189 11219
Intake Forms Received through Q1 2015 N 379 2993 4401 11761 19155
Received through Q1 2015 as a percentage of the number of women ever enrolled
% 100.3 63.2 78.9 88.9 81.3
Third Trimester Surveys Received through Q1 2015
N 228 1876 2145 4683 8704
Received through Q1 2015 as a percentage of the number of women delivered
% 89.4 82.5 77.9 75.7 77.6
Postpartum Surveys Received through Q1 2015
N 159 1533 1416 4000 6949
Received through Q1 2015 as a percentage of the number of women delivered
% 62.4 67.4 51.4 64.6 61.9
Exit Forms Received through Q1 2015 N 230 2133 1433 3103 6669

156
Data Element N or
%
PUERTO RICO (Group Prenatal
Care)
Birth Center
Group Prenatal Care
Maternity Care Home
Total
Received through Q1 2015 as a percentage of the number of women delivered
% 90.2 93.8 52.0 50.1 59.4
Note: Rows labeled with an “N” indicate the number of observations from which percentages have been calculated.
Table 2. Sociodemographic Risk Factors, through Quarter 1 2015
Data Element N or
%
PUERTO RICO (Group Prenatal
Care)
Birth Center
Group Prenatal Care
Maternity Care Home
Total
Mother’s Age at Intake N 379 2993 4401 11761 19155
Less than 18 years of age % 7.4 3.4 6.7 5.8 5.6
18 through 34 years of age % 62.3 86.1 75.0 81.4 80.7
35 years and older % 8.7 6.2 4.9 6.0 5.8
Missing % 21.6 4.3 13.4 6.8 7.9
Race and Ethnicity N 379 2993 4401 11761 19155
Hispanic % 96 25.7 39.2 22.9 27.1
Non-Hispanic white % 1.1 53.3 13.7 26.2 27.6
Non-Hispanic black % 0.3 14.8 39.2 46.3 39.8
Non-Hispanic Asian % 0 1.1 1.2 1.2 1.2
Non-Hispanic other % 0 0.6 1.6 0.7 0.9
Non-Hispanic multiple race % 0 3.6 2.3 1.2 1.8
Missing % 2.6 0.9 2.8 1.5 1.7
Employed at Intake N 379 2993 4401 11761 19155
Yes % 29.8 39.7 34.6 38.8 380
No % 68.3 59.1 60.9 60.0 60.0
Missing % 1.8 1.2 4.5 1.2 2.0
Education Level at Intake N 379 2993 4401 11761 19155
Less than high school % 8.7 14.3 23.7 24.5 22.7
High school graduate or GED % 34.3 52.3 46.2 52 50.7
Bachelor’s degree % 6.3 10.1 3.1 2.5 3.9
Other college degree(s) % 24.3 12.7 7.2 6.0 7.3
Missing % 26.4 10.7 19.8 15.0 15.4
Relationship Status at Intake N 379 2993 4401 11761 19155
Married, living with spouse % 19.0 40.7 18.6 17.2 21.2
Married, not living with spouse % 1.8 1.7 2.1 1.9 1.9
Living with a partner % 45.9 32.2 31.3 30.6 31.0
In a relationship but not living together % 17.9 12.9 24.6 30.5 26.4
Not in a relationship right now % 12.9 11.1 17.0 17.8 16.6
Missing % 2.4 1.3 6.4 2.0 2.9
Smokes Cigarettes at Intake N 379 2993 4401 11761 19155
Yes % 2.4 10.1 7.8 14.1 12.0
No % 79.2 77.1 71.7 77.8 76.3
Missing % 18.5 12.9 20.4 8.1 11.7
Food Insecure at Intake N 379 2993 4401 11761 19155
Yes % 24 18.1 18.5 16.1 16.9
No % 67.3 76.9 61.4 76.2 72.9
Missing*
% 8.7 5.0 20.0 7.7 10.1

157
Data Element N or
%
PUERTO RICO (Group Prenatal
Care)
Birth Center
Group Prenatal Care
Maternity Care Home
Total
Exhibiting Depressive Symptoms at Intake**
N 379 2993 4401 11761 19155
Yes % 28.5 21.8 25.2 23.4 23.5
No % 48.5 69.3 57.0 69.3 66.4
Missing* % 23.0 9.0 17.9 7.3 10.0
Have Experienced Intimate Partner Violence in a Relationship***
N 379 2993 4401 11761 19155
Yes % 15.0 20.6 17.1 19.0 18.8
No % 82.1 77.2 68.4 78.5 76.0
Missing* % 2.9 2.1 14.5 2.4 5.1
Notes: Cells that contain one asterisk indicate that the ‘Missing’ category includes respondents who did not answer all of the items required to calculate this measure. Cells that contain two asterisks indicate that this is as measured by a shortened version of the CES-D. Cells that contain three asterisks indicate that this is as measured by the Slapped, Threatened, and Throw (STaT) screener. Rows labeled with an “N” indicate the number of observations from which percentages have been calculated.
Table 3. Medical Risk Factors Prior to Current Pregnancy, through Quarter 1 2015
Data Element N or
%
PUERTO RICO (Group Prenatal
Care)
Birth Center
Group Prenatal Care
Maternity Care Home
Total
Inter-Pregnancy Interval with Current Pregnancy Since Last Birth
N 147 1127 700 1914 3741
<18 months % 14.9 24.3 18.0 19.5 20.7
≥18 months % 53.1 39.8 48.3 51.9 47.6
Missing % 32.0 35.9 33.7 28.6 31.8
Previous Preterm Birth(s) Between 20 and 36 weeks, 6 days EGA
N 147 1127 700 1914 3741
Yes % 5.4 10.7 11.4 18.9 15
No % 30.6 89.3 63.9 63.2 71.2
Not Known % 63.9 0 18.6 14.9 11.1
Missing % 0 0 6.1 3.0 2.7
Previous Birth(s) Less than 2,500 grams N 147 1127 700 1914 3741
Yes % 4.1 1.9 8.6 14.8 9.7
No % 31.3 95.8 60.4 61.7 71.7
Not Known % 64.6 0 24.7 19.2 14.5
Missing % 0 2.3 6.3 4.3 4.1
Pre-Pregnancy Diagnosis of Type I Diabetes N 230 2133 1433 3103 6669
Yes % 5.7 0.5 1.3 1.5 1.1
No % 91.3 99.5 74.2 84.4 87
Not Known % 2.6 0 7.7 11.1 6.8
Missing % 0.4 0 16.7 3.1 5.0
Pre-Pregnancy Diagnosis of Type II Diabetes N 230 2133 1433 3103 6669
Yes % 12.6 0 2.6 1.9 1.5
No % 84.3 5 72.9 83.3 56.1
Not Known % 2.6 0 7.7 11.1 6.8
Missing % 0.4 94.9 16.7 3.7 35.7
Pre-Pregnancy Diagnosis of Hypertension N 230 2133 1433 3103 6669
Yes % 20.4 0.5 6.0 9.5 5.9

158
Data Element N or
%
PUERTO RICO (Group Prenatal
Care)
Birth Center
Group Prenatal Care
Maternity Care Home
Total
No % 77.4 99.5 66.7 77.4 82.2
Not Known % 1.7 0 7.6 10.2 6.4
Missing % 0.4 0 19.7 2.9 5.6
Note: Rows labeled with an “N” indicate the number of observations from which percentages have been calculated.
Table 4. Medical Risk Factors during the Current Pregnancy, through Quarter 1 2015
Data Element N or
%
PUERTO RICO (Group Prenatal
Care)
Birth Center
Group Prenatal Care
Maternity Care Home
Total
Gestational Diabetes N 230 2133 1433 3103 6669
Yes % 7.0 2.7 4.2 5.3 4.2
No % 91.3 97.3 65.4 76.0 80.6
Not Known % 0.4 0 10.3 15.9 9.6
Missing % 1.3 0 20.1 2.8 5.6
Pregnancy-Related Hypertension N 230 2133 1433 3103 6669
Yes % 13 1.3 7.8 7.7 5.7
No % 85.2 98.7 62.6 74.8 79.8
Not Known % 0.4 0 9.4 14.6 8.8
Missing % 1.3 0 20.2 2.9 5.7
Note: Rows labeled with an “N” indicate the number of observations from which percentages have been calculated.
Table 5. Birth and Delivery Methods, through Quarter 1 2015
Data Element N or
%
PUERTO RICO (Group Prenatal
Care)
Birth Center
Group Prenatal Care
Maternity Care Home
Total
Total Number of Exit Forms with Valid Birth Information
N 214 2125 1103 2740 5968
Number of Babies Born N 226 2128 1125 2801 6054
Induction of Labor Excluding Planned C-Sections
N 168 2133 1297 2826 6256
Yes % 19.6 14.4 23.8 17.2 17.6
No % 66.1 85.3 42.8 35.5 54.0
Not known % 4.8 0 10.6 37.8 19.3
Missing % 9.5 0.3 22.7 9.6 9.1
Delivery Method from Exit Data N 230 2133 1433 3103 6669
Vaginal delivery % 45.7 87.3 49.1 52.0 62.7
C-Section % 47.0 12.4 24.3 29.6 23.0
Vaginal and C-Section % 0 0 0 0 0
Missing % 7.4 0.2 26.7 18.3 14.3
Women Who Had a Vaginal Birth as a Percentage of Women Who Planned to Deliver Vaginally
% 73.2 90.9 80.2 81.6 85.4
VBAC29
N 61 90 161 418 669
Yes % 11.5 30.0 19.9 13.9 17.5
29 The denominator for VBAC and repeat C-section are calculated by adding the total respondents in both categories since we cannot confidently know who else had a previous C-section.

159
Data Element N or
%
PUERTO RICO (Group Prenatal
Care)
Birth Center
Group Prenatal Care
Maternity Care Home
Total
Repeat C-Section N 61 90 161 418 669
Yes % 88.5 70.0 80.1 86.1 82.5
Scheduled C-Section N 108 265 348 920 1533
Yes % 57.4 0 39.1 29.2 26.4
Note: Rows labeled with an “N” indicate the number of observations from which percentages have been calculated.
Table 6. Infant Outcomes, through Quarter 1 2015
Data Element N or
%
PUERTO RICO (Group Prenatal
Care)
Birth Center
Group Prenatal Care
Maternity Care Home
Total
Number of Live Births by Estimated Gestational Birth (EGA)
N 213 2115 1140 2617 5872
Preterm Births, <37 weeks EGA N 37 112 131 461 704
% 17.4 5.3 11.5 17.6 12
Non-Preterm Births, ≥37 weeks EGA N 113 1994 823 1945 4762
% 53.1 94.3 72.2 74.3 81.1
Missing N 63 – 186 211 406
% 29.6 – 16.3 8.1 6.9
Number of Live Births by Birth Weight N 213 2115 1140 2617 5872
Low Birth Weight, <2500 grams N 48 75 147 412 634
% 22.5 3.5 12.9 15.7 10.8
Not Low Birth Weight, ≥ 2500 grams N 171 1810 993 2019 4822
% 80.3 85.6 87.1 77.2 82.1
Missing N – 240 13 197 450
% – 11.3 1.1 7.5 7.7
Notes: Rows labeled with an “N” indicate the number of observations from which percentages have been calculated. Yellow cells labeled with a dash symbol indicate that between 0 and 11 responses had been received during the reporting period. Statistics were only calculated for items with at least 11 responses.
Table 7. Breastfeeding and Family Planning, through Quarter 1 2015
Data Element N or
%
PUERTO RICO (Group Prenatal
Care)
Birth Center
Group Prenatal Care
Maternity Care Home
Total
Breastfeeding After Delivery from Postpartum Data
N 159 1533 1416 4000 6949
Yes % 73.0 86.4 64.7 61.5 67.7
No % 25.2 7.4 9.5 25.6 18.3
Prefer not to answer % 0 0.7 1.8 0.5 0.8
Missing % 1.9 5.6 24.0 12.3 13.2
Women Who Breastfed As a Percentage of Women Who Planned to Breastfeed
% 87.8 100.2 97.4 100.7 99.9
Had Birth Control Counseling After Delivery N 159 1533 1416 4000 6949
Yes % 58.5 71.6 60.8 69.7 68.3
No % 37.7 19.4 12.3 15.2 15.5
Unsure % 1.3 2.8 2.4 1.8 2.1
Missing % 2.5 6.2 24.5 13.3 14
Note: Rows labeled with an “N” indicate the number of observations from which percentages have been calculated.

160
TECHNICAL ASSISTANCE
The evaluation team is exploring the possibility of obtaining birth certificate data from Puerto Rico, but
no direct conversations between Urban and territory officials has yet taken place.

161
University of South Alabama
CASE STUDY
The Department of Obstetrics and Gynecology at the University of South Alabama (USA) administers a
Strong Start award in the Mobile, Alabama region, with four Maternity Care Home (MCH) sites, one of
which also offers group prenatal care through the Strong Start program. Strong Start complements an
existing Alabama Medicaid perinatal program called MomCare which provides social services to
pregnant Medicaid enrollees. The MCH provides each participant with a risk assessment, nutritional
counseling, and support from either a social worker or a nurse. USA’s group prenatal care approach
follows CHI’s CenteringPregnancy approach.
Highlights from the second round of case study data collection include:
Enhanced services through USA’s Maternity Care Home approach focus on enhanced
psychosocial screening and enhanced nutritional support by a registered dietician. Strong Start
screening and patient health and pregnancy counseling have been integrated into the first
prenatal care visit and are now offered in face-to-face patient encounters (initially, the awardee
provided these later in pregnancy by phone). Key informants believe this change has led to
important improvements across many program aspects—outreach, enrollment, and service
utilization.
Participants who are teens or first-time mothers are automatically referred to the dietician
while other women in the program only receive nutritional counseling if they present with or
develop a BMI of over 30 or under 19.
Women enrolled in Strong Start group prenatal care at The Women’s Center participate in ten
sessions, using the CenteringPregnancy standards and curriculum.
In March 2015, a fourth MCH Strong Start site was added—the USA Family Medicine outpatient
clinic.
Eligibility requirements have changed to allow any pregnant patient who is eligible for Medicaid
to enroll in Strong Start, without an additional preterm risk factor and up until the 28th week of
pregnancy. During the first program year, participants were required to possess an additional
risk factor (beyond Medicaid eligibility) for inclusion in the program.
Some Strong Start participants have been concerned about questions on the evaluation’s intake
form related to housing, which they believe could impact receipt of other (non-Medicaid) public
benefits. USA allows women to skip questions of significant concern to them, such as who lives
in the household, if they do not feel comfortable providing this information.
Key informants believe the rate of preterm birth among Strong Start enrollees may be
improving, though low enrollment makes it difficult to draw conclusions. (USA enrolled a total of

162
503 participants in their first year of program operation.) USA has developed a plan to increase
enrollment in Strong Start through Y3 of the program.
PARTICIPANT-LEVEL PROCESS EVALUATION
The information presented below is based on data submitted from the four evaluation forms through
Quarter 1 2015. By March 2015, University of South Alabama had Intake Forms for 95 percent of
participants enrolled through Quarter 1 2015 (828 Intake Forms for 875 participants). In addition,
University of South Alabama submitted 236 Third Trimester Surveys, 123 Postpartum Surveys, and 139
Exit Forms. The tables below present data collected on University of South Alabama’s participants with
aggregated rates by approach for the purpose of comparison.
Table 1. Enrollment and Forms Submitted, through Quarter 1 2015
Data Element N or
%
USA (Group Prenatal Care and
Maternity Care Home)
Birth Center
Group Prenatal Care
Maternity Care Home
Total
Newly Enrolled in Q1 2015 N 207 739 948 2638 4325
Total Ever Enrolled through Q1 2015 N 875 4739 5576 13232 23547
Number of Women Delivered through Q1 2015 N 316 2275 2755 6189 11219
Intake Forms Received through Q1 2015 N 828 2993 4401 11761 19155
Received through Q1 2015 as a percentage of the number of women ever enrolled
% 94.6 63.2 78.9 88.9 81.3
Third Trimester Surveys Received through Q1 2015
N 236 1876 2145 4683 8704
Received through Q1 2015 as a percentage of the number of women delivered
% 74.7 82.5 77.9 75.7 77.6
Postpartum Surveys Received through Q1 2015 N 123 1533 1416 4000 6949
Received through Q1 2015 as a percentage of the number of women delivered
% 38.9 67.4 51.4 64.6 61.9
Exit Forms Received through Q1 2015 N 139 2133 1433 3103 6669
Received through Q1 2015 as a percentage of the number of women delivered
% 44.0 93.8 52.0 50.1 59.4
Note: Rows labeled with an “N” indicate the number of observations from which percentages have been calculated.
Table 2. Sociodemographic Risk Factors, through Quarter 1 2015
Data Element N or
%
USA (Group Prenatal Care and
Maternity Care Home)
Birth Center
Group Prenatal Care
Maternity Care Home
Total
Mother’s Age at Intake N 828 2993 4401 11761 19155
Less than 18 years of age % 7.9 3.4 6.7 5.8 5.6
18 through 34 years of age % 75 86.1 75 81.4 80.7
35 years and older % 2.7 6.2 4.9 6.0 5.8
Missing % 14.5 4.3 13.4 6.8 7.9
Race and Ethnicity N 828 2993 4401 11761 19155
Hispanic % 1.6 25.7 39.2 22.9 27.1
Non-Hispanic white % 34.4 53.3 13.7 26.2 27.6

163
Data Element N or
%
USA (Group Prenatal Care and
Maternity Care Home)
Birth Center
Group Prenatal Care
Maternity Care Home
Total
Non-Hispanic black % 60.1 14.8 39.2 46.3 39.8
Non-Hispanic Asian % 1.2 1.1 1.2 1.2 1.2
Non-Hispanic other % 1.0 0.6 1.6 0.7 0.9
Non-Hispanic multiple race % 1.3 3.6 2.3 1.2 1.8
Missing % 0.4 0.9 2.8 1.5 1.7
Employed at Intake N 828 2993 4401 11761 19155
Yes % 38.4 39.7 34.6 38.8 38.0
No % 58.6 59.1 60.9 60.0 60.0
Missing % 3.0 1.2 4.5 1.2 2.0
Education Level at Intake N 828 2993 4401 11761 19155
Less than high school % 26 14.3 23.7 24.5 22.7
High school graduate or GED % 55.6 52.3 46.2 52.0 50.7
Bachelor’s degree % 1.1 10.1 3.1 2.5 3.9
Other college degree(s) % 5.9 12.7 7.2 6.0 7.3
Missing % 11.5 10.7 19.8 15.0 15.4
Relationship Status at Intake N 828 2993 4401 11761 19155
Married, living with spouse % 12.3 40.7 18.6 17.2 21.2
Married, not living with spouse % 3.5 1.7 2.1 1.9 1.9
Living with a partner % 25.6 32.2 31.3 30.6 31.0
In a relationship but not living together % 30.3 12.9 24.6 30.5 26.4
Not in a relationship right now % 23.3 11.1 17.0 17.8 16.6
Missing % 5.0 1.3 6.4 2.0 2.9
Smokes Cigarettes at Intake N 828 2993 4401 11761 19155
Yes % 21.4 10.1 7.8 14.1 12.0
No % 68.4 77.1 71.7 77.8 76.3
Missing % 10.3 12.9 20.4 8.1 11.7
Food Insecure at Intake N 828 2993 4401 11761 19155
Yes % 17.0 18.1 18.5 16.1 16.9
No % 68.0 76.9 61.4 76.2 72.9
Missing*
% 14.9 5.0 20.0 7.7 10.1
Exhibiting Depressive Symptoms at Intake** N 828 2993 4401 11761 19155
Yes % 30.7 21.8 25.2 23.4 23.5
No % 56.5 69.3 57.0 69.3 66.4
Missing* % 12.8 9.0 17.9 7.3 10.0
Have Experienced Intimate Partner Violence in a Relationship***
N 828 2993 4401 11761 19155
Yes % 15.3 20.6 17.1 19.0 18.8
No % 81.6 77.2 68.4 78.5 76.0
Missing* % 3.0 2.1 14.5 2.4 5.1
Notes: Cells that contain one asterisk indicate that the ‘Missing’ category includes respondents who did not answer all of the items required to calculate this measure. Cells that contain two asterisks indicate that this is as measured by a shortened version of the CES-D. Cells that contain three asterisks indicate that this is as measured by the Slapped, Threatened, and Throw (STaT) screener. Rows labeled with an “N” indicate the number of observations from which percentages have been calculated.

164
Table 3. Medical Risk Factors Prior to Current Pregnancy, through Quarter 1 2015
Data Element N or
%
USA (Group Prenatal Care and
Maternity Care Home)
Birth Center
Group Prenatal Care
Maternity Care Home
Total
Inter-Pregnancy Interval with Current Pregnancy Since Last Birth
N 79 1127 700 1914 3741
<18 months % 25.3 24.3 18.0 19.5 20.7
≥18 months % 55.7 39.8 48.3 51.9 47.6
Missing % 19.0 35.9 33.7 28.6 31.8
Previous Preterm Birth(s) Between 20 and 36 weeks, 6 days EGA
N 79 1127 700 1914 3741
Yes % 32.9 10.7 11.4 18.9 15.0
No % 64.6 89.3 63.9 63.2 71.2
Not Known % 2.5 0 18.6 14.9 11.1
Missing % 0 0 6.1 3 2.7
Previous Birth(s) Less than 2,500 grams N 79 1127 700 1914 3741
Yes % 15.2 1.9 8.6 14.8 9.7
No % 58.2 95.8 60.4 61.7 71.7
Not Known % 25.3 0 24.7 19.2 14.5
Missing % 1.3 2.3 6.3 4.3 4.1
Pre-Pregnancy Diagnosis of Type I Diabetes N 139 2133 1433 3103 6669
Yes % 0 0.5 1.3 1.5 1.1
No % 94.2 99.5 74.2 84.4 87
Not Known % 3.6 0 7.7 11.1 6.8
Missing % 2.2 0 16.7 3.1 5.0
Pre-Pregnancy Diagnosis of Type II Diabetes N 139 2133 1433 3103 6669
Yes % 0 0 2.6 1.9 1.5
No % 94.2 5 72.9 83.3 56.1
Not Known % 3.6 0 7.7 11.1 6.8
Missing % 2.2 94.9 16.7 3.7 35.7
Pre-Pregnancy Diagnosis of Hypertension N 139 2133 1433 3103 6669
Yes % 10.8 0.5 6.0 9.5 5.9
No % 83.5 99.5 66.7 77.4 82.2
Not Known % 3.6 0 7.6 10.2 6.4
Missing % 2.2 0 19.7 2.9 5.6
Note: Rows labeled with an “N” indicate the number of observations from which percentages have been calculated.
Table 4. Medical Risk Factors during the Current Pregnancy, through Quarter 1 2015
Data Element N or
%
USA (Group Prenatal Care and
Maternity Care Home)
Birth Center
Group Prenatal Care
Maternity Care Home
Total
Gestational Diabetes N 139 2133 1433 3103 6669
Yes % 2.9 2.7 4.2 5.3 4.2
No % 87.8 97.3 65.4 76.0 80.6
Not Known % 9.4 0 10.3 15.9 9.6
Missing % 0 0 20.1 2.8 5.6
Pregnancy-Related Hypertension N 139 2133 1433 3103 6669

165
Data Element N or
%
USA (Group Prenatal Care and
Maternity Care Home)
Birth Center
Group Prenatal Care
Maternity Care Home
Total
Yes % 5.0 1.3 7.8 7.7 5.7
No % 87.1 98.7 62.6 74.8 79.8
Not Known % 7.9 0 9.4 14.6 8.8
Missing % 0 0 20.2 2.9 5.7
Note: Rows labeled with an “N” indicate the number of observations from which percentages have been calculated.
Table 5. Birth and Delivery Methods, through Quarter 1 2015
Data Element N or
%
USA (Group Prenatal Care and
Maternity Care Home)
Birth Center
Group Prenatal Care
Maternity Care Home
Total
Total Number of Exit Forms with Valid Birth Information
N 122 2125 1103 2740 5968
Number of Babies Born N 127 2128 1125 2801 6054
Induction of Labor Excluding Planned C-Sections
N 126 2133 1297 2826 6256
Yes % 30.2 14.4 23.8 17.2 17.6
No % 54.8 85.3 42.8 35.5 54.0
Not known % 4.0 0 10.6 37.8 19.3
Missing % 11.1 0.3 22.7 9.6 9.1
Delivery Method from Exit Data N 139 2133 1433 3103 6669
Vaginal delivery % 53.2 87.3 49.1 52.0 62.7
C-Section % 34.5 12.4 24.3 29.6 23.0
Vaginal and C-Section % 0 0 0 0 0
Missing % 12.2 0.2 26.7 18.3 14.3
Women Who Had a Vaginal Birth as a Percentage of Women Who Planned to Deliver Vaginally
% 77.1 90.9 80.2 81.6 85.4
VBAC30
N 22 90 161 418 669
Yes % 9.1 30.0 19.9 13.9 17.5
Repeat C-Section N 22 90 161 418 669
Yes % 90.9 70.0 80.1 86.1 82.5
Scheduled C-Section N 48 265 348 920 1533
Yes % 27.1 0 39.1 29.2 26.4
30 The denominator for VBAC and repeat C-section are calculated by adding the total respondents in both categories since we cannot confidently know who else had a previous C-section.
Note: Rows labeled with an “N” indicate the number of observations from which percentages have been calculated.
Table 6. Infant Outcomes, through Quarter 1 2015
Data Element N or
%
USA (Group Prenatal Care and
Maternity Care Home)
Birth Center
Group Prenatal Care
Maternity Care Home
Total
Number of Live Births by Estimated Gestational Birth (EGA)
N 125 2115 1140 2617 5872

Data Element N or
%
USA (Group Prenatal Care and
Maternity Care Home)
Birth Center
Group Prenatal Care
Maternity Care Home
Total
Preterm Births, <37 weeks EGA N 35 112 131 461 704
% 28 5.3 11.5 17.6 12.0
Non-Preterm Births, ≥37 weeks EGA N 88 1994 823 1945 4762
% 70.4 94.3 72.2 74.3 81.1
Missing N – – 186 211 406
% – – 16.3 8.1 6.9
Number of Live Births by Birth Weight N 125 2115 1140 2617 5872
Low Birth Weight, <2500 grams N 28 75 147 412 634
% 22.4 3.5 12.9 15.7 10.8
Not Low Birth Weight, ≥ 2500 grams N 99 1810 993 2019 4822
% 79.2 85.6 87.1 77.2 82.1
Missing N 0 240 13 197 450
% 0 11.3 1.1 7.5 7.7
166
Notes: Rows labeled with an “N” indicate the number of observations from which percentages have been calculated.Yellow cells label with a dash symbol indicate that between 0 and 11 responses had been received during the reporting period. Statistics were only calculated for items with at least 11 responses.
Table 7. Breastfeeding and Family Planning, through Quarter 1 2015
Data Element N or
%
USA (Group Prenatal Care and
Maternity Care Home)
Birth Center
Group Prenatal Care
Maternity Care Home
Total
Breastfeeding After Delivery from Postpartum Data
N 123 1533 1416 4000 6949
Yes % 39.8 86.4 64.7 61.5 67.7
No % 27.6 7.4 9.5 25.6 18.3
Prefer not to answer % 0 0.7 1.8 0.5 0.8
Missing % 32.5 5.6 24.0 12.3 13.2
Women Who Breastfed As a Percentage of Women Who Planned to Breastfeed
% 97.5 100.2 97.4 100.7 99.9
Had Birth Control Counseling After Delivery N 123 1533 1416 4000 6949
Yes % 61.8 71.6 60.8 69.7 68.3
No % 4.1 19.4 12.3 15.2 15.5
Unsure % 0.8 2.8 2.4 1.8 2.1
Missing % 33.3 6.2 24.5 13.3 14.0
Note: Rows labeled with an “N” indicate the number of observations from which percentages have been calculated.
TECHNICAL ASSISTANCE
In March 2015, the evaluation team spoke with officials from the Alabama Medicaid Agency and the
Alabama Department of Public Health (AHPH) to learn about the state’s willingness to and process for
releasing state Medicaid and birth certificate data (respectively) to the Urban Institute for the impact
analysis of the Strong Start evaluation. State officials were receptive to supporting the evaluation, but
said that they would prefer having the Urban Institute will link the Medicaid and birth certificate data. In
June 2015, the evaluation team received approval from the Alabama Medicaid Agency. A data request

167
application was submitted to ADPH in April 2015, and we are currently awaiting approval from ADPH.
The team hopes to begin receiving data in late 2015.

168
University of Tennessee Health Sciences
Center
CASE STUDY
The University of Tennessee Health Science Center (UTHSC) operates two Strong Start group prenatal
care sites in Memphis, Tennessee. Hollywood Prenatal Care (formerly Hollywood Health Loop) is an
outpatient center in North Memphis. The Regional One Health Outpatient Center (formerly called Med
Outpatient) is co-located with the Regional One Medical Center and serves as the high-risk referral clinic
for pregnant women in the area. Strong Start enables the continuation and expansion of group prenatal
care at both sites, which have operated groups following CHI’s CenteringPregnancy model since 2005.
Highlights from the second round of case study data collection include:
In October of 2014, the UTHSC merged with the Regional One Medical Center and the University
of Tennessee Medical Group (the original Strong Start awardee) became defunct. Key
informants noted that there was a slight decrease in enrollment in the month following the
change in UTHSC’s hospital affiliation but enrollment has since picked up. Program staff and
providers remain the same as in evaluation Y1, though group care facilitators who co-lead
sessions with a midwife are now called “administrative coordinators.”
Along with a midwife, administrative coordinators co-lead an eight-session, group prenatal care
program that uses a modified version of the Centering curriculum. UTHSC operates six prenatal
care groups (which translates to three sessions per week). Each group has an average of 8-10
patients.
Participants must be Medicaid eligible and up to 25 weeks gestational age. No additional
preterm risk factors are required for Strong Start eligibility.
Each site employs a different enrollment approach. Hollywood Prenatal Care, where patients
tend to be of average risk, uses an opt-out approach whereby all patients are enrolled in group
care by default with the option of switching to traditional OB care if they are not satisfied with
the group setting. Regional One Health employs an opt-in approach, reportedly because of a
high proportion of high-risk patients who must attend specialist as well as prenatal care visits.
Patients with gestational diabetes, sickle cell anemia, and preeclampsia are not eligible for
Strong Start.
The Project Manager is charged with program coordination and program data entry following a
transition in program roles.

169
Two midwives were receiving facilitator training from CHI at the time of Y2 data collection; the
addition of these midwives to the Strong Start program staff will allow UTHSC increase the
number of groups in operation at the sites.
Key informants are pleased with Strong Start program outcomes and report increased retention
and a decrease in infant mortality in Shelby County, where UTHSC resides.
Efforts to increase enrollment (which was 413 ever enrolled in December 2014) are ongoing and
administrative coordinators currently engage in community outreach at health fairs in the
Memphis area.
PARTICIPANT-LEVEL PROCESS EVALUATION
The information presented below is based on data submitted from the four evaluation forms through
Quarter 1 2015. By March 2015, University Tennessee Health Science Center had Intake Forms for 34
percent of participants enrolled through Quarter 1 2015 (140 Intake Forms for 413 participants). In
addition, University Tennessee Health Science Center submitted 66 Third Trimester Surveys, 19
Postpartum Surveys, but no Exit Forms. The tables below present data collected on University
Tennessee Health Science participants with aggregated rates by approach for the purpose of
comparison.
Table 1. Enrollment and Forms Submitted, through Quarter 1 2015
Data Element N or
% UTHSC (Group Prenatal Care)
Birth Center
Group Prenatal Care
Maternity Care Home
Total
Newly Enrolled in Q1 2015 N 44 739 948 2638 4325
Total Ever Enrolled through Q1 2015 N 413 4739 5576 13232 23547
Number of Women Delivered through Q1 2015
N 56 2275 2755 6189 11219
Intake Forms Received through Q1 2015 N 140 2993 4401 11761 19155
Received through Q1 2015 as a percentage of the number of women ever enrolled
% 33.9 63.2 78.9 88.9 81.3
Third Trimester Surveys Received through Q1 2015
N 66 1876 2145 4683 8704
Received through Q1 2015 as a percentage of the number of women delivered
% 117.9 82.5 77.9 75.7 77.6
Postpartum Surveys Received through Q1 2015
N + 1533 1416 4000 6949
Received through Q1 2015 as a percentage of the number of women delivered
% + 67.4 51.4 64.6 61.9
Exit Forms Received through Q1 2015 N + 2133 1433 3103 6669
Received through Q1 2015 as a percentage of the number of women delivered
% + 93.8 52.0 50.1 59.4
Notes: Rows labeled with an “N” indicate the number of observations from which percentages have been calculated. Gray cells labeled with a plus symbol indicate that fewer than 25 forms had been received during the reporting period. Statistics were calculated only if there were at least 25 forms received.

170
Table 2. Sociodemographic Risk Factors, through Quarter 1 2015
Data Element N or
% UTHSC (Group Prenatal Care)
Birth Center
Group Prenatal Care
Maternity Care Home
Total
Mother’s Age at Intake N 140 2993 4401 11761 19155
Less than 18 years of age % 0 3.4 6.7 5.8 5.6
18 through 34 years of age % 0 86.1 75.0 81.4 80.7
35 years and older % 0 6.2 4.9 6.0 5.8
Missing % 100 4.3 13.4 6.8 7.9
Race and Ethnicity N 140 2993 4401 11761 19155
Hispanic % 1.4 25.7 39.2 22.9 27.1
Non-Hispanic white % 2.1 53.3 13.7 26.2 27.6
Non-Hispanic black % 78.6 14.8 39.2 46.3 39.8
Non-Hispanic Asian % 0 1.1 1.2 1.2 1.2
Non-Hispanic other % 0 0.6 1.6 0.7 0.9
Non-Hispanic multiple race % 0 3.6 2.3 1.2 1.8
Missing % 17.9 0.9 2.8 1.5 1.7
Employed at Intake N 140 2993 4401 11761 19155
Yes % 21.4 39.7 34.6 38.8 38.0
No % 57.1 59.1 60.9 60.0 60.0
Missing % 21.4 1.2 4.5 1.2 2.0
Education Level at Intake N 140 2993 4401 11761 19155
Less than high school % 16.4 14.3 23.7 24.5 22.7
High school graduate or GED % 46.4 52.3 46.2 52.0 50.7
Bachelor’s degree % 0 10.1 3.1 2.5 3.9
Other college degree(s) % 2.1 12.7 7.2 6.0 7.3
Missing % 35.0 10.7 19.8 15.0 15.4
Relationship Status at Intake N 140 2993 4401 11761 19155
Married, living with spouse % 5 40.7 18.6 17.2 21.2
Married, not living with spouse % 0.7 1.7 2.1 1.9 1.9
Living with a partner % 10 32.2 31.3 30.6 31.0
In a relationship but not living together % 23.6 12.9 24.6 30.5 26.4
Not in a relationship right now % 10.7 11.1 17.0 17.8 16.6
Missing % 50.0 1.3 6.4 2.0 2.9
Smokes Cigarettes at Intake N 140 2993 4401 11761 19155
Yes % 2.9 10.1 7.8 14.1 12
No % 53.6 77.1 71.7 77.8 76.3
Missing % 43.6 12.9 20.4 8.1 11.7
Food Insecure at Intake N 140 2993 4401 11761 19155
Yes % 6.4 18.1 18.5 16.1 16.9
No % 39.3 76.9 61.4 76.2 72.9
Missing*
% 54.3 5.0 20.0 7.7 10.1
Exhibiting Depressive Symptoms at Intake** N 140 2993 4401 11761 19155
Yes % 12.1 21.8 25.2 23.4 23.5
No % 31.4 69.3 57.0 69.3 66.4
Missing* % 56.4 9.0 17.9 7.3 10.0
Have Experienced Intimate Partner Violence in a Relationship***
N 140 2993 4401 11761 19155
Yes % 8.6 20.6 17.1 19.0 18.8

171
Data Element N or
% UTHSC (Group Prenatal Care)
Birth Center
Group Prenatal Care
Maternity Care Home
Total
No % 44.3 77.2 68.4 78.5 76.0
Missing* % 47.1 2.1 14.5 2.4 5.1
Notes: Cells that contain one asterisk indicate that the ‘Missing’ category includes respondents who did not answer all of the items required to calculate this measure. Cells that contain two asterisks indicate that this is as measured by a shortened version of the CES-D. Cells that contain three asterisks indicate that this is as measured by the Slapped, Threatened, and Throw (STaT) screener. Rows labeled with an “N” indicate the number of observations from which percentages have been calculated.
Table 3. Medical Risk Factors Prior to Current Pregnancy, through Quarter 1 2015
Data Element N or
% UTHSC (Group Prenatal Care)
Birth Center
Group Prenatal Care
Maternity Care Home
Total
Inter-Pregnancy Interval with Current Pregnancy Since Last Birth
N + 1127 700 1914 3741
<18 months % + 24.3 18.0 19.5 20.7
≥18 months % + 39.8 48.3 51.9 47.6
Missing % + 35.9 33.7 28.6 31.8
Previous Preterm Birth(s) Between 20 and 36 weeks, 6 days EGA
N + 1127 700 1914 3741
Yes % + 10.7 11.4 18.9 15.0
No % + 89.3 63.9 63.2 71.2
Not Known % + 0 18.6 14.9 11.1
Missing % + 0 6.1 3.0 2.7
Previous Birth(s) Less than 2,500 grams N + 1127 700 1914 3741
Yes % + 1.9 8.6 14.8 9.7
No % + 95.8 60.4 61.7 71.7
Not Known % + 0 24.7 19.2 14.5
Missing % + 2.3 6.3 4.3 4.1
Pre-Pregnancy Diagnosis of Type I Diabetes N + 2133 1433 3103 6669
Yes % + 0.5 1.3 1.5 1.1
No % + 99.5 74.2 84.4 87
Not Known % + 0 7.7 11.1 6.8
Missing % + 0 16.7 3.1 5.0
Pre-Pregnancy Diagnosis of Type II Diabetes N + 2133 1433 3103 6669
Yes % + 0 2.6 1.9 1.5
No % + 5.0 72.9 83.3 56.1
Not Known % + 0 7.7 11.1 6.8
Missing % + 94.9 16.7 3.7 35.7
Pre-Pregnancy Diagnosis of Hypertension N + 2133 1433 3103 6669
Yes % + 0.5 6.0 9.5 5.9
No % + 99.5 66.7 77.4 82.2
Not Known % + 0 7.6 10.2 6.4
Missing % + 0 19.7 2.9 5.6
Notes: Rows labeled with an “N” indicate the number of observations from which percentages have been calculated. Gray cells labeled with a plus symbol indicate that fewer than 25 forms had been received during the reporting period. Statistics were calculated only if there were at least 25 forms received.

172
Table 4. Medical Risk Factors during the Current Pregnancy, through Quarter 1 2015
Data Element N or
% UTHSC (Group Prenatal Care)
Birth Center
Group Prenatal Care
Maternity Care Home
Total
Gestational Diabetes N + 2133 1433 3103 6669
Yes % + 2.7 4.2 5.3 4.2
No % + 97.3 65.4 76 80.6
Not Known % + 0 10.3 15.9 9.6
Missing % + 0 20.1 2.8 5.6
Pregnancy-Related Hypertension N + 2133 1433 3103 6669
Yes % + 1.3 7.8 7.7 5.7
No % + 98.7 62.6 74.8 79.8
Not Known % + 0 9.4 14.6 8.8
Missing % + 0 20.2 2.9 5.7
Notes: Rows labeled with an “N” indicate the number of observations from which percentages have been calculated. Gray cells labeled with a plus symbol indicate that fewer than 25 forms had been received during the reporting period. Statistics were calculated only if there were at least 25 forms received.
Table 5. Birth and Delivery Methods, through Quarter 1 2015
Data Element N or
% UTHSC (Group Prenatal Care)
Birth Center
Group Prenatal Care
Maternity Care Home
Total
Total Number of Exit Forms with Valid Birth Information
N + 2125 1103 2740 5968
Number of Babies Born N + 2128 1125 2801 6054
Induction of Labor Excluding Planned C-Sections
N + 2133 1297 2826 6256
Yes % + 14.4 23.8 17.2 17.6
No % + 85.3 42.8 35.5 54.0
Not known % + 0 10.6 37.8 19.3
Missing % + 0.3 22.7 9.6 9.1
Delivery Method from Exit Data N + 2133 1433 3103 6669
Vaginal delivery % + 87.3 49.1 52.0 62.7
C-Section % + 12.4 24.3 29.6 23.0
Vaginal and C-Section % + 0 0 0 0
Missing % + 0.2 26.7 18.3 14.3
Women Who Had a Vaginal Birth as a Percentage of Women Who Planned to Deliver Vaginally
% + 90.9 80.2 81.6 85.4
VBAC31
N + 90 161 418 669
Yes % + 30.0 19.9 13.9 17.5
Repeat C-Section N + 90 161 418 669
Yes % + 70.0 80.1 86.1 82.5
Scheduled C-Section N + 265 348 920 1533
Yes % + 0 39.1 29.2 26.4
31 The denominator for VBAC and repeat C-section are calculated by adding the total respondents in both categories since we cannot confidently know who else had a previous C-section.
Notes: Rows labeled with an “N” indicate the number of observations from which percentages have been calculated. Gray cells labeled with a plus symbol indicate that fewer than 25 forms had been received during the reporting period. Statistics were calculated only if there were at least 25 forms received.
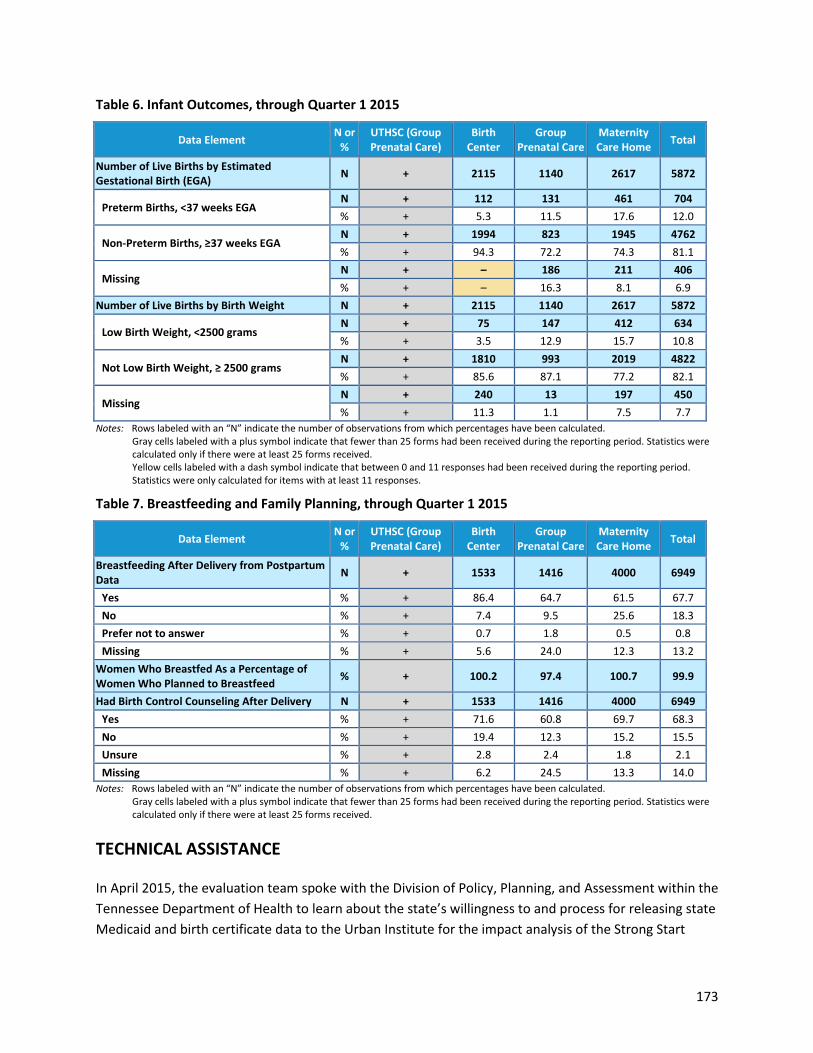
173
Table 6. Infant Outcomes, through Quarter 1 2015
Data Element N or
% UTHSC (Group Prenatal Care)
Birth Center
Group Prenatal Care
Maternity Care Home
Total
Number of Live Births by Estimated Gestational Birth (EGA)
N + 2115 1140 2617 5872
Preterm Births, <37 weeks EGA N + 112 131 461 704
% + 5.3 11.5 17.6 12.0
Non-Preterm Births, ≥37 weeks EGA N + 1994 823 1945 4762
% + 94.3 72.2 74.3 81.1
Missing N + – 186 211 406
% + – 16.3 8.1 6.9
Number of Live Births by Birth Weight N + 2115 1140 2617 5872
Low Birth Weight, <2500 grams N + 75 147 412 634
% + 3.5 12.9 15.7 10.8
Not Low Birth Weight, ≥ 2500 grams N + 1810 993 2019 4822
% + 85.6 87.1 77.2 82.1
Missing N + 240 13 197 450
% + 11.3 1.1 7.5 7.7
Notes: Rows labeled with an “N” indicate the number of observations from which percentages have been calculated. Gray cells labeled with a plus symbol indicate that fewer than 25 forms had been received during the reporting period. Statistics were calculated only if there were at least 25 forms received. Yellow cells labeled with a dash symbol indicate that between 0 and 11 responses had been received during the reporting period. Statistics were only calculated for items with at least 11 responses.
Table 7. Breastfeeding and Family Planning, through Quarter 1 2015
Data Element N or
% UTHSC (Group Prenatal Care)
Birth Center
Group Prenatal Care
Maternity Care Home
Total
Breastfeeding After Delivery from Postpartum Data
N + 1533 1416 4000 6949
Yes % + 86.4 64.7 61.5 67.7
No % + 7.4 9.5 25.6 18.3
Prefer not to answer % + 0.7 1.8 0.5 0.8
Missing % + 5.6 24.0 12.3 13.2
Women Who Breastfed As a Percentage of Women Who Planned to Breastfeed
% + 100.2 97.4 100.7 99.9
Had Birth Control Counseling After Delivery N + 1533 1416 4000 6949
Yes % + 71.6 60.8 69.7 68.3
No % + 19.4 12.3 15.2 15.5
Unsure % + 2.8 2.4 1.8 2.1
Missing % + 6.2 24.5 13.3 14.0
Notes: Rows labeled with an “N” indicate the number of observations from which percentages have been calculated. Gray cells labeled with a plus symbol indicate that fewer than 25 forms had been received during the reporting period. Statistics were calculated only if there were at least 25 forms received.
TECHNICAL ASSISTANCE
In April 2015, the evaluation team spoke with the Division of Policy, Planning, and Assessment within the
Tennessee Department of Health to learn about the state’s willingness to and process for releasing state
Medicaid and birth certificate data to the Urban Institute for the impact analysis of the Strong Start

174
evaluation. State officials were very receptive to supporting the evaluation, and the Office of Vital
Records said that it would be able to link Medicaid and birth certificate data on our behalf. The
evaluation team submitted a data request form to the Office of Vital Records in June 2015, and is in the
process of submitting materials to the state’s Institutional Review Board (IRB). Additionally, the
evaluation team is in the process of completing the application for Medicaid and CHIP data, which are
overseen by TennCare.

175
Virginia Commonwealth University
CASE STUDY
Virginia Commonwealth University (VCU) is a university health system that has implemented group
prenatal care using the CenteringPregnancy model under Strong Start. At the time of evaluation Y2 data
collection, VCU was operating four of its original five Strong Start sites in central and northern Virginia
and had enrolled 546 women in Strong Start. VCU reports that since evaluation Y1 data collection, the
program has progressed and been strengthened by changes in both outreach and services offered.
Highlights from the second round of case study data collection include:
Because of challenges associated with recruitment and data collection, the Shenandoah site
withdrew from Strong Start. At the time of the Y2 data collection, the Manassas site had
substantially reduced staffing and the size of its group prenatal care program because of
reimbursement and network inclusion issues with the Medicaid managed care organizations
(MCOs) in which their patients were enrolled. The awardee reported on June 16 (subsequent to
Y2 data collection) that the Manassas site had ceased all operations as a result of these issues
with the MCOs.
VCU has increased staffing and services to provide more care coordination, referrals to and
coordination with social services, and patient tracking.
Enrollment continues to be a challenge, though it has increased considerably as noted above. To
increase enrollment, VCU partners with the state Medicaid agency, the Department of Medical
Assistance Services (DMAS), to send information to Medicaid-enrolled pregnant women,
encouraging them to participate in Strong Start. Additionally, VCU works with other programs
and departments such as Baby Basics, the MCV trauma department’s “Project Empower”
initiative (which focuses on addressing the needs of women who have experienced intimate
partner violence), and migrant care centers to direct patients to group prenatal care sites.
VCU’s Strong Start sites now enroll all eligible pregnant Medicaid patients in Strong Start (i.e., no
additional preterm risk factor is required). Enhanced services available to all Strong Start
women, including some who present for care too late to be included in a group cohort, but are
enrolled in Strong Start nonetheless, include dental services, care and social service
coordination, and referrals to Healthy Families (a home visiting organization).
Implementation challenges include retention (although retention appears to have improved
compared to Y1), facilitator “burn-out,” maintenance of smooth clinic workflow with the group
prenatal care schedule, and workflow issues in patient charting.
Early data indicate that the incidence of preterm birth now ranges from 6 to 9 percent in the
VCU Strong Start sites, compared to a statewide average of 11 percent, which key informants

176
attributed to the implementation of Strong Start. Manassas (a midwifery practice) reported a
preterm delivery rate of 4.4 percent among Strong Start participants.
Key informants report that patient response to Centering in Strong Start at VCU is
overwhelmingly favorable and enthusiastic.
PARTICIPANT-LEVEL PROCESS EVALUATION
The information presented below is based on data submitted from the four evaluation forms through
Quarter 1 2015. By February 2015, Virginia Commonwealth University had Intake Forms for 89 percent
of participants enrolled through Quarter 1 2015 (507 Intake Forms for 567 participants). In addition,
Virginia Commonwealth University submitted 101 Third Trimester Surveys, 77 Postpartum Surveys, and
217 Exit Forms. The tables below present data collected on Virginia Commonwealth University’s
participants with aggregated rates by approach for the purpose of comparison.
Table 1. Enrollment and Forms Submitted, through Quarter 1 2015
Data Element N or
% VCU (Group
Prenatal Care) Birth
Center Group
Prenatal Care Maternity Care Home
Total
Newly Enrolled in Q1 2015 N 71 739 948 2638 4325
Total Ever Enrolled through Q1 2015 N 567 4739 5576 13232 23547
Number of Women Delivered through Q1 2015 N 259 2275 2755 6189 11219
Intake Forms Received through Q1 2015 N 507 2993 4401 11761 19155
Received through Q1 2015 as a percentage of the number of women ever enrolled
% 89.4 63.2 78.9 88.9 81.3
Third Trimester Surveys Received through Q1 2015
N 101 1876 2145 4683 8704
Received through Q1 2015 as a percentage of the number of women delivered
% 39.0 82.5 77.9 75.7 77.6
Postpartum Surveys Received through Q1 2015 N 77 1533 1416 4000 6949
Received through Q1 2015 as a percentage of the number of women delivered
% 29.7 67.4 51.4 64.6 61.9
Exit Forms Received through Q1 2015 N 217 2133 1433 3103 6669
Received through Q1 2015 as a percentage of the number of women delivered
% 83.8 93.8 52.0 50.1 59.4
Note: Rows labeled with an “N” indicate the number of observations from which percentages have been calculated.
Table 2. Sociodemographic Risk Factors, through Quarter 1 2015
Data Element N or
% VCU (Group
Prenatal Care) Birth
Center Group
Prenatal Care Maternity Care Home
Total
Mother’s Age at Intake N 507 2993 4401 11761 19155
Less than 18 years of age % 5.5 3.4 6.7 5.8 5.6
18 through 34 years of age % 84.8 86.1 75.0 81.4 80.7
35 years and older % 4.9 6.2 4.9 6.0 5.8
Missing % 4.7 4.3 13.4 6.8 7.9
Race and Ethnicity N 507 2993 4401 11761 19155
Hispanic % 27.2 25.7 39.2 22.9 27.1
Non-Hispanic white % 18.5 53.3 13.7 26.2 27.6
Non-Hispanic black % 39.4 14.8 39.2 46.3 39.8

177
Data Element N or
% VCU (Group
Prenatal Care) Birth
Center Group
Prenatal Care Maternity Care Home
Total
Non-Hispanic Asian % 3.7 1.1 1.2 1.2 1.2
Non-Hispanic other % 0.6 0.6 1.6 0.7 0.9
Non-Hispanic multiple race % 3 3.6 2.3 1.2 1.8
Missing % 7.5 0.9 2.8 1.5 1.7
Employed at Intake N 507 2993 4401 11761 19155
Yes % 35.5 39.7 34.6 38.8 38.0
No % 43.2 59.1 60.9 60.0 60.0
Missing % 21.3 1.2 4.5 1.2 2.0
Education Level at Intake N 507 2993 4401 11761 19155
Less than high school % 16.8 14.3 23.7 24.5 22.7
High school graduate or GED % 37.5 52.3 46.2 52.0 50.7
Bachelor’s degree % 5.9 10.1 3.1 2.5 3.9
Other college degree(s) % 6.7 12.7 7.2 6.0 7.3
Missing % 33.1 10.7 19.8 15.0 15.4
Relationship Status at Intake N 507 2993 4401 11761 19155
Married, living with spouse % 18.9 40.7 18.6 17.2 21.2
Married, not living with spouse % 3.0 1.7 2.1 1.9 1.9
Living with a partner % 26.4 32.2 31.3 30.6 31.0
In a relationship but not living together % 19.7 12.9 24.6 30.5 26.4
Not in a relationship right now % 14.8 11.1 17 17.8 16.6
Missing % 17.2 1.3 6.4 2.0 2.9
Smokes Cigarettes at Intake N 507 2993 4401 11761 19155
Yes % 7.7 10.1 7.8 14.1 12
No % 22.1 77.1 71.7 77.8 76.3
Missing % 70.2 12.9 20.4 8.1 11.7
Food Insecure at Intake N 507 2993 4401 11761 19155
Yes % 20.3 18.1 18.5 16.1 16.9
No % 43.4 76.9 61.4 76.2 72.9
Missing*
% 36.3 5.0 20.0 7.7 10.1
Exhibiting Depressive Symptoms at Intake** N 507 2993 4401 11761 19155
Yes % 23.5 21.8 25.2 23.4 23.5
No % 47.9 69.3 57.0 69.3 66.4
Missing* % 28.6 9.0 17.9 7.3 10.0
Have Experienced Intimate Partner Violence in a Relationship***
N 507 2993 4401 11761 19155
Yes % 13.8 20.6 17.1 19.0 18.8
No % 55.8 77.2 68.4 78.5 76.0
Missing* % 30.4 2.1 14.5 2.4 5.1
Notes: Cells that contain one asterisk indicate that the ‘Missing’ category includes respondents who did not answer all of the items required to calculate this measure. Cells that contain two asterisks indicate that this is as measured by a shortened version of the CES-D. Cells that contain three asterisks indicate that this is as measured by the Slapped, Threatened, and Throw (STaT) screener. Rows labeled with an “N” indicate the number of observations from which percentages have been calculated.

178
Table 3. Medical Risk Factors Prior to Current Pregnancy, through Quarter 1 2015
Data Element N or
% VCU (Group
Prenatal Care) Birth
Center Group
Prenatal Care Maternity Care Home
Total
Inter-Pregnancy Interval with Current Pregnancy Since Last Birth
N 80 1127 700 1914 3741
<18 months % 13.7 24.3 18.0 19.5 20.7
≥18 months % 48.8 39.8 48.3 51.9 47.6
Missing % 37.5 35.9 33.7 28.6 31.8
Previous Preterm Birth(s) Between 20 and 36 weeks, 6 days EGA
N 80 1127 700 1914 3741
Yes % 15.0 10.7 11.4 18.9 15.0
No % 71.2 89.3 63.9 63.2 71.2
Not Known % 0 0 18.6 14.9 11.1
Missing % 13.8 0 6.1 3.0 2.7
Previous Birth(s) Less than 2,500 grams N 80 1127 700 1914 3741
Yes % 6.2 1.9 8.6 14.8 9.7
No % 78.8 95.8 60.4 61.7 71.7
Not Known % 0 0 24.7 19.2 14.5
Missing % 15.0 2.3 6.3 4.3 4.1
Pre-Pregnancy Diagnosis of Type I Diabetes N 217 2133 1433 3103 6669
Yes % 0 0.5 1.3 1.5 1.1
No % 20.3 99.5 74.2 84.4 87
Not Known % 0 0 7.7 11.1 6.8
Missing % 79.7 0 16.7 3.1 5
Pre-Pregnancy Diagnosis of Type II Diabetes N 217 2133 1433 3103 6669
Yes % 0 0 2.6 1.9 1.5
No % 20.3 5.0 72.9 83.3 56.1
Not Known % 0 0 7.7 11.1 6.8
Missing % 79.7 94.9 16.7 3.7 35.7
Pre-Pregnancy Diagnosis of Hypertension N 217 2133 1433 3103 6669
Yes % 0.5 0.5 6.0 9.5 5.9
No % 0 99.5 66.7 77.4 82.2
Not Known % 0 0 7.6 10.2 6.4
Missing % 99.5 0 19.7 2.9 5.6
Note: Rows labeled with an “N” indicate the number of observations from which percentages have been calculated.
Table 4. Medical Risk Factors during the Current Pregnancy, through Quarter 2015
Data Element N or
% VCU (Group
Prenatal Care) Birth
Center Group
Prenatal Care Maternity Care Home
Total
Gestational Diabetes N 217 2133 1433 3103 6669
Yes % 0.5 2.7 4.2 5.3 4.2
No % 1.8 97.3 65.4 76.0 80.6
Not Known % 0 0 10.3 15.9 9.6
Missing % 97.7 0 20.1 2.8 5.6
Pregnancy-Related Hypertension N 217 2133 1433 3103 6669
Yes % 0 1.3 7.8 7.7 5.7
No % 2.3 98.7 62.6 74.8 79.8
Not Known % 0 0 9.4 14.6 8.8

179
Data Element N or
% VCU (Group
Prenatal Care) Birth
Center Group
Prenatal Care Maternity Care Home
Total
Missing % 97.7 0 20.2 2.9 5.7
Note: Rows labeled with an “N” indicate the number of observations from which percentages have been calculated.
Table 5. Birth and Delivery Methods, through Quarter 1 2015
Data Element N or
% VCU (Group
Prenatal Care) Birth
Center Group
Prenatal Care Maternity Care Home
Total
Total Number of Exit Forms with Valid Birth Information
N 37 2125 1103 2740 5968
Number of Babies Born N 37 2128 1125 2801 6054
Induction of Labor Excluding Planned C-Sections
N 217 2133 1297 2826 6256
Yes % 1.8 14.4 23.8 17.2 17.6
No % 0.5 85.3 42.8 35.5 54.0
Not known % 0 0 10.6 37.8 19.3
Missing % 97.7 0.3 22.7 9.6 9.1
Delivery Method from Exit Data N 217 2133 1433 3103 6669
Vaginal delivery % 1.8 87.3 49.1 52.0 62.7
C-Section % 0.5 12.4 24.3 29.6 23.0
Vaginal and C-Section % 0 0 0 0 0
Missing % 97.7 0.2 26.7 18.3 14.3
Women Who Had a Vaginal Birth as a Percentage of Women Who Planned to Deliver Vaginally
% 66.7 90.9 80.2 81.6 85.4
VBAC32
N – 90 161 418 669
Yes % – 30.0 19.9 13.9 17.5
Repeat C-Section N – 90 161 418 669
Yes % – 70.0 80.1 86.1 82.5
Scheduled C-Section N – 265 348 920 1533
Yes % – 0 39.1 29.2 26.4
32 The denominator for VBAC and repeat C-section are calculated by adding the total respondents in both categories since we cannot confidently know who else had a previous C-section.
Notes: Rows labeled with an “N” indicate the number of observations from which percentages have been calculated. Yellow cells labeled with a dash symbol indicate that between 0 and 11 responses had been received during the reporting period. Statistics were only calculated for items with at least 11 responses.
Table 6. Infant Outcomes, through Quarter 1 2015
Data Element N or
% VCU (Group
Prenatal Care) Birth
Center Group
Prenatal Care Maternity Care Home
Total
Number of Live Births by Estimated Gestational Birth (EGA)
N 88 2115 1140 2617 5872
Preterm Births, <37 weeks EGA N – 112 131 461 704
% – 5.3 11.5 17.6 12.0
Non-Preterm Births, ≥37 weeks EGA N 33 1994 823 1945 4762
% 37.5 94.3 72.2 74.3 81.1
Missing N 49 – 186 211 406
% 55.7 – 16.3 8.1 6.9
Number of Live Births by Birth Weight N 88 2115 1140 2617 5872

180
Data Element N or
% VCU (Group
Prenatal Care) Birth
Center Group
Prenatal Care Maternity Care Home
Total
Low Birth Weight, <2500 grams N 11 75 147 412 634
% 12.5 3.5 12.9 15.7 10.8
Not Low Birth Weight, ≥ 2500 grams N 74 1810 993 2019 4822
% 84.1 85.6 87.1 77.2 82.1
Missing N – 240 13 197 450
% – 11.3 1.1 7.5 7.7
Notes: Rows labeled with an “N” indicate the number of observations from which percentages have been calculated. Yellow cells labeled with a dash symbol indicate that between 0 and 11 responses had been received during the reporting period. Statistics were only calculated for items with at least 11 responses.
Table 7. Breastfeeding and Family Planning, through Quarter 1 2015
Data Element N or
% VCU (Group
Prenatal Care) Birth
Center Group
Prenatal Care Maternity Care Home
Total
Breastfeeding After Delivery from Postpartum Data
N 77 1533 1416 4000 6949
Yes % 66.2 86.4 64.7 61.5 67.7
No % 3.9 7.4 9.5 25.6 18.3
Prefer not to answer % 0 0.7 1.8 0.5 0.8
Missing % 29.9 5.6 24.0 12.3 13.2
Women Who Breastfed As a Percentage of Women Who Planned to Breastfeed
% 103.2 100.2 97.4 100.7 99.9
Had Birth Control Counseling After Delivery N 77 1533 1416 4000 6949
Yes % 59.7 71.6 60.8 69.7 68.3
No % 10.4 19.4 12.3 15.2 15.5
Unsure % 2.6 2.8 2.4 1.8 2.1
Missing % 27.3 6.2 24.5 13.3 14
Note: Rows labeled with an “N” indicate the number of observations from which percentages have been calculated.
TECHNICAL ASSISTANCE
In May 2015, the evaluation team spoke with the Strong Start awardee in Virginia, Virginia
Commonwealth University (VCU). VCU was asked by the Virginia Department of Medical Assistance
Services (DMAS) and the Virginia Office of Vital Records to coordinate our data request for the state’s
release of Medicaid and birth certificate data to the Urban Institute. The state, with assistance from
VCU, is receptive to supporting the evaluation, and DMAS staff plan to link the Medicaid and birth
certificate data for our impact analysis. VCU has also requested Medicaid and birth certificate data from
the state to conduct its own evaluations of its Strong Start program and is exploring whether our data
request can fall under its current agreement with the state or if a separate data sharing agreement is
required. The evaluation team hopes to begin receiving data in early 2016, as final birth certificate data
for 2014 births will not be available until that time.