Embed Size (px)
Citation preview

A N N UA L R E P O R T 2015A N N UA L R E P O R T 2015
StrongFOUNDATIONS
i
For
per
sona
l use
onl
y

2 Our Vision, Our Values
4 Strong Performance
6 2015 Highlights
8 Strong Leadership
10 Strong Strategic Outlook
14 Strong Financial Management
16 Strong Executive Team
18 Strong Production
22 Strong Gas Growth
28 Strong Exploration Programme
32 Strong Commitment to Social Responsibility
36 Strong Organisational Capability
40 2015 Reserves and Resources
46 Licence Interests
48 Strong Governance
54 Financial Report Contents
55 Directors’ Report
88 Financial Statements
124 Shareholder Information
128 Ten-year Summary
130 Glossary
132 Corporate Directory
IBC About Oil Search
For
per
sona
l use
onl
y

… the key toFUTURE GROWTH
Oil Search’s history is deeply rooted in Papua New Guinea (PNG), where the
Company has operated since 1929. Over this time, Oil Search has developed strong
and genuine relationships with the PNG Government, regulators, landowners
and communities and an unrivalled understanding of how to operate successfully
and safely in PNG. The Company’s long-standing commitment to social responsibility
and sustainable development, which is fundamental to maintaining a stable
operating environment in PNG, has been instrumental in its success.
Oil Search remains committed to PNG and intends to leverage its strong foundations
to unlock the country’s full oil and gas potential, ensuring continued delivery of
long-term value to all stakeholders.
55 Directors’ Report
88 Financial Statements
124 Shareholder Information
128 Ten-year Summary
130 Glossary
132 Corporate Directory
IBC About Oil Search
1OIL SEARCH Annual Report 2015
For
per
sona
l use
onl
y

To gen erate top q u ar t i le r e t ur n s
for sh ar ehol der s thr ough exc el len c e
in s o c ia l ly r e sp on sible oi l an d
ga s explorat ion an d pr o duc t ion
O U R V i s i o n
2
For
per
sona
l use
onl
y

O U R V a l u e s
Responsible
Respectintegrity
Diversity
Excellence
Caring
Passion
3OIL SEARCH Annual Report 2015
For
per
sona
l use
onl
y

Strong PERFORMANCE
During 2015, Oil Search delivered a strong performance, both operationally and financially.
Production increased 52% to 29.3 million barrels of oil equivalent (mmboe), while core
profit declined 25%, despite nearly a 50% fall in the oil price compared to 2014.
Oil Search’s production assets have low operating costs and sustaining capital requirements
and generate positive cash flows even at current oil prices. In addition, the Company has
a strong balance sheet and sufficient liquidity to fund its globally-competitive gas growth
projects, which have the potential to deliver sector-leading returns to shareholders.
In 2015, Oil Search implemented a number of initiatives to recalibrate the business, aimed
at ensuring the Company can continue to deliver superior returns to its shareholders,
in a socially responsible way, in a ‘lower for longer’ oil price environment. This programme
to drive further efficiencies and innovation will continue in 2016.
4
in a challenging environment
For
per
sona
l use
onl
y

XX
5OIL SEARCH Annual Report 2015
For
per
sona
l use
onl
y
2 0 1 5 H i g h l i g h t s
29.3 M M BOE
US$360 M I LLION
T o t a l p r o d u c t i o n
C o r e p r o f i t
6
For
per
sona
l use
onl
y

T o t a l p r o d u c t i o n ( M M B O E )
O p e r a t i n g c a s h f l o w ( U S $ M I L L I O N )
A v e r a g e r e a l i s e d o i l
a n d c o n d e n s a t e p r i c e ( U S $ P E R B A R R E L )
D i v i d e n d s p e r s h a r e ( U S C E N T S )
2015 BUSI N E SS OP T I M ISAT ION
PROGR A M M E
i n i t i a t i v e s w e r e i m p l e m e n t e d
t o a c h i e v e t h e a p p r o p r i a t e
o r g a n i s a t i o n a l a n d
r e s o u r c i n g s t r u c t u r e
t o d e l i v e r t h e C o m p a n y ’ s
c o r e p r i o r i t i e s i n a l o w
o i l p r i c e e n v i r o n m e n t
52% UP
4%
47%
42%
S a f e t y r e m a i n s a k e y
p r i o r i t y . T h e T R i R p e r
m i l l i o n h o u r s w o r k e d
i n 2 0 1 5 w a s 1 . 9 1 ,
d o w n f r o m 1 . 9 7 i n t h e
p r e v i o u s y e a r , d e s p i t e
m a n y w o r k p l a c e c h a n g e s
TOTA L R ECOR DA BL E I NCI DE NT R AT E (T R I R)
11 12 13 14 15 11 12 13 14 15
11 12 13 14 15 11 12 13 14 15 11 12 13 14 15
6.7
4 4 4
992
367
196
386
13.9
17.4 18
.8
12.2
116
114
111
98
6.4
6.7
19.3
51
29.
310
953
10.1
11 12 13 14 15
236
153 20
6
483
36
0
410
11 12 13 14 15 11 12 13 14 15
11 12 13 14 15 11 12 13 14 15 11 12 13 14 15
6.7
4 4 4
992
367
196
386
13.9
17.4 18
.8
12.2
116
114
111
98
6.4
6.7
19.3
51
29.
310
953
10.1
11 12 13 14 15
236
153 20
6
483
36
0
410
11 12 13 14 15 11 12 13 14 15
11 12 13 14 15 11 12 13 14 15 11 12 13 14 15
6.7
4 4 4
992
367
196
386
13.9
17.4 18
.8
12.2
116
114
111
98
6.4
6.7
19.3
51
29.
310
953
10.1
11 12 13 14 15
236
153 20
6
483
36
0
410
11 12 13 14 15 11 12 13 14 15
11 12 13 14 15 11 12 13 14 15 11 12 13 14 15
6.7
4 4 4
992
367
196
386
13.9
17.4 18
.8
12.2
116
114
111
98
6.4
6.7
19.3
51
29.
310
953
10.1
11 12 13 14 15
236
153 20
6
483
36
0
410
11 12 13 14 15 11 12 13 14 15
11 12 13 14 15 11 12 13 14 15 11 12 13 14 15
6.7
4 4 4
992
367
196
386
13.9
17.4 18
.8
12.2
116
114
111
98
6.4
6.7
19.3
51
29.
310
953
10.1
11 12 13 14 15
236
153 20
6
483
36
0
410
11 12 13 14 15 11 12 13 14 15
11 12 13 14 15 11 12 13 14 15 11 12 13 14 15
6.7
4 4 4
992
367
196
386
13.9
17.4 18
.8
12.2
116
114
111
98
6.4
6.7
19.3
51
29.
310
953
10.1
11 12 13 14 15
236
153 20
6
483
36
0
410
DOWN
DOWN
PAYOUT RATiO
C o r e p r o f i t
b e f o r e i m p a i r m e n t s ( U S $ M I L L I O N )
U n i t p r o d u c t i o n c o s t( U S $ P E R B A R R E L O F
O I L E Q U I V A L E N T )
25% 17% DOWNDOWN
4¢ SPECIAL
O i l S e a r c h ’ s o n e y e a r
T S R f e l l 1 2 % , r e f l e c t i n g
r e c e n t g l o b a l o i l p r i c e
w e a k n e s s . H o w e v e r
o v e r t h e p a s t 1 0 y e a r s ,
t h e C o m p a n y h a s
d e l i v e r e d a T S R o f 1 1 2 % ,
o u t p e r f o r m i n g t h e
A S X 2 0 0 a n d A S X 2 0 0
E n e r g y i n d i c e s
TOTA L SH A R E HOL DE R R ET U R N (TSR)
7OIL SEARCH Annual Report 2015
For
per
sona
l use
onl
y

2015 was one of the most challenging years in
Oil Search’s history, with the average global oil
price nearly 50% lower than in 2014. However,
it was also one of the most successful for the
Company. Production reached an all-time high
of 29.3 mmboe, an increase of 52% compared
to 2014, driven by an excellent performance from
the PNG LNG Project and a solid contribution
from the Oil Search-operated PNG oil and gas
fields. While impacted by lower oil and gas prices,
the Company delivered a core profit of US$360
million before non-cash impairments, a strong
result given the oil price environment.
L E A D E R S H I P Strong
L E T T E R F R O M T H E C H A I R M A N
Consistent with our dividend policy to pay out between 35% and 50% of core profit to shareholders, an ordinary dividend of 10 US cents per share was paid for 2015, compared to a total of 14 US cents per share for 2014 (comprising an ordinary dividend of 10 US cents per share and a special dividend of four US cents per share). The Board continues to believe that a proportional dividend policy is appropriate in this time of volatile oil prices, enabling sufficient cash to be retained to invest in high-returning growth projects while still providing a return to shareholders. Given our financial strength, with US$910 million in cash and liquidity of close to US$1.7 billion at year end, our dividend reinvestment plan remains suspended.
The outlook for oil and LNG prices remains uncertain. With far fewer new oil and gas projects sanctioned in 2015 compared to previous years, we believe that global oil markets, which are currently oversupplied, will progressively rebalance as conventional oil production starts to decline. This should result in a gradual recovery in oil prices over the next few years. However, we expect, and are planning for, sustained low oil prices during 2016.
We implemented a number of organisational changes in 2015 to promote improved productivity and ensure the Company’s cost competitiveness.
8
For
per
sona
l use
onl
y

Production costs in 2015 were US$10.08 per barrel of oil equivalent (boe), down from US$12.21 per boe in 2014, despite several one-off costs associated with restructuring. We expect a further reduction in 2016, as the benefits of the changes made in 2015 are realised and additional initiatives to reduce costs and improve efficiency and productivity are undertaken. Oil Search’s breakeven oil price, after cash operating costs, sustaining capital and debt servicing, is approximately US$30 per barrel, highlighting the Company’s resilience to low oil prices. The strong liquidity position provides a further buffer in a low oil price environment.
With so many changes occurring within the Company, a key concern for the management team and Board in 2015 was, that our safety performance would suffer. Pleasingly, the Company achieved a slight improvement in Total Recordable Incidents and had no Lost Time Injuries, which is a credit to all Oil Search employees and reflects the strong safety culture embedded within the Company.
Looking to the future, we are very fortunate to have interests in two major LNG growth projects – the potential expansion of the PNG LNG Project and the proposed Papua LNG Project. Both are assessed by independent experts to be in the lowest quartile of development costs globally and
can generate significant shareholder value, even on more modest long-term oil and gas price expectations. Cash generated from our low cost producing assets and our strong balance sheet allow us to continue to invest in these high-returning growth opportunities, while many other proposed developments globally are being delayed or cancelled. The excellent performance of the PNG LNG Project, which is consistently and safely operating above nameplate capacity, has put PNG on the map as a reliable supplier of high heating value gas, located close to the key Asian markets. PNG LNG’s success provides us with confidence that, when these projects are ready for sanction, there will be demand for our gas from premium Asian buyers, despite the current oversupply of LNG.
During 2015, Woodside Petroleum submitted a highly conditional, scrip only proposal to the Oil Search Board to merge the two companies. Following extensive consultation with shareholders and a detailed assessment of the terms, the Oil Search Board rejected the proposal on the basis that it materially undervalued the Company and brought few, if any, benefits to Oil Search shareholders. Woodside subsequently withdrew the proposal. While the Company is in a strong position, operationally and financially, the Oil Search Board is open to any proposal
that reflects compelling value for Oil Search shareholders, which clearly this offer did not. The Board remains committed to acting in the best interests of shareholders at all times.
Strong leadership from the Oil Search Board, our Managing Director and the executive team was instrumental in driving the good performance achieved in 2015, despite it being a difficult year. I would like to thank all our employees for their contributions and my Board colleagues for their support and guidance. We look forward to 2016 with a degree of optimism, tempered by the recognition that the immediate and longer term market outlook will present both risk and opportunity. Our Company is well placed to meet the challenge.
Richard LeeCHAIRMAN
L E T T E R F R O M T H E C H A I R M A N
9OIL SEARCH Annual Report 2015
For
per
sona
l use
onl
y

in light of sharply lower oil prices, in 2015 Oil Search reviewed the outcomes of the 2014 Strategic Review. The Company concluded that its core strategies remain appropriate and capable of generating significant value for stakeholders, even during a period of sustained low oil prices. The Company is committed, and has the financial capacity, to continue investing in its globally competitive LNG growth opportunities, through the present oil price cycle.
Peter BottenManaging Director
S T R A T E G I C O U T L O O K
Strong
In 2014, Oil Search undertook a major Strategic Review to prepare the Company for its next phase of growth. The Review concluded that shareholder returns would be maximised by the Company commercialising its existing gas resources in PNG. The Review also recognised the importance of maintaining Oil Search’s long-standing commitment to sustainable development, social responsibility and community relations.
In 2015, Oil Search carried out a careful re-examination of the results of the 2014 Strategic Review. It concluded that the core strategies remain the most appropriate way to deliver top quartile returns to shareholders.
A key component of Oil Search’s strategy to deliver long-term, high-value growth is the potential development of a third
train at the PNG LNG Project and the proposed new Papua LNG Project. Both developments are assessed by independent experts to be highly competitive relative to other proposed new LNG developments globally. Industry expert, Wood Mackenzie, ranks the projects in the lowest quartile for development costs, with PNG’s average LNG breakeven price almost 30% lower than proposed LNG projects in Australia.
In addition, Oil Search has developed a range of other strategic initiatives to further enhance shareholder value, including:
^ Increasing productivity and improving cost competitiveness through the implementation of a number of initiatives identified by the 2015 Business Optimisation Programme, outlined opposite.
Central Processing Facility, Kutubu, PNG Highlands.
10
For
per
sona
l use
onl
y

^ Supporting the PNG LNG Project operator in its efforts to optimise production and debottleneck the existing two PNG LNG trains.
^ Reviewing the potential to accelerate the supply of gas from the Oil Search-operated Associated Gas fields to the PNG LNG Project, optimising future capital investment and operating costs and bringing forward the end of field life.
^ Promoting a cooperative development agenda between ExxonMobil and Total, to capture potential synergies from existing infrastructure and to forge potential new partnerships.
^ Appraising and developing existing discovered gas resources as potential sources of third party gas for the PNG LNG and Papua LNG projects and to underwrite potential local power projects.
^ Replenishing the Company’s exploration porfolio in PNG.
^ Adding value through judicious and strategic acquisitions, with a focus on new acreage and licences in PNG.
2015 BUSINESS OPTIMISATION PROGRAMME OUTCOMESDuring 2015, in addition to reassessing its core strategies, Oil Search undertook a comprehensive review of all aspects of its business. The review was focused on ensuring that the Company’s organisational and resourcing structure, skill sets and cost base were not only appropriate for a potentially prolonged period of subdued oil and gas prices, but also capable of delivering Oil Search’s growth objectives. A range of initiatives identified by the review were progressively rolled out over the second half of 2015 and will continue to be implemented during 2016. The key changes include:
^ Simplifying the Company’s organisational structure, which has resulted in a leaner and more efficient business model.
^ Strengthening the LNG growth and PNG exploration teams, to support the key activities that will drive long-term growth.
^ Enhancing integrated planning, to drive efficiency and productivity through better alignment of resources and activities with Company priorities.
^ Optimising operated production output by maximising plant uptime.
^ Optimising supply chain and procurement activities through re-negotiating all major contracts and evaluating and implementing partnering strategies and process optimisation.
^ Improving drilling performance through the use of new technologies and innovation in rig and partnering strategies.
^ Increasing capital discipline and re-prioritising work programmes, to focus on value-adding activities that will maximise returns based on revised oil prices.
^ Further building the capabilities of the Port Moresby head office and the Company’s PNG workforce, to progress Oil Search’s localisation and diversity objectives. This includes targeted programmes to elevate PNG citizens into senior positions and further localisation of the PNG workforce.
^ Progressing partnerships with the PNG Government and communities, on projects such as power solutions, national infrastructure, health and education, that benefit all PNG citizens and help ensure a stable operating environment.
Towards the end of 2015, a Performance and Innovation Office was launched, aimed at embedding a culture of continuous improvement into the Company, to provide ongoing business improvements.
The delivery of these initiatives is expected to result in a more productive, efficient and cost-effective organisation, reducing production costs for Oil Search’s operated assets by approximately 25% in 2016. The programme of driving further efficiencies and innovation will continue into 2016 and beyond.
R E DUCT ION
i n p r o d u c t i o n c o s t s
f o r o p e r a t e d a s s e t s
e x p e c t e d i n 2 0 1 6
~25%
THE COMPANY HAS SIX KEY STR ATEGIES
Sustain and optimise the Company’s oil and gas assets
Commercialise gas in PNG
Pursue high-value exploration opportunities
Contribute to a stable operating environment
Enhance organisational capability
Optimise capital management
1.
2.
3.
4.
5.
6.
11OIL SEARCH Annual Report 2015
For
per
sona
l use
onl
y

ENSURING A STABLE OPERATING ENVIRONMENTOil Search has developed a comprehensive strategy of community and government engagement that helps promote operating stability and provides positive social impacts in the communities in which the Company works.
Oil Search’s employment and business development initiatives for project landowners, together with a range of health, infrastructure and social development programmes, give Oil Search unprecedented access to, and support from, local communities. The Company’s Private-Public Partnerships with Government have delivered major infrastructure for PNG, leveraging Oil Search’s development skills to provide cost-effective, corruption-free services, which include roads, hospitals, schools and major buildings, including the new National Football Stadium.
In 2015, significant progress was made by Oil Search, in partnership with the Government, on projects designed to provide domestic power solutions in PNG, which is one of the country’s key infrastructure and social challenges.
BUSINESS ENVIRONMENT OUTLOOKOver 2015, the Brent oil price fell 47%, from an average of US$99 per barrel in 2014 to US$52 per barrel in 2015, and in January 2016 dipped below US$30 per barrel for the first time in 12 years. The fall is the result of an oversupplied market, with a substantial increase in production from new tight oil in the US and a change in OPEC strategy, away from its traditional role as a swing producer, coinciding with slowing economic growth in China and Europe.
The global supply:demand imbalance has led to a significant increase in world oil inventories. While there is already evidence that non-OPEC supply is starting to taper off, it is anticipated that oil prices will continue to be volatile over the next few years, until inventory levels have been drawn down to more normal levels. The global industry reaction to lower oil and gas prices has been to put marginal projects on hold, reduce discretionary expenditure and seek contractor rate reductions. With equity funding becoming harder to obtain, there has been a clear focus on capital efficiency and prioritisation. Significant downsizing has occurred and major capital projects have stalled, with only five major oil and gas projects sanctioned in 2015 compared to 30-50 annually in recent years.
There is also currently an oversupply of LNG globally, which is expected to persist through to the end of this decade, driven by the start-up of production from several major projects in Australia and the US. In the short-term, the LNG price outlook is expected to reflect this supply overhang and the continued weakness in global oil prices. However, from early in the next decade, demand from key markets in Asia is expected to exceed supply, as existing long-term contracts expire and demand for gas grows, particularly given its status as a far lower carbon emitter than alternative fuels.
Given this backdrop, the Company’s two potential LNG growth projects, which are both targeting first gas sales early in the 2020s, are well positioned. With far fewer proposed LNG developments making progress, these projects have the opportunity to benefit from anticipated capital cost reductions, attract premium customers and commence production in a period of stronger pricing.
Shorter-term, the Company’s business planning for 2016 is based on the assumption that lower oil prices will continue through most of the year. However, in line with a range of independent oil watchers, the Company does not believe that the oil and gas industry, in its current configuration, is sustainable at present oil prices. Consequently, a gradual recovery in oil and gas prices is expected through 2017 and 2018, as the supply:demand imbalance moderates.
REJECTION OF WOODSIDE PROPOSALIn September 2015, Oil Search received a non-binding, conditional indicative proposal from Woodside, under which Woodside would acquire all the shares in Oil Search for a consideration of one Woodside share for every four Oil Search shares held.
The proposal was subject to the following conditions:
^ Completion by Woodside of satisfactory due diligence on Oil Search.
^ Execution of a mutually acceptable confidentiality agreement.
^ Oil Search granting an agreed period of exclusivity.
S t r o n g S T R A T E G I C O U T L O O K c o n t i n u e d
The National Football Stadium, one of nine infrastructure projects managed and delivered by Oil Search on behalf of the PNG Government in 2015, hosted its first game in February 2016.
12
For
per
sona
l use
onl
y

^ Oil Search obtaining support from key stakeholders and shareholders.
^ Woodside being satisfied that the transaction was likely to be supported by the PNG Government on acceptable terms.
Following a detailed evaluation of the proposal, the Board concluded that it was highly opportunistic, grossly undervalued the Company and diluted the growth profile available to Oil Search shareholders. In addition, Oil Search undertook substantial shareholder engagement, with the overwhelming feedback that the proposal had little merit. Consequently, the Board unanimously decided to reject the approach and in December, Woodside withdrew the proposal.
OUTLOOK FOR 2016Oil Search is in a strong position, with a low cost production base with modest sustaining capital requirements and a substantial liquidity buffer. As such, unlike some of our global energy peers, the Company is committed, and has the balance sheet capacity, to continue to judiciously invest in its growth opportunities. By investing through the cycle, Oil Search hopes to take advantage of lower construction costs and then benefit from an expected recovery in oil and LNG pricing when the projects come on-stream early in the next decade.
The Company regards the coming year as an ideal time to optimise its portfolio and has the ability to take advantage of acquisition opportunities, should strategic and well-priced assets become available. Oil Search looks forward to an exciting, if challenging, year ahead.
Peter BottenMANAGING DIRECTOR
S t r o n g S T R A T E G I C O U T L O O K c o n t i n u e d
OBJECTIVES for 2016
1. Deliver top quartile operating performance Maximise cash flows from operated production, minimise operating costs and prudently manage capital expenditure.
2. Expand the capacity of the PNG LNG Project and work towards delivering a potential third train Continue to support the operator, ExxonMobil, on further brownfield development of the PNG LNG Project.
3. Work towards delivering the Papua LNG Project Support Total in developing the Papua LNG Project, the next potential world-class LNG development in PNG, including pursuing cooperation and potential integration with the PNG LNG Project.
4. Accumulate high-value resources through exploration Replenish the PNG exploration portfolio through licence acquisition and prepare to drill high-potential wells that, if successful, can support longer-term growth.
5. Manage PNG country risk Continue to invest in activities in PNG that promote a stable operating environment.
6. Proactively manage balance sheet and cost performance Ensure that the Company is able to fund all commitments and prioritise work programmes that can deliver value in a low oil price environment.
7. Ongoing performance improvement deliveryDeliver identified initiatives and seek further productivity improvement opportunities, for delivery in 2016 onwards.
8. Enhance core Oil Search behaviours Demonstrate and strengthen leadership behaviours and ensure an increased commercial focus within all aspects of the business.
OIL SEARCH Annual Report 2015 13
For
per
sona
l use
onl
y

F I N A N C I A L M A N A G E M E N T
in 2015, Oil Search recalibrated its cost structures and implemented enhanced capital discipline throughout the business. This was aimed at ensuring the Company has the capacity to fund its current commitments and its attractive LNG growth projects, while accommodating dividend distributions during a potentially sustained period of low oil prices.
Stephen GardinerChief Financial Officer and Group Secretary
Strong
FINANCIAL PERFORMANCEOil Search reported a net loss of US$39.4 million in 2015 compared to a net profit of US$353.2 million in the previous year. The result included a US$399.3 million after-tax impairment charge due to the write-down of the carrying value of the Taza PSC in Kurdistan to nil. Excluding impairments, core profit was US$359.9 million, compared to US$482.8 million in 2014.
Total revenue was US$1.59 billion, 2% lower than the 2014 result. While sales of oil from operated fields fell 8%, sales of PNG LNG Project LNG more than doubled and condensate and naphtha sales volumes increased 80%, due to a full year of production and higher than anticipated production rates. This was offset by a 32% fall in the average realised LNG and gas price to US$9.44 per mmBtu and a 47% drop in the average realised oil and condensate price to US$51.36 per barrel, reflecting a collapse in global oil and gas prices.
Production costs on a per barrel of oil equivalent (boe) basis declined from US$12.21 per boe in 2014 to US$10.08 per boe in 2015, reflecting lower average PNG LNG Project unit production costs relative to average oil field unit production costs and cost reduction initiatives. Other operating costs increased from US$125.8 million to US$148.9 million, mainly due to higher selling and distribution costs from a full year of LNG sales and one-off restructuring costs. Depreciation and amortisation unit costs increased slightly from US$13.11 per boe in 2014 to US$13.28 per boe in 2015, due to a higher proportion of PNG LNG production.
Exploration costs of US$50.9 million were expensed in 2015, 53% lower than in the previous year. US$37.2 million of this amount related to activities in PNG, including the exploration component of the Hides F1 well, while the remainder was associated with exploration activities in the Middle East and North Africa.
Net interest costs in 2015 were US$185.1 million, 43% higher than in 2014, primarily due to the expensing of a full year of PNG LNG Project borrowing costs.
As mentioned, an impairment charge of US$399.3 million was recognised, related to the Taza PSC in Kurdistan, following a reduction in estimated gross recoverable 2C contingent resources in the field, after the completion of appraisal drilling and testing in 2015. No other impairments were required, with all producing assets assessed against a range of short, medium and long-term oil prices, reflecting the robust economics of Oil Search’s producing assets.
The effective tax rate on 2015 core profit was 29.1%, compared to 36.9% in the previous year. The lower tax rate reflected a higher proportion of revenues which are taxed at the statutory rate for gas of 30% compared to 50% for oil income.
CASH FLOWSNet operating cash flow decreased slightly, from US$992.3 million in 2014 to US$952.7 million in 2015. Net investing cash outflow totalled US$535.6 million, including US$248.3 million spent on exploration and evaluation activities, US$141.6 million on PNG LNG Project development activities and US$119.6 million on PNG production activities.
14
For
per
sona
l use
onl
y

OUTLOOK for 2016
CAPITAL MANAGEMENT AND LIQUIDITYAt the end of 2015, Oil Search had net debt of US$3,318.2 million, comprising cash of US$910.5 million (including US$270.8 million escrowed in PNG LNG Project accounts) and debt of US$4,228.6 million, entirely drawn down from the PNG LNG Project finance facility. Since the PNG LNG Project achieved financial completion in February 2015, US$1.2 billion of cash distributions have been released to the Company. At year end, liquidity totalled US$1.7 billion, including US$748 million available from undrawn corporate revolving facilities. In December, the Company
successfully refinanced two US$125 million bilateral revolving credit facilities through a well-supported competitive bid process.
A 2015 final unfranked dividend of four US cents per share was declared, taking the total unfranked dividend for 2015, including the six cent interim dividend, to 10 US cents per share. This represented a dividend payout ratio of 42%, in line with the Company’s policy of distributing between 35% and 50% of core profit by way of dividends. The Board believes a proportional dividend policy, where dividend payments are aligned with the Company’s profitability, remains appropriate in the current volatile oil price environment.
FINANCIAL PERFORMANCE SUMMARYYear to 31 December 2015 2014 % change
Total production mmboe 29.25 19.27 52%
Total sales mmboe 28.76 17.76 62%
Average realised oil and condensate price US$/bbl 51.36 97.79 (47%)
Average realised LNG and gas price US$/mmBtu 9.44 13.94 (32%)
Revenue from operations US$m 1,585.7 1,610.4 (2%)
EBITDAX(1) US$m 1,151.3 1,257.0 (8%)
Depreciation and amortisation US$m (407.8) (252.7) 61%
Exploration costs expensed US$m (50.9) (109.1) (53%)
EBIT(1) US$m 692.6 895.2 (23%)
Net interest income / (expense) US$m (185.1) (129.6) 43%
Impairment loss US$m (399.3) (180.6) 121%
Tax US$m (147.6) (231.8) (36%)
Net profit after tax(2) US$m (39.4) 353.2 (111%)
Impairment (net of tax) US$m 399.3 129.6 208%
Core profit(1) US$m 359.9 482.8 (25%)
Basic EPS(2) US¢/share (2.6) 23.8 (111%)
Basic EPS before significant items US¢/share 23.6 32.6 (27%)
Dividends per share US¢/share 10.0 14.0 (29%)
Operating cash flow US$m 952.7 992.3 (4%)
Net cash / (debt) US$m (3,318.2) (3,452.0) (4%)
(1) EBITDAX (earnings before interest, tax, depreciation/amortisation, impairment and exploration), EBIT (earnings before interest, impairment and tax) and Core Profit are non-IFRS measures that are presented to provide a more meaningful understanding of the performance of Oil Search’s operations. The non-IFRS financial information is unaudited but is derived from the financial statements which have been subject to audit by the Group’s auditor.
(2) Including significant items.
Oil Search enters 2016 in a strong financial position, benefiting from substantial liquidity, a low cost production base and modest sustaining capital requirements. Together with ongoing cash flow from producing assets, the Company has sufficient funds to support all current committed activities, including scheduled debt repayments and the continued judicious investment in its two highly competitive potential LNG growth projects.
In 2016, the Company will continue to drive further efficiencies and reduce costs. Production costs for Oil Search’s operated assets are expected to fall by approximately 25% in 2016, as the benefits of restructuring and cost reductions undertaken in 2015 are fully realised. In addition, total capital spend in 2016 is expected to be approximately 35% lower than in 2015, focused on the Company’s high-returning Highlands and Gulf gas commercialisation activities.
15OIL SEARCH Annual Report 2015
For
per
sona
l use
onl
y

E X E C U T I V E T E A MStrong
Peter Botten, CBEManaging Director
Peter was appointed Managing Director of Oil Search in 1994. He has extensive worldwide experience in the oil and gas industry, previously holding various senior technical, managerial and board positions in a number of listed and government-owned organisations. He is currently a Council Member of the Australia PNG Business Council, Director of the Oil Search Foundation and Chairman of Business for Development Australia.
Gerea Aopi, CBEExecutive General Manager, Stakeholder Engagement
Gerea was appointed to the Executive Leadership Team in 1998 and joined the Board as an Executive Director in 2006. Prior to joining Oil Search, Gerea was Managing Director of Telikom PNG Ltd, held several very senior positions in the PNG public service and served as the Secretary of the Department of Finance and Planning.
Paul CholakosExecutive General Manager, Technical Services
Paul joined Oil Search in 2010, after more than 25 years’ experience in the international oil and gas and mining industries. He was appointed EGM, Technical Services in 2015, having previously held the roles of EGM, PNG Operations and EGM, Project Development. Paul played a significant part in the Company’s transition to a major LNG exporter through overseeing the Oil Search-operated elements of the PNG LNG Project.
Michael HerrettExecutive General Manager, Human Resources
Michael joined Oil Search in 2012, after more than 30 years with BHP Billiton in senior Human Resources roles, including Vice President positions based in the US, UK and Australia. He has extensive international HR experience, with previous responsibilities covering oil and gas, mining and manufacturing operations in Africa, Latin America, Asia, Australia and the US.
Stephen GardinerChief Financial Officer and Group Secretary
Stephen joined Oil Search in 2004, after a 20-year career in corporate finance at two of Australia’s largest multinational construction materials companies and a major Australian telecommunications company. Stephen was appointed Chief Financial Officer in 2012. Stephen is also the Group Secretary of Oil Search, a role he has held since May 2009.
16
For
per
sona
l use
onl
y

Dr Julian FowlesExecutive General Manager, PNG Business Unit
Julian joined Oil Search in 2012, after a 23-year career with a number of large international oil and gas companies, including 16 years with Shell. His worldwide experience encompasses technical and senior executive management across exploration, development and production operations and new business.
Dr Keiran WulffExecutive General Manager, Exploration and New Business
Keiran re-joined Oil Search in January 2015, having previously worked for the Company between 1995 and 2008. Keiran was formerly Managing Director of Buru Energy Limited and has more than 30 years’ worldwide experience in the oil and gas industry.
Ian MunroExecutive General Manager, Gas Business Development
Ian joined Oil Search in August 2013 to drive growth of the Company’s gas business and deliver opportunities for gas commercialisation. Ian’s career spans more than 27 years in the oil and gas industry, including senior technical and commercial roles at Mobil, ExxonMobil and Woodside Petroleum.
Glenn Darnley-StuartExecutive General Manager, Project Development
Glenn joined Oil Search in 2003, after seven years with Chevron and 20 years in the Australian Army. He spent his first five years with Oil Search as General Manager, PNG Operations, prior to being seconded to ExxonMobil as a Project Manager on the PNG LNG Project based in PNG. Glenn was appointed to the position of EGM, Project Development in early 2013.
17OIL SEARCH Annual Report 2015
For
per
sona
l use
onl
y
PNG LNG PROJECTIn 2015, the PNG LNG Project contributed 22.2 mmboe net to Oil Search, 76% of the Company’s total production, of which 18.9 mmboe was LNG and 3.3 mmboe liquids (condensate and naphtha).
A number of milestones were celebrated by the Project, operated by ExxonMobil PNG Limited, during 2015. Financial completion was achieved in February 2015, allowing the distribution of Project cash flows to the co-venture partners to commence, the Project marked its first year of production in April 2015 and the 100th cargo was delivered in June 2015.
The Project operated consistently above the nameplate capacity of 6.9 million tonnes per annum (MTPA), averaging 7.4 MTPA in 2015, with facility processing performance improving progressively over
the year. As well as high levels of uptime at the LNG plant, the result was supported by strong upstream deliverability, with an excellent performance from the Hides wells, the Oil Search-operated Associated Gas (AG) fields and the Hides Gas Conditioning Plant (HGCP). Third party gas sales from the Oil Search-operated SE Gobe field commenced in May, adding gas volumes to help support the plant’s expanded capacity. Towards the end of the year, an extended high-rate production test took place to evaluate potential debottlenecking opportunities. It is anticipated that further work to optimise the installed capacity will take place in 2016.
Most importantly, the Project’s strong performance was achieved safely, continuing its record of zero Lost Time Incidents since production began.
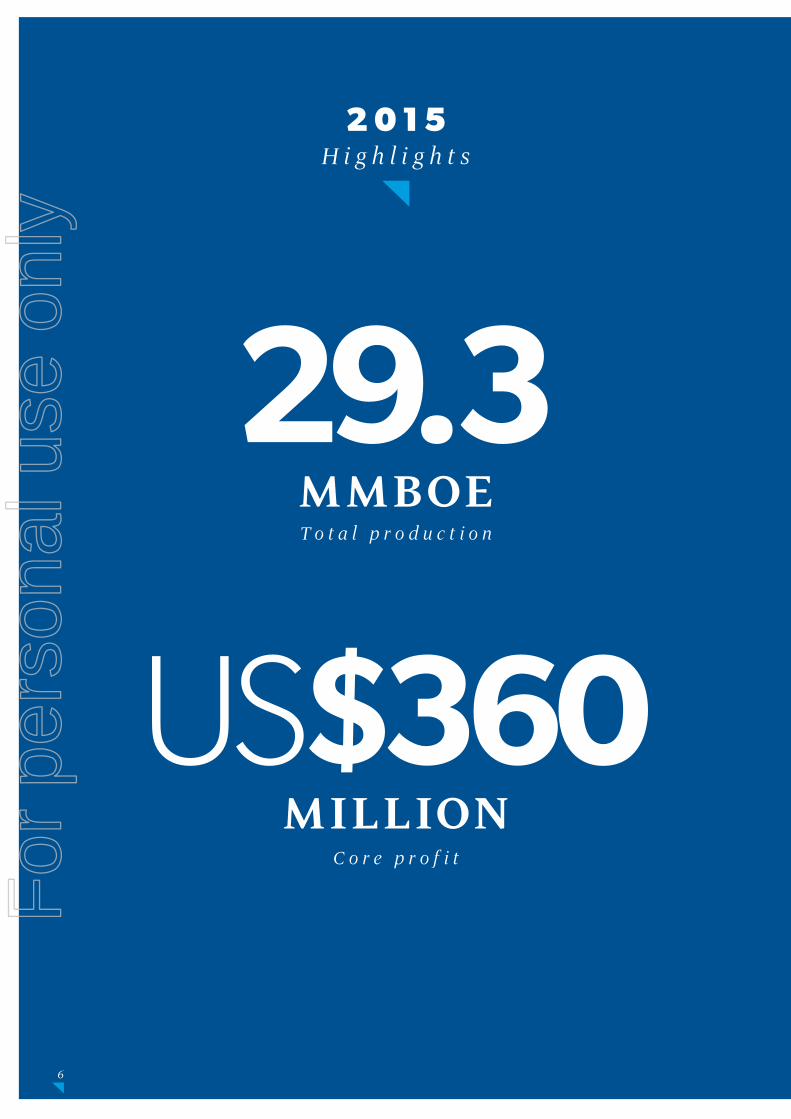
P R O D U C T I O N
Total production in 2015 was 29.3 mmboe, 52% higher than in the previous year and an all-time record for the Company. This reflected an outstanding performance by the PNG LNG Project, which operated at an annualised production rate of approximately 7.4 MTPA during 2015, and a stable contribution from the operated PNG oil fields, which was an excellent outcome given their maturity.
Julian Fowles EGM, PNG Business UnitGlenn Darnley-Stuart EGM, Project Development Paul Cholakos EGM, Technical Services
Strong
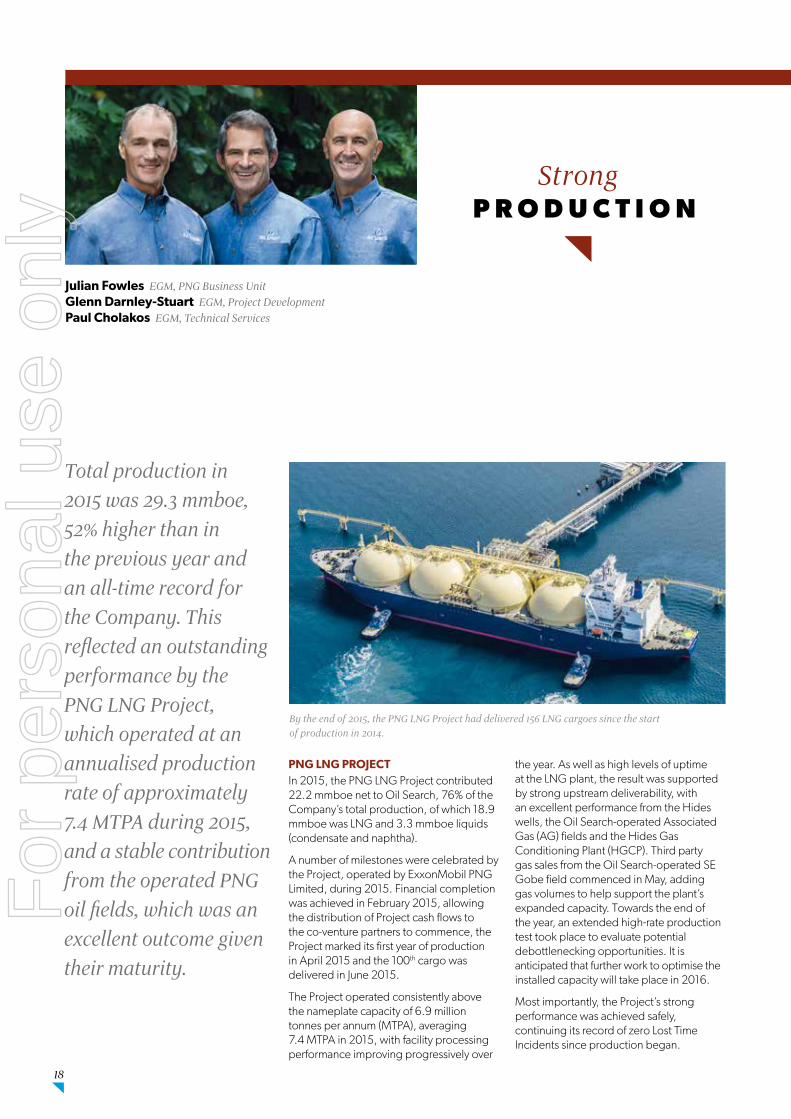
By the end of 2015, the PNG LNG Project had delivered 156 LNG cargoes since the start of production in 2014.
18
For
per
sona
l use
onl
y

Solid demand for PNG LNG Project gas Since the commencement of exports, the PNG LNG Project has established a reputation as a very reliable gas supplier. The product has been well received by the market, due to its high heating value, which is well suited to the Asian reticulation network, while PNG’s proximity to key Asian LNG markets means shorter shipping times and represents geographical diversification for customers. In 2015, 101 LNG cargoes were sold, of which nearly 80% was sold under the Project’s four long-term sales agreements. The ramp-up of contract sales reached the plateau level of 6.6 MTPA in the fourth quarter of 2015. Good demand was also seen for the Project’s additional volumes, with more than 70% of uncontracted cargoes acquired by the Project’s long-term contract customers and the balance sold to a range of top tier LNG buyers. 31.5 equivalent cargoes of Kutubu Blend, comprising production from the Oil Search-operated PNG oil fields and condensate from the PNG LNG Project, as well as eight cargoes of naphtha from the PNG LNG Project, were also sold.
Ongoing development activities Development drilling activities on the Angore gas field continued during 2015. Two wells, Angore A1 and A2, were completed as future producers. The Hides F1 development well was successfully logged and cased in the Toro reservoir as a future producer for the Project and is expected to be tied into the HGCP in late 2017/2018. Structural mapping to delineate the distribution and volume of gas reserves in the Hides field was undertaken during the year.
Oil Search’s role in gas and liquids delivery to the PNG LNG ProjectDuring 2015, an average of 118 million standard cubic feet per day (mmscf/day) of gas was supplied to the PNG LNG Project by Oil Search from the AG and SE Gobe fields, representing approximately 12% of the total gas delivered to the LNG plant. The Kutubu and Gobe Main fields contributed an average of more than 65 mmscf/d and 30 mmscf/d, respectively, over the year. Third party gas sales from the SE Gobe field to the Project commenced in May at an average rate of more than 30 mmscf/d.
L N G c a r g o e s w e r e
s o l d i n 2 0 1 5
o f t h e P N G L N G
P r o j e c t p r o d u c t i o n
w o r k f o r c e c o m p r i s e d
P N G c i t i z e n s a t
t h e e n d o f 2 0 1 5
l o n g - t e r m
c o n t r a c t c u s t o m e r s :
S i n o p e c ( C h i n a )
T E P C O ( J a p a n )
O s a k a G a s ( J a p a n )
C P C ( T a i w a n )
~80%
4
2015 PRODUCTION SUMMARY(1)
YEAR TO 31 DECEMBER 2015 2014 % Change
GAS PRODUCTION mmscf mmscf Net to OSH
PNG LNG Project LNG(2) 96,646 52,199 +85%
Hides GTE Gas Production(3) 5,312 5,675 -6%
SE Gobe Gas to PNG LNG(4) 1,886 – N/M
Total Gas 103,844 57,874 +79%
OIL AND LIQUIDS PRODUCTION mmbbl mmbbl
Kutubu 3.80 3.69 +3%
Moran 1.56 1.99 -22%
Gobe Main 0.03 0.03 -5%
SE Gobe 0.12 0.13 -8%
SE Mananda – 0.01 N/M
Total Oil 5.51 5.85 -6%
PNG LNG Project Liquids 3.27 1.96 +67%
Hides GTE Liquids(3) 0.11 0.12 -8%
Total Liquids 8.89 7.93 +12%
TOTAL PRODUCTION(5) 29.25 19.27 +52%
(1) Numbers may not add due to rounding.
(2) Production net of fuel, flare, shrinkage and SE Gobe wet gas.
(3) Hides GTE production is reported on a 100% basis for gas and associated liquids purchased by the Hides GTE Project Participant (Oil Search 100%) for processing and sale to the Porgera power station. Sales gas volumes are inclusive of approximately 2% unrecovered process gas.
(4) SE Gobe wet gas reported at inlet to plant, inclusive of fuel, flare and naphtha.
(5) Gas and LNG volumes for 2015 have been converted to barrels of oil equivalent using an Oil Search specific conversion factor of 5,100 scf = 1 boe which represents a weighted average based on Oil Search’s reserves portfolio, using the actual calorific value of each gas volume at its point of sale. Minor variations to the conversion factors may occur over time.
101
19OIL SEARCH Annual Report 2015
For
per
sona
l use
onl
y

The Oil Search-operated liquids export system, comprising the transportation of liquids through 270 kilometres of pipeline from the Highlands to the Kumul Marine Terminal located offshore in the Gulf of Papua, handled 10.6 mmbbl (approximately 30,000 bbl/d) of condensate from the PNG LNG Project in 2015. A high level of uptime was maintained in the export system during the year and this will remain a focus in 2016.
Oil Search has identified a potentially valuable opportunity to accelerate gas supply to the PNG LNG Project from the Kutubu, Agogo and Moran AG fields, which it operates. As well as providing increased gas delivery flexibility, this would optimise capital investment, bring forward the end of AG field life and reduce the future cost of supporting ageing facilities and wells, in the face of declining oil production. Initial discussions with the PNG LNG Project operator were completed in 2015 and Oil Search has since formed an internal project team which will conduct a feasibility study on this opportunity during 2016.
PNG LNG workforce and business development At the end of 2015, the Project production workforce, including employees and contractors, totalled more than 2,400, of which 79% were PNG citizens. This compared to 3,500 at the end of 2014, as the demobilisation of development personnel continued.
During 2015, the operator provided more than 65,000 hours of training through more than 2,300 training programmes. Also during the year, six Lancos and 200 non-Lanco PNG businesses were contracted by the operator to provide services, including labour hire, maintenance, transportation, security, freight and logistics to the Project. In 2015, the Project spent approximately Kina 515 million (US$182 million) on PNG-based services, including approximately Kina 187 million (US$66 million) spent with Lancos. Since 2010, the PNG LNG Project has generated expenditures of more than Kina 11.5 billion (US$4.5 billion) in-country, including Kina 2.9 billion (US$1.1 billion) with Lancos.
PORT MORESBY
KUMUL TERMINAL
PPL 269PRL 3
PRL 15
PPL 385
PPL 260
PPL 244
PPL 402
PPL 339
PPL 277
PPL 339
PRL 10
PRL 8PRL 9
PRL 14
PDL 4PDL 2
PDL 6
APDL 11
PDL 5
PDL 1
PDL 8
PDL 9
PDL 7
0 100km
PPL 464
PPL 395
PDL 3
Papua New Guinea
BISMARCK SEA
GULF OF PAPUA
PPL 339
PPL 339
PPL 339
PPL 339
PPL 339
PPL 339 PPL 339
PPL 277
PPL 260
ANGORE
HIDES GAS CONDITIONING PLANT
GOBE PROCESSING FACILITY
CENTRAL PROCESSING FACILITY GOBE MAIN
USANOAGOGO
KUTUBU
MORAN
JUHA
HIDESPROPOSED JUHA FACILITY
PNG LNG PLANT
SE GOBE
MANANDA
BILIP
BARIKEWA
SE HEDINIA
HAGANA
FLINDERS
ELK-ANTELOPE
COBRA
P'NYANG
URAMU
P'NYANGSOUTH
IEHIKIMU
JUHA NORTH
SE MANANDA
s u c c e s s r a t e a c h i e v e d
f o r o i l f i e l d d e v e l o p m e n t
w e l l s d r i l l e d s i n c e
O i l S e a r c h c o m m e n c e d
o p e r a t o r s h i p i n 2 0 0 3
~85%
S t r o n g P R O D U C T I O N c o n t i n u e d
LEGEND
Gas Pipeline Condensate Pipeline Proposed Gas Pipeline Oil Pipeline Facility Gas Field Oil Field Oil & Gas Field
OSH non-operated OSH operated PNG LNG Project Gas Fields PNG LNG Project Facilities Non PNG LNG Gas/Oil Fields
Oil Search’s licence interests in PNG.
20
For
per
sona
l use
onl
y

PNG LNG beneficiary identification During 2015, Oil Search continued to support the PNG Government and the operator to progress the PNG LNG Project Landowner Benefits Identification Programme. Royalty payments from the sale of Project LNG and liquids continue to be paid into a Government-nominated trust account with the Bank of Papua New Guinea for future distribution to landowners.
PNG OPERATED OIL AND GAS PRODUCTION In 2015, Oil Search achieved total net operated production of 7.03 mmboe, produced at a gross average rate of 35,165 boepd. This was similar to production in 2014 of 7.08 mmboe, an excellent outcome given the maturity of the fields. Net crude oil production for the year was 5.51 mmbbl, with the Kutubu and Moran fields contributing more than 95% of total oil produced, while gas and liquids production from the Hides Gas-to-Electricity (GTE) Project was 1.15 mmboe and SE Gobe gas sales to the PNG LNG Project contributed 0.37 mmboe. This compared to net oil production of 5.85 mmbbl and gas and liquids production of 1.23 mmboe in 2014.
Production from the Kutubu complex of fields increased 3%, largely due to an excellent performance from the Usano field, where reservoir management strategies developed and implemented in recent years continued to yield material gains in oil production. Production from Usano has increased from approximately 2,000 bopd in mid-2013 to sustained rates of more than 5,500 bopd in 2014 and 2015. At Agogo, production optimisation from three reservoirs accessed via existing backlimb wells and recent development wells in the Agogo forelimb resulted in an average production rate gain of 1,000 bopd compared to the previous year.
At Moran, the Moran 16 ST1 development well encountered oil in the targeted Toro and Digimu reservoirs close to prognosis and was brought online in May at a rate of 1,500 bopd. However, total production was impacted by a number of mechanical issues in the Moran 2X ST2 and NW Moran 1 ST5 wells. Successful sidetracks were undertaken in both wells, which were brought back online late in the year.
Oil production rates at the Gobe Main and SE Gobe fields were maintained at similar levels to 2014, reflecting stable facilities uptime. During the year, gas
exports to the PNG LNG Project ramped up materially, with third party gas sales commencing from SE Gobe in May 2015. Together with gas from Gobe Main, 19.2 billion cubic feet (bcf) gross of gas was exported from the Gobe fields to the PNG LNG Project during the year. The Gobe Processing Facility now exports in excess of 15,000 boepd of oil and gas, compared to approximately 2,000 boepd prior to Gobe Main and SE Gobe gas sales commencing.
Gas sales from the Hides GTE Project to the Porgera Gold Mine fell 6% in 2015. This reflected the impact of a major drought in PNG in the second half of the year, which resulted in a temporary closure of the Porgera mine.
Adding value in a low oil price environmentSince assuming oil field operatorship in 2003, Oil Search has drilled 43 development wells with a success rate of approximately 85%. Over the past four years alone, the Company has added nearly 50 mmbbls of oil (gross) to 1P reserves through high resolution reservoir modelling, development drilling and field management. However, traditional opportunities to extract oil from these mature reservoirs have become commercially challenging in the low oil price environment. In light of this, the Company’s strategy for 2016 is to optimise production from its operated oil fields by driving operating efficiencies through reduced planned downtime and improving reliability through integrated activity planning.
PROCESS SAFETYIn 2015, the Process Safety Improvement Plan (PSIP) focused on updating hazard and operability studies, identifying potential major accident events and using a systematic process to review the current status of controls to prevent them from occurring. Assessment of Oil Search’s producing wells confirmed that all wells are safe and also identified opportunities to further reduce risk. Work also commenced on embedding Oil Search’s approach to managing process safety into the Company’s management system. Once complete, this will help provide assurance that process safety is being properly managed and ensure the gains achieved through the implementation of the PSIP are sustained.
FOCUS ITEMS for 2016
PNG LNG PROJECT
^ Continue to provide a reliable supply of gas from the Kutubu, Gobe Main and SE Gobe fields and ensure a high level of facilities availability from the liquids export system via the Kumul Marine Terminal.
^ Support the Project operator in analysing opportunities for further production optimisation and debottlenecking.
^ Undertake a feasibility study on the potential accelerated gas blow down of the AG fields to the Project.
PNG OPERATED PRODUCTION
^ Enhance production performance through reducing unplanned downtime and improving the reliability of the production facilities.
^ Continue to focus on well integrity and process safety.
2016 PRODUCTION OUTLOOK(1)
Oil Search-operated (PNG oil and gas) 5.7 – 6.2 mmboe(2),(3)
PNG LNG Project
LNG 95 – 100 bcf
Liquids 3.3 – 3.5 mmbbl
Total PNG LNG Project 22 – 23 mmboe(2)
Total production 27.5 – 29.5 mmboe
(1) Numbers may not add due to rounding.
(2) Gas volumes have been converted to barrels of oil equivalent using an Oil Search specific conversion factor of 5,100 scf = 1 boe, which represents a weighted average, based on Oil Search’s reserves portfolio, using the actual calorific value of each gas volume at its point of sale.
(3) Includes 2.8 – 3.0 bcf (net) of SE Gobe gas (OSH – 22.34%) sold to the PNG LNG Project.
21OIL SEARCH Annual Report 2015
For
per
sona
l use
onl
y

PNG LNG PROJECT EXPANSION
P’nyang gas field MoU signedIn January 2015, ExxonMobil PNG Limited, operator of the PNG LNG Project and PRL 3, and the PNG Government signed a Memorandum of Understanding (MoU) regarding the development of the P’nyang field in PRL 3 (Oil Search – 38.51%). Under the MoU, P’nyang gas will be brought into the PNG LNG Project to support production, including production optimisation and debottlenecking of the existing two trains, a potential third LNG train and the supply of electricity and gas for domestic power. This was a significant milestone for the PRL 3 Joint Venture (JV), as it provided a clear framework for the
award of a Petroleum Development Licence (PDL) for the P’nyang field. In addition, the MoU included a timeline, agreed by the JV and the Government, targeting a final investment decision on a potential third LNG train by the end of 2017.
In line with the MoU, in early 2015, the JV submitted a PDL application for the field to the PNG Government, with work towards the formal award of the PDL continuing during the year. Assisted by logistics support from the JV, the Department of Petroleum and Energy undertook fieldwork to identify project landowners and held information sessions in the project area regarding the development. Additional village-based information sessions, building on a Ministerial determination of eligible
G A S G R O W T H
Gas commercialisation activities in the Highlands and Gulf Province in PNG made significant progress in 2015. PNG LNG Project expansion and the Papua LNG Project have the potential to deliver at least two, and possibly three, additional LNG trains in PNG, which, once on-stream, would double Oil Search’s production. The Company’s extensive gas exploration portfolio in PNG has the potential to support further gas commercialisation.
Ian MunroExecutive General Manager,Gas Business Development
Strong
Co-location of LNG plant sites will allow the opportunity to drive capital efficient expansion, operational synergies and schedule optimisation between the potential PNG LNG Project expansion and the proposed Papua LNG Project.
SPACE AVAILABLE FOR EXPANSION TRAINS
EXISTING PNG LNG PLANT
PROPOSED PAPUA LNG PLANT SITE AT CAUTION BAY
22
For
per
sona
l use
onl
y
P’nyang Gas Field Clans and Villages, are expected to take place in 2016, prior to landowner development forums.
Once the PDL is awarded, the intention is to integrate P’nyang into the PNG LNG Project, to support the proven additional production capacity within the Project’s existing two trains, domestic market opportunities and a potential third train. The incorporation of P’nyang into PNG LNG is regarded as the optimal outcome for all stakeholders. A brownfield development will benefit from the stable and transparent fiscal terms already agreed with the Government, a relatively straightforward expansion of the existing project finance facility to provide debt funding and the use of existing downstream PNG LNG Project infrastructure, significantly reducing development costs. The upstream development of P’nyang will include new gas and liquids pipelines that tie into existing project infrastructure at Kutubu. The pipeline route, which was agreed by the JV in 2015, may help facilitate the development of stranded gas fields in the Western Forelands region.
In April 2015, a key commitment under the MoU was fulfilled, with the execution of a power sale agreement by ExxonMobil, on behalf of the PNG LNG/PRL 3 co-venturers, for the supply of up to 25 megawatts of electricity to PNG Power Limited for use in Port Moresby. Power deliveries from the PNG LNG plant to PNG Power commenced in early July, ensuring a reliable supply of electricity during the Pacific Games and demonstrating the JV’s commitment to the Government and the people of PNG.
Preparatory works for further drilling on the P’nyang field took place during 2015. The objective of this drilling is to allow the reclassification of some of the 2C contingent resources to the 1C category, to support marketing of additional PNG LNG volumes. Oil Search is working closely with the operator, including providing environmental and community expertise and staff and logistics for pad construction. In 2015 and early 2016, Oil Search supported the delivery of community awareness and
a site-specific environmental and social impact assessment of the planned drilling activity. P’nyang South 2, in the south-east of the field and the first of potentially two wells on P’nyang, is presently targeted to spud in the second half of 2016.
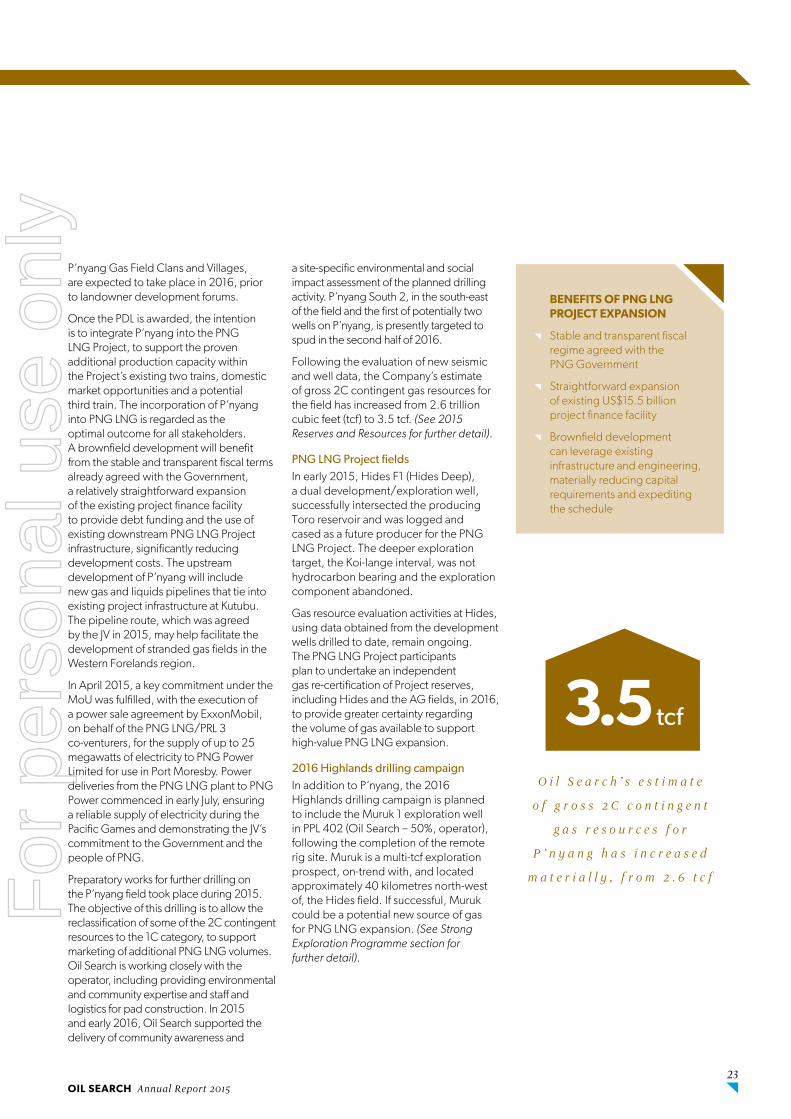
Following the evaluation of new seismic and well data, the Company’s estimate of gross 2C contingent gas resources for the field has increased from 2.6 trillion cubic feet (tcf) to 3.5 tcf. (See 2015 Reserves and Resources for further detail).
PNG LNG Project fields In early 2015, Hides F1 (Hides Deep), a dual development/exploration well, successfully intersected the producing Toro reservoir and was logged and cased as a future producer for the PNG LNG Project. The deeper exploration target, the Koi-Iange interval, was not hydrocarbon bearing and the exploration component abandoned.
Gas resource evaluation activities at Hides, using data obtained from the development wells drilled to date, remain ongoing. The PNG LNG Project participants plan to undertake an independent gas re-certification of Project reserves, including Hides and the AG fields, in 2016, to provide greater certainty regarding the volume of gas available to support high-value PNG LNG expansion.
2016 Highlands drilling campaignIn addition to P’nyang, the 2016 Highlands drilling campaign is planned to include the Muruk 1 exploration well in PPL 402 (Oil Search – 50%, operator), following the completion of the remote rig site. Muruk is a multi-tcf exploration prospect, on-trend with, and located approximately 40 kilometres north-west of, the Hides field. If successful, Muruk could be a potential new source of gas for PNG LNG expansion. (See Strong Exploration Programme section for further detail).
BENEFITS OF PNG LNG PROJECT EXPANSION
^ Stable and transparent fiscal regime agreed with the PNG Government
^ Straightforward expansion of existing US$15.5 billion project finance facility
^ Brownfield development can leverage existing infrastructure and engineering, materially reducing capital requirements and expediting the schedule
O i l S e a r c h ’ s e s t i m a t e
o f g r o s s 2 C c o n t i n g e n t
g a s r e s o u r c e s f o r
P ’ n y a n g h a s i n c r e a s e d
m a t e r i a l l y , f r o m 2 . 6 t c f
3.5tcf
23OIL SEARCH Annual Report 2015
For
per
sona
l use
onl
y
PAPUA LNG PROJECT
Project milestones in 2015The Papua LNG Project made considerable progress during 2015 towards the development of the Elk-Antelope gas fields, located in PRL 15 (Oil Search – 22.8%) in the Gulf Province of PNG. Following the resolution of licence transfer and JV management issues, in March, all participants in PRL 15 unanimously voted to appoint Total E&P PNG Limited as operator of the JV. This move was welcomed by Oil Search, with the election of Total, a world leader in the global LNG industry as operator expected to facilitate the timely development of this world-class asset. Operatorship transitioned to Total in August and Total personnel were progressively mobilised to PNG during the year.
Early in the second half of 2015, after a comprehensive study lasting more than 12 months, the JV selected the locations of key infrastructure sites, including the Central Processing Facility, onshore and offshore pipeline routes and LNG plant site for the Papua LNG Project, with the PNG
Government expressing its support for these decisions. Caution Bay was selected as the most suitable location for the LNG plant, due to the availability of a large area of state land with a similar footprint to the PNG LNG Project site, favourable sea and coastal conditions for ship loading and its proximity to Port Moresby. The location, adjacent to the PNG LNG Project site, will also allow the maximum opportunity for schedule optimisation and potential synergies during the construction and operations phases of the potential PNG LNG expansion and Papua LNG projects.
Work on financing of the Papua LNG Project commenced during the year, with the appointment of Credit Agricole (financial advisor), Milbank (international legal counsel), Allens (PNG legal counsel) and PwC (tax advisor). Towards the end of the year, Oil Search seconded senior community affairs personnel to the Project to support Total with local community engagement.
S t r o n g G A S G R O W T H c o n t i n u e d
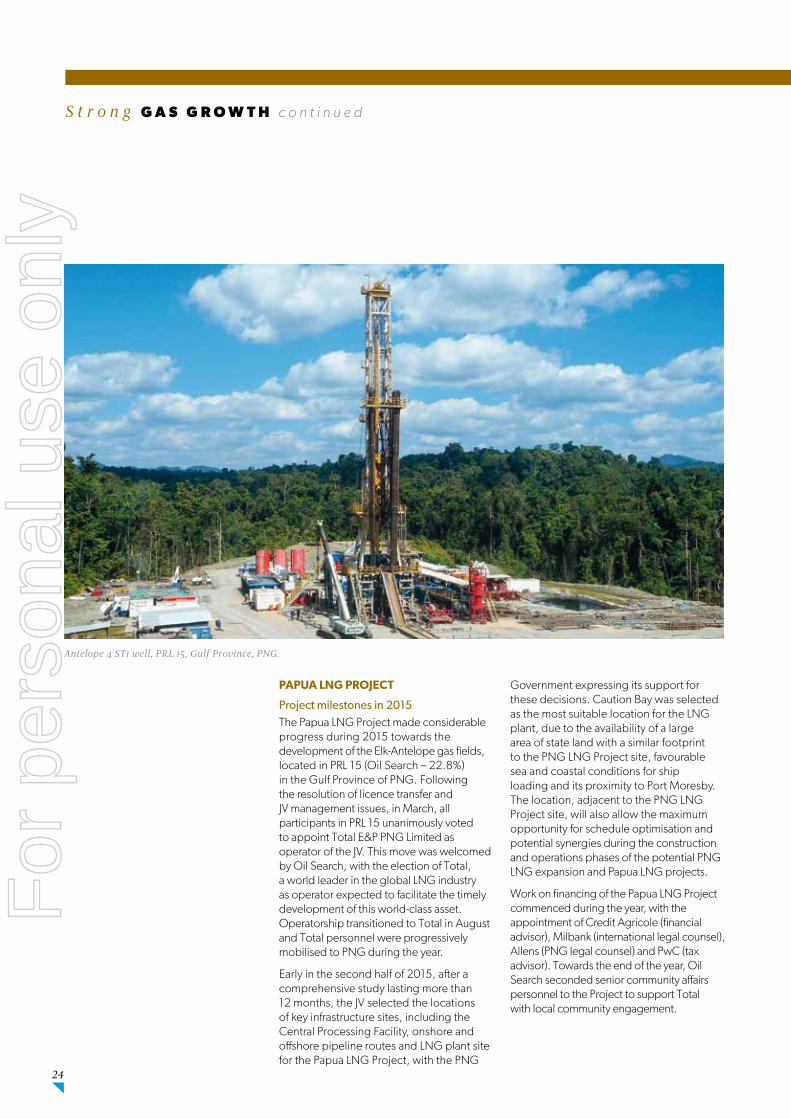
Antelope 4 ST1 well, PRL 15, Gulf Province, PNG.
24
For
per
sona
l use
onl
y

Encouraging appraisal results to dateDuring the year, two appraisal wells, Antelope 4 ST1, located at the southern margin of the field, and Antelope 5, on the western flank, were drilled. The well results confirmed that the high quality carbonate reservoir extends to the south and west of the structure. In June, an extended well test of Antelope 5 confirmed a substantial resource base, excellent reservoir quality and deliverability and demonstrated strong pressure communication between the Antelope 5 and Antelope 1 wells. Shortly after the end of the year, a second production test of Antelope 5, with observation of pressure movements at Antelope 1, was conducted. Preliminary analysis has confirmed the excellent reservoir quality and strong connectivity seen in the initial production test, with further analysis underway to quantify reservoir properties.
Antelope 6, located two kilometres east-southeast of Antelope 3, spudded in late December. The well, which is expected to reach total depth during the first quarter of 2016, is designed to appraise the eastern extent of the structure close to the gas-water contact. A further appraisal well, Antelope 7, to assess potential resource upside to the west of the currently-mapped field, is under consideration by the JV for drilling in the second half of 2016. A decision on the well will be made once the results of Antelope 6 drilling and Antelope 5 testing are evaluated.
Preliminary interpretation of the Antelope 4, Antelope 4 ST1 and Antelope 5 appraisal well results and seismic reprocessing has been positive and, subject to completion of appraisal drilling, Oil Search’s estimate of the gross 2C contingent resource could increase from the currently booked 5.3 tcf of raw gas. Given this, Oil Search remains confident that the Elk-Antelope fields have sufficient gas resources to underpin at least one 5 MTPA LNG train and, depending on the outcome of the appraisal programme, potentially two smaller-sized trains.
Certification of PRL 15Preparations for independent gas certification of the Elk-Antelope fields commenced in 2015, in line with the agreement between Oil Search and the sellers of the Pac LNG Group Companies relating to the Company’s acquisition of its interest in PRL 15. Two world-class certifiers, Netherland Sewell and Associates and Gaffney Cline and Associates, have been engaged. The certification commenced in the first quarter of 2016, with results anticipated around mid-year.
Completion of the appraisal programme and confirmation of the resource size will enable the selection of the final development concept, including the sizing and capacity of upstream and downstream facilities. This development concept will determine the Basis of Design, including a decision on the number of LNG trains, followed by entry into Front End Engineering and Design, with Oil Search anticipating a Final Investment Decision on the Project in 2018.
S t r o n g G A S G R O W T H c o n t i n u e d
BENEFITS OF THE PAPUA LNG PROJECT
^ Proximity of the Elk-Antelope fields to:
The Purari River, enabling cost-effective transport of equipment and people to site
The LNG plant site, with approximately a 330 kilometre pipeline required
^ Relatively flat up-stream terrain
^ Location of the LNG plant adjacent to the PNG LNG Project site, providing the opportunity for potential integration and cooperation with PNG LNG
Location of key infrastructure sites for the proposed Papua LNG Project.
PORT MORESBY
PPL 269PRL 3
PRL 15
PPL 260
PPL 402
PPL 277
PRL 14
PDL 4PDL 2
PDL 6
APDL 11
PDL 5
PDL 1
PDL 8
PDL 9
PDL 7
0 100km
PPL 464
PPL 395
PDL 3
Papua New Guinea
BISMARCK SEA
GULF OF PAPUA
PPL 260
KEREMA
0 100km
PROPOSED CENTRAL PROCESSING FACILITY
PROPOSED PLANT LOCATION
PROPOSED PIPELINE ROUTEPNG LNG PIPELINE
ELK-ANTELOPE GAS FIELDS
PNG LNG PLANT
25OIL SEARCH Annual Report 2015
For
per
sona
l use
onl
y

S t r o n g G A S G R O W T H c o n t i n u e d
MAXIMISING THE VALUE OF THE NEXT PHASE OF LNG DEVELOPMENT IN PNG Oil Search believes that there is an excellent opportunity to maximise the value of the potential PNG LNG Project expansion and the proposed Papua LNG Project through cooperation and integration. The use of existing infrastructure and the co-location of plant sites would help drive capital efficient investment, cost and operational synergies and schedule acceleration, maximising returns for all stakeholders, including the PNG Government, landowners and co-venturers. Generating maximum shared value through working together is particularly important if there is an extended period of low oil and gas prices.
With equity interests in the North-West Highlands and Gulf Province gas hubs and existing resource infrastructure in PNG, Oil Search is in a unique position to play a lead role in gas commercialisation activities, to ensure the most cost-effective development of future LNG trains. The Company intends to leverage its superior in-country operating experience, strong Government, community and landowner relationships, PNG basin expertise and experience gained from the PNG LNG Project to support operators, ExxonMobil and Total, and to promote a cooperative agenda for the next phase of LNG development in PNG.
DEMAND FOR LNG FROM PNG The global LNG market is becoming increasingly competitive, due to a range of new projects in Australia coming on-stream and the emergence of the US as a significant new gas exporter. Based on current forecasts, the LNG market appears well supplied until the end of this decade. However, early in the next decade, demand is expected to surpass contracted supply, particularly in the Asia Pacific region. This reflects the expiry of several existing long-term contracts and the expected deferral or delay of sanctioning of a number of proposed projects due to challenging economics at current low prices. Oil Search believes that this will provide a market window for the potential third PNG LNG train and the proposed Papua LNG Project, allowing these high heating value gas projects to secure premium Asian markets.
Given the sharp decline in oil and gas prices, only low cost projects are likely to proceed to development in the short-to-medium term. Both the potential third PNG LNG train and the Papua LNG Project continue to offer the prospect of attractive returns, despite the present oil price weakness. This view is supported by a range of independent experts, which rank these two projects as among the most commercially attractive globally and therefore the most likely to be sanctioned in the next two to three years.
MIDDLE EAST
N AMERICA
S AMERICA
SW EUROPE
NW EUROPE
ASEAN
JAPAN KOREA MARKER COUNTRIES
INDIA
CHINA
TOTAL LNG DEMAND
Source: Wood Mackenzie, LNG Tool, Dec ‘15
GLOBAL LNG DEMAND V CONTRACTED SUPPLY
2000 2005 2010 2015 2020 2025 2030 2035
600
500
400
300
200
100
0
MTP
A
26
For
per
sona
l use
onl
y

PNG POWER INITIATIVES Oil Search believes that the delivery of reliable, competitively priced power is a political and social priority in PNG and an important aspect of maintaining a stable operating environment. In 2015, the Company worked closely with the PNG Government and Government-owned PNG Power Ltd (PPL) on the Ramu Power Project, a multi-phase long-term power delivery project which aims to provide up to 100 megawatts (MW) of additional electricity generating capacity and to connect up to one million people to a larger and improved electricity grid by 2030.
The first phase of the Ramu Power Project was completed in April, with the upgrade and provision of diesel to PPL’s power plant in Tari, enabling the commencement of continuous 24-hour power supply in the town. In September, Oil Search signed a statement of intent with PPL on the next phases of the Ramu Power Project, which was followed by the signing of two Power Purchase Agreements (PPAs) – the PNG Biomass Independent Power Producer
(IPP) PPA and the Highlands IPP PPA – with PPL in December.
Under the Biomass PPA, PNG Biomass IPP (Oil Search – 70%) will use wood chips, primarily sourced from new plantation trees grown and harvested in the Markham Valley, to deliver up to 30 MW of biomass-fired baseload power for the Ramu Grid. The Highlands PPA involves the construction by Highlands IPP (Oil Search – 100%), of an initial 2 MW gas-fired pilot power project located near Hides in the Hela Province, with potential to ramp up to 5 MW in the short-term and up to 65 MW by 2030. Subject to the execution of a binding gas supply agreement, the Highlands IPP is designed to provide cost-effective baseload, peaking and back-up power to the Hela and Southern Highlands Provinces.
These activities are complementary to the power initiatives being undertaken by the PNG LNG Project on behalf of the co-venturers.
S t r o n g G A S G R O W T H c o n t i n u e d
FOCUS ITEMS for 2016
PNG LNG PROJECT EXPANSION
^ Obtain a PDL over the P’nyang field, followed by the integration of P’nyang into the PNG LNG Project.
^ Prepare to drill the Muruk 1 exploration well, the P’nyang South 2 well and evaluate a potential second P’nyang well.
PAPUA LNG PROJECT
^ Complete drilling and testing of the Antelope 6 appraisal well.
^ Determine whether to drill the Antelope 7 appraisal well.
^ Complete the Oil Search resource certification of the Elk-Antelope fields.
^ Select the final development concept for Papua LNG and confirm the Basis of Design.
k e y p o w e r
i n i t i a t i v e s e n t e r e d
i n t o d u r i n g 2 0 1 5
3
Oil Search’s partnership with PNG Power Ltd in the Ramu Power Project seeks to bring together the best of public and private enterprise skills.
27OIL SEARCH Annual Report 2015
For
per
sona
l use
onl
y

PNG GAS EXPLORATIONIn 2015, Oil Search undertook a detailed review of PNG’s hydrocarbon basins, which confirmed that there is significant exploration upside, particularly for gas, with an estimated 5 billion barrels of oil equivalent yet to be found (YTF) (1),(2). A systematic exploration and appraisal programme targeting 5 – 6 tcf of unrisked gas resources commenced in 2015, with the acquisition of 194 kilometres of 2D seismic and preparations to commence drilling in 2016. In addition, as part of a strategic expansion and high-grading of its PNG acreage portfolio, in 2015 Oil Search entered three new exploration licences, PPL 269 and PPL 402 in the Highlands and PPL 339 in the Gulf, and submitted eight new licence applications, the majority in conjunction with its major LNG project partners, ExxonMobil and Total.
North-West HighlandsOil Search has identified 3 – 4 tcf (3) of mean gross prospective resources in the North-West Highlands, including the high-potential Muruk exploration prospect in PPL 402 and Strickland prospect in PPL 269.
In 2015, Oil Search acquired a 100% interest in PPL 402(4), located north of the Juha and Hides fields. During the year, 102 kilometres of 2D seismic data was acquired in this and adjacent licences. Processing and interpretation of the seismic has matured the Muruk exploration prospect in PPL 402. Muruk 1, which is expected to spud in 2016, subject to well pad completion, is a multi-tcf exploration prospect, located close to the existing PNG LNG fields. Operated by Oil Search, the Muruk 1 well will target gas in the Toro reservoir and, should it be successful, could provide a new source of gas for PNG LNG
E X P L O R A T I O N P R O G R A M M E
Oil Search recognises that it is essential to invest in exploration through the oil price cycle, to ensure that the Company has an ongoing pipeline of future growth opportunities. The current period of low oil prices presents an opportunity for Oil Search to optimise its portfolio and tighten its focus on PNG, particularly on exploration activities that will support the ongoing commercialisation of gas.
Keiran WulffExecutive General Manager,Exploration and New Business
Strong
Seismic acquisition in the PNG Highlands.
28
For
per
sona
l use
onl
y

Project expansion. Oil Search estimates that Muruk 1 has approximately a 20% chance of success.
During the year, Oil Search finalised the acquisition of a 10% interest in PPL 269. The operator, Repsol, completed a 72 kilometre 2D seismic programme in the licence and matured the Strickland prospect, located west of the Juha field, for drilling. The Strickland exploration wells are expected to spud in the second quarter of 2016, targeting gas in the Darai limestone and in the Toro Formation sandstone reservoir. The Darai limestone represents a new play in this part of PNG. Oil Search believes the primary Toro target has approximately a 25% chance of success.
Gulf and Forelands Oil Search has identified an estimated 1 tcf (5) of mean gross prospective gas resources and appraisal upside of approximately 1 tcf of gross 2C resources in existing discovered gas fields in the Gulf and Forelands regions.
In May, Oil Search exercised its option with Kina Petroleum Limited to farm into a 70% interest(6) in PPL 339 in the Gulf
Province, following indications from high resolution gravity, magnetic and 2D seismic data of potentially prospective structures. This included the identification of the Kalangar prospect, located in the Eastern Papuan Basin, which is on-trend with the Antelope field and believed to be an Antelope-lookalike, carbonate build-up. The Kalangar 1 exploration well is expected to be drilled during the dry weather window in early 2017. Kalangar is assessed to have approximately a 15% chance of success. If the results are positive, Kalangar will open up an important and new prospective trend in the Gulf Province.
Preparatory work continued for appraisal of the existing gas discoveries in PRL 8 (Kimu), PRL 9 (Barikewa) and PRL 10 (Uramu) in the Gulf and Forelands regions. Reassessment and remapping of the discoveries has indicated potentially material 2C gas resource upside, which will be confirmed by appraisal drilling planned for 2016/2017. The drilling programme is expected to commence with the Barikewa 3 well in PRL 9 (Oil Search – 45.1%, operator) in late 2016/early 2017.
PORT MORESBY
PPL 269PRL 3
PRL 15
PPL 385
PPL 260
PPL 244
PPL 402
PPL 339
PPL 277
PPL 339
PRL 10
PRL 8
PRL 9
PRL 14
PDL 4
PDL 2
PDL 6
APDL 11
PDL 5
PDL 1
PDL 8
PDL 9
PDL 7
0
PPL 464
PPL 395
PDL 3
Papua New Guinea
BISMARCK SEA
GULF OF PAPUA
PPL 339
PPL 339
PPL 339
PPL 339
PPL 339
PPL 339 PPL 339
PPL 277
PPL 260
KIMU WEST
KIMU NORTH
KALANGAR 1URAMU 2
STRICKLAND 1
MURUK 1
BARIKEWA 3
North West HighlandsExploration activities targeting ~3-4 tcf* mean gross prospective resources
Regional petroleum system analysis and mapping targeting new frontiers
Offshore Papuan Gulf
* Mean gross prospective resources. OSH 2015 internal analysis. P50/best estimate equivalent is ~2.7 tcf. All estimates are unrisked** Mean gross prospective resources. OSH 2015 internal analysis. P50/best estimate equivalent is ~0.5 tcf. All estimates are unrisked
100km
Gulf / ForelandsExploration activities targeting ~1 tcf** mean gross prospective resourcesAppraisal targeting ~1 tcf gross 2C resources
(1) YTF represents USGS P50 & IHS Estimates. YTF includes all prospective resource estimates in all PNG sedimentary basins.
(2) The estimated quantities of petroleum that may potentially be recovered by the application of a future development project(s) relate to undiscovered accumulations. These estimates have both an associated risk of discovery and a risk of development. Further exploration appraisal and evaluation is required to determine the existence of a significant quantity of potentially moveable hydrocarbons.
(3 Based on Oil Search analysis. P50/best estimate equivalent is approximately ~ 2.7 tcf, unrisked.
(4) In April 2015, Oil Search farmed down a 50% interest in PPL 402 to Esso PNG Wren Ltd, an ExxonMobil affiliate.
(5) Based on Oil Search analysis. P50/best estimate equivalent is approximately 0.5 tcf, unrisked.
(6) The Company subsequently farmed down a 35% interest in the licence to Total SA, subject to regulatory and other relevant approvals. Oil Search will retain a 35% interest and operatorship on completion.
Oil Search’s PNG exploration/appraisal programme is targeting 5-6 tcf of gas (unrisked) close to existing infrastructure.
29OIL SEARCH Annual Report 2015
For
per
sona
l use
onl
y

WORKING COLLABORATIVELY WITH THE COMMUNITY
in preparation for the Muruk drilling campaign, in 2015 Oil Search temporarily relocated 15 households and gardens at the Kobalu settlement. This was driven by safety concerns, given the complex topography and the necessity to ensure
a safe flight path for helicopter movements to the logistics support base. Considerations in the relocation and livelihood planning included security of
tenure, cultural factors, women and other vulnerable persons and compensation for physical and economic loss and re-establishment. All members and their
families accepted the compensation offered and have moved to a nearby location of their choice for the duration of the drilling campaign.
Kobalu supply base, Muruk, PPL 402, PNG Highlands.
In PRL 10 (Oil Search – 100%, operator), preparations have commenced to drill the Uramu 2 well in 2017. In PRL 8 (Oil Search – 60.7%, operator), a 53 kilometre 2D seismic programme over Kimu and potential nearfield exploration prospects is planned to be acquired in 2016. Development options for these gas pools range from stand-alone power or small scale LNG to integration into the major LNG projects.
INTERNATIONAL EXPLORATION
Kurdistan Region of Iraq (Taza PSC)In the Taza PSC (Oil Search – 60%, operator), two appraisal wells were drilled and tested in 2015 and the Company undertook initial processing and interpretation of 630 square kilometres of 3D seismic data acquired in 2014. Taza 2, located 10 kilometres north-west of the Taza 1 discovery well and Taza 3, located six kilometres south-east of Taza 1, both flowed oil, but at low rates. Preliminary analysis of the 3D seismic has indicated that both wells were drilled in areas with lightly developed fractures and that the potential for economic flow rates from the central part of the field is unlikely. As a result,
Oil Search’s entitlement share of Taza’s 2C contingent resources was reduced by 31.2 mmbbl of oil and 128.6 bcf of gas. While the Company still believes that Taza could deliver value if the western, more fractured area of the field is oil bearing, it took a conservative approach and wrote down the carrying value of Taza to nil at 31 December 2015. Advanced processing of the 3D seismic will continue through the first half of 2016 and the Company intends to prepare a farm-out/divestment package as part of the forward plan in 2016. A licence extension has been negotiated with the Kurdistan authorities to secure tenure over the licence as the Company continues to progress this work.
Tunisia (Tajerouine PSC)During the year, Oil Search completed the processing and interpretation of data acquired from a 399 kilometre 2D survey over the Tajerouine PSC (Oil Search – 100%, operator) in 2014. The evaluation studies indicated that there was limited remaining potential in the Tajerouine Block and the Company relinquished the licence at the end of the Exploration Period in August 2015.
S t r o n g E X P L O R A T I O N P R O G R A M M E c o n t i n u e d
e x p l o r a t i o n
l i c e n c e s w e r e e n t e r e d
i n t o d u r i n g 2 0 1 5
n e w l i c e n c e
a p p l i c a t i o n s w e r e
s u b m i t t e d i n P N G
3
8
2 D s e i s m i c w a s
a c q u i r e d i n t h e P N G
H i g h l a n d s a n d
G u l f P r o v i n c e
194 KM
30
For
per
sona
l use
onl
y

Yemen (Block 7)In the second quarter of 2015, Oil Search sold its interest in Block 7 (Oil Search – 34%, operator) to a subsidiary of Petsec Energy Limited. At year end, completion of the sale to Petsec was pending relevant approvals, with the Block in a state of force majeure due to the security situation in-country.
REVISED APPROACH IN LIGHT OF LOW OIL AND GAS PRICESThe 2015 Business Optimisation Programme identified the need for a renewed focus on cost management to maximise the financial returns from exploration and appraisal activities. As a result, during the year, drilling and seismic contract rates were renegotiated and the use of both proven and innovative new technologies was introduced. This approach has shaped Oil Search’s drilling campaign planned for 2016/17. The programme includes wells such as Kalangar 1 and Barikewa 3, in the Gulf and Forelands regions, respectively, which are both located close to roads and can be road-supported. The network of roads also enables the acquisition of road-supported seismic, reducing the need for aviation support.
For deeper, more challenging wells, such as Muruk 1, Strickland 1 and P’nyang South 2 in the Highlands, the Company is working cooperatively with the operators of adjacent blocks to share rigs, associated equipment and support facilities, to minimise mobilisation and support costs and appraise and explore acreage more economically.
The Company’s near-term exploration activities will focus on PNG, where it has a competitive advantage, and on licences that are believed to have material gas potential close to existing infrastructure, to support the high-value potential PNG LNG expansion and the proposed Papua LNG Project. The Company is also looking for conventional oil and new play opportunities in PNG.
International activities have been pared back, with Oil Search in the process of exiting Yemen and Tunisia and reducing operational activity in Kurdistan. New ventures work will focus on refreshing the PNG portfolio, with any international expansion opportunities to be prudently assessed against the Company’s high-returning PNG growth opportunities.
S t r o n g E X P L O R A T I O N P R O G R A M M E c o n t i n u e d
FOCUS ITEMS for 2016
PNG
^ Prepare to drill the Muruk 1 (PPL 402) and Strickland 1 (PPL 269) exploration wells in the Highlands and complete the 72 kilometre 2D seismic survey around P’nyang South.
^ Prepare to drill the Barikewa 3 (PRL 9) appraisal well in the Forelands.
^ Continue a licence rebuilding programme to support exploration for long-term gas reserves, new conventional plays and areas with potential for new “game changers”.
^ Manage capital expenditure by optimising licence equities.
^ Continue to review costs and the application of new technology to maximise returns from exploration and appraisal activities.
INTERNATIONAL
^ Complete technical work at Taza in Kurdistan and prepare a farm-out/divestment package.
^ Continue to build new ventures capabilities and relationships and evaluate long-term opportunities.
in light of low oil and gas prices, Oil Search is targeting to reduce exploration costs, focus on core areas and build long-term growth options.
31OIL SEARCH Annual Report 2015
For
per
sona
l use
onl
y

THE OIL SEARCH FOUNDATION In 2015, the Oil Search Health Foundation transitioned to the Oil Search Foundation to reflect the expansion of its remit from health to also include women’s protection and empowerment and leadership and education. These were identified as areas where the Foundation could best contribute to PNG’s most important sustainable development goals.
Oil Search is the founder and principal donor to the Foundation, having contributed US$28 million between 2011 and 2015. During 2015, Oil Search committed to contribute more than US$50 million to support the Foundation’s work over the period 2016
to 2020. The Foundation also receives grants from a range of donors and has been selected to manage, on behalf of the PNG Government, the US$14.2 million Global Fund HIV grant.
During 2015, the Foundation continued to improve maternal and child health by supporting the vaccination of more than 5,000 children, equipping delivery rooms with electricity and running water and training nurses and midwives to safely deliver babies in remote locations. The Foundation has also helped to ensure continued low malaria rates in local communities and has improved access for HIV patients to lifesaving treatment programmes. The Foundation was proud to support the achievement of the goal of zero transmission of HIV from mothers to babies in the Hela Province in 2015. In 2015, the Foundation provided scholarships to increase the health workforce in Gulf
C O M M I T M E N T T O S O C I A L R E S P O N S I B I L I T Y
Oil Search’s commitment to social responsibility and sustainable development is fundamental to maintaining a stable operating environment in PNG. Key highlights in 2015 included expanding the scope of the Oil Search Foundation, the delivery of US$213 million of infrastructure projects on behalf of the PNG Government under various Tax Credit Schemes and a third consecutive year of improved safety performance.
Gerea Aopi, CBEExecutive General Manager,Stakeholder Engagement
Strong
Oil Search’s long-standing commitment to working collaboratively with the community is fundamental to its social licence to operate.
32
For
per
sona
l use
onl
y
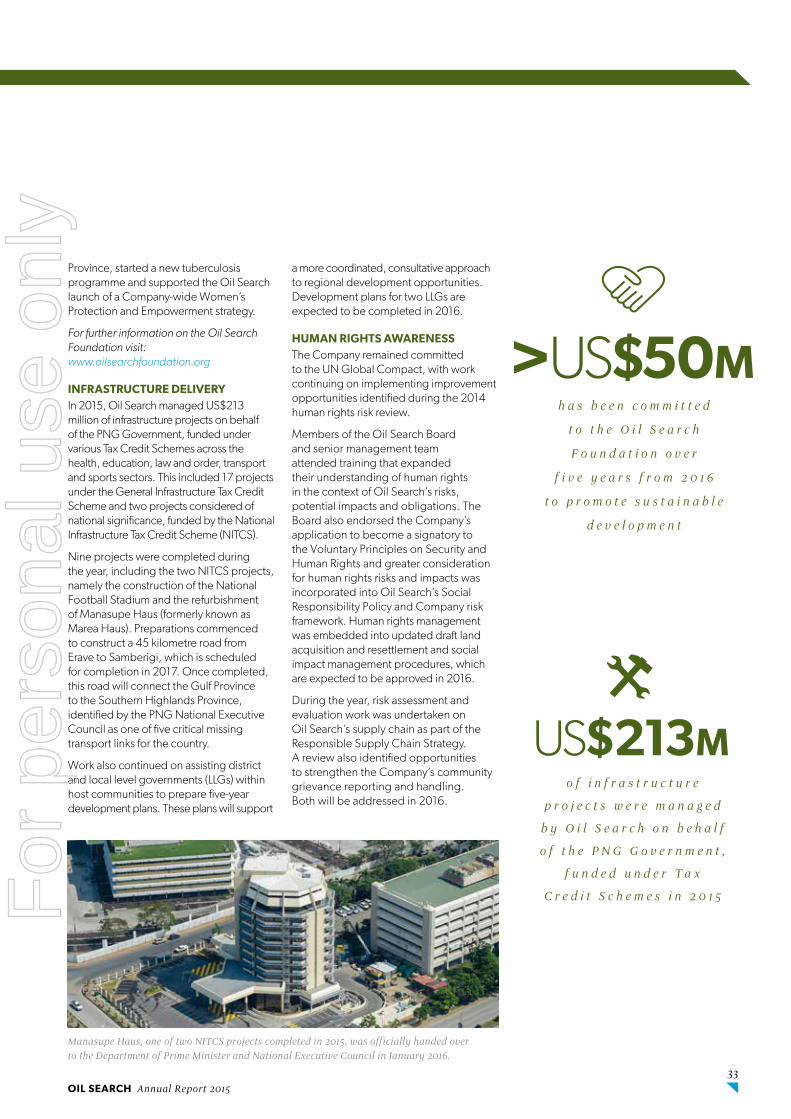
Province, started a new tuberculosis programme and supported the Oil Search launch of a Company-wide Women’s Protection and Empowerment strategy.
For further information on the Oil Search Foundation visit: www.oilsearchfoundation.org
INFRASTRUCTURE DELIVERY In 2015, Oil Search managed US$213 million of infrastructure projects on behalf of the PNG Government, funded under various Tax Credit Schemes across the health, education, law and order, transport and sports sectors. This included 17 projects under the General Infrastructure Tax Credit Scheme and two projects considered of national significance, funded by the National Infrastructure Tax Credit Scheme (NITCS).
Nine projects were completed during the year, including the two NITCS projects, namely the construction of the National Football Stadium and the refurbishment of Manasupe Haus (formerly known as Marea Haus). Preparations commenced to construct a 45 kilometre road from Erave to Samberigi, which is scheduled for completion in 2017. Once completed, this road will connect the Gulf Province to the Southern Highlands Province, identified by the PNG National Executive Council as one of five critical missing transport links for the country.
Work also continued on assisting district and local level governments (LLGs) within host communities to prepare five-year development plans. These plans will support
a more coordinated, consultative approach to regional development opportunities. Development plans for two LLGs are expected to be completed in 2016.
HUMAN RIGHTS AWARENESS The Company remained committed to the UN Global Compact, with work continuing on implementing improvement opportunities identified during the 2014 human rights risk review.
Members of the Oil Search Board and senior management team attended training that expanded their understanding of human rights in the context of Oil Search’s risks, potential impacts and obligations. The Board also endorsed the Company’s application to become a signatory to the Voluntary Principles on Security and Human Rights and greater consideration for human rights risks and impacts was incorporated into Oil Search’s Social Responsibility Policy and Company risk framework. Human rights management was embedded into updated draft land acquisition and resettlement and social impact management procedures, which are expected to be approved in 2016.
During the year, risk assessment and evaluation work was undertaken on Oil Search’s supply chain as part of the Responsible Supply Chain Strategy. A review also identified opportunities to strengthen the Company’s community grievance reporting and handling. Both will be addressed in 2016.
Manasupe Haus, one of two NiTCS projects completed in 2015, was officially handed over to the Department of Prime Minister and National Executive Council in January 2016.
h a s b e e n c o m m i t t e d
t o t h e O i l S e a r c h
F o u n d a t i o n o v e r
f i v e y e a r s f r o m 2 0 1 6
t o p r o m o t e s u s t a i n a b l e
d e v e l o p m e n t
>US$50M
o f i n f r a s t r u c t u r e
p r o j e c t s w e r e m a n a g e d
b y O i l S e a r c h o n b e h a l f
o f t h e P N G G o v e r n m e n t ,
f u n d e d u n d e r T a x
C r e d i t S c h e m e s i n 2 0 1 5
US$213M
33OIL SEARCH Annual Report 2015
For
per
sona
l use
onl
y

RESPONDING COLLABORATIVELYIn 2015, the Company collaborated closely with local communities around Lake Kutubu as part of a long-standing programme to support conservation management of the lake and its fish population. With Oil Search’s support, the Lake Kutubu Wildlife Management Area (WMA) Committee held three forums during the year, to discuss the findings of recent fish health and composition surveys and to explore community-led management options. In 2016, Oil Search and the WMA Committee plan to introduce a simple Catchment Management Plan that will be owned and implemented by the WMA Committee.
Oil Search’s ability to respond quickly to community crises and needs was demonstrated during 2015 when one of the worst droughts on record impacted food and water supplies across the whole of PNG. Oil Search cooperated with governments, landowner companies and affected communities in an extensive disaster relief operation that delivered emergency supplies to more than 27,000 people in 94 villages. The Company contributed US$0.83 million towards this effort.
Following the announcement in 2015 of the departure of the Hela Provincial Hospital’s main service provider, Oil Search delivered financial and in-kind assistance to support continued operations. As the only referral hospital in the area, Hela Provincial Hospital
would have struggled to maintain the same level of service to the Hela community, where the majority of the Company’s upstream operations are located, without Oil Search’s support. The Hospital’s newly appointed Board, chaired by Oil Search’s Managing Director Peter Botten, met for the first time in November 2015, to plan the transition. The Board is focused on finding medical staff with the required medical experience prepared to relocate to the remote Hela Province. Oil Search has been assisting the hospital in a number of ways, including staff recruitment, refurbishing hospital wards and ensuring a continued supply of water and electricity. This support will continue in 2016.
CORRUPTION PREVENTION AND TRANSPARENCYCorruption prevention, a robust Code of Conduct and actively supporting transparency are fundamental elements of Oil Search’s approach to operating with integrity.
In 2015, work on reviewing and updating the Oil Search Code of Conduct continued and the associated reporting and analysis capabilities were strengthened. During the year, there were 19 breaches of the Code. Investigation resulted in seven warning letters, five records of discussion, two resignations and five terminations.
S t r o n g C O M M I T M E N T T O S O C I A L R E S P O N S I B I L I T Y c o n t i n u e d
O i l S e a r c h i s P N G ’ s
l a r g e s t c o m p a n y ,
i n v e s t o r a n d e m p l o y e r
OI L SE A RCH’S 2015 SOCIO -ECONOM IC
CONT R I BUT ION I N PNG
246
71
30 28
91
US$466M
SUPPLIERS
COMMUNITY
GOVERNMENT
SHAREHOLDERS
EMPLOYEES
Oil Search was heavily involved in the drought relief effort that delivered emergency supplies throughout PNG in 2015.
11 12 13 14 15
1.85
2.64
2.47
1.97
1.9
1
TOTA L R ECOR DA BL E I NCI DE NT R AT E
( P E R M I L L I O N H O U R S W O R K E D )
3% DOWN
34
For
per
sona
l use
onl
y
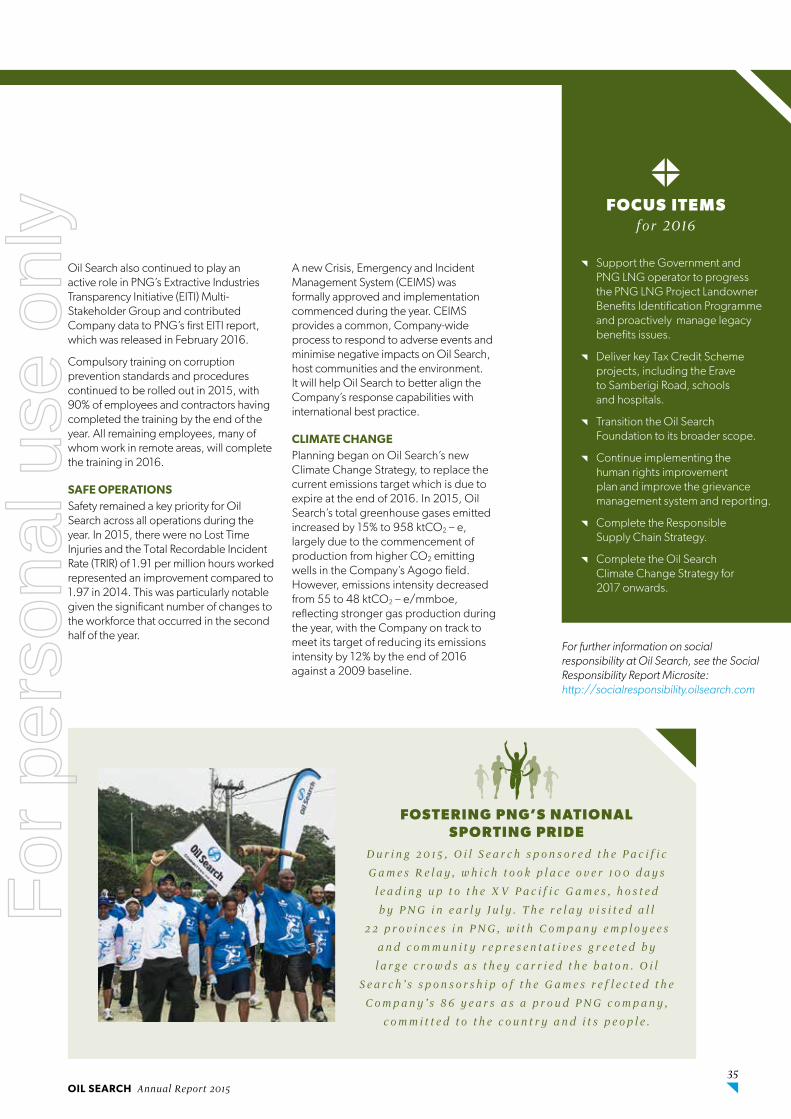
Oil Search also continued to play an active role in PNG’s Extractive Industries Transparency Initiative (EITI) Multi-Stakeholder Group and contributed Company data to PNG’s first EITI report, which was released in February 2016.
Compulsory training on corruption prevention standards and procedures continued to be rolled out in 2015, with 90% of employees and contractors having completed the training by the end of the year. All remaining employees, many of whom work in remote areas, will complete the training in 2016.
SAFE OPERATIONSSafety remained a key priority for Oil Search across all operations during the year. In 2015, there were no Lost Time Injuries and the Total Recordable Incident Rate (TRIR) of 1.91 per million hours worked represented an improvement compared to 1.97 in 2014. This was particularly notable given the significant number of changes to the workforce that occurred in the second half of the year.
A new Crisis, Emergency and Incident Management System (CEIMS) was formally approved and implementation commenced during the year. CEIMS provides a common, Company-wide process to respond to adverse events and minimise negative impacts on Oil Search, host communities and the environment. It will help Oil Search to better align the Company’s response capabilities with international best practice.
CLIMATE CHANGEPlanning began on Oil Search’s new Climate Change Strategy, to replace the current emissions target which is due to expire at the end of 2016. In 2015, Oil Search’s total greenhouse gases emitted increased by 15% to 958 ktCO2 – e, largely due to the commencement of production from higher CO2 emitting wells in the Company’s Agogo field. However, emissions intensity decreased from 55 to 48 ktCO2 – e/mmboe, reflecting stronger gas production during the year, with the Company on track to meet its target of reducing its emissions intensity by 12% by the end of 2016 against a 2009 baseline.
S t r o n g C O M M I T M E N T T O S O C I A L R E S P O N S I B I L I T Y c o n t i n u e d
FOCUS ITEMS for 2016
^ Support the Government and PNG LNG operator to progress the PNG LNG Project Landowner Benefits Identification Programme and proactively manage legacy benefits issues.
^ Deliver key Tax Credit Scheme projects, including the Erave to Samberigi Road, schools and hospitals.
^ Transition the Oil Search Foundation to its broader scope.
^ Continue implementing the human rights improvement plan and improve the grievance management system and reporting.
^ Complete the Responsible Supply Chain Strategy.
^ Complete the Oil Search Climate Change Strategy for 2017 onwards.
D u r i n g 2 0 1 5 , O i l S e a r c h s p o n s o r e d t h e P a c i f i c
G a m e s R e l a y , w h i c h t o o k p l a c e o v e r 1 0 0 d a y s
l e a d i n g u p t o t h e X V P a c i f i c G a m e s , h o s t e d
b y P N G i n e a r l y J u l y . T h e r e l a y v i s i t e d a l l
2 2 p r o v i n c e s i n P N G , w i t h C o m p a n y e m p l o y e e s
a n d c o m m u n i t y r e p r e s e n t a t i v e s g r e e t e d b y
l a r g e c r o w d s a s t h e y c a r r i e d t h e b a t o n . O i l
S e a r c h ’ s s p o n s o r s h i p o f t h e G a m e s r e f l e c t e d t h e
C o m p a n y ’ s 8 6 y e a r s a s a p r o u d P N G c o m p a n y ,
c o m m i t t e d t o t h e c o u n t r y a n d i t s p e o p l e .
FOSTERING PNG’S NATIONAL SPORTING PRIDE
For further information on social responsibility at Oil Search, see the Social Responsibility Report Microsite: http://socialresponsibility.oilsearch.com
35OIL SEARCH Annual Report 2015
For
per
sona
l use
onl
y
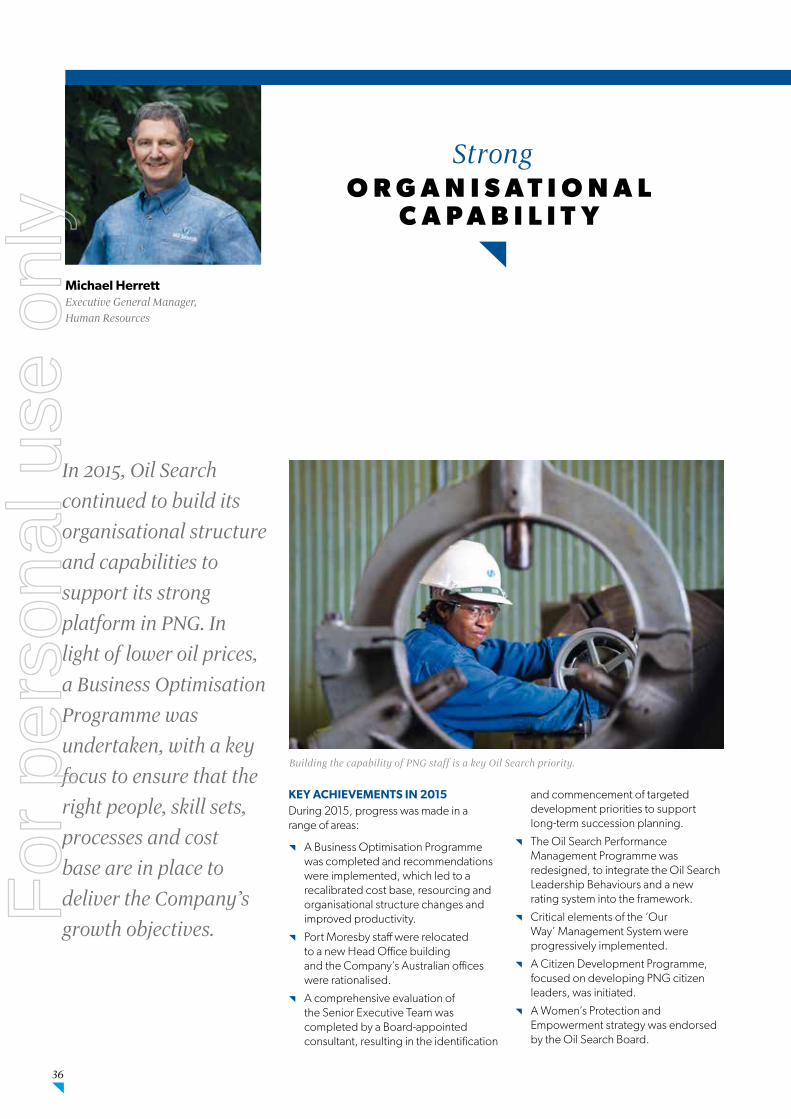
KEY ACHIEVEMENTS IN 2015During 2015, progress was made in a range of areas:
^ A Business Optimisation Programme was completed and recommendations were implemented, which led to a recalibrated cost base, resourcing and organisational structure changes and improved productivity.
^ Port Moresby staff were relocated to a new Head Office building and the Company’s Australian offices were rationalised.
^ A comprehensive evaluation of the Senior Executive Team was completed by a Board-appointed consultant, resulting in the identification
and commencement of targeted development priorities to support long-term succession planning.
^ The Oil Search Performance Management Programme was redesigned, to integrate the Oil Search Leadership Behaviours and a new rating system into the framework.
^ Critical elements of the ‘Our Way’ Management System were progressively implemented.
^ A Citizen Development Programme, focused on developing PNG citizen leaders, was initiated.
^ A Women’s Protection and Empowerment strategy was endorsed by the Oil Search Board.
O R G A N I S A T I O N A L C A P A B I L I T Y
in 2015, Oil Search continued to build its organisational structure and capabilities to support its strong platform in PNG. in light of lower oil prices, a Business Optimisation Programme was undertaken, with a key focus to ensure that the right people, skill sets, processes and cost base are in place to deliver the Company’s growth objectives.
Michael HerrettExecutive General Manager,Human Resources
Strong
36
Building the capability of PNG staff is a key Oil Search priority.
For
per
sona
l use
onl
y

BUILDING CAPABILIT Y ONE PNG CITIZEN AT A TIME
BUSINESS OPTIMISATION PROGRAMME A key focus of the 2015 Business Optimisation Programme was to right-size the Company’s organisational and resourcing structure, to ensure Oil Search has the appropriate skill sets and cost base to deliver the Company’s strategies in a low oil price environment. A range of initiatives identified by the review were progressively rolled out over the second half of 2015 and will continue into 2016. The Oil Search organisational structure has been redesigned and simplified, with some areas of the business rationalised. Other areas, such as investment in LNG growth and PNG exploration, which are regarded as priority activities to drive long-term growth, have been bolstered. Towards the end of the year, the Brisbane office was closed, with a number of roles redeployed to Sydney. In the field, the production and operations support workforce was materially reduced, with a significant number of technical and support roles relocated to Port Moresby or Sydney. An increased number of senior roles and activities across the business were also progressively transitioned from the field and Sydney to Port Moresby during the year.
Towards the end of 2015, a Performance and Innovation Office (PIO) was launched, aimed at delivering ongoing business improvements and developing and embedding high performing capabilities through the Company. The PIO is pursuing a number of initiatives that will underpin improved performance, including organisational efficiency and effectiveness, integrated planning, end-to-end spend management and production enhancement. These initiatives are expected to deliver material cost reductions for Oil Search’s operated oil and gas business as they are progressively rolled out over 2016.
in November, Oil Search process technician apprentice, Jonathan Pirah, was recognised as PNG’s 2015 Apprentice of the Year.
Jonathan was recruited in 2012 and currently works at the Oil Search Central Processing Facility (CPF) in the Southern Highlands as a field operator. Jonathan’s main task is to ensure that crude oil flows safely
to the CPF and is ready for export.
Mr Pirah’s award continues a history of Oil Search apprentices winning this prestigious title, reflecting the high quality of the Company’s apprenticeship programme. This programme has produced more
than 160 apprentices over the past 13 years.
Oil Search seeks to build capability through the recruitment, development and retention of early career PNG citizens, including entry level apprentices, graduates, vacation employment and internships in trades and professional roles. in 2015, the Company’s four-year apprenticeship programme employed
more than 50 apprentices across the process, maintenance, mechanical and electrical areas and its graduate programme accepted 28 graduates. Each graduate was assigned a mentor, provided with the opportunity to participate in two professional development programmes and provided
on-the-job training via a series of rotations across the business to develop their technical skills. Over the past decade, the retention rate among
Oil Search graduates has averaged more than 70%.
37OIL SEARCH Annual Report 2015
For
per
sona
l use
onl
y
‘OUR WAY’ MANAGEMENT SYSTEM The ‘Our Way’ Management System was progressively implemented and embedded in Oil Search’s business during 2015. Progress across the four key elements included:
Foundation. Clear and consistent approaches and methodologies for Risk Management, Process Safety, Planning and Opportunity Delivery were defined through the design and progressive implementation of four new Company-wide Frameworks.
Operating Model. During 2015, the Operating Model, which consists of four key Business Units – PNG, Gas Development, Exploration and Corporate – supported by Functions, was updated as part of the Business Optimisation Programme.
Governance. In 2015, a group comprising senior representatives from all Business Units and Functions was established to lead the review and endorsement of a number of Company-wide procedures. Progressive implementation of these procedures is planned for 2016.
Leadership. The Oil Search Accelerated Development Programme (ADP) for emerging and senior leaders was expanded in 2015 to include 17 employees, comprising 53% females and 36% PNG citizens. As part of the programme, each participant was teamed with two Executive General Managers for mentoring. A customised development plan was formulated, based on in-depth psychometric assessments, 360-degree reviews, offsite residential programmes and personalised executive coaching sessions during the year. In 2015, more than a third of the 2014 ADP cohort were promoted and more than a third had their roles expanded or experienced additional development opportunities.
The Oil Search Employee Performance Management Programme (PMP) was also re-designed. The former numbers-based rating system was replaced with behaviourally descriptive performance ratings and individual performance assessed against a combination of “business as usual” activities, Key Performance Indicators and new Leadership Behaviours (Accountable, Culturally Aware, Forward Thinking, Resourceful, Working Together and Leading Others). An interactive training programme was rolled out to engage and inform employees about the new PMP process during the year. Oil Search is very focused in this challenging operating environment on demonstrating and strengthening its leadership behaviours and pipeline.
DIVERSITY AND INCLUSION STRATEGYThe Oil Search Diversity and Inclusion Strategy aims to improve the representation, development and retention of diverse groups of employees who represent the communities in which the Company operates. This includes:
^ Ensuring Oil Search has a diverse and skilled workforce.
^ Creating a workplace culture that displays fair practices and behaviours.
^ Improving employment access and participation for diversity groups.
The Diversity Council, formed in 2014, continued to meet on a quarterly basis during the year, to report and discuss the Company’s progress against its stated diversity and inclusion targets. Progress during 2015 against these targets is summarised opposite (see the People and Organisation section of the Oil Search Social Responsibility microsite at http://socialresponsibility.oilsearch.com for further detail).
S t r o n g O R G A N I S A T I O N A L C A P A B I L I T Y c o n t i n u e d
i s f o c u s e d o n e n s u r i n g
k e y a s p e c t s o f
O i l S e a r c h ’ s l e a d e r s h i p ,
g o v e r n a n c e , o p e r a t i n g
m o d e l , s t a n d a r d s ,
k e y p r o c e s s e s a n d
c a p a b i l i t i e s a r e m a n a g e d
i n a t r a n s p a r e n t a n d
c o n s i s t e n t m a n n e r
38
For
per
sona
l use
onl
y

CITIZEN DEVELOPMENT PROGRAMMEThe Citizen Development Programme (CDP) aims to increase the number of PNG citizens in key leadership roles within the organisation over the next five years. Citizens with leadership interest and potential will be identified to participate in various development initiatives, including a combination of training and on-the-job experiences supported by coaching, to prepare them for leadership roles. The CDP represents a significant investment for Oil Search and demonstrates the Company’s ongoing commitment to PNG and the development of local talent. Two key roles, General Manager – Citizen Development and an Organisational Development specialist, are being recruited to oversee and support a dedicated team to achieve this goal. A Supervisor Development Programme will also be rolled out in 2016, to provide a formal process for talented PNG citizens to develop their supervisory and practical management skills to succeed in leadership roles.
ELIMINATION OF VIOLENCE AGAINST WOMENOil Search believes that women’s protection and empowerment is an important issue that cannot be ignored. In 2015, a number of initiatives were implemented to promote an end to violence against women, commencing with the appointment of a Head of Women’s Protection and Empowerment at the Oil Search Foundation. In November, a coordinated Company-wide campaign was implemented to support International Day for the Elimination of Violence Against Women, including staff briefings and walkathons at all Oil Search locations in Australia, PNG and Kurdistan. Towards the end of the year, the Oil Search Women’s Protection and Empowerment Strategy was developed and endorsed by the Board, with a roll-out of activities planned for 2016.
S t r o n g O R G A N I S A T I O N A L C A P A B I L I T Y c o n t i n u e d
FOCUS ITEMS for 2016
^ Accelerate the Citizen Development Programme to increase PNG citizen representation in leadership roles in PNG.
^ Implement ongoing business improvement initiatives identified by the Performance and Innovation Office.
^ Extract maximum value from the ‘Our Way’ Management System.
^ Continue to pursue the Oil Search Diversity and Inclusion goals.
^ Drive employee engagement and retention through flexible workplace arrangements and market-competitive benefits.
^ Continue to develop high-potential talent.
^ Implement supervisor and manager level leadership programmes.
DIVERSITY AND INCLUSION GOAL PROGRESS IN 2015
GOAL 1: Increase the percentage of females in leadership roles by 2017.
The percentage of female representation in leadership roles increased from 15% in 2014 to 18% in 2015, with the promotion of three females to the position of General Manager.
GOAL 2: Increase the percentage of PNG citizens in leadership roles by 2017.
The percentage of PNG citizens in leadership roles increased from 16% in 2014 to 21% in 2015.
GOAL 3: Increase the percentage of female graduates and apprentices by 2017.
The percentage of female graduates and apprentices increased from 28% and 21% in 2014, to 36% and 38%, respectively, in 2015.
GOAL 4: Increase the representation of females and PNG citizens in succession plans for leadership and management roles.
The 2015 succession plan was based on the restructured organisation and female and PNG citizen representation remained constant at 27% and 22%, respectively.
GOAL 5: Implement diversity and inclusiveness training as part of the Oil Search leadership development programmes.
The Oil Search Accelerated Development Programme included cultural awareness assessment and training as part of the residential course component. 100% of participants completed this training in 2015.
39OIL SEARCH Annual Report 2015
For
per
sona
l use
onl
y

R E S E R V E S A N D R E S O U R C E S
2015
Oil Search achieved record oil and gas production in 2015. As a result, proved and probable (2P) oil and condensate reserves declined by 9% to 87.2 million barrels (mmbbl) and 2P gas reserves fell 5% to 2,177.9 billion cubic feet (bcf), with no other material changes in reserves. At the end of 2015, 2C contingent gas resources were 3,610.0 bcf and 2C contingent oil and condensate resources were 57.1 mmbbl.
Key changes during 2015 included the addition of 326 bcf of gas and 10.6 mmbbl of condensate to Oil Search’s net 2C contingent resources following technical studies at the P’nyang field in PRL 3, offset by a downward revision to net 2C contingent resources, of 31.2 mmbbl of oil and 128.6 bcf of gas, based on appraisal data from Taza in Kurdistan, and 128.1 bcf of gas from re-mapping the Cobra field in PRL 14.
Based on 2015 production of 29.3 million barrels of oil equivalent (mmboe), Oil Search has a proved (1P) reserves life of 11.6 years and a proved and probable (2P) reserves life of 17.5 years. The Company also has 57.1 mmbbl of oil and condensate and 3,610.0 bcf of gas in the 2C contingent resource category, of which a large proportion has a high probability of development.
OIL AND GAS RESERVESAt 31 December 2015, the Company’s proved reserves (1P) were 57.5 mmbbl of oil and condensate and 1,441.8 bcf of gas.
2P reserves were 87.2 mmbbl of oil and condensate and 2,177.9 bcf of gas.
The key changes in 1P and 2P reserves since 31 December 2014, which are summarised in Tables 1 and 2, are as follows:
^ Reserves at 31 December 2015 have been adjusted for record net production in 2015 of 8.8 mmbbl of oil and condensate and 99.4 bcf of gas(1).
^ There have been no changes to the Estimated Ultimate Recoveries (EUR) of the Moran and Kutubu complex oil fields or the PNG LNG Project fields and remaining reserves for both 1P and 2P categories reflect the year-end 2014 position less 2015 production volumes.
^ An independent audit of the Gobe Main and SE Gobe fields by Netherland, Sewell & Associates, Inc. (NSAI) has resulted in minor changes to the EUR for oil and SE Gobe gas.(1) Note that these production figures are
based on Oil Search’s net 16.67% share of PDL 1 Hides GTE production.
Export gas metering at the Central Processing Facility at Kutubu.
40
For
per
sona
l use
onl
y

Developed and undeveloped reserves are shown in Table 3. Undeveloped oil and gas reserves are largely related to the PNG LNG Project, where the construction of additional infrastructure is required prior to the commencement of gas export, consistent with the approved development plan. Some undeveloped reserves at Moran and Agogo have been moved to the developed category following successful development drilling and workover operations during the year.
The 2015 reserves statement used the same methodology as the Company’s impairment analysis, including assessments at a range of short, medium and long term oil prices.
CONTINGENT RESOURCESAt the end of 2015, the Company’s 2C contingent resources comprised 3,610.0 bcf of gas, up from 3,529.5 bcf at the end of 2014, and 57.1 mmbbl of oil and condensate, down from 77.7 mmbbl.
The key changes in 2C contingent resources since 31 December 2014, which are summarised in Tables 1 and 2, are as follows:
^ The addition of 326 bcf of gas and 10.6 mmbbl of condensate at PRL 3, reflecting a revised technical assessment of the P’nyang field, using updated structural mapping and core analysis data. The reported volumes reflect gross 2C resources of 3.5 tcf of gas and 52.5 mmbbl of condensate.
^ A reduction of 31.2 mmbbl of oil and 128.6 bcf of gas (on a net entitlement basis) at Taza in Kurdistan. This follows a re-appraisal of the Taza field, involving the interpretation of 3D seismic and analysis of data from drilling and testing the Taza 2 and Taza 3 appraisal wells. The data has been used to determine probabilistic in-place volume estimates from geological modelling, combined with recovery factor estimates from deterministic simulation modelling. The revised modelling corresponds to gross 2C field resources of 56.4 mmbbl of oil and 17.4 bcf of gas.
^ A reduction of 128.1 bcf of gas at Cobra (PRL 14), reflecting revised mapping of the Cobra structure.
TABLE 1: 2015 OIL AND CONDENSATE RESERVES AND RESOURCES RECONCILIATION WITH 2014
Proved oil and condensate reserves (million barrels)
LICENCE/FIELD END 2014
RESERVES PRODUCTION
DISCOVERIES/ EXTENSIONS/
REVISIONSACQUISITIONS/
DIVESTMENTSEND 2015
RESERVES
PDL 2 – Kutubu 19.2 3.8 – – 15.4
PDL 2/5/6 – Moran Unit 10.2 1.6 – – 8.6
PDL 4 – Gobe Main 0.1 0.0 0.0 – 0.1
PDL 3/4 – SE Gobe 0.2 0.1 0.2 – 0.2
PDL 1 – Hides GTE – – – – –
PNG LNG Project 36.5 3.3 – – 33.2
Total 66.0 8.8 0.2 – 57.5
Proved and Probable oil and condensate reserves (million barrels)
PDL 2 – Kutubu 23.8 3.8 – – 20.0
PDL 2/5/6 – Moran Unit 13.8 1.6 – – 12.2
PDL 4 – Gobe Main 0.1 0.0 0.0 – 0.1
PDL 3/4 – SE Gobe 0.5 0.1 0.0 – 0.3
PDL 1 – Hides GTE – – – – –
PNG LNG Project 57.8 3.3 – – 54.5
Total 95.9 8.8 0.0 – 87.2
2C Contingent oil and condensate resources (million barrels)
LICENCE/FIELD END 2014
2C RESOURCES PRODUCTION
DISCOVERIES/ EXTENSIONS/
REVISIONSACQUISITIONS/
DIVESTMENTSEND 2015
2C RESOURCES
PNG LNG Project oil and condensate 1.7 – – – 1.7
Other PNG oil and condensate 22.9 – 10.6 – 33.6
Middle East oil and condensate 53.1 – (31.2) – 21.9
Total 77.7 – (20.6) – 57.1
OIL SEARCH Annual Report 2015 41
For
per
sona
l use
onl
y
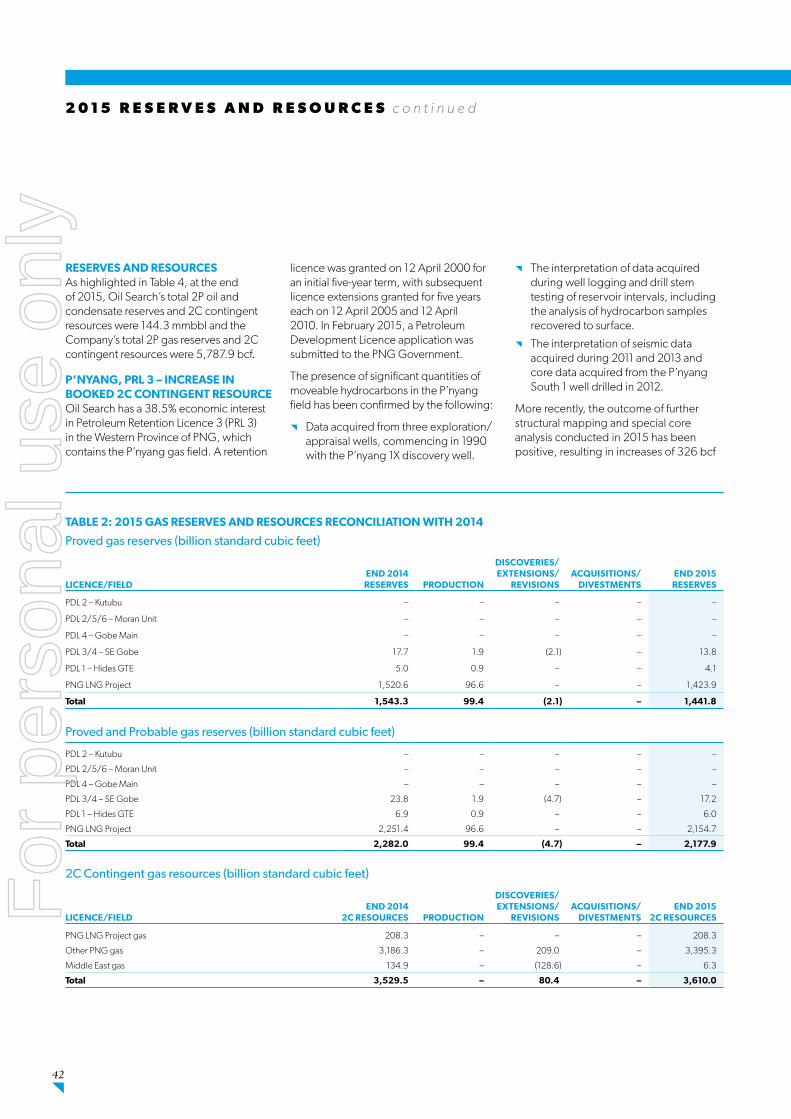
RESERVES AND RESOURCESAs highlighted in Table 4, at the end of 2015, Oil Search’s total 2P oil and condensate reserves and 2C contingent resources were 144.3 mmbbl and the Company’s total 2P gas reserves and 2C contingent resources were 5,787.9 bcf.
P’NYANG, PRL 3 – INCREASE IN BOOKED 2C CONTINGENT RESOURCEOil Search has a 38.5% economic interest in Petroleum Retention Licence 3 (PRL 3) in the Western Province of PNG, which contains the P’nyang gas field. A retention
licence was granted on 12 April 2000 for an initial five-year term, with subsequent licence extensions granted for five years each on 12 April 2005 and 12 April 2010. In February 2015, a Petroleum Development Licence application was submitted to the PNG Government.
The presence of significant quantities of moveable hydrocarbons in the P’nyang field has been confirmed by the following:
^ Data acquired from three exploration/appraisal wells, commencing in 1990 with the P’nyang 1X discovery well.
^ The interpretation of data acquired during well logging and drill stem testing of reservoir intervals, including the analysis of hydrocarbon samples recovered to surface.
^ The interpretation of seismic data acquired during 2011 and 2013 and core data acquired from the P’nyang South 1 well drilled in 2012.
More recently, the outcome of further structural mapping and special core analysis conducted in 2015 has been positive, resulting in increases of 326 bcf
TABLE 2: 2015 GAS RESERVES AND RESOURCES RECONCILIATION WITH 2014
Proved gas reserves (billion standard cubic feet)
LICENCE/FIELD END 2014
RESERVES PRODUCTION
DISCOVERIES/ EXTENSIONS/
REVISIONSACQUISITIONS/
DIVESTMENTSEND 2015
RESERVES
PDL 2 – Kutubu – – – – –
PDL 2/5/6 – Moran Unit – – – – –
PDL 4 – Gobe Main – – – – –
PDL 3/4 – SE Gobe 17.7 1.9 (2.1) – 13.8
PDL 1 – Hides GTE 5.0 0.9 – – 4.1
PNG LNG Project 1,520.6 96.6 – – 1,423.9
Total 1,543.3 99.4 (2.1) – 1,441.8
Proved and Probable gas reserves (billion standard cubic feet)
PDL 2 – Kutubu – – – – –
PDL 2/5/6 – Moran Unit – – – – –
PDL 4 – Gobe Main – – – – –
PDL 3/4 – SE Gobe 23.8 1.9 (4.7) – 17.2
PDL 1 – Hides GTE 6.9 0.9 – – 6.0
PNG LNG Project 2,251.4 96.6 – – 2,154.7
Total 2,282.0 99.4 (4.7) – 2,177.9
2C Contingent gas resources (billion standard cubic feet)
LICENCE/FIELD END 2014
2C RESOURCES PRODUCTION
DISCOVERIES/ EXTENSIONS/
REVISIONSACQUISITIONS/
DIVESTMENTSEND 2015
2C RESOURCES
PNG LNG Project gas 208.3 – – – 208.3
Other PNG gas 3,186.3 – 209.0 – 3,395.3
Middle East gas 134.9 – (128.6) – 6.3
Total 3,529.5 – 80.4 – 3,610.0
2 0 1 5 R E S E R V E S A N D R E S O U R C E S c o n t i n u e d
42
For
per
sona
l use
onl
y

of dry gas and 10.6 mmbbl of condensate in the 2C contingent resource category. The net 2C resource is now estimated at 1,348 bcf of dry gas and 20.2 mmbbl of condensate, reflecting gross 2C resources of 3,500 bcf of dry gas and 52.5 mmbbl of condensate.
Contingent resource volumes were assessed by combining in-place volume estimates from geological modelling with recovery factor estimates from simulation modelling using a deterministic method. They are based on separator conditions in the field, prior to downstream losses,
until downstream processing conditions are better defined. The field is still subject to further drilling (commencing with the P’nyang South 2 well currently scheduled for the second half of 2016) and technical studies, which may further alter the 2C contingent resource estimate.
The P’nyang resources are considered to be contingent on additional drilling, further technical studies, the confirmation of a commercially viable development project and the negotiation of, and commitment to, future LNG contracts.
ELK-ANTELOPE, PRL 15 – POTENTIAL FOR INCREASE IN BOOKED 2C CONTINGENT RESOURCE1,219.4 bcf raw gas has currently been booked in the 2C contingent resource category relating to Oil Search’s 22.835% economic interest in Petroleum Retention Licence 15 (PRL 15) in the Gulf Province of PNG, which contains the Elk-Antelope gas fields.
A licence was granted on 30 November 2010 for a five-year term. In May 2015, an application for a further five-year term was submitted to the PNG Government.
TABLE 3: DEVELOPED AND UNDEVELOPED RESERVES
Developed reserves (net to Oil Search)
PROVED (1P) PROVED AND PROBABLE (2P)
LICENCE/FIELD
OIL SEARCH INTEREST
%
OIL AND CONDENSATE
DEVELOPED(1)
mmbbl
GASDEVELOPED(2),(3)
bscf
OIL AND CONDENSATE
DEVELOPED(1)
mmbbl
GASDEVELOPED(2),(3)
bscf
PDL 2 – Kutubu 60.0% 12.6 – 17.0 –
PDL 2/5/6 – Moran Unit 49.5% 6.1 – 9.4 –
PDL 4 – Gobe 10.0% 0.1 – 0.1 –
PDL 3/4 – SE Gobe 22.3% 0.2 13.8 0.3 17.2
PDL 1 – Hides GTE 16.7% – 4.1 – 6.0
Oil fields and Hides GTE reserves 19.0 17.9 26.8 23.2
PNG LNG Project reserves 29.0% 23.1 1,032.7 39.6 1,594.0
Sub-total developed reserves 42.1 1,050.6 66.4 1,617.3
Undeveloped reserves (net to Oil Search)
PROVED (1P) PROVED AND PROBABLE (2P)
LICENCE/FIELD
OIL SEARCH INTEREST
%
OIL AND CONDENSATE
UNDEVELOPED(1)
mmbbl
GASUNDEVELOPED(2),(3)
bscf
OIL AND CONDENSATE
UNDEVELOPED(1)
mmbbl
GASUNDEVELOPED(2),(3)
bscf
PDL 2 – Kutubu 60.0% 2.8 – 3.0 –
PDL 2/5/6 – Moran Unit 49.5% 2.5 – 2.9 –
PDL 4 – Gobe Main 10.0% – – – –
PDL 3/4 – SE Gobe 22.3% – – – –
PDL 1 – Hides GTE 16.7% – – – –
Oil fields and Hides GTE reserves 5.2 – 5.9 –
PNG LNG Project reserves 29.0% 10.1 391.2 14.9 560.7
Subtotal undeveloped reserves 15.3 391.2 20.8 560.7
Total developed and undeveloped reserves 57.5 1,441.8 87.2 2,177.9
(1) Liquids include crude oil, separator and plant condensates.
(2) For the PNG LNG Project, shrinkage has been applied to raw gas for the field condensate, plant liquids recovery and fuel and flare.
(3) PNG LNG Project reserves comprise the Kutubu complex, Moran, Gobe Main, SE Hedinia, Hides, Angore and Juha fields. In addition, third party gas sales to the Project at the Gobe facility outlet (including LNG plant liquids) have been included for SE Gobe in 1P and 2P reserves according to the post-sales agreement interest (Oil Search - 22.34%). SE Gobe estimates for gas are based on NSAI certification in 2015.
2 0 1 5 R E S E R V E S A N D R E S O U R C E S c o n t i n u e d
43OIL SEARCH Annual Report 2015
For
per
sona
l use
onl
y

The presence of significant quantities of moveable hydrocarbons in the Elk-Antelope fields has been confirmed by the following:
^ Data acquired from eight Elk-Antelope exploration and appraisal wells, commencing in 2006 with the Elk 1 discovery well.
^ The interpretation of data acquired during the drill stem testing of multiple intervals, including the analysis of reservoir hydrocarbon samples recovered to surface.
Preliminary interpretation of recently acquired appraisal data, including the Antelope 5, Antelope 4 and Antelope 4 ST1 appraisal well results and seismic reprocessing, has indicated a positive impact on resources. Subject to a successful outcome from testing of the Antelope 5 well and completion of appraisal drilling and testing of Antelope 6 and the possible drilling of Antelope 7, the 2C contingent resource could increase. Contingent resource volumes are being assessed by combining in-place volume estimates from geological modelling with recovery factor estimates from simulation modelling using a combination of deterministic and probabilistic methods.
The Elk-Antelope resources are considered to be contingent on a number of factors including additional appraisal drilling and technical studies, the confirmation of a commercially viable development project, acceptable project financing and the negotiation of, and commitment to, future LNG contracts.
GOVERNANCE AND 2016 AUDIT PLANThe governance arrangements for the reporting of hydrocarbon reserves and resources are based on Oil Search’s Reserves Management and Audit Procedure (RMAP), which consists of the following:
^ A Technical Reserves Committee (TRC) which assesses all proposed changes and additions to the Company’s reserves and resources database, utilising advice and contributions from peer review and subject matter experts, where appropriate.
^ The TRC reports to the Reserves Operating Committee (ROC), consisting of senior management from technical and commercial disciplines, for the sanction of changes proposed by the TRC.
Final statements are subject to review and endorsement by the Audit and Financial Risk Committee prior to approval by the Board.
Oil FieldsUnder the Company’s RMAP arrangements, oil fields are subject to independent audit every three years or more frequently under some circumstances (for example, if a material change is indicated). The Kutubu and Moran fields were audited at the end of 2014 and the Gobe Main and SE Gobe fields were audited at the end of 2015 by independent auditors, NSAI.
PNG LNG ProjectGas reserves are subject to audit under instruction from the PNG LNG Project operator, ExxonMobil PNG Limited. Given the substantial amount of new information now available following the cessation of development drilling at Hides and Angore, together with more than18 months of gas production at Hides and the Associated Gas (AG) fields, ExxonMobil has elected to recertify all Project gas reserves in 2016, using NSAI as the independent auditor. Oil Search will play a leading part in the recertification of the Associated Gas (AG) field reserves during this exercise.
PRL 3Gas resources at P’nyang (PRL 3) are likely to be recertified in 2017, based on advice from the operator, ExxonMobil PNG Limited.
PRL 15Under the Sale and Purchase Agreement with the sellers of the Pac LNG group of Companies, the Elk and Antelope fields within PRL 15 are subject to two independent certifications.
The First Certification commenced in March 2016, with completion expected in mid-2016. The Second Certification will occur one year after delivery of the first commercial LNG cargo.
2 0 1 5 R E S E R V E S A N D R E S O U R C E S c o n t i n u e d
Hides Gas Conditioning Plant in the PNG Highlands. Photo courtesy of ExxonMobil.
44
For
per
sona
l use
onl
y

2 0 1 5 R E S E R V E S A N D R E S O U R C E S c o n t i n u e d
TABLE 4: TOTAL RESERVES AND RESOURCES SUMMARY
Reserves and resources at 31 December 2015(1),(2) (net to Oil Search)
PROVED (1P) PROVED AND PROBABLE (2P)
LICENCE/FIELD
OIL SEARCH INTEREST
%
OIL AND CONDENSATE
TOTAL(3)
mmbbl
GASTOTAL(4)
bscf
OIL AND CONDENSATE
TOTAL(3)
mmbbl
GASTOTAL(4)
bscf
RESERVES
PDL 2 – Kutubu 60.0% 15.4 – 20.0 –
PDL 2/5/6 – Moran Unit 49.5% 8.6 – 12.2 –
PDL 4 – Gobe 10.0% 0.1 – 0.1 –
PDL 3/4 – SE Gobe(5) 22.3% 0.2 13.8 0.3 17.2
PDL 1 – Hides GTE(6) 16.7% – 4.1 – 6.0
Oil fields and Hides GTE reserves 24.3 17.9 32.7 23.2
PNG LNG Project reserves(5) 29.0% 33.2 1,423.9 54.5 2,154.7
Sub-total reserves 57.5 1,441.8 87.2 2,177.9
CONTINGENT RESOURCES 1C 2C
PNG LNG Project gas and oil and condensate – – 1.7 208.3
Other PNG gas, oil and condensate(7) – – 33.6 3,395.3
Middle East gas, oil and condensate(7) – – 21.9 6.3
Sub-total resources – – 57.1 3,610.0
Total reserves and resources 57.5 1,441.8 144.3 5,787.9
(1) Numbers may not add due to rounding.
(2) Oil field proved (1P) and proved and probable (2P) reserves are as certified by independent auditors Netherland, Sewell & Associates, Inc. (NSAI) in 2014 and 2015. 1P PNG LNG Project reserves are as certified in 2008 by independent auditors, NSAI. 2P PNG LNG Project reserves and 2C contingent resources are based on a combination of independent audit, PNG LNG Project operator and internal assessments.
(3) Liquids include crude oil, separator and plant condensates.
(4) For the PNG LNG Project, shrinkage has been applied to raw gas for the field condensate, plant liquids recovery and fuel and flare.
(5) PNG LNG Project reserves comprise the Kutubu complex, Moran, Gobe Main, SE Hedinia, Hides, Angore and Juha fields. In addition, third party gas sales to the Project at the Gobe facility outlet (including LNG plant liquids) have been included for SE Gobe in 1P and 2P reserves according to the post-sales agreement interest (Oil Search - 22.34%). SE Gobe estimates for gas are based on NSAI certification in 2015.
(6) Hides reserves associated with the GTE Project under existing contract. Production volumes shown in this reserves report are based on Oil Search’s entitlement of PDL 1 (16.67%).
(7) Other gas, oil and condensate resources comprise the Company’s other fields including SE Mananda, Juha North, P’nyang, Kimu, Uramu, Barikewa, Iehi, Cobra, Mananda, Flinders, Taza and Al Meashar-1, and may also include resources beyond the current economic limit of producing oil and gas fields. These gas resources may include fuel, flare and shrinkage depending on the choice of reference point.
ADDITIONAL NOTES
^ The evaluation date for these estimates is 31 December 2015.
^ The following reference points are assumed:
Oil field liquids: the inlet to the refinery at the Central Processing FacilityHides GTE: the custody transfer point at the wellheadPNG LNG Project: the outlet to the LNG plantSE Gobe gas: the outlet to the Gobe facilityFuel, flare and shrinkage upstream of the reference points have been excluded.
^ Reserves and contingent resources are aggregated by arithmetic summation by category and therefore proved reserves may be a conservative estimate due to the portfolio effects of arithmetic summation.
^ Reserves and contingent resources have been estimated using both deterministic and probabilistic methods.
^ The information in this reserves and resources statement has been prepared by Dr Jon Rowse, Oil Search’s General Manager – Subsurface, who is a full-time employee of the Company and a member of the Society of Petroleum Engineers. Dr Rowse is qualified in accordance with ASX Listing Rules 5.41-5.44, and confirms that the statement fairly represents information and documentation which has been prepared under his supervision and approved by him. He has consented to publish this information in the form and context in which it is presented in this statement.
45OIL SEARCH Annual Report 2015
For
per
sona
l use
onl
y

L I C E N C E I N T E R E S T S2015
PORT MORESBY
GOBE MAINSE GOBE
USANO
KUTUBU
MORAN
BILIP
BARIKEWA
SE HEDINIA
HAGANAFLINDERS
ELK-ANTELOPE
COBRA
P'NYANG
ANGORE
URAMU
HIDES
P'NYANGSOUTH
IEHIKIMU
JUHA NORTH
HIDES GAS CONDITIONING PLANT
KUMUL TERMINAL
PNG LNG PLANT
CENTRAL PROCESSING FACILITY
GOBE PROCESSING FACILITY
PPL 269PRL 3
PRL 15
PPL 385
PPL 260
PPL 244
PPL 402
PPL 339
PPL 277
PPL 339
PRL 10
PRL 8PRL 9
PRL 14
PDL 4PDL 2
PDL 6 PDL 5
PDL 1
PDL 8
PDL 9
PDL 7
PPL 464
PPL 395
PDL 3
Papua New Guinea
BISMARCK SEA
GULF OF PAPUA
PPL 339
PPL 339
PPL 339
PPL 339
PPL 339
PPL 339 PPL 339
PPL 277
PPL 260
100km0
PROPOSED P’NYANG PIPELINE
PROPOSED CENTRAL PROCESSING FACILITY
JUHA
MANANDAAPDL 11
SE MANANDAAGOGO
PROPOSED JUHA FACILITY
PROPOSED PAPUA LNG PLANT
LEGEND
Gas Pipeline Condensate Pipeline Proposed Gas Pipeline Oil Pipeline Facility Gas Field Oil Field Oil & Gas Field
Operated PDL Operated PRL Operated PPL PDL with OSH Interests PRL with OSH Interests PPL with OSH Interests
46
For
per
sona
l use
onl
y

LICENCE INTERESTS AS AT 24 FEBRUARY 2016
LICENCE FIELD/PROJECT OIL SEARCH INTEREST % OPERATORPNG Petroleum Development Licences (PDL)
PDL 1 Hides 16.66 ExxonMobil
PDL 2 Kutubu, Moran 60.05 Oil Search
PDL 2 - SE Mananda JV SE Mananda 72.27 Oil Search
PDL 3 SE Gobe 36.36 Santos
PDL 4 Gobe Main, SE Gobe 10.00 Oil Search
PDL 5 Moran 40.69 ExxonMobil
PDL 6 Moran 71.07 Oil Search
SE Gobe Unit (PDL 3/PDL 4) 22.34(1) Oil Search
Moran Unit (PDL 2/PDL 5/PDL 6) 49.51 Oil Search
Hides Gas to Electricity Project (PDL 1) 100.00 Oil Search
PDL 7 South Hides 40.69 ExxonMobil
PDL 8 Angore 40.69 ExxonMobil
PDL 9 Juha 24.42 ExxonMobil
APDL 11 Mananda 71.25(2) Oil Search
APDL 13 P’nyang 38.51(3) ExxonMobil
PNG LNG Project PNG LNG Project 29.00 ExxonMobil
PNG Pipeline Licences (PL)
PL 1 Hides 100.00 Oil Search
PL 2 Kutubu 60.05 Oil Search
PL 3 Gobe 17.78 Oil Search
PL 4 PNG LNG Project 29.00 ExxonMobil
PL 5 PNG LNG Project 29.00 ExxonMobil
PL 6 PNG LNG Project 29.00 ExxonMobil
PL 7 PNG LNG Project 29.00 ExxonMobil
PL 8 PNG LNG Project 29.00 ExxonMobil
PNG Petroleum Processing Facility Licence
PPFL 2 PNG LNG Project 29.00 ExxonMobil
PNG Petroleum Retention Licences (PRL)
PRL 8 Kimu 60.71 Oil Search
PRL 9 Barikewa 45.11 Oil Search
PRL 10 Uramu 100.00(4) Oil Search
PRL 14 Cobra, Iehi 62.56 Oil Search
PRL 15 Elk-Antelope 22.84 Total
PNG Petroleum Prospecting Licences (PPL)
PPL 244 40.00 Oil Search
PPL 260 40.00 Oil Search
PPL 269 10.00(5) Repsol
PPL 277 50.00 ExxonMobil
PPL 339 70.00(6) Oil Search
PPL 385 100.00 Oil Search
PPL 402 50.00(7) Oil Search
PPL 464 50.00 ExxonMobil
PNG Farm-in Agreements
PPL 395 100.00(8) Taurus
International
Block 7, Yemen 34.00(9) Oil Search
Taza (K42), Kurdistan Region of Iraq 60.00(10) Oil Search
(1) With effect from 1 February 2016, Oil Search’s gas unit interests in the SE Gobe Unit decreased from 25.55% to 22.34% in line with the provisions of the relevant unitisation and unit operating agreement, as amended. Despite that change, Oil Search’s registered licence interests in PDL 3 and PDL 4 remain unchanged from the prior year.
(2) Pending Ministerial grant.
(3) In February 2015, a PDL application was submitted by the PRL 3 joint venture in respect of the P’nyang field. The application remains pending Ministerial grant.
(4) In December 2015, Oil Search and Total agreed to cancel their 2012 farm-out agreement under which Total had a right to potentially acquire a 50% interest in PRL 10.
(5) In February 2015, Oil Search obtained regulatory approval of its acquisition from Mitsubishi Corporation of a 10% interest in PPL 269.
(6) In November 2015, Oil Search completed the acquisition from Kina Petroleum Limited of a 70% interest in PPL 339 under the parties’ 2010 farm-in agreement. In December 2015, Oil Search and Total agreed to: (1) cancel their 2012 farm-out agreement under which Total had a right to potentially acquire a 35% interest in PPL 339 and (2) enter into a new farm-out agreement under which Total will, subject to regulatory and other approvals, acquire a 35% interest in PPL 339.
(7) In March 2015, Oil Search completed the sale to ExxonMobil of a 50% interest in PPL 402.
(8) In May 2015, Oil Search entered into an agreement with Taurus Oil Limited to potentially acquire a 100% interest in PPL 395. In December 2015, Oil Search entered an agreement with ExxonMobil under which ExxonMobil has an option to potentially acquire from Oil Search a 50% interest in PPL 395 after completion of Oil Search’s acquisition from Taurus of a 100% interest in the licence.
(9) 40% paying interest. In April 2015, Oil Search entered into an agreement with Petsec Energy Limited under which Petsec will, subject to customary conditions precedent including regulatory and other approvals, acquire all of the shares in the entity holding Oil Search’s interest in Block 7.
(10) 75% paying interest.
OIL SEARCH Annual Report 2015 47
For
per
sona
l use
onl
y
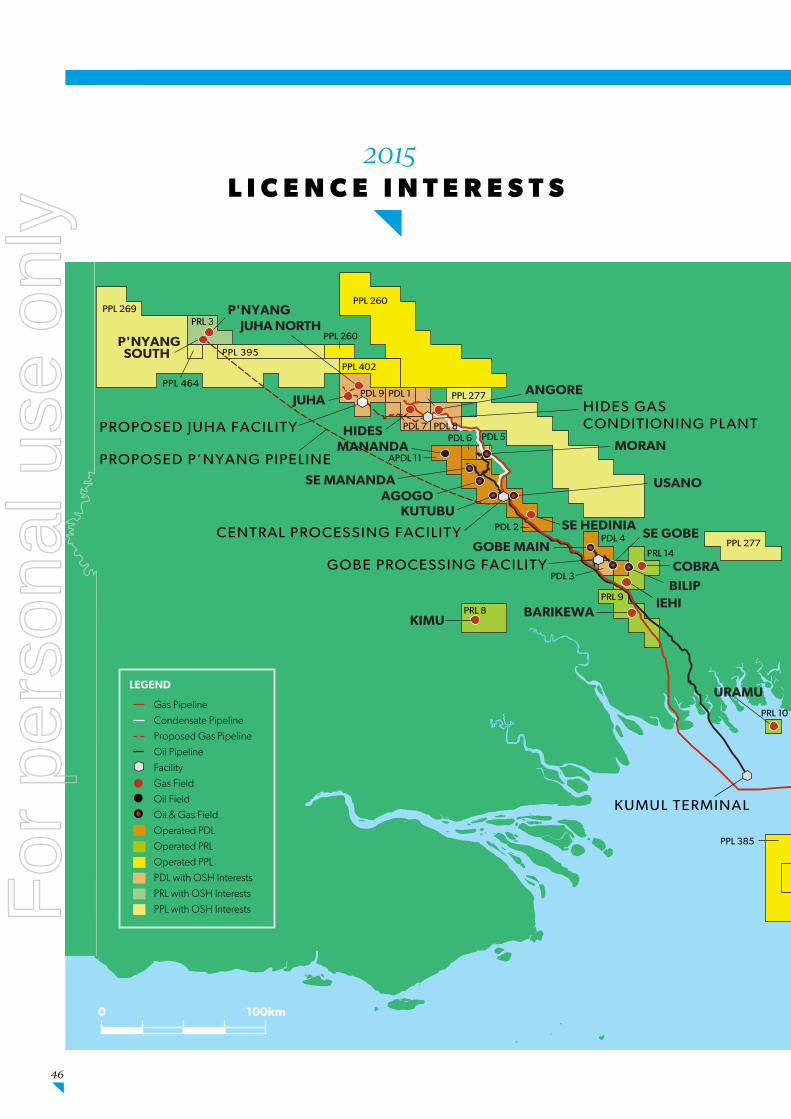
PORT MORESBY
GOBE MAINSE GOBE
USANO
KUTUBU
MORAN
BILIP
BARIKEWA
SE HEDINIA
HAGANAFLINDERS
ELK-ANTELOPE
COBRA
P'NYANG
ANGORE
URAMU
HIDES
P'NYANGSOUTH
IEHIKIMU
JUHA NORTH
HIDES GAS CONDITIONING PLANT
KUMUL TERMINAL
PNG LNG PLANT
CENTRAL PROCESSING FACILITY
GOBE PROCESSING FACILITY
PPL 269PRL 3
PRL 15
PPL 385
PPL 260
PPL 244
PPL 402
PPL 339
PPL 277
PPL 339
PRL 10
PRL 8PRL 9
PRL 14
PDL 4PDL 2
PDL 6 PDL 5
PDL 1
PDL 8
PDL 9
PDL 7
PPL 464
PPL 395
PDL 3
Papua New Guinea
BISMARCK SEA
GULF OF PAPUA
PPL 339
PPL 339
PPL 339
PPL 339
PPL 339
PPL 339 PPL 339
PPL 277
PPL 260
100km0
PROPOSED P’NYANG PIPELINE
PROPOSED CENTRAL PROCESSING FACILITY
JUHA
MANANDAAPDL 11
SE MANANDAAGOGO
PROPOSED JUHA FACILITY
PROPOSED PAPUA LNG PLANT
L I C E N C E I N T E R E S T S2015
LEGEND
Gas Pipeline Condensate Pipeline Proposed Gas Pipeline Oil Pipeline Facility Gas Field Oil Field Oil & Gas Field
Operated PDL Operated PRL Operated PPL PDL with OSH Interests PRL with OSH Interests PPL with OSH Interests
46
For
per
sona
l use
onl
y

PORT MORESBY
GOBE MAINSE GOBE
USANO
KUTUBU
MORAN
BILIP
BARIKEWA
SE HEDINIA
HAGANAFLINDERS
ELK-ANTELOPE
COBRA
P'NYANG
ANGORE
URAMU
HIDES
P'NYANGSOUTH
IEHIKIMU
JUHA NORTH
HIDES GAS CONDITIONING PLANT
KUMUL TERMINAL
PNG LNG PLANT
CENTRAL PROCESSING FACILITY
GOBE PROCESSING FACILITY
PPL 269PRL 3
PRL 15
PPL 385
PPL 260
PPL 244
PPL 402
PPL 339
PPL 277
PPL 339
PRL 10
PRL 8PRL 9
PRL 14
PDL 4PDL 2
PDL 6 PDL 5
PDL 1
PDL 8
PDL 9
PDL 7
PPL 464
PPL 395
PDL 3
Papua New Guinea
BISMARCK SEA
GULF OF PAPUA
PPL 339
PPL 339
PPL 339
PPL 339
PPL 339
PPL 339 PPL 339
PPL 277
PPL 260
100km0
PROPOSED P’NYANG PIPELINE
PROPOSED CENTRAL PROCESSING FACILITY
JUHA
MANANDAAPDL 11
SE MANANDAAGOGO
PROPOSED JUHA FACILITY
PROPOSED PAPUA LNG PLANT
OIL SEARCH Annual Report 2015
GULF OF ADEN
PERSIAN GULF
Iraq
U.A.E.
Yemen
CASPIANSEA
KURDISTAN REGION OF IRAQ
Taza
Block 7
1,000km0
RED SEA
MEDITERRANEANSEA
LEGEND
Operated LicenceFor
per
sona
l use
onl
y

G O V E R N A N C EStrong
Pictured from left to right: RJ Lee (Chairman); ZE Switkowski; AJ Kantsler; B Philemon; PR Botten; EJ Doyle (Appointed in February 2016); G Aopi; KW Spence; KG Constantinou.
48
For
per
sona
l use
onl
y

FE Harris (Resigned in December 2015)
OIL SEARCH Annual Report 2015 49
For
per
sona
l use
onl
y
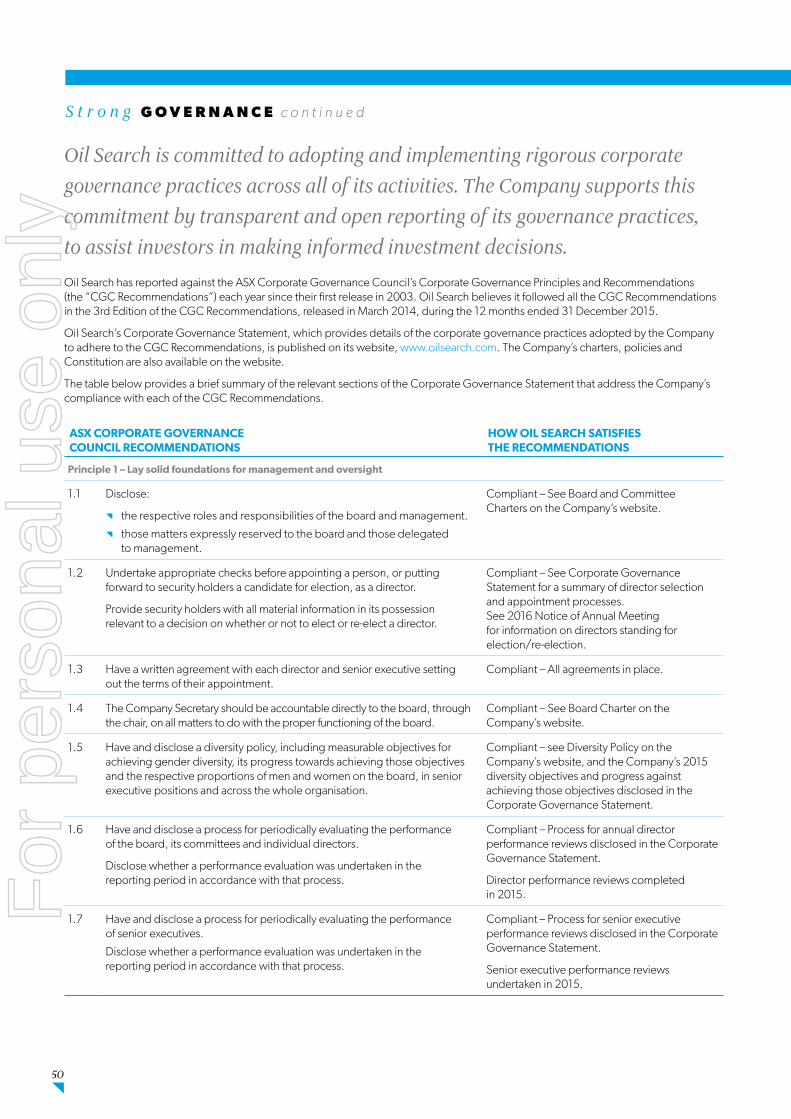
Oil Search is committed to adopting and implementing rigorous corporate governance practices across all of its activities. The Company supports this commitment by transparent and open reporting of its governance practices, to assist investors in making informed investment decisions.
Oil Search has reported against the ASX Corporate Governance Council’s Corporate Governance Principles and Recommendations (the “CGC Recommendations”) each year since their first release in 2003. Oil Search believes it followed all the CGC Recommendations in the 3rd Edition of the CGC Recommendations, released in March 2014, during the 12 months ended 31 December 2015.
Oil Search’s Corporate Governance Statement, which provides details of the corporate governance practices adopted by the Company to adhere to the CGC Recommendations, is published on its website, www.oilsearch.com. The Company’s charters, policies and Constitution are also available on the website.
The table below provides a brief summary of the relevant sections of the Corporate Governance Statement that address the Company’s compliance with each of the CGC Recommendations.
ASX CORPORATE GOVERNANCE COUNCIL RECOMMENDATIONS
HOW OIL SEARCH SATISFIES THE RECOMMENDATIONS
Principle 1 – Lay solid foundations for management and oversight
1.1 Disclose:
^ the respective roles and responsibilities of the board and management.
^ those matters expressly reserved to the board and those delegated to management.
Compliant – See Board and Committee Charters on the Company’s website.
1.2 Undertake appropriate checks before appointing a person, or putting forward to security holders a candidate for election, as a director.
Provide security holders with all material information in its possession relevant to a decision on whether or not to elect or re-elect a director.
Compliant – See Corporate Governance Statement for a summary of director selection and appointment processes. See 2016 Notice of Annual Meeting for information on directors standing for election/re-election.
1.3 Have a written agreement with each director and senior executive setting out the terms of their appointment.
Compliant – All agreements in place.
1.4 The Company Secretary should be accountable directly to the board, through the chair, on all matters to do with the proper functioning of the board.
Compliant – See Board Charter on the Company’s website.
1.5 Have and disclose a diversity policy, including measurable objectives for achieving gender diversity, its progress towards achieving those objectives and the respective proportions of men and women on the board, in senior executive positions and across the whole organisation.
Compliant – see Diversity Policy on the Company’s website, and the Company’s 2015 diversity objectives and progress against achieving those objectives disclosed in the Corporate Governance Statement.
1.6 Have and disclose a process for periodically evaluating the performance of the board, its committees and individual directors.
Disclose whether a performance evaluation was undertaken in the reporting period in accordance with that process.
Compliant – Process for annual director performance reviews disclosed in the Corporate Governance Statement.
Director performance reviews completed in 2015.
1.7 Have and disclose a process for periodically evaluating the performance of senior executives.
Disclose whether a performance evaluation was undertaken in the reporting period in accordance with that process.
Compliant – Process for senior executive performance reviews disclosed in the Corporate Governance Statement.
Senior executive performance reviews undertaken in 2015.
S t r o n g G O V E R N A N C E c o n t i n u e d
50
For
per
sona
l use
onl
y
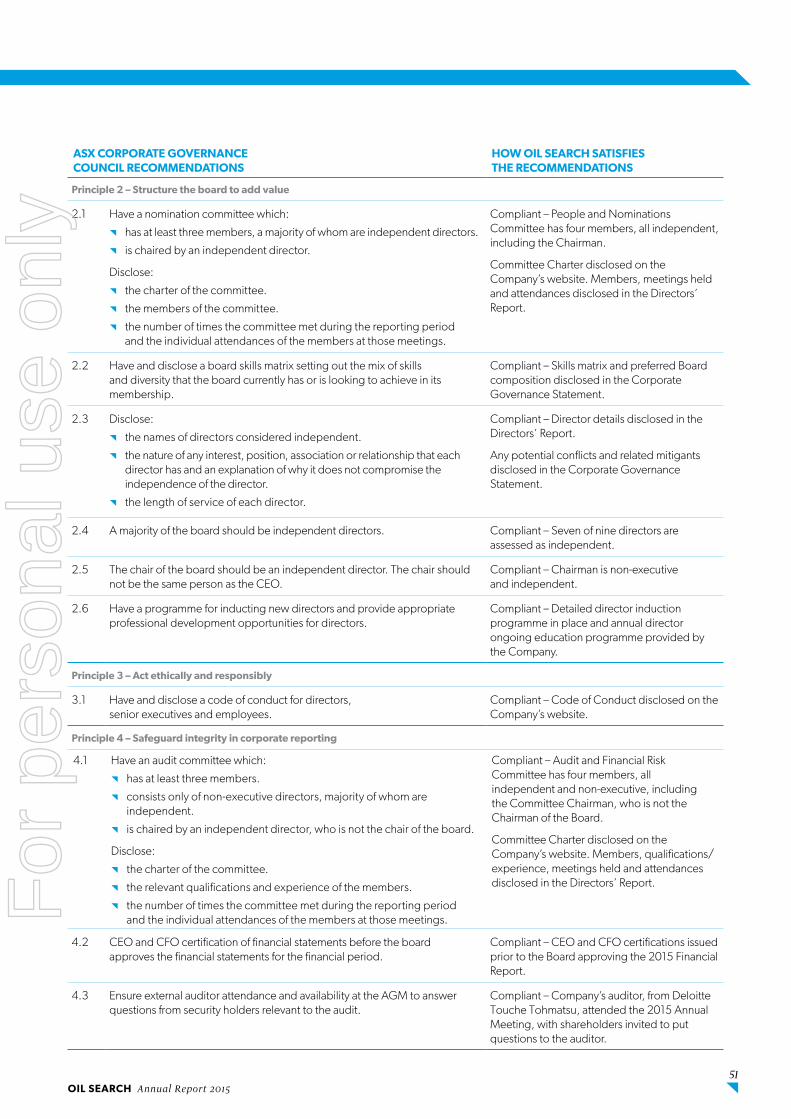
ASX CORPORATE GOVERNANCE COUNCIL RECOMMENDATIONS
HOW OIL SEARCH SATISFIES THE RECOMMENDATIONS
Principle 2 – Structure the board to add value
2.1 Have a nomination committee which:
^ has at least three members, a majority of whom are independent directors.
^ is chaired by an independent director.
Disclose:
^ the charter of the committee.
^ the members of the committee.
^ the number of times the committee met during the reporting period and the individual attendances of the members at those meetings.
Compliant – People and Nominations Committee has four members, all independent, including the Chairman.
Committee Charter disclosed on the Company’s website. Members, meetings held and attendances disclosed in the Directors’ Report.
2.2 Have and disclose a board skills matrix setting out the mix of skills and diversity that the board currently has or is looking to achieve in its membership.
Compliant – Skills matrix and preferred Board composition disclosed in the Corporate Governance Statement.
2.3 Disclose:
^ the names of directors considered independent.
^ the nature of any interest, position, association or relationship that each director has and an explanation of why it does not compromise the independence of the director.
^ the length of service of each director.
Compliant – Director details disclosed in the Directors’ Report.
Any potential conflicts and related mitigants disclosed in the Corporate Governance Statement.
2.4 A majority of the board should be independent directors. Compliant – Seven of nine directors are assessed as independent.
2.5 The chair of the board should be an independent director. The chair should not be the same person as the CEO.
Compliant – Chairman is non-executive and independent.
2.6 Have a programme for inducting new directors and provide appropriate professional development opportunities for directors.
Compliant – Detailed director induction programme in place and annual director ongoing education programme provided by the Company.
Principle 3 – Act ethically and responsibly
3.1 Have and disclose a code of conduct for directors, senior executives and employees.
Compliant – Code of Conduct disclosed on the Company’s website.
Principle 4 – Safeguard integrity in corporate reporting
4.1 Have an audit committee which:
^ has at least three members.
^ consists only of non-executive directors, majority of whom are independent.
^ is chaired by an independent director, who is not the chair of the board.
Disclose:
^ the charter of the committee.
^ the relevant qualifications and experience of the members.
^ the number of times the committee met during the reporting period and the individual attendances of the members at those meetings.
Compliant – Audit and Financial Risk Committee has four members, all independent and non-executive, including the Committee Chairman, who is not the Chairman of the Board.
Committee Charter disclosed on the Company’s website. Members, qualifications/experience, meetings held and attendances disclosed in the Directors’ Report.
4.2 CEO and CFO certification of financial statements before the board approves the financial statements for the financial period.
Compliant – CEO and CFO certifications issued prior to the Board approving the 2015 Financial Report.
4.3 Ensure external auditor attendance and availability at the AGM to answer questions from security holders relevant to the audit.
Compliant – Company’s auditor, from Deloitte Touche Tohmatsu, attended the 2015 Annual Meeting, with shareholders invited to put questions to the auditor.
S t r o n g G O V E R N A N C E c o n t i n u e d
OIL SEARCH Annual Report 2015 51
For
per
sona
l use
onl
y
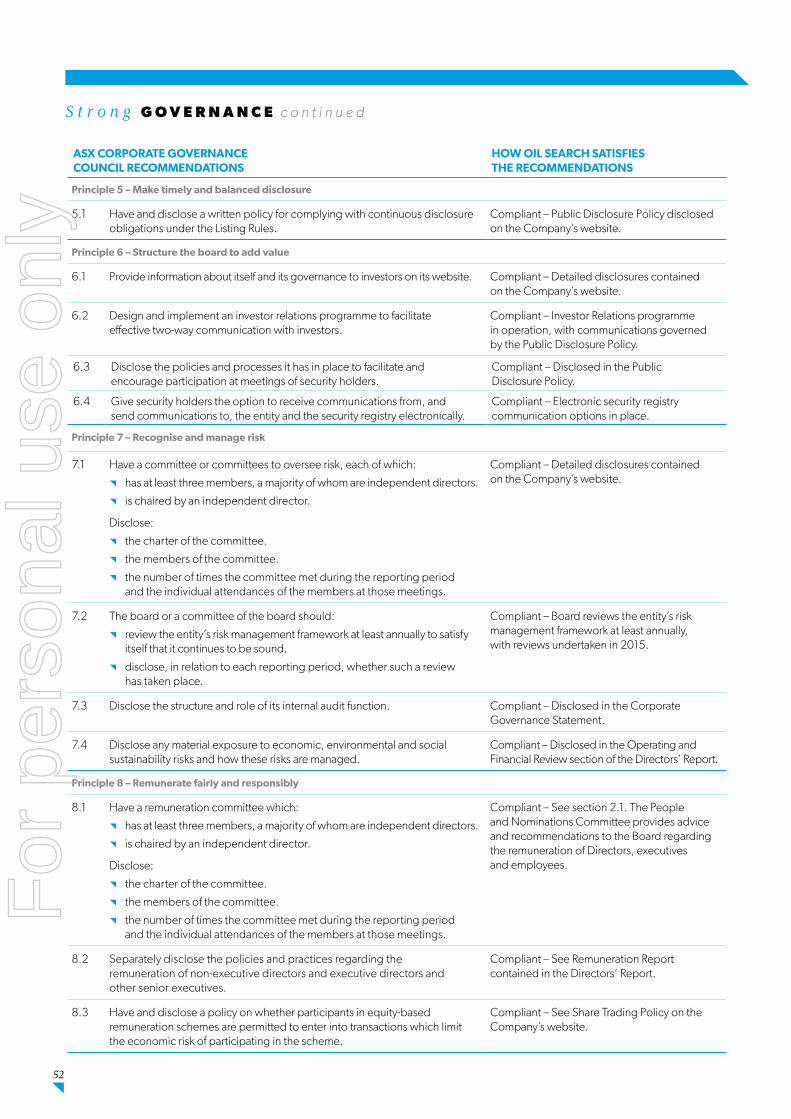
ASX CORPORATE GOVERNANCE COUNCIL RECOMMENDATIONS
HOW OIL SEARCH SATISFIES THE RECOMMENDATIONS
Principle 5 – Make timely and balanced disclosure
5.1 Have and disclose a written policy for complying with continuous disclosure obligations under the Listing Rules.
Compliant – Public Disclosure Policy disclosed on the Company’s website.
Principle 6 – Structure the board to add value
6.1 Provide information about itself and its governance to investors on its website. Compliant – Detailed disclosures contained on the Company’s website.
6.2 Design and implement an investor relations programme to facilitate effective two-way communication with investors.
Compliant – Investor Relations programme in operation, with communications governed by the Public Disclosure Policy.
6.3 Disclose the policies and processes it has in place to facilitate and encourage participation at meetings of security holders.
Compliant – Disclosed in the Public Disclosure Policy.
6.4 Give security holders the option to receive communications from, and send communications to, the entity and the security registry electronically.
Compliant – Electronic security registry communication options in place.
Principle 7 – Recognise and manage risk
7.1 Have a committee or committees to oversee risk, each of which:
^ has at least three members, a majority of whom are independent directors.
^ is chaired by an independent director.
Disclose:
^ the charter of the committee.
^ the members of the committee.
^ the number of times the committee met during the reporting period and the individual attendances of the members at those meetings.
Compliant – Detailed disclosures contained on the Company’s website.
7.2 The board or a committee of the board should:
^ review the entity’s risk management framework at least annually to satisfy itself that it continues to be sound.
^ disclose, in relation to each reporting period, whether such a review has taken place.
Compliant – Board reviews the entity’s risk management framework at least annually, with reviews undertaken in 2015.
7.3 Disclose the structure and role of its internal audit function. Compliant – Disclosed in the Corporate Governance Statement.
7.4 Disclose any material exposure to economic, environmental and social sustainability risks and how these risks are managed.
Compliant – Disclosed in the Operating and Financial Review section of the Directors’ Report.
Principle 8 – Remunerate fairly and responsibly
8.1 Have a remuneration committee which:
^ has at least three members, a majority of whom are independent directors.
^ is chaired by an independent director.
Disclose:
^ the charter of the committee.
^ the members of the committee.
^ the number of times the committee met during the reporting period and the individual attendances of the members at those meetings.
Compliant – See section 2.1. The People and Nominations Committee provides advice and recommendations to the Board regarding the remuneration of Directors, executives and employees.
8.2 Separately disclose the policies and practices regarding the remuneration of non-executive directors and executive directors and other senior executives.
Compliant – See Remuneration Report contained in the Directors’ Report.
8.3 Have and disclose a policy on whether participants in equity-based remuneration schemes are permitted to enter into transactions which limit the economic risk of participating in the scheme.
Compliant – See Share Trading Policy on the Company’s website.
S t r o n g G O V E R N A N C E c o n t i n u e d
52
For
per
sona
l use
onl
y

OIL SEARCH Annual Report 2015 51
S t r o n g G O V E R N A N C E c o n t i n u e d
2015C O N S O L I D A T E D F I N A N C I A L R E P O R T
f o r t h e y e a r e n d e d 3 1 D e c e m b e r 2 0 1 5
^
OIL SEARCH Annual Report 2015 53
For
per
sona
l use
onl
y

54
2015C O N S O L I D A T E D F I N A N C I A L R E P O R T
f o r t h e y e a r e n d e d 3 1 D e c e m b e r 2 0 1 5
DIRECTORS’ REPORT . . . . . . . . . . . . . . . . . . . . . . . . . . . . . . . . . . . . . . . . . . . . . . . . . . . . . . . . . . . . . . . . . . . . . . . . . . . . . . . . . . . . . . . .55
AUDITOR’S INDEPENDENCE DECLARATION . . . . . . . . . . . . . . . . . . . . . . . . . . . . . . . . . . . . . . . . . . . . . . . . . . . . . . . . . . . . . . . . . . . .87
STATEMENTS OF COMPREHENSIVE INCOME . . . . . . . . . . . . . . . . . . . . . . . . . . . . . . . . . . . . . . . . . . . . . . . . . . . . . . . . . . . . . . . . . . . .88
STATEMENTS OF FINANCIAL POSITION . . . . . . . . . . . . . . . . . . . . . . . . . . . . . . . . . . . . . . . . . . . . . . . . . . . . . . . . . . . . . . . . . . . . . . . .89
STATEMENTS OF CASH FLOWS . . . . . . . . . . . . . . . . . . . . . . . . . . . . . . . . . . . . . . . . . . . . . . . . . . . . . . . . . . . . . . . . . . . . . . . . . . . . . . . .90
STATEMENTS OF CHANGES IN EQUITY . . . . . . . . . . . . . . . . . . . . . . . . . . . . . . . . . . . . . . . . . . . . . . . . . . . . . . . . . . . . . . . . . . . . . . . . . 91
NOTES TO THE FINANCIAL STATEMENTS
1 Significant accounting policies . . . . . . . . . . . . . . . . . . . . . . . . . . . . . . . . . . . . . . . . . . . . . . . . . . . . . . . . . . . . . . . . . . . . . . . . . . . 93
2 Segment reporting . . . . . . . . . . . . . . . . . . . . . . . . . . . . . . . . . . . . . . . . . . . . . . . . . . . . . . . . . . . . . . . . . . . . . . . . . . . . . . . . . . . . . 98
3 Revenue . . . . . . . . . . . . . . . . . . . . . . . . . . . . . . . . . . . . . . . . . . . . . . . . . . . . . . . . . . . . . . . . . . . . . . . . . . . . . . . . . . . . . . . . . . . . . . 99
4 Cost of sales . . . . . . . . . . . . . . . . . . . . . . . . . . . . . . . . . . . . . . . . . . . . . . . . . . . . . . . . . . . . . . . . . . . . . . . . . . . . . . . . . . . . . . . . . . 99
5 Other expenses . . . . . . . . . . . . . . . . . . . . . . . . . . . . . . . . . . . . . . . . . . . . . . . . . . . . . . . . . . . . . . . . . . . . . . . . . . . . . . . . . . . . . . 100
6 Net finance costs . . . . . . . . . . . . . . . . . . . . . . . . . . . . . . . . . . . . . . . . . . . . . . . . . . . . . . . . . . . . . . . . . . . . . . . . . . . . . . . . . . . . . 100
7 Income tax . . . . . . . . . . . . . . . . . . . . . . . . . . . . . . . . . . . . . . . . . . . . . . . . . . . . . . . . . . . . . . . . . . . . . . . . . . . . . . . . . . . . . . . . . . . 100
8 Earnings per share . . . . . . . . . . . . . . . . . . . . . . . . . . . . . . . . . . . . . . . . . . . . . . . . . . . . . . . . . . . . . . . . . . . . . . . . . . . . . . . . . . . . 101
9 Dividends paid or proposed . . . . . . . . . . . . . . . . . . . . . . . . . . . . . . . . . . . . . . . . . . . . . . . . . . . . . . . . . . . . . . . . . . . . . . . . . . . . 102
10 Receivables . . . . . . . . . . . . . . . . . . . . . . . . . . . . . . . . . . . . . . . . . . . . . . . . . . . . . . . . . . . . . . . . . . . . . . . . . . . . . . . . . . . . . . . . . . 102
11 Inventories . . . . . . . . . . . . . . . . . . . . . . . . . . . . . . . . . . . . . . . . . . . . . . . . . . . . . . . . . . . . . . . . . . . . . . . . . . . . . . . . . . . . . . . . . . . 102
12 Other financial assets . . . . . . . . . . . . . . . . . . . . . . . . . . . . . . . . . . . . . . . . . . . . . . . . . . . . . . . . . . . . . . . . . . . . . . . . . . . . . . . . . . 103
13 Exploration and evaluation assets . . . . . . . . . . . . . . . . . . . . . . . . . . . . . . . . . . . . . . . . . . . . . . . . . . . . . . . . . . . . . . . . . . . . . . . . 103
14 Property, plant and equipment . . . . . . . . . . . . . . . . . . . . . . . . . . . . . . . . . . . . . . . . . . . . . . . . . . . . . . . . . . . . . . . . . . . . . . . . . . 104
15 Payables . . . . . . . . . . . . . . . . . . . . . . . . . . . . . . . . . . . . . . . . . . . . . . . . . . . . . . . . . . . . . . . . . . . . . . . . . . . . . . . . . . . . . . . . . . . . 104
16 Provisions . . . . . . . . . . . . . . . . . . . . . . . . . . . . . . . . . . . . . . . . . . . . . . . . . . . . . . . . . . . . . . . . . . . . . . . . . . . . . . . . . . . . . . . . . . . 105
17 Borrowings . . . . . . . . . . . . . . . . . . . . . . . . . . . . . . . . . . . . . . . . . . . . . . . . . . . . . . . . . . . . . . . . . . . . . . . . . . . . . . . . . . . . . . . . . . 105
18 Share capital and reserves . . . . . . . . . . . . . . . . . . . . . . . . . . . . . . . . . . . . . . . . . . . . . . . . . . . . . . . . . . . . . . . . . . . . . . . . . . . . . . 106
19 Statement of cash flows . . . . . . . . . . . . . . . . . . . . . . . . . . . . . . . . . . . . . . . . . . . . . . . . . . . . . . . . . . . . . . . . . . . . . . . . . . . . . . . . 107
20 Employee benefits and share-based payments . . . . . . . . . . . . . . . . . . . . . . . . . . . . . . . . . . . . . . . . . . . . . . . . . . . . . . . . . . . . . 108
21 Key management personnel remuneration . . . . . . . . . . . . . . . . . . . . . . . . . . . . . . . . . . . . . . . . . . . . . . . . . . . . . . . . . . . . . . . . . .111
22 Key management personnel transactions . . . . . . . . . . . . . . . . . . . . . . . . . . . . . . . . . . . . . . . . . . . . . . . . . . . . . . . . . . . . . . . . . . 112
23 Commitments . . . . . . . . . . . . . . . . . . . . . . . . . . . . . . . . . . . . . . . . . . . . . . . . . . . . . . . . . . . . . . . . . . . . . . . . . . . . . . . . . . . . . . . . 113
24 Auditor’s remuneration . . . . . . . . . . . . . . . . . . . . . . . . . . . . . . . . . . . . . . . . . . . . . . . . . . . . . . . . . . . . . . . . . . . . . . . . . . . . . . . . . 113
25 Subsidiaries and interests in joint arrangements . . . . . . . . . . . . . . . . . . . . . . . . . . . . . . . . . . . . . . . . . . . . . . . . . . . . . . . . . . . . . 114
26 Financial and capital risk management . . . . . . . . . . . . . . . . . . . . . . . . . . . . . . . . . . . . . . . . . . . . . . . . . . . . . . . . . . . . . . . . . . . . 116
27 Events occurring after the reporting period . . . . . . . . . . . . . . . . . . . . . . . . . . . . . . . . . . . . . . . . . . . . . . . . . . . . . . . . . . . . . . . . 120
DIRECTORS’ DECLARATION . . . . . . . . . . . . . . . . . . . . . . . . . . . . . . . . . . . . . . . . . . . . . . . . . . . . . . . . . . . . . . . . . . . . . . . . . . . . . . . . . 121
INDEPENDENT AUDITOR’S REPORT . . . . . . . . . . . . . . . . . . . . . . . . . . . . . . . . . . . . . . . . . . . . . . . . . . . . . . . . . . . . . . . . . . . . . . . . . . .122
For
per
sona
l use
onl
y

OIL SEARCH Annual Report 2015 55
D I R E C T O R S ’ R E P O R T
f o r t h e y e a r e n d e d 3 1 D e c e m b e r 2 0 1 5
The directors submit their report for the financial year ended 31 December 2015 .
DIRECTORSThe names, details and shareholdings of the directors of the company in office during or since the end of the financial year are:
Mr RJ Lee, BEng (Chem) (Hons), MA (Oxon), FAICD, (Chairman) Non-Executive, 65 yearsMr Lee joined the Board on 9 May 2012 and was appointed Chairman on 28 February 2013 . Mr Lee has extensive resource banking and international commercial experience . His previous senior executive roles include 16 years with CSR Limited and 9 years in the position of Chief Executive Officer of NM Rothschild Australia Limited . Mr Lee is a Director of Newcrest Mining Limited and a former Chairman of the Australian Institute of Company Directors . He was appointed a Member of the Order of Australia in the 2015 Queen’s Birthday Honours List for services to business, commerce, sport and charity . Ordinary shares, fully paid: 96,829
Mr PR Botten, CBE, BSc, ARSM, (Managing Director), Executive, 61 yearsMr Botten was appointed Managing Director on 28 October 1994, having previously filled both exploration and general manager roles in the company since joining in 1992 . He has extensive worldwide experience in the oil and gas business, previously holding various senior technical and managerial positions in a number of listed and government owned organisations . Mr Botten is immediate past President of the Papua New Guinea Chamber of Mines and Petroleum and is on the Executive Committee of the Australia PNG Business Council . He is also a Director of Business for Development . He was awarded Commander of the Order of the British Empire (CBE) in the 2008 Queen’s Birthday Honours List for services to commerce and the mining and petroleum industry in Papua New Guinea . Ordinary shares, fully paid: 2,487,394; Performance Rights: 698,600; Restricted shares: 226,043
Mr G Aopi, CBE, BEc, BAC, MBA, Executive, 61 yearsMr Aopi joined the Board as an Executive Director on 18 May 2006 and presently holds the position of Executive General Manager Stakeholder Engagement . Mr Aopi has substantial public service and business experience in Papua New Guinea, having had a long and distinguished career in government, with a number of important positions, including Secretary for Finance and Planning and Managing Director of Telikom PNG Ltd . He was previously the Chairman of Telikom PNG Ltd and Independent Public Business Corporation (IPBC) . Mr Aopi is a Director of Steamships Trading, Bank of South Pacific and a number of other private sector and charitable organisations in Papua New Guinea . Ordinary shares, fully paid: 466,521; Performance Rights: 152,200; Restricted shares: 39,593
Sir KG Constantinou, OBE, 58 yearsSir Kostas joined the Board on 16 April 2002 . He is a prominent business figure in Papua New Guinea, holding a number of high level public sector and private sector appointments . Sir Kostas is Chairman of various companies, including Airways Hotel & Apartments Limited, Lamana Hotel Limited, Lamana Development Limited, Hebou Constructions, Alotau International Hotel, Pacific Games 2015 Authority and Bank of South Pacific . He is a Director of Heritage Park Hotel in Honiara, Gazelle International Hotel in Kokopo, Grand Pacific Hotel in Fiji, Taumeasina Island Resort in Samoa and Good Taste Company in New Zealand . Sir Kostas is also Vice Chairman of the Employers Federation of Papua New Guinea and Honorary Consul for Greece in Papua New Guinea and a Member of the APEC Business Advisory Council for Papua New Guinea . He was awarded Knights Bachelor in the 2015 Queen’s Birthday Honours List for services to sport, tourism, banking and to the community in Papua New Guinea . Ordinary shares, fully paid: nil
Ms FE Harris, BCom, FAICD, FCA (Aust), 55 years (Resigned 17 December 2015)Ms Harris joined the Board on 1 March 2013 . Ms Harris has over 18 years of experience as a non-executive director, including on the boards of numerous resource and other companies in the ASX50, ASX100 and ASX200, and several with international operations . She is currently a non-executive director of listed companies Aurora Oil & Gas Limited, BWP Trust, Infigen Energy Limited and Toro Energy Limited . Prior to commencing her career as non-executive director, Ms Harris was a partner at KPMG, working in Perth, San Francisco and Sydney . Ordinary shares, fully paid: 31,961
Dr AJ Kantsler, BSc (Hons), PhD, GAICD, FTSE, 65 yearsDr Kantsler joined the Board on 19 July 2010 . Dr Kantsler worked with Woodside Petroleum for 15 years, where he was Executive Vice President Exploration and New Ventures from 1995 to 2009 and Executive Vice President Health, Safety and Security . Before joining Woodside Petroleum, Dr Kantsler had extensive experience with the Shell Group of Companies working in various exploration roles in Australia and internationally . Dr Kantsler has been a director of Forte Consolidated Limited and Savcor Group Limited . He was also Councillor and Director of the Australian Petroleum Production and Exploration Association (APPEA) for 15 years, where, as well as being chairman of several of APPEA’s committees, he was Chairman from 2000 to 2002 . Dr Kantsler was also a founding member of the Australian Government’s Council for Australian Arab Relations . He is Managing Director of Transform Exploration Pty Ltd and President of the Chamber of Commerce and Industry, WA . Ordinary shares, fully paid: 45,736F
or p
erso
nal u
se o
nly

56
D I R E C T O R S ’ R E P O R T
f o r t h e y e a r e n d e d 3 1 D e c e m b e r 2 0 1 5
Mr B Philemon, Non-Executive, 70 yearsMr Philemon joined the Board on 5 November 2012 . Mr Philemon is acknowledged as one of Papua New Guinea’s most influential leaders, with distinguished careers in both business and public service . Mr Philemon’s career highlights include serving as Chairman of Air Nuigini and holding a number of ministerial posts in PNG Government, including Minister of Foreign Affairs and Minister for Finance and Treasury . Mr Philemon served as the member for Lae Open in Government from 1992 until the 2012 elections . Mr Philemon is a director of Highlands Pacific Limited and the Bank of Papua New Guinea . Ordinary shares, fully paid: 7,241
Mr KW Spence, BSc (Geophysics) (Hons), Non-Executive, 62 yearsMr Spence joined the Board on 9 May 2012 . Mr Spence brings over thirty years of oil and gas experience to the Board, having served in senior executive positions with Woodside Petroleum Limited, including Chief Operating Officer and Acting Chief Executive . Mr Spence was with Shell for 18 years prior to Woodside . Mr Spence is Chairman of Geodynamics Limited and Base Resources Limited . He chairs a number of other bodies, including the National Offshore Petroleum Safety and Environmental Management Authority Board . Mr Spence is a director of Independence Group NL and Murray and Roberts Holdings Limited . Ordinary shares, fully paid: 25,000
Dr ZE Switkowski, BSc (Hons), PhD, FAA, FAICD, FTSE, AO, 67 yearsDr Switkowski joined the Board on 22 November 2010 . Dr Switkowski’s career highlights include serving as Chief Executive Officer and Managing Director of Telstra, Chief Executive Officer of Optus and Chairman and Managing Director of Kodak (Australasia) . Dr Switkowski currently serves as a Director of Tabcorp Limited and is Chairman of Suncorp Group and NBN Co . He is also Chancellor of the Royal Melbourne Institute of Technology (RMIT University) . Dr Switkowski is a former Chairman of the Australian Nuclear Science and Technology Organisation and Opera Australia . He holds a PhD in nuclear physics from the University of Melbourne . Dr Switkowski was awarded Officer in the General Division (AO) in the 2014 Queen’s Birthday Honours List for distinguished service to the community, in particular to tertiary education, scientific organisations and the telecommunications sector, to business and, to the arts . Ordinary shares, fully paid: 201,829
Dr E Doyle, BMath (Hons), MMath, PhD, FAICD, 61 yearsDr Doyle joined the Board on 18 February 2016 . Dr Doyle’s career spans the building materials, water and industrials sectors, including senior operational roles at BHP Limited and CSR Limited and culminating in her appointment as CEO of CSR’s Panel’s Division . She is a director of GPT Group Limited, Boral Limited, Hunter Research Foundation and Knights Rugby League Pty Ltd . Dr Doyle is a member of the NSW Council of the Australian Institute of Company Directors . She has previously served on a number of other boards, including Deputy Chairman of CSIRO and Chairman of Port Waratah Coal Services . Ordinary shares, fully paid: nil
GROUP SECRETARY
Mr SW Gardiner, BEc (Hons), CPA, 57 yearsMr Gardiner joined Oil Search Limited in 2004, after a twenty year career in corporate finance at two of Australia’s largest multinational construction materials companies and a major Australian telecoms company . Mr Gardiner’s roles at Oil Search have covered senior corporate finance and corporate services responsibilities . In November 2012 Mr Gardiner was appointed to the position of Chief Financial Officer of Oil Search . Mr Gardiner is also the Group Secretary of Oil Search, a role he has held since May 2009 . Ordinary shares, fully paid: 373,517; Performance Rights: 154,697; Restricted shares: 43,914
RESULTS AND REVIEW OF OPERATIONSThe Oil Search Limited Group (‘the group’) reported a consolidated net loss of US$39 .4 million (2014: net profit of US$353 .2 million) for the year, after providing for income tax of US$147 .6 million (2014: US$231 .8 million) .
Further details on the group’s operating and financial performance can be found in the ‘Operating and Financial Review’ on page 59 .
DIVIDENDSSubsequent to balance date, the directors approved the payment of a final unfranked dividend of US 4 cents per ordinary share (2014: US 8 cents final dividend and US 4 cents special dividend) to ordinary shareholders in respect of the financial year ended 31 December 2015 . The due date for payment is 31 March 2016 to all holders of ordinary shares on the Register of Members on 9 March 2016 . The company’s dividend reinvestment plan will remain suspended for the final dividend . Dividends paid and declared during the year are recorded in note 9 to the financial statements .
PRINCIPAL ACTIVITIESThe principal activity of the group is the exploration for oil and gas fields and the development and production of such fields . This is carried out as both the operator and non-operator participant in the exploration, development and production of hydrocarbons .
SIGNIFICANT CHANGES IN THE STATE OF AFFAIRSDuring the year, there were no significant changes in the nature of the activities or the state of affairs of the group other than that referred to in the financial statements and notes thereto .
LIKELY FUTURE DEVELOPMENTSRefer to the ‘Operating and Financial Review’ on page 59 for details on likely developments and future prospects of the group .
ENVIRONMENTAL DISCLOSUREThe group complies with all environmental laws and regulations and aims to operate at the highest industry standard for environmental compliance . The group has provided for costs associated with the restoration of sites in which it holds a participating interest .
For
per
sona
l use
onl
y

OIL SEARCH Annual Report 2015 57
D I R E C T O R S ’ R E P O R T
f o r t h e y e a r e n d e d 3 1 D e c e m b e r 2 0 1 5
CORPORATE INFORMATIONOil Search Limited is a company limited by shares and is incorporated and domiciled in Papua New Guinea . The group had 1,342 employees as at 31 December 2015 (2014: 1,692) . Oil Search Limited is listed on the Australian Securities Exchange and Port Moresby Stock Exchange .
SHARE BASED PAYMENT TRANSACTIONSThere were 682,736 share rights (2014: 611,045) granted under the Employee Share Rights Plan . There were 1,052,876 performance rights (2014: 934,100) granted under the Performance Rights Plan and 681,241 restricted shares (2014: 404,806) granted under the Restricted Share Plan during the year .
As at 31 December 2015, there were 1,018,608 share rights (2014: 581,748), 1,225,800 share appreciation rights (2014: 3,048,400), 3,422,243 performance rights (2014: 4,070,768) and 976,157 restricted shares (2014: 726,036) granted over ordinary shares exercisable at various dates in the future, subject to meeting applicable performance hurdles, and at varying exercise prices (refer to note 20 for further details) .
ROUNDINGThe majority of amounts included in this report are rounded to the nearest US$1,000 (where rounding is applicable) .
COMMITTEES OF THE BOARD During the year ended 31 December 2015, the company had an Audit and Financial Risk Committee, a Corporate Actions Committee, a Health, Safety and Sustainability Committee and a People and Nominations Committee .
Members comprising the Committees of the Board during the year were:
Audit and Financial Risk Committee: Dr AJ Kantsler (Committee Chairman), Ms FE Harris, Mr B Philemon and Dr ZE Switkowski . Mr RJ Lee is an ex-officio attendee of this Committee;
Corporate Actions Committee: Mr RJ Lee (Committee Chairman), Mr PR Botten, Dr AJ Kantsler, Mr KW Spence, Ms FE Harris and Dr ZE Switkowski;
Health, Safety and Sustainability Committee: Mr KW Spence (Committee Chairman), Dr AJ Kantsler, Mr G Aopi, Sir KG Constantinou and Ms FE Harris . Mr RJ Lee is an ex-officio attendee of this Committee; and
People and Nominations Committee: Dr ZE Switkowski (Committee Chairman), Sir KG Constantinou, Mr B Philemon and Mr KW Spence . Mr RJ Lee is an ex-officio attendee of this Committee .
ATTENDANCES AT DIRECTORS’ AND COMMITTEE MEETINGSThe number of meetings of directors (including meetings of Committees of the Board) held during the year and the number of meetings attended by each director were as follows:
DIRECTORS DIRECTORS’
MEETINGSAUDIT AND
FINANCIAL RISKCORPORATE
ACTIONS
HEALTH, SAFETY AND
SUSTAINABILITYPEOPLE AND
NOMINATIONS
Number of meetings held 8 4 1 4 4
Number of meetings attended
G Aopi 8 – – 4 –
PR Botten 8 – 1 – –
KG Constantinou 7 – – 4 4
FE Harris(1) 3 2 – 2 –
AJ Kantsler 8 4 1 4 –
RJ Lee 8 3 1 3 4
B Philemon 8 4 – – 4
KW Spence 8 – 1 4 4
ZE Switkowski 8 4 1 – 4
(1) Ms Harris was on leave from the Board during the second half of 2015 and resigned from the Board on 17 December 2015, due to a health issue .
Note: The Managing Director and Chief Financial Officer attend meetings at the request of the Committees . Other members of the Board have attended various Committee meetings during the year . These attendances are not included in the above table .
For
per
sona
l use
onl
y

58
D I R E C T O R S ’ R E P O R T
f o r t h e y e a r e n d e d 3 1 D e c e m b e r 2 0 1 5
DIRECTORS’ AND OTHER OFFICERS’ REMUNERATIONThe People and Nominations Committee of the Board is responsible for reviewing compensation for the directors and staff and recommending compensation levels to the Board . The Committee assesses the appropriateness of the nature and amount of emoluments on a periodic basis with reference to relevant employment market conditions, with the overall benefit of maximising shareholder value by the retention of high quality personnel . To achieve this objective the Board links a component of executive director and other staff emoluments to the company’s financial and operational performance .
Details of the amount, in US dollars, of each element of the emoluments for the financial year for directors and executives of the group are disclosed in note 21 to the financial statements .
INDEMNIFICATION AND INSURANCE OF DIRECTORS, OFFICERS, EMPLOYEES AND AUDITORSDuring the financial year, the group paid premiums to insure all directors, officers and employees of the group against claims brought against the individual while performing services for the group and against expenses relating thereto . The amount of the insurance premium paid during the year has not been disclosed as it would breach the confidentiality clause in the insurance policy .
The group has agreed to indemnify the directors, officers and employees of the group against any liability to another person other than the group or a related body corporate for an act or omission that may arise from their positions as directors, officers and employees of the group, to the extent permitted by the PNG Companies Act 1997 .
No indemnity has been granted to an auditor of the group in their capacity as auditor of the group .
AUDITOR INDEPENDENCE AND NON-AUDIT SERVICESDuring the year the auditor, Deloitte Touche Tohmatsu, provided non-audit accounting services for the group . These services are outlined in note 24 to the financial statements . Deloitte Touche Tohmatsu’s Independence Declaration, which forms part of this report, is attached on page 87 .
MATTERS SUBSEQUENT TO THE END OF THE FINANCIAL YEARSubsequent to balance date, the Directors declared an unfranked final dividend of US 4 cents per share, to be paid on 31 March 2016 . The proposed final dividend for 2015 is payable to all holders of ordinary shares on the Register of Members on 9 March 2016 .
There were no other significant events after balance date .
For
per
sona
l use
onl
y
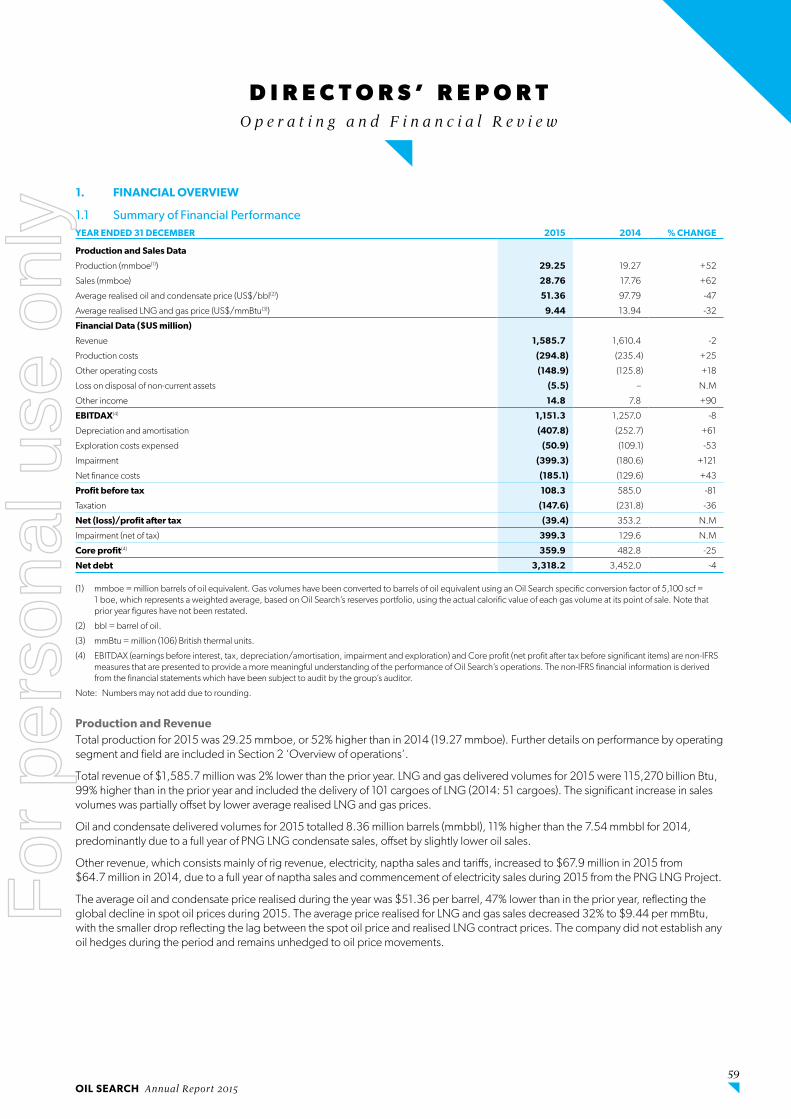
OIL SEARCH Annual Report 2015 59
D I R E C T O R S ’ R E P O R T
O p e r a t i n g a n d F i n a n c i a l R e v i e w
1. FINANCIAL OVERVIEW
1 .1 Summary of Financial PerformanceYEAR ENDED 31 DECEMBER 2015 2014 % CHANGE
Production and Sales Data
Production (mmboe(1)) 29.25 19 .27 +52
Sales (mmboe) 28.76 17 .76 +62
Average realised oil and condensate price (US$/bbl(2)) 51.36 97 .79 -47
Average realised LNG and gas price (US$/mmBtu(3)) 9.44 13 .94 -32
Financial Data ($US million)
Revenue 1,585.7 1,610 .4 -2
Production costs (294.8) (235 .4) +25
Other operating costs (148.9) (125 .8) +18
Loss on disposal of non-current assets (5.5) – N .M
Other income 14.8 7 .8 +90
EBITDAX(4) 1,151.3 1,257 .0 -8
Depreciation and amortisation (407.8) (252 .7) +61
Exploration costs expensed (50.9) (109 .1) -53
Impairment (399.3) (180 .6) +121
Net finance costs (185.1) (129 .6) +43
Profit before tax 108.3 585 .0 -81
Taxation (147.6) (231 .8) -36
Net (loss)/profit after tax (39.4) 353 .2 N .M
Impairment (net of tax) 399.3 129 .6 N .M
Core profit(4) 359.9 482 .8 -25
Net debt 3,318.2 3,452 .0 -4
(1) mmboe = million barrels of oil equivalent . Gas volumes have been converted to barrels of oil equivalent using an Oil Search specific conversion factor of 5,100 scf = 1 boe, which represents a weighted average, based on Oil Search’s reserves portfolio, using the actual calorific value of each gas volume at its point of sale . Note that prior year figures have not been restated .
(2) bbl = barrel of oil .
(3) mmBtu = million (106) British thermal units .
(4) EBITDAX (earnings before interest, tax, depreciation/amortisation, impairment and exploration) and Core profit (net profit after tax before significant items) are non-IFRS measures that are presented to provide a more meaningful understanding of the performance of Oil Search’s operations . The non-IFRS financial information is derived from the financial statements which have been subject to audit by the group’s auditor .
Note: Numbers may not add due to rounding .
Production and RevenueTotal production for 2015 was 29 .25 mmboe, or 52% higher than in 2014 (19 .27 mmboe) . Further details on performance by operating segment and field are included in Section 2 ‘Overview of operations’ .
Total revenue of $1,585 .7 million was 2% lower than the prior year . LNG and gas delivered volumes for 2015 were 115,270 billion Btu, 99% higher than in the prior year and included the delivery of 101 cargoes of LNG (2014: 51 cargoes) . The significant increase in sales volumes was partially offset by lower average realised LNG and gas prices .
Oil and condensate delivered volumes for 2015 totalled 8 .36 million barrels (mmbbl), 11% higher than the 7 .54 mmbbl for 2014, predominantly due to a full year of PNG LNG condensate sales, offset by slightly lower oil sales .
Other revenue, which consists mainly of rig revenue, electricity, naptha sales and tariffs, increased to $67 .9 million in 2015 from $64 .7 million in 2014, due to a full year of naptha sales and commencement of electricity sales during 2015 from the PNG LNG Project .
The average oil and condensate price realised during the year was $51 .36 per barrel, 47% lower than in the prior year, reflecting the global decline in spot oil prices during 2015 . The average price realised for LNG and gas sales decreased 32% to $9 .44 per mmBtu, with the smaller drop reflecting the lag between the spot oil price and realised LNG contract prices . The company did not establish any oil hedges during the period and remains unhedged to oil price movements .
For
per
sona
l use
onl
y

60
D I R E C T O R S ’ R E P O R T
O p e r a t i n g a n d f i n a n c i a l r e v i e w
Production and other operating costsProduction costs increased from $235 .4 million in 2014 to $294 .8 million in 2015 primarily due to a full year of PNG LNG production in 2015 . However, production costs on a per barrel of oil equivalent (boe) basis declined from $12 .21 per boe in 2014 to $10 .08 per boe, reflecting lower average PNG LNG Project unit production costs relative to average oil field unit production costs .
US$ MILLION
PRODUCTION COSTS
2015 2014
PNG LNG 149.9 103 .6
PNG oil and gas 144.9 131 .8
294.8 235.4
PNG LNG production unit costs on a per boe basis were $6 .75, which reflected the PNG LNG Project producing well above nameplate capacity . PNG oil and gas unit production costs per boe for 2015 were $20 .62, 11% higher than in the prior year primarily due to well workover activity in 2015 .
Other operating costs increased from $125 .8 million in 2014 to $148 .9 million in 2015 primarily due to selling and distribution costs generated by the full year of LNG sales cargoes, a loss on disposal of non-current assets and an increase in other expenses, partially offset by a decrease in royalties and levies due to lower realised prices, a decrease in gas purchase costs and inventory movements .
Depreciation and amortisationDepreciation and amortisation increased from $252 .7 million in 2014 to $407 .8 million in 2015 .
Amortisation costs increased by $236 .2 million to $388 .4 million in 2015 due to a full year of production for the PNG LNG Project, partially offset by lower oil production . On a cost per boe produced basis, depreciation and amortisation for 2015 was $13 .28 per boe, compared to the 2014 cost of $13 .11 per boe .
Depreciation increased by $2 .9 million to $19 .4 million in 2015 mainly driven by a new finance lease for a PNG LNG marine vessel and higher rig utilisation .
Exploration costs expensedIn line with the successful efforts accounting policy, all costs associated with unsuccessful drilling, seismic work and other support costs related to exploration activity were expensed during the year and resulted in a pre-tax charge of $50 .9 million . This included $16 .9 million attributable to the exploration component of the Hides F1 well .
The remaining exploration costs expensed consisted of seismic, geological, geophysical and general and administration expenses .
Further details on exploration activities during the year are included in Section 2 ‘Overview of operations’ .
Net interest costsNet interest costs of $185 .1 million in 2015 were $55 .5 million higher than the prior year, primarily due to the full year of expensing of borrowing costs in relation to the PNG LNG Project .
ImpairmentAn impairment charge of $399 .3 million was recognised in 2015 related to the group’s interest in the Taza PSC in Kurdistan following a reduction in estimated resources after the completion of an appraisal drilling programme .
TaxationTax expense on statutory profit in 2015 was $147 .6 million, compared to $231 .8 million in 2014 . This resulted in an effective tax rate of 136 .4%, significantly higher than in prior years primarily due to the impairment of the Taza asset . The effective tax rate on Core profit is 29 .1% which was lower than in the prior year . This is broadly attributable to the increase in revenues in 2015 taxed at the prevailing statutory gas rate of 30% rather than the statutory rate for oil income of 50% .
1 .2 Summary of Financial Position
Net debtAs at 31 December 2015, Oil Search had net debt (total borrowings less cash) of $3,318 .2 million which is $133 .8 million lower than the prior year net debt position of $3,452 .0 million . A reconciliation of the movement in net debt during the year is as follows:
US$ MILLION
Net debt at 31 December 2014 3,452.0
Net repayment – PNG LNG Project finance facility (33.5)
Net repayment – Corporate revolving facilities (150.0)
Decrease in cash balances 49.7
Net movement in 2015 (133.8)
Net debt at 31 December 2015 3,318.2
At 31 December 2015, the group had drawn down $4,228 .6 million under the PNG LNG Project finance facility and nil debt under the $750 million of corporate facilities .
Oil Search remained in a strong liquidity position at 31 December 2015, with cash of $910 .5 million, including $270 .8 million in PNG LNG escrow accounts, and $748 million available under the group’s corporate revolving facilities ($2 million of the $250 million bilateral revolving facilities had been utilised for letters of credit) .
For
per
sona
l use
onl
y

OIL SEARCH Annual Report 2015 61
D I R E C T O R S ’ R E P O R T
O p e r a t i n g a n d f i n a n c i a l r e v i e w
Investment expenditureTotal investment expenditure for 2015 was $539 .1 million, which was 71% lower than the prior year expenditure of $1,868 .0 million . The components of investment expenditure for the year were:
US$ MILLION 2015 2014
Exploration and evaluation(1) 275.7 1,246 .9
Development – PNG LNG Project(2) 135.2 502 .6
Producing assets 111.8 105 .7
Other plant and equipment(3) 16.4 12 .8
Total capital expenditure 539.1 1,868.0
(1) Includes $50 .9 million (2014: $109 .1 million) of exploration costs expensed during the year .
(2) 2014 included capitalised financing costs .
(3) Excludes finance leased assets that are recognised as other plant and equipment .
Exploration and evaluation expenditure for 2015 was $275 .7 million (2014: $1,246 .9 million) . This expenditure primarily comprised appraisal drilling and evaluation of the PRL 15 Antelope wells and related pre-FEED activities of $90 .4 million and appraisal drilling and evaluation of the Taza field in Kurdistan of $102 .7 million .
Oil Search’s share the PNG LNG Project development costs were $135 .2 million during 2015 (2014: $502 .6 million of which $45 .9 million related to capitalised financing costs) .
Expenditure on producing assets totalled $111 .8 million for 2015, (2014: 105 .7 million) and mainly related to infill drilling and workover activity on the Moran field and ongoing sustaining capital .
Reserves and resourcesAt 31 December 2015 the group’s total proved and probable reserves (2P) and contingent resources (2C) for oil and condensate were 144 .3 mmbbl, down 17% compared to 2014 . The addition of 10 .6 mmbbl of condensate at P’nyang following updated technical studies was offset by production of 8 .8 mmbbl and the downward revision to net 2C contingent resources of 31 .2 mmbbl of oil following analysis of appraisal data from Taza .
Total proven and probable reserves (2P) and contingent resources (2C) for gas were 5,787 .9 bcf, essentially unchanged from 2014 . The addition of 326 bcf at P’nyang was offset by record gas production of 99 .4 bcf, the downward revision to net 2C contingent resources of 128 .1 bcf at Cobra following a remapping exercise, and a reduction of 128 .6 bcf at Taza following analysis of appraisal data .
Further details are included in the 2015 Reserves and Resources Statement .
1 .3 Operating cash flowsYEAR TO 31 DECEMBER (US$ MILLION) 2015 2014 % CHANGE
Net receipts 1,204.3 1,185 .2 2
Net interest paid (166.2) (11 .2) N .M
Tax paid (85.4) (181 .7) -53
Operating cash flow 952.7 992.3 -4
Net investing cash flow (535.6) (1,740 .4) -69
Net financing cash flow (466.8) 1,498 .6 -131
Net cash (outflow)/inflow (49.7) 750.5 -107
Operating cash flow decreased slightly, with the contribution from a full year of operations at the PNG LNG Project, partially offset by lower oil sales volumes and lower average realised hydrocarbon prices in 2015 .
During 2015, Oil Search’s net investing cash flow included expenditures of:
$248 .3 million on exploration and evaluation ($1,189 .7 million in 2014);
$141 .6 million on PNG LNG Project development activities ($422 .7 million in 2014);
$119 .6 million on production activities ($101 .9 million in 2014); and
$16 .0 million on other plant and equipment ($12 .5 million in 2014) .
The group distributed $274 .1 million to shareholders by way of the 2014 final and special dividend and the 2015 interim dividend during the year . During 2015, net borrowings of $333 .0 million were repaid, including $103 .0 million under the PNG LNG Project finance facility and $230 million under the corporate revolving facilities, offset by borrowings of $80 million drawn under the $250 million bilateral facilities and a drawn down of $69 .5 million under the PNG LNG Project finance facility prior to financial completion that was declared in February 2015 .
For
per
sona
l use
onl
y

62
D I R E C T O R S ’ R E P O R T
O p e r a t i n g a n d f i n a n c i a l r e v i e w
2. OVERVIEW OF OPERATIONSEstablished in 1929, Oil Search is a Papua New Guinean (PNG) oil and gas exploration and production company .
The Company operates all of PNG’s currently producing oil fields and the Hides Gas to Electricity Project . It also has a 29% interest in the PNG LNG Project, a world scale liquefied natural gas (LNG) development, operated by ExxonMobil PNG Limited . Since commencement of production in 2014, the PNG LNG Project has delivered more than 150 LNG cargoes to markets in Asia . During 2015, the first full year of operations, the Project produced 7 .4 MTPA, well above its 6 .9 MTPA nameplate capacity .
Oil Search is pursuing two major growth opportunities in PNG . These are the expansion of the PNG LNG Project, through production optimisation and debottlenecking as well as the potential construction of a third LNG train, underpinned by the P’nyang gas field, and the Papua LNG Project, a world scale LNG development in the onshore Gulf Province based on the Elk-Antelope gas fields . The Company is undertaking a range of exploration and appraisal activities in PNG to support these development opportunities .
Oil Search also has exploration interests in the Middle East .
2 .1 Activities in PNG
2.1.1 Operated oil and gas productionOil Search’s total net production in 2015 was 29 .25 million barrels of oil equivalent (mmboe), 52% higher than in the previous year . Strong performances from the PNG LNG Project and the Oil Search-operated oil fields resulted in production exceeding the Company’s initial guidance of 26 – 28 mmboe .
Kutubu (PDL 2 – 60 .0%, operator)Oil Search continued to be successful in optimising production from the Kutubu complex of fields during 2015 . Production increased 3% year on year, an excellent performance from this mature field, with gross production averaging 17,325 barrels of oil per day (bopd) .
During the year, Usano production continued to benefit from the reservoir management strategies which have been developed and implemented over the past two years . The field produced at sustained rates in excess of 5,500 bopd during 2015, similar to 2014 but approximately 175% higher than rates in mid-2013 . Similar success in sustaining oil production has been achieved at the Agogo field, with average production rates of 4,466 bopd in 2015, nearly 1,200 bopd higher than in 2014 . This was achieved by optimising production from three separate reservoirs accessed by the existing backlimb wells and maximising contributions from the recent development wells in the Agogo forelimb . In addition, production from the Hedinia Digimu reservoir was boosted by the reinstatement of the IDD 5 well, which had been shut-in for a prolonged interval while reservoir pressures built up .
Gas exports to the PNG LNG Project from Kutubu averaged 66 mmscf/d in 2015 .
Moran (49 .5%, based on PDL 2 – 60 .0%, PDL 5 – 40 .7% and PDL 6 – 71 .1%, operator)Gross production from Moran in 2015 averaged 8,635 bopd, down 22% from 2014 levels .
The Moran 16 ST1 well, targeting the Toro and Digimu oil reservoirs in a downdip location in the central part of the field, was successfully drilled early in the year . The reservoirs were encountered close to prognosis and the well was brought on-stream in the second quarter at a rate of approximately 1,500 bopd . However, this was offset by both natural decline and a number of mechanical issues in the Moran 2X ST2 and NW Moran 1 ST5 wells . Sidetracks were undertaken to resolve the issues in these wells and both were brought back on stream in the fourth quarter with a combined rate of more than 2,000 bopd . In addition, a previously undeveloped interval in the NW Moran sidetrack (NW Moran 1-ST7) was brought into production late in the year .
Gobe (PDL 3 – 36 .4% and PDL 4 – 10%, operator)Production from the Gobe Main field declined 5% to 827 bopd, while production from the SE Gobe field was 8% lower, at 1,255 bopd .
The natural decline in oil production from the Gobe Main and SE Gobe fields was mitigated during the year by a continued strong focus on reservoir management, with the 5% and 8% decline rates, respectively, a pleasing outcome given the maturity of these fields .
A key focus for the year was the ramp up in gas exports to the PNG LNG Project . Third party gas sales to the Project commenced from SE Gobe in May 2015, while Gobe Main gas exports continued in line with expectations . In total, more than 19 bcf of gas (gross) was supplied to the PNG LNG Project from the Gobe fields during the year . Sustained steady operation of the Gobe plant and facilities was achieved, with combined oil and gas production rates through the Gobe Facility reaching in excess of 12,000 boepd by the end of 2015 .
Gas to Electricity Project – 100%, operator (PDL 1 – 16 .7%) The Hides Gas to Electricity Project produced 5 .312 bcf, 6% lower than in 2014 due to drought conditions in the PNG Highlands, which led to a short closure of the Porgera Gold Mine and a resulting drop in demand for gas .
For
per
sona
l use
onl
y

OIL SEARCH Annual Report 2015 63
D I R E C T O R S ’ R E P O R T
O p e r a t i n g a n d f i n a n c i a l r e v i e w
2.1.2 PNG LNG Project The PNG LNG Project produced 22 .2 mmboe net to Oil Search in 2015, comprising 96 .6 bcf of LNG and 3 .27 mmbbl of liquids . Gross annualised production from the Project was 7 .4 MTPA, well above the nameplate capacity of 6 .9 MTPA, reflecting excellent gas deliverability from the upstream facilities combined with a high level of uptime at the LNG trains .
In 2015, 101 PNG LNG cargoes were exported, with 79 sold under long-term contract and 22 cargoes sold on the spot market . 31 .5 cargoes of Kutubu Blend and 8 cargoes of naphtha were also sold .
Development drilling on the Angore field took place in 2015 . The Angore B1 development well encountered technical issues during drilling and was suspended . The Angore A1 and Angore A2 development wells were subsequently drilled, successfully intersecting the Toro reservoir . Development drilling at the Hides field also continued during the year, with the Hides F1 dual development/exploration well successfully intersecting the Toro reservoir . However, the deeper exploration target, the Koi-Iange reservoir, was unsuccessful .
In February 2015, having satisfied all of the financial completion tests incorporated in the Project’s financing arrangements, financial completion was achieved . This important milestone allowed completion guarantees to be released and co-venturer distributions to commence, according to the terms of the financing agreements .
2.1.3 2015 Production Summary(1),(2) YEAR TO 31 DECEMBER 2015 2014 % CHANGE
GROSS DAILY PRODUCTION
(BOPD) NET TO OSH
(MMBBL)
GROSS DAILY PRODUCTION
(BOPD) NET TO OSH
(MMBBL) GROSS DAILY
PRODUCTION NET TO OSH
Oil Production
Kutubu 17,325 3.797 16,843 3 .692 +2 .86 +2 .86
Moran 8,635 1.560 11,009 1 .989 -21 .57 -21 .57
Gobe Main 827 0.030 872 0 .032 -5 .20 -5 .20
SE Gobe 1,255 0.117 1,363 0 .127 -7 .92 -7 .92
SE Mananda – – 19 0 .005 – –
Total PNG Oil 28,041 5.505 30,107 5 .845 -6 .86 -5 .82
PNG LNG Project Liquids 30,921 3.273 18,520 1 .961 66 .96 66 .96
Hides GTE Liquids 306 0.112 331 0 .121 -7 .54 -7 .54
Total Liquids 59,268 8.890 48,104 7 .926 23 .21 12 .16
Gas Production mmscf/d mmscf mmscf/d mmscf
PNG LNG Project LNG 912.93 96,646 493 .09 52,199 85 .15 85 .15
Hides Gas Production(4 ) 14.55 5,312 15 .55 5,675 -6 .40 -6 .40
SE Gobe Gas to PNG LNG 20.22 1,886 – – – –
Total Gas 947.70 103,844 508 .63 57,874 86 .33 79 .43
boepd mmboe boepd mmboe
Total Production(3) 245,097 29.251 148,690 19 .274 64 .84 51 .76
(1) Prior period comparatives updated for subsequent changes .
(2) Numbers may not add due to rounding .
(3) Gas and LNG volumes for 2015 have been converted to barrels of oil equivalent using an Oil Search specific conversion factor of 5,100 scf = 1 boe, which represents a weighted average, based on Oil Search’s reserves portfolio, using the actual calorific value of each gas volume at its point of sale . This reflects the energy content of the Company’s gas reserve portfolio . Minor variations to the conversion factors may occur over time .
(4) Hides GTE production is reported on a 100% basis for gas and associated liquids purchased by the Hides (GTE) Project Participant (Oil Search 100%) for processing and sale to the Porgera power station . Sales gas volumes include approximately 2% unrecovered process gas .
For
per
sona
l use
onl
y

64
D I R E C T O R S ’ R E P O R T
O p e r a t i n g a n d f i n a n c i a l r e v i e w
2.1.4 Gas expansion activities
P’nyang gas field, PRL 3, PNGIn January 2015, ExxonMobil PNG Limited, operator of the PNG LNG Project and the PRL 3 Joint Venture (Oil Search – 38 .51%), and the PNG Government signed a Memorandum of Understanding (MoU) for the potential expansion of the PNG LNG Project and the provision of electricity and gas for domestic power generation . Under the MoU, it is envisaged that the P’nyang field will be developed to provide additional gas for both power generation and for PNG LNG Project expansion, including production optimisation and debottlenecking of the existing trains and the construction of a potential third LNG train .
The MoU set out an agreed timeline between the PRL 3 co-venturers and Government to a final investment decision for the third LNG train, with the PRL 3 owners targeting to sanction the train in the earliest timeframe, subject to completion of typical activities including appraisal, marketing, financing and development engineering on P’nyang .
In early 2015, the PRL 3 co-venturers submitted a petroleum development licence (PDL) application for the field to the PNG Government, in accord with the MOU, with engagement towards the formal award of a PDL over P’nyang continuing over the balance of the year .
The PRL 3 co-venturers undertook planning work for drilling the P’nyang South 2 well, located in the south-east of the P’nyang field, during the year . This well, which is expected to be drilled in 2016, is targeting the re-classification of some of the 2C resources within the field to the 1C category, to support PNG LNG expansion project financing and marketing activities . A P’nyang South multi-licence seismic survey commenced towards the end of the year, with approximately 72 kilometres of 2D data to be acquired to mature adjacent exploration leads . It is anticipated that this survey will be completed in 2016 .
Elk/Antelope gas fields, PRL 15, PNGDuring the year, the PRL 15 Joint Venture (Oil Search – 22 .835%) continued a comprehensive appraisal programme to help delineate the size and structural extent of the Elk-Antelope gas resource .
The Antelope 5 appraisal well, located 1 .8 kilometres west of Antelope 2, was spudded in December 2014 to appraise the western flank of the structure . The well was completed successfully in June 2015 . Testing confirmed excellent reservoir quality and deliverability, consistent with a substantial resource base .
In April 2015, the Antelope 4 appraisal well, located one kilometre south of Antelope 2, was suspended at a depth of 2,134 metres due to drilling difficulties and the Western Drilling 1 rig was demobilised . Sidetrack operations commenced in August 2015, using Oil Search’s Rig 103 . Antelope 4 ST1 reached a total depth of 2,326 metres in November and wireline logging was completed, with log interpretations confirming that a thick, high quality dolomite reservoir unit extends to this southern location .
The Antelope 6 appraisal well commenced drilling in December 2015 . This well will appraise the eastern margin of the field .
In February 2015, arbitration proceedings between Oil Search and Total SA were concluded . The International Court of Arbitration of the International Chamber of Commerce (ICC) declined to issue Oil Search pre-emptive rights over the transfer of a 40 .1% participating interest in PRL 15 from an InterOil subsidiary to a subsidiary of the Total SA Group, announced on 26 March 2014 . Subsequently, the joint venture participants unanimously agreed to appoint Total E&P PNG Limited (Total) as operator of the PRL 15 Joint Venture, subject to the terms of the Joint Venture Operating Agreement . On 1 August 2015, Total became operator of the PRL 15 Joint Venture, including the Papua LNG Project .
In July 2015, following extensive studies, the location of key infrastructure was agreed by the PRL 15 Joint Venture, as follows:
The LNG plant will be located at Caution Bay, approximately 20 kilometres north-west of Port Moresby and adjacent to the PNG LNG Project site .
The upstream Central Processing Facility will be located west of the Herd Base in PRL15, close to the Purari River .
The approximately 75 kilometre onshore and 265 kilometre offshore pipeline routes for the separate gas and condensate pipelines have been determined .
Sizing and capacity of the facilities is expected to be determined once the appraisal programme on Elk-Antelope has been completed and the resource size quantified .
NW HighlandsDuring 2015, Oil Search expanded its licence interests in the Highlands region through the acquisition of a 10% interest in PPL 269 and a 100% interest in PPL 402 . A 2D seismic data acquisition programme in the Juha and Hides areas took place, covering 102 kilometres . Based on this seismic, the Muruk exploration prospect in PPL 402 was matured for drilling and well preparations commenced, with Muruk 1 expected to spud in early 2016 . 71 kilometres of 2D seismic was acquired by Talisman/Repsol over PPL 269 in 2015 and the Strickland 1 prospect was matured for drilling in 2016 .
Forelands/Gulf RegionIn May, Oil Search exercised its option with Kina Petroleum Limited to farm into a 70% interest in PPL 339, in the Gulf Province . The Company subsequently farmed down a 35% interest in the licence to Total, subject to relevant approvals, with Oil Search retaining 35% and operatorship . A number of attractive prospects have been identified in the licence .
Re-assessment of existing gas discoveries PRLs 8 (Kimu), 9 (Barikewa) and 10 (Uramu), located in the Forelands/Gulf region, during the year has indicated material potential 2C gas resource upside in each pool . Preparations are underway for further appraisal and drilling work .
For
per
sona
l use
onl
y

OIL SEARCH Annual Report 2015 65
D I R E C T O R S ’ R E P O R T
O p e r a t i n g a n d f i n a n c i a l r e v i e w
2.1.5 Power In April 2015, Oil Search announced the first phase of the Ramu Power Project (RPP), a major multi-phase project to develop and deliver power solutions in PNG, in conjunction with Government-owned PNG Power Limited (PPL) . The RPP has a target of connecting an additional one million people by 2030, providing PNG businesses and households with access to affordable power supplies . Provision of power in PNG is a high political and social priority for the country and the company’s involvement is part of its programme to mitigate operating risk by giving back to the community .
The initial project comprised an upgrade of PPL’s existing power plant in Tari, a major town located approximately 50 kilometres north-east of the Hides gas field, with assistance from Oil Search, and the signing of an agreement for Oil Search to provide fuel for the plant from its Hides GTE plant . This allowed the commencement of continuous 24-hour power generation and supply to Tari .
In December, Oil Search signed two Power Purchase Agreements (PPAs) with PPL, subject to the satisfaction of various conditions precedent:
PNG Biomass IPP (Oil Search – 70%, Aligned Energy 30%) will deliver up to 30MW of biomass-fired base load power to the Ramu grid using wood chips from new plantation trees grown and sustainably harvested in the Markham Valley .
Highlands IPP (Oil Search – 100%) will construct an initial 2 MW gas-fired pilot power project located near Hides in the Hela Province, with potential to ramp up to 5 MW in the short-term and up to 65 MW by 2030 .
2 .2 Middle East and North Africa
2.2.1 Kurdistan Region of IraqAppraisal of the Taza oil discovery in the Taza PSC in Kurdistan continued in 2015, with the initial processing and interpretation of 630 square kilometres of 3D seismic data acquired in 2014 and the completion of two appraisal wells . Taza 2, located 10 kilometres north-west of the Taza 1 discovery well and Taza 3, located 6 kilometres south-east of Taza 1, both flowed oil but at sub-commercial rates . Preliminary analysis of the 3D seismic indicates that both wells were drilled in areas with lightly developed fractures and that the potential for economic flow rates from the Taza field is constrained to the more tightly folded and fractured forelimb area .
2.2.2 TunisiaProcessing and interpretation of seismic data acquired in 2014 confirmed that there was limited potential in the Tajerouine PSE (Oil Search – 100%, operator) . Consequently, following the completion of all obligations, the Block was relinquished towards the end of 2015 .
2.2.3 Yemen In the second quarter of 2015, Oil Search sold its interest in Block 7 in Yemen (Oil Search – 34%, operator) to Petsec . At the end of 2015, completion of the transaction was pending relevant approvals .
3. BUSINESS STRATEGY, OUTLOOK AND RISK
3 .1 Business Strategy Despite the dramatic decline in oil prices, Oil Search remains committed to the pursuit of key strategies identified under the 2014 Strategic Review which includes:
Sustaining and optimising the value of existing Oil Search assets through safe and reliable operations .
Commercialising additional LNG trains with gas sourced from the NW Highlands and Gulf Hubs .
Exploring for and appraising high value oil and gas accumulations in PNG .
Maintaining Oil Search as a leading corporate citizen in PNG . Protecting value and enabling growth by mitigating risks and promoting a stable operating environment .
Enhancing organisational capabilities to deliver our strategic commitments .
Optimising capital and liquidity management to support investment and reward shareholders .
In addition to the Strategic Review initiatives, Oil Search commenced a comprehensive review of the company’s operations, work practices and processes in early 2015 . The review analysed opportunities to reduce the company’s cost base to one more appropriate for the low oil price environment, to improve business efficiencies and to ensure the right people and processes are in place to deliver the company’s expansion plans .
The Business Optimisation Programme confirmed the need to focus on activities that support the expansion of the PNG LNG Project, including the development of a third train, the construction of Papua LNG and continued optimisation of the core oil business in PNG . It also identified the need for improved efficiency in some parts of the business and that investment in areas that are non-core to Oil Search, should be reduced . The work highlighted the need to continue to support a range of social programmes in PNG and enhance the development of Oil Search’s PNG national staff, especially in management and leadership positions .
Implementation of a number of changes to the company’s organisational structure and internal processes, to ensure that Oil Search can continue to deliver superior returns to its shareholders in a lower oil price environment, took place progressively over the second half of 2015 . This regrettably included a number of redundancies from across all offices and operations, with the Brisbane office closed down at the end of the year . A number of people were relocated from field operations, Brisbane and Sydney to the Port Moresby Head Office in PNG .
These changes have delivered a reduction in controllable operating and capital costs . It is also anticipated that the decline in production from the company’s mature oil fields will be partially mitigated through improved planning and reduced downtime .
Given the recent further sharp decline in oil prices, information gained through the 2015 Business Optimisation Programme is being used to prioritise further cost reduction opportunities across the business . Oil Search’s overall strategy, however, remains unchanged, with a strong focus on PNG, where the company has a major competitive advantage, and on its high-value growth projects .
For
per
sona
l use
onl
y

66
D I R E C T O R S ’ R E P O R T
O p e r a t i n g a n d f i n a n c i a l r e v i e w
3 .2 OutlookKey activities in 2016 are expected to include the following:
Continued delivery of gas from Oil Search’s operated fields to the PNG LNG Project and reliable operation of the Project’s liquids export system .
Progressing feasibility studies and commercial undertakings on the potential accelerated gas blowdown of the Kutubu/Agogo and Moran Associated Gas fields for the PNG LNG Project .
Drilling of the P’nyang South 2 well and the Muruk 1 exploration well, and other pre-FEED activities needed to source and evaluate additional gas to support the expansion of the PNG LNG Project through production optimisation and debottlenecking and a potential third LNG train .
Completion of drilling and testing of the Antelope 6 appraisal well, an extended well test of the Antelope 5 well, assess and potentially drill an additional appraisal well, Antelope 7 to test possible resource upside to the west of the Antelope field as well progressing other pre-FEED activities on Papua LNG .
Completion of the certification by two third party experts of the Antelope resource .
Appraisal drilling in PRL 9 (Barikewa 3) and towards the end of the year in PPL 339 (Kalangar) with possible further appraisal activities in the Forelands/Gulf region to assess potential gas resource upside .
3 .3 Material business risksThe international scope of the group’s operations, the nature of the oil and gas industry and external economic factors mean that a range of factors may impact results . Material business risks that could impact Oil Search’s results and performance are described below .
These risks are not the only risks that may affect the group . Additional risks and uncertainties not presently known to management or that management currently believe not to be material may also affect Oil Search’s business .
Financial and Liquidity risks
Pricing riskOil Search’s business is heavily dependent on prevailing market prices for its products, primarily oil and gas . Changes in the prices of these commodities will impact the group’s revenue and cash flows .
International oil and gas prices have fallen significantly in the past year and conditions are expected to remain challenging for the industry for the at least the next 12 months . There are a number of macroeconomic factors that influence oil pricing, over which Oil Search has no control .
Oil Search has executed long term sales and purchase agreements for the supply and sale of its LNG production, with pricing factors already established under these agreements .
The group’s financial risk management strategy to address commodity price risk is outlined in note 26 in the financial statements . The group’s Audit and Financial Risk Committee is responsible for reviewing the policies, processes, practices and reporting systems covering the group’s exposure to business and financial risks .
Future operating and capital cost requirementsFuture operating and capital cost requirements may be impacted by multiple external and internal factors, many of which have been identified elsewhere through this section . Unexpected changes to future cost profiles could result in Oil Search’s cash requirements being over and above its available liquidity . To the extent that the group’s operating cash flows and debt facilities are insufficient to meet its requirements for ongoing operations and capital expenditure, Oil Search may need to seek additional funding, sell assets and reassess or defer capital programmes . If Oil Search is unable to obtain additional funding on acceptable terms in these circumstances, its financial condition and ability to continue operating may be affected .
The group’s financial risk management strategy to address liquidity risk is outlined in note 26 in the financial statements . The group’s Audit and Financial Risk Committee is responsible for reviewing the policies, processes, practices and reporting systems covering the group’s exposure to business and financial risks . The group also undertakes regular short, medium and long term forecasting to assess any implications on future liquidity and profitability .
Operational risks
Production risksOil and gas producing assets may be exposed to production decreases or stoppages, which may be the result of facility shut-downs, mechanical or technical failure, well, reservoir or other subsurface impediments, safety breaches and other unforeseeable events . A significant failure to maintain production could result in the group lowering production forecasts, loss of revenues and incurring additional costs to reinstate production to expected levels .
Safety and environmental risksOil and gas producing and exploration operations are also exposed to industry operational safety risks including fire, explosions, blow outs, pipe failures, as well as transport and occupational safety incidents . Major environmental risks include accidental spills or leakage of petroleum liquids, gas leaks, ruptures, or discharge of toxic gases . The occurrence of any of these risks could result in substantial losses to the group due to injury or loss of life; damage to or destruction of property, natural resources, or equipment; pollution or other environmental damage; cleanup responsibilities; regulatory investigation and penalties or suspension of operations . Damages occurring to third parties as a result of such risks may also give rise to claims against the group .
For
per
sona
l use
onl
y

OIL SEARCH Annual Report 2015 67
D I R E C T O R S ’ R E P O R T
O p e r a t i n g a n d f i n a n c i a l r e v i e w
These risks are largely internally focused but there is also a heightened threat from cyber security actors, increasing operational and information security risks .
The group manages operational risk through a variety of means including; strict adherence to its operating standards, procedures and policies; staff competency development and training programs and through the effective use of a group-wide risk management system . In addition, the group has insurance programmes in place that are consistent with good industry practice .
Reserves and resource risks
Reserves decline and replacementOil Search, like any oil and gas company, is subject to reserves declining and impacting organisational value . Oil Search aims to replace and grow its reserve and resource base via exploration and commercial activities . The longer term health of the business will depend on the quality and size of its current portfolio and the investment decisions it makes over many years .
Oil and gas exploration is a speculative endeavor and each prospect/investment carries a degree of risk associated with the discovery of hydrocarbons in commercial quantities . The value of exploration and development assets can be affected by a number of different factors including, amongst other things, macro-economic and socio-political conditions, changes to reserves estimates, the composition of oil and gas reserves, unforeseen project difficulties and other operational issues . Similarly, the economic value of the organisation’s individual producing assets declines as oil and gas is produced . Oil Search’s future production profitability is subject to both subsurface and commodity price uncertainties but is also highly dependent on how Oil Search manages and maximizes the value of the production business over this period .
The group’s Board of Directors and Investment Review Board oversee all significant investment decisions, each of which are subject to economic and risk analysis and assurance activities at specific gates, in line with the organisation’s management system . Further, the group also includes significant exploration, drilling and development teams who continually monitor the organisation’s prospects inventory and exploration plan, and lead activities to identify and develop the group’s resources . For our producing assets, the group has a developing Life of Asset planning process which guides the long term management of operated producing assets .
Reserves and resource estimatesUnderground oil and gas reserve and resource estimates are expressions of judgment based on knowledge, experience and industry practice . Estimates which are valid at a certain point in time may alter significantly or become uncertain when new oil and gas reservoir information becomes available through additional drilling or reservoir engineering over the life of the field . As reserve and resource estimates change, development and production plans may be altered in a way that may affect the group’s operations and/or financial results .
Additionally, oil and gas reserves and resources assume that the group continues to be entitled to production licences over the fields and that the fields would be produced until the economic limit of production is reached . If any production licences for fields are not renewed or are cancelled, estimated oil and gas reserves and resources may be materially impacted .
The group employs the appropriate internal expertise to estimate reserves and resources and to prepare the Annual Reserves Statement in compliance with the ASX listing rules . In addition, proven (1P) and proven and probable (2P) oil field reserves are periodically certified by independent auditors .
External and Stakeholder
Legislative and regulatory riskOil Search operates across a number of international jurisdictions and therefore the business is subject to various national and local laws and regulations in those jurisdictions . Changes in government policy, the fiscal regime, regulatory regime or the legislative framework could impact the group’s business, results from operations or financial condition and performance .
The possible extent of such changes that may affect the group’s business activities cannot be predicted with any certainty . The effects of any such actions may result in, amongst other things, increased costs, whether in the nature of capital or operating expenses, taxes (direct and indirect) or through delays or the prevention of the group to be able to execute certain activities .
Companies in the oil and gas industry may be subject to pay direct and indirect taxes, royalties and other imposts in addition to normal company taxes . The group’s profitability may be affected by changes in government taxation and royalty policies or in the interpretation or application of such policies .
In addition to changes in existing tax laws, risk is also embedded in the interpretation or application of existing tax laws, especially where specific guidance is unavailable or has not been tested in the tax jurisdiction .
Political, community and other stakeholdersThe developing countries in which Oil Search operates expose the organisation to different degrees of political and commercial risk . The profitability of our operating assets may be adversely impacted by political instability, land ownership disputes and community issues as well as war, civil unrest and terrorism . Oil Search’s ability to acquire, retain and gain full value from licences may also be affected by a number of political and social issues such as differing political agendas and decision making, environmental and social policy and the impact of bribery and corruption . Further, the media, NGOs and other activists may play an increasing role at local, national and international levels influencing political policy and community actions or otherwise impacting the organisation’s reputation . Delays in government led infrastructure development can also impact the commercial outcome of projects .
For
per
sona
l use
onl
y
68
D I R E C T O R S ’ R E P O R T
O p e r a t i n g a n d f i n a n c i a l r e v i e w
Oil Search operates under its Stakeholder Engagement standards and policies which require transparent, open, pro-active communication and cooperation between company and government at all levels . Oil Search operates dedicated teams to manage government relations, which amongst other things, are targeted towards minimising risk that could arise out of potential fiscal, tax, resource investment, infrastructure access or regulatory and legal changes . Oil Search has in place a comprehensive corruption prevention framework .
Oil Search also strives to minimise any negative impact of the group’s operations on local society, culture and environment while contributing to local community and economic development and leaving a positive legacy . The group spends considerable time, effort and expense in working with government and communities led by a dedicated Stakeholder Engagement team . The Health, Safety and Sustainability Committee oversees the strategies and processes adopted by management and monitors the group’s performance in these areas .
Joint venture riskOil Search derives significant revenues and growth through joint venture arrangements . The use of joint ventures is common in the oil and gas industry and usually exists through all stages of the oil and gas lifecycle . Joint venture arrangements, amongst other things, can serve to mitigate the risk associated with exploration activities and capital intensive development phases . However, failure to establish alignment between joint venture participants, poor performance of joint venture operators or the failure of joint venture partners to meet their commitments and share of costs and liabilities could have a material impact on the group’s business .
The group manages joint venture risk through careful joint venture partner selection (when applicable), stakeholder engagement and relationship management . Commercial and legal agreements are also in place across all joint associations which bind the joint venture participants to certain responsibilities and obligations .
For
per
sona
l use
onl
y

OIL SEARCH Annual Report 2015 69
D I R E C T O R S ’ R E P O R T
R e m u n e r a t i o n R e p o r t
This report has been prepared in accordance with section 300A of the Australian Corporations Act 2001 and summarises the arrangements in place for the remuneration of directors, Key Management Personnel and other employees of Oil Search for the period from 1 January 2015 to 31 December 2015 . Although it is not a requirement for PNG companies, Oil Search has voluntarily complied with section 300A of the Australian Corporations Act 2001 to ensure it meets current best practice remuneration reporting for ASX listed companies .
1. REMUNERATION POLICY The objectives of the Oil Search remuneration policy are to:
Attract and retain the talent necessary to create value for shareholders;
Reward Key Management Personnel and other employees fairly and responsibly, having regard to the performance of Oil Search, the competitive environment and the individual performance of each employee; and
Comply with all relevant legal and regulatory provisions .
Oil Search’s approach to remuneration is based upon “Reward for Performance”, and remuneration is differentiated based on various measures of corporate, team, and individual performance .
Remuneration for non-executive directors was established using data from external independent consultants which is updated from time to time and takes into account:
The level of fees paid to non-executive directors of other ASX listed corporations of a similar size and complexity to Oil Search;
The growing international scale of Oil Search activities;
Responsibilities of non-executive directors; and
Work requirements of Board members .
2. SHARE TRADING POLICYOil Search has a share trading policy in place for all employees, including Key Management Personnel and directors, which is available on the Oil Search website in the Corporate Governance Section . Under this policy there are three groups of employees:
Restricted Employees – Executive General Managers and their direct reports, General Managers and their direct reports and other employees notified by the Group Secretary that they are a restricted employee;
Prescribed Employees – particular employees, contractors or a member of a class of employees or contractors that are notified by the Group Secretary that they are prescribed employees due to the nature of work they are undertaking; and
All Other Employees – any employee or contractor who is not classified as a Restricted or Prescribed Employee .
Under the Oil Search Share Trading Policy, non-executive directors are classified as restricted employees .
There are two specific periods defined in the share trading policy:
Closed Period – the period from 1 January to 12 noon on the day after the release of the full year results and the period from 1 July to 12 noon the day after the release of the half year results:
Trading Window – the period of four weeks commencing at 12 noon the day after:
– The release of the half year results;
– The release of the full year results; and
– The Oil Search Annual Meeting .
The Board may also approve trading windows at other times of the year .
The following table details the times at which employees can trade in Oil Search shares:
Table 1 – Trading permitted under the Oil Search Share Trading PolicyCLOSED PERIOD TRADING WINDOW ALL OTHER TIMES
Restricted Employees Not permitted to trade May trade, but Directors and Executive Management must first notify the Group Secretary
Must receive pre-approval to trade
Prescribed Employees Not permitted to trade Not permitted to trade Not permitted to tradeAll Other Employees Not permitted to trade May trade May trade
Regardless of the trading times specified in the above table, employees are not permitted to trade at any time if they are in receipt of inside information . Employees are also prohibited from hedging or acquiring options over unvested securities, granted under employee share plans, at any time . Regular audits of share trading are conducted by the Group Secretary to ensure compliance . F
or p
erso
nal u
se o
nly
70
D I R E C T O R S ’ R E P O R T
R e m u n e r a t i o n R e p o r t
3. ROLE OF THE PEOPLE AND NOMINATIONS COMMITTEE
The People and Nominations Committee (the Committee) of the Board, formerly called the Remuneration & Nominations Committee, provides advice and recommendations to the Board regarding people matters . The Committee’s responsibilities include:
Review of the ongoing appropriateness, coherence, and competitiveness of remuneration policies and practices, and recommendation of changes to the Board as appropriate;
Oversight of the implementation of remuneration, retention, talent management and termination policies;
Oversight of the key processes employed to identify and develop talent across the Group;
Recommendation to the Board on the specific remuneration of executive directors, Key Management Personnel and any other direct reports to the Managing Director;
Recommendation to the Board of budgets for annual remuneration awards for all other employees;
Recommendation to the Board on performance measures underpinning all Incentive Plans;
Board Performance Reviews;
Proposal to the Board for appointment of new non-executive directors;
Approval of terms and conditions and contracts for any new Key Management Personnel and other direct reports of the Managing Director .
The Committee must comprise at least three non-executive directors and the members of the Committee during the year were:
Dr ZE Switkowski – independent non-executive (Chair from 12 May 2011)
Mr KG Constantinou OBE – independent non-executive (from 16 April 2002)
Mr KW Spence – independent non-executive (from 9 May 2012)
Mr B Philemon – independent non-executive (from 5 November 2012)
At the Committee’s invitation, the Managing Director, Executive General Manager Human Resources, and Rewards Manager attend meetings in an advisory capacity and co-ordinate the work of external, independent advisors as requested . All executives are excluded from any discussions impacting their own remuneration .
Under its Charter, the Committee must meet at least four times a year . The Committee formally met four times during the year and the Committee Members’ attendance records are disclosed in the Directors’ Report . A copy of the charter of the Committee is available on Oil Search’s website in the Corporate Governance section .
To ensure it remains up to date with market practice, the Committee engages independent external advisors from time to time . The table below summarises work undertaken by external consultants at the Committee’s request in 2015 and also notes additional work undertaken by the same consultants
on behalf of management . Where a consultant was engaged by the Committee or the Board their findings were reported directly to the Committee or the Board .
Table 2 – External Consultants Engaged by the Committee in 2015
CONSULTANTCOMMITTEE AND BOARD ENGAGEMENTS
MANAGEMENT ENGAGEMENTS
Orient Capital Ad hoc reporting in relation to Total Shareholder Return calculations .
Regular analysis of the Company’s shareholder registry .
The Committee did not commission any advice from external consultants during 2015 in relation to Executive Remuneration quantum or Board Remuneration quantum .
4. REMUNERATION STRUCTURE Oil Search’s remuneration structure comprises four elements:
Total Fixed Remuneration (TFR);
Short-Term Incentive (STI);
Long-Term Incentive (LTI); and
Occasional Retention Awards of Restricted Shares for key/critical staff .
The mix of remuneration elements for individual employees is dependent on their level and role within Oil Search, with the proportion of “at risk” performance-related remuneration (STI and LTI elements) increasing with greater seniority .
Total Fixed Remuneration (TFR) The target ranges for TFR payable for roles in the organisation, including those for Key Management Personnel are 80% – 120% of competitive benchmarks . An independent external remuneration consultant is engaged by the Committee from time to time to provide competitive benchmark data for Key Management Personnel roles .
For other roles in the organisation, remuneration information is derived from annual remuneration surveys conducted by independent third parties .
An annual TFR review budget, agreed by the Board each year, is used to adjust TFRs paid to individuals to ensure that their fixed remuneration remains competitive for their specific skills, competence, and value to the Company . In recognition of the significant focus on costs, no Key Management Personnel received a TFR increase during 2015 .
Short-Term Incentive (STI) Each permanent employee has the opportunity to earn an annual STI which is based on a percentage of his or her TFR . The STI percentage increases with seniority to ensure a higher proportion of remuneration is “at risk” for our senior employees .
The size of the STI pool is directly related to corporate performance through a scorecard which includes a range of key measures that directly affect Shareholder Value and which are directly linked to the Oil Search Strategic Plan .
At the start of each year, the Board determines the hurdles and target levels of performance which form the STI scorecard .
For
per
sona
l use
onl
y

OIL SEARCH Annual Report 2015 71
D I R E C T O R S ’ R E P O R T
R e m u n e r a t i o n R e p o r t
As noted in last year’s report, given the transformational nature of the successful commissioning of PNG LNG, a significant review of the Oil Search strategic plan occurred during 2014 following which both STI and LTI measures for 2015 onwards were reviewed to ensure continued alignment to the revised strategy and that the weightings remained appropriate .
Following the review, the STI scorecard was reweighted to reflect the increased importance of safe and reliable production post commissioning of PNG LNG and the focus on costs . For 2015, the STI scorecard comprised the following components:
Operational components (55% of the scorecard):
– Safety (10%, comprising 6% Total Recordable Injury Frequency Rate and 4% High Potential Incident Rate)
– Production (20%, comprising 10% operated asset production and 10% non-operated asset production)
– Costs (20%)
– EBITDAX (5%)
Business Growth components (45% of the scorecard):
– Discovery or acquisition of new 2C Gas Resources (15%)
– Discovery or acquisition of new 2C Oil Resources (15%)
– Strategic and growth initiatives (15%)
At the end of the year, the Board approves an overall STI pool based on the level of achievement against the hurdles that were determined at the start of the year .
The STI pool is then distributed to employees taking into account:
The contribution of the employee’s division to the achievement of the organisational objectives; and
The individual performance of the employee .
The target levels of performance set by the Board are challenging and if achieved deliver the payment of 50% of STI opportunity . While individual awards above ‘Opportunity’ are possible, the overall STI pool available to all employees is capped at 100% of the opportunity amount .
Performance during 2015For 2015, performance for the scorecard measures was as follows:
MEASUREPERFORMANCE DURING 2015
Safety– Total Recordable Injury
Frequency rateMuch better than target
– High Potential Incident Rate Much better than targetProduction Much better than targetCosts Much better than targetEBITDAX Below target(1)
Discovery or acquisition of new 2C Gas Resources
Much better than target
Discovery or acquisition of new 2C Oil Resources
No achievement(2)
Strategic and growth initiatives Close to target
Overall for the 2015 performance year, the Board determined a scorecard outcome of 91% of Opportunity . This amount was then reduced to 72 .5% of Opportunity to reflect (1) an adjustment to the EBITDAX line item to recognise the statutory loss for 2015 and (2) the reassessment of results from the Taza appraisal drilling programme that indicated that a proportion of STI amounts paid in respect of the 2013 year related to Taza should be clawed back .
Table 3 – STI Awards to Employees Over the period 2011 to 2015 STI, the STI pool as a percentage of STI Opportunity has been as follows:
11 12 13 14 15
{ STI outcome as % of Opportunity
100.
0%
85.6
%
106.
8%
28.5
%
72.5
%Incentives – Executives
Performance RightsFor Key Management Personnel, and other key/critical managers and staff approved by the Board, the Long Term Incentive Plan (LTIP) is provided in the form of a grant of Performance Rights (PRs) .
Awards of PRs under the LTIP are rights to acquire ordinary shares in the Company for nil consideration, conditional on pre-determined corporate performance hurdles being met within defined time restrictions .
Vesting of the awards depends on Oil Search’s Total Shareholder Return (TSR) performance over a three-year period relative to two peer groups of companies . If the Performance Hurdles are satisfied awards automatically exercise on the vesting date and one Oil Search share is transferred in satisfaction of each vested Performance Right .
To determine the level of vesting of the awards, Oil Search’s TSR over the three year performance period is ranked against the TSR of each company in the two peer groups over the same period .
For each peer group, if Oil Search’s TSR performance is:
below median, that is the 50th percentile, no Performance Rights will vest;
at the median, 25% of the Performance Rights granted will vest;
greater than the median and less than the 75th percentile, the number of Performance Rights that will vest increases on a straight line basis from 25% to 50% of the total number of Performance Rights granted;
at or above the 75th percentile, 50% of the Performance Rights granted will vest .
For
per
sona
l use
onl
y

72
D I R E C T O R S ’ R E P O R T
R e m u n e r a t i o n R e p o r t
For example, if Oil Search’s TSR performance is at or above the 75th percentile TSR performance of both peer groups, 100% of the Performance Rights granted will vest .
For awards made since 2012 the two peer groups have been:
The ASX50 (excluding property trusts and non-standard listings); and
The constituents of the Standard & Poor’s Global Energy Index . TSR outcomes for this international group are normalised against a US dollar base currency to provide consistency of measurement .
For awards made between 2007 and 2011, Oil Search’s performance was measured against the following two peer groups:
The first 150 companies included in the ASX 200 Index; and
A selected group of similar sized international oil and gas exploration and production companies .(1)
The changes to the peer groups were made in recognition of the Company’s increasing market capitalisation and, in the case of the international group, to remove the subjectivity of inclusion or exclusion of individual oil and gas companies (the larger peer group also reducing the impact of mergers and acquisitions within the group) .
Awards of Performance Rights are aligned with growth in Shareholder Value, measured in terms of Total Shareholder Return relative to other peer companies .
The table below details the vesting of Performance Rights issued between 2011 and 2015:
Table 4 – Details of Awards of Performance Rights2011 2012 2013(3) 2014 2015
Measurement Period1 Jan 11 to 31 Dec 13
1 Jan 12 to 31 Dec 14
1 Jan 13 to 31 Dec 15
1 Jan 14 to 31 Dec 16
1 Jan 2015 to 31 Dec 17
Total Rights Granted 1,696,500 1,899,900 1,635,200 948,000 1,052,876
Oil Search TSR (3 year – AUD)(1) 27 .4% 34 .7% 6 .1% – –
Percentile Rank (ASX peer group) 59 .3 41 .1 30 .8% – –
Vesting 34 .25% 0% 0% May 2017 May 2018
Oil Search TSR (3 year – USD)(2) n/a 14 .0% -26 .4% – –
Percentile Rank (International Group) 85 .7 61 .9 51 .1 – –
Vesting 50% 36 .9% 26 .1% May 2017 May 2018
Total Vesting 84 .25% 36 .9% 26 .1% May 2017 May 2018
(1) TSR is calculated by an independent external consultant and is based on share price changes and dividends paid on the shares over the measurement period . In calculating the TSR it is assumed dividends are reinvested to purchase additional shares of the Company at the closing price applicable on the ex-dividend date .
(2) For awards made from 2012 onwards, TSR outcomes for the international group are measured in a common US dollar base currency to provide consistency of measurement .
(3) While the 2013 Performance Rights will not vest until May 2016, Oil Search relative TSR for the period 1 January 2013 to 31 December 2015 is available .
Deferred STIThe 50% deferred portion of an executive’s STI (see section 5 opposite) is awarded as Restricted Shares under the LTIP . Any dividends payable on Restricted Shares issued as the deferred component of an executive’s STI award are paid to the executive .
Long Term Incentives – General Employee Share PlanProvided that they have demonstrated an acceptable level of personal performance, each permanent employee has the opportunity to participate in the Oil Search Long Term Incentive Plan .
Share Appreciation RightsFor awards made in 2010 to 2013, participation in the general employee share plan was through awards of Share Appreciation Rights (SARs) . SARs operate in much the same way as Share Options, with an employee only receiving a benefit if the Oil Search share price increases over the vesting period . At the end of the vesting period the share appreciation is calculated and then that value is provided to the individual in Oil Search shares .
SARs are automatically exercised on vesting, which is dependent on the Oil Search share price increasing over the 3 year vesting period . Accordingly, if the share price does not increase above the Vesting Price, then the SARs will automatically lapse on the vesting date . As a result, the employee only benefits from a grant of SARs if the Oil Search share price increases over the three year vesting period, so this form of LTI is directly related to increasing Shareholder Value .
(1) The list of companies includes Anadarko Petroleum Corporation, AGL Energy Limited, AWE Limited, Cairn Energy, Canadian Natural Resources, Chesapeake Energy Corporation, Lundin Petroleum, Murphy Oil Corporation, Newfield Exploration, Nexen, Origin Energy, Premier Oil, Roc Oil, Santos, and Tullow Oil .
For
per
sona
l use
onl
y
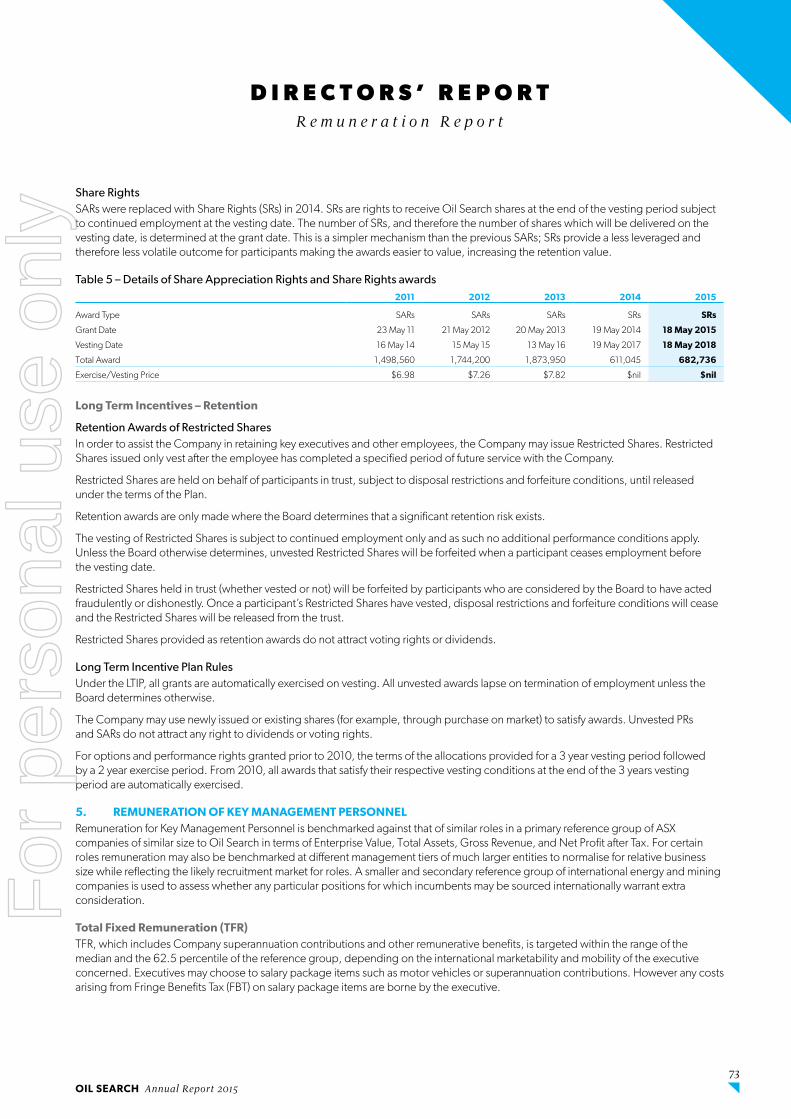
OIL SEARCH Annual Report 2015 73
D I R E C T O R S ’ R E P O R T
R e m u n e r a t i o n R e p o r t
Share RightsSARs were replaced with Share Rights (SRs) in 2014 . SRs are rights to receive Oil Search shares at the end of the vesting period subject to continued employment at the vesting date . The number of SRs, and therefore the number of shares which will be delivered on the vesting date, is determined at the grant date . This is a simpler mechanism than the previous SARs; SRs provide a less leveraged and therefore less volatile outcome for participants making the awards easier to value, increasing the retention value .
Table 5 – Details of Share Appreciation Rights and Share Rights awards2011 2012 2013 2014 2015
Award Type SARs SARs SARs SRs SRs
Grant Date 23 May 11 21 May 2012 20 May 2013 19 May 2014 18 May 2015
Vesting Date 16 May 14 15 May 15 13 May 16 19 May 2017 18 May 2018
Total Award 1,498,560 1,744,200 1,873,950 611,045 682,736
Exercise/Vesting Price $6 .98 $7 .26 $7 .82 $nil $nil
Long Term Incentives – Retention
Retention Awards of Restricted Shares In order to assist the Company in retaining key executives and other employees, the Company may issue Restricted Shares . Restricted Shares issued only vest after the employee has completed a specified period of future service with the Company .
Restricted Shares are held on behalf of participants in trust, subject to disposal restrictions and forfeiture conditions, until released under the terms of the Plan .
Retention awards are only made where the Board determines that a significant retention risk exists .
The vesting of Restricted Shares is subject to continued employment only and as such no additional performance conditions apply . Unless the Board otherwise determines, unvested Restricted Shares will be forfeited when a participant ceases employment before the vesting date .
Restricted Shares held in trust (whether vested or not) will be forfeited by participants who are considered by the Board to have acted fraudulently or dishonestly . Once a participant’s Restricted Shares have vested, disposal restrictions and forfeiture conditions will cease and the Restricted Shares will be released from the trust .
Restricted Shares provided as retention awards do not attract voting rights or dividends .
Long Term Incentive Plan RulesUnder the LTIP, all grants are automatically exercised on vesting . All unvested awards lapse on termination of employment unless the Board determines otherwise .
The Company may use newly issued or existing shares (for example, through purchase on market) to satisfy awards . Unvested PRs and SARs do not attract any right to dividends or voting rights .
For options and performance rights granted prior to 2010, the terms of the allocations provided for a 3 year vesting period followed by a 2 year exercise period . From 2010, all awards that satisfy their respective vesting conditions at the end of the 3 years vesting period are automatically exercised .
5. REMUNERATION OF KEY MANAGEMENT PERSONNEL Remuneration for Key Management Personnel is benchmarked against that of similar roles in a primary reference group of ASX companies of similar size to Oil Search in terms of Enterprise Value, Total Assets, Gross Revenue, and Net Profit after Tax . For certain roles remuneration may also be benchmarked at different management tiers of much larger entities to normalise for relative business size while reflecting the likely recruitment market for roles . A smaller and secondary reference group of international energy and mining companies is used to assess whether any particular positions for which incumbents may be sourced internationally warrant extra consideration .
Total Fixed Remuneration (TFR)TFR, which includes Company superannuation contributions and other remunerative benefits, is targeted within the range of the median and the 62 .5 percentile of the reference group, depending on the international marketability and mobility of the executive concerned . Executives may choose to salary package items such as motor vehicles or superannuation contributions . However any costs arising from Fringe Benefits Tax (FBT) on salary package items are borne by the executive .
For
per
sona
l use
onl
y
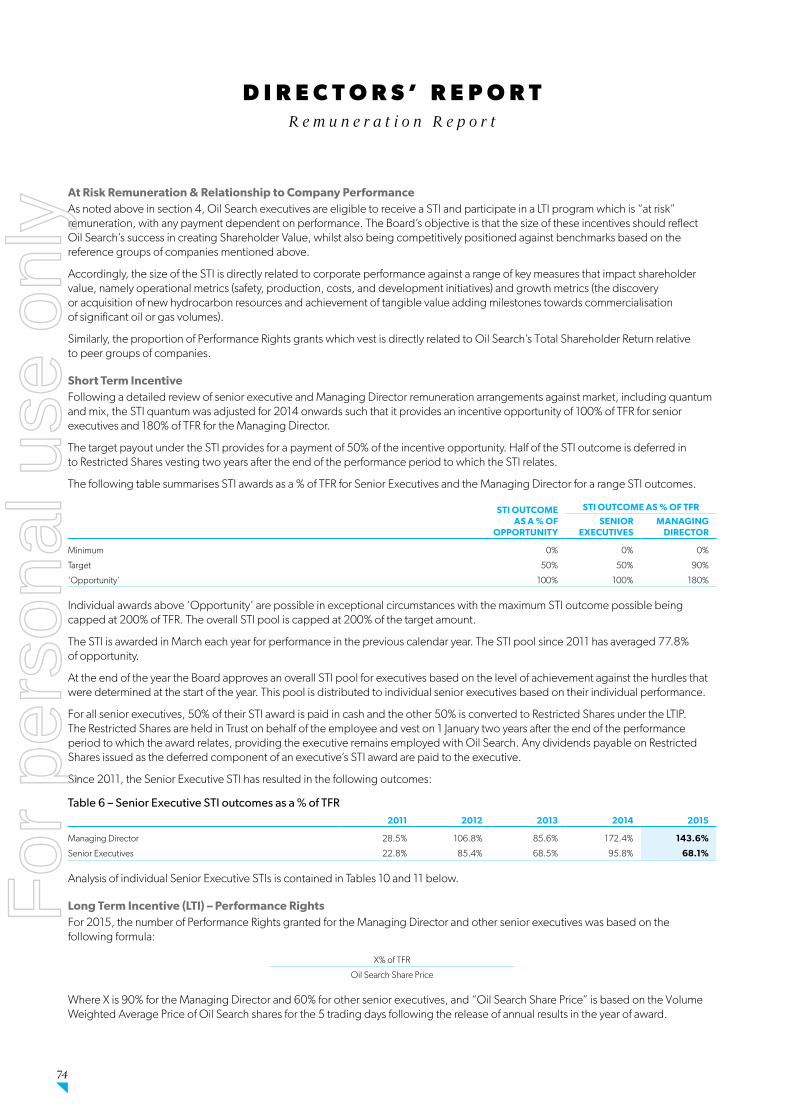
74
D I R E C T O R S ’ R E P O R T
R e m u n e r a t i o n R e p o r t
At Risk Remuneration & Relationship to Company Performance As noted above in section 4, Oil Search executives are eligible to receive a STI and participate in a LTI program which is “at risk” remuneration, with any payment dependent on performance . The Board’s objective is that the size of these incentives should reflect Oil Search’s success in creating Shareholder Value, whilst also being competitively positioned against benchmarks based on the reference groups of companies mentioned above .
Accordingly, the size of the STI is directly related to corporate performance against a range of key measures that impact shareholder value, namely operational metrics (safety, production, costs, and development initiatives) and growth metrics (the discovery or acquisition of new hydrocarbon resources and achievement of tangible value adding milestones towards commercialisation of significant oil or gas volumes) .
Similarly, the proportion of Performance Rights grants which vest is directly related to Oil Search’s Total Shareholder Return relative to peer groups of companies .
Short Term Incentive Following a detailed review of senior executive and Managing Director remuneration arrangements against market, including quantum and mix, the STI quantum was adjusted for 2014 onwards such that it provides an incentive opportunity of 100% of TFR for senior executives and 180% of TFR for the Managing Director .
The target payout under the STI provides for a payment of 50% of the incentive opportunity . Half of the STI outcome is deferred in to Restricted Shares vesting two years after the end of the performance period to which the STI relates .
The following table summarises STI awards as a % of TFR for Senior Executives and the Managing Director for a range STI outcomes .
STI OUTCOME AS A % OF
OPPORTUNITY
STI OUTCOME AS % OF TFR
SENIOR EXECUTIVES
MANAGING DIRECTOR
Minimum 0% 0% 0%
Target 50% 50% 90%
‘Opportunity’ 100% 100% 180%
Individual awards above ‘Opportunity’ are possible in exceptional circumstances with the maximum STI outcome possible being capped at 200% of TFR . The overall STI pool is capped at 200% of the target amount .
The STI is awarded in March each year for performance in the previous calendar year . The STI pool since 2011 has averaged 77 .8% of opportunity .
At the end of the year the Board approves an overall STI pool for executives based on the level of achievement against the hurdles that were determined at the start of the year . This pool is distributed to individual senior executives based on their individual performance .
For all senior executives, 50% of their STI award is paid in cash and the other 50% is converted to Restricted Shares under the LTIP . The Restricted Shares are held in Trust on behalf of the employee and vest on 1 January two years after the end of the performance period to which the award relates, providing the executive remains employed with Oil Search . Any dividends payable on Restricted Shares issued as the deferred component of an executive’s STI award are paid to the executive .
Since 2011, the Senior Executive STI has resulted in the following outcomes:
Table 6 – Senior Executive STI outcomes as a % of TFR2011 2012 2013 2014 2015
Managing Director 28 .5% 106 .8% 85 .6% 172 .4% 143.6%
Senior Executives 22 .8% 85 .4% 68 .5% 95 .8% 68.1%
Analysis of individual Senior Executive STIs is contained in Tables 10 and 11 below .
Long Term Incentive (LTI) – Performance Rights For 2015, the number of Performance Rights granted for the Managing Director and other senior executives was based on the following formula:
X% of TFR
Oil Search Share Price
Where X is 90% for the Managing Director and 60% for other senior executives, and “Oil Search Share Price” is based on the Volume Weighted Average Price of Oil Search shares for the 5 trading days following the release of annual results in the year of award .
For
per
sona
l use
onl
y

OIL SEARCH Annual Report 2015 75
D I R E C T O R S ’ R E P O R T
R e m u n e r a t i o n R e p o r t
The grants and vesting level of performance rights over the past five years for current Key Management Personnel is as follows:
Table 7 – Allocation of Performance Rights to Key Management Personnel 2011 2012 2013 2014 2015
NO. VEST NO. VEST NO. VEST(1) NO. VEST NO. VEST
Directors
P Botten 245,800 84 .25% 248,700 36 .9% 240,000 26 .1% 222,600 2017 236,000 2018
G Aopi 51,100 84 .25% 53,600 36 .9% 52,300 26 .1% 48,500 2017 51,400 2018
Executives
P Cholakos 55,200 84 .25% 55,900 36 .9% 53,900 26 .1% 50,000 2017 53,009 2018
G Darnley-Stuart 25,700 84 .25% 26,100 36 .9% 53,200 26 .1% 49,400 2017 52,331 2018
S Gardiner 44,200 84 .25% 44,700 36 .9% 52,300 26 .1% 49,700 2017 52,697 2018
J Fowles – – 55,300 36 .9% 54,900 26 .1% 51,000 2017 54,025 2018
M Herrett – – – – 45,200 26 .1% 42,500 2017 45,081 2018
I Munro – – – – 18,700 26 .1% 49,400 2017 52,331 2018
K Wulff – – – – – – – – 55,638 2018
Former Executives
M Kay – – – – 22,668 26 .1% 49,400 2017 52,331 2018
(1) The vesting date of the 2013 Performance Rights is 13 May 2016 . Oil Search’s TSR for the period 1 January 2013 to 31 December 2015 will result in 26 .1% vesting .
Corporate Financial Performance Table 8 illustrates Oil Search’s financial performance over the past five years, which may be compared with the levels of STI and LTI awards granted to Key Management Personnel and detailed above .
Table 8 – Oil Search’s Five Year Performance YEAR ENDED 31 DECEMBER 2011 2012 2013 2014 2015
Net profit/(loss) after tax (US$m) 202 .5 175 .8 205 .7 353 .2 (39.4)
Diluted Earnings per share (US cents) 15 .3 13 .2 15 .3 23 .8 (2.59)
Dividends per share (US cents) 4 .0 4 .0 4 .0 14 .0(1) 10.0
Shares Closing price (A$)(2) $6 .25 $7 .01 $8 .11 $7 .89 $6.70
Oil Search Three Year TSR(3) 44% 23% 27 .4% 34 .7% 6.1%
(1) Comprising an ordinary dividend of 8 US cents per share, a special dividend of 4 US cents per share and an interim dividend of 2 US cents per share .
(2) The closing price of Oil Search shares is taken on the last day of the financial year . The closing share price at the start of the 5 year period (31 December 2010) was $7 .04 .
(3) The TSR has been calculated by an independent external consultant and is based on share price increases and dividends paid on the shares over the three year period up to and including 31 December of the year they are reported against .
For
per
sona
l use
onl
y

76
D I R E C T O R S ’ R E P O R T
R e m u n e r a t i o n R e p o r t
6. REMUNERATION DETAILS FOR KEY MANAGEMENT PERSONNEL
For this section of the report, Key Management Personnel excludes non-executive directors, whose remuneration is disclosed in Section 10 . The Key Management Personnel for the purposes of this section are the following employees:
Mr Peter Botten CBE – Managing Director Incumbent for the full year
As the Managing Director, Peter has the overall responsibility for effectively managing Oil Search and achieving the corporate objectives . He is also responsible for ensuring that strategies agreed with the Board are implemented .
Mr Gerea Aopi CBE – Executive General Manager Stakeholder Engagement Incumbent for the full year
Gerea plays a major role in managing relationships with the PNG Government and other joint venture partners . He is also charged with strategy development and enactment of our community affairs within the Company . Gerea plays an important role in the interface between the Company and major shareholders in PNG .
In addition, Gerea has responsibility of leading the company’s broad sustainability strategies and social programs within PNG .
Mr Paul Cholakos – Executive General Manager Technical ServicesIncumbent for the full year
Paul was appointed to the role of EGM Technical Services in February 2015 . In his current position, Paul oversees the delivery of HSES, risk, drilling, engineering and ICT functions that underpin the Company’s operations . In his previous role as EGM PNG Operations, Paul played a major role in the Company’s transition to a major LNG exporter through its contributions to the world-class PNG LNG Project .
Mr Glenn Darnley-Stuart – Executive General Manager – Project Development Incumbent for the full year
Glenn was appointed to the role of EGM Project Development in February 2013 . He has responsibility for the delivery and management of Oil Search projects, with a specific focus on those associated with the PNG LNG Project . He is also responsible for the management of the corporate project function .
Glenn previously spent five years as General Manager PNG Operations and was seconded to ExxonMobil as a Project Manager on the PNG LNG Project .
Dr Julian Fowles – Executive General Manager PNG Business UnitIncumbent for the full year
Julian was appointed to the role of EGM PNG Business Unit in February 2015 . In his current role, Julian’s responsibilities include the management of Oil Search’s PNG assets and production, engagement with key stakeholders and addressing in-country issues . Julian previously held the position of Executive General Manager Exploration .
Mr Stephen Gardiner – Chief Financial Officer & Group SecretaryIncumbent for the full year
Stephen’s role is to manage the corporate finance, treasury, tax and audit functions for the company as well as all Group Secretarial matters . He is also responsible for the corporate sustainability function and delivering an appropriate financial control and reporting framework . Stephen was formally appointed to this position on 14 November 2012, having acted in the role since 2 July 2012 . Prior to this, Stephen’s role was EGM Sustainability, Corporate Services & Group Secretary .
Mr Michael Herrett – Executive General Manager Human Resources – Health & AdministrationIncumbent for the full year
Michael is responsible for establishing and aligning people management strategies, processes and systems to ensure that Oil Search attracts, develops, retains and rewards the right people with the right skills to achieve the strategic objectives of the organisation . Michael also has overall responsibility for Company’s enterprise management system and the Health & Administration function within the Company .
Mr Ian Munro – Executive General Manager – Gas Business Development Incumbent for the full year
Ian has responsibility for directing and managing Oil Search’s gas business development strategy, including managing OSL’s gas interests and assets, from a commercial and operational perspective . This includes but is not limited to OSL’s LNG interests in PNG . Ian is accountable for stewardship of Oil Search’s investment in the PNG LNG Project and the identification, promotion and Joint Venture management of growth and expansion opportunities for LNG in PNG .
Dr Keiran Wulff – Executive General Manager – Exploration and New VenturesIncumbent from 19 January 2015
Keiran has responsibility for Oil Search’s exploration programs to grow Shareholder value through exposure to quality exploration projects on a risked basis . Keiran leads teams in the technical and commercial evaluation of new ventures and business development opportunities .
For
per
sona
l use
onl
y

OIL SEARCH Annual Report 2015 77
D I R E C T O R S ’ R E P O R T
R e m u n e r a t i o n R e p o r t
Former Executives (Executives during the 2015 calendar year who are not Key Management Personnel at the date of this report)
Mr Philip Caldwell – Executive General Manager Enterprise Systems DevelopmentRetired 31 May 2015
Prior to his departure, Philip was responsible for Oil Search’s business systems and processes including Information and Communications Technology .
Mr Matthew Kay – Executive General Manager – Strategy & Commercial Incumbent from 6 January 2014, resigned 11 January 2016
Matthew had responsibility for leading all commercial aspects of the business, establishing cross business Commercial guidelines, processes and overseeing all commercial capability within the organisation . He co-ordinated the development of Corporate Strategy and had responsibility for the execution of mergers, divestments & acquisitions . Matthew resigned his employment on 11 January 2016 .
The remuneration philosophy outlined above is applied consistently to the Company’s Key management personnel . The following table shows the remuneration breakdown for current Key Management Personnel .
Table 9 – 2015 Key Management Personnel Remuneration Mix
The remuneration mix and quantum for the Managing Director and Executive General Managers is aligned with the Company’s targeted market positioning .
0
20
40
60
80
100
EXECUTIVE GENERAL MANAGERS
MANAGING DIRECTOR
36%
16%
16%
32%
48%
12%
12%
29%
{ TFR{ STI Cash{ STI Deferred{ LTI Face Value
Fixed Remuneration
(48%)Fixed
Remuneration (36%)
At Risk Remuneration
(52%)At Risk
Remuneration (64%)
The pay mix outlined above is determined by the application of the Oil Search Remuneration Strategy, assuming STI awards at 100% of target and LTI awards at 100% of their ‘face value’ (i .e ., not discounted to take account of the performance conditions nor dividends forgone over the vesting period) . Percentages shown in the later section on Executive Remuneration reflect actual incentives paid as a percentage of TFR, which includes movements in leave balances, non-monetary benefits and share based payments calculated in accordance with IFRS 2 Share Based Payment .
The following table is in US Dollars . For all remuneration reporting stated in US Dollars, the following exchange rates have been used:
EXCHANGE RATE 2014 2015
AUD/USD 0 .9028 0.7530
PGK/USD 0 .3994 0.3618
For
per
sona
l use
onl
y

78
D I R E C T O R S ’ R E P O R T
R e m u n e r a t i o n R e p o r t
Table 10 – Key Management Personnel Remuneration (US$)
YEAR
SHORT TERMPOST
EMPLOYMENT LONG TERM EQUITY(6) OTHER
TOTAL
SALARIES FEES AND
ALLOW-ANCES(1)
NON-MONETARY
BENEFITS(2)
SHORT TERM
IN-CENTIVE(3)
COMPANY CONTRIBU-
TION TO SUPER(4)
LONG SERVICE
LEAVE ACCRUAL(5)
PERFORM. RIGHTS
RESTRICT-ED
SHARES
SIGN ON/TERMI-
NATION BENEFITS
Directors
P Botten 2015 1,693,030 72,670 1,154,424 14,341 26,806 830,408 895,438 – 4,687,117
Managing Director 2014 2,036,505 9,464 1,662,634 16,502 107,653 1,057,235 842,218 – 5,732,211
G Aopi 2015 389,219 171,327 190,487 39,075 13,010 180,683 192,942 – 1,176,743
EGM Stakeholder Engagement 2014 394,414 222,434 291,221 68,774 23,922 228,343 264,783 – 1,493,891
Executives
P Cholakos 2015 548,436 159,150 196,477 14,341 51,176 190,615 202,492 – 1,362,687
EGM Technical Services 2014 632,950 12,434 312,647 16,502 – 242,405 353,965 – 1,570,903
G Darnley-Stuart 2015 532,174 – 193,968 25,486 8,905 175,946 196,136 – 1,132,615
EGM Project Development 2014 673,110 54,853 296,541 16,502 26,411 185,265 82,474 – 1,335,156
J Fowles 2015 945,780 50,282 200,243 1,179 – 193,577 292,807 – 1,683,868
EGM PNG Business Unit 2014 662,039 – 306,135 16,502 – 216,847 187,870 – 1,389,393
S Gardiner 2015 540,964 – 197,612 14,341 8,975 183,184 202,196 – 1,147,272
Chief Financial Officer & Group Secretary 2014 619,330 – 323,005 16,502 17,678 218,753 216,136 – 1,411,404
M Herrett 2015 449,784 – 174,009 27,088 – 151,248 170,693 – 972,822
EGM Human Resources, Health & Administration 2014 561,609 – 265,891 16,502 – 124,315 110,445 – 1,078,762
I Munro 2015 508,890 – 194,235 24,095 – 118,834 329,462 – 1,175,516
EGM Gas Business Development 2014 655,473 – 320,765 16,502 – 81,547 64,728 – 1,139,015
K Wulff 2015 554,979 34,704 218,881 14,341 – 26,217 – – 849,122
EGM Exploration & New Ventures 2014 – – – – – – – – –
Former Executives
P Caldwell 2015 178,279 – – 15,306 – 106,749 369,503 – 669,837
EGM Enterprise Systems 2013 588,877 – 332,187 16,502 – 257,476 236,410 – 1,431,452
M Kay 2015 538,724 – 133,770 25,170 – 124,136 146,508 – 968,308
EGM Strategy & Commercial 2014 641,632 – 302,135 16,502 – 87,904 157,032 – 1,205,205
(1) Includes salaries, allowances, expatriate allowances and movements in annual leave accruals .
(2) Includes the grossed up FBT value of benefits subject to FBT provided to an employee in the year that the FBT is payable .
(3) STI is based on the year that the performance period relates to, regardless of when paid and excludes the 50% which is deferred into Oil Search Shares under the Restricted Share Plan, which is captured in the Restricted Shares data in the Equity section .
(4) Superannuation is the contributions made to an approved superannuation fund .
(5) Long service leave accrual is based on the relevant legislation .
(6) Equity is the expensed value of all Performance Rights or Restricted Shares .
Details of the vesting profile of the Short Term Incentives awarded as remuneration to each Director of Oil Search and the Key Management Personnel are detailed in Table 11 . Percentages of STI are based on assuming STI awards at 100% of opportunity .
For
per
sona
l use
onl
y

OIL SEARCH Annual Report 2015 79
D I R E C T O R S ’ R E P O R T
R e m u n e r a t i o n R e p o r t
Table 11 – Analysis of STI Included in RemunerationINCLUDED IN
REMUNERATION (US$)(1)
% OF STI OPPORTUNITY CASH DEFERRED
Directors
P Botten 2,308,848 79 .75% 1,154,424 1,154,424
G Aopi 380,974 72 .50% 190,487 190,487
Executives
P Cholakos 392,954 72 .50% 196,477 196,477
G Darnley-Stuart 387,936 72 .50% 193,968 193,968
J Fowles 400,486 72 .50% 200,243 200,243
S Gardiner 395,224 73 .35% 197,612 197,612
M Herrett 348,018 75 .50% 174,009 174,009
I Munro 388,470 72 .60% 194,235 194,235
K Wulff 437,762 76 .95% 218,881 218,881
Former Executives
M Kay(2) 133,770 25 .00% 133,770 –
(1) The value includes 50% of the STI award paid as cash (as reported in Table 10) as well as the 50% to be deferred via the allocation of Restricted Shares that will vest on 1 January 2018 .
(2) M Kay forfeited any entitlement to his deferred STI upon his resignation .
7. KEY TERMS OF EMPLOYMENT CONTRACTS FOR KEY MANAGEMENT PERSONNEL Table 12 identifies the contractual provisions for current Key Management Personnel . All employees at Oil Search have no contractual entitlement to future increases in remuneration or entitlement to receive any incentives, whether Short Term or Long Term .
Remuneration for all employees is reviewed via an annual process across the organisation . Remuneration for the Managing Director and the Key Management Personnel is reviewed by the People and Nominations Committee, which then recommends to the Board:
Budgets for TFR increases for the coming year;
STI payments for the previous year;
STI targets for the coming year; and
LTI participation in the coming year .
For all other employees, the Managing Director approves recommendations from senior managers across the organisation, within budgets approved by the Board .
Table 12 – Contractual Provisions for Specified ExecutivesEMPLOYING
COMPANYCONTRACT DURATION
NOTICE PERIOD COMPANY
NOTICE PERIOD EMPLOYEE TERMINATION PROVISION
P Botten POSL Ongoing 6 months 6 months 18 months Total Fixed Reward
G Aopi OSPNG Ongoing 1 month 1 month4 weeks per year of service (minimum 8, maximum 52)
Other EGMs POSL Ongoing 6 months 6 months4 weeks per year of service (minimum 8, maximum 52)
For
per
sona
l use
onl
y

80
D I R E C T O R S ’ R E P O R T
R e m u n e r a t i o n R e p o r t
8. EQUITY INSTRUMENTSAll Rights in the following tables refer to Performance Rights or Restricted Shares issued in accordance with the Performance Rights Plan or Long Term Incentive Plan . The structure of the Rights is detailed in section 4 on Remuneration Structure .
Rights over Equity Instruments Granted as Remuneration
Details of Performance Rights over ordinary shares in the Company that were granted as remuneration to each key manager during the reporting period and details of Performance Rights that vested during the reporting period are as follows:
Table 13 – Details of Performance Rights GrantedNUMBER OF
RIGHTS GRANTED DURING 2015
GRANT DATE
FAIR VALUE PER RIGHT
(A$)
EXERCISE PRICE PER RIGHT
(A$)EXPIRY
DATE
Directors
P Botten 236,000 18 May 2015 $2 .995 $0 .00 18 May 2018
G Aopi 51,400 18 May 2015 $2 .995 $0 .00 18 May 2018
Executives
P Cholakos 53,009 18 May 2015 $2 .995 $0 .00 18 May 2018
G Darnley-Stuart 52,331 18 May 2015 $2 .995 $0 .00 18 May 2018
J Fowles 54,025 18 May 2015 $2 .995 $0 .00 18 May 2018
S Gardiner 52,697 18 May 2015 $2 .995 $0 .00 18 May 2018
M Herrett 45,081 18 May 2015 $2 .995 $0 .00 18 May 2018
I Munro 52,331 18 May 2015 $2 .995 $0 .00 18 May 2018
K Wulff 55,638 18 May 2015 $2 .995 $0 .00 18 May 2018
Former Executives
M Kay 52,331 18 May 2015 $2 .995 $0 .00 18 May 2018
All Performance Rights expire on the earlier of their expiry date or termination of the individual’s employment unless the Board determines otherwise . Performance Rights automatically exercise on the vesting dates detailed in the tables above conditional on Oil Search achieving certain performance hurdles . Details of the performance criteria are included in the section on Long Term Incentives above . For Performance Rights granted in 2015 the earliest exercise date is 18 May 2018 .
The deferred component of the 2014 STI was allocated as Restricted Shares under the Long Term Incentive Plan outlined above for certain Key Management Personnel in 2015 . The number of Restricted Shares granted during the reporting period is as follows:
Table 14a – Details of Deferred STI granted as Restricted Shares NUMBER
GRANTED DURING 2015
GRANT DATE
FAIR VALUE (A$)
EXERCISE PRICE (A$)
VESTING DATE
Directors
P Botten(1) 226,043 18 May 2015 $7 .33 $0 .00 1 January 2017
G Aopi(1) 39,593 18 May 2015 $7 .33 $0 .00 1 January 2017
Executives
P Cholakos 42,506 18 May 2015 $7 .33 $0 .00 1 January 2017
G Darnley-Stuart 40,316 18 May 2015 $7 .33 $0 .00 1 January 2017
J Fowles 41,621 18 May 2015 $7 .33 $0 .00 1 January 2017
S Gardiner 43,914 18 May 2015 $7 .33 $0 .00 1 January 2017
M Herrett 36,149 18 May 2015 $7 .33 $0 .00 1 January 2017
I Munro 43,610 18 May 2015 $7 .33 $0 .00 1 January 2017
Former Executives
P Caldwell(2) 45,162 18 May 2015 $7 .33 $0 .00 31 May 2015
M Kay 41,077 18 May 2015 $7 .33 $0 .00 1 January 2017
(1) The allocations for P Botten and G Aopi were approved at the 2015 Annual Meeting .
(2) The Restricted Shares allocated to P Caldwell vested on the date of his retirement from Oil Search .
For
per
sona
l use
onl
y

OIL SEARCH Annual Report 2015 81
D I R E C T O R S ’ R E P O R T
R e m u n e r a t i o n R e p o r t
Table 14b – Details of other awards of Restricted Shares NUMBER
GRANTED DURING 2015
GRANT DATE
FAIR VALUE (A$)
EXERCISE PRICE (A$)
VESTING DATE
J Fowles(1) 50,000 2 March 2015 $8 .12 $0 .00 31 December 2017
(1) J Fowles received the above following his commencement in the role of EGM PNG Business Unit .
Modification of Terms of Equity Settled Share based Payment TransactionsNo terms related to equity-settled share based payment transactions (including Performance Rights and Restricted Shares granted as compensation to Key Management Personnel) have been altered or modified by the issuing entity during the reporting period or the prior period, with the exception of the early vesting of certain allocations for terminating employees .
Exercise of Rights Granted as Remuneration During the reporting period, the following shares were issued on the exercise of Performance Rights previously granted as remuneration:
Table 15 – Details of the Exercise of Performance Rights
EXERCISED IN 2015
NUMBER OF RIGHTS
EXERCISED
AMOUNT PAID PER SHARE
(A$)
Directors
P Botten 91,770 $0.00
G Aopi 19,778 $0.00
Executives
P Cholakos 20,627 $0.00
G Darnley-Stuart 9,631 $0.00
J Fowles 20,406 $0.00
S Gardiner 16,494 $0.00
Former Executives
P Caldwell 21,882 $0.00
EXERCISED IN 2014
NUMBER OF RIGHTS
EXERCISED
AMOUNT PAID PER SHARE
(A$)
Directors
P Botten 207,087 $0 .00
G Aopi 75,988 $0 .00
Executives
P Cholakos 46,506 $0 .00
G Darnley-Stuart 21,652 $0 .00
S Gardiner 62,299 $0 .00
Former executives
P Caldwell 49,455 $0 .00
For
per
sona
l use
onl
y

82
D I R E C T O R S ’ R E P O R T
R e m u n e r a t i o n R e p o r t
Analysis of Performance Rights and Restricted Shares Over Equity Instruments Granted as Remuneration Details of vesting profiles and movements of Performance Rights and Restricted Shares granted as remuneration to Key Management Personnel are set out in Table 16 and Table 17 below .
Table 16 – Details of Vesting Profile and movements of Performance RightsMOVEMENTS DURING THE YEAR
GRANT DATE
BALANCE AT 1 JAN 2015
RIGHTS GRANTED
RIGHTS EXERCISED
RIGHTS LAPSED
BALANCE AT 31 DEC 2015
% VESTED IN THE YEAR
% FORFEITED
IN THE YEAR
FINANCIAL YEAR OF VESTING
Directors
P Botten 21/5/12 248,700 – (91,770) (156,930) – 36 .9% 63 .1% 201510/5/13 240,000 – – – 240,000 201619/5/14 222,600 – – – 222,600 201718/5/15 – 236,000 – – 236,000 2018
Total 711,300 236,000 (91,770) (156,930) 698,600G Aopi 21/5/12 53,600 – (19,778) (33,822) – 36 .9% 61 .1% 2015
10/5/13 52,300 – – – 52,300 201619/5/14 48,500 – – – 48,500 201718/5/15 – 51,400 – – 51,400 2018
Total 154,400 51,400 (19,778) (33,822) 152,200
ExecutivesP Cholakos 21/5/12 55,900 – (20,627) (35,273) – 36 .9% 61 .1% 2015
24/5/13 53,900 – – – 53,900 201619/5/14 50,000 – – – 50,000 201718/5/15 – 53,009 – – 53,009 2018
Total 159,800 53,009 (20,627) (35,273) 156,909G Darnley-Stuart 21/5/12 26,100 – (9,631) (16,469) – 36 .9% 61 .1% 2015
24/5/13 53,200 – – – 53,200 201619/5/14 49,400 – – – 49,400 201718/5/15 – 52,331 – – 52,331 2018
Total 128,700 52,331 (9,631) (16,469) 154,931J Fowles 21/5/12 55,300 – (20,406) (34,894) – 36 .9% 61 .1% 2015
24/5/13 54,900 – – – 54,900 201619/5/14 51,000 – – – 51,000 201718/5/15 – 54,025 – – 54,025 2018
Total 161,200 54,025 (20,406) (34,894) 159,925S Gardiner 21/5/12 44,700 – (16,494) (28,206) – 36 .9% 61 .1% 2015
24/5/13 52,300 – – – 52,300 201619/5/14 49,700 – – – 49,700 201718/5/15 – 52,697 – – 52,697 2018
Total 146,700 52,697 (16,494) (28,206) 154,697M Herrett 24/5/13 45,200 – – – 45,200 2016
19/5/14 42,500 – – – 42,500 201718/5/15 – 45,081 – – 45,081 2018
Total 87,700 45,081 – – 132,781I Munro 10/1/14 18,700 – – – 18,700 2016
19/5/14 49,400 – – – 49,400 201718/5/15 – 52,331 – – 52,331 2018
Total 68,100 52,331 – – 120,431K Wulff 18/5/15 – 55,638 – – 55,638 2018
Total – 55,638 – – 55,638
Former ExecutivesP Caldwell 21/5/12 59,300 – (21,882) (37,418) – 36 .9% 61 .1% 2015
24/5/13 57,300 – – (18,210) 39,090(1) 31 .8% 201619/5/14 53,100 – – (34,842) 18,258(1) 65 .6% 2017
Total 169,700 – (21,882) (90,470) 57,348M Kay 10/1/14 22,668 – – – 22,668 2016
19/5/14 49,400 – – – 49,400 201718/5/15 – 52,331 – – 52,331 2018
Total 72,068 52,331 – – 124,399
(1) P Caldwell was afforded ‘good leaver’ treatment in relation to his unvested Performance Rights on his retirement from Oil Search . Under the ‘good leaver’ provisions, P Caldwell retains a pro-rata amount of unvested Performance Rights held by him at his retirement date calculated by reference to his time served as an employee during the respective vesting period as a proportion of the overall vesting period . The retained Performance Rights are subject to testing along with those held by continuing employees at the original vesting date .
For
per
sona
l use
onl
y
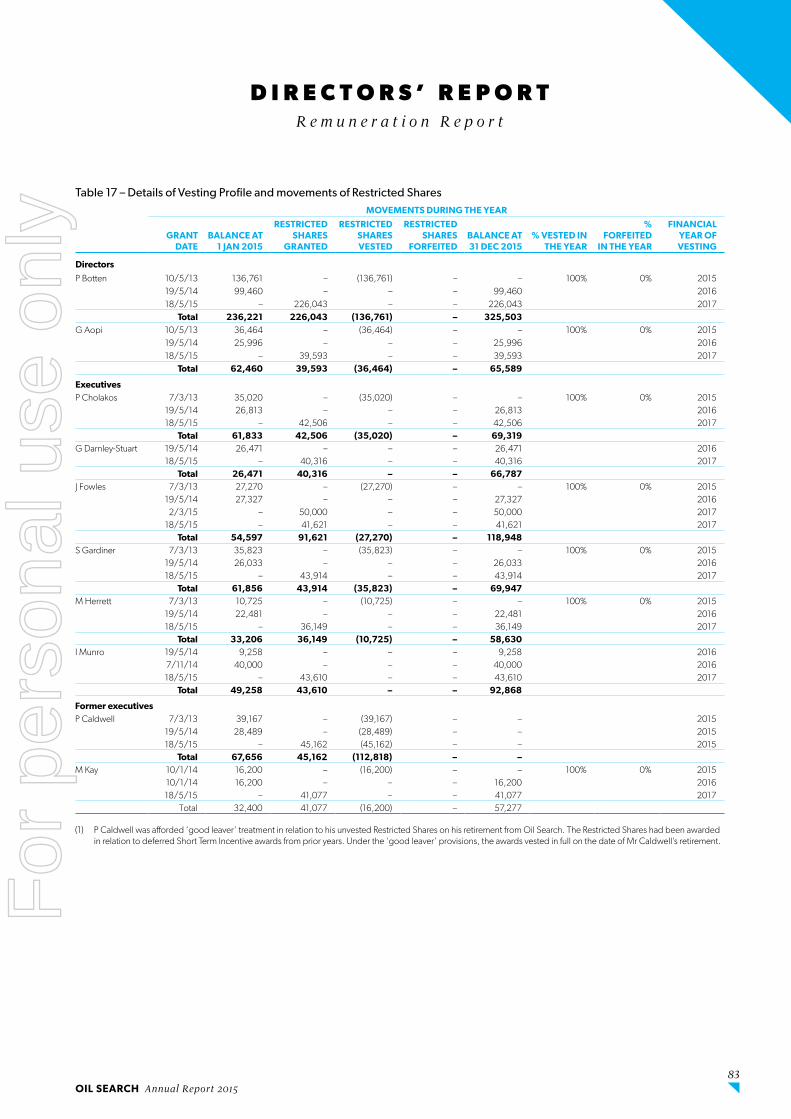
OIL SEARCH Annual Report 2015 83
D I R E C T O R S ’ R E P O R T
R e m u n e r a t i o n R e p o r t
Table 17 – Details of Vesting Profile and movements of Restricted SharesMOVEMENTS DURING THE YEAR
GRANT DATE
BALANCE AT 1 JAN 2015
RESTRICTED SHARES
GRANTED
RESTRICTED SHARES VESTED
RESTRICTED SHARES
FORFEITEDBALANCE AT 31 DEC 2015
% VESTED IN THE YEAR
% FORFEITED
IN THE YEAR
FINANCIAL YEAR OF VESTING
Directors
P Botten 10/5/13 136,761 – (136,761) – – 100% 0% 201519/5/14 99,460 – – – 99,460 201618/5/15 – 226,043 – – 226,043 2017
Total 236,221 226,043 (136,761) – 325,503G Aopi 10/5/13 36,464 – (36,464) – – 100% 0% 2015
19/5/14 25,996 – – – 25,996 201618/5/15 – 39,593 – – 39,593 2017
Total 62,460 39,593 (36,464) – 65,589
ExecutivesP Cholakos 7/3/13 35,020 – (35,020) – – 100% 0% 2015
19/5/14 26,813 – – – 26,813 201618/5/15 – 42,506 – – 42,506 2017
Total 61,833 42,506 (35,020) – 69,319G Darnley-Stuart 19/5/14 26,471 – – – 26,471 2016
18/5/15 – 40,316 – – 40,316 2017Total 26,471 40,316 – – 66,787
J Fowles 7/3/13 27,270 – (27,270) – – 100% 0% 201519/5/14 27,327 – – – 27,327 2016
2/3/15 – 50,000 – – 50,000 201718/5/15 – 41,621 – – 41,621 2017
Total 54,597 91,621 (27,270) – 118,948S Gardiner 7/3/13 35,823 – (35,823) – – 100% 0% 2015
19/5/14 26,033 – – – 26,033 201618/5/15 – 43,914 – – 43,914 2017
Total 61,856 43,914 (35,823) – 69,947M Herrett 7/3/13 10,725 – (10,725) – – 100% 0% 2015
19/5/14 22,481 – – – 22,481 201618/5/15 – 36,149 – – 36,149 2017
Total 33,206 36,149 (10,725) – 58,630I Munro 19/5/14 9,258 – – – 9,258 2016
7/11/14 40,000 – – – 40,000 201618/5/15 – 43,610 – – 43,610 2017
Total 49,258 43,610 – – 92,868
Former executivesP Caldwell 7/3/13 39,167 – (39,167) – – 2015
19/5/14 28,489 – (28,489) – – 201518/5/15 – 45,162 (45,162) – – 2015
Total 67,656 45,162 (112,818) – –M Kay 10/1/14 16,200 – (16,200) – – 100% 0% 2015
10/1/14 16,200 – – – 16,200 201618/5/15 – 41,077 – – 41,077 2017
Total 32,400 41,077 (16,200) – 57,277
(1) P Caldwell was afforded ‘good leaver’ treatment in relation to his unvested Restricted Shares on his retirement from Oil Search . The Restricted Shares had been awarded in relation to deferred Short Term Incentive awards from prior years . Under the ‘good leaver’ provisions, the awards vested in full on the date of Mr Caldwell’s retirement .
For
per
sona
l use
onl
y

84
D I R E C T O R S ’ R E P O R T
R e m u n e r a t i o n R e p o r t
Analysis of Movements in Performance Rights and Restricted SharesThe movement during the reporting period, by value of Performance Rights or Restricted Shares over ordinary shares in Oil Search held by each Key Management Personnel, is detailed below:
Table 18 – Movement in Value of Performance Rights and Restricted Shares
GRANTED IN THE YEAR
(US$)(1)
VALUE OF PERFORMANCE RIGHTS EXERCISED AND RESTRICTED SHARES VESTED IN THE YEAR(2)
VALUE OF PERFORMANCE RIGHTS LAPSED AND RESTRICTED SHARES FORFEITED IN THE YEAR(3)
(US$)
NUMBER
AVERAGE VALUE
(US$)
TOTAL VALUE
(US$) NUMBER
AVERAGE VALUE
(US$)
TOTAL VALUE
(US$)
Directors
P Botten 1,779,878 228,531 5 .83 1,332,173 156,930 5 .66 888,626
G Aopi 334,452 56,242 5 .84 328,633 33,822 5 .66 191,519
Executives
P Cholakos 354,159 55,647 5 .84 324,861 35,273 5 .66 199,735
G Darnley-Stuart 278,157 9,631 5 .66 54,536 16,469 5 .66 93,257
J Fowles 657,284 47,676 5 .82 277,566 34,894 5 .66 197,589
S Gardiner 361,227 52,317 5 .85 306,229 28,206 5 .66 159,718
M Herrett 302,816 10,725 5 .94 63,719 – – –
I Munro 358,724 – – – – – –
K Wulff 125,477 – – – – – –
Former Executives
P Caldwell(4) 249,271 134,700 5 .82 784,196 90,470 5 .75 519,882
M Kay 344,743 16,200 6 .24 101,126 – – –
(1) The value for awards granted is the fair value at the time of grant for Performance Rights and the share price on the date of grant for Restricted Shares .
(2) The value for Performance Rights exercised is based on the market price of Oil Search shares on the close of trade on the date of exercise . The value for Restricted Shares is based on the market price of Oil Search shares on the close of trade on the vesting date .
(3) The value for Performance Rights lapsed and Restricted Shares forfeited is based on the market price of Oil Search shares on the close of trade on the date of the lapse or forfeiture .
(4) The Restricted Shares vesting in 2015 includes the early vesting of Restricted Shares under good leaver provisions approved by the Board upon Mr Caldwell’s retirement .
KMP shareholdingsThe following table summarises the movements in shareholdings of Executive KMP including their personally related entities for the 2015 financial year .
Table 19 – KMP shareholdingsBALANCE AT
1 JANUARY 2015
ACQUIRED (DISPOSED)
DURING 2015
BALANCE AT 31 DECEMBER
2015
Directors
P Botten 2,222,403 165,531 2,387,934
G Aopi 394,602 56,842 451,444
Executives
P Cholakos 174,770 55,647 230,417
G Darnley-Stuart – 10,000 10,000
J Fowles 1,829 47,676 49,505
S Gardiner 295,167 52,317 347,484
M Herrett 1,829 – 1,829
I Munro – – –
K Wulff 8,590 – 8,590
Former Executives
P Caldwell – – –
M Kay – – –
For
per
sona
l use
onl
y

OIL SEARCH Annual Report 2015 85
D I R E C T O R S ’ R E P O R T
R e m u n e r a t i o n R e p o r t
9. NON-EXECUTIVE DIRECTOR REMUNERATION
Remuneration Policy Remuneration for Non-Executive Directors is determined by reference to relevant external market data and takes into consideration the level of fees paid to directors of other Australian corporations of similar size and complexity to Oil Search, the growing scale of its international activities and the responsibilities and work requirements of Board members . Remuneration for Non-Executive Directors is subject to the aggregate limit of A$2,500,000 in any calendar year set by shareholders at the 2013 Annual Meeting .
Remuneration Payable Fees payable to Non-Executive Directors are reviewed periodically and are fixed by the Board as discussed above . Table 18 below sets out the fee structure applied from 1 January 2013 .
Table 20 – Annual Board and Committee Fees Payable to Non-Executive Directors in Australian DollarsPOSITION ANNUAL FEE
Chairman of the Board(1) A$495,000
Non-Executive Directors other than the Chairman A$165,000
Chairman Audit and Financial Risk Committee (additional fee) A$49,500
Chairman Health, Safety and Sustainability Committee (additional fee) A$38,500
Chairman People and Nominations Committee (additional fee)(2) A$38,500
Member Audit and Financial Risk Committee (additional fee) A$25,500
Member Health, Safety and Sustainability Committee (additional fee) A$22,000
Member People and Nominations Committee (additional fee) A$22,000
(1) The fees paid to the Chairman of the Board are inclusive of any Committee Fees .
(2) The Remuneration and Nominations Committee was renamed the People and Nominations Committee during 2013 .
Each non-executive director also receives a travel allowance of A$25,500 per annum to compensate for the time spent travelling between Papua New Guinea and Australia to attend Board and Committee Meetings and for time spent on field trips to the Company’s global operations .
Board fees are paid to non-executive directors only .
In addition to Board and Committee fees, non-executive directors are entitled to be reimbursed for all reasonable travel, accommodation and other expenses incurred in attending meetings of the Board, Committees or shareholders or while engaged on Oil Search business .
The total remuneration which was paid to each non-executive director in 2014 and 2015 is set out in Table 22 .
There are no provisions in any of the non-executive directors’ appointment arrangements for compensation payable on early termination of their directorship .
There is no separate retirement benefits plan or provision for superannuation for Oil Search’s non-executive directors .
Equity Participation for Non-Executive Directors There is no share plan for Oil Search non-executive directors . The following table summarises the movements in shareholdings of Non-Executive Directors including their personally related entities for the 2015 financial year .
Table 21 – Non-Executive Director shareholdingsBALANCE AT
1 JANUARY 2015
ACQUIRED (DISPOSED)
DURING 2015
BALANCE AT 31 DECEMBER
2015
KG Constantinou – – –
FE Harris 31,961 – 31,961
AJ Kantsler 45,736 – 45,736
RJ Lee 71,829 25,000 96,829
B Philemon 7,241 – 7,241
KW Spence 25,000 – 25,000
ZE Switkowski 201,829 – 201,829
For
per
sona
l use
onl
y

D I R E C T O R S ’ R E P O R T
R e m u n e r a t i o n R e p o r t
86
Details of Directors’ Remuneration The details of the remuneration received by Oil Search directors in 2014 and 2015 are set out in Table 19 below .
The Managing Director, Mr Botten, and the Executive General Manager PNG Stakeholder Engagement, Mr Aopi, are the only executive directors on the Board .
Table 22 – Remuneration (US$) of Directors of Oil Search Limited
DIRECTORS YEAR
SHORT TERMPOST
EMP’MENTLONG TERM EQUITY OTHER
TOTAL
SALARIES FEES AND
ALLOW-ANCES
NON-MONETARY
BENEFITS
SHORT TERM
INCENTIVE
COMPANY CONTRIBU-
TION TO SUPER
LONG SERVICE
LEAVE ACCRUAL
PERFORM. RIGHTS
RESTRICTED SHARES
SIGN ON/TERMINA-
TION BENEFITS
Executive Directors
P Botten 2015 1,693,030 72,670 1,154,424 14,341 26,806 830,408 895,438 – 4,687,117
Managing Director 2014 2,036,505 9,464 1,662,634 16,502 107,653 1,057,235 842,218 – 5,732,211
G Aopi 2015 389,219 171,327 190,487 39,075 13,010 180,683 192,942 – 1,176,743
EGM Stakeholder Engagement 2014 394,414 222,434 291,221 68,774 23,922 228,343 264,783 – 1,493,891
Non-Executive Directors
R Lee 2015 391,937 – – – – – – – 391,937
2014 469,907 – – – – – – – 469,907
KG Constantinou 2015 176,578 – – – – – – – 176,578
2014 211,707 – – – – – – – 211,707
A Kanstler 2015 197,286 – – – – – – – 197,286
2014 236,534 – – – – – – – 236,534
B Philemon 2015 179,214 – – – – – – – 179,214
2014 214,866 – – – – – – – 214,866
KW Spence 2015 189,003 – – – – – – – 189,003
2014 221,911 – – – – – – – 221,911
ZE Switkowski 2015 191,638 – – – – – – – 191,638
2014 198,489 – – – – – – – 198,489
Former Non-Executive Directors
F Harris(1) 2015 119,476 – – – – – – – 119,476
2014 214,866 – – – – – – – 214,866
(1) Ms F Harris resigned as a non-executive Director of Oil Search on 17 December 2015 following a period of unpaid leave in order to focus on making a full recovery from a health issue .
Signed in accordance with a resolution of the directors .
Richard LeeCHAIRMAN
Peter BottenMANAGING DIRECTOR
Sydney, 22 February 2016
For
per
sona
l use
onl
y
A U D I T O R ’ S I N D E P E N D E N C E D E C L A R A T I O N
f o r t h e y e a r e n d e d 3 1 D e c e m b e r 2 0 1 5
OIL SEARCH Annual Report 2015 87
Deloitte Touche TohmatsuA.B.N. 74 490 121 060
Grosvenor Place225 George StreetSydney NSW 2000PO Box N250 Grosvenor PlaceSydney NSW 1220 Australia
DX 10307SSETel: +61 (0) 2 9322 7000Fax: +61 (0) 2 9322 7001
The Directors www.deloitte.com.auOil Search LimitedLevel 22,1 Bligh StreetSydney NSW 2000
22 February 2016
Dear Directors,Oil Search Limited
I am pleased to provide the following declaration of independence to the directors of Oil Search Limited.
As lead audit partner for the audit of the financial statements of Oil Search Limited for the year ended 31December 2015, I declare that to the best of my knowledge and belief, there have been no contraventions of theauditor independence requirements of the Code of Ethics for Professional Accountants, issued by theInternational Ethics Standards Board for Accountants (IESBA) in relation to the audit.
Yours sincerely
DELOITTE TOUCHE TOHMATSU
Matthew DonaldsonPartnerChartered Accountants
Member of Deloitte Touche Tohmatsu Limited.
87
For
per
sona
l use
onl
y

88
S T A T E M E N T S O F C O M P R E H E N S I V E I N C O M E
f o r t h e y e a r e n d e d 3 1 D e c e m b e r 2 0 1 5
NOTE
CONSOLIDATED PARENT
2015$’000
2014$’000
2015$’000
2014$’000
Revenue 3 1,585,728 1,610,370 – –
Cost of sales 4 (781,811) (554,963) – –
Gross profit 803,917 1,055,407 – –
Other income 14,841 7,762 763,389 53,463
Other expenses 5 (525,389) (348,582) (27,762) (13,481)
Profit from operating activities 293,369 714,587 735,627 39,982
Net finance (costs)/income 6 (185,115) (129,595) 403 (1,187)
Profit before income tax 108,254 584,992 736,030 38,795
Income tax (expense)/benefit 7 (147,636) (231,774) 3,129 4,185
Net (loss)/profit after tax (39,382) 353,218 739,159 42,980
Other comprehensive income
Items that may be reclassified to profit or loss:
Foreign currency translation differences for foreign operations (4,218) (9,111) – –
Total comprehensive (loss)/income for the year (43,600) 344,107 739,159 42,980
CENTS CENTS
Basic (loss)/earnings per share 8 (2.59) 23 .84
Diluted (loss)/earnings per share 8 (2.59) 23 .77
The statements of comprehensive income should be read in conjunction with the accompanying notes .
For
per
sona
l use
onl
y
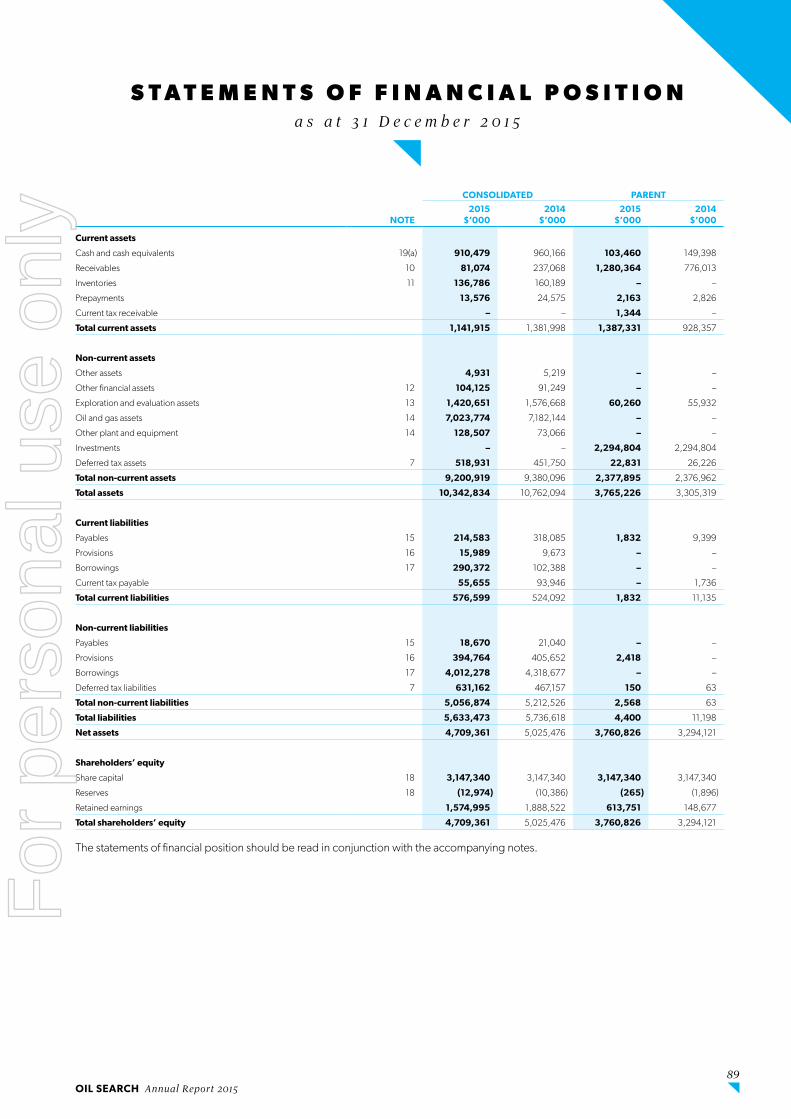
OIL SEARCH Annual Report 2015 89
S T A T E M E N T S O F F I N A N C I A L P O S I T I O N
a s a t 3 1 D e c e m b e r 2 0 1 5
NOTE
CONSOLIDATED PARENT
2015$’000
2014$’000
2015$’000
2014$’000
Current assets
Cash and cash equivalents 19(a) 910,479 960,166 103,460 149,398
Receivables 10 81,074 237,068 1,280,364 776,013
Inventories 11 136,786 160,189 – –
Prepayments 13,576 24,575 2,163 2,826
Current tax receivable – – 1,344 –
Total current assets 1,141,915 1,381,998 1,387,331 928,357
Non-current assets
Other assets 4,931 5,219 – –
Other financial assets 12 104,125 91,249 – –
Exploration and evaluation assets 13 1,420,651 1,576,668 60,260 55,932
Oil and gas assets 14 7,023,774 7,182,144 – –
Other plant and equipment 14 128,507 73,066 – –
Investments – – 2,294,804 2,294,804
Deferred tax assets 7 518,931 451,750 22,831 26,226
Total non-current assets 9,200,919 9,380,096 2,377,895 2,376,962
Total assets 10,342,834 10,762,094 3,765,226 3,305,319
Current liabilities
Payables 15 214,583 318,085 1,832 9,399
Provisions 16 15,989 9,673 – –
Borrowings 17 290,372 102,388 – –
Current tax payable 55,655 93,946 – 1,736
Total current liabilities 576,599 524,092 1,832 11,135
Non-current liabilities
Payables 15 18,670 21,040 – –
Provisions 16 394,764 405,652 2,418 –
Borrowings 17 4,012,278 4,318,677 – –
Deferred tax liabilities 7 631,162 467,157 150 63
Total non-current liabilities 5,056,874 5,212,526 2,568 63
Total liabilities 5,633,473 5,736,618 4,400 11,198
Net assets 4,709,361 5,025,476 3,760,826 3,294,121
Shareholders’ equity
Share capital 18 3,147,340 3,147,340 3,147,340 3,147,340
Reserves 18 (12,974) (10,386) (265) (1,896)
Retained earnings 1,574,995 1,888,522 613,751 148,677
Total shareholders’ equity 4,709,361 5,025,476 3,760,826 3,294,121
The statements of financial position should be read in conjunction with the accompanying notes .
For
per
sona
l use
onl
y

90
S T A T E M E N T S O F C A S H F L O W S
f o r t h e y e a r e n d e d 3 1 D e c e m b e r 2 0 1 5
NOTE
CONSOLIDATED PARENT
2015$’000
2014$’000
2015$’000
2014$’000
Cash flows from operating activities
Receipts from customers and third parties 1,683,489 1,592,809 – –
Payments to suppliers and employees (434,312) (383,279) (14,262) (1,714)
Interest received 4,006 1,275 835 291
Borrowing costs paid (170,215) (12,481) (297) (1,612)
Income tax (paid)/refund (85,392) (181,670) – 2,884
Payments for exploration and evaluation – seismic, G&A, G&G (32,809) (24,350) (695) (572)
Payments for site restoration (12,028) – – –
Net cash from/(used in) operating activities 19(b) 952,739 992,304 (14,419) (723)
Cash flows from investing activities
Payments for other plant and equipment (16,028) (12,499) – –
Payments for exploration and evaluation expenditure (248,287) (1,189,749) (3,424) (910,976)
Payments for development asset expenditure (141,591) (422,727) – –
Payments for producing asset expenditure (119,620) (101,897) – –
Loan to third party in respect of exploration and evaluation (10,121) (13,494) – –
Net cash used in investing activities (535,647) (1,740,366) (3,424) (910,976)
Cash flows from financing activities
Proceeds from private placement – 1,097,037 – 1,097,037
Proceeds from share purchase plan – 169,466 – 169,466
Proceeds from underwriter of dividend reinvestment plan (DRP) – 36,082 – 36,082
Dividend payments (net of DRP)(1) (274,085) (36,073) (274,085) (36,081)
Purchase of treasury shares (8,569) (14,954) (8,569) (14,954)
Contributions received for employee share schemes 1,887 16,398 – 16,398
Costs relating to share issues – (1,428) – (1,428)
Proceeds from borrowings 149,484 433,539 – –
Repayment of borrowings (333,046) (200,000) – –
Establishment fee on credit facility (1,500) (1,500) – –
Finance lease payments (950) – – –
Loans from/(to) related entities – – 254,559 (280,718)
Net cash (used in)/from financing activities (466,779) 1,498,567 (28,095) 985,802
Net (decrease)/increase in cash and cash equivalents (49,687) 750,505 (45,938) 74,103
Cash and cash equivalents at the beginning of the year 960,166 209,661 149,398 75,295
Cash and cash equivalents at the end of the year 19(a) 910,479 960,166 103,460 149,398
(1) Total dividend payments including cash and dividend reinvestment was $274 .1 million (2014: $60 .3 million) . Total dividend payments net of dividends reinvested under the dividend reinvestment plan were $274 .1 million (2014: $36 .1 million), refer to Note 9 .
The statements of cash flows should be read in conjunction with the accompanying notes .
For
per
sona
l use
onl
y

OIL SEARCH Annual Report 2015 91
S T A T E M E N T S O F C H A N G E S I N E Q U I T Y
f o r t h e y e a r e n d e d 3 1 D e c e m b e r 2 0 1 5
CONSOLIDATEDSHARE CAPITAL
$’000
FOREIGN CURRENCY
TRANSLATION RESERVE
$’000
RESERVE FOR TREASURY
SHARES$’000
EMPLOYEE EQUITY
COMPENSATION RESERVE
$’000
RETAINED EARNINGS
$’000TOTAL$’000
Balance at 1 January 2014 1,821,957 (5,412) (2,620) 11,506 1,595,621 3,421,052
Dividends provided for or paid – – – – (60,308) (60,308)
Total comprehensive income for the year
Net profit after tax for the year – – – – 353,218 353,218
Other comprehensive income:
Exchange differences on translation of foreign operations – (9,111) – – – (9,111)
Total comprehensive income for the year – (9,111) – – 353,218 344,107
Transactions with owners, recorded directly in equity
Shares issued through private placement 1,097,037 – – – – 1,097,037
Shares issued for the share purchase plan 169,466 – – – – 169,466
Issue of shares through underwritten dividend reinvestment plan 60,308 – – – – 60,308
Costs associated with share issues (1,428) – – – – (1,428)
Transfer of vested shares – – 9,007 (9,007) – –
Exercise of share options – – 468 – – 468
Employee share-based remuneration – – – 10,335 – 10,335
Purchase of treasury shares – – (14,954) – (14,954)
Net exchange differences – – – (598) – (598)
Trust distribution – – – – (9) (9)
Total transactions with owners 1,325,383 – (5,479) 730 (9) 1,320,625
Balance at 31 December 2014 3,147,340 (14,523) (8,099) 12,236 1,888,522 5,025,476
Balance at 1 January 2015 3,147,340 (14,523) (8,099) 12,236 1,888,522 5,025,476
Dividends provided for or paid – – – – (274,085) (274,085)
Total comprehensive income for the year
Net loss after tax for the year – – – – (39,382) (39,382)
Other comprehensive income:
Exchange differences on translation of foreign operations – (4,218) – – – (4,218)
Total comprehensive loss for the year – (4,218) – – (39,382) (43,600)
Transactions with owners, recorded directly in equity
Transfer of vested shares – – 11,277 (11,277) – –
Employee share-based remuneration – – – 10,199 – 10,199
Purchase of treasury shares – – (8,569) – – (8,569)
Net exchange differences – – – – – –
Trust distribution – – – – (60) (60)
Total transactions with owners – – 2,708 (1,078) (60) 1,570
Balance at 31 December 2015 3,147,340 (18,741) (5,391) 11,158 1,574,995 4,709,361
The statements of changes in equity should be read in conjunction with the accompanying notes .For
per
sona
l use
onl
y
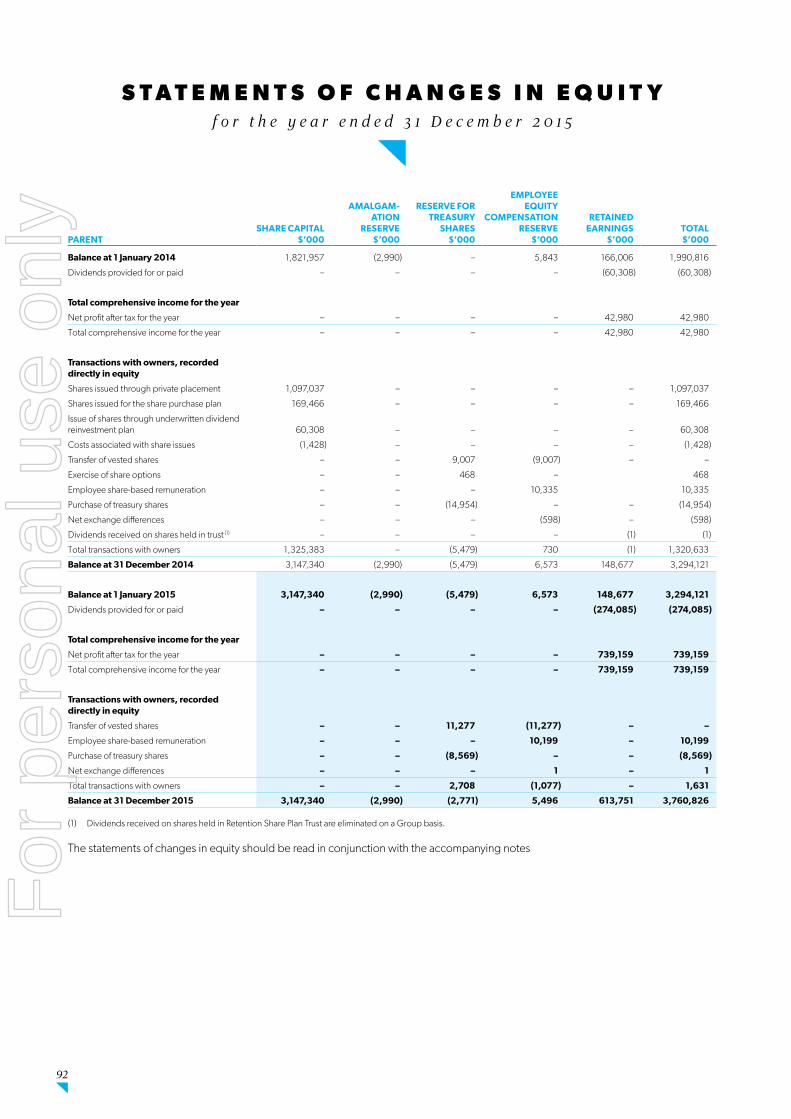
92
S T A T E M E N T S O F C H A N G E S I N E Q U I T Y
f o r t h e y e a r e n d e d 3 1 D e c e m b e r 2 0 1 5
PARENTSHARE CAPITAL
$’000
AMALGAM-ATION
RESERVE$’000
RESERVE FOR TREASURY
SHARES$’000
EMPLOYEE EQUITY
COMPENSATION RESERVE
$’000
RETAINED EARNINGS
$’000TOTAL$’000
Balance at 1 January 2014 1,821,957 (2,990) – 5,843 166,006 1,990,816
Dividends provided for or paid – – – – (60,308) (60,308)
Total comprehensive income for the year
Net profit after tax for the year – – – – 42,980 42,980
Total comprehensive income for the year – – – – 42,980 42,980
Transactions with owners, recorded directly in equity
Shares issued through private placement 1,097,037 – – – – 1,097,037
Shares issued for the share purchase plan 169,466 – – – – 169,466
Issue of shares through underwritten dividend reinvestment plan 60,308 – – – – 60,308
Costs associated with share issues (1,428) – – – – (1,428)
Transfer of vested shares – – 9,007 (9,007) – –
Exercise of share options – – 468 – 468
Employee share-based remuneration – – – 10,335 10,335
Purchase of treasury shares – – (14,954) – – (14,954)
Net exchange differences – – – (598) – (598)
Dividends received on shares held in trust (1) – – – – (1) (1)
Total transactions with owners 1,325,383 – (5,479) 730 (1) 1,320,633
Balance at 31 December 2014 3,147,340 (2,990) (5,479) 6,573 148,677 3,294,121
Balance at 1 January 2015 3,147,340 (2,990) (5,479) 6,573 148,677 3,294,121
Dividends provided for or paid – – – – (274,085) (274,085)
Total comprehensive income for the year
Net profit after tax for the year – – – – 739,159 739,159
Total comprehensive income for the year – – – – 739,159 739,159
Transactions with owners, recorded directly in equity
Transfer of vested shares – – 11,277 (11,277) – –
Employee share-based remuneration – – – 10,199 – 10,199
Purchase of treasury shares – – (8,569) – – (8,569)
Net exchange differences – – – 1 – 1
Total transactions with owners – – 2,708 (1,077) – 1,631
Balance at 31 December 2015 3,147,340 (2,990) (2,771) 5,496 613,751 3,760,826
(1) Dividends received on shares held in Retention Share Plan Trust are eliminated on a Group basis .
The statements of changes in equity should be read in conjunction with the accompanying notes
For
per
sona
l use
onl
y

OIL SEARCH Annual Report 2015 93
2015N O T E S T O T H E F I N A N C I A L S T A T E M E N T S
1 SIGNIFICANT ACCOUNTING POLICIESOil Search Limited (the ‘parent entity’ or ‘company’) is incorporated in Papua New Guinea (PNG) . The consolidated financial report for the year ended 31 December 2015 comprises the parent entity and its controlled entities (together, ‘the Group’) .
The financial statements were authorised for issue by the Board of Directors on 22 February 2016 .
(a) Basis of preparationThe financial statements have been prepared in accordance with International Financial Reporting Standards (IFRS), International Financial Reporting Interpretations Committee (“IFRIC”) interpretations and the PNG Companies Act 1997 . The financial statements have been prepared under the historical cost convention .
(i) Issued standards adopted during yearNone of the new standards and amendments to standards that are mandatory for the first time for the financial year beginning 1 January 2015 affected any of the amounts recognised in the current period or any prior period and are not likely to affect future periods .
(ii) New accounting standards not yet effectiveThe following new accounting standards are not yet effective but may have an impact on the Group in the financial years commencing 1 January 2016 or later:
IFRS 9 Financial Instruments
IFRS 15 Revenue from Contracts with Customers
Amendments to IFRS 11 Accounting for Acquisition of Interests in Joint Operations
The Group is in the process of determining the potential impact of adopting the above standards and they have not been applied in the preparation of these financial statements .
(b) Principles of consolidationThe consolidated financial statements comprise the financial statements of Oil Search Limited and its controlled subsidiaries, after elimination of all inter-company transactions .
(i) Business combinationsThe Group accounts for business combinations using the acquisition method when control is transferred to the Group . The consideration transferred in the acquisition is generally measured at fair value, as are the identifiable net assets acquired . Any goodwill that arises is tested annually for impairment . Any gain on a bargain purchase is recognised in profit or loss immediately . Transaction costs are expensed as incurred, except if related to the issue of debt or equity securities .
The consideration transferred does not include amounts related to the settlement of pre-existing relationships . Such amounts are generally recognised in profit or loss .
Any contingent consideration payable is measured at fair value at the acquisition date . If the contingent consideration is classified as equity, then it is not remeasured and settlement is accounted for within equity . Otherwise, subsequent changes in the fair value of the contingent consideration are recognised in profit or loss .
(ii) SubsidiariesSubsidiaries are entities controlled by the Group . The Group controls an entity when it is exposed to, or has rights to, variable returns from its involvement with the entity and has the ability to affect those returns through its power over the entity . The financial statements of subsidiaries are included in the consolidated financial statements from the date on which control commences until the date on which control ceases . The financial statements of subsidiaries are prepared for the same reporting period as the parent entity, using consistent accounting policies .
(iii) Joint arrangementsExploration, development and production activities of the Group are primarily carried on through joint arrangements with other parties . Joint arrangements are classified as either joint operations or joint ventures depending on the contractual rights and obligations each investor has, rather than the legal structure of the joint arrangement . The Group has assessed the nature of its joint arrangements and determined that they comprise investments in joint operations .
Joint operationsThe Group has accounted for its direct rights and obligations by recognising its share of jointly held assets, liabilities, revenues and expenses of each joint operation . These have been incorporated in the financial statements under the appropriate headings . Details of the joint operations are set out in note 25 .
(c) Currency translation
(i) Functional and presentation currencyItems included in the financial statements of each of the Group’s entities are measured using the currency of the primary economic environment in which the entity operates (‘the functional currency’) . The consolidated and parent financial statements are presented in United States dollars, which is Oil Search Limited’s functional and presentation currency .
(ii) Transactions and balancesForeign currency transactions are translated into the functional currency using the exchange rates prevailing at the dates of the transactions . Foreign exchange gains and losses resulting from the settlement of such transactions and from the translation at year end exchange rates of monetary assets and liabilities denominated in foreign currencies are recognised in profit or loss, except when they are deferred in equity as qualifying cash flow hedges and qualifying net investment hedges or are attributable to part of the net investment in a foreign operation .
Foreign exchange gains and losses that relate to borrowings are presented in the statement of comprehensive income, within finance costs . All other foreign exchange gains and losses are presented in the statement of comprehensive income on a net basis within other expenses .
(iii) Group companiesThe results and financial position of foreign operations (none of which has the currency of a hyperinflationary economy) that have a functional currency different from the presentation currency are translated into the presentation currency as follows:
assets and liabilities for each statement of financial position presented are translated at the closing rate at the date of that statement of financial position;
For
per
sona
l use
onl
y

94
N O T E S T O T H E F I N A N C I A L S T A T E M E N T S2015
income and expenses for each statement of comprehensive income are translated at average exchange rates (unless this is not a reasonable approximation of the cumulative effect of the rates prevailing on the transaction dates, in which case income and expenses are translated at the dates of the transactions); and
all resulting exchange differences are recognised in other comprehensive income .
(d) Revenue recognitionRevenue is recognised when the significant risks and rewards of ownership have been transferred to the customer, recovery of the consideration is probable, the associated costs and possible return of goods can be estimated reliably, there is no continuing management involvement with the goods, and the amount of revenue can be measured reliably . Revenue for the Group’s main products are recognised as follows:
Liquefied natural gas Liquefied natural gas sales are recognised when ownership is transferred to the buyer when product is placed onboard a vessel or offloaded from the vessel, depending on the contractually agreed terms .
Oil and condensateCrude oil and condensate sales are recognised after each vessel is loaded .
GasGas sales are recognised after production upon delivery into the sales pipeline .
Dividend incomeDividend revenue from controlled entities is recognised as the dividends are declared, and from other parties as the dividends are received or receivable .
(e) Borrowing costsBorrowing costs directly attributable to the acquisition, construction or production of qualifying assets, which are assets that necessarily take a substantial period of time to get ready for their intended use or sale, are added to the cost of those assets, until such time as the assets are substantially ready for their intended use or sale . The capitalisation rate used to determine the amount of borrowing costs to be capitalised is the weighted average interest rate applicable to the borrower’s outstanding borrowings during the year used to develop the qualifying asset .
All other borrowing costs are recognised in the statement of comprehensive income in the period in which they are incurred .
(f) Share-based remunerationThe fair value at grant date of equity-settled, share-based compensation plans are charged to the statement of comprehensive income over the period for which the benefits of employee services are to be derived . The corresponding accrued employee entitlement is recorded in the employee equity compensation reserve . The fair value of the awards is calculated using an option pricing model which considers a number of factors . Where awards are forfeited because non-market vesting conditions are not satisfied, the expense previously recognised is proportionately reversed . At each statement of financial position date, the entity revises its estimates of the number of awards that are expected to vest . It recognises the impact of the revision of original estimates, if any, in the statement of comprehensive income, and a corresponding adjustment to equity over the remaining vesting period .
Where shares in Oil Search Limited are acquired by on-market purchases prior to settling vested entitlements, the cost of the acquired shares is carried as treasury shares and deducted from equity . No gain or loss is recognised in the statement of comprehensive income on the purchase, sale, issue or cancellation of the Group’s own equity instruments .
(g) Income taxThe current tax payable or receivable is based on taxable profit for the year . Taxable profit differs from net profit as reported in the statement of comprehensive income because it excludes items of income or expense that are taxable or deductible in other years and it further excludes items that are never taxable or deductible . The Group’s liability or asset for current tax is calculated using tax rates that have been enacted or substantively enacted at the reporting date .
Deferred tax is accounted for using the balance sheet liability method . Temporary differences are differences between the tax base of an asset or liability and its carrying amount in the statement of financial position . The tax base of an asset or liability is the amount attributed to that asset or liability for tax purposes .
In principle, deferred tax liabilities are recognised for all taxable temporary differences . Deferred tax assets are recognised to the extent that it is probable that sufficient taxable amounts will be available against which deductible temporary differences or unused tax losses and tax offsets can be utilised . However, deferred tax assets and liabilities are not recognised if the temporary differences giving rise to them arise from initial recognition of assets and liabilities (other than as a result of a business combination) which affects neither taxable income nor accounting profit . Furthermore, a deferred tax liability is not recognised in relation to taxable temporary differences arising from the initial recognition of goodwill .
The carrying amount of deferred tax assets is reviewed at each statement of financial position date and reduced to the extent that it is no longer probable that sufficient taxable profit will be available to allow all or part of the deferred tax asset to be utilised .
Deferred tax assets and liabilities are measured at the tax rates that are expected to apply to the period when the asset is realised or the liability is settled, based on tax rates (and tax laws) that have been enacted or substantively enacted at the statement of financial position date . Deferred tax is charged or credited in the statement of comprehensive income, except when it relates to items charged or credited directly to equity, in which case the deferred tax is also dealt with in equity .
Tax benefits transferred between Group companies are transferred under normal commercial arrangements, with consideration paid equal to the tax benefit of the transfer .
(h) InventoriesInventories are valued at the lower of cost or net realisable value . Cost is determined as follows:
materials, which include drilling and maintenance stocks, are valued at the cost of acquisition; and
petroleum products, comprising extracted crude oil and condensate, LNG and refined products stored in tanks, pipeline systems and aboard vessels are valued using the full absorption cost method .
1 SIGNIFICANT ACCOUNTING POLICIES (CONTINUED)
For
per
sona
l use
onl
y

OIL SEARCH Annual Report 2015 95
2015N O T E S T O T H E F I N A N C I A L S T A T E M E N T S
(i) Exploration and evaluation assetsExploration and evaluation expenditures are accounted for under the successful efforts method .
Exploration licence acquisition costs are initially capitalised . For exploration and appraisal wells, costs directly associated with drilling and evaluating the wells are initially capitalised pending an assessment of whether economically recoverable hydrocarbons have been discovered or whether expenditures are expected to be recouped by sale . All other exploration and evaluation costs are expensed as incurred .
Capitalised exploration costs are reviewed at each reporting date to determine whether there is an indication of impairment, generally on a licence-by-licence basis . Impairment indicators include:
the exploration licence has expired and is not expected to be renewed;
exploration and appraisal activities have not led to the discovery of economically recoverable reserves and no further activity on the licence is planned;
sufficient information exists to indicate that the carrying amount of the exploration and evaluation asset is unlikely to be recovered in full from successful development or by sale .
Where such indicators exist, an impairment test is performed – see accounting policy (m) .
When an oil or gas field has been approved for development, the accumulated exploration and evaluation costs are transferred to Oil and Gas Assets – Assets in Development .
Where an ownership interest in an exploration and evaluation asset is exchanged for another, the transaction is recognised by reference to the carrying value of the original interest . Any cash consideration paid, including transaction costs, is accounted for as an acquisition of exploration and evaluation assets . Any cash consideration received, net of transaction costs, is treated as a recoupment of costs previously capitalised, with any excess accounted for as a gain on disposal of non-current assets .
(j) Oil and gas assets
Assets in developmentWhen the technical and commercial feasibility of an undeveloped oil or gas field has been demonstrated and approval of commercial development occurs, the field enters its development phase . The costs of oil and gas assets in development are separately accounted for and include past exploration and evaluation costs, development drilling and other subsurface expenditure, surface plant and equipment and any associated land and buildings . When the committed development expenditure programs are completed and production commences, these costs are subject to amortisation .
Producing assetsThe costs of oil and gas assets in production include past exploration and evaluation costs, past development costs and the ongoing costs of continuing to develop reserves for production and to expand, replace, acquire or improve plant and equipment and any associated land and buildings . These costs are subject to amortisation .
Amortisation of oil and gas assetsAmortisation is calculated using the units of production method for an asset or group of assets from the date of commencement of production . Depletion charges are calculated using the units of production method over the life of the estimated Developed, Proven plus Probable (“2P”) reserves for an asset or group of assets .
Restoration costsSite restoration costs are capitalised within the cost of the associated assets and the provision is stated in the statement of financial position at total estimated present value . These costs are based on judgements and assumptions regarding removal dates, technologies, and industry practice . Over time, the liability is increased for the change in the present value based on a risk adjusted pre-tax discount rate appropriate to the risks inherent in the liability . The costs of restoration are brought to account in the statement of comprehensive income through depreciation of the associated assets over the economic life of the projects with which these costs are associated . The unwinding of the discount is recorded as an accretion charge within finance costs .
(k) Other plant and equipmentPlant and equipment are carried at cost less accumulated depreciation and impairment . Any gain or loss on the disposal of assets is determined as the difference between the carrying value of the asset at the time of disposal and the proceeds from disposal, and is included in the results of the Group in the year of disposal .
DepreciationDepreciation on plant and equipment is calculated on a straight-line basis so as to generally write-off the cost of each fixed asset over its estimated useful life on the following basis:
Marine 4% Corporate plant and equipment 20% – 33% Rigs Drilling days based on a 10 year drilling life
(l) Leases
(i) Leased assetsAssets held by the Group under leases that transfer to the Group substantially all the risks and rewards of ownership are classified as finance leases . The leased asset is measured initially at an amount equal to the lower of its fair value and the present value of the minimum lease payments . Subsequent to initial recognition, the assets are accounted for in accordance with the accounting policy applicable to that asset . Assets held under other leases are classified as operating leases and are not recognised in the Group’s statement of financial position .
(ii) Lease paymentsPayments made under operating leases are recognised in profit or loss on a straight-line basis over the term of the lease . Lease incentives received are recognised as an integral part of the total lease expense, over the term of the lease .
Minimum lease payments made under finance leases are apportioned between the finance expense and the reduction of the outstanding liability . The finance expense is allocated to each period during the lease term so as to produce a constant periodic rate of interest on the remaining balance of the liability .
1 SIGNIFICANT ACCOUNTING POLICIES (CONTINUED)
For
per
sona
l use
onl
y

96
N O T E S T O T H E F I N A N C I A L S T A T E M E N T S2015
(m) Impairment of assetsThe carrying amounts of all assets, other than inventory, certain financial assets and deferred tax assets, are reviewed at each reporting date to determine whether there is an indication of impairment . Where such an indication exists, an estimate of the recoverable amount is made .
For any asset that does not generate largely independent cash flows, the recoverable amount is determined for the cash generating unit (CGU) to which the asset belongs .
Expected future cash flows are the basis for impairment assessment, however, market values are also referenced where appropriate .
An impairment loss is recognised in the statement of comprehensive income when the carrying amount of an asset or its CGU exceeds its recoverable amount . Where an impairment loss subsequently reverses, the carrying amount of the asset (or CGU) is increased to the revised estimate of its recoverable amount, but only to the extent that the asset’s carrying amount does not exceed the carrying amount that would have been determined, net of depreciation or amortisation, if no impairment loss had been recognised .
(n) Employee benefitsProvision is made for long service leave and annual leave estimated to be payable to employees on the basis of statutory and contractual requirements . The liability for long service leave and annual leave which is not expected to be settled within 12 months after the end of the period in which the employees render the related service is recognised in the provision for employee entitlements and measured as the present value of expected future payments to be made in respect of services provided by employees up to the end of the reporting period . Expected future payments are discounted using market yields at the end of the reporting period on government bonds with terms and currencies that match, as closely as possible, the estimated future cash outflows .
The obligations are presented as current liabilities in the statement of financial position if the entity does not have an unconditional right to defer settlement for at least twelve months after the reporting date, regardless of when the actual settlement is expected to occur .
(o) Investments and other financial assets
(i) InvestmentsInvestments in subsidiaries are accounted for at cost in the parent entity financial statements .
(ii) Other financial assetsAll other financial assets are initially recognised at the fair value of consideration paid . Subsequently, all financial assets are carried at amortised cost less impairment . Financial assets are assessed for indicators of impairment at each reporting date . Financial assets are impaired where there is objective evidence that as a result of one or more events that occurred after the initial recognition of the financial asset the estimated future cash flows of the investment have been impacted .
In assessing collective impairment, the Group uses historical information on the timing of recoveries and the amount of loss incurred, and makes an adjustment if current economic and credit conditions are such that the actual losses are likely to be greater or lesser than suggested by historical trends .
An impairment loss is calculated as the difference between an asset’s carrying amount and the present value of the estimated future cash flows discounted at the asset’s original effective interest rate .
Impairment losses are recognised in profit or loss . If the amount of impairment loss subsequently decreases and the decrease can be related objectively to an event occurring after the impairment was recognised, then the previously recognised impairment loss is reversed through profit or loss .
(p) Borrowings Borrowings are initially recognised at fair value, net of transaction costs incurred . Borrowings are subsequently measured at amortised cost . Any difference between the proceeds (net of transaction costs) and the redemption amount is recognised in profit or loss over the period of the borrowings using the effective interest method . Fees paid on the establishment of loan facilities are recognised as transaction costs of the loan to the extent that it is probable that some or all of the facility will be drawn down . In this case, the fee is deferred until the draw down occurs . To the extent there is no evidence that it is probable that some or all of the facility will be drawn down, the fee is capitalised as a prepayment for liquidity services and amortised over the period of the facility to which it relates .
Borrowings are removed from the statement of financial position when the obligation specified in the contract is discharged, cancelled or expired .
Borrowings are classified as current liabilities unless the Group has an unconditional right to defer settlement of the liability for at least 12 months after the reporting period .
(q) Critical accounting estimates and assumptions In applying the Group’s accounting policies, management regularly evaluates judgements, estimates and assumptions based on experience and other factors, including expectations of future events that may have an impact on the Group . All judgements, estimates and assumptions made are believed to be reasonable based on the most current set of circumstances available to management . Actual results may differ from those judgements, estimates and assumptions . Significant judgements, estimates and assumptions made by management in the preparation of these financial statements are outlined below .
Impairment of assetsThe Group assesses whether oil and gas assets are impaired on a semi-annual basis . This requires review of the indicators of impairment and/or an estimation of the recoverable amount of the cash-generating unit to which the assets belong . For oil and gas properties, expected future cash flow estimation is based on reserves, future production profiles, commodity prices and costs . Market values are also referenced where appropriate . The carrying value of oil and gas properties, exploration and evaluation and other plant and equipment is disclosed in notes 13 to 14 .
Restoration obligationsThe Group estimates the future removal and restoration costs of oil and gas production facilities, wells, pipelines and related assets at the time of installation of the assets . In most instances the removal of these assets will occur many years in the future . The estimate of future removal costs are made considering relevant legislation and industry practice and require management to make judgments regarding the removal date, the extent of restoration activities required and future removal technologies . For more detail regarding the policy in respect of provision for restoration refer to note 1(j) .
The carrying amount of the provision for restoration is disclosed in note 16 .
1 SIGNIFICANT ACCOUNTING POLICIES (CONTINUED)
For
per
sona
l use
onl
y
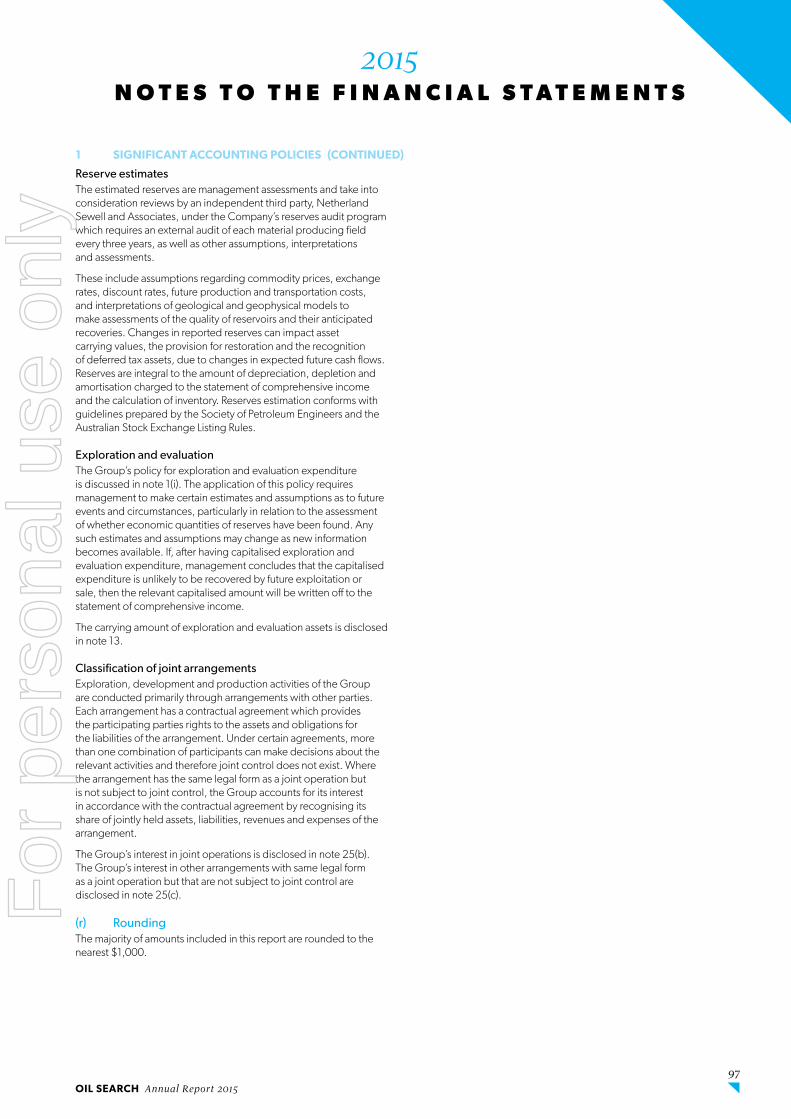
OIL SEARCH Annual Report 2015 97
N O T E S T O T H E F I N A N C I A L S T A T E M E N T S2015
Reserve estimatesThe estimated reserves are management assessments and take into consideration reviews by an independent third party, Netherland Sewell and Associates, under the Company’s reserves audit program which requires an external audit of each material producing field every three years, as well as other assumptions, interpretations and assessments .
These include assumptions regarding commodity prices, exchange rates, discount rates, future production and transportation costs, and interpretations of geological and geophysical models to make assessments of the quality of reservoirs and their anticipated recoveries . Changes in reported reserves can impact asset carrying values, the provision for restoration and the recognition of deferred tax assets, due to changes in expected future cash flows . Reserves are integral to the amount of depreciation, depletion and amortisation charged to the statement of comprehensive income and the calculation of inventory . Reserves estimation conforms with guidelines prepared by the Society of Petroleum Engineers and the Australian Stock Exchange Listing Rules .
Exploration and evaluationThe Group’s policy for exploration and evaluation expenditure is discussed in note 1(i) . The application of this policy requires management to make certain estimates and assumptions as to future events and circumstances, particularly in relation to the assessment of whether economic quantities of reserves have been found . Any such estimates and assumptions may change as new information becomes available . If, after having capitalised exploration and evaluation expenditure, management concludes that the capitalised expenditure is unlikely to be recovered by future exploitation or sale, then the relevant capitalised amount will be written off to the statement of comprehensive income .
The carrying amount of exploration and evaluation assets is disclosed in note 13 .
Classification of joint arrangementsExploration, development and production activities of the Group are conducted primarily through arrangements with other parties . Each arrangement has a contractual agreement which provides the participating parties rights to the assets and obligations for the liabilities of the arrangement . Under certain agreements, more than one combination of participants can make decisions about the relevant activities and therefore joint control does not exist . Where the arrangement has the same legal form as a joint operation but is not subject to joint control, the Group accounts for its interest in accordance with the contractual agreement by recognising its share of jointly held assets, liabilities, revenues and expenses of the arrangement .
The Group’s interest in joint operations is disclosed in note 25(b) . The Group’s interest in other arrangements with same legal form as a joint operation but that are not subject to joint control are disclosed in note 25(c) .
(r) RoundingThe majority of amounts included in this report are rounded to the nearest $1,000 .
1 SIGNIFICANT ACCOUNTING POLICIES (CONTINUED)
For
per
sona
l use
onl
y
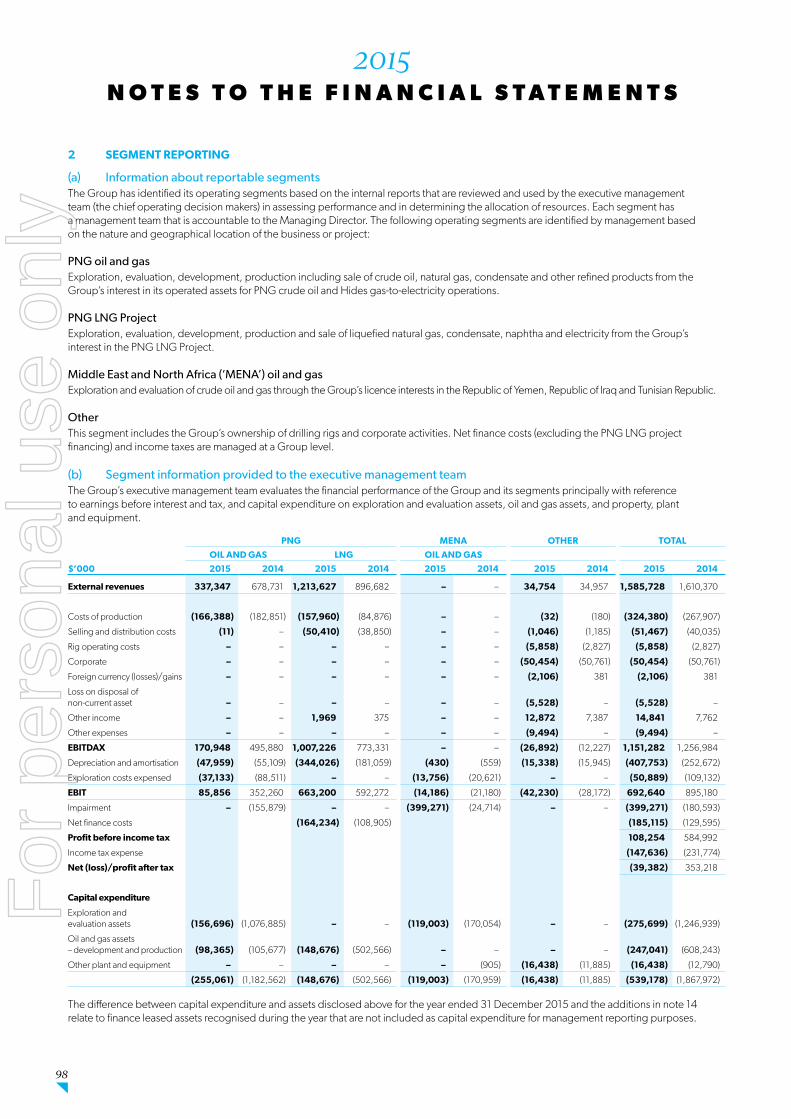
98
N O T E S T O T H E F I N A N C I A L S T A T E M E N T S2015
2 SEGMENT REPORTING
(a) Information about reportable segmentsThe Group has identified its operating segments based on the internal reports that are reviewed and used by the executive management team (the chief operating decision makers) in assessing performance and in determining the allocation of resources . Each segment has a management team that is accountable to the Managing Director . The following operating segments are identified by management based on the nature and geographical location of the business or project:
PNG oil and gasExploration, evaluation, development, production including sale of crude oil, natural gas, condensate and other refined products from the Group’s interest in its operated assets for PNG crude oil and Hides gas-to-electricity operations .
PNG LNG ProjectExploration, evaluation, development, production and sale of liquefied natural gas, condensate, naphtha and electricity from the Group’s interest in the PNG LNG Project .
Middle East and North Africa (‘MENA’) oil and gasExploration and evaluation of crude oil and gas through the Group’s licence interests in the Republic of Yemen, Republic of Iraq and Tunisian Republic .
OtherThis segment includes the Group’s ownership of drilling rigs and corporate activities . Net finance costs (excluding the PNG LNG project financing) and income taxes are managed at a Group level .
(b) Segment information provided to the executive management teamThe Group’s executive management team evaluates the financial performance of the Group and its segments principally with reference to earnings before interest and tax, and capital expenditure on exploration and evaluation assets, oil and gas assets, and property, plant and equipment .
$’000
PNG MENA OTHER TOTAL
OIL AND GAS LNG OIL AND GAS
2015 2014 2015 2014 2015 2014 2015 2014 2015 2014
External revenues 337,347 678,731 1,213,627 896,682 – – 34,754 34,957 1,585,728 1,610,370
Costs of production (166,388) (182,851) (157,960) (84,876) – – (32) (180) (324,380) (267,907)
Selling and distribution costs (11) – (50,410) (38,850) – – (1,046) (1,185) (51,467) (40,035)
Rig operating costs – – – – – – (5,858) (2,827) (5,858) (2,827)
Corporate – – – – – – (50,454) (50,761) (50,454) (50,761)
Foreign currency (losses)/gains – – – – – – (2,106) 381 (2,106) 381
Loss on disposal of non-current asset – – – – – – (5,528) – (5,528) –
Other income – – 1,969 375 – – 12,872 7,387 14,841 7,762
Other expenses – – – – – – (9,494) – (9,494) –
EBITDAX 170,948 495,880 1,007,226 773,331 – – (26,892) (12,227) 1,151,282 1,256,984
Depreciation and amortisation (47,959) (55,109) (344,026) (181,059) (430) (559) (15,338) (15,945) (407,753) (252,672)
Exploration costs expensed (37,133) (88,511) – – (13,756) (20,621) – – (50,889) (109,132)
EBIT 85,856 352,260 663,200 592,272 (14,186) (21,180) (42,230) (28,172) 692,640 895,180
Impairment – (155,879) – – (399,271) (24,714) – – (399,271) (180,593)
Net finance costs (164,234) (108,905) (185,115) (129,595)
Profit before income tax 108,254 584,992
Income tax expense (147,636) (231,774)
Net (loss)/profit after tax (39,382) 353,218
Capital expenditure
Exploration and evaluation assets (156,696) (1,076,885) – – (119,003) (170,054) – – (275,699) (1,246,939)
Oil and gas assets – development and production (98,365) (105,677) (148,676) (502,566) – – – – (247,041) (608,243)
Other plant and equipment – – – – – (905) (16,438) (11,885) (16,438) (12,790)
(255,061) (1,182,562) (148,676) (502,566) (119,003) (170,959) (16,438) (11,885) (539,178) (1,867,972)
The difference between capital expenditure and assets disclosed above for the year ended 31 December 2015 and the additions in note 14 relate to finance leased assets recognised during the year that are not included as capital expenditure for management reporting purposes .
For
per
sona
l use
onl
y

OIL SEARCH Annual Report 2015 99
N O T E S T O T H E F I N A N C I A L S T A T E M E N T S2015
Geographical segmentsThe Oil Search Group operates primarily in Papua New Guinea, but also has activities in Republic of Yemen, Republic of Iraq, Tunisian Republic and Australia .
Production from the designated segments is sold on commodity markets and may be sold to other geographical segments .
In presenting information on the basis of geographical segments, segment revenue and segment assets are based on the location of operating activity .
REVENUE NON-CURRENT ASSETS(1)
2015$’000
2014$’000
2015$’000
2014$’000
PNG 1,585,728 1,610,370 8,560,564 8,523,379
Australia – – 17,262 23,869
MENA – – 104,162 381,098
Total 1,585,728 1,610,370 8,681,988 8,928,346
(1) Non-current assets exclude deferred tax of $518 .9 million (2014: $451 .8 million) .
Major customersThere are four customers with revenue exceeding 10% of the Group’s total sales revenue . Each of these customers are in the PNG LNG segment .
Revenue from one customer represents approximately $374 .9 million or 24% of the Group’s total revenue (2014: $373 .3 million, 51%) .
Revenue from one other customer represents approximately $228 .0 million or 14% of the Group’s total revenue (2014: $33 .3 million, 5%) .
Revenue from one other customer represents approximately $207 .0 million or 13% of the Group’s total revenue (2014: nil) .
Revenue from one other customer represents approximately $184 .4 million or 12% of the Group’s total revenue (2014: $198 .8 million, 27%) .
3 REVENUE
CONSOLIDATED PARENT
2015$’000
2014$’000
2015$’000
2014$’000
Liquefied natural gas sales 1,043,469 729,343 – –
Oil and condensate sales 429,543 737,134 – –
Gas sales 44,802 79,221 – –
Other revenue 67,914 64,672 – –
Total revenue 1,585,728 1,610,370 – –
4 COST OF SALES
CONSOLIDATED PARENT
2015$’000
2014$’000
2015$’000
2014$’000
Costs of production:
Production costs (294,818) (235,380) – –
Royalties and levies (12,376) (19,722) – –
Gas purchases (20,924) (39,259) – –
Inventory movements 3,738 26,454 – –
(324,380) (267,907) – –
Selling and distribution costs (51,467) (40,035) – –
Rig operating costs (5,858) (2,827) – –
Depreciation and amortisation
Oil and gas assets (388,355) (236,168) – –
Marine assets (3,630) (350) – –
Rig assets (8,121) (7,676) – –
Total cost of sales (781,811) (554,963) – –
2 SEGMENT REPORTING (CONTINUED)
For
per
sona
l use
onl
y

100
N O T E S T O T H E F I N A N C I A L S T A T E M E N T S2015
5 OTHER EXPENSES
CONSOLIDATED PARENT
2015$’000
2014$’000
2015$’000
2014$’000
Corporate(1) (50,454) (50,761) (10,752) (12,854)
Exploration costs expensed (50,889) (109,132) (906) (826)
Impairment (399,271) (180,593) – –
Depreciation (7,647) (8,477) – –
Loss on disposal of non-current assets (5,528) – – –
Other expenses (9,494) – (14,309) –
Foreign currency (loss)/gain (2,106) 381 (1,795) 199
Total other expenses (525,389) (348,582) (27,762) (13,481)
(1) Includes business development costs of $10 .7 million (2014: $13 .3 million) on a consolidated basis .
6 NET FINANCE COSTS
CONSOLIDATED PARENT
2015$’000
2014$’000
2015$’000
2014$’000
Interest income 6,808 3,723 699 426
Borrowing costs (181,620) (123,377) (296) (1,613)
Unwinding of discount on site restoration (10,303) (9,941) – –
Net finance (costs)/income (185,115) (129,595) 403 (1,187)
7 INCOME TAX
CONSOLIDATED PARENT
2015$’000
2014$’000
2015$’000
2014$’000
The major components of tax expenses are:
Current tax expense (28,328) (155,345) – –
Adjustments for current tax of prior periods 14,250 23,554 2,798 57
Deferred tax (expense)/income (133,558) (99,983) 331 4,128
Income tax (expense)/benefit (147,636) (231,774) 3,129 4,185
Reconciliation of income tax expense to prima facie tax payable:
Profit before tax 108,254 584,992 736,030 38,795
Tax at PNG rate for gas and non-oil (30%) (32,477) (175,501) (220,809) (11,639)
Restatement of deferred tax balances 11,953 (48,926) – –
Effect of differing tax rates across tax regimes (4,503) (13,630) – –
(25,027) (238,057) (220,809) (11,639)
Tax effect of items not tax deductible or assessable:
Over provisions in prior periods 14,250 23,554 2,798 57
Non-deductible expenditure (140,456) (23,747) (7,877) (4,578)
Non-assessable income 4,017 2,170 4,017 2,170
Reinstatement deferred tax assets – 4,306 – 4,306
Exempt dividends 15 – 225,000 13,869
Other (435) – – –
Income tax (expense)/benefit (147,636) (231,774) 3,129 4,185
For
per
sona
l use
onl
y

OIL SEARCH Annual Report 2015 101
N O T E S T O T H E F I N A N C I A L S T A T E M E N T S2015
7 INCOME TAX (CONTINUED)
CONSOLIDATED PARENT
2015$’000
2014$’000
2015$’000
2014$’000
Deferred tax (expense)/income recognised in net (loss)/profit for each type of temporary difference:
Exploration, development and production (139,791) (154,391) (442) 4,549
Other assets 2,419 2,294 – –
Provisions and accruals (6,893) 53,260 726 (190)
Other items 539 (318) 63 (167)
Tax losses 10,168 (828) (16) (64)
Deferred tax (expense)/income (133,558) (99,983) 331 4,128
Deferred tax assets
Temporary differences:
Exploration, development and production 248,406 262,395 22,105 26,226
Other assets – 3,357 – –
Provisions 149,270 141,419 726 –
Tax losses recognised 8,786 9,731 – –
Tax credits 112,469 34,848 – –
518,931 451,750 22,831 26,226
Deferred tax liabilities
Temporary differences:
Exploration, development and production 619,155 455,631 – –
Prepayments and receivables 11,119 11,033 150 63
Other assets 888 493 – –
631,162 467,157 150 63
8 EARNINGS PER SHARE
CONSOLIDATED
2015 CENTS
2014 CENTS
Basic (loss)/earnings per share (2.59) 23 .84
Diluted (loss)/earnings per share (2.59) 23 .77
NO. NO.
Weighted average number of ordinary shares used for the purposes of calculating diluted earnings per share reconciles to the number used to calculate basic earnings per share as follows:
Basic earnings per share 1,522,692,587 1,481,502,290
Employee share appreciation rights and share rights – 540,762
Employee performance rights – 3,815,607
Diluted earnings per share 1,522,692,587 1,485,858,659
Basic earnings and diluted earnings per share have been calculated on a net loss after tax of $39 .4 million (2014: net profit of $353 .2 million) . There are nil share appreciation rights and share rights (2014: 1,968,748), and nil performance rights (2014: 4,070,768) which are dilutive potential ordinary shares and are therefore included in the weighted average number of shares for the calculation of diluted earnings per share . In 2014, the Restricted Share Plan Trust held 34,003 Oil Search Limited shares that may be used to settle dilutive potential ordinary shares which were taken into account in the calculation of diluted earnings per share .
For
per
sona
l use
onl
y
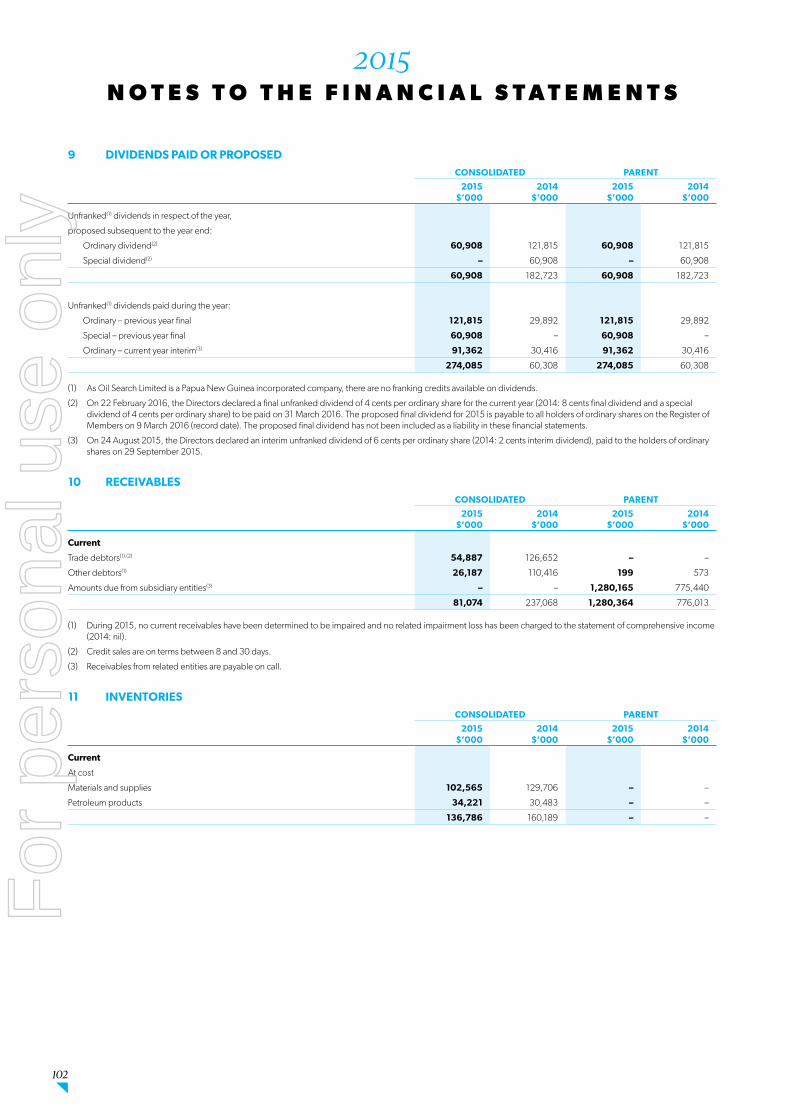
102
N O T E S T O T H E F I N A N C I A L S T A T E M E N T S2015
9 DIVIDENDS PAID OR PROPOSED
CONSOLIDATED PARENT
2015$’000
2014$’000
2015$’000
2014$’000
Unfranked(1) dividends in respect of the year,
proposed subsequent to the year end:
Ordinary dividend(2) 60,908 121,815 60,908 121,815
Special dividend(2) – 60,908 – 60,908
60,908 182,723 60,908 182,723
Unfranked(1) dividends paid during the year:
Ordinary – previous year final 121,815 29,892 121,815 29,892
Special – previous year final 60,908 – 60,908 –
Ordinary – current year interim(3) 91,362 30,416 91,362 30,416
274,085 60,308 274,085 60,308
(1) As Oil Search Limited is a Papua New Guinea incorporated company, there are no franking credits available on dividends .
(2) On 22 February 2016, the Directors declared a final unfranked dividend of 4 cents per ordinary share for the current year (2014: 8 cents final dividend and a special dividend of 4 cents per ordinary share) to be paid on 31 March 2016 . The proposed final dividend for 2015 is payable to all holders of ordinary shares on the Register of Members on 9 March 2016 (record date) . The proposed final dividend has not been included as a liability in these financial statements .
(3) On 24 August 2015, the Directors declared an interim unfranked dividend of 6 cents per ordinary share (2014: 2 cents interim dividend), paid to the holders of ordinary shares on 29 September 2015 .
10 RECEIVABLES
CONSOLIDATED PARENT
2015$’000
2014$’000
2015$’000
2014$’000
Current
Trade debtors(1),(2) 54,887 126,652 – –
Other debtors(1) 26,187 110,416 199 573
Amounts due from subsidiary entities(3) – – 1,280,165 775,440
81,074 237,068 1,280,364 776,013
(1) During 2015, no current receivables have been determined to be impaired and no related impairment loss has been charged to the statement of comprehensive income (2014: nil) .
(2) Credit sales are on terms between 8 and 30 days .
(3) Receivables from related entities are payable on call .
11 INVENTORIESCONSOLIDATED PARENT
2015$’000
2014$’000
2015$’000
2014$’000
Current
At cost
Materials and supplies 102,565 129,706 – –
Petroleum products 34,221 30,483 – –
136,786 160,189 – –
For
per
sona
l use
onl
y

OIL SEARCH Annual Report 2015 103
N O T E S T O T H E F I N A N C I A L S T A T E M E N T S2015
12 OTHER FINANCIAL ASSETSCONSOLIDATED PARENT
2015$’000
2014$’000
2015$’000
2014$’000
Non-current
Loan receivable 104,125 91,249 – –
The loan receivable relates to cash advanced by Oil Search under a farm-in arrangement in respect of an exploration licence that remains subject to government approvals . The balance is comprised of both interest bearing, $39 .0 million (2014: $30 .9 million) and non-interest bearing, $65 .2 million (2014: $60 .3 million) components . Interest accrues at the lesser of 10% per annum or Libor plus 7 .5% . An option agreement and a share pledge agreement are held over this receivable balance, permitting Oil Search to acquire an equity interest in the issued share capital of the borrower . This asset is not past due or impaired at the end of the reporting period . The loan receivable is payable based on contractual arrangements .
13 EXPLORATION AND EVALUATION ASSETS
(a) Exploration and evaluation assetsCONSOLIDATED PARENT
2015$’000
2014$’000
2015$’000
2014$’000
At cost 2,067,115 1,823,862 84,053 79,725
Less impairment (646,464) (247,194) (23,793) (23,793)
1,420,651 1,576,668 60,260 55,932
Balance at start of year 1,576,668 594,169 55,932 56,360
Additions 275,699 1,246,939 2,816 398
Exploration costs expensed during the year (50,889) (109,132) (906) (826)
Changes in restoration obligations 19,474 5,326 2,418 –
Net exchange differences (1,030) (859) – –
Impairment (399,271) (159,775) – –
Balance at end of year 1,420,651 1,576,668 60,260 55,932
Exploration and evaluation assets include $1,056 .6 million (2014: $1,109 .1 million) of licence acquisition costs and signature bonuses that are classified as intangible assets .
(b) Impairment of non-current assets – Exploration and evaluationAt 31 December 2015 the Group assessed each exploration and evaluation asset to determine whether an indicator of impairment existed .
Where indicators were identified, the estimated recoverable amount for exploration and evaluation assets was determined based on their fair values less costs of disposal . If the recoverable amount of an asset was less than its carrying amount, the difference was realised as an impairment loss . The following impairment loss was recognised at 31 December 2015:
ASSET SEGMENT EVENTS AND CIRCUMSTANCES
IMPAIRMENT AMOUNT
$’000
RECOVERABLE AMOUNT
$’000
K42 (Taza PSC) MENA Results from appraisal drilling programme that indicated the re-estimated resources are not economically recoverable
399,271 –
399,271 –
Fair value less costs of disposal for the Taza PSC was determined using the market approach . The fair value measurement is categorised as Level 3 in the fair value hierarchy .
For
per
sona
l use
onl
y

104
N O T E S T O T H E F I N A N C I A L S T A T E M E N T S2015
14 PROPERTY, PLANT AND EQUIPMENT
CONSOLIDATED OIL AND GAS
CONSOLIDATED OTHER PLANT AND EQUIPMENT
DEVELOPMENT$’000
PRODUCING$’000
TOTAL$’000
MARINE$’000
RIGS$’000
CORPORATE$’000
TOTAL $’000
2015
At cost 446 8,880,329 8,880,775 75,101 84,479 125,392 284,972
Accumulated amortisation, depreciation and impairment – (1,857,001) (1,857,001) (3,980) (57,835) (94,650) (156,465)
446 7,023,328 7,023,774 71,121 26,644 30,742 128,507
Balance at 1 January 2015 143,320 7,038,824 7,182,144 8,653 34,765 29,648 73,066
Additions 135,211 111,830 247,041 66,098 – 16,438 82,536
Transfers (278,085) 278,085 – – – – –
Disposals – – – – – (5,528) (5,528)
Changes in restoration obligations – (17,056) (17,056) – – (183) (183)
Net exchange differences – – – – – (1,986) (1,986)
Amortisation and depreciation – (388,355) (388,355) (3,630) (8,121) (7,647) (19,398)
Balance at 31 December 2015 446 7,023,328 7,023,774 71,121 26,644 30,742 128,507
2014
At cost 143,320 8,507,470 8,650,790 9,003 84,479 116,651 210,133
Accumulated amortisation, depreciation and impairment – (1,468,646) (1,468,646) (350) (49,714) (87,003) (137,067)
143,320 7,038,824 7,182,144 8,653 34,765 29,648 73,066
Balance at 1 January 2014 6,400,179 330,828 6,731,007 – 41,739 26,707 68,446
Additions 456,621 105,677 562,298 9,003 702 12,088 21,793
Transfers (6,759,425) 6,759,425 – – – – –
Borrowing costs capitalised 45,945 – 45,945 – – – –
Changes in restoration obligations – 120,698 120,698 – – 40 40
Net exchange differences – – – – – (710) (710)
Amortisation and depreciation – (256,986) (256,986) (350) (7,676) (8,477) (16,503)
Impairment – (20,818) (20,818) – – – –
Balance at 31 December 2014 143,320 7,038,824 7,182,144 8,653 34,765 29,648 73,066
15 PAYABLES
CONSOLIDATED PARENT
2015$’000
2014$’000
2015$’000
2014$’000
Current
Payables and accruals(1) 209,755 312,665 1,832 9,399
Deferred lease liability 4,828 5,420 – –
214,583 318,085 1,832 9,399
Non-current
Other payables 8,055 8,462 – –
Deferred lease liability 10,615 12,578 – –
18,670 21,040 – –
(1) Trade creditors are normally settled on 30 day terms . For
per
sona
l use
onl
y

OIL SEARCH Annual Report 2015 105
N O T E S T O T H E F I N A N C I A L S T A T E M E N T S2015
16 PROVISIONS
NOTES
CONSOLIDATED PARENT
2015$’000
2014$’000
2015$’000
2014$’000
Current
Employee entitlements (i) 6,106 6,923 – –
Site restoration (ii) 7,179 – – –
Contingent consideration 2,000 2,000 – –
Other provisions 704 750 – –
15,989 9,673 – –
Non-current
Employee entitlements (i) 10,628 13,128 – –
Site restoration (ii) 384,136 392,524 2,418 –
394,764 405,652 2,418 –
(i) Movement in employee entitlements provision
CONSOLIDATED PARENT
2015$’000
2014$’000
2015$’000
2014$’000
Balance at start of year 20,051 20,025 – –
Additional provision recognised 9,064 9,083 – –
Provision utilised (12,381) (9,057) – –
Balance at end of year 16,734 20,051 – –
The provisions represent amounts due to employees in respect of entitlements to annual leave and long service leave accrued under statutory obligations applicable in Australia, PNG and MENA . These amounts are payable in the normal course of business, either when leave is taken or on termination of employment .
(ii) Movement in site restoration provision
CONSOLIDATED PARENT
2015$’000
2014$’000
2015$’000
2014$’000
Balance at start of year 392,524 256,519 – –
Additional provision recognised 516 126,064 2,418 –
Provision utilised (12,028) – – –
Unwinding of discount 10,303 9,941 – –
Balance at end of year 391,315 392,524 2,418 –
These provisions are in relation to the estimated costs associated with the restoration of sites that will be incurred at the conclusion of the economic life of the producing assets in which the Group holds a participating interest .
17 BORROWINGS
CONSOLIDATED PARENT
2015$’000
2014$’000
2015$’000
2014$’000
Current
Finance lease 1,117 249 – –
Secured loan from joint operation(1) 289,255 102,139 – –
290,372 102,388 – –
Non-current
Finance lease 72,902 8,622 – –
Revolving credit facility(1) – 150,000 – –
Secured loan from joint operation(1) 3,939,376 4,160,055 – –
4,012,278 4,318,677 – –
(1) Details regarding borrowings are contained in Note 26(f) .
For
per
sona
l use
onl
y

106
N O T E S T O T H E F I N A N C I A L S T A T E M E N T S2015
18 SHARE CAPITAL AND RESERVES
CONSOLIDATED
2015$’000
2014$’000
Issued 1,522,692,587 (2014: 1,522,692,587)
Ordinary shares, fully paid (no par value) 3,147,340 3,147,340
2015 SHARES
2014 SHARES
2015 $’000
2014 $’000
Movements in issued and fully paid shares
Balance at the beginning of the year 1,522,692,587 1,343,361,150 3,147,340 1,821,957
Shares issued through private placement – 149,390,244 – 1,097,037
DRP underwriting agreement(1)
Ordinary shares issued at $7 .65 (2013 final dividend) – 2,196,784 – 16,794
Ordinary shares issued at $8 .35 (2014 interim dividend) – 2,309,820 – 19,287
DRP(2)
Ordinary shares issued at $7 .58 (2013 final dividend) – 1,744,275 – 13,066
Ordinary shares issued at $7 .79 (2014 interim dividend) – 1,360,542 – 11,161
Shares issued under share purchase plan – 22,329,772 – 169,466
Share issue costs – – – (1,428)
Balance at the end of the year 1,522,692,587 1,522,692,587 3,147,340 3,147,340
(1) A fully underwritten DRP was utilised for all dividends paid during 2014 .
(2) The price for shares issued under the DRP was calculated in accordance with the DRP Rules and was the arithmetic average of the daily volume weighted average sales price of all Oil Search shares sold on the Australian Securities Exchange (excluding off-market trades) during ten trading days following the Record Date for the dividend, less a discount of 2 .00% .
CONSOLIDATED PARENT
2015$’000
2014$’000
2015$’000
2014$’000
Reserves at the end of the year
Foreign currency translation reserve(1) (18,741) (14,523) – –
Amalgamation reserve(2) – – (2,990) (2,990)
Reserve for treasury shares(3) (5,391) (8,099) (2,771) (5,479)
Employee equity compensation reserve(4) 11,158 12,236 5,496 6,573
(12,974) (10,386) (265) (1,896)
(1) The foreign currency translation reserve is used to record foreign exchange differences arising from the translation of the financial statements of foreign subsidiaries .
(2) The amalgamation reserve was used to record the retained earnings of entities amalgamated into the parent entity in 2006 .
(3) The reserve for treasury shares is used to record the cost of purchasing Oil Search Limited shares by the Restricted Share Plan Trust .
(4) The employee equity compensation reserve is used to record the share-based remuneration obligations to employees in relation to Oil Search Limited ordinary shares as held by the Employee Options and Rights Share Plans and Share Appreciation Rights Share Plans, which have not vested as at the end of the year .
For
per
sona
l use
onl
y

OIL SEARCH Annual Report 2015 107
N O T E S T O T H E F I N A N C I A L S T A T E M E N T S2015
19 STATEMENT OF CASH FLOWS
(a) Cash and cash equivalents
CONSOLIDATED PARENT
2015$’000
2014$’000
2015$’000
2014$’000
Cash at bank and on hand(1) 454,258 772,946 103,355 40,718
Share of cash in joint operations 31,221 43,540 105 –
Interest-bearing short-term deposits(2),(3),(4) 425,000 143,680 – 108,680
910,479 960,166 103,460 149,398
(1) Includes $270 .8 million (2014: $696 .5 million) escrowed in the PNG LNG Project account . Refer to note 26 for further details .
(2) Includes $nil (2014: $2 .0 million) held as security for letters of credit on issue .
(3) Includes $nil (2014: $107 .0 million) held in escrow to meet future PNG LNG Project base equity commitments . Refer to note 26(f) for further details .
(4) Includes $10 .1 million (2014: $10 .1 million) in a debt service reserve account held with Australia & New Zealand Banking Group Limited, as required by the $500 million revolving facility agreement .
(b) Reconciliation of cash flows from operating activitiesCONSOLIDATED PARENT
2015$’000
2014$’000
2015$’000
2014$’000
Net (loss)/profit after tax (39,382) 353,218 739,159 42,980
Add/(deduct):
Exploration costs expensed(1) 18,088 84,782 199 826
Impairment expense 399,271 180,593 – –
Loss/(gain) on disposal of non-current assets 5,528 (150) – –
Dividend income – – (750,000) (46,230)
Depreciation and amortisation 407,753 252,671 – –
Non-cash interest expense – 108,289 – –
Unwinding of site restoration discount 10,303 9,941 – –
Employee share-based remuneration 10,199 10,335 – –
Exchange losses/(gain) – unrealised 172 (8,782) 1,790 (199)
Movement in tax provisions 58,533 49,370 465 (2,035)
Decrease/(Increase) in receivables 81,011 (16,585) (5,043) 2,483
Decrease/(Increase) in inventories 13,225 (55,882) (200) 177
Decrease/(Increase) in other current and non-current assets 7,414 (33,987) – –
Increase/(decrease) in payables (166) 57,602 8,692 1,275
(Decrease)/Increase in provisions (19,210) 889 – –
992,121 639,086 (744,097) (43,703)
Net cash from/(used in) operating activities 952,739 992,304 (4,938) (723)
(1) Exploration costs expensed totalled $50 .9 million (2014: $109 .1 million) of which $18 .1 million (2014: $84 .8 million) represents the write-off of costs for unsuccessful wells which are not included in operating cash flows .
(C) NON-CASH INVESTING AND FINANCING ACTIVITIESCONSOLIDATED
2015$’000
2014$’000
Borrowing costs capitalised into developing assets(1) – 44,685
Acquisition of marine assets by means of finance lease 66,098 9,003
(1) This amount differs to the amount disclosed in Note 14 as interest on the Group’s revolving credit facility is cash-settled when due .For
per
sona
l use
onl
y
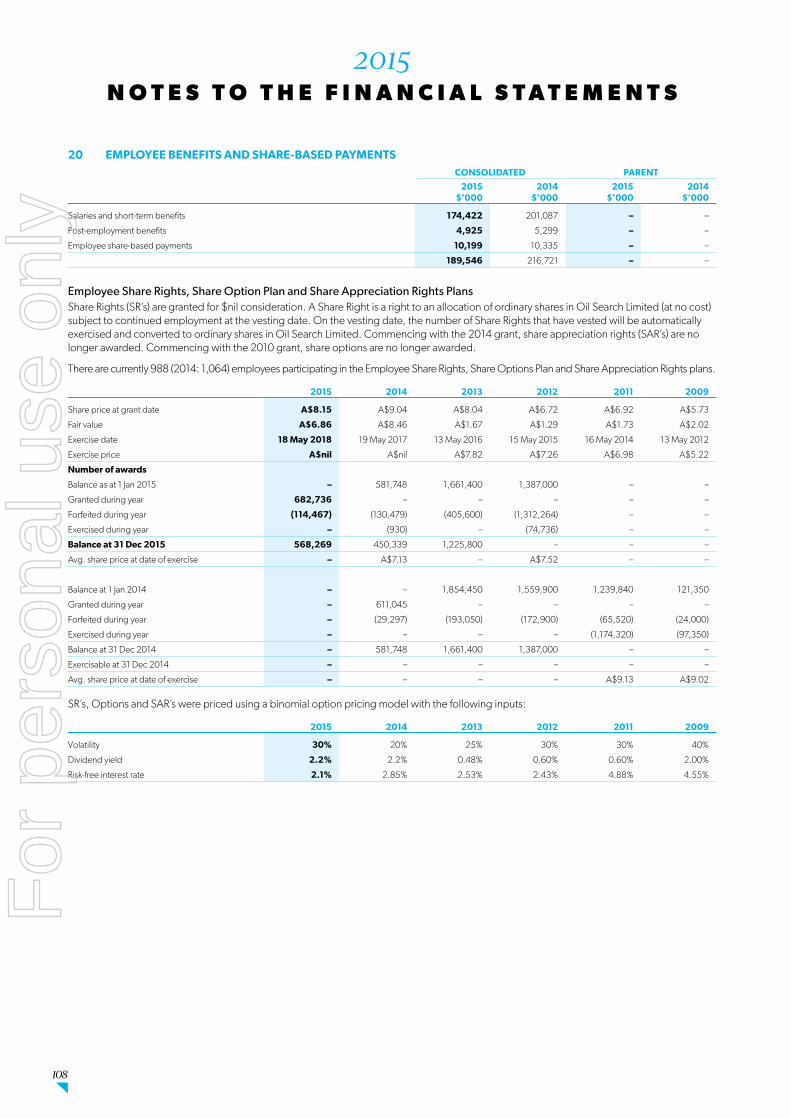
108
N O T E S T O T H E F I N A N C I A L S T A T E M E N T S2015
20 EMPLOYEE BENEFITS AND SHARE-BASED PAYMENTSCONSOLIDATED PARENT
2015$’000
2014$’000
2015$’000
2014$’000
Salaries and short-term benefits 174,422 201,087 – –
Post-employment benefits 4,925 5,299 – –
Employee share-based payments 10,199 10,335 – –
189,546 216,721 – –
Employee Share Rights, Share Option Plan and Share Appreciation Rights PlansShare Rights (SR’s) are granted for $nil consideration . A Share Right is a right to an allocation of ordinary shares in Oil Search Limited (at no cost) subject to continued employment at the vesting date . On the vesting date, the number of Share Rights that have vested will be automatically exercised and converted to ordinary shares in Oil Search Limited . Commencing with the 2014 grant, share appreciation rights (SAR’s) are no longer awarded . Commencing with the 2010 grant, share options are no longer awarded .
There are currently 988 (2014: 1,064) employees participating in the Employee Share Rights, Share Options Plan and Share Appreciation Rights plans .
2015 2014 2013 2012 2011 2009
Share price at grant date A$8.15 A$9 .04 A$8 .04 A$6 .72 A$6 .92 A$5 .73
Fair value A$6.86 A$8 .46 A$1 .67 A$1 .29 A$1 .73 A$2 .02
Exercise date 18 May 2018 19 May 2017 13 May 2016 15 May 2015 16 May 2014 13 May 2012
Exercise price A$nil A$nil A$7 .82 A$7 .26 A$6 .98 A$5 .22
Number of awards
Balance as at 1 Jan 2015 – 581,748 1,661,400 1,387,000 – –
Granted during year 682,736 – – – – –
Forfeited during year (114,467) (130,479) (405,600) (1,312,264) – –
Exercised during year – (930) – (74,736) – –
Balance at 31 Dec 2015 568,269 450,339 1,225,800 – – –
Avg . share price at date of exercise – A$7 .13 – A$7 .52 – –
Balance at 1 Jan 2014 – – 1,854,450 1,559,900 1,239,840 121,350
Granted during year – 611,045 – – – –
Forfeited during year – (29,297) (193,050) (172,900) (65,520) (24,000)
Exercised during year – – – – (1,174,320) (97,350)
Balance at 31 Dec 2014 – 581,748 1,661,400 1,387,000 – –
Exercisable at 31 Dec 2014 – – – – – –
Avg . share price at date of exercise – – – – A$9 .13 A$9 .02
SR’s, Options and SAR’s were priced using a binomial option pricing model with the following inputs:
2015 2014 2013 2012 2011 2009
Volatility 30% 20% 25% 30% 30% 40%
Dividend yield 2.2% 2 .2% 0 .48% 0 .60% 0 .60% 2 .00%
Risk-free interest rate 2.1% 2 .85% 2 .53% 2 .43% 4 .88% 4 .55%
For
per
sona
l use
onl
y

OIL SEARCH Annual Report 2015 109
N O T E S T O T H E F I N A N C I A L S T A T E M E N T S2015
Performance Rights PlanAn employee Performance Rights Plan was established in 2004 where selected employees of the Group are granted rights over ordinary shares of Oil Search Limited . Vesting of the awards depends on Oil Search’s Total Shareholder Return (TSR) performance over a three-year period relative to peer Groups of companies . The two peer groups are:
The ASX50 (excluding property trusts and non-standard listings); and
The constituents of the Standard and Poor’s Global Energy Index . TSR outcomes for this international group are normalised against a US dollar base currency to provide consistency of measurement .
To determine the level of vesting of the awards, Oil Search’s TSR over the three year performance period is ranked against the TSR of each company in the peer Groups over the same period .
For each peer Group, if Oil Search’s TSR performance is:
below median, that is the 50th percentile, no performance rights will vest;
at the median, 25% of the performance rights granted will vest;
greater than the median and less than the 75th percentile, the number of performance rights that will vest increases on a straight line basis from 25% to 50% of the total number of performance rights granted;
at or above the 75th percentile, 50% of the performance rights granted will vest .
The rights are granted for nil consideration and are granted in accordance with guidelines approved by shareholders at the Annual Meeting in 2004 . The rights cannot be transferred and are not quoted on the Australian Securities Exchange . There are currently 117 (2014: 163) employees participating in the Performance Rights Plans .
EXECUTIVES 2015 2014 2013 2012 2011 2009
Grant date 18 May 2015 19 May 2014 24 May 2013 21 May 2012 23 May 2011 1 June 2009
Share price at grant date A$8.15 A$9 .04 A$8 .16 A$6 .72 A$6 .92 A$5 .73
Fair value A$3.00 A$5 .59 A$5 .28 A$4 .52 A$4 .40 A$4 .70
Exercise date 18 May 2018 19 May 2017 20 May 2016 15 May 2015 23 May 2014 13 May 2012
Number of rights
Balance at 1 January 2015 – 934,100 1,610,868 1,525,800 – –
Granted during year 1,052,876 – – – – –
Forfeited during year (32,382) (57,835) (85,384) (958,887) – –
Exercised during year – – – (566,913) – –
Balance at 31 December 2015 1,020,494 876,265 1,525,484 – – –
Average share price at date of exercise – – – A$7 .70 – –
Balance at 1 January 2014 – – 1,635,200 1,595,900 1,307,400 115,131
Granted during year – 934,100 – – – –
Forfeited during year – – (24,332) (70,100) (235,056) –
Exercised during year – – – – (1,072,344) (115,131)
Balance at 31 December 2014 – 934,100 1,610,868 1,525,800 – –
Average share price at date of exercise – – – – A$9 .13 A$9 .03
2015 2014 2013 2012 2011 2009
Volatility 30% 20% 25% 30% 30% 40%
Dividend yield 2.2% 2 .2% 0 .48% 0 .60% 0 .60% 2 .00%
Risk-free interest rate 2.1% 2 .85% 2 .60% 2 .43% 4 .88% 4 .16%
For performance rights granted prior to 2010, the terms of the allocations provided for a 3 year vesting period followed by a 2 year exercise period . From 2010, all awards that satisfy their respective vesting conditions at the end of the 3 years vesting period are automatically exercised .
20 EMPLOYEE BENEFITS AND SHARE-BASED PAYMENTS (CONTINUED)
For
per
sona
l use
onl
y

110
N O T E S T O T H E F I N A N C I A L S T A T E M E N T S2015
Restricted Share PlanAn employee Restricted Share Plan was established in 2007 where selected employees of the Group are granted restricted shares of Oil Search Limited .
Restricted shares are granted under the plan in two situations . Firstly, as a way of retaining key management and other employees, secondly, by way of a mandatory deferral of a portion of a selected participant’s short-term incentive award . Awards under the Restricted Share Plan are structured as grants of restricted shares for nil consideration . Restricted shares will be held on behalf of participants in trust, subject to the disposal restrictions and forfeiture conditions, until release under the terms of the plan and in accordance with guidelines approved by shareholders at the Annual Meeting in 2007 . There are currently 14 (2014: 10) employees participating in the Restricted Share Plan .
Restricted shares were priced at the closing share price at the grant date .
EXECUTIVES 2015 2015 2015 2014 2014 2014 2014 2014 2014 2014
Grant date2 Nov 2015
18 May 2015
2 Mar 2015
7 Nov 2014
14 Oct 2014
14 Oct 2014
19 May 2014
19 May 2014
19 May 2014
10 Jan 2014
Share price at grant date A$7.79 A$7.33 A$8.12 A$8 .69 A$8 .43 A$8 .43 A$8 .80 A$7 .92 A$7 .92 A$7 .72
Exercise date30 Oct
20171 Jan
201731 Dec
20171 Mar 2016
1 Oct 2016
1 Oct 2015
1 Jan 2016
1 Jan 2016
1 Jan 2015
24 Feb 2016
Exercise price $A nil $A nil $A nil $A nil $A nil $A nil $Anil $A nil $A nil $A nil
Number of shares
Balance at 1 January 2015 – – – 40,000 4,889 4,889 292,328 15,150 15,150 16,200
Granted during year 31,250 599,991 50,000 – – – – – – –
Forfeited during year – – – – – – – – – –
Vested during year – (45,162) – – – (4,889) (28,489) – (15,150) –
Balance at 31 December 2015 31,250 554,829 50,000 40,000 4,889 – 263,839 15,150 – 16,200
Balance at 1 January 2014 – – – – – – – – – –
Granted during year – – – 40,000 4,889 4,889 292,328 15,150 15,150 16,200
Forfeited during year – – – – – – – – – –
Vested during year – – – – – – – – – –
Balance at 31 December 2014 – – – 40,000 4,889 4,889 292,328 15,150 15,150 16,200
EXECUTIVES 2014 2013 2013 2012 2010
Grant date10 Jan 2014
7 Mar 2013
7 Mar 2013
5 Mar 2012
27 Apr 2010
Share price at grant date A$7 .72 A$7 .87 A$7 .87 A$7 .21 A$5 .79
Exercise date24 Feb
201531 Oct
20141 Jan
20151 Jan
201427 Apr
2014
Exercise price $A nil A$ nil A$ nil A$ nil A$ nil
Number of shares
Balance at 1 January 2015 16,200 – 321,230 – –
Granted during year – – – – –
Forfeited during year – – – – –
Vested during year (16,200) – (321,230) – –
Balance at 31 December 2015 – – – – –
Balance at 1 January 2014 – 40,000 321,230 72,648 100,000
Granted during year 16,200 – – – –
Forfeited during year – – – – –
Vested during year – (40,000) – (72,648) (100,000)
Balance at 31 December 2014 16,200 – 321,230 – –
20 EMPLOYEE BENEFITS AND SHARE-BASED PAYMENTS (CONTINUED)
For
per
sona
l use
onl
y
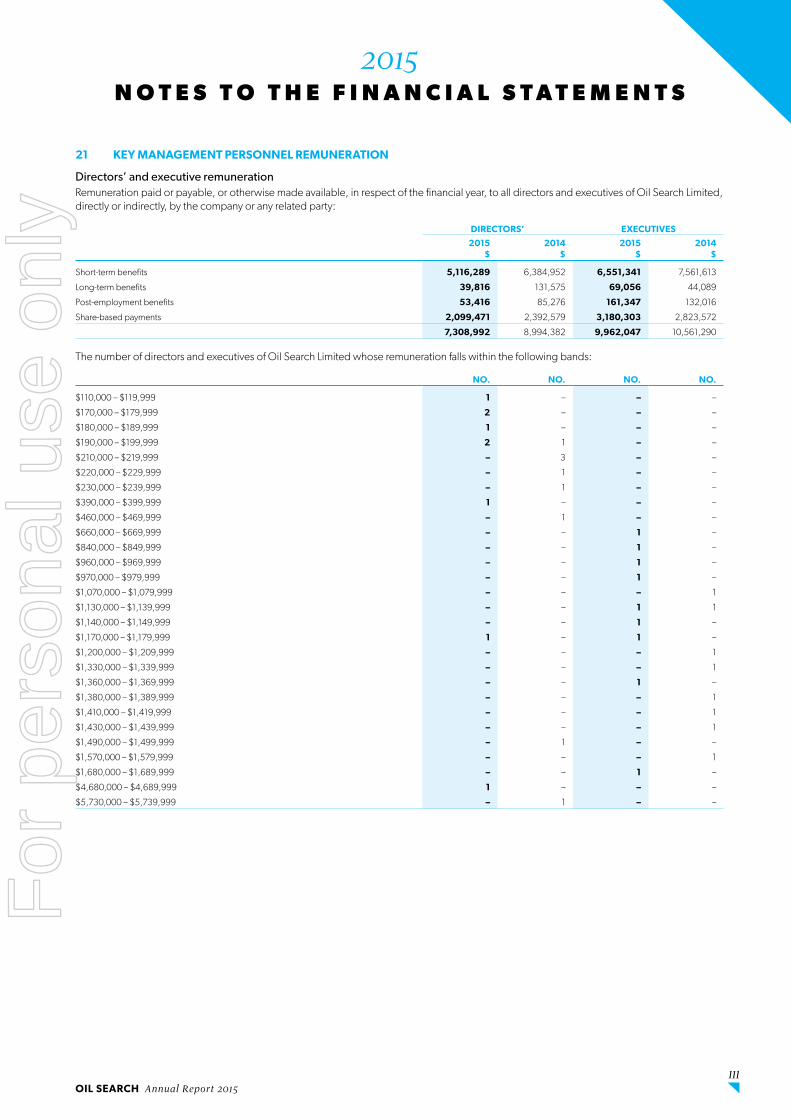
OIL SEARCH Annual Report 2015 111
N O T E S T O T H E F I N A N C I A L S T A T E M E N T S2015
21 KEY MANAGEMENT PERSONNEL REMUNERATION
Directors’ and executive remunerationRemuneration paid or payable, or otherwise made available, in respect of the financial year, to all directors and executives of Oil Search Limited, directly or indirectly, by the company or any related party:
DIRECTORS’ EXECUTIVES
2015$
2014$
2015$
2014$
Short-term benefits 5,116,289 6,384,952 6,551,341 7,561,613
Long-term benefits 39,816 131,575 69,056 44,089
Post-employment benefits 53,416 85,276 161,347 132,016
Share-based payments 2,099,471 2,392,579 3,180,303 2,823,572
7,308,992 8,994,382 9,962,047 10,561,290
The number of directors and executives of Oil Search Limited whose remuneration falls within the following bands:
NO. NO. NO. NO.
$110,000 – $119,999 1 – – –
$170,000 – $179,999 2 – – –
$180,000 – $189,999 1 – – –
$190,000 – $199,999 2 1 – –
$210,000 – $219,999 – 3 – –
$220,000 – $229,999 – 1 – –
$230,000 – $239,999 – 1 – –
$390,000 – $399,999 1 – – –
$460,000 – $469,999 – 1 – –
$660,000 – $669,999 – – 1 –
$840,000 – $849,999 – – 1 –
$960,000 – $969,999 – – 1 –
$970,000 – $979,999 – – 1 –
$1,070,000 – $1,079,999 – – – 1
$1,130,000 – $1,139,999 – – 1 1
$1,140,000 – $1,149,999 – – 1 –
$1,170,000 – $1,179,999 1 – 1 –
$1,200,000 – $1,209,999 – – – 1
$1,330,000 – $1,339,999 – – – 1
$1,360,000 – $1,369,999 – – 1 –
$1,380,000 – $1,389,999 – – – 1
$1,410,000 – $1,419,999 – – – 1
$1,430,000 – $1,439,999 – – – 1
$1,490,000 – $1,499,999 – 1 – –
$1,570,000 – $1,579,999 – – – 1
$1,680,000 – $1,689,999 – – 1 –
$4,680,000 – $4,689,999 1 – – –
$5,730,000 – $5,739,999 – 1 – –
For
per
sona
l use
onl
y

112
N O T E S T O T H E F I N A N C I A L S T A T E M E N T S2015
22 KEY MANAGEMENT PERSONNEL TRANSACTIONSThe directors and other key management personnel of Oil Search Limited during the year to 31 December 2015, and their interests in the shares of Oil Search Limited at that date were:
NO. OF ORDINARY SHARES
NO. OF PERFORMANCE RIGHTS(1)
NO. OF RESTRICTED SHARES(1)
2015 2014 2015 2014 2015 2014
Directors
PR Botten 2,387,394 2,222,403 698,600 711,300 325,503 236,221
G Aopi 451,444 394,602 152,200 154,400 65,589 62,460
KG Constantinou – – – – – –
FE Harris(2) 31,961 31,961 – – – –
AJ Kantsler 45,736 45,736 – – – –
RJ Lee 96,829 71,829 – – – –
B Philemon 7,241 7,241 – – – –
KW Spence 25,000 25,000 – – – –
ZE Switkowski 201,829 201,829 – – – –
Other key management personnel
P Cholakos 230,417 174,770 156,909 159,800 69,319 61,833
G Darnley-Stuart 10,000 – 154,931 128,700 66,787 26,471
J Fowles 49,505 1,829 159,925 161,200 118,948 54,597
S Gardiner 347,484 295,167 154,697 146,700 69,947 61,856
M Herrett 1,829 1,829 132,781 87,700 58,630 33,206
I Munro – – 120,431 68,100 92,868 49,258
K Wulff 8,590 – 55,638 – – –
M Kay(2) – – 124,399 72,068 57,277 32,400
P Caldwell(2) – – 57,348 169,700 – 67,656
(1) Refer to note 20 for key terms .
(2) Number of ordinary shares held by the Director or Executive at date of ceasing employment with the Group .
Some directors and other key management personnel, or their related parties, hold positions in other entities that result in them having control or joint control over those entities .
Four of these entities transacted with the Group in the reporting period . The terms and conditions of the transactions with key management personnel and their related parties were no more favourable than those available, or which might reasonably be expected to be available, on similar transactions to non-key management personnel related entities on an arm’s length basis .
The aggregate value of transactions and outstanding balances relating to key management personnel and entities over which they have control or significant influence were as follows:
CONSOLIDATED
TRANSACTIONS VALUE YEAR ENDED 31 DECEMBER
2015$’000
2014$’000
Airways Hotel and Apartments Limited(1) 7 55
Airways Residence Limited(1) 122 152
Alotau International Hotel(1) 2 9
Lamana Hotel Port Moresby(1) 41 69
(1) The Group acquired hotel, conference facility and accommodation services in PNG from Airways Hotel and Apartments Limited, Airways Residence Limited, Alotau International Hotel and Lamana Hotel Port Moresby, companies of which Sir KG Constantinou is a Director .
All services acquired were based upon normal commercial terms and conditions .For
per
sona
l use
onl
y

OIL SEARCH Annual Report 2015 113
N O T E S T O T H E F I N A N C I A L S T A T E M E N T S2015
23 COMMITMENTSCONSOLIDATED PARENT
2015$’000
2014$’000
2015$’000
2014$’000
Finance lease commitments
Lease of PNG LNG marine vessels
Payable within 12 months 10,436 1,284 – –
Payable 1 to 5 years 41,744 5,135 – –
Payable greater than 5 years 139,697 12,088 – –
191,877 18,507 – –
Future finance charges (117,858) (9,636) – –
Finance lease liability 74,019 8,871 – –
Operating lease commitments
Rental of premises, equipment and LNG charter vessels
Payable within 12 months 27,586 36,271 – –
Payable 1 to 5 years 86,395 114,294 – –
Payable greater than 5 years 142,123 139,561 – –
256,104 290,126 – –
Expenditure commitments
Capital expenditure commitments 266,557 791,390 16,220 17,739
Other expenditure commitments 181,864 190,606 – –
448,421 981,996 16,220 17,739
24 AUDITOR’S REMUNERATIONCONSOLIDATED PARENT
2015$’000
2014$’000
2015$’000
2014$’000
Amounts paid or due and payable in respect of:
Audit and review of the Group’s financial report 303 377 100 125
Other services 38 91 – –
341 468 100 125
The audit fees are in Australian dollars and are translated at 0 .7530 (2014: 0 .9028) .
For
per
sona
l use
onl
y

114
N O T E S T O T H E F I N A N C I A L S T A T E M E N T S2015
25 SUBSIDIARIES AND INTERESTS IN JOINT ARRANGEMENTS
(a) Subsidiaries
COUNTRY OF
INCORPORATION
OWNERSHIP INTEREST %
OWNERSHIP INTEREST %
2015 2014
Parent entity
Oil Search Limited PNG
Consolidated entities
Oil Search (Middle Eastern) Limited British Virgin Is . 100 100
Oil Search (Iraq) Limited British Virgin Is . 100 100
Oil Search (Libya) Limited British Virgin Is . 100 100
Oil Search (Tunisia) Limited British Virgin Is . 100 100
Oil Search (Newco) Limited British Virgin Is . 100 100
Oil Search (ROY) Limited British Virgin Is . 100 100
Oil Search (Gas Holdings) Limited PNG 100 100
Oil Search (Tumbudu) Limited PNG 100 100
Oil Search (P’nyang) Holdings Limited PNG 100 100
Oil Search (P’nyang) Limited PNG 100 100
Oil Search (PNG) Limited PNG 100 100
Oil Search (Drilling) Limited PNG 100 100
Oil Search (Exploration) Inc . Cayman Is . 100 100
Oil Search (LNG) Limited PNG 100 100
Oil Search Finance Limited British Virgin Is . 100 100
New Guinea Investments Limited PNG 100 100
New Guinea (Petroleum) Limited PNG 100 100
Oil Search Foundation Limited(1) PNG 100 100
Papuan Oil Search Limited Australia 100 100
Oil Search (Uramu) Pty Limited Australia 100 100
Oil Search Limited Retention Share Plan Trust Australia 100 100
Pac LNG Investments Limited PNG 100 100
Pac LNG Assets Limited PNG 100 100
Pac LNG International Limited PNG 100 100
Pac LNG Overseas Limited PNG 100 100
Pac LNG Holdings Limited PNG 100 100
(1) Oil Search Foundation Limited is Trustee of the Oil Search Foundation Trust, a not-for-profit organisation established for charitable purposes in PNG . This Trust is not controlled by Oil Search and is not consolidated within the Group .
(b) Interests in joint operationsThe principal activities of the following joint operations, in which the Group holds an interest, are for the exploration and production of crude oil and natural gas . The Group’s interests in joint operations are as follows:
(i) Exploration licences
PRINCIPAL PLACE OF BUSINESS
% INTEREST
2015 2014
PPL 233(2) PNG 52.50 52 .50
PPL 234(1),(2) PNG 80.00 80 .00
PPL 339(1),(4) PNG 70.00 –
PPL 277(2) PNG 50.00 50 .00
Block 7(1) Yemen 34.00(3) 34 .00(3)
(1) Joint operation operated by an Oil Search Group entity .
(2) Subject to government approval .
(3) Participating interest is 34% . Paying interest is 40% .
(4) Subject to farm out/in agreement .
For
per
sona
l use
onl
y

OIL SEARCH Annual Report 2015 115
N O T E S T O T H E F I N A N C I A L S T A T E M E N T S2015
(ii) Gas licences
PRINCIPAL PLACE OF BUSINESS
% INTEREST
2015 2014
PDL 1 Hides gas field PNG 16.66 16 .66
PDL 7 South Hides gas field PNG 40.69 40 .69
PDL 8 Angore gas field PNG 40.69 40 .69
PDL 9 Juha gas field PNG 24.42 24 .42
PRL 3 P’nyang gas field PNG 38.51 38 .51
PRL 9(1) Barikewa gas field PNG 45.11 45 .11
PNG LNG PNG LNG Project PNG 29.00 29 .00
PPFL 2 PNG LNG Project PNG 29.00 29 .00
PL 4 PNG LNG Project PNG 29.00 29 .00
PL 5 PNG LNG Project PNG 29.00 29 .00
PL 6 PNG LNG Project PNG 29.00 29 .00
PL 7 PNG LNG Project PNG 29.00 29 .00
PL 8 PNG LNG Project PNG 29.00 29 .00
(1) Joint operation operated by an Oil Search Group entity .
(iii) Other projects
PRINCIPAL PLACE OF BUSINESS
% INTEREST
2015 2014
Papua New Guinea Liquefied Natural Gas Global Company LDC Bahamas 29.00 29.00
Biomass PNG 70.00(1) 67.00
(1) Participating interest is 70% . Paying interest is 100% .
(c) Interests in other arrangementsThe Group participates in arrangements with other parties that have the same legal form as a joint operation but are not subject to joint control (as described in note 1(q)) . The Group’s interests in these arrangements are as follows:
(i) Production licences
PRINCIPAL PLACE OF BUSINESS
% INTEREST
2015 2014
PDL 1(1) Hides gas to electricity project PNG 100.00 100 .00
PDL 2(2) Kutubu & Moran oil fields PNG 60.05 60 .05
PDL 2(2) South East Mananda oil field PNG 72.27 72 .27
PDL 3(2) South East Gobe oil field PNG 36.36 36 .36
PDL 4(2) Gobe Main and South East
Gobe oil fields PNG 10.00 10 .00
PDL 5 Moran oil field PNG 40.69 40 .69
PDL 6(2) Moran oil field PNG 71.07 71 .07
PL 1(2) Hides gas pipeline PNG 100.00 100 .00
PL 2(2) Kutubu oil pipeline PNG 60.05 60 .05
PL 3(2) Gobe oil pipeline PNG 17.78 17 .78
(1) The Group is operator of the gas to electricity project .
(2) Operated by an Oil Search Group entity .
25 SUBSIDIARIES AND INTERESTS IN JOINT ARRANGEMENTS (CONTINUED)
For
per
sona
l use
onl
y

116
N O T E S T O T H E F I N A N C I A L S T A T E M E N T S2015
(ii) Exploration licences
PRINCIPAL PLACE OF BUSINESS
% INTEREST
2015 2014
PPL 219(1) PNG 71.25 71 .25
PPL 244(1) PNG 40.00 40 .00
PPL 260(1) PNG 40.00 40 .00
PPL 269 PNG 10.00 –
PPL 385(2) PNG 100.00 100 .00
PPL 402(1) PNG 50.00 –
PPL 464 PNG 50.00 –
Taza (K42)(1) Iraq 60.00(3) 60 .00(3)
Tajerouine Tunisia – (5) 50 .00(4)
(1) Operated by an Oil Search Group entity .
(2) Licence 100% owned by the Group . Disclosed for information purposes .
(3) Participating interest is 60% . Paying interest is 75% .
(4) Participating interest is 50% . Paying interest is 100% .
(5) Licence relinquished on 4 May 2015 .
(iii) Gas licences
PRINCIPAL PLACE
OF BUSINESS
% INTEREST
2015 2014
PRL 8(1) Kimu gas field PNG 60.71 60 .71
PRL 10(1) Uramu gas field PNG 100.00 100 .00
PRL 14(1) Cobra, lehi, Bilip gas fields PNG 62.56 62 .56
PRL 15 Elk/Antelope PNG 22.84 22 .84
(1) Operated by an Oil Search Group entity .
26 FINANCIAL AND CAPITAL RISK MANAGEMENTFinancial risk exposures arise in the course of the day-to-day operating activities of the Group, primarily due to the impact of oil price movements on revenue items and exchange rate and interest rate impacts on expenditure and statement of financial position items . The management of borrowings and cash also create liquidity and credit risk exposures . Monetary assets and liabilities denominated in currencies that are different to the Group’s functional currency may also give rise to translation exposures .
The Group’s overall approach to financial risk management is to enter into hedges using derivative financial instruments only in circumstances where it is necessary to ensure adequate cash flow to meet future financial commitments . Financial risk management is undertaken by Group Treasury and risks are managed within the parameters of the Board approved Financial Risk Management Policy .
(a) Foreign exchange riskThe Group’s revenue and major capital obligations are predominantly denominated in US$ .
The Group’s residual currency risk exposure mainly originates from two different sources:
Administrative and business development expenditures incurred at the corporate level in Australian dollars (A$); and
Operating and capital expenditures incurred by the Group in relation to its PNG operations in Papua New Guinea Kina (PGK) and A$ .
The Group is not exposed to material translation exposures as the majority of its assets and liabilities are denominated in US$ .
Foreign exchange risk managementThe Group manages its exposure to foreign exchange rate volatility by matching the currency of its cost structure to its US$ revenue stream . Transaction exposures are netted off across the Group to reduce volatility and avoid incurring the dealing spread on transactions, providing a natural hedge . The residual operating cost exposures, primarily in A$, are recurring in nature and therefore no long-term hedging is undertaken to minimise the profit and loss impact of these exposures .
Cash flows related to joint ventures where Oil Search is the operator are managed independently to the Group’s corporate exposures, reflecting the interests of joint arrangement partners in the operator cash flows . The operator’s A$ and PGK requirements are bought on the spot market . Where these currencies are purchased in advance of requirements, A$ and PGK cash balances do not exceed three months’ requirements .
As at 31 December 2015, there were no foreign exchange hedge contracts outstanding (2014: nil) .
No currency sensitivity analysis is provided as there were no derivative financial instruments in place to hedge residual foreign exchange exposure and any non-derivative financial instruments are directly denominated in the functional currency of the entity in which it is taken out .
25 SUBSIDIARIES AND INTERESTS IN JOINT ARRANGEMENTS (CONTINUED)
For
per
sona
l use
onl
y

OIL SEARCH Annual Report 2015 117
N O T E S T O T H E F I N A N C I A L S T A T E M E N T S2015
(b) Interest rate riskThe Group is exposed to interest rate movements directly through borrowings and investments in each of the currencies of its operations . Surplus cash is invested in accordance with Board approved credit counterparty limits, based on minimum credit ratings, and managed to ensure adequate liquidity is maintained . Whilst some cash is held in PGK and A$, the Group’s primary exposure is to US interest rates .
Interest rate risk managementInterest rate risk is managed on a Group basis at the corporate level . Limits on the proportion of fixed interest rate exposure are applied and interest rates may be fixed for a maximum term of four years or the remaining life of term debt facilities, whichever is the longer .
As at 31 December 2015, there was no interest rate hedging in place (2014: nil) . Cash was invested in short-term instruments with an average maturity of 1 to 3 months .
Interest rate sensitivityThe sensitivity analysis below has been determined based on exposure to interest rates at the reporting date and the stipulated change taking place at the beginning of the financial year and held constant throughout the year .
At the reporting date, if interest rates had been 25 basis points (2014: 25 basis points) higher or lower and all other variables were held constant, the Group’s net (loss)/profit after tax would increase/decrease by $8 .4 million (2014: $9 .2 million) .
At the reporting date, if interest rates had been 25 basis points (2014: 25 basis points) higher or lower and all other variables were held constant, the Parent entity’s net profit after tax would increase/decrease by $0 .3 million (2014: $0 .4 million) .
CONSOLIDATEDFINANCIAL INSTRUMENTS
FLOATING INTEREST
RATE$’000
FIXED INTEREST RATE MATURING IN:
NON-INTEREST BEARING
$’000
TOTAL CARRYING AMOUNT IN
THE STATEMENT OF FINANCIAL
POSITION$’000
1 YEAR OR LESS
$’0001-5 YEARS
$’000
MORE THAN 5 YEARS
$’000
2015
Financial assets
Cash and cash equivalents 485,479 425,000 – – – 910,479
Trade debtors – – – – 54,887 54,887
Other debtors – – – – 26,187 26,187
Loan receivable 38,956 – – – 65,169 104,125
Non-current receivables – – – – 2,084 2,084
Total financial assets 524,435 425,000 – – 148,327 1,097,762
Financial liabilities
Payables and accruals – – – – 209,755 209,755
Other payables – – – – 8,055 8,055
Finance leases – 1,117 6,302 66,600 – 74,019
Borrowings 3,437,031 – – 791,600 – 4,228,631
Total financial liabilities 3,437,031 1,117 6,302 858,200 217,810 4,520,460
2014
Financial assets
Cash and cash equivalents 816,486 143,680 – – – 960,166
Trade debtors – – – – 126,652 126,652
Other debtors – – – – 110,416 110,416
Loan receivable 30,926 – – – 60,323 91,249
Non-current receivables – – – – 1,078 1,078
Total financial assets 847,412 143,680 – – 298,469 1,289,561
Financial liabilities
Payables and accruals – – – – 312,665 312,665
Other payables – – – – 8,462 8,462
Finance lease – 249 1,795 6,827 – 8,871
Borrowings 3,592,409 – – 819,786 – 4,412,194
Total financial liabilities 3,592,409 249 1,795 826,613 321,127 4,742,192
26 FINANCIAL AND CAPITAL RISK MANAGEMENT (CONTINUED)
For
per
sona
l use
onl
y

118
N O T E S T O T H E F I N A N C I A L S T A T E M E N T S2015
PARENTFINANCIAL INSTRUMENTS
FLOATING INTEREST
RATE$’000
FIXED INTEREST RATE MATURING IN:
NON-INTEREST BEARING
$’000
TOTAL CARRYING AMOUNT IN
THE STATEMENT OF FINANCIAL
POSITION$’000
1 YEAR OR LESS
$’0001-5 YEARS
$’000
MORE THAN 5 YEARS
$’000
2015
Financial assets
Cash and cash equivalents 103,460 – – – – 103,460
Other debtors – – – – 199 199
Total financial assets 103,460 – – – 199 103,659
Financial liabilities
Payables and accruals – – – – 1,832 1,832
Total financial liabilities – – – – 1,832 1,832
2014
Financial assets
Cash and cash equivalents 40,718 108,680 – – – 149,398
Other debtors – – – – 573 573
Total financial assets 40,718 108,680 – – 573 149,971
Financial liabilities
Payables and accruals – – – – 9,399 9,399
Total financial liabilities – – – – 9,399 9,399
(c) Commodity price riskThe Group has exposure to commodity price risk associated with the production and sale of oil, condensate, natural gas and liquefied natural gas .
Commodity risk managementThe Group does not seek to limit its exposure to fluctuations in oil prices; rather the central aim of oil price risk management is to ensure the Group’s financial position remains sound and that the Group is able to meet its financial obligations in the event of low oil prices . Hedge cover targets are determined through detailed modelling of the Group’s position under various oil price scenarios . Any hedging programmes entered into will ensure that maturities are spread over time and there are maximum hedge cover levels that apply to future years . This avoids the Group being forced to price a significant proportion of its exposure in an unfavourable oil price environment .
Under the PNG LNG Project financing there are restrictions relating to hedging activities that may be undertaken . Permitted hedging instruments as defined in the financing agreements, which must be non-recourse to the participant’s Project interest and the Project property .
As at 31 December 2015, there was no oil price hedging in place (2014: nil) . No commodity price sensitivity analysis is required as there was no hedging in place .
(d) Credit riskThe Group has exposure to credit risk if counterparties are not able to meet their financial obligations to the Group . The exposure arises as a result of the following activities:
Financial transactions involving money market, surplus cash investments and derivative instruments;
Direct sales of liquefied natural gas, oil, condensate and gas;
Other receivables; and
Loan receivable .
Credit risk managementGlobal credit limits have been established across all categories of financial transactions . These limits are based on the counterparties’ credit rating as issued by Standard and Poor’s and Moody’s .
The Group markets Kutubu crude oil, blended with PNG LNG condensate, on behalf of the Joint Lifting Consortium, primarily selling this product to investment grade counterparties . Sales to non-investment grade counterparties are secured by letters of credit from an investment grade bank .
An option agreement and a share pledge agreement are held as security for the third party loan receivable balance, permitting Oil Search Limited to acquire an equity interest in the issued share capital of the borrower (note 11) .
At 31 December 2015 there was no significant concentration of credit risk exposure to any single counterparty (2014: nil) .
26 FINANCIAL AND CAPITAL RISK MANAGEMENT (CONTINUED)
For
per
sona
l use
onl
y

OIL SEARCH Annual Report 2015 119
N O T E S T O T H E F I N A N C I A L S T A T E M E N T S2015
The extent of the Group’s credit risk exposure is identified in the following table:
NOTE
CONSOLIDATED PARENT
2015$’000
2014$’000
2015$’000
2014$’000
Current
Cash at bank and on hand 19(a) 454,258 772,946 103,355 40,718
Share of cash in joint operations 19(a) 31,221 43,540 105 –
Interest-bearing short-term deposits 19(a) 425,000 143,680 – 108,680
Receivables 10 81,074 237,068 1,280,364 776,013
Borrowings 17 290,372 102,388 – –
Total 1,281,925 1,299,622 1,383,824 925,411
Non-current
Other assets – receivables 2,084 1,078 – –
Loan receivable 12 104,125 91,249 – –
Borrowings 17 4,012,278 4,318,677 – –
Total 4,118,487 4,411,004 – –
(e) Liquidity riskThe Group has exposure to liquidity risk if it is unable to settle financial transactions in the normal course of business and if new funding and refinancing cannot be obtained as required and on reasonable terms .
Liquidity risk managementThe Group manages liquidity risk by ensuring it has sufficient funds available to meet its financial obligations on a day-to-day basis and to meet any unexpected liquidity needs in the normal course of business . The Group’s policy is to maintain surplus immediate cash liquidity together with committed undrawn lines of credit for business opportunities and unanticipated cash outflows .
The Group also seeks to ensure maturities of committed debt facilities are reasonably well spread over time to minimise the Group’s exposure to risk on the cost or availability of funds should the refinancing requirement coincide with unexpected short-term disruption or adverse fund-raising conditions in the capital markets . In order to avoid an exposure to any particular source of external funding the Group acknowledges the benefits of diversification of funding sources and where possible, aims to source its funds from a range of lenders, markets and funding instruments .
As at 31 December 2015, the Group has cash of $910 .5 million (2014: $960 .2 million), of which $425 .0 million was invested in short-term instruments (2014: $143 .7 million) and undrawn loan facilities of $748 .0 million (2014: $600 .0 million) .
The table below shows the Group’s non-derivative financial liabilities into relevant maturity groupings based on their contractual maturities . The amounts disclosed in the table are the contractual undiscounted cash flows .
Non-derivative financial liabilities
CARRYING AMOUNT
$’000
CONTRACTUAL CASH FLOWS
TOTAL$’000
LESS THAN 1 YEAR
$’0001 TO 5 YEARS
$’000
MORE THAN 5 YEARS$’000
2015
Payables and accruals 209,755 209,755 209,755 – –
Other payables 8,055 8,055 8,055 – –
Secured loan from joint operation 4,228,631 5,479,128 449,662 1,962,007 3,067,459
Finance leases 74,019 191,877 10,436 41,744 139,697
Total 4,520,460 5,888,815 677,908 2,003,751 3,207,156
2014
Payables and accruals 312,665 312,665 312,665 – –
Other payables 8,462 8,462 8,462 – –
Secured loan from joint operation 4,262,194 5,910,631 262,541 2,039,912 3,609,178
Revolving credit facility 150,000 151,772 895 150,877 –
Finance lease 8,871 18,507 1,284 5,135 12,088
Total 4,742,192 6,402,037 585,847 2,194,920 3,621,266
26 FINANCIAL AND CAPITAL RISK MANAGEMENT (CONTINUED)
For
per
sona
l use
onl
y

120
N O T E S T O T H E F I N A N C I A L S T A T E M E N T S2015
(f) Financing facilities
Syndicated revolving credit facilityOil Search (Finance) Limited (“OSFL”) signed a five year non-amortising syndicated financing facility effective 29 October 2012 for $500 million . As part of the terms and conditions of this facility, OSFL has provided a charge over its credit account in Melbourne with Australia & New Zealand Banking Group Limited and Oil Search (PNG) Limited as guarantor, provided a charge over its credit account in Melbourne with Australia & New Zealand Banking Group Limited .
Bilateral facilitiesOil Search (PNG) Limited (“OSP”) entered into two separate three year bilateral revolving facilities effective 18 December 2015, with facility limits of $125 million each . As part of the terms and conditions of these facilities, OSP provided a charge over its credit account in Melbourne with Australia & New Zealand Banking Group Limited and the lenders have the benefit of security over OSFL’s credit account in Melbourne with Australia & New Zealand Banking Group Limited .
Secured loan from joint operationPapua New Guinea Liquefied Natural Gas Global Company LDC, a limited duration company incorporated under the laws of the Commonwealth of the Bahamas (the “Borrower”) was organised to conduct certain activities of the PNG LNG Project outside of PNG, including the borrowing and on-lending to the Project participants of the Project Finance Debt Facility, and the purchase and re-sale of PNG LNG Project liquids and LNG . The Borrower is owned by each Project participant in a percentage equal to its interest in the PNG LNG Project (the Oil Search Limited Group interest at 31 December 2015 is 29 .0% (December 2014: 29 .0%)) . Oil Search (LNG) Limited and Oil Search (Tumbudu) Limited are the Company’s participants in the PNG LNG Project (the “OSL Participants”) .
Interest and principal on the Project Finance Debt Facility is payable on specified semi-annual dates, which commenced in June 2015, with the principal being repayable over 11 .5 years based on a customised repayment profile .
The liquids and LNG sales proceeds from the PNG LNG Project are received into a sales escrow account from which agreed expenditure obligations and debt servicing are firstly made and, subject to meeting certain debt service cover ratio tests, surpluses are distributed to the Project participants .
The Borrower granted to the security trustee for the Project Finance Debt Facility:
a first-ranking security interest in all of its assets, with a few limited exceptions;
a fixed and floating charge over existing and future funds in the offshore accounts; a deed of charge (and assignment) over the sales contracts, LNG charter party agreements, rights under insurance policies, LNG supply and sales commitment agreements, on-loan agreements and the sales, shipping and finance administration agreements, collectively known as “Borrower Material Agreements”; and
a mortgage of contractual rights over Borrower Material Agreements .
The OSL Participants have granted the security trustee for the Project Finance Debt Facility a security interest in all their rights, titles, interests in and to all of their assets, excluding any non-PNG LNG Project assets . The Company, as the shareholder in the OSL Participants, has provided the security trustee for the Project Finance Debt Facility a share mortgage over its shares in the OSL Participants .
The Project Finance Debt Facility is subject to various covenants and a negative pledge restricting further secured borrowings, subject to a number of permitted lien exceptions . Neither the covenants nor the negative pledge have been breached at any time during the reporting period .
Financial Completion for the PNG LNG Project was achieved on 5 February 2015 . From that date, the completion guarantee that was provided by the Company for its share of the Project Finance Debt Facility was released . The Company has not provided any other security .
(g) Capital managementThe Group manages its capital to ensure that entities in the consolidated Group will be able to continue as a going concern while maximising the return to stakeholders through the optimisation of the debt and equity balances .
This involves the use of corporate forecasting models which facilitate analysis of the Group’s financial position including cash flow forecasts to determine the future capital management requirements . Capital management is undertaken to ensure a secure, cost-effective and flexible supply of funds is available to meet the Group’s operating and capital expenditure requirements .
(h) Fair valuesAll financial assets and financial liabilities are initially recognised at the fair value of consideration paid or received, net of transaction costs as appropriate, and subsequently carried at amortised cost . The fair values of financial assets and liabilities approximate their carrying amounts .
27 EVENTS OCCURRING AFTER THE REPORTING PERIODSubsequent to balance date, the Directors declared an unfranked final dividend of US four cents per share, to be paid on 31 March 2016 . The proposed final dividend for 2015 is payable to all holders of ordinary shares on the Register of Members on 9 March 2016 .
There were no other significant events after balance date .
26 FINANCIAL AND CAPITAL RISK MANAGEMENT (CONTINUED)
For
per
sona
l use
onl
y

OIL SEARCH Annual Report 2015 121
D I R E C T O R S ’ D E C L A R A T I O N
f o r t h e y e a r e n d e d 3 1 D e c e m b e r 2 0 1 5
In accordance with a resolution of the Directors of Oil Search Limited, the Directors declare that:
(a) the attached financial statements and notes thereto of the consolidated entity:
(i) give a true and fair view of the consolidated entity’s financial position as at 31 December 2015, and its performance for the year ended on that date; and
(ii) comply with International Financial Reporting Standards; and
(iii) the attached financial statements and notes thereto comply with the reporting requirements of the Australian Securities Exchange Listing Rules; and
(b) in the opinion of the Directors, there are reasonable grounds to believe that the company will be able to pay its debts as and when they become due or payable .
This declaration has been made after receiving unqualified declarations from the Managing Director and the Chief Financial Officer, that are consistent with requirements under section 295A of the Australian Corporations Act 2001, for the year ended 31 December 2015 .
Signed in accordance with a resolution of the Directors .
On behalf of the Directors
Richard LeeCHAIRMAN
Peter BottenMANAGING DIRECTOR
Sydney, 22 February 2016
For
per
sona
l use
onl
y

122
Deloitte Touche Tohmatsu Deloitte Touche TohmatsuA.B.N. 74 490 121 060 A.B.N. 74 490 121 060
Deloitte Tower, Level 12Grosvenor Place Douglas Street225 George Street Port MoresbySydney NSW 2000 PO Box 1275 Port MoresbyPO Box N250 Grosvenor Place National Capital DistrictSydney NSW 1220 Australia Papua New GuineaDX 10307SSE
Tel: +675 308 7000Tel: +61 (0) 2 9322 7000 Fax: +675 308 7001Fax: +61 (0) 2 9322 7001 www.deloitte.com.pgwww.deloitte.com.au
Independent Auditor’s Reportto the members of Oil Search Limited
Report on the Financial Report
We have audited the accompanying financial statements of Oil Search Limited (the Company), whichcomprises the statement of financial position as at 31 December 2015, the statement of comprehensiveincome, the statement of cash flows and the statement of changes in equity for the year ended on thatdate, notes comprising a summary of significant accounting policies and other explanatoryinformation, and the directors’ declaration of the consolidated entity comprising the Company and theentities it controlled at the year’s end or from time to time during the financial year as set out on pages88 to 121.
Directors’ Responsibility for the Financial Statements
The directors of the Company are responsible for the preparation of financial statements that give atrue and fair view in accordance with International Financial Reporting Standards (including theinterpretations of the International Financial Reporting Interpretations Committee) and the Papua NewGuinea Companies Act 1997 and for such internal control as the directors determine is necessary toenable the preparation of financial statements that are free from material misstatement, whether due tofraud or error.
Auditor’s Responsibility
Our responsibility is to express an opinion on the financial report based on our audit. We conductedour audit in accordance with International Standards of Auditing. Those standards require that wecomply with relevant ethical requirements relating to audit engagements and plan and perform theaudit to obtain reasonable assurance whether the financial report is free from material misstatement.
An audit involves performing procedures to obtain audit evidence about the amounts and disclosuresin the financial report. The procedures selected depend on the auditor’s judgement, including theassessment of the risks of material misstatement of the financial report, whether due to fraud or error.In making those risk assessments, the auditor considers internal control, relevant to the entity’spreparation of the financial report that gives a true and fair view, in order to design audit proceduresthat are appropriate in the circumstances, but not for the purpose of expressing an opinion on theeffectiveness of the entity’s internal control. An audit also includes evaluating the appropriateness ofaccounting policies used and the reasonableness of accounting estimates made by the directors, as wellas evaluating the overall presentation of the financial statements.
We believe that the audit evidence we have obtained is sufficient and appropriate to provide a basis forour audit opinion.
Liability limited by a scheme approved under Professional Standards Legislation.
Member of Deloitte Touche Tohmatsu Limited.122
I N D E P E N D E N T A U D I T O R ’ S R E P O R Tt o t h e m e m b e r s o f O i l S e a r c h L i m i t e d
For
per
sona
l use
onl
y

OIL SEARCH Annual Report 2015 123
I N D E P E N D E N T A U D I T O R ’ S R E P O R T t o t h e m e m b e r s o f O i l S e a r c h L i m i t e d
Opinion
In our opinion,(i) the financial statements of Oil Search Limited give a true and fair view of the Company’s and consolidated entity’s financial position as at 31 December 2015 and of their performance for
the year ended on that date in accordance with International Financial Reporting Standards (including the interpretations of the International Financial Reporting Interpretations
Committee) and the Papua New Guinea Companies Act 1997 ; and
(ii) proper accounting records have been kept by the Company.
Other Information
We have no interest in the Company or any relationship other than that of the auditor of the Company.
Report on the Remuneration Report
We have audited the Remuneration Report included in pages 69 to 86 of the directors’ report for theyear ended 31 December 2015. The directors of the Company are responsible for the preparation andpresentation of the Remuneration Report and have voluntarily complied with section 300A of theCorporations Act 2001 . Our responsibility is to express an opinion on the Remuneration Report, basedon our audit conducted in accordance with International Standards on Auditing.
Opinion
In our opinion the Remuneration Report of Oil Search Limited for the year ended 31 December 2015,has been prepared in accordance with the requirements of section 300A of the Corporations Act 2001 .
DELOITTE TOUCHE TOHMATSU
Matthew DonaldsonPartnerChartered AccountantsRegistered Company Auditor in AustraliaSydney, 22 February 2016
DELOITTE TOUCHE TOHMATSU
David MurrayPartnerChartered AccountantsRegistered under the Accountants Act, 1996Port Moresby, 22 February 2016
123
For
per
sona
l use
onl
y

124
S H A R E H O L D E R I N F O R M A T I O N
OIL SEARCH LIMITEDARBN 055 079 868
(a) The distribution of ordinary shares ranked according to size as at 10 March 2016 was:
SIZE OF HOLDINGNUMBER OF
HOLDERSNUMBER OF
SHARES% OF ISSUED
CAPITAL
1 – 1,000 21,023 10,055,906 0 .66
1,001 – 5,000 21,449 53,375,862 3 .51
5,001 – 10,000 5,313 37,963,191 2 .49
10,001 – 100,000 3,207 66,789,529 4 .39
100,001 and over 181 1,354,508,099 88 .95
Total 51,173 1,522,692,587 100.00%
(b) The 20 largest ordinary shareholders representing 84 .30% of the ordinary shares as at 10 March 2016 were:
SHAREHOLDERNUMBER OF
SHARES% OF ISSUED
CAPITAL
1 . J P Morgan Nominees Australia Limited 368,985,964 24 .23
2 . HSBC Custody Nominees (Australia) Limited 345,576,391 22 .70
3 . Aust Executor Trustees Ltd <IPIC> 196,604,177 12 .91
4 . National Nominees Limited 152,161,813 9 .99
5 . Citicorp Nominees Pty Limited 80,420,100 5 .28
6 . BNP Paribas Nominees Pty Ltd <DRP> 38,481,556 2 .53
7 . AMP Life Limited 18,179,683 1 .19
8 . Australian Foundation Investment Company Limited 16,482,507 1 .08
9 . Citicorp Nominees Pty Limited <Colonial First State Inv A/C> 14,058,952 0 .92
10 . BNP Paribas Nominees Pty Ltd <Agency Lending DRP A/C> 11,411,093 0 .75
11 . RBC Investor Services Australia Nominees Pty Limited <PI Pooled A/C> 7,294,528 0 .48
12 . National Superannuation Fund Limited 6,081,472 0 .40
13 . Bainpro Nominees Pty Limited 4,814,000 0 .32
14 . UBS Nominees Pty Ltd 3,814,536 0 .25
15 . National Nominees Limited <DB A/C> 3,694,483 0 .24
16 . BNP Paribas Nominees Pty Ltd <Agency Lending Collateral> 3,500,000 0 .23
17 . Djerriwarrh Investments Limited 3,107,213 0 .20
18 . Mrs Frances Claire Fox <Thomas J Beresford Will A/C> 3,006,829 0 .20
19 . UBS Wealth Management Australia Nominees Pty Ltd 2,969,207 0 .19
20 . HSBC Custody Nominees (Australia) Limited <NT-Comnwlth Super Corp A/C> 2,948,360 0 .19
Total 1,283,592,864 84.30
(c) Issued capital as at 10 March 2016 was:
1,522,692,587 ordinary fully paid shares
3,361,482 unlisted performance rights
656,118 restricted shares
1,230,450 share appreciation rights
1,005,469 share rights
The trustee for the employee share plan holds 736,369 shares that are available to satisfy the exercise of employee rights and options and vesting of restricted shares . The shares in the trust are part of the issued capital .F
or p
erso
nal u
se o
nly

OIL SEARCH Annual Report 2015 125
S H A R E H O L D E R I N F O R M A T I O N
(d) The following interests were registered on the Company’s register of Substantial Shareholders as at 10 March 2016:
SHAREHOLDERNUMBER OF
SHARES% OF ISSUED
CAPITAL
International Petroleum Investment Company 196,604,177 12 .91
The Capital Group Companies 156,875,026 10 .30
NPCP Investments 149,390,244 9 .81
(e) The Company’s ordinary fully paid shares are listed on the Australian Securities Exchange and the Port Moresby Stock Exchange . Shares are also listed in the United States of America, via American Depositary Receipts (ADRs) .
(f) At 10 March 2016, 1,854 holders held unmarketable parcels of ordinary shares in the Company .
VOTING RIGHTS ATTACHED TO ORDINARY SHARES 1 . On a show of hands, one vote per member .
2 . On a poll, every member present shall have one vote for every share held by them in the Company .
For
per
sona
l use
onl
y

126
S H A R E H O L D E R I N F O R M A T I O N
ANNUAL MEETINGOil Search’s 2016 Annual Meeting will be held at the Crowne Plaza Hotel, Port Moresby, Papua New Guinea on Friday, 13 May 2016, commencing at 9:30am (Port Moresby time) .
2015 FINAL DIVIDENDThe 2015 final dividend will be paid on 31 March 2016 to shareholders registered at the close of business on 9 March 2016 .
The dividend will be paid in PNG Kina for those shareholders domiciled in Papua New Guinea, in GB Pounds for those shareholders that have lodged direct credit details requesting a GB credit with the Company’s share registry, Computershare, and in Australian dollars for all other shareholders . The exchange rates used for converting the US dollar dividend into the payment currencies are the rates as on the record date, 9 March 2016 .
The dividend will be unfranked and no withholding tax will be deducted . The Company’s dividend reinvestment plan remains suspended .
SHARE REGISTRY
EnquiriesOil Search’s share register is managed by Computershare Investor Services Pty Limited . Please contact Computershare for all shareholding and dividend related enquiries .
Change of shareholder detailsShareholders should notify Computershare of any changes in shareholder details via the Computershare website (www .computershare .com .au) or in writing (fax, email, mail) . Examples of such changes include:
Registered name
Registered address
Direct credit payment details
Dividend payment currency preference .
Computershare Investor Services Pty LimitedGPO Box 2975 Melbourne VIC 3001 Australia
Telephone: Within Australia: 1300 850 505 Outside Australia: +61 3 9415 4000 Facsimile: +61 3 9473 2500
Email: oilsearch@computershare .com .au
Website: www .computershare .com .au
AMERICAN DEPOSITARY RECEIPTS PROGRAMMEBank of New York Mellon ADR Division 22nd Floor 101 Barclay Street New York NY 10286
Telephone: Within USA: +1 888 269 2377 Outside USA: +1 201 680 6825 Facsimile: +1 212 571 3050
SHARE CODESASX Share Code: OSH POMSoX Share Code: OSH ADR Share Code: OISHY
OIL SEARCH WEBSITEA wide range of information on Oil Search is available on the Company’s website, at www .oilsearch .com . As well as reviews of Oil Search’s Board and senior management team, corporate governance practices, activities and sustainability initiatives, the following information for investors is available:
Share price information
Dividend information
Annual reports
Sustainability reports
Quarterly reports
Press releases
Profit announcements
Drilling reports
Presentations
Webcasts .
Investor information, other than about shareholdings and dividends, can be obtained by sending an email to: investor@oilsearch .com
For
per
sona
l use
onl
y
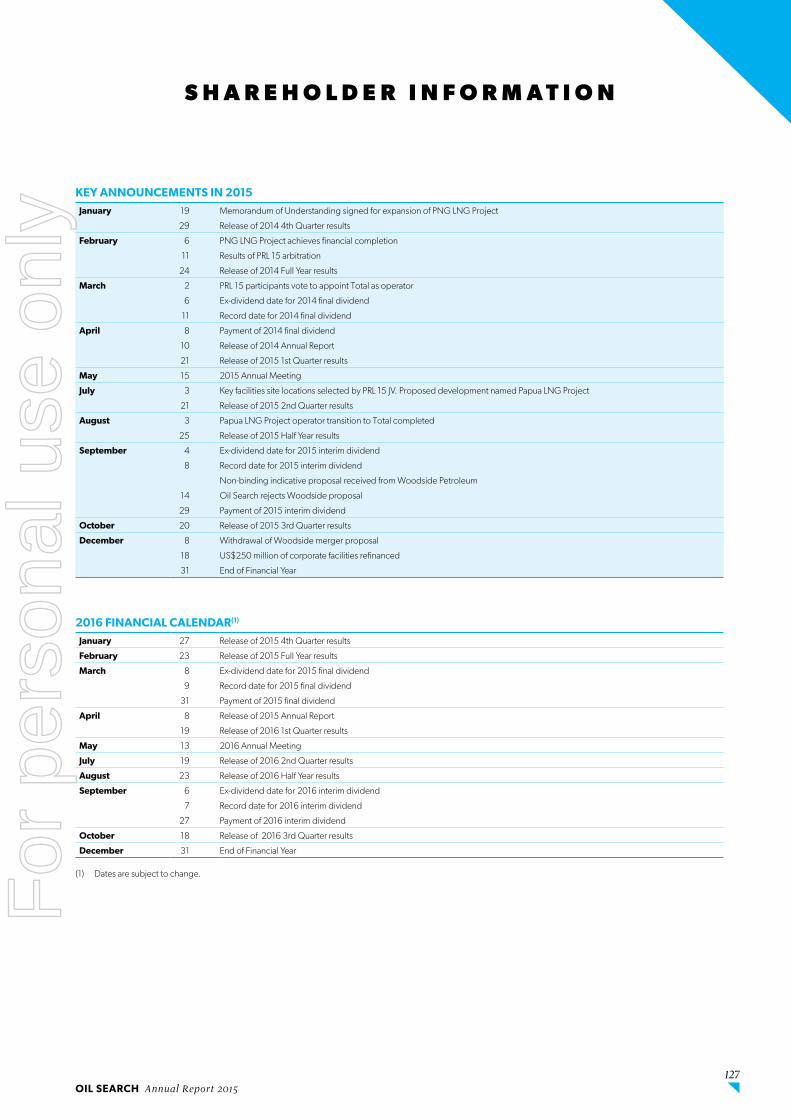
OIL SEARCH Annual Report 2015 127
S H A R E H O L D E R I N F O R M A T I O N
KEY ANNOUNCEMENTS IN 2015
January 19 Memorandum of Understanding signed for expansion of PNG LNG Project
29 Release of 2014 4th Quarter results
February 6 PNG LNG Project achieves financial completion
11 Results of PRL 15 arbitration
24 Release of 2014 Full Year results
March 2 PRL 15 participants vote to appoint Total as operator
6 Ex-dividend date for 2014 final dividend
11 Record date for 2014 final dividend
April 8 Payment of 2014 final dividend
10 Release of 2014 Annual Report
21 Release of 2015 1st Quarter results
May 15 2015 Annual Meeting
July 3 Key facilities site locations selected by PRL 15 JV . Proposed development named Papua LNG Project
21 Release of 2015 2nd Quarter results
August 3 Papua LNG Project operator transition to Total completed
25 Release of 2015 Half Year results
September 4 Ex-dividend date for 2015 interim dividend
8 Record date for 2015 interim dividend
Non-binding indicative proposal received from Woodside Petroleum
14 Oil Search rejects Woodside proposal
29 Payment of 2015 interim dividend
October 20 Release of 2015 3rd Quarter results
December 8 Withdrawal of Woodside merger proposal
18 US$250 million of corporate facilities refinanced
31 End of Financial Year
2016 FINANCIAL CALENDAR(1)
January 27 Release of 2015 4th Quarter results
February 23 Release of 2015 Full Year results
March 8 Ex-dividend date for 2015 final dividend
9 Record date for 2015 final dividend
31 Payment of 2015 final dividend
April 8 Release of 2015 Annual Report
19 Release of 2016 1st Quarter results
May 13 2016 Annual Meeting
July 19 Release of 2016 2nd Quarter results
August 23 Release of 2016 Half Year results
September 6 Ex-dividend date for 2016 interim dividend
7 Record date for 2016 interim dividend
27 Payment of 2016 interim dividend
October 18 Release of 2016 3rd Quarter results
December 31 End of Financial Year
(1) Dates are subject to change .
For
per
sona
l use
onl
y

128
T E N - Y E A R S U M M A R Y
2015
US$’0002014
US$’0002013
US$’0002012
US$’0002011
US$’0002010
US$’0002009
US$’0002008
US$’0002007
US$’0002006
US$’000
INCOME STATEMENT(1)
Revenue 1,585,728 1,610,370 766,265 724,619 732,869 583,560 512,154 814,330 718,755 645,070
Production costs (294,818) (235,380) (126,442) (112,042) (93,919) (87,770) (84,104) (92,870) (93,650) (78,655)
Other operating costs (154,469) (125,769) (87,392) (88,244) (53,362) (24,078) (18,663) (23,399) (26,209) (23,825)
Other income 14,841 7,762 216 45,079 138 3,158 14,914 126,145 1,291 260,488
EBITDAX(2) 1,151,282 1,256,983 552,647 569,412 585,726 474,870 424,301 824,206 600,187 803,078
Depreciation and amortisation (407,753) (252,671) (50,201) (49,457) (51,307) (49,874) (105,416) (127,230) (135,939) (102,975)
Exploration costs expensed (50,889) (109,132) (107,424) (143,970) (60,633) (131,188) (75,729) (91,234) (163,324) (46,765)
EBIT(3) 692,640 895,180 395,022 375,985 473,786 293,808 243,156 605,742 300,924 653,338
Net finance (costs)/income (185,114) (129,595) (15,152) (4,557) (658) (826) (3,326) 6,093 22,791 21,802
Net impairment (losses)/reversals (399,271) (180,593) – (23,793) (33,227) (15,808) – (91,530) 129 (65,180)
Profit before income tax 108,254 584,992 379,870 347,635 439,901 277,174 239,830 520,305 323,844 609,960
Income tax expense (147,636) (231,774) (174,148) (171,801) (237,418) (91,572) (106,150) (206,943) (185,972) (197,978)
Net (loss)/profit after tax (39,381) 353,218 205,722 175,834 202,483 185,602 133,680 313,362 137,872 411,982
Significant items 399,271 180,593 – (22,796) 33,227 (41,488) (34,058) (73,396) 3,621 (204,437)
Core Profit 359,890 533,811 205,722 153,038 235,710 144,114 99,622 239,966 141,493 207,545
Dividends paid – ordinary (274,085) (60,308) (53,532) (53,143) (52,663) (52,087) (67,359) (89,415) (89,587) (100,739)
BALANCE SHEET
Total assets 10,342,834 10,762,094 8,421,537 7,102,721 5,702,034 4,370,067 3,077,390 2,005,457 1,833,479 1,802,755
Total cash 910,479 960,166 209,661 488,274 1,047,463 1,263,589 1,288,077 534,928 343,578 477,884
Total debt 4,302,650 4,421,065 4,024,421 2,866,050 1,747,567 929,720 – – – –
Shareholders’ equity 4,709,361 5,025,476 3,421,052 3,208,346 3,017,232 2,798,467 2,593,181 1,593,227 1,389,132 1,340,980
OTHER INFORMATION 2015 2014 2013 2012 2011 2010 2009 2008 2007 2006
Average realised oil and condensate price (US$/bbl) 51.36 97 .79 110 .73 113 .97 116 .09 80 .19 65 .40 100 .10 77 .78 67 .22
Average realised LNG and gas price (US$/mmBtu) 9.44 13 .94 – – – – – – – –
Net annual oil and condensate production (mmbbl) 8.89 7 .93 5 .82 5 .50 5 .76 6 .77 7 .20 7 .71 8 .98 9 .22
Net annual gas production (bcf)(4) 103.84 57 .87 5 .51 5 .27 5 .56 5 .35 5 .52 5 .35 4 .80 5 .13
Total net annual production (mmboe)(5) 29.25 19 .27 6 .74 6 .38 6 .69 7 .66 8 .12 8 .58 9 .78 10 .20
Exploration and evaluation expenditure (US$’000) 275,699 1,246,939 293,985 240,615 144,606 175,980 438,922 257,286 222,391 120,929
Assets in development expenditure (US$’000) 135,211 502,566 1,214,615 1,492,529 1,286,542 1,139,058 – 4,214 37,617 294
Producing assets expenditure (US$’000) 111,830 105,677 152,600 111,498 129,396 41,850 142,325 157,584 57,219 143,367
Operating cash flow (US$’000) 952,739 992,304 366,804 196,226 386,193 346,675 284,099 507,423 326,783 398,978
Operating cash flow per ordinary share (US cents) 62.57 65 .17 27 .39 14 .75 29 .3 26 .5 24 .5 45 .3 29 .2 35 .6
Diluted EPS (after significant items) (US cents) (2.6) 23 .8 15 .3 13 .2 15 .3 14 .1 11 .5 27 .8 12 .2 36 .6
Diluted EPS (before significant items) (US cents) 23.6 32 .5 15 .4 11 .5 17 .9 11 .0 8 .6 21 .4 12 .6 18 .5
Ordinary dividend per share (US cents) 10.0 10 .0 4 .0 4 .0 4 .0 4 .0 4 .0 8 .0 8 .0 8 .0
Special dividend per share (US cents) – 4 .0 – – – – – – – –
Gearing (%)(6) 41.9% 40 .8% 52 .7% 42 .6% 18 .8% – – – – –
Return on average shareholders’ funds (%) 2.2% 8 .4% 6 .2% 5 .6% 7 .0% 6 .9% 6 .4% 21 .0% 10 .1% 34 .9%
Number of issued shares – ordinary (000s) 1,522,693 1,522,693 1,343,361 1,334,757 1,325,155 1,312,888 1,299,562 1,119,841 1,119,841 1,119,841
EXCHANGE RATES
Year end A$ : US$ 0.731 0 .820 0 .895 1 .038 1 .016 1 .016 0 .897 0 .693 0 .791 0 .791
Average A$ : US$ 0.753 0 .903 0 .969 1 .036 1 .032 0 .919 0 .792 0 .868 0 .836 0 .752
(1) Prior year comparatives have been restated where necessary, in order to achieve consistency with current year disclosures .(2) Earnings before interest, tax, depreciation and amortisation, impairment and exploration .(3) Earnings before interest, impairment and tax .(4) Hides gas production for 2008 onwards includes vent gas . Vent gas was not reported prior to 2008 .(5) Gas and LNG volumes for 2014 onwards have been converted to barrels of oil equivalent using an Oil Search specific conversion factor of 5,100 scf = 1 boe, which
represents a weighted average, based on Oil Search’s reserves portfolio, using the actual calorific value of each gas volume at its point of sale . The change to a specific boe conversion factor more closely reflects the energy content of the Company’s gas reserve portfolio compared to the previous conversion factor of 6,000 scf per boe . Note that prior year figures have not been restated . Minor variations to the conversion factors may occur over time .
(6) Net debt / (net debt and shareholders’ funds) .
For
per
sona
l use
onl
y

OIL SEARCH Annual Report 2015 129
T E N - Y E A R S U M M A R Y
2015 US$’000
2014 US$’000
2013 US$’000
2012 US$’000
2011 US$’000
2010 US$’000
2009 US$’000
2008 US$’000
2007 US$’000
2006 US$’000
INCOME STATEMENT(1)
Revenue 1,585,728 1,610,370 766,265 724,619 732,869 583,560 512,154 814,330 718,755 645,070
Production costs (294,818) (235,380) (126,442) (112,042) (93,919) (87,770) (84,104) (92,870) (93,650) (78,655)
Other operating costs (154,469) (125,769) (87,392) (88,244) (53,362) (24,078) (18,663) (23,399) (26,209) (23,825)
Other income 14,841 7,762 216 45,079 138 3,158 14,914 126,145 1,291 260,488
EBITDAX(2) 1,151,282 1,256,983 552,647 569,412 585,726 474,870 424,301 824,206 600,187 803,078
Depreciation and amortisation (407,753) (252,671) (50,201) (49,457) (51,307) (49,874) (105,416) (127,230) (135,939) (102,975)
Exploration costs expensed (50,889) (109,132) (107,424) (143,970) (60,633) (131,188) (75,729) (91,234) (163,324) (46,765)
EBIT(3) 692,640 895,180 395,022 375,985 473,786 293,808 243,156 605,742 300,924 653,338
Net finance (costs)/income (185,114) (129,595) (15,152) (4,557) (658) (826) (3,326) 6,093 22,791 21,802
Net impairment (losses)/reversals (399,271) (180,593) – (23,793) (33,227) (15,808) – (91,530) 129 (65,180)
Profit before income tax 108,254 584,992 379,870 347,635 439,901 277,174 239,830 520,305 323,844 609,960
Income tax expense (147,636) (231,774) (174,148) (171,801) (237,418) (91,572) (106,150) (206,943) (185,972) (197,978)
Net (loss)/profit after tax (39,381) 353,218 205,722 175,834 202,483 185,602 133,680 313,362 137,872 411,982
Significant items 399,271 180,593 – (22,796) 33,227 (41,488) (34,058) (73,396) 3,621 (204,437)
Core Profit 359,890 533,811 205,722 153,038 235,710 144,114 99,622 239,966 141,493 207,545
Dividends paid – ordinary (274,085) (60,308) (53,532) (53,143) (52,663) (52,087) (67,359) (89,415) (89,587) (100,739)
BALANCE SHEET
Total assets 10,342,834 10,762,094 8,421,537 7,102,721 5,702,034 4,370,067 3,077,390 2,005,457 1,833,479 1,802,755
Total cash 910,479 960,166 209,661 488,274 1,047,463 1,263,589 1,288,077 534,928 343,578 477,884
Total debt 4,302,650 4,421,065 4,024,421 2,866,050 1,747,567 929,720 – – – –
Shareholders’ equity 4,709,361 5,025,476 3,421,052 3,208,346 3,017,232 2,798,467 2,593,181 1,593,227 1,389,132 1,340,980
OTHER INFORMATION 2015 2014 2013 2012 2011 2010 2009 2008 2007 2006
Average realised oil and condensate price (US$/bbl) 51.36 97 .79 110 .73 113 .97 116 .09 80 .19 65 .40 100 .10 77 .78 67 .22
Average realised LNG and gas price (US$/mmBtu) 9.44 13 .94 – – – – – – – –
Net annual oil and condensate production (mmbbl) 8.89 7 .93 5 .82 5 .50 5 .76 6 .77 7 .20 7 .71 8 .98 9 .22
Net annual gas production (bcf)(4) 103.84 57 .87 5 .51 5 .27 5 .56 5 .35 5 .52 5 .35 4 .80 5 .13
Total net annual production (mmboe)(5) 29.25 19 .27 6 .74 6 .38 6 .69 7 .66 8 .12 8 .58 9 .78 10 .20
Exploration and evaluation expenditure (US$’000) 275,699 1,246,939 293,985 240,615 144,606 175,980 438,922 257,286 222,391 120,929
Assets in development expenditure (US$’000) 135,211 502,566 1,214,615 1,492,529 1,286,542 1,139,058 – 4,214 37,617 294
Producing assets expenditure (US$’000) 111,830 105,677 152,600 111,498 129,396 41,850 142,325 157,584 57,219 143,367
Operating cash flow (US$’000) 952,739 992,304 366,804 196,226 386,193 346,675 284,099 507,423 326,783 398,978
Operating cash flow per ordinary share (US cents) 62.57 65 .17 27 .39 14 .75 29 .3 26 .5 24 .5 45 .3 29 .2 35 .6
Diluted EPS (after significant items) (US cents) (2.6) 23 .8 15 .3 13 .2 15 .3 14 .1 11 .5 27 .8 12 .2 36 .6
Diluted EPS (before significant items) (US cents) 23.6 32 .5 15 .4 11 .5 17 .9 11 .0 8 .6 21 .4 12 .6 18 .5
Ordinary dividend per share (US cents) 10.0 10 .0 4 .0 4 .0 4 .0 4 .0 4 .0 8 .0 8 .0 8 .0
Special dividend per share (US cents) – 4 .0 – – – – – – – –
Gearing (%)(6) 41.9% 40 .8% 52 .7% 42 .6% 18 .8% – – – – –
Return on average shareholders’ funds (%) 2.2% 8 .4% 6 .2% 5 .6% 7 .0% 6 .9% 6 .4% 21 .0% 10 .1% 34 .9%
Number of issued shares – ordinary (000s) 1,522,693 1,522,693 1,343,361 1,334,757 1,325,155 1,312,888 1,299,562 1,119,841 1,119,841 1,119,841
EXCHANGE RATES
Year end A$ : US$ 0.731 0 .820 0 .895 1 .038 1 .016 1 .016 0 .897 0 .693 0 .791 0 .791
Average A$ : US$ 0.753 0 .903 0 .969 1 .036 1 .032 0 .919 0 .792 0 .868 0 .836 0 .752
(1) Prior year comparatives have been restated where necessary, in order to achieve consistency with current year disclosures .(2) Earnings before interest, tax, depreciation and amortisation, impairment and exploration .(3) Earnings before interest, impairment and tax .(4) Hides gas production for 2008 onwards includes vent gas . Vent gas was not reported prior to 2008 .(5) Gas and LNG volumes for 2014 onwards have been converted to barrels of oil equivalent using an Oil Search specific conversion factor of 5,100 scf = 1 boe, which
represents a weighted average, based on Oil Search’s reserves portfolio, using the actual calorific value of each gas volume at its point of sale . The change to a specific boe conversion factor more closely reflects the energy content of the Company’s gas reserve portfolio compared to the previous conversion factor of 6,000 scf per boe . Note that prior year figures have not been restated . Minor variations to the conversion factors may occur over time .
(6) Net debt / (net debt and shareholders’ funds) .
For
per
sona
l use
onl
y

130
G L O S S A R Y
$, $m, $bnDollars stated in US dollar terms unless otherwise stated .
1CLow estimate of contingent resources .
1H, 2HHalves of the calendar year . 1H (1 January – 30 June), 2H (1 July – 31 December) .
1PProved reserves .
1Q, 2Q, 3Q, 4QQuarters of the calendar year . 1Q (1 January – 31 March), 2Q (1 April – 30 June), 3Q (1 July – 30 September), 4Q (1 October – 31 December) .
2CBest estimate of contingent resources .
2PProved and probable reserves .
Appraisal wellA well drilled to follow up an oil or gas discovery to evaluate its commercial potential .
barrel/bblThe standard unit of measurement for oil and condensate production and sales .
bcf/bscfBillion standard cubic feet, a measure of gas volume .
boeBarrels of oil equivalent – the factor used to convert volumes of different hydrocarbon production to barrels of oil equivalent .
bopdBarrels of oil per day .
BtuBritish thermal units, a measure of thermal energy .
CondensateHydrocarbons which are in the gaseous state under reservoir conditions and which become liquid when temperature or pressure is reduced . A mixture of pentanes and higher hydrocarbons .
Core ProfitNet profit after tax before significant items .
Crude oilLiquid petroleum as it comes out of the ground . Crude oils range from very light (high in gasoline) to very heavy (high in residual oils) . Sour crude is high in sulphur content . Sweet crude is low in sulphur and therefore often more valuable .
Development wellWells designed to produce hydrocarbons from a gas or oil field within a proven productive reservoir defined by exploration or appraisal drilling .
Deviated wellA well whose path has been intentionally diverted at an angle from vertical, often to reach a distant part of the reservoir and increase exposure to producing zones .
EBITEarnings before interest, impairment and tax .
EBITDAXEarnings before interest, tax, depreciation/amortisation, impairment and exploration .
EITIExtractive Industries Transparency Initiative .
FEEDFront end engineering and design . Conceptual design prior to detailed design .
FIDFinal Investment Decision .
GearingNet debt / (net debt and shareholders’ funds) .
GHGGreenhouse gas .
HydrocarbonsSolid, liquid or gas compounds of the elements hydrogen and carbon .
JVJoint venture .
LNGLiquefied natural gas .
LPGLiquid petroleum gas .
LTILong-term incentive .
LTIRLost Time Injury Rate .
MENAMiddle East/North Africa .
mmbblMillion barrels .
mmBtuMillion British thermal units .
For
per
sona
l use
onl
y
OIL SEARCH Annual Report 2015 131
G L O S S A R Y
mmscf/dMillion standard cubic feet per day .
MoUMemorandum of Understanding .
MTPAMillion tonnes per annum (LNG) .
Net debtTotal debt less cash and cash equivalents .
NITCSNational Infrastructure Tax Credit Scheme .
PDLPetroleum Development Licence .
PIOPerformance and Innovation Office .
PJPetajoules – joules are the metric measurement unit for energy – a petajoule is equal to 1 joule x 1015 .
PLPipeline Licence .
PNGPapua New Guinea .
PNG LNG Project operatorExxonMobil PNG Limited, a subsidiary of Exxon Mobil Corporation (ExxonMobil) .
PPAPower Purchase Agreement .
PPFLPetroleum Processing Facilities Licence .
PPLPetroleum Prospecting Licence .
PRLPetroleum Retention Licence .
PSCProduction Sharing Contract .
Seismic surveyA survey used to gain an understanding of rock formations beneath the earth’s surface .
scfStandard cubic feet, a measure of gas volume .
STIShort-term incentive .
tcfTrillion cubic feet, a measure of gas volume .
TRIRTotal Recordable Incident Rate .
TSRTotal Shareholder Return .
Definition of reserves and contingent resources Estimates of reserves and contingent resources are conducted to Society of Petroleum Engineers (SPE) standards on a Proved (1P and 1C) and Proved and Probable (2P and 2C) basis .
Proved reservesProved reserves are the estimated quantities of crude oil, natural gas and natural gas liquids which geological and engineering data demonstrate with reasonable certainty to be recoverable in future years from known reservoirs under existing economic and operating conditions . Proved reserves are limited to those quantities of oil and gas which can be expected, with little doubt, to be recoverable commercially at current prices and costs, under existing regulatory practices and with existing conventional equipment and operating methods . Proved (1P) reserves are probabilistically calculated reserves having a 90 per cent confidence level (P90); such reserves have a 90 per cent likelihood of being equalled or exceeded .
Probable reservesProbable reserves are those reserves which geological and engineering data demonstrate to be potentially recoverable, but where some element of risk or insufficient data prevent classification as proven . Probable reserves are calculated by subtracting proven reserves from those probabilistically calculated reserves having a 50 per cent confidence level (P50) . Therefore, “Proved plus Probable” (2P) reserves are defined as those reserves which have a 50 per cent likelihood of being equalled or exceeded .
Contingent resourcesThe Company’s technically recoverable resources for its discovered but uncommercialised gas fields are classified as contingent resources . 2C denotes the best estimate of contingent resources .
Conversion Factors
1 mmscf LNG Approximately 1 .10 – 1 .14 billion Btu*
1 tonne LNG Approximately 52 mmBtu
1 boe Approximately 5,100 standard cubic feet (6,000 scf = 1 boe up to and including 2013)
Note: Minor variations in conversion factors may occur over time, due to changes in gas composition .
* Conversion factors used for forecasting purposes only .
For
per
sona
l use
onl
y
132
C O R P O R A T E D I R E C T O R Y
REGISTERED OFFICEOil Search (PNG) Limited Ground Floor, Harbourside East Building Stanley Esplanade National Capital District Port Moresby Papua New Guinea
PO Box 842 Port Moresby NCD 121 Papua New Guinea
Telephone: +675 322 5599 Facsimile: +675 322 5566
AUSTRALIAN OFFICEPapuan Oil Search Limited 1 Bligh Street Sydney NSW 2000 Australia
GPO Box 2442 Sydney NSW 2001 Australia
Telephone: +61 2 8207 8400 Facsimile: +61 2 8207 8500
YEMEN OFFICEOil Search (ROY) Limited Haddah Street Haddah Residential Complex B6 Penthouse Sana’a Republic of Yemen
Telephone: +967 1 423 440/441/422 Facsimile: +967 1 410 314
DUBAI OFFICEOil Search (Middle Eastern) Limited Al Saqr Business Tower Level 8, Office 802 Sheikh Zayed Road Dubai United Arab Emirates
Telephone: +971 4 331 4884 Facsimile: +971 4 331 1610
TUNISIA OFFICEOil Search (Tunisia) Limited Immeuble Regency – Bloc A Appt 401 Rue du Lac Leman Les Berges du Lac, 1053 Tunis Tunisia
Telephone: +216 71 860 532 Facsimile: +216 71 960 473
IRAQ OFFICESOil Search (Iraq) Limited
Erbil OfficeShirin Room Level 1, Divan Hotel Gulan Street Erbil, Kurdistan Iraq
Telephone: +964 53 328 2214 Facsimile: +61 2 8103 2037
Sulaymaniyah OfficeGrand Millennium Hotel Bakhtiary Sulaymaniyah, Kurdistan Iraq
Telephone: +964 (0) 780 194 6668 Facsimile: +61 2 8103 2037
For
per
sona
l use
onl
y

A B O U T O I L S E A R C H
Oil Search was established in Papua New Guinea (PNG) in 1929. More than 98%
of its assets are in PNG, where it operates all of the country’s producing oil fields,
holds an extensive appraisal and exploration portfolio and has a 29% interest
in the PNG LNG Project, operated by ExxonMobil PNG Limited. This world-class
liquefied natural gas (LNG) development, which came on-stream in 2014,
has transformed Oil Search into a regionally significant oil and gas producer
with a long-term, low cost, high quality LNG revenue stream. The Company also
holds a 23% interest in the proposed Papua LNG Project, operated by Total SA,
which has the potential to become PNG’s next major LNG development.
Oil Search has a clear strategy to drive future growth. This is focused on appraisal and
exploration activities in PNG to prove up further gas to support potential PNG LNG
Project expansion and the proposed Papua LNG Project which, once on-stream, have
the potential to double Oil Search’s production. These projects are among the most
competitive proposed new LNG developments in the world.
Oil Search is listed on the Australian and Port Moresby stock exchanges (OSH)
and its ADRs trade on the US Over The Counter market (OISHY).
This report has been printed using Pacesetter Satin and Pacesetter Laser . Pacesetter Satin is an FSC® Mix Certified paper, which ensures that all virgin pulp is derived from well-managed forests and controlled sources . It contains elemental chlorine free bleached pulp and is manufactured by an ISO 14001 certified mill . Pacesetter Laser is made from elemental chlorine free bleached pulp which is sourced from “farmed trees” and other sustainably managed sources . It is manufactured by an ISO 14001 certified mill .
Designed and produced by Helicopter Creative | www .helicoptercreative .com .au
7807_oilsearch_AR14_COV_FA.indd 5-6 18/03/15 9:48 AM
For
per
sona
l use
onl
y

www. o i l s e a r c h . c om
For
per
sona
l use
onl
y