Embed Size (px)
Citation preview

Stroke QUERI ReviewJanuary 26, 2011
Linda Williams, MDDawn Bravata, MD
Glenn Graham, MD, PhDTeresa Damush, PhD
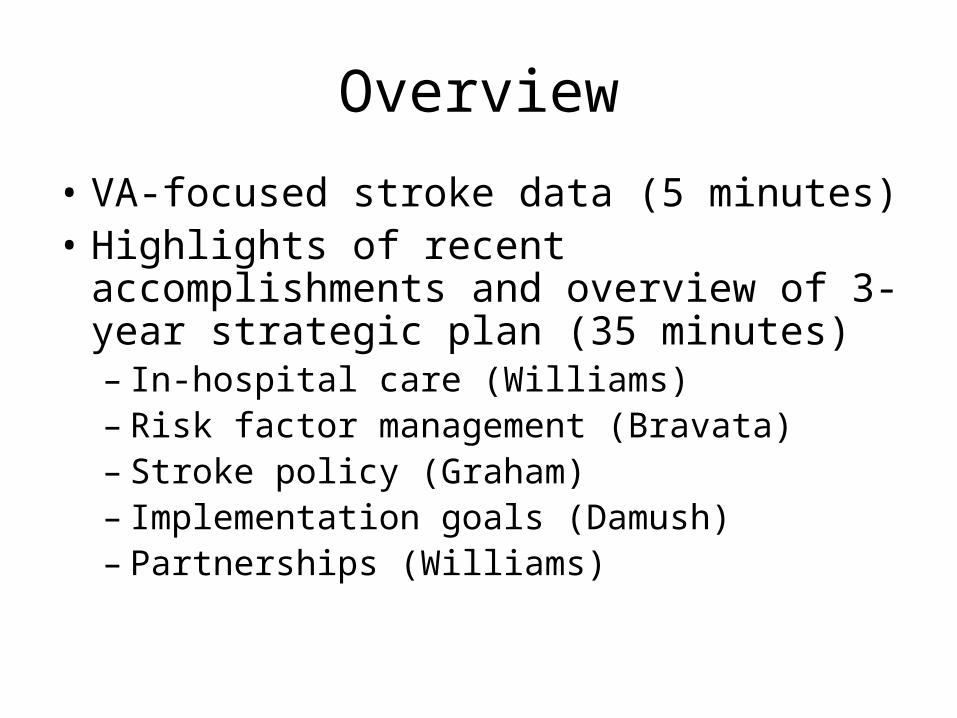
Overview
• VA-focused stroke data (5 minutes)• Highlights of recent accomplishments and
overview of 3-year strategic plan (35 minutes)– In-hospital care (Williams)– Risk factor management (Bravata)– Stroke policy (Graham)– Implementation goals (Damush)– Partnerships (Williams)

VA Stroke Performance• Stroke-specific performance indicators:
• None• FIM (functional) screening of inpatients with stroke,
amputation, or spinal cord injury transitioned to a quality indicator without benchmark in FY08
• Stroke-relevant performance indicators:• Outpatient:
• BP, lipids, DM, smoking; none reported in stroke cohort• Inpatient:
• VTE prophylaxis (IPEC measure, stroke not included in high risk group that makes up the denominator)
• Smoking cessation counseling (not reported for stroke patients specifically)
• Stroke QUERI is the primary advocate promoting effective measurement and active improvement projects that are advancing VA stroke care

VA Stroke Data
• Acute ischemic stroke is a common condition in VA with approximately:– 6,000 veterans annually with primary discharge
diagnosis of stroke• This does not include post-operative strokes, strokes
occurring with other primary conditions (e.g. MI), non-VA hospitalizations, or TIA diagnoses
– 5,000 veterans with admission or ED visit for TIA– 60,00 veterans with an outpatient stroke-related
encounter in FY09– Stroke incidence and prevalence rates in
veterans are unknown

VA Stroke Outcomes and Cost
• In FY07 OQP national VA ischemic stroke cohort:• In-hospital mortality: 4%• 6-month mortality: 8%• 6-month readmission (VA only): 27%
• In FY05, the total VA cost of acute stroke treatment was $315M, with cost per veteran of 3.4x the average VA healthcare cost

Hospital Care
Rehab Acute Treatment
Stroke QUERI Works Across the Continuum of Care
Primary PreventionIn-hospital Management
Recovery and Secondary Prevention
• Hypertension control
•Identification of high-risk patients
•Developing systems to measure in-hospital stroke care quality
• Implementation of System Redesign-based interventions to improve in-hospital care
• Rehabilitation structure and outcome models
• Telerehabilitation interventions
• Self-management of vascular risk factors
Cross-cutting work:• Quality measurement/OQP Stroke Special Project• Policy decision support/Data for outcomes measurement
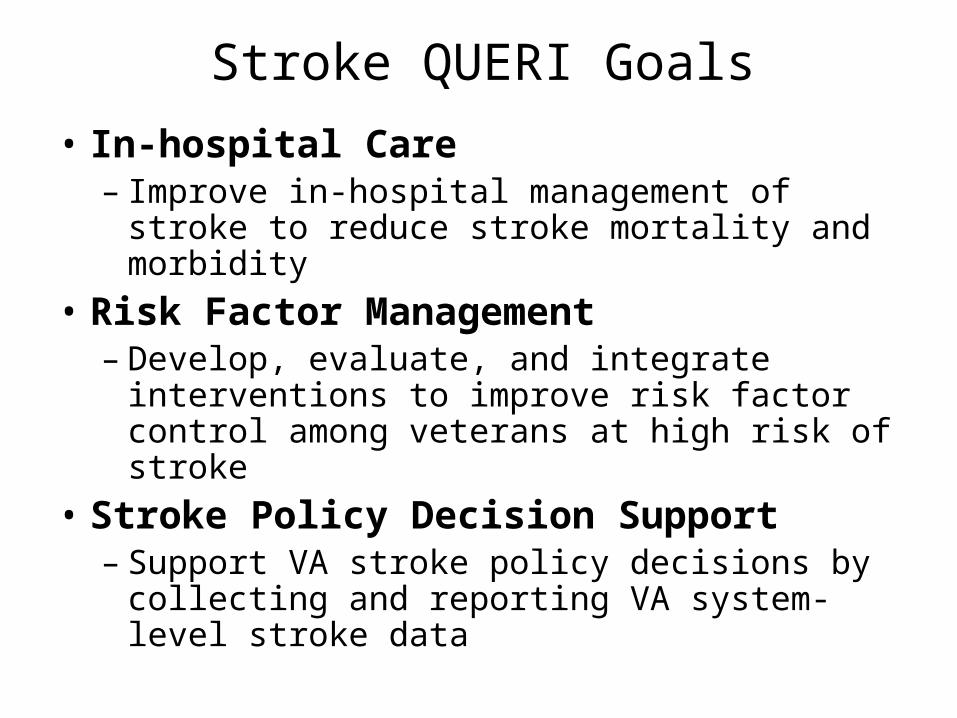
Stroke QUERI Goals
• In-hospital Care– Improve in-hospital management of stroke to
reduce stroke mortality and morbidity
• Risk Factor Management– Develop, evaluate, and integrate interventions
to improve risk factor control among veterans at high risk of stroke
• Stroke Policy Decision Support– Support VA stroke policy decisions by
collecting and reporting VA system-level stroke data

In-hospital Care Goal:
Improve in-hospital management of stroke to reduce stroke
mortality and morbidity

In-hospital care: Quality Measurement
OQP Stroke Special Project: • Objectives
• Assess the quality of inpatient VA stroke care and post-stroke risk factor management
• Feedback performance data to VAMCs• Provide a resource of improvement strategies and tools
• Sample• 5000 veterans admitted to a VA facility with discharge diagnosis
of ischemic stroke, FY07• 100% of veterans at small volume centers (≤55 admissions)• 80% of veterans at high volume centers (>55 admissions)
• Chart review and feedback• Chart review based on electronic medical records only (not
paper) by EPRP abstractors• VAMCs provided opportunity to review and correct inpatient data

OQP Project: 14 Inpatient Processes of Care
Early Hospitalization• Dysphagia screening before oral
intake• NIH Stroke scale completed• Thrombolysis (tPA) given
In-Hospital Period• Antithrombotic therapy, HD2• VTE prophylaxis• Early ambulation• Fall risk assessment (Morse Scale)• Pressure ulcer risk assessment
(Braden scale)• Rehab consultation/FIM results
Hospital Discharge• Antithrombotic therapy, D/C• Lipid management• Atrial fibrillation management • Smoking cessation counseling• Stroke education
Joint Commission based indicator (2007)
VA-specific
•Among 131 VAMCs, 129 facilities cared for veterans who were eligible for at least one quality indicator
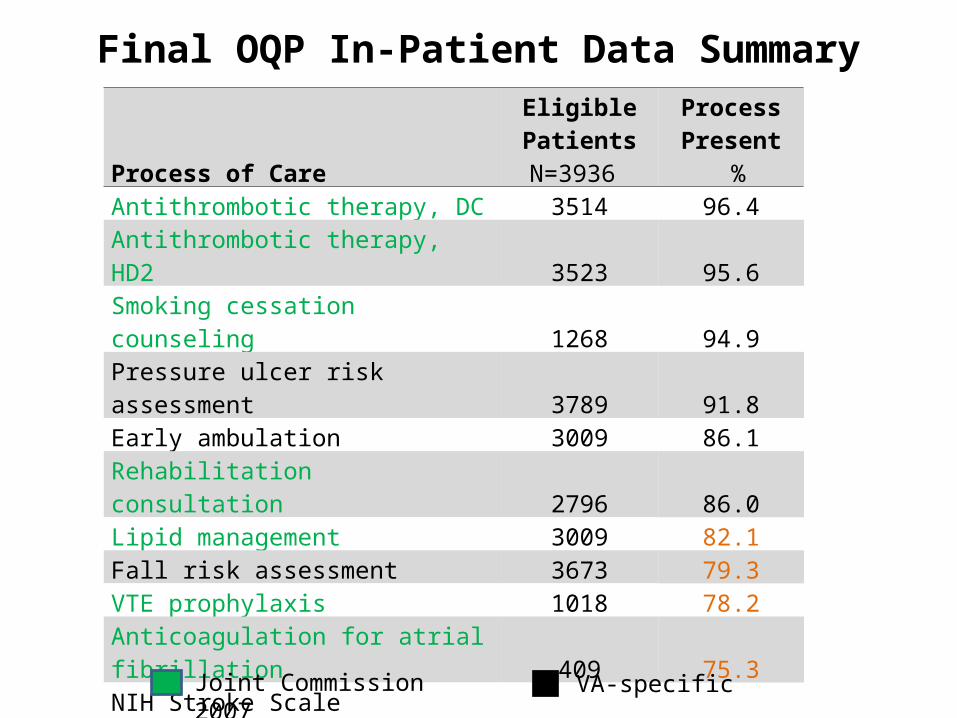
Final OQP In-Patient Data Summary
Process of Care
Eligible PatientsN=3936
Process Present
%Antithrombotic therapy, DC 3514 96.4Antithrombotic therapy, HD2 3523 95.6Smoking cessation counseling 1268 94.9Pressure ulcer risk assessment 3789 91.8Early ambulation 3009 86.1Rehabilitation consultation 2796 86.0Lipid management 3009 82.1Fall risk assessment 3673 79.3VTE prophylaxis 1018 78.2Anticoagulation for atrial fibrillation 409 75.3NIH Stroke Scale documented 3640 27.7Dysphagia screening 3591 23.4Stroke education 2524 18.1Thrombolysis (tPA) given 227 8.4
Joint Commission 2007 VA-specific

In-hospital care: Quality measurement
• Intentionally working in two distinct areas of quality measurement development:– Using existing data resources
• What do we have available that can support improved stroke care now?
– Developing a stroke-specific decision support system
• Can we develop and implement a robust system to support acute stroke care decision making and also collect data to facilitate ongoing quality of care assessments?

In-hospital care: Quality measurement accomplishments
• VistA-based quality indicators (Chumbler RRP PI)• Anticoagulation for atrial fibrillation• Lipid lowering medication at discharge• VTE prophylaxis (by hospital day 2 in non-ambulatory
patients)
• Iterative construction of algorithms, partnership with VISN 11 VERC/CACs
• Our methodology to collect non-pharmacologic VTE interventions in use by VISN 11
• Numerators and denominators compared to chart abstraction are promising– Kappas are .70 to .90– Ongoing work to further define VTE denominator

In-hospital care: Quality measurement plans
• VistA quality indicators next steps: – Planned RRP/SDP to implement at other
facilities, evaluate ease of implementation and accuracy, develop standard reports
– Discussions with IPEC regarding collecting the VTE indicator for stroke patients
– Dissemination to other interested staff/facilities via SQUINT network

In-hospital care: Quality measurement accomplishments
• Stroke Quality Improvement Decision Support System (SQUIDSS): Kent/Anderson PIs
– Designed to interface with CPRS to collect relevant data, prompt evidence-based decisions, and document important processes of care related to providing acute stroke evaluation and treatment
– Completed end-user evaluations of mock-ups, usability assessments
– Programming ongoing, plan to beta-test in Houston ED in 2011

16

17

In-hospital care: Quality measurement plans
• SQUIDSS next steps:• Complete version 1.0• Working with Dr. Tyndall, OHI, others to plan
next development cycle (SDP) for FY12• Interface SQUIDSS with EDIS 2.0 in several
EDs• Technical feasibility• Test data collection from multiple facilities• Improve product via additional user input

In-hospital care: QI accomplishments
• Stroke Toolkit developed as part of the OQP project– Tools linked to each of the 14 indicators– Disseminated as part of National Report in 2009– Over 12,000 hits in FY10
• Stroke Quality Improvement Network– Developed with PCS Neurology, also at time of OQP
National Report in 2009– Monthly calls for any VA clinician interested in
improving stroke care– Dr. Graham and Dr. Jane Anderson, RNP, PhD co-
lead– Ongoing RRP to evaluate effectiveness of SQUINT
group and the Toolkit
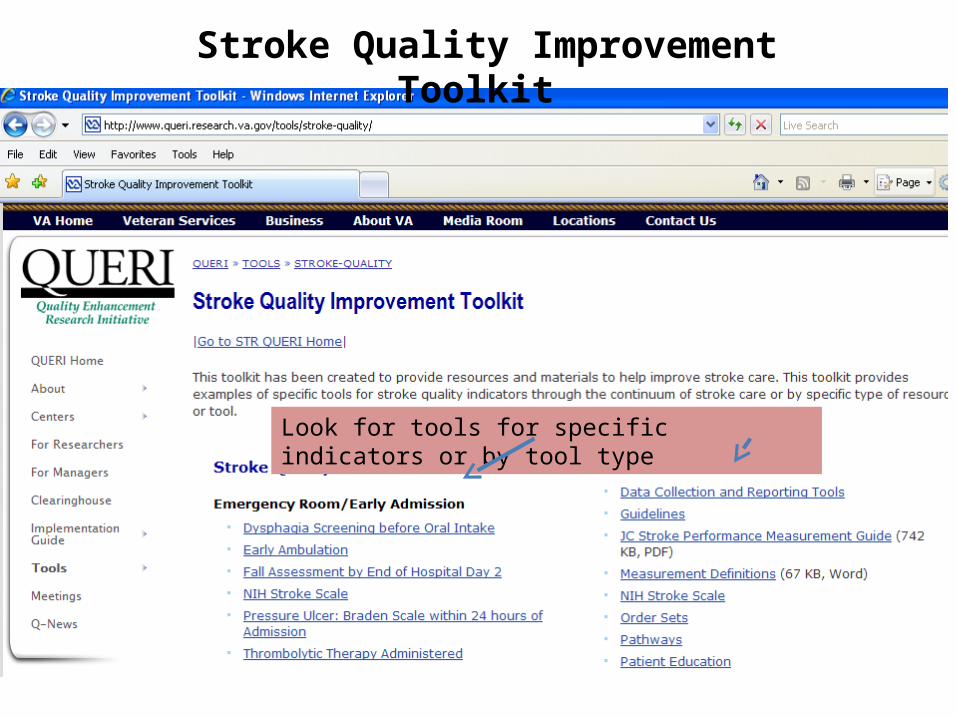
Stroke Quality Improvement Toolkit
Look for tools for specific indicators or by tool type

In-hospital care: QI accomplishments
• System Redesign-based interventions– Developed SR training program with VISN 11
VERC, delivered in a collaborative setting with follow-up coaching
– Worked with 7 VISN 11 facilities to improve 2 inpatient stroke indicators
• Dysphagia screening before oral intake• Discharge on lipid lowering medication
– Achieved improvements over 6 months in both indicators and in spread of SR techniques
• Dysphagia improved 26% to 48%• Lipid lowering medications improved 83% to 87%
– Median of 4 rapid improvement cycles per facility and 3 facilities spread SR methods to other improvement issues

In-hospital care: QI accomplishments
• Dysphagia-focused interventions– Redesign of nurse-based intake screener
• Shorter, improved screener as part of standardized nurse admission template
– Pilot project to train and implement nurse screening in the Emergency Department
• Developed and tested nurse training module including bedside water swallow testing
• Developed CPRS dysphagia reminder template• Houston ED showed significant improvement over
time in dysphagia screening rates
In-hospital care: QI accomplishments
• VA Stroke Task Force collaboration• Based on OQP results and ED survey of stroke care,
VA assembled a multidisciplinary team to make recommendations about improving acute stroke care• ED, Neurology, Primary Care, Nursing, Allied Health,
Operations (Dr. Gary Tyndall, Chair)• Recommendations in four areas:
• Templates/measures (Williams/Anderson)• Facility requirements (Graham)• Consent• Education (Daggett)
• Active planning for 2011 National VA Acute Stroke meeting

In-hospital care: QI Plans
• System Redesign focused interventions: INSPIRE/RE-INSPIRE– Completing baseline interviews and in-
hospital QI data collection at 12 sites– Randomize sites to SR-based collaborative
vs. data feedback alone in late April 2011– 6 month intervention and 12 months of data
collection, complete evaluation in 2013– RE-INSPIRE in-depth context interviews and
site assessments to begin in May 2011

In-hospital care: QI Plans
• Dysphagia screening– Training tools developed in RRP planned to
add to Stroke Toolkit, disseminate via SQUINT, INSPIRE. VA Stroke Task Force
– Planning larger implementation roll-out to further integrate screening with formal SLP evaluation and refine screening tool
Vascular Risk Factor Goal:
Develop, evaluate, and integrate interventions to improve risk
factor control among veterans at high risk of stroke
Veterans at high risk of stroke
High risk groups include veterans with:• Recent stroke or transient ischemic attack (TIA)• Multiple poorly controlled stroke risk factors
– Includes activities aimed at both primary and secondary prevention
Accomplishments and Strategic Plan for: A. Identifying patients at high risk of strokeB. Evaluating risk factor management qualityC. Stroke risk factors: QI interventions

A. Identifying High Risk Patients: Risk of First Stroke
Accomplishments• Cheng RRP: used VistA data to build and test
Framingham risk calculator
Plans• Continue to improve tool to identify veterans at risk of
stroke by including data readily available within VA but that were not included in Framingham models
• Implement this tool in future intervention studies that seek to reduce the risk of stroke (e.g., the Cross-QUERI collaborative project)

A. Identifying High Risk Patients:Risk of Recurrent Stroke
Accomplishments• Examination of national VA data over past 3 years
demonstrates relatively constant number of TIA admissions and post-TIA event rates
– 5135 veterans with TIA (FY09)– VA data only: 15% had a stroke in the first 90-days post-TIA– VA data only: 29% had any recurrent vascular event or died in
first 90-days post-TIA– wide variation in event rates across VAMCs: 12.5% to 48.2%
among the highest volume facilities
Plans • RRP FY10-11 to assess practice patterns and outcomes after
TIA• VA-Medicare study to accurately describe the recurrent event
rate among veterans with stroke

B. Evaluate Risk Factor Control for Veterans with Stroke and TIA
Accomplishments• OQP data used to evaluate risk factor management
among veterans with stroke and TIA – Most veterans have multiple co-existing vascular risk
factors– Opportunities exist to improve post-stroke risk factor
control

National OQP Outpatient Data SummaryVeterans with follow-up within 6 months post-stroke
Process of Care
Eligible Patients
Process Present
%
Blood pressure measured 2031 98.1
INR measured 271 86.3
Hemoglobin A1c measured 641 68.6
LDL measured 1426 58.1
BP measured and meets goal 2031 55.4
Hemoglobin A1c measured and meets goal 641 46.6
INR measured and meets goal 271 43.2
LDL measured and meets goal 1426 35.0

B. Evaluate Risk Factor Control for Veterans with Stroke and TIA
Plans• Ongoing analysis of OQP data for veterans with stroke
seeks to:– Identify facility characteristics/policies that are
associated with either very good or very poor risk factor quality
– Identify any potential age-, race-, or geographic- disparities in risk factor management
• Cheng RRP is examining gaps in TIA care nationwide to target for future implementation projects
• Ongoing evaluation of group visits for veterans with poorly controlled risk factors post-stroke/TIA
• Explore the possibility of having EPRP risk factor control data reported for patients with stroke and TIA

C. Stroke Risk Factors: QI interventionsAccomplishments• Hypertension
– Series of projects focused on HTN improvement (Dr. Bosworth)
– Lessons learned:• Patient-focused intervention component is necessary for ongoing
improvement in BP control• Behavior change for BP is relevant to other vascular RF
• Behavioral interventions after stroke or TIA– Several projects testing self-management interventions for
behavior change (Drs. Damush, Anderson)– Lessons learned:
• Immediate post-stroke period has benefits and challenges to behavior change
• Tailoring of standardized programs is key: physical, cognitive, situational elements post-stroke

C. Stroke Risk Factors: QI interventions
• Interventions in veterans with stroke and TIA:– Conduct the submitted SDP to improve care and outcomes
for veterans with TIA at high volume centers using a remote multidisciplinary team to provide guideline concordant care
– Develop a SDP to improve risk factor management for patients with recent stroke exploring the question of whether to use existing VA risk factor management programs or a stroke-specific program
• Interventions in veterans with multiple risk factors:– Continue to seek approvals for the Cross-QUERI
collaborative program to implement a stepped care intervention for veterans with multiple poorly controlled vascular risk factors

Stroke Policy Goal:
Support VA stroke policy decisions by collecting and reporting VA
system-level stroke data
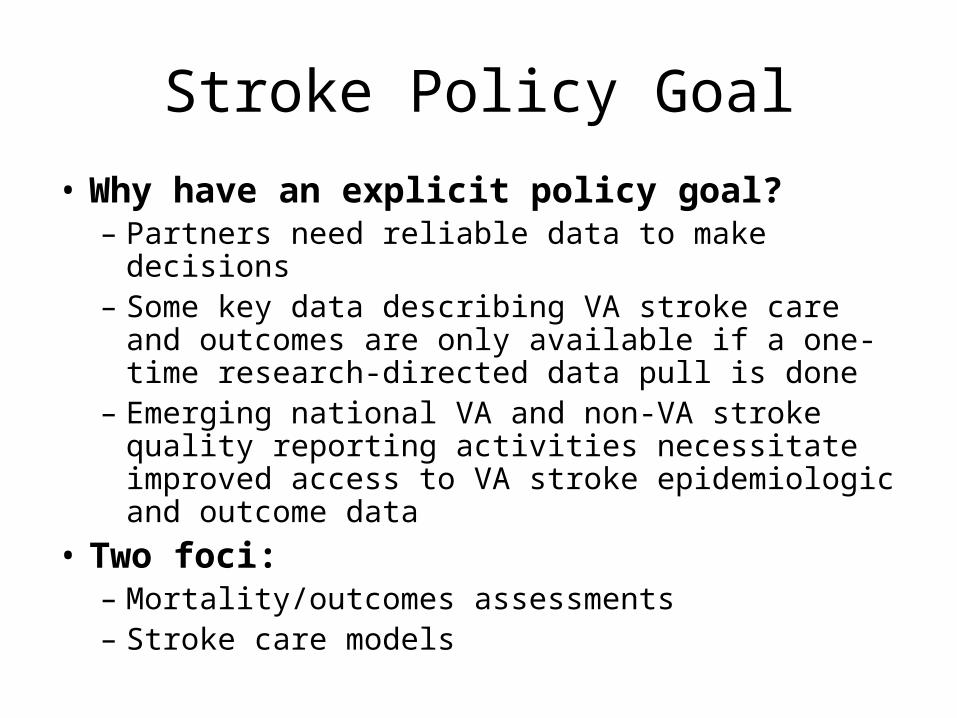
Stroke Policy Goal
• Why have an explicit policy goal?– Partners need reliable data to make decisions– Some key data describing VA stroke care and
outcomes are only available if a one-time research-directed data pull is done
– Emerging national VA and non-VA stroke quality reporting activities necessitate improved access to VA stroke epidemiologic and outcome data
• Two foci:– Mortality/outcomes assessments– Stroke care models

Policy: Stroke Mortality Assessment Accomplishments
• VA risk-adjusted stroke mortality data not available• CMS has proposed two national hospital-level stroke
quality indicators:• Adjusted 30-day mortality rate• Adjusted 30-day readmission rate
• QUERI impact on these discussions to date include:– Risk adjusted mortality is lower for veterans admitted to a
VAMC than nationally reported stroke mortality (OQP)– Risk adjusted readmission rates are as high or higher
among veterans than other nationally reported data (OQP)– Stroke severity explains nearly all of the adjusted mortality
risk at the patient level– VA has one of the only national datasets capable of
evaluating the impact of stroke severity on risk-adjusted facility level mortality reports; Stroke QUERI is part of the ongoing CMS discussion around this issue
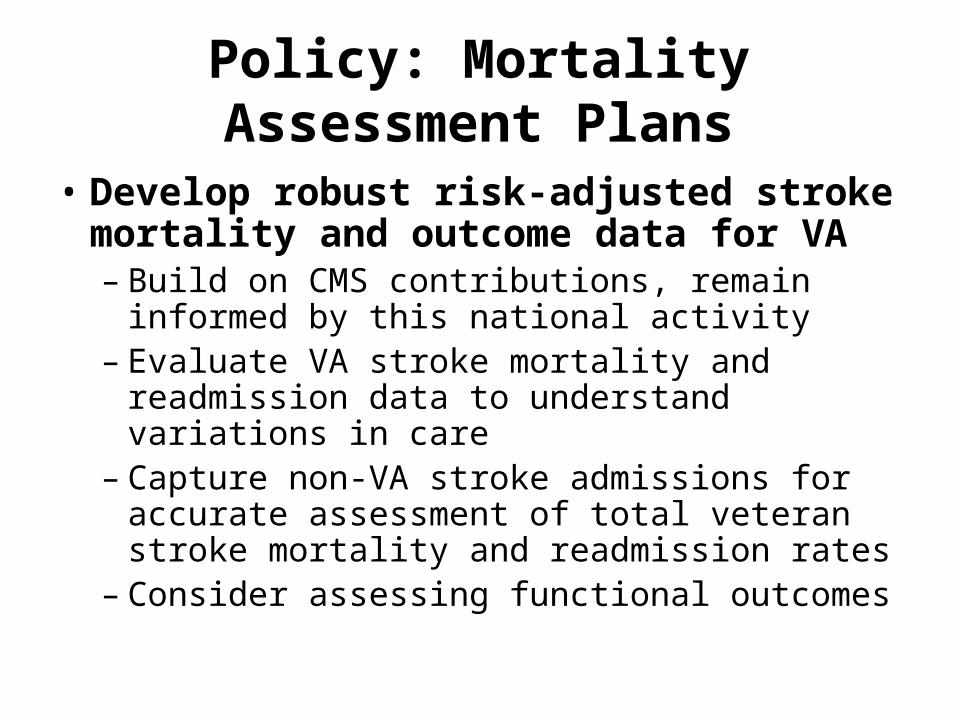
Policy: Mortality Assessment Plans
• Develop robust risk-adjusted stroke mortality and outcome data for VA– Build on CMS contributions, remain informed
by this national activity– Evaluate VA stroke mortality and readmission
data to understand variations in care– Capture non-VA stroke admissions for
accurate assessment of total veteran stroke mortality and readmission rates
– Consider assessing functional outcomes

Policy: Mortality Assessment Plans
• Identify optimal methods for risk adjusting stroke outcomes– Explore OQP data (chart review “ideal” data)– Develop new dataset to include VA and non-VA
stroke admissions (administrative data), planned RRP
• Optimize accuracy of case ascertainment• Produce facility-level risk-adjusted in-hospital and 30-
day mortality and readmission reports– Explore methods for estimating stroke severity in
administrative datasets• Inform decisions about methods and timing of
enhancing stroke documentation in VA

Policy: Stroke Models Accomplishments
• System Dynamics modeling– Allows clinicians, researchers, and policy-
makers to compare the relative effectiveness of different interventions
– In 2009 we engaged researchers and policy makers in populating and using the VA model
– Results informed strategic planning activities• Interest in TIA• Interest in combinations of risk factors
– Focus on combinations of risk factors yields almost twofold reduction in cumulative 5-year stroke incidence compared to HTN alone

VA Stroke System Dynamics Model
- Total strokes & TIAs- Fatal strokes- DALYs- Medical costs
OUTCOMES IN VA USER POPN
NON-EVENT VA USER POPN POST-STROKE
VA USER POPN
Rankin 4 & 5
1st stroke
Fatal
Survived
Recurrentstroke
Fatal
Survived
Primaryprevention efforts (HTN & AF mgmt)
Stroke rehabeffort
Stroke acute care efforts:-Timely to hospital- Effective tPA use-DVT prophylaxis
-Dysphagia screening Post strokeCEA & 2o prevention
efforts
Rankin 2 & 3
Rankin 0 & 1
by age group & subsets ofsmokers, hypertensives, atrial fib, diabetes, CVD;and interventions targetingparticular subsets Post-1st stroke
Rankin score
Post-recurrent strokechange in Rankin
Post TIA CEA & 2o
prevention efforts
POST-TIA VA USER POPN
1st TIA
Recurrent TIA
1st TIAs inNew VA Users
1st Strokes in New VA Users
Undx Dx
TIA diagnosis
effort

Policy: Rehabilitation Models Accomplishments
• Rehabilitation cost (Vogel, PI):
– Adjusted acute rehab bed costs are 25% lower than subacute bed costs, while delivering higher quality care
– Assistive device costs are lower in VA than in Medicare, but device provision varies widely
• Rehabilitation structure (Chumbler, PI):
– Telerehabilitation may be associated with improved outcomes compared to usual care

Policy: Stroke Models Plans
• Systems Dynamics Modeling– Provide better estimates of cost-quality-
outcome associations– Explore partnership with VISN 11 VERC to
make interactive tool so operational partners can explore various interventions and their projected impact on stroke outcomes
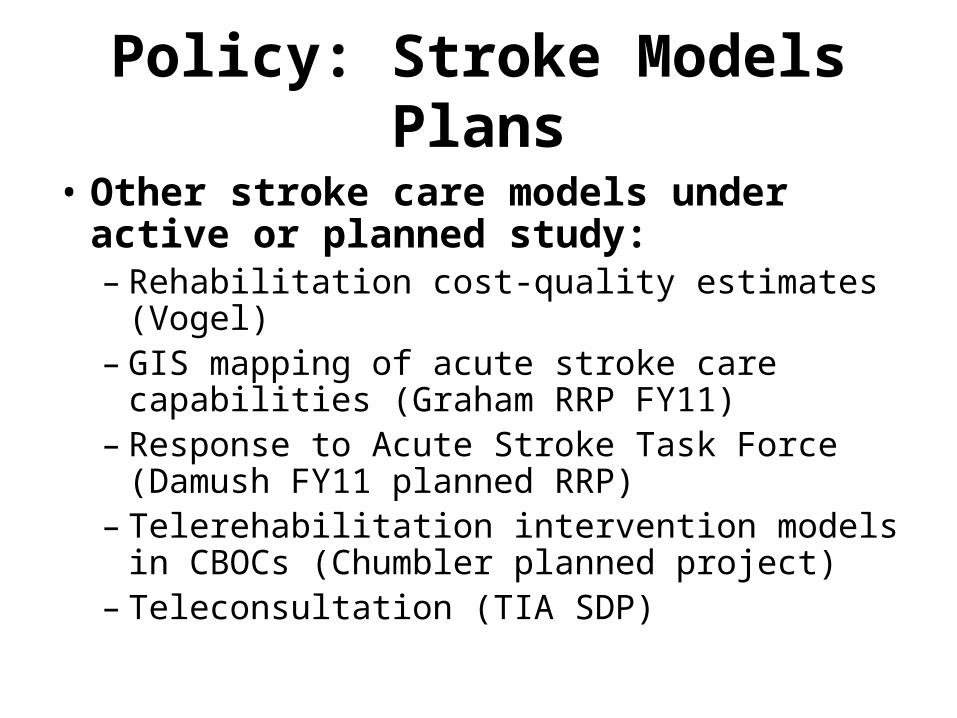
Policy: Stroke Models Plans
• Other stroke care models under active or planned study:– Rehabilitation cost-quality estimates (Vogel)– GIS mapping of acute stroke care capabilities
(Graham RRP FY11)– Response to Acute Stroke Task Force
(Damush FY11 planned RRP)– Telerehabilitation intervention models in
CBOCs (Chumbler planned project)– Teleconsultation (TIA SDP)

Implementation Science:
Stroke QUERI Challenges, Activities, Contributions
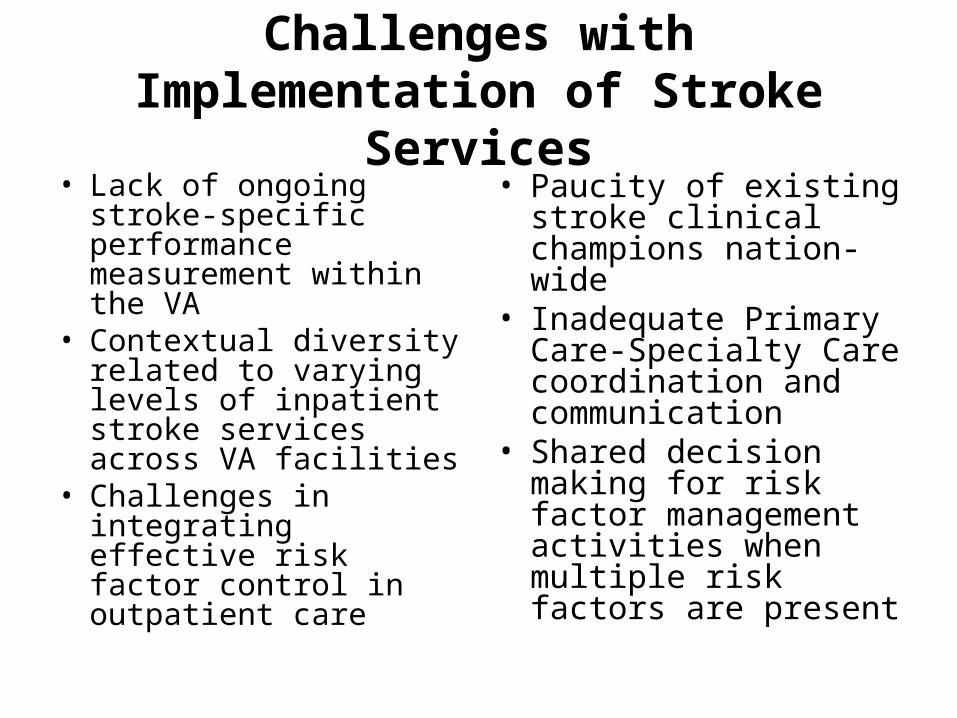
Challenges with Implementation of Stroke Services
• Lack of ongoing stroke-specific performance measurement within the VA
• Contextual diversity related to varying levels of inpatient stroke services across VA facilities
• Challenges in integrating effective risk factor control in outpatient care
• Paucity of existing stroke clinical champions nation-wide
• Inadequate Primary Care-Specialty Care coordination and communication
• Shared decision making for risk factor management activities when multiple risk factors are present
In-Hospital Activities: Integrating and evaluating System Redesign strategies in VA Collaboratives
• External Facilitation – Coaches/ Engineers• Internal Facilitation – Local Champion• Vicarious Learning across sites• Team Dynamics within a site• Contextual diversity for delivery of stroke services• Measure stroke care processes for feedback• Qualitative codes to operationally define and measure
implementation concepts

Risk Factor Management Activities: Patient-focused implementation
• Active Implementation in varying contexts to improve control of cardiovascular risk factors – Hypertension Improve (Bosworth)– Primary prevention – TOOLS (Damush)- Secondary prevention– Group Visits (Cheng)– Secondary prevention– Stop Clinic (Anderson) – Secondary prevention
Policy Implementation: Evaluation of Operations Activities
• Qualitative assessments of national stroke-related initiatives– Evaluation of how OQP Stroke Special Study data
were received and used by the field (INSPIRE)– Planned study of response to Acute Stroke Task
Force recommendations at various types of VAMCs

Implementation Models in Use
• REINSPIRE – CFIR• INSPIRE – FAB
Framework• STARS – Precede-
Procede Model• Drs. Sundar (SMILE
BP) and Friedberg (ASA) – Prochaska Transtheoretical Model of Stages of Change
• SQUIDSS – Knowledge Management Model and Process Model of Program Change
• Stroke Self-Management- Social Cognitive Theory
• Hypertension Improve– Determinants of effective
innovation implementation in organizations
– Social Cognitive Theory

Implementation Science Contributions
• Locally adapted existing secondary risk factor management tools based on provider and patient preferences– TOOLS study (Damush et al)– Methodology and theoretical framework for intervention
mapping to locally adapt tools, Implementation Science 2010, Dec 15;5:97.
• Hypertension Improve – Adopting effective management program for veterans at risk for cardiovascular event in primary care.– Protocol Methodology and organizational change
framework Implementation Science 2010; Jul 16;5:54

Implementation Science Contributions
• Formative evaluation of veterans, with stroke who smoke, preferences for smoking cessation efforts –Zillich, Hudmon, Damush, Topics in Stroke Rehabilitation, 2010
• Implementation of patient self-management in VHA (Damush, Anderson, Bosworth, Cheng, JGIM, 2010 – National QUERI Meeting Workshop proceedings)
• AHA International Stroke Conference Feb 2010 invited symposium on behavioral change strategies for secondary stroke prevention (Damush)

Partnership Activities• Explicit engagement of key partners via:
– Executive Committee representation– Intentional discussion/interviews
• Key operational partners:– OQP (inpatient and outpatient quality measurement)– Neurology and ED/PCS (inpatient QI, policy)– VA Acute Stroke Task Force (inpatient QI, policy)– VISN 11 VERC (inpatient QI)
• Developing partners:– Primary Care (Ambulatory Care Sensitive Condition work
with the Office of Productivity, Efficiency, and Staffing; exploring PACT collaborations on risk factor implementation projects)
– IPEC (policy, mortality/outcomes reporting)– Specialty Care Transformation (in-hospital care, policy,
telehealth projects)
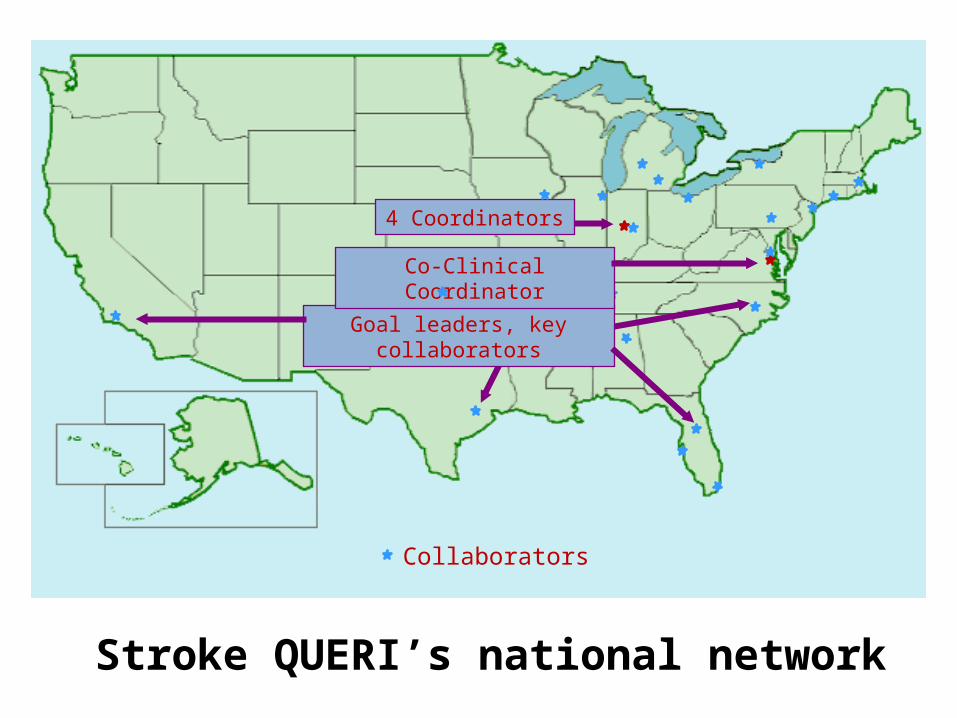
Collaborators
Stroke QUERI’s national network
4 Coordinators
Goal leaders, key collaborators
Co-Clinical Coordinator

Hospital Care
Rehab Acute Treatment
VA Stroke Care in 2014
Primary PreventionIn-hospital Management
Recovery and Secondary Prevention
• High risk patients identified in primary care panels
• National Cross-QUERI project ongoing
• In-hospital stroke care quality measurement in multiple VAMCs
• High volume facilities engaged in active stroke QI projects
• Vascular risk factor data reported in veterans with stroke/TIA
• TIA rapid assessment and treatment program
• Telerehabilitation intervention evaluations
Data to inform VA policy:• Risk-adjusted stroke mortality and readmission reports• Projections comparing relative effectiveness of interventions; cost and quality data