Embed Size (px)
Citation preview

45 Computed Tomography–Based Evaluation of Cerebrovascular DiseaseIMANUEL DZIALOWSKI, VOLKER PUETZ, RÜDIGER VON KUMMER
This chapter studies the clinical efficacy of computed tomography (CT) in patients with acute ischemic or
hemorrhagic stroke. We will discuss noncontrast CT (NCT) as well as CT angiography (CTA) and CT perfusion imag-ing (CTP) for acute stroke. Because of the differing prog-nosis between anterior and posterior circulation ischemic strokes, we will separately discuss CT imaging for these. In theory, CT, like magnetic resonance imaging (MRI), can be clinically effective in patients with acute stroke on five different levels: (1) technical capacity, (2) diagnostic accu-racy, (3) diagnostic impact, (4) therapeutic impact, and (5) patient outcome or prognostic impact.1
We will focus on the use of CT in the acute stroke setting. Whenever applicable, we will compare CT with MRI—the other important acute stroke imaging modality discussed in a separate chapter.
Noncontrast CTFeasibility and Technical Capacity
A potential advantage of CT over MRI is its wide avail-ability and excellent feasibility.2 Even with older genera-tion scanners a plain CT scan can be performed within minutes. Performing a CTA or CTP requires a spiral CT scanner, the application of contrast media, and process-ing afterward. Each examination will usually only require an extra 5 minutes’ scan time. Recently, CT scanners with up to 320 detector rows that cover a tissue volume of 16 cm thickness have become available.3 These scan-ners can examine the whole brain in less than 1 second and can repeatedly image the entire cerebral circulation, allowing time-resolved images of the brain vessels and whole brain CTP.
Detection of Infarct Core
Acute brain ischemia below the cerebral blood flow (CBF) threshold of 20 to 30 mL/100 g/min leads to loss of neurologic function, cell membrane dysfunction with cel-lular edema (so-called cytotoxic edema), and subsequent shrinkage of the extracellular space. This type of edema is potentially reversible and can be visualized by MRI with diffusion-weighted imaging (DWI). Acute severe brain ischemia with CBF values below 10 mL/100 g/min causes
870
immediate net water uptake into gray matter.4,5 This so-called ionic edema6 characterizes brain tissue destined for tissue necrosis, even with early reperfusion.7 Only this net uptake of water into brain tissue causes a decrease in x-ray attenuation on CT.4 The decrease in x-ray attenua-tion is linearly and indirectly correlated to the amount of water uptake. A 1% increase in tissue water causes a decrease of approximately 2 Hounsfield units (HU) in x-ray attenuation that can be detected by the human eye.8 CT is thus a very specific method for depicting irrevers-ible brain infarction.9
Early Signs of Infarction on NCT
Early changes visible on head CT during ischemia are often summarized as “early ischemic changes” (EIC). We should, however, distinguish between at least three dif-ferent kinds of EIC with different pathophysiologic and diagnostic relevance: 1. Reduced x-ray attenuation of gray matter is the com-
mon cause of CT signs such as “loss of the insular or cortical ribbon,” “obscuration of the lentiform nucleus,” reduction in gray matter–white matter con-trast, or “hypodensity.” These phenomena are all con-sequences of ionic cerebral edema and thus represent ischemic damage (infarction) on CT (Fig. 45-1B).
2. Isolated brain tissue swelling without reduced x-ray attenuation (Fig. 45-2): this phenomenon has been extensively studied recently and is likely caused by compensatory vasodilation with an increase of cere-bral blood volume (CBV).10-12 It seems to represent tis-sue at risk of infarction that might be salvaged with reperfusion (ischemic penumbra). It can be observed in 10% to 20% of ischemic brain regions.10 The pres-ence of isolated cortical swelling on CT—even if very extensive—should NOT keep stroke neurologists from attempting urgent recanalization but should rather be taken as a challenge. It is therefore a mistake to call brain tissue swelling per se an “early CT sign of infarc-tion” and to lump this phenomenon together with is chemic x-ray hypoattenuation.
3. The hyperdense artery sign is highly specific for the presence of an intraarterial thrombus,13 but its detec-tion depends on the thrombus’ hematocrit value, which

COMPUTED TOMOGRAPHY–BASED EVALUATION OF CEREBROVASCULAR DISEASE 871
A B
C D
Figure 45-1 Acute middle cerebral artery (MCA) infarction in a patient with occlusion of the internal carotid artery (ICA) and MCA. A, Hyperdense MCA sign (arrow) on baseline noncontrast CT (NCT) scan. B, NCT with hypoattenuation of the right lentiform nucleus, head of caudate nucleus, and insula (arrows). C, Intracranial CT angiography (CTA) source image showing right proximal MCA occlusion (arrow). D, Extracranial CTA maximal intensity projection of the right common carotid artery, external carotid artery, and ICA showing proximal ICA occlusion.
determines its x-ray attenuation.14 The term EIC should not be used for this sign because arterial obstruction by an intraluminal thrombus can be fully compensated for by collateral flow. An arterial obstruction is not a “sign” of brain ischemia but may cause brain ischemia (see Fig. 45-1A).
Diagnostic Accuracy
In the first 6 hours after ischemic stroke, two of three stroke patients will develop ionic edema that can be detected by NCT.15 Poor sensitivity of NCT is often blamed for the fact that ischemic (i.e., ionic) edema cannot be diagnosed early in each and every patient with ischemic stroke. However, stroke symptoms occur at CBF reduc-tion to 20 to 30 mL/100 g/min, which is well above the accepted threshold for occurrence of ionic edema. We can thus assume that around one third of ischemic stroke patients have not yet developed relevant ionic edema (i.e., no irreversible damage) and may have an excellent prog-nosis if reperfusion is achieved. X-ray hypoattenuation on early NCT, however, is subtle and hard to detect without training (see Fig. 45-1B). Interrater reliability for ischemic tissue hypoattenuation varies between a kappa value of 0.4 and 0.6.16 The “sensitivity” of NCT for evidence of infarction on follow-up imaging varies between 20% and
87% depending on image quality, experience, and train-ing.15 Using systematic scores like the Alberta Stroke Pro-gram Early CT Score (ASPECTS) facilitates detection of x-ray hypoattenuation and improves reliability and sensi-tivity.17 Once a hypoattenuating area has been detected, it is highly predictive of subsequent infarction.9
Diagnostic Impact
The diagnostic impact of stroke imaging refers to the proportion of patients in whom the specific diagnosis of stroke type relies on imaging. NCT has a huge diag-nostic impact simply by differentiating ischemic from hemorrhagic stroke, enabling a specific therapy like thrombolysis to be administered. In addition, the extent of hypoattenuation on NCT is an important positive pre-dictor of thrombolysis-induced brain hemorrhage, which is the most feared complication of thrombolysis.18-20 MR DWI is highly sensitive for ischemic brain tissue, even above the CBF level of the penumbra and indicates brain tissue at high risk, if not already irreversibly injured, whereas hypoattenuation on NCT depicts irreversible tis-sue damage with high specificity. The detection of areas with high signal intensity on DWI may allow assessment of the pattern of affected brain territories and the cause

DIAGNOSTIC STUDIES872
B CA
ED F
Figure 45-2 A 79-year-old man seen with acute aphasia and right-sided hemiplegia. Baseline noncontrast CT (NCT) shows hemispheric cortical swelling (arrows) without hypoattenuation (A, D). CT angiography demonstrates dilated cortical vessels in these regions (B, E). The patient had marked spontaneous clinical improvement. Follow-up NCT (C, F) 3 days later revealed minor infarcts in the internal borderzone (arrowheads) and regressive cortical swelling.
of stroke early on and signals an increased risk of stroke in patients with transient ischemic attacks (TIAs).21
Therapeutic Impact
In acute ischemic stroke, thrombolysis with intravenous (IV) recombinant tissue plasminogen activator (rt-PA) within 3 hours of stroke onset can increase the propor-tion of nondisabled patients by an absolute 13%.22 The therapeutic time window of 3 hours may be extended in the future because treatment with IV rt-PA has recently shown a beneficial effect, that is, between 3 and 4.5 hours from symptom onset with an absolute effect size for improved functional outcome of 7%.23 The National Institute of Neurological Disorders and Stroke (NINDS) rt-PA Study Group was able to prove benefit for throm-bolysis simply by using NCT to identify ischemic stroke patients. The European Cooperative Acute Stroke Study (ECASS) investigators used NCT to additionally exclude patients with extended ischemic edema.24 These stud-ies show that NCT is sufficient to identify a group of
patients in whom IV thrombolytics have a moderate ben-eficial effect within 4.5 hours of symptom onset. Inter-estingly, none of the completed, large, phase III trials of IV thrombolysis selected patients on the basis of a visible arterial occlusion—the target pathology for immediate recanalizing therapies—and did not check for recanali-zation by treatment. Only the Prolyse in Acute Cerebral Thromboembolism (PROACT) studies investigated the therapeutic impact of thrombolysis in patients selected by angiographically proven middle cerebral artery (MCA) occlusion and slight edema on NCT.25,26 Intraarterial infu-sion of prourokinase within 6 hours of symptom onset achieved an absolute effect size of 15%.
Prognostic Impact
The impact of CT on the functional outcome of stroke patients is the most important level of clinical efficacy. As shown above, NCT enables thrombolysis in ischemic stroke patients and thereby reduces long-term disabil-ity. Moreover, the information on the extent of x-ray

COMPUTED TOMOGRAPHY–BASED EVALUATION OF CEREBROVASCULAR DISEASE 873
hypoattenuation on NCT is prognostically relevant. There is good evidence that patients with extended hypoattenu-ation (infarction) on NCT have a poorer natural history and less chance to benefit from thrombolysis.18,20,27
In summary, brain tissue imaging by NCT ignores the changes above the CBF threshold of irreversible injury, with the exception of brain tissue swelling with-out hypoattenuation due to compensatory vasodilation. NCT has a rather low sensitivity for identifying brain ischemia but a high specificity for identifying irrevers-ible ischemic injury. One may conclude that mainly patients who have small volumes of hypoattenuating brain tissue on NCT but severe symptoms will benefit from reperfusion therapy. In fact, several studies have demonstrated that the response to thrombolytic ther-apy is associated with the extent of hypoattenuation on early CT.20
CTAFeasibility and Technical Capacity
The advent of “helical” or “spiral” acquisition has enabled CT scanners to acquire data very rapidly. With this tech-nique, data acquisition occurs continuously while the gan-try table moves the patient through the gantry, so a volume of interest can be scanned in a relatively short time.
A CTA study of the neck and head requires about 5 minutes’ examination time and the application of contrast media. Usually, an IV bolus of about 100 mL of an iodin-ated, nonionic and isoosmolar or low osmolar contrast agent is given, and image acquisition will be initiated when the contrast reaches the aortic arch or common carotid artery. In our experience, feasibility of CTA is excellent and images are diagnostic in almost every patient. Imme-diately after data acquisition, CTA source images can be viewed, and large vessel occlusions can be diagnosed instantaneously (see Fig. 45-1C). Within a few minutes, 3D reformats can be generated, enabling detection of periph-eral vessel and other abnormalities (see Fig. 45-1D).
The utility of CTA is tremendous, and it has already replaced conventional catheter angiography in many situ-ations. Recent technical development enables CTA with time-resolution (4D-CTA) and digital subtraction of the bone.
Diagnostic Accuracy
Intracranial Disease
The need for rapid decision making makes CTA an ideal technique in the detection of large vessel intracranial arterial stenosis or occlusion (see Fig. 45-1). For intra-cranial atherosclerotic stenosis, noninvasive imaging modalities should identify lesions with high sensitivity and specificity as compared with the gold standard of digital subtraction angiography (DSA). In the prospec-tive Stroke Outcomes and Neuroimaging of Intracranial Atherosclerosis (SONIA) Trial, both transcranial Doppler (TCD) ultrasound and magnetic resonance angiography (MRA) noninvasively identified 50% to 99% of intracranial large vessel stenoses with a substantial negative predic-tive value of about 90%.28 However, the positive predic-tive value (PPV) was only 36% for TCD and 59% for MRA. Thus the authors concluded that abnormal findings on TCD or MRA require a confirmatory test such as angiogra-phy to reliably identify stenosis.
Compared with MRA, CTA has increased sensitivity (70% versus 98%, respectively) and PPV (65% versus 93%, respectively) for revealing intracranial arterial stenosis.29 Similar results were found in a recent study, where the sensitivity of CTA to detect 50% or greater intracranial stenosis was 97.1% and the specificity was 99.5%.30 Thus, CTA seems sufficient to detect or rule out significant intracranial atherosclerotic stenosis. We have recently used CTA to detect intracranial nonocclusive thrombi (iNOT; Fig. 45-3) in patients seen with acute ischemic stroke and TIAs.31 These thrombi seem to be rare (2.7% of patients in our study) but indicate stroke patients with increased risk of clinical deterioration during the hospi-tal course.
CTA also has excellent accuracy in detecting intracra-nial arterial occlusion. Lev et al32 studied 44 consecutive patients with acute ischemic stroke who underwent CTA of the circle of Willis within 6 hours of onset of symp-toms. A total of 572 vessels was evaluated, and angio-graphic correlation was available for 224 of these vessels. Sensitivity and specificity of CTA were both 98%, and accuracy was 99%. The mean time for CTA reconstruc-tion was 15 minutes. The results of Lev et al have been confirmed by a study by Nguyen-Huynh et al,30 in which
A B
Figure 45-3 Example of intracranial nonocclusive thrombus (arrows) in the distal right M1 segment (A) and left M1 segment (B).

DIAGNOSTIC STUDIES874
both the sensitivity and specificity of CTA to detect large artery intracranial occlusion were 100%.
As an additional prognostic factor and for the pur-pose of immediate treatment decisions, the intracranial thrombus extent can be estimated with CTA. Patients’ prognoses and responses to therapy can be judged by a 10-point clot burden score (CBS; Fig. 45-4). CBS is a simple measure of the location and extent of intracranial thrombus.33 Patients with a higher thrombus burden (i.e., lower CBS scores) had higher baseline Institutes of Health Stroke Scale (NIHSS) scores and more extended infarc-tions compared with patients with less thrombus burden. Moreover, CBS was an independent predictor of indepen-dent functional outcomes and death in this study. These results have been confirmed in a recent study by Tan et al.34 Their study also demonstrated a correlation of CBS with the perfusion defects on CTP maps and CTA source images and confirmed the hypothesis that a higher throm-bus burden is associated with lower recanalization rates with IV thrombolysis.34,35
In summary, CTA is an ideal tool for the rapid and accurate detection of intracranial stenosis and occlusion of major intracranial arteries and may help to differenti-ate patients who will benefit from specific recanalization techniques.
Extracranial Carotid Artery Disease
Cerebral angiography has been the diagnostic procedure of choice for the quantification of extracranial carotid artery stenosis. Although generally safe, angiography is still associated with a 0.5% to 5% rate of stroke as a com-plication when used in routine clinical practice.36,37 With the advent of ultrafast helical CT imaging, the complica-tion is avoided, and CTA is being used with increasing
1
1 1
1
2 2
2
Figure 45-4 A 10-point clot burden score (CBS): 1 or 2 points each (as indicated) are subtracted for absent contrast opacification on CT angiography in the infraclinoid internal carotid artery (ICA) (1), supraclinoid ICA (2), proximal M1 segment (2), distal M1 seg-ment (2), M2 branches (1 each) and A1 segment (1). The CBS score applies only to the symptomatic hemisphere.
frequency in the diagnosis of extracranial carotid artery disease. An example of severe right internal carotid ste-nosis is depicted in Fig. 45-5A, on conventional arteriogra-phy, and in Fig. 45-5B, on CTA (axial cuts).
Several studies to date have reported excellent agree-ment between conventional catheter cerebral angiography and CTA. In a comparative study of CTA, conventional angi-ography, and MRA, a strong correlation was found between CTA and angiography (r = 0.987; P < 0.0001) in 128 carotid bifurcations in 64 patients.38 CTA has the additional benefit of providing precise information regarding the surround-ing vascular and bony anatomy, including arterial wall cal-cification that is not depicted by DSA or MRA.
In a prospective study, 40 patients (80 carotid arteries) underwent evaluation by CTA, digital DSA, and Doppler ultrasonography.39 The overall correlation between Dop-pler ultrasonography and DSA was less robust (r = 0.808) than that between CTA and DSA (r = 0.92); CTA provided superb correlation in the detection of mild stenosis (0% to 29%), stenosis greater than 50%, and carotid occlusion and had sensitivities and specificities exceeding 0.90. CTA performed less well in the detection of 70% to 99% steno-sis and had a sensitivity of 0.73 (axial source images) and a PPV of only 0.62 (negative predictive value, 0.95). The relatively poorer degree of discrimination on CTA in this study between moderate (50% to 69%) and severe (70% to 99%) stenosis is an important limiting factor to con-sider in the use of this technology. It is hoped that further prospective data acquisition with simultaneous 320-slice technology will shed additional light on this issue.
Detection of Infarct Core
In addition to providing information on the vessel status, CTA may also predict the fate of ischemic brain paren-chyma; that is, it improves early detection of ischemic infarction.40 Viewing the CTA source images at a low contrast and window level (e.g., 40/40 HU) downstream to a large vessel occlusion, CTA will show an area of diminished tissue contrast enhancement (Figs. 45-6 and 45-7). This area likely represents severely hypoperfused brain tissue that will be irreversibly damaged without reperfusion. In comparison with NCT, the sensitivity and accuracy in prediction of final infarct extension can be improved.41,42 CTA source images closely correlated to MR DWI sequences.43
Diagnostic Impact
The diagnostic impact of CTA is probably still underes-timated. Within minutes, CTA reliably diagnoses arterial occlusions and stenoses from the aortic arch to the distal intracranial arterial segments. Compared with MRI, CTA is sensitive for calcified plaques and can thus elucidate the underlying stroke etiology in many cases. It was already shown that patients with MCA occlusion have a lesser chance to benefit from IV thrombolytics if the ipsilat-eral carotid is obstructed.44 A systematic study of arterial pathology with CTA may enable more specific treatments of arterial occlusions. In addition, CTA can distinguish patients seen with seizures and postictal paresis (Todd’s paralysis) from those with true ischemic hemiparesis and early seizures by demonstrating arterial occlusion.45

COMPUTED TOMOGRAPHY–BASED EVALUATION OF CEREBROVASCULAR DISEASE 875
A
C
B
D
Figure 45-5 Conventional angiographic depiction (A, B) of right internal carotid artery occlusion in a patient seen with an acute ischemic right middle cerebral artery distribution infarction. CT angiography source images (C, D) confirm right ICA occlusion (arrow).
A B C
Figure 45-6 Noncontrast CT (NCT) (A) and CT angiography (CTA) source images (B) of a patient 1 hour after acute aphasia and right hemiparesis. NCT shows subtle hypoattenuation of left basal ganglia, insula, and anterior cerebral artery (ACA) territory. CTA clearly shows contrast hypoattenuation in the complete middle cerebral artery and ACA territory caused by an internal carotid artery occlusion. Follow- up CT (C) shows the resulting infarction.

DIAGNOSTIC STUDIES876
NCT CTA CTA-SI
TTP CBF CBV DWI d 1
Figure 45-7 Noncontrast CT (NCT), CT angiography (CTA), and CT perfusion imaging (CTA-SI) of an 82-year-old patient 2 hours after aphasia and mild right hemiparesis. NCT and CTA results are normal without evidence of intracranial arterial occlusion (upper two rows). Time-to-peak (TTP) and cerebral blood flow (CBF) parameter maps reveal hypoperfusion in the left insula and corona radiata without reduc-tion of cerebral blood volume (CBV, lower two rows). After thrombolysis with recombinant tissue plasminogen activator (rt-PA), follow-up MRI-diffusion-weighted imaging (DWI) shows a tiny infarction in the left insula.
Therapeutic Impact
The usefulness of CTA for therapeutic decision making has not yet been prospectively studied. There is evidence from secondary analyses of randomized trials that patients with a small core of infarction on NCT (or possibly CTA source images) and an intracranial large vessel occlusion on CTA might be ideal candidates for recanalization, even beyond the accepted time window.46 This hypothesis is currently being studied in at least two large, randomized controlled trials.47
Many centers use CTA to select acute ischemic stroke patients for intraarterial interventions. The PROACT II study demonstrated that patients with an MCA occlusion
benefit from intraarterial thrombolysis up to 6 hours after onset.25 Another approach for patients with known intra-cranial occlusions is the intravenous–intraarterial bridg-ing concept. The Interventional Management of Stroke III trial currently investigates whether this strategy is supe-rior to standard IV thrombolysis.47 Potentially, patients with proximal arterial occlusion (e.g., carotid T occlu-sion) and/or large thrombus burden may benefit from additional intraarterial therapy, whereas patients with minor thrombus burden (e.g., MCA M2 branch occlusion) may have no additional benefit. Estimation of thrombus burden with a CBS could be a simple and readily avail-able tool to help in deciding whether a patient will benefit from aggressive treatment paradigms.

COMPUTED TOMOGRAPHY–BASED EVALUATION OF CEREBROVASCULAR DISEASE 877
CTA might also be useful for excluding patients with-out visible arterial occlusion from thrombolysis. Angio-graphic studies have shown that no arterial occlusion can be detected in one third of patients seen within 6 hours of onset.48 A systematic comparison of the effi-cacy of thrombolysis in acute ischemic stroke patients with arterial occlusion versus those without arterial occlusion, however, has not yet been performed.
CT Perfusion ImagingTechnical Capacity and Feasibility
With the development of helical CT scanning technology, it is now possible to track a bolus of IV contrast material as it passes through the brain. The measurement tech-nique for CBF has its theoretical basis in the central vol-ume principle,49 which relates CBF (mL/100g/min), CBV (mL/100 g), and mean transit time (MTT; seconds) by the following equation:
CBF = CBV
MTT
It is assumed that a linear relationship exists between the CT enhancement and the concentration of contrast material within brain tissue and arteries. After IV administration of a bolus of iodinated contrast agent, measurements are made of the arterial enhancement curve, Ca(t), the supplying artery, and the tissue enhancement curve, Q(t), for a region of the central parenchyma. For the calculation of MTT, a mathematical process of deconvolution is applied to the functions Ca(t) and Q(t) to determine an impulse function, R(t), which would be the theoretical tissue enhancement curve obtained from a rapidly injected bolus of contrast material. The MTT is calculated from the following formula:
MTT = area underneath R(t)height of R(t) plateau
CBV is calculated from Q(t) and Ca(t), the two param-eters measured directly during the CTP study:
CBV =area underneath Q(t)area underneath Ca(t)
Although this technique is rapidly evolving, difficul-ties remain and include patient motion artifacts, partial averaging effects, effects of drawing regions of interest (ROIs) directly over arterial vessels, and the proper selec-tion of the arterial input vessel to yield the most accurate results. Another still significant limitation is the incom-plete coverage of the volume of brain tissue scanned dur-ing contrast passage. Depending on the CT manufacturer, only about 2 to 4 cm (craniocaudal extension) of brain tissue can be covered. This volume is usually placed at the level of the basal ganglia so that perfusion of all major supratentorial vascular territories can be captured. New-generation CT scanners with up to 320 detector rows will provide whole-brain perfusion images.
Attempts at quantitative validation of this technology in humans through comparison with other techniques, such as xenon-CT, are ongoing.50,51
Diagnostic Accuracy
CTP parameter maps improve diagnostic accuracy for tis-sue at risk and irreversibly damaged brain tissue.42,50,52,53 For example, Lin et al studied 28 patients with multi-modal CT seen with territorial infarction within 3 hours of symptom onset and assessed 280 ASPECTS regions for a relative CBV reduction. They found a 91% sensitiv-ity and 100% specificity for predicting a DWI lesion on follow-up imaging.52 Parsons et al42 showed that CBV best predicts final infarct extent in patients with major reper-fusion, whereas CBF and MTT were the best predictor of final infarct size in patients without reperfusion. In some patients with MCA branch or other distal intracranial occlusions not recognized on CTA, time-to-peak (TTP) or MTT parameter maps are helpful in identifying the pres-ence and site of occlusion (Fig. 45-7).
Diagnostic Impact
CTP facilitates and improves identification of the infarct core and has the potential to identify tissue at risk. Acute multimodal CT imaging is limited in detecting small ischemic lesions. In patients with normal NCT, CTA, and CTP findings but persistent neurologic deficit, immedi-ate MR DWI will usually show one or multiple small ischemic lesions, for example, in the brainstem or one that is bihemispheric. In patients without a DWI lesion an ischemic cause becomes very unlikely.
Therapeutic and Prognostic Impact
The therapeutic impact of CTP is still unclear. Acute stroke patients presenting within 4 to 5 hours of symp-tom onset should not be excluded from thrombolysis on the grounds of CTP imaging findings. In patients present-ing beyond the accepted time window for thrombolysis, CTP might help to identify the tissue at risk, thereby facil-itating decision making on late recanalization strategies.
Similar to NCT, CTP is prognostically relevant because it identifies the core of infarction. Patients with an exten-sive CBV lesion have reduced chances of achieving an independent functional outcome.42,54
Limitations of a Multimodal CT Protocol
Before initiation of a multimodal CT examination, the fol-lowing contraindications should be kept in mind: known renal insufficiency, contrast media allergy, hyperthyroid-ism, medication with the oral antidiabetic metformin, and pregnancy. Because acute ischemic stroke with the option of thrombolysis is an emergency, waiting for laboratory results such as serum creatinine level should not delay the performance of CT. The risk of developing relevant radiocontrast media nephropathy in acute stroke patients seems to be reasonably low (<0.5%).55,56 In patients taking metformin, the serum creatinine level should be checked at baseline and up to 3 days after the examination so that metformin accumulation with subsequent lactate acidosis is avoided.
Depending on the CT manufacturer, data on the effec-tive radiation dose varies between 5 and 10 mSv. A relevant individual risk of radiation-induced intracranial neoplasm
DIAGNOSTIC STUDIES878
seems only to exist in children.57 Because of the rapidly increasing frequency of CT examinations, however, there is a cumulative risk that should not be neglected.
Posterior Circulation CT ImagingIschemic Stroke
About 20% of cerebrovascular ischemic events involve the posterior circulation.58 Clinical signs and symptoms are frequently less specific compared with anterior cir-culation stroke. Isolated transient loss-of-consciousness or dizziness can be misattributed to vertebrobasilar isch-emia, whereas many cases of true vertebrobasilar isch-emia remain undiagnosed.59 However, similar to anterior circulation stroke, early diagnosis is crucial for initiating systemic thrombolysis or mechanical revascularization procedures. The relevance of acute brain imaging with CT is to reliably rule out intracranial hemorrhaging and to identify patients with basilar artery occlusion. Latter patients have a devastating prognosis: nearly 80% die or are severely disabled if treated conservatively.60
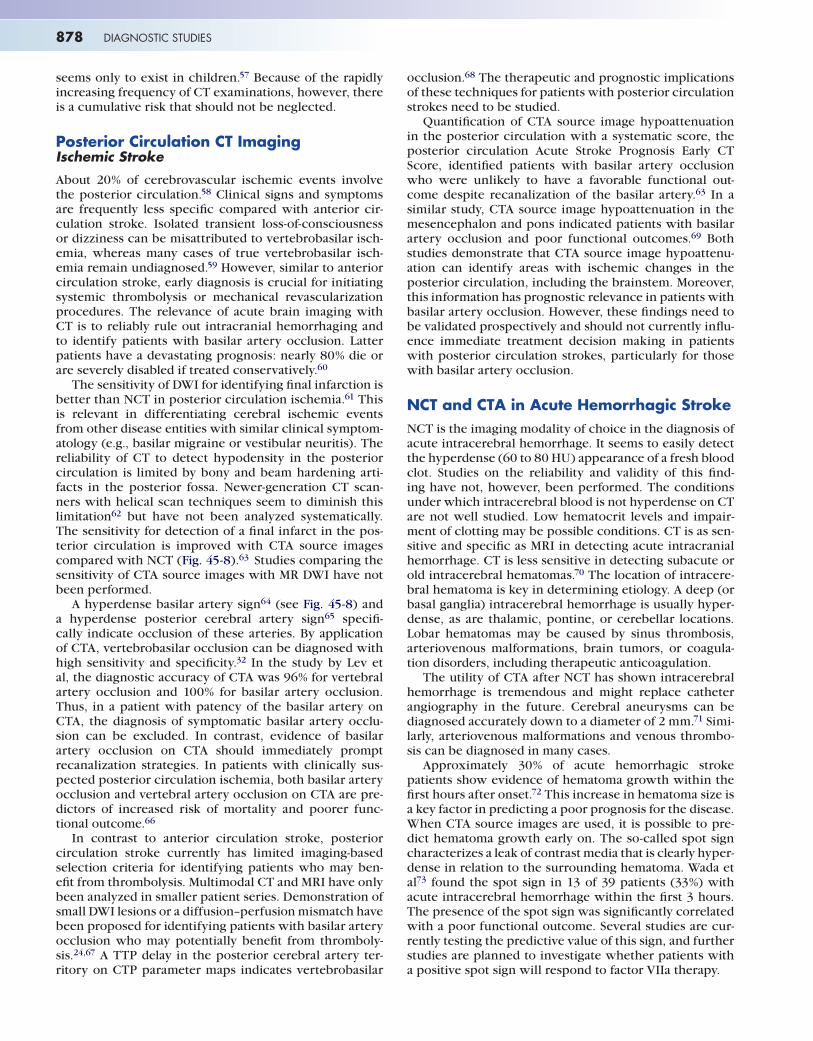
The sensitivity of DWI for identifying final infarction is better than NCT in posterior circulation ischemia.61 This is relevant in differentiating cerebral ischemic events from other disease entities with similar clinical symptom-atology (e.g., basilar migraine or vestibular neuritis). The reliability of CT to detect hypodensity in the posterior circulation is limited by bony and beam hardening arti-facts in the posterior fossa. Newer-generation CT scan-ners with helical scan techniques seem to diminish this limitation62 but have not been analyzed systematically. The sensitivity for detection of a final infarct in the pos-terior circulation is improved with CTA source images compared with NCT (Fig. 45-8).63 Studies comparing the sensitivity of CTA source images with MR DWI have not been performed.
A hyperdense basilar artery sign64 (see Fig. 45-8) and a hyperdense posterior cerebral artery sign65 specifi-cally indicate occlusion of these arteries. By application of CTA, vertebrobasilar occlusion can be diagnosed with high sensitivity and specificity.32 In the study by Lev et al, the diagnostic accuracy of CTA was 96% for vertebral artery occlusion and 100% for basilar artery occlusion. Thus, in a patient with patency of the basilar artery on CTA, the diagnosis of symptomatic basilar artery occlu-sion can be excluded. In contrast, evidence of basilar artery occlusion on CTA should immediately prompt recanalization strategies. In patients with clinically sus-pected posterior circulation ischemia, both basilar artery occlusion and vertebral artery occlusion on CTA are pre-dictors of increased risk of mortality and poorer func-tional outcome.66
In contrast to anterior circulation stroke, posterior circulation stroke currently has limited imaging-based selection criteria for identifying patients who may ben-efit from thrombolysis. Multimodal CT and MRI have only been analyzed in smaller patient series. Demonstration of small DWI lesions or a diffusion–perfusion mismatch have been proposed for identifying patients with basilar artery occlusion who may potentially benefit from thromboly-sis.24,67 A TTP delay in the posterior cerebral artery ter-ritory on CTP parameter maps indicates vertebrobasilar
occlusion.68 The therapeutic and prognostic implications of these techniques for patients with posterior circulation strokes need to be studied.
Quantification of CTA source image hypoattenuation in the posterior circulation with a systematic score, the posterior circulation Acute Stroke Prognosis Early CT Score, identified patients with basilar artery occlusion who were unlikely to have a favorable functional out-come despite recanalization of the basilar artery.63 In a similar study, CTA source image hypoattenuation in the mesencephalon and pons indicated patients with basilar artery occlusion and poor functional outcomes.69 Both studies demonstrate that CTA source image hypoattenu-ation can identify areas with ischemic changes in the posterior circulation, including the brainstem. Moreover, this information has prognostic relevance in patients with basilar artery occlusion. However, these findings need to be validated prospectively and should not currently influ-ence immediate treatment decision making in patients with posterior circulation strokes, particularly for those with basilar artery occlusion.
NCT and CTA in Acute Hemorrhagic StrokeNCT is the imaging modality of choice in the diagnosis of acute intracerebral hemorrhage. It seems to easily detect the hyperdense (60 to 80 HU) appearance of a fresh blood clot. Studies on the reliability and validity of this find-ing have not, however, been performed. The conditions under which intracerebral blood is not hyperdense on CT are not well studied. Low hematocrit levels and impair-ment of clotting may be possible conditions. CT is as sen-sitive and specific as MRI in detecting acute intracranial hemorrhage. CT is less sensitive in detecting subacute or old intracerebral hematomas.70 The location of intracere-bral hematoma is key in determining etiology. A deep (or basal ganglia) intracerebral hemorrhage is usually hyper-dense, as are thalamic, pontine, or cerebellar locations. Lobar hematomas may be caused by sinus thrombosis, arteriovenous malformations, brain tumors, or coagula-tion disorders, including therapeutic anticoagulation.
The utility of CTA after NCT has shown intracerebral hemorrhage is tremendous and might replace catheter angiography in the future. Cerebral aneurysms can be diagnosed accurately down to a diameter of 2 mm.71 Simi-larly, arteriovenous malformations and venous thrombo-sis can be diagnosed in many cases.
Approximately 30% of acute hemorrhagic stroke patients show evidence of hematoma growth within the first hours after onset.72 This increase in hematoma size is a key factor in predicting a poor prognosis for the disease. When CTA source images are used, it is possible to pre-dict hematoma growth early on. The so-called spot sign characterizes a leak of contrast media that is clearly hyper-dense in relation to the surrounding hematoma. Wada et al73 found the spot sign in 13 of 39 patients (33%) with acute intracerebral hemorrhage within the first 3 hours. The presence of the spot sign was significantly correlated with a poor functional outcome. Several studies are cur-rently testing the predictive value of this sign, and further studies are planned to investigate whether patients with a positive spot sign will respond to factor VIIa therapy.

COMPUTED TOMOGRAPHY–BASED EVALUATION OF CEREBROVASCULAR DISEASE 879
Figure 45-8 Noncontrast CT (NCT) (upper row) and CT angiography (CTA) source images (middle row) of a patient with acute basilar artery occlusion 3.5 hours and 4.5 hours after symptom onset, respectively. NCT demonstrates hyperdense basilar artery sign (arrow) but does not reveal early ischemic changes. CTA source images demonstrate hypoattenuation in all posterior circulation territories (posterior circulation Acute Stroke Prognosis Early CT Score [pc-ASPECTS] = 0). The patient was treated with systemic thrombolysis with alteplase. Diffusion-weighted MRI (lower row) performed after thrombolysis (6.5 hours after symptom onset) demonstrates lesions in the same territories (pc-ASPECTS = 0). (Images courtesy of the Seaman Family MR Research Centre, University of Calgary, Canada.)
Acknowledgment
We would like to acknowledge Charles A. Jungreis and Steven Goldstein for their work on the previous edition of this chapter.
REFERENCES 1. Kent DL, Larson EB: Disease, level of impact, and quality of research
methods. Three dimensions of clinical efficacy assessment applied to magnetic resonance imaging, Invest Radiol 27:245–254, 1992.
2. Hand PJ, Wardlaw JM, Rowat AM, et al: Magnetic resonance brain imaging in patients with acute stroke: Feasibility and patient related difficulties, J Neurol Neurosurg Psychiatry 76:1525–1527, 2005.
3. Murayama K, Katada K, Nakane M, et al: Whole-brain perfusion CT performed with a prototype 256-detector row CT system: Initial experience, Radiology 250:202–211, 2009.
4. Schuier FJ, Hossmann KA: Experimental brain infarcts in cats. II. Ischemic brain edema, Stroke 11:593–601, 1980.
5. Todd NV, Picozzi P, Crockard HA, et al: Reperfusion after cerebral ischemia: Influence of duration of ischemia, Stroke 17:460–466, 1986.
6. Simard JM, Kent TA, Chen M, et al: Brain oedema in focal isch-aemia: Molecular pathophysiology and theoretical implications, Lancet Neurol 6:258–268, 2007.
7. Dzialowski I, Klotz E, Goericke S, et al: Ischemic brain tissue water content: CT monitoring during middle cerebral artery occlusion and reperfusion in rats, Radiology 243:720–726, 2007.

DIAGNOSTIC STUDIES880
8. Dzialowski I, Weber J, Doerfler A, et al: Brain tissue water uptake after middle cerebral artery occlusion assessed with CT, J Neuro-imaging 14:42–48, 2004.
9. von Kummer R, Bourquain H, Bastianello S, et al: Early prediction of irreversible brain damage after ischemic stroke at CT, Radiology 219:95–100, 2001.
10. Na DG, Kim EY, Ryoo JW, et al: CT sign of brain swelling with-out concomitant parenchymal hypoattenuation: Comparison with diffusion- and perfusion-weighted MR imaging, Radiology 235:948–992, 2005.
11. Parsons MW, Pepper EM, Bateman GA, et al: Identification of the penumbra and infarct core on hyperacute noncontrast and perfu-sion CT, Neurology 68:730–736, 2007.
12. Butcher KS, Lee SB, Parsons MW, et al: Differential prognosis of iso-lated cortical swelling and hypoattenuation on CT in acute stroke, Stroke 38:941–947, 2007.
13. von Kummer R, Meyding-Lamade U, Forsting M, et al: Sensitivity and prognostic value of early CT in occlusion of the middle cere-bral artery trunk, AJNR Am J Neuroradiol 15:9–15, 1994:discussion 16–18.
14. Kirchhof K, Welzel T, Mecke C, et al: Differentiation of white, mixed, and red thrombi: Value of CT in estimation of the prognosis of thrombolysis phantom study, Radiology 228:126–130, 2003.
15. Wardlaw JM, Mielke O: Early signs of brain infarction at CT: Observer reliability and outcome after thrombolytic treatment—systematic review, Radiology 235:444–453, 2005.
16. Marks MP, Holmgren EB, Fox AJ, et al: Evaluation of early computed tomographic findings in acute ischemic stroke, Stroke 30:389–392, 1999.
17. Barber PA, Demchuk AM, Zhang J, et al: Validity and reliability of a quantitative computed tomography score in predicting outcome of hyperacute stroke before thrombolytic therapy, Lancet 355:1670–1674, 2000.
18. Dzialowski I, Hill MD, Coutts SB, et al: Extent of early ischemic changes on computed tomography (CT) before thrombolysis: Prog-nostic value of the Alberta Stroke Program Early CT Score in ECASS II, Stroke 37:973–978, 2006.
19. Lansberg MG, Albers GW, Wijman CA: Symptomatic intracerebral hemorrhage following thrombolytic therapy for acute ischemic stroke: A review of the risk factors, Cerebrovasc Dis 24:1–10, 2007.
20. von Kummer R, Allen KL, Holle R, et al: Acute stroke: Usefulness of early CT findings before thrombolytic therapy, Radiology 205:327–333, 1997.
21. Coutts SB, Simon JE, Eliasziw M, et al: Triaging transient ischemic attack and minor stroke patients using acute magnetic resonance imaging, Ann Neurol 57:848–854, 2005.
22. Tissue plasminogen activator for acute ischemic stroke: The National Institute of Neurological Disorders and Stroke rt-Pa Stroke Study Group, N Engl J Med 333:1581–1587, 1995.
23. Hacke W, Kaste M, Bluhmki E, et al: Thrombolysis with alteplase 3 to 4.5 hours after acute ischemic stroke, N Engl J Med 359:1317–1329, 2008.
24. Ostrem JL, Saver JL, Alger JR, et al: Acute basilar artery occlu-sion: Diffusion-perfusion MRI characterization of tissue salvage in patients receiving intra-arterial stroke therapies, Stroke 35:e30–e34, 2004.
25. Furlan A, Higashida R, Wechsler L, et al: Intra-arterial prourokinase for acute ischemic stroke. The PROACT II Study: A randomized controlled trial. Prolyse in acute cerebral thromboembolism, JAMA 282:2003–2011, 1999.
26. del Zoppo GJ, Higashida RT, Furlan AJ, et al: PROACT: A phase II randomized trial of recombinant pro-urokinase by direct arterial delivery in acute middle cerebral artery stroke. PROACT investiga-tors. Prolyse in acute cerebral thromboembolism, Stroke 29:4–11, 1998.
27. Hill MD, Buchan AM: Thrombolysis for acute ischemic stroke: Results of the Canadian Alteplase For Stroke Effectiveness Study, CMAJ 172:1307–1312, 2005.
28. Feldmann E, Wilterdink JL, Kosinski A, et al: The stroke outcomes and neuroimaging of intracranial atherosclerosis (SONIA) trial, Neurology 68:2099–2106, 2007.
29. Bash S, Villablanca JP, Jahan R, et al: Intracranial vascular stenosis and occlusive disease: Evaluation with CT angiography, MR angi-ography, and digital subtraction angiography, AJNR Am J Neurora-diol 26:1012–1021, 2005.
30. Nguyen-Huynh MN, Wintermark M, English J, et al: How accurate is CT angiography in evaluating intracranial atherosclerotic disease? Stroke 39:1184–1188, 2008.
31. Puetz V, Dzialowski I, Coutts SB, et al: Frequency and clinical course of stroke and transient ischemic attack patients with intra-cranial nonocclusive thrombus on computed tomographic angiog-raphy, Stroke 40:193–199, 2009.
32. Lev MH, Farkas J, Rodriguez VR, et al: CT angiography in the rapid triage of patients with hyperacute stroke to intraarterial thrombol-ysis: Accuracy in the detection of large vessel thrombus, J Comput Assist Tomogr 25:520–528, 2001.
33. Puetz V, Dzialowski I, Hill MD, et al: Intracranial thrombus extent predicts clinical outcome, final infarct size and hemorrhagic trans-formation in ischemic stroke: The clot burden score, Int J Stroke 3:230–236, 2008.
34. Tan IY, Demchuk AM, Hopyan J, et al: CT angiography clot burden score and collateral score: Correlation with clinical and radiologic outcomes in acute middle cerebral artery infarct, AJNR Am J Neu-roradiol 30:525–531, 2009.
35. Lee KY, Han SW, Kim SH, et al: Early recanalization after intrave-nous administration of recombinant tissue plasminogen activator as assessed by pre- and post-thrombolytic angiography in acute ischemic stroke patients, Stroke 38:192–193, 2007.
36. Mamourian A, Drayer BP: Clinically silent infarcts shown by MR after cerebral angiography, AJNR Am J Neuroradiol 11:1084, 1990.
37. Johnston DC, Chapman KM, Goldstein LB: Low rate of complica-tions of cerebral angiography in routine clinical practice, Neurol-ogy 57:2012–2014, 2001.
38. Sameshima T, Futami S, Morita Y, et al: Clinical usefulness of and problems with three-dimensional CT angiography for the evalua-tion of arteriosclerotic stenosis of the carotid artery: Comparison with conventional angiography, MRA, and ultrasound sonography, Surg Neurol 51:301–308, 1999:discussion 308–309.
39. Anderson GB, Ashforth R, Steinke DE, et al: CT angiography for the detection and characterization of carotid artery bifurcation dis-ease, Stroke 31:2168–2174, 2000.
40. Ezzeddine MA, Lev MH, McDonald CT, et al: CT angiography with whole brain perfused blood volume imaging: Added clinical value in the assessment of acute stroke, Stroke 33:959–966, 2002.
41. Coutts SB, Lev MH, Eliasziw M, et al: Aspects on CTA source images versus unenhanced CT: Added value in predicting final infarct extent and clinical outcome, Stroke 35:2472–2476, 2004.
42. Parsons MW, Pepper EM, Chan V, et al: Perfusion computed tomog-raphy: Prediction of final infarct extent and stroke outcome, Ann Neurol 58:672–679, 2005.
43. Schramm P, Schellinger PD, Klotz E, et al: Comparison of perfusion computed tomography and computed tomography angiography source images with perfusion-weighted imaging and diffusion-weighted imaging in patients with acute stroke of less than 6 hours’ duration, Stroke 35:1652–1658, 2004.
44. Rubiera M, Ribo M, Delgado-Mederos R, et al: Tandem internal carotid artery/middle cerebral artery occlusion: An independent predictor of poor outcome after systemic thrombolysis, Stroke 37:2301–2305, 2006.
45. Sylaja PN, Dzialowski I, Krol A, et al: Role of CT angiography in thrombolysis decision-making for patients with presumed seizure at stroke onset, Stroke 37:915–917, 2006.
46. Hill MD, Rowley HA, Adler F, et al: Selection of acute ischemic stroke patients for intra-arterial thrombolysis with pro-urokinase by using ASPECTS, Stroke 34:1925–1931, 2003.
47. Khatri P, Hill MD, Palesch YY, et al: Methodology of the interven-tional management of stroke III trial, Int J Stroke 3:130–137, 2008.
48. Kassem-Moussa H, Graffagnino C: Nonocclusion and spontaneous recanalization rates in acute ischemic stroke: A review of cerebral angiography studies, Arch Neurol 59:1870–1873, 2002.
49. Meier P, Zierler KL: On the theory of the indicator-dilution method for measurement of blood flow and volume, J Appl Physiol 6:731–744, 1954.
50. Murphy BD, Fox AJ, Lee DH, et al: Identification of penumbra and infarct in acute ischemic stroke using computed tomography perfusion-derived blood flow and blood volume measurements, Stroke 37:1771–1777, 2006.
51. Wintermark M, Thiran JP, Maeder P, et al: Simultaneous measurement of regional cerebral blood flow by perfusion CT and stable xenon CT: A validation study, AJNR Am J Neuroradiol 22:905–914, 2001.

COMPUTED TOMOGRAPHY–BASED EVALUATION OF CEREBROVASCULAR DISEASE 881
52. Lin K, Rapalino O, Law M, et al: Accuracy of the Alberta Stroke Program Early CT Score during the first 3 hours of middle cere-bral artery stroke: Comparison of noncontrast CT, CT angiography source images, and CT perfusion, AJNR Am J Neuroradiol 29:931–936, 2008.
53. Tan JC, Dillon WP, Liu S, et al: Systematic comparison of perfu-sion-CT and CT-angiography in acute stroke patients, Ann Neurol 61:533–543, 2007.
54. Gasparotti R, Grassi M, Mardighian D, et al: Perfusion CT in patients with acute ischemic stroke treated with intra-arterial thrombolysis: Predictive value of infarct core size on clinical outcome, AJNR Am J Neuroradiol 30:722–727, 2009.
55. Krol AL, Dzialowski I, Roy J, et al: Incidence of radiocontrast nephropathy in patients undergoing acute stroke computed tomog-raphy angiography, Stroke 38:2364–2366, 2007.
56. Josephson SA, Dillon WP, Smith WS: Incidence of contrast nephrop-athy from cerebral CT angiography and CT perfusion imaging, Neu-rology 64:1805–1806, 2005.
57. Brenner DJ, Hall EJ: Computed tomography—an increasing source of radiation exposure, N Engl J Med 357:2277–2284, 2007.
58. Savitz SI, Caplan LR: Vertebrobasilar disease, N Engl J Med 352:2618–2626, 2005.
59. Ferro JM, Pinto AN, Falcao I, et al: Diagnosis of stroke by the non-neurologist. A validation study, Stroke 29:1106–1109, 1998.
60. Schonewille WJ, Algra A, Serena J, et al: Outcome in patients with basilar artery occlusion treated conventionally, J Neurol Neuro-surg Psychiatry 76:1238–1241, 2005.
61. Muir KW, Buchan A, von Kummer R, et al: Imaging of acute stroke, Lancet Neurol 5:755–768, 2006.
62. Schulte-Altedorneburg G, Bruckmann H: [Imaging techniques in diagnosis of brainstem infarction], Nervenarzt 77:731–743, 2006:quiz 744.
63. Puetz V, Sylaja PN, Coutts SB, et al: Extent of hypoattenuation on CT angiography source images predicts functional outcome in patients with basilar artery occlusion, Stroke 39:2485–2490, 2008.
64. Vonofakos D, Marcu H, Hacker H: CT diagnosis of basilar artery occlusion, AJNR Am J Neuroradiol 4:525–528, 1983.
65. Krings T, Noelchen D, Mull M, et al: The hyperdense posterior cere-bral artery sign: A computed tomography marker of acute ischemia in the posterior cerebral artery territory, Stroke 37:399–403, 2006.
66. Sylaja PN, Puetz V, Dzialowski I, et al: Prognostic value of CT angiography in patients with suspected vertebrobasilar ischemia, J Neuroimaging 18:46–49, 2008.
67. Renard D, Landragin N, Robinson A, et al: MRI-based score for acute basilar artery thrombosis, Cerebrovasc Dis 25:511–516, 2008.
68. Nagahori T, Hirashima Y, Umemura K, et al: Supratentorial dynamic computed tomography for the diagnosis of vertebrobasilar isch-emic stroke, Neurol Med Chir (Tokyo) 44:105–110, 2004:discus-sion 110–101.
69. Schaefer PW, Yoo AJ, Bell D, et al: CT angiography-source image hypoattenuation predicts clinical outcome in posterior circulation strokes treated with intra-arterial therapy, Stroke 39:3107–3109, 2008.
70. Kidwell CS, Chalela JA, Saver JL, et al: Comparison of MRI and CT for detection of acute intracerebral hemorrhage, JAMA 292:1823–1830, 2004.
71. Chen W, Wang J, Xin W, et al: Accuracy of 16-row multislice com-puted tomographic angiography for assessment of small cerebral aneurysms, Neurosurgery 62:113–121, 2008:discussion 121–112.
72. Brott T, Broderick J, Kothari R, et al: Early hemorrhage growth in patients with intracerebral hemorrhage, Stroke 28:1–5, 1997.
73. Wada R, Aviv RI, Fox AJ, et al: CT angiography “spot sign” predicts hematoma expansion in acute intracerebral hemorrhage, Stroke 38:1257–1262, 2007.