Embed Size (px)
Citation preview
Please refer to important disclosures at the end of this report
Market Cap Rs70bn/US$1.1bn Year to March FY17 FY18E FY19E FY20E
Reuters/Bloomberg STSA.BO/STR IN Net Revenue (Rs mn) 34,834 37,711 40,069 45,219
Shares Outstanding (mn) 89.5 Net Profit (Rs mn) 2,886 2,036 3,955 5,288
52-week Range (Rs) 1383/776 Dil. EPS (Rs) 32.3 22.8 44.2 59.1
Free Float (%) 68.9 % Chg YoY 78.0 (29.4) 94.2 33.7
FII (%) 33.6 P/E (x) 24.1 34.2 17.6 13.2
Daily Volume (US$'000) 6,469 CEPS (Rs) 53.2 44.2 65.7 82.8
Absolute Return 3m (%) (13.6) EV/EBITDA (x) 15.0 17.2 12.4 9.8
Absolute Return 12m (%) (26.1) Dividend Yield (%) 0.0 0.0 0.0 0.0
Sensex Return 3m (%) 5.0 RoCE (%) 7.2 5.8 8.6 10.2
Sensex Return 12m (%) 24.4 RoE (%) 10.8 7.2 12.6 14.9
Equity Research November 14, 2017 BSE Sensex: 32942
ICICI Securities Limited is the author and distributor of this report
Pharmaceuticals
Target price Rs1,002 I-Sec vs Bbg* consensus (%) FY18E FY19E FY20E Sales 0.3 (7.4) (10.4) Adj. PAT (30.5) (17.6) (15.3) Source: *Bloomberg, I-Sec research
Shareholding pattern
Mar ’17
Jun ’17
Sep ’17
Promoters 31.1 31.1 31.1 Institutional investors 48.9 49.4 50.2 MFs and UTI 13.5 15.0 16.1 Banks, FI’s, Insurance co 2.4 0.6 0.5 FIIs 33.9 33.9 33.6 Others 20.0 19.5 18.7
Source: BSE
Price chart
600
800
1000
1200
1400
1600
Nov
-14
May
-15
Nov
-15
May
-16
Nov
-16
May
-17
Nov
-17
(Rs)
Strides Shasun Ltd BUY
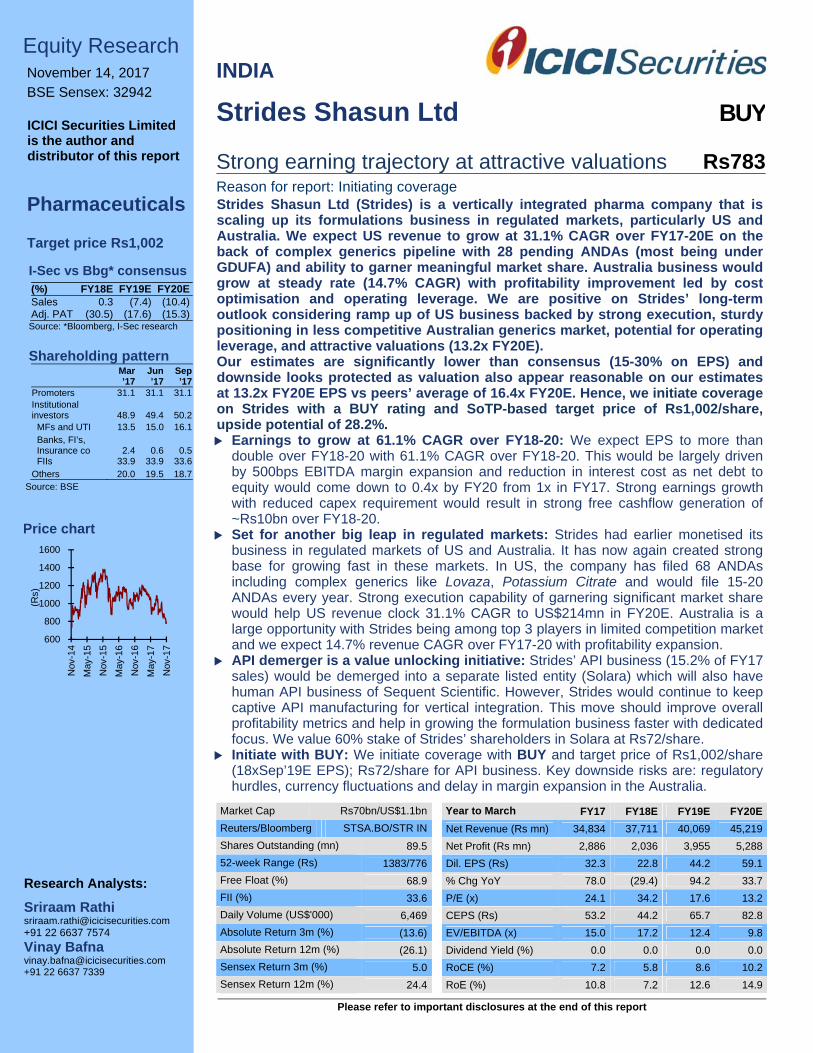
Strong earning trajectory at attractive valuations Rs783Reason for report: Initiating coverage
Research Analysts:
Sriraam Rathi [email protected] +91 22 6637 7574
Vinay Bafna [email protected] +91 22 6637 7339
INDIA
Strides Shasun Ltd (Strides) is a vertically integrated pharma company that isscaling up its formulations business in regulated markets, particularly US andAustralia. We expect US revenue to grow at 31.1% CAGR over FY17-20E on theback of complex generics pipeline with 28 pending ANDAs (most being underGDUFA) and ability to garner meaningful market share. Australia business wouldgrow at steady rate (14.7% CAGR) with profitability improvement led by costoptimisation and operating leverage. We are positive on Strides’ long-termoutlook considering ramp up of US business backed by strong execution, sturdypositioning in less competitive Australian generics market, potential for operatingleverage, and attractive valuations (13.2x FY20E). Our estimates are significantly lower than consensus (15-30% on EPS) anddownside looks protected as valuation also appear reasonable on our estimatesat 13.2x FY20E EPS vs peers’ average of 16.4x FY20E. Hence, we initiate coverageon Strides with a BUY rating and SoTP-based target price of Rs1,002/share,upside potential of 28.2%. Earnings to grow at 61.1% CAGR over FY18-20: We expect EPS to more than
double over FY18-20 with 61.1% CAGR over FY18-20. This would be largely drivenby 500bps EBITDA margin expansion and reduction in interest cost as net debt toequity would come down to 0.4x by FY20 from 1x in FY17. Strong earnings growthwith reduced capex requirement would result in strong free cashflow generation of~Rs10bn over FY18-20.
Set for another big leap in regulated markets: Strides had earlier monetised itsbusiness in regulated markets of US and Australia. It has now again created strongbase for growing fast in these markets. In US, the company has filed 68 ANDAsincluding complex generics like Lovaza, Potassium Citrate and would file 15-20ANDAs every year. Strong execution capability of garnering significant market sharewould help US revenue clock 31.1% CAGR to US$214mn in FY20E. Australia is alarge opportunity with Strides being among top 3 players in limited competition marketand we expect 14.7% revenue CAGR over FY17-20 with profitability expansion.
API demerger is a value unlocking initiative: Strides’ API business (15.2% of FY17sales) would be demerged into a separate listed entity (Solara) which will also havehuman API business of Sequent Scientific. However, Strides would continue to keepcaptive API manufacturing for vertical integration. This move should improve overallprofitability metrics and help in growing the formulation business faster with dedicatedfocus. We value 60% stake of Strides’ shareholders in Solara at Rs72/share.
Initiate with BUY: We initiate coverage with BUY and target price of Rs1,002/share(18xSep’19E EPS); Rs72/share for API business. Key downside risks are: regulatoryhurdles, currency fluctuations and delay in margin expansion in the Australia.

Strides Shasun Ltd, November 14, 2017 ICICI Securities
2
TABLE OF CONTENT
Earnings to grow at 61.1% CAGR over FY18-20 ........................................................... 3
Creating another big leap in regulated markets ........................................................... 5
US – strong execution capability to drive strong growth ................................................. 6
Developing solid franchise in Australia ........................................................................... 8
Regulated markets revenue to grow strong .................................................................. 11
Emerging markets business on stable growth path .................................................. 12
API demerger is a value unlocking initiative ............................................................... 15
Pharmaceuticals Industry ............................................................................................. 16
Global pharma market to clock 4.7% CAGR ................................................................. 16
Exports from India growing in double-digits .................................................................. 16
US generics – Large opportunity .................................................................................. 17
India formulations industry going through regulatory challenges ................................. 20
Financial performance ................................................................................................... 22
Key assumptions ........................................................................................................... 26
Valuations and risks ...................................................................................................... 27
Risks .............................................................................................................................. 28
Company background and key management personnel ........................................... 29
Financials ........................................................................................................................ 30
Index of tables and charts ............................................................................................. 34
Strides Shasun Ltd, November 14, 2017 ICICI Securities
3
Earnings to grow at 61.1% CAGR over FY18-20
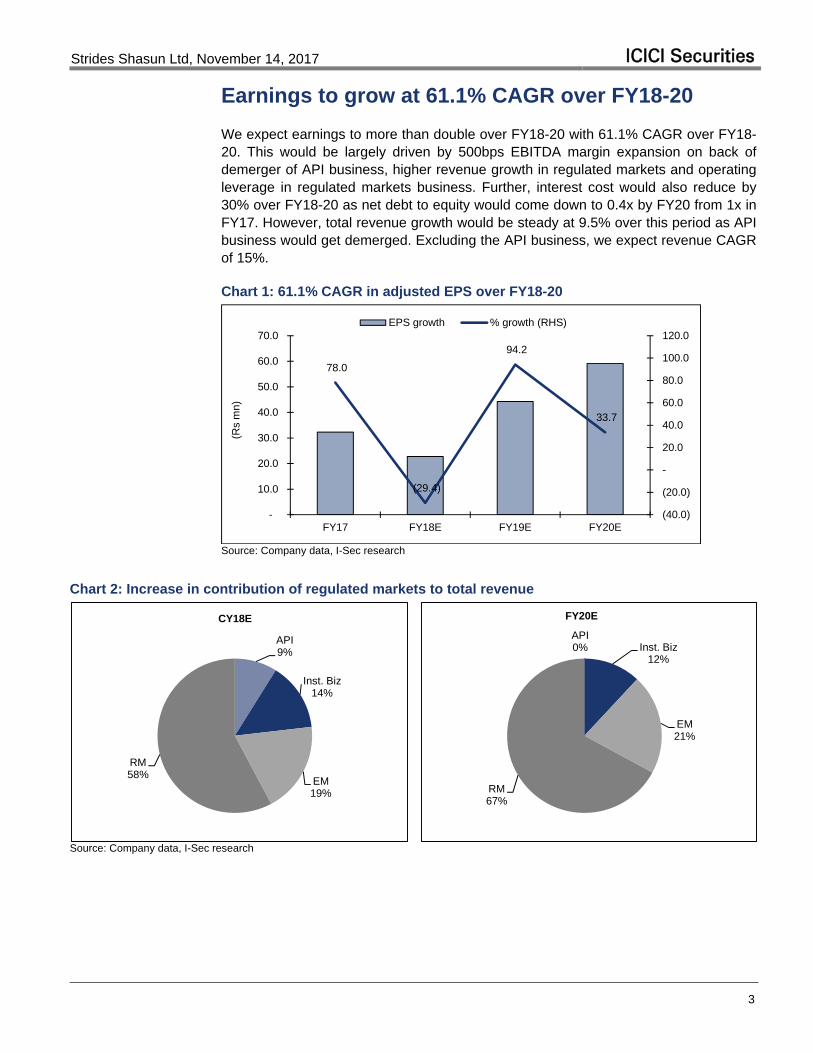
We expect earnings to more than double over FY18-20 with 61.1% CAGR over FY18-20. This would be largely driven by 500bps EBITDA margin expansion on back of demerger of API business, higher revenue growth in regulated markets and operating leverage in regulated markets business. Further, interest cost would also reduce by 30% over FY18-20 as net debt to equity would come down to 0.4x by FY20 from 1x in FY17. However, total revenue growth would be steady at 9.5% over this period as API business would get demerged. Excluding the API business, we expect revenue CAGR of 15%.
Chart 1: 61.1% CAGR in adjusted EPS over FY18-20
78.0
(29.4)
94.2
33.7
(40.0)
(20.0)
-
20.0
40.0
60.0
80.0
100.0
120.0
-
10.0
20.0
30.0
40.0
50.0
60.0
70.0
FY17 FY18E FY19E FY20E
(Rs
mn)
EPS growth % growth (RHS)
Source: Company data, I-Sec research
Chart 2: Increase in contribution of regulated markets to total revenue
API9%
Inst. Biz14%
EM19%
RM58%
CY18E
API0% Inst. Biz
12%
EM21%
RM67%
FY20E
Source: Company data, I-Sec research

Strides Shasun Ltd, November 14, 2017 ICICI Securities
4
Chart 3: Significant increase in EBITDA contribution from regulated markets
API8%
Inst. Biz20%
EM14%
RM58%
CY18E
API0% Inst. Biz
13%
EM15%
RM72%
FY20E
Source: I-Sec research
Strides Shasun Ltd, November 14, 2017 ICICI Securities
5
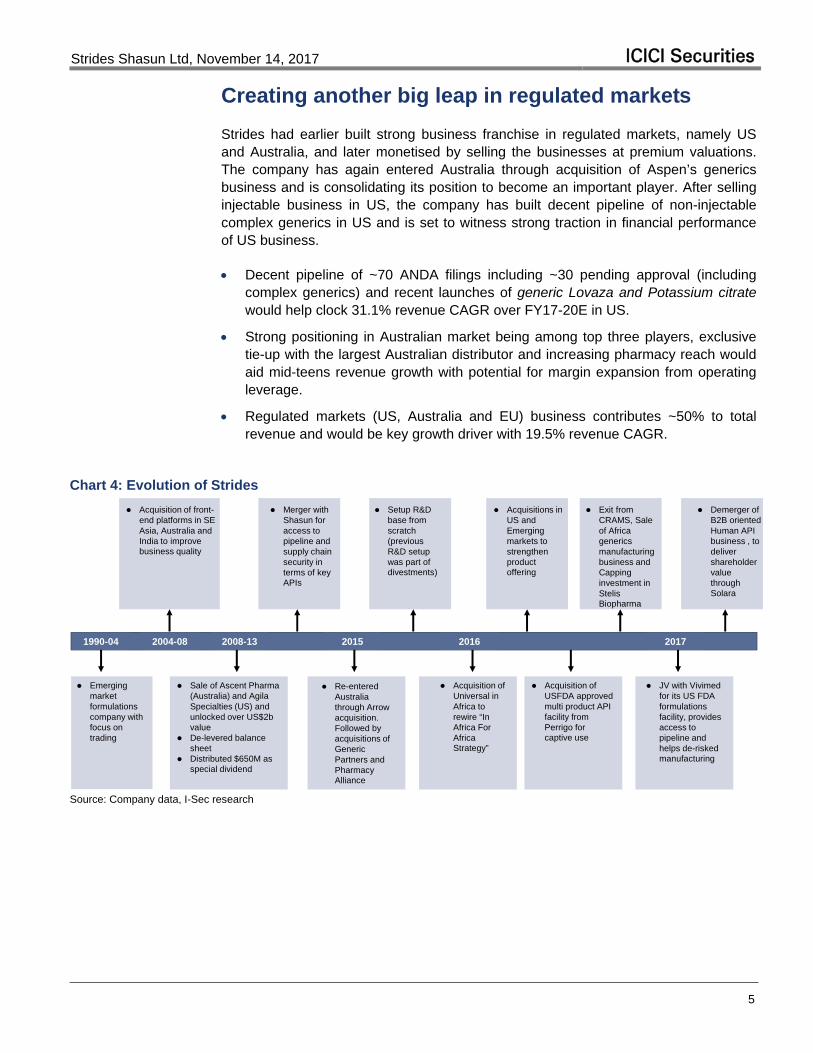
Creating another big leap in regulated markets
Strides had earlier built strong business franchise in regulated markets, namely US and Australia, and later monetised by selling the businesses at premium valuations. The company has again entered Australia through acquisition of Aspen’s generics business and is consolidating its position to become an important player. After selling injectable business in US, the company has built decent pipeline of non-injectable complex generics in US and is set to witness strong traction in financial performance of US business.
Decent pipeline of ~70 ANDA filings including ~30 pending approval (including complex generics) and recent launches of generic Lovaza and Potassium citrate would help clock 31.1% revenue CAGR over FY17-20E in US.
Strong positioning in Australian market being among top three players, exclusive tie-up with the largest Australian distributor and increasing pharmacy reach would aid mid-teens revenue growth with potential for margin expansion from operating leverage.
Regulated markets (US, Australia and EU) business contributes ~50% to total revenue and would be key growth driver with 19.5% revenue CAGR.
Chart 4: Evolution of Strides
1990-04
Emerging market formulations company with focus on trading
2004-08
Acquisition of front-end platforms in SE Asia, Australia and India to improve business quality
2008-13
Sale of Ascent Pharma (Australia) and AgilaSpecialties (US) and unlocked over US$2b value
De-levered balance sheet
Distributed $650M as special dividend
2015
Re-entered Australia through Arrow acquisition. Followed by acquisitions of Generic Partners and Pharmacy Alliance
Merger with Shasun for access to pipeline and supply chain security in terms of key APIs
Setup R&D base from scratch (previous R&D setup was part of divestments)
2016
Acquisition of Universal in Africa to rewire “In Africa For Africa Strategy”
Acquisitions in US and Emerging markets to strengthen product offering
Acquisition of USFDA approved multi product API facility from Perrigo for captive use
Exit from CRAMS, Sale of Africa generics manufacturing business and Capping investment in StelisBiopharma
2017
JV with Vivimedfor its US FDA formulations facility, provides access to pipeline and helps de-risked manufacturing
Demerger of B2B oriented Human API business , to deliver shareholder value through Solara
Source: Company data, I-Sec research

Strides Shasun Ltd, November 14, 2017 ICICI Securities
6
US – strong execution capability to drive strong growth
Strides has developed a pipeline of total 68 ANDA filings, of which 28 are pending for approval. Most of these filings have been made in last 3-4 years, after sale of Agila (sterile injectable business in US). Management focus has been on building product portfolio in niche and complex generics and hence, about half of pending filings of the portfolio comprise topicals, softgels and modified release dosages. We believe Strides is well positioned to witness strong growth in US with 28 ANDAs pending for final approval in complex generics and clear FDA status with all manufacturing plants being approved by USFDA. We expect US revenue to more than double in next three years and clock 31.1% CAGR over FY17-20 to US$214mn led by new product launches and capability of garnering meaningful market share.
Chart 5: US revenue to more than double over FY17-20
35.7
41.1
35.1
18.3
-
5.0
10.0
15.0
20.0
25.0
30.0
35.0
40.0
45.0
-
50
100
150
200
250
FY17 FY18E FY19E FY20E
(US
$ m
n)
US revenue % growth (RHS)
Source: Company data, I-Sec research
Building complex generic product portfolio
The focus of the management is on developing niche and complex generic portfolio where competition would be limited and company can look for meaningful market share. The company has re-built its R&D team after sale of injectable business in CY13. It has created a team of over 500 scientists. It has developed capabilities across multiple delivery and dosages such as orals, topicals, soft gels, creams, liquids, modified release formats and tablets. The company has 28 ANDAs pending for approval and most of these filings are post GDUFA which would ensure approval in relatively lesser time. More than half of these pending filings are in complex space such as modified release format, topicals, soft gels and para IVs. Management expects 20+ approvals over next 12 months and is targeting to file 15-20 ANDAs per year over next 2-3 years. Recent approvals for generic Lovaza and Potassium citrate would drive growth in near to mid-term and new launches going forward would help in sustaining strong growth.
Strides Shasun Ltd, November 14, 2017 ICICI Securities
7
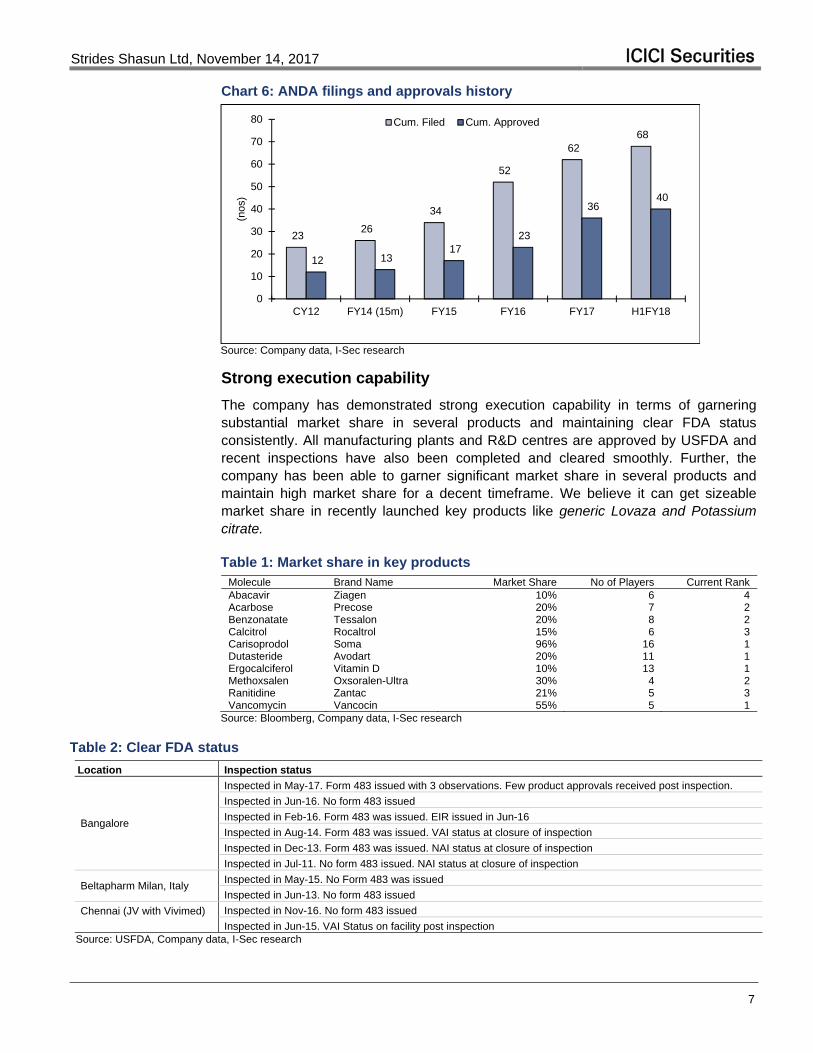
Chart 6: ANDA filings and approvals history
23 26
34
52
62 68
12 13 17
23
36 40
0
10
20
30
40
50
60
70
80
CY12 FY14 (15m) FY15 FY16 FY17 H1FY18
(nos
)
Cum. Filed Cum. Approved
Source: Company data, I-Sec research
Strong execution capability
The company has demonstrated strong execution capability in terms of garnering substantial market share in several products and maintaining clear FDA status consistently. All manufacturing plants and R&D centres are approved by USFDA and recent inspections have also been completed and cleared smoothly. Further, the company has been able to garner significant market share in several products and maintain high market share for a decent timeframe. We believe it can get sizeable market share in recently launched key products like generic Lovaza and Potassium citrate.
Table 1: Market share in key products Molecule Brand Name Market Share No of Players Current Rank Abacavir Ziagen 10% 6 4 Acarbose Precose 20% 7 2 Benzonatate Tessalon 20% 8 2 Calcitrol Rocaltrol 15% 6 3 Carisoprodol Soma 96% 16 1 Dutasteride Avodart 20% 11 1 Ergocalciferol Vitamin D 10% 13 1 Methoxsalen Oxsoralen-Ultra 30% 4 2 Ranitidine Zantac 21% 5 3 Vancomycin Vancocin 55% 5 1
Source: Bloomberg, Company data, I-Sec research
Table 2: Clear FDA status
Location Inspection status
Bangalore
Inspected in May-17. Form 483 issued with 3 observations. Few product approvals received post inspection.
Inspected in Jun-16. No form 483 issued
Inspected in Feb-16. Form 483 was issued. EIR issued in Jun-16
Inspected in Aug-14. Form 483 was issued. VAI status at closure of inspection
Inspected in Dec-13. Form 483 was issued. NAI status at closure of inspection
Inspected in Jul-11. No form 483 issued. NAI status at closure of inspection
Beltapharm Milan, Italy Inspected in May-15. No Form 483 was issued
Inspected in Jun-13. No form 483 issued
Chennai (JV with Vivimed)
Inspected in Nov-16. No form 483 issued
Inspected in Jun-15. VAI Status on facility post inspection Source: USFDA, Company data, I-Sec research

Strides Shasun Ltd, November 14, 2017 ICICI Securities
8
Developing solid franchise in Australia
After exiting Australian market in CY12 by sale of business to Watson, Strides has re-entered this market in a big way through inorganic route. It acquired the generic business of Aspen Pharmacare (Arrow Pharma) in Australia and got 20%+ market share straight away as Aspen was among top three generic players in Australia. This acquisition helped Strides become the third largest generic player in the geography and get access to 130 commercialised products. Post this acquisition, Strides also acquired controlling stake in Generic Partners (GP) and Amneal’s Australian business to strengthen its position further in Australia.
The company has also entered a ten-year distribution agreement with large pharmacy chain, Pharmacy Alliance, which has a network of about 600 pharmacies in Australia, and has signed an exclusive agreement with largest wholesaler Sigma in Australia. We believe these initiatives would help Strides strengthen its presence further in this market and gain market share. We expect revenue from Australian business to clock 13.3% CAGR over FY17-20 with gradual improvement in profitability margin through operating leverage.
Chart 7: Strategic focus on Australian business
Highly consolidated market worth US$2bn
Top 4 generic players including Arrow (Strides) control 85% of market
Pharmacy ownership to stay independent bylaw
Changes in PBS reimbursements regulations driving expansion of generics market
To become market leader in Australia in 3years
Expansion of product portfolio through in-house development and in-licensing opportunities
Enhance pharmacy coverage as first line generics with high loyalty across footprints
Site transfer product portfolio in-house to expand profitability
Ranks #2 by volume and #3 by revenues
Own nation wide sales force driving distribution and loyalty in generics and proprietary Chemist’s own portfolio
Signed a 10 year exclusive distribution agreement with Sigma, a major distributor
New product development including drugs going off patent through acquisition of GenericPartners
Increase in loyalty and substitution through Pharmacy Alliance, across the footprint
Big opportunity Strides today
Growth strategy Steps
Australia focus
Source: Company data, I-Sec research

Strides Shasun Ltd, November 14, 2017 ICICI Securities
9
Chart 8: Steady revenue growth momentum in Australia
18.4
12.0 12.0
-
2.0
4.0
6.0
8.0
10.0
12.0
14.0
16.0
18.0
20.0
-
2,000
4,000
6,000
8,000
10,000
12,000
14,000
FY17 FY18E FY19E FY20E
(Rs
mn)
Australian revenue % growth (RHS)
Source: Company data, I-Sec research
Favourable market dynamics in Australia
The pharmaceutical market of Australia was estimated at US$13.5bn in CY16 and is expected to grow at 0-3% over next five years largely driven by increase in generic penetration, better access to pharmaceutical products, launch of new drugs. The generic drug market size is ~US$2bn in Australia and is highly consolidated with top three players having ~75% market share. Strides (Arrow) is the third largest player in terms of value. The generic penetration is relatively lower in Australia at ~60% due to reimbursement by PBS (Pharmaceutical Benefits Scheme) for branded drugs. PBS is a part of universal health system of Government in Australia which provides subsidised medicines at affordable prices to local people and most of the drug sales happen through this route. The generic penetration is expected to rise going forward as list of medicines under PBS scheme are expected to be brought down by government to promote generics. Large part of growth in Australian pharma market would be led by generics.
Chart 9: Composition of Australian pharma market
Branded61%
Generic18%
OTC21%
FY16
Source: Company data, I-Sec research
Australian pharma market is highly concentrated with just four pharma companies having ~85% market share in generics market and three wholesalers (distributors) supplying to PBS. These wholesalers prefer to work with manufacturers who can offer
Strides Shasun Ltd, November 14, 2017 ICICI Securities
10
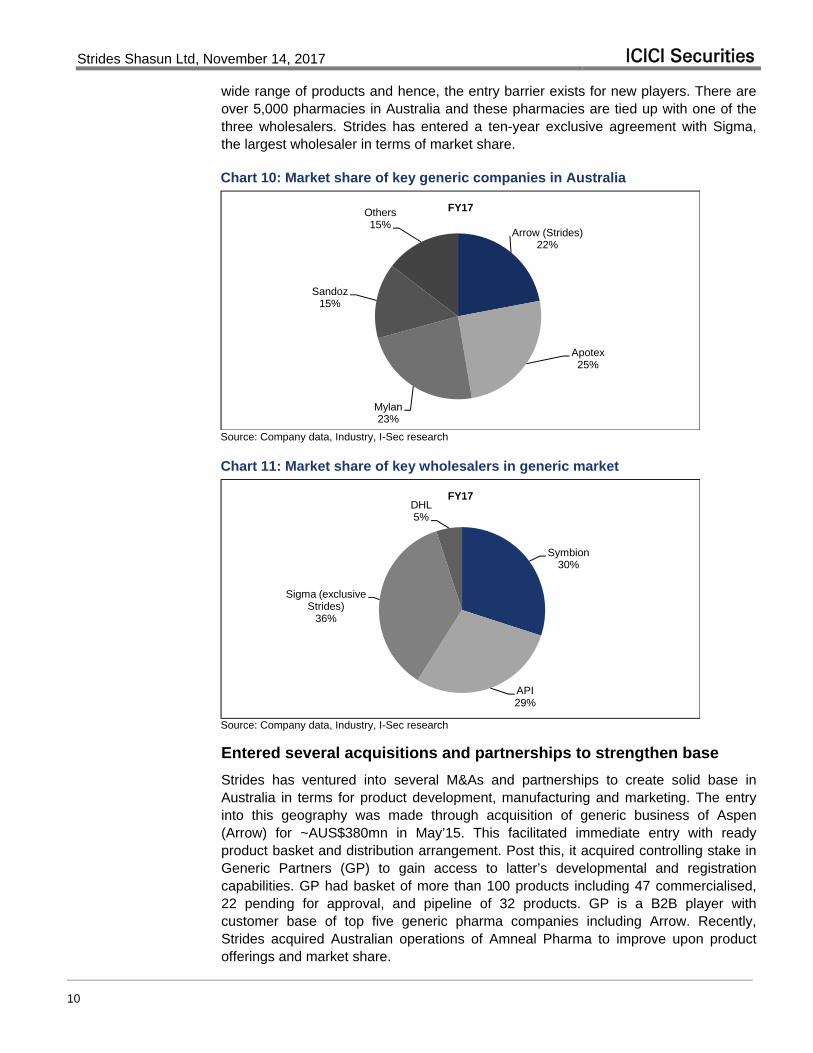
wide range of products and hence, the entry barrier exists for new players. There are over 5,000 pharmacies in Australia and these pharmacies are tied up with one of the three wholesalers. Strides has entered a ten-year exclusive agreement with Sigma, the largest wholesaler in terms of market share.
Chart 10: Market share of key generic companies in Australia
Arrow (Strides)22%
Apotex25%
Mylan23%
Sandoz15%
Others15%
FY17
Source: Company data, Industry, I-Sec research
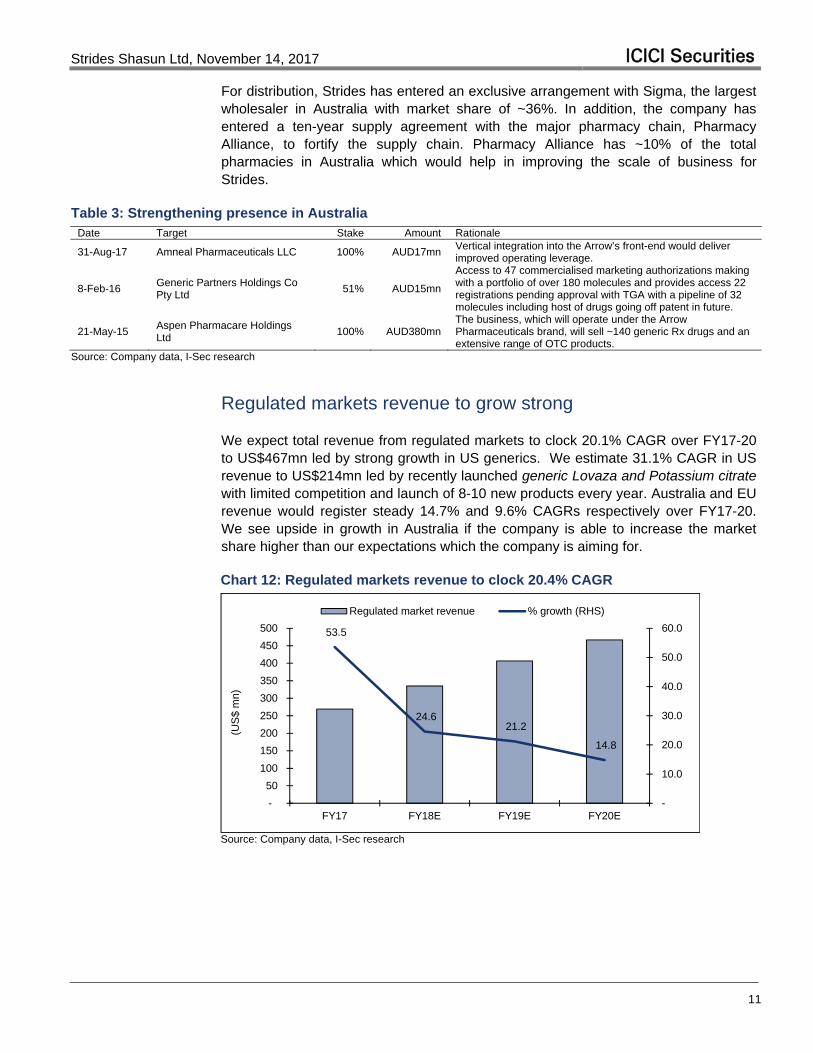
Chart 11: Market share of key wholesalers in generic market
Symbion30%
API29%
Sigma (exclusive Strides)
36%
DHL5%
FY17
Source: Company data, Industry, I-Sec research
Entered several acquisitions and partnerships to strengthen base
Strides has ventured into several M&As and partnerships to create solid base in Australia in terms for product development, manufacturing and marketing. The entry into this geography was made through acquisition of generic business of Aspen (Arrow) for ~AUS$380mn in May’15. This facilitated immediate entry with ready product basket and distribution arrangement. Post this, it acquired controlling stake in Generic Partners (GP) to gain access to latter’s developmental and registration capabilities. GP had basket of more than 100 products including 47 commercialised, 22 pending for approval, and pipeline of 32 products. GP is a B2B player with customer base of top five generic pharma companies including Arrow. Recently, Strides acquired Australian operations of Amneal Pharma to improve upon product offerings and market share.
Strides Shasun Ltd, November 14, 2017 ICICI Securities
11
For distribution, Strides has entered an exclusive arrangement with Sigma, the largest wholesaler in Australia with market share of ~36%. In addition, the company has entered a ten-year supply agreement with the major pharmacy chain, Pharmacy Alliance, to fortify the supply chain. Pharmacy Alliance has ~10% of the total pharmacies in Australia which would help in improving the scale of business for Strides.
Table 3: Strengthening presence in Australia Date Target Stake Amount Rationale
31-Aug-17 Amneal Pharmaceuticals LLC 100% AUD17mn Vertical integration into the Arrow’s front-end would deliver improved operating leverage.
8-Feb-16 Generic Partners Holdings Co Pty Ltd
51% AUD15mn
Access to 47 commercialised marketing authorizations making with a portfolio of over 180 molecules and provides access 22 registrations pending approval with TGA with a pipeline of 32 molecules including host of drugs going off patent in future.
21-May-15 Aspen Pharmacare Holdings Ltd
100% AUD380mn The business, which will operate under the Arrow Pharmaceuticals brand, will sell ~140 generic Rx drugs and an extensive range of OTC products.
Source: Company data, I-Sec research
Regulated markets revenue to grow strong
We expect total revenue from regulated markets to clock 20.1% CAGR over FY17-20 to US$467mn led by strong growth in US generics. We estimate 31.1% CAGR in US revenue to US$214mn led by recently launched generic Lovaza and Potassium citrate with limited competition and launch of 8-10 new products every year. Australia and EU revenue would register steady 14.7% and 9.6% CAGRs respectively over FY17-20. We see upside in growth in Australia if the company is able to increase the market share higher than our expectations which the company is aiming for.
Chart 12: Regulated markets revenue to clock 20.4% CAGR
53.5
24.6 21.2
14.8
-
10.0
20.0
30.0
40.0
50.0
60.0
-
50
100
150
200
250
300
350
400
450
500
FY17 FY18E FY19E FY20E
(US
$ m
n)
Regulated market revenue % growth (RHS)
Source: Company data, I-Sec research
Strides Shasun Ltd, November 14, 2017 ICICI Securities
12
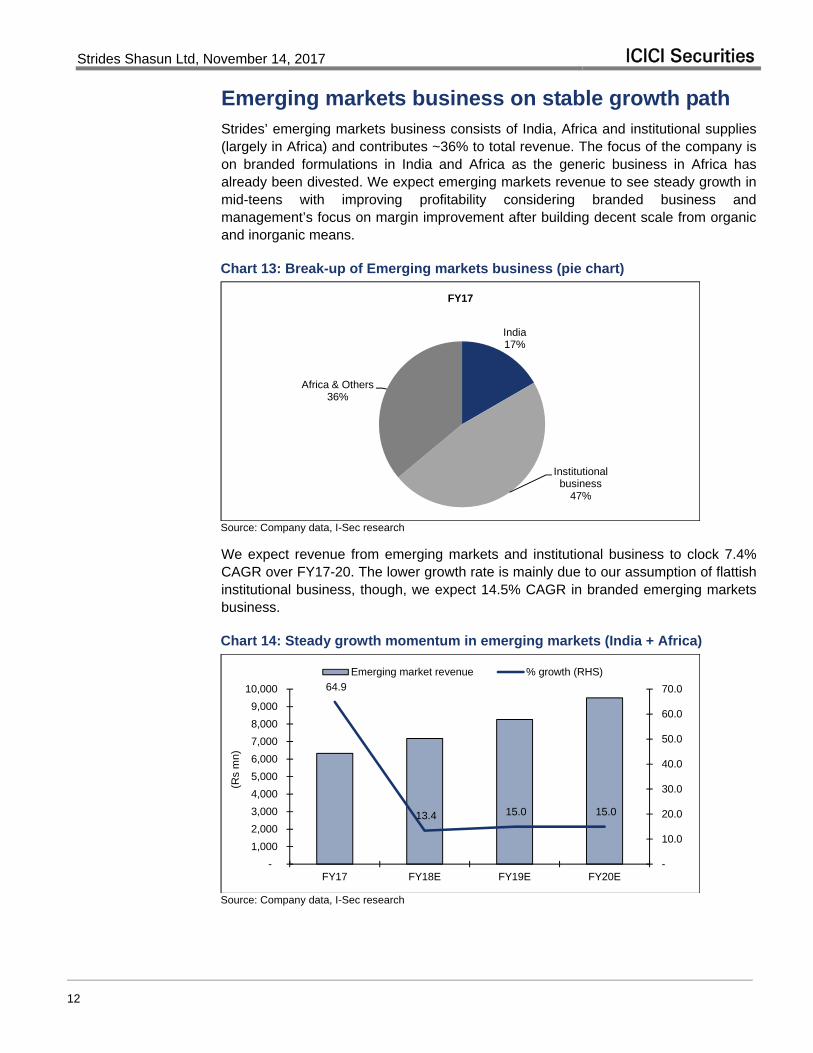
Emerging markets business on stable growth path Strides’ emerging markets business consists of India, Africa and institutional supplies (largely in Africa) and contributes ~36% to total revenue. The focus of the company is on branded formulations in India and Africa as the generic business in Africa has already been divested. We expect emerging markets revenue to see steady growth in mid-teens with improving profitability considering branded business and management’s focus on margin improvement after building decent scale from organic and inorganic means.
Chart 13: Break-up of Emerging markets business (pie chart)
India17%
Institutional business
47%
Africa & Others36%
FY17
Source: Company data, I-Sec research
We expect revenue from emerging markets and institutional business to clock 7.4% CAGR over FY17-20. The lower growth rate is mainly due to our assumption of flattish institutional business, though, we expect 14.5% CAGR in branded emerging markets business.
Chart 14: Steady growth momentum in emerging markets (India + Africa)
64.9
13.4 15.0 15.0
-
10.0
20.0
30.0
40.0
50.0
60.0
70.0
-
1,000
2,000
3,000
4,000
5,000
6,000
7,000
8,000
9,000
10,000
FY17 FY18E FY19E FY20E
(Rs
mn)
Emerging market revenue % growth (RHS)
Source: Company data, I-Sec research

Strides Shasun Ltd, November 14, 2017 ICICI Securities
13
Chart 15: Institutional business to remain largely flattish
(4.6)(5.0)
(6.0)
(5.0)
(4.0)
(3.0)
(2.0)
(1.0)
-
5,250
5,300
5,350
5,400
5,450
5,500
5,550
5,600
5,650
5,700
FY17 FY18E FY19E FY20E
(Rs
mn)
Instituional business % growth (RHS)
Source: Company data, I-Sec research
We expect emerging markets business growth would be broad based across India and Africa. The company has built India branded business through organic and inorganic means. Strides’ focus is largely on chronic therapies in India such as anti-diabetes, CNS, cardiac, women healthcare, pain, and this would help it grow faster than the industry. In terms of distribution reach, the company has built field force strength of 750 MRs, relation with ~3,500 stockists and reach to over 80,000 doctors. It made the following acquisitions to scale up India business portfolio and distribution reach:
Acquired seven brands from J&J in derma, pain and antiemetic segments and acquired majority stake in Medispan’s domestic branded business with presence in nutritional, probiotic and gastro segments for an undisclosed sum. The combined sales of both these acquisitions were Rs320mn in FY16.
Acquired CNS division (Solus and Solus care) of erstwhile Ranbaxy from Sun Pharma for Rs1.7bn along with the associated employees in Sep’15. The annual sales of brands under these divisions stood at Rs920mn as per IMS Jul’15 data.
Acquired majority stake (74%) in India branded generics business of Bafna Pharmaceuticals in Jul’14 for a consideration of Rs481mn. This acquisition provided global rights to Bafna’s flagship brand Raricap which had annual revenue of Rs200mn and strengthened women and child care portfolio of Strides.
In Africa, Strides is present in both the branded and generics market and has been growing at faster than the industry growth rate. Within Africa, the company has footprint in 40+ countries and is a well-established player in West Africa. It has built a field force of 250 MRs who are covering about 30,000 doctors. In terms of product pipeline, Strides already has 750 product registrations and a pipeline of 500 additional product registrations. The strategy of the management is to focus on brands driven chronic therapies to gain leadership position in key therapies in Sub-Saharan African branded generic market. Strides exited the generic business in Africa and expanded footprint in East Africa through following transactions:
The company divested the generic business in Africa recently including six facilities and would now focus on branded business. The divested business had revenue of US$21mn with EBITDA of US$1.4mn and was sold for US$16mn in cash deal.
Strides Shasun Ltd, November 14, 2017 ICICI Securities
14
To expand into East Africa, Strides acquired controlling (51%) stake in Universal Corporation in Feb’16 for a consideration of US$11mn. Universal Corporation is Nairobi-based manufacturing and marketing company and has strong presence in the East Africa. It has front-end business and has supply contracts with key donor agencies. Further, Universal’s facility is one of the only two WHO Pre-Qualified sites in Sub–Saharan Africa, other than South Africa.
Strides Shasun Ltd, November 14, 2017 ICICI Securities
15
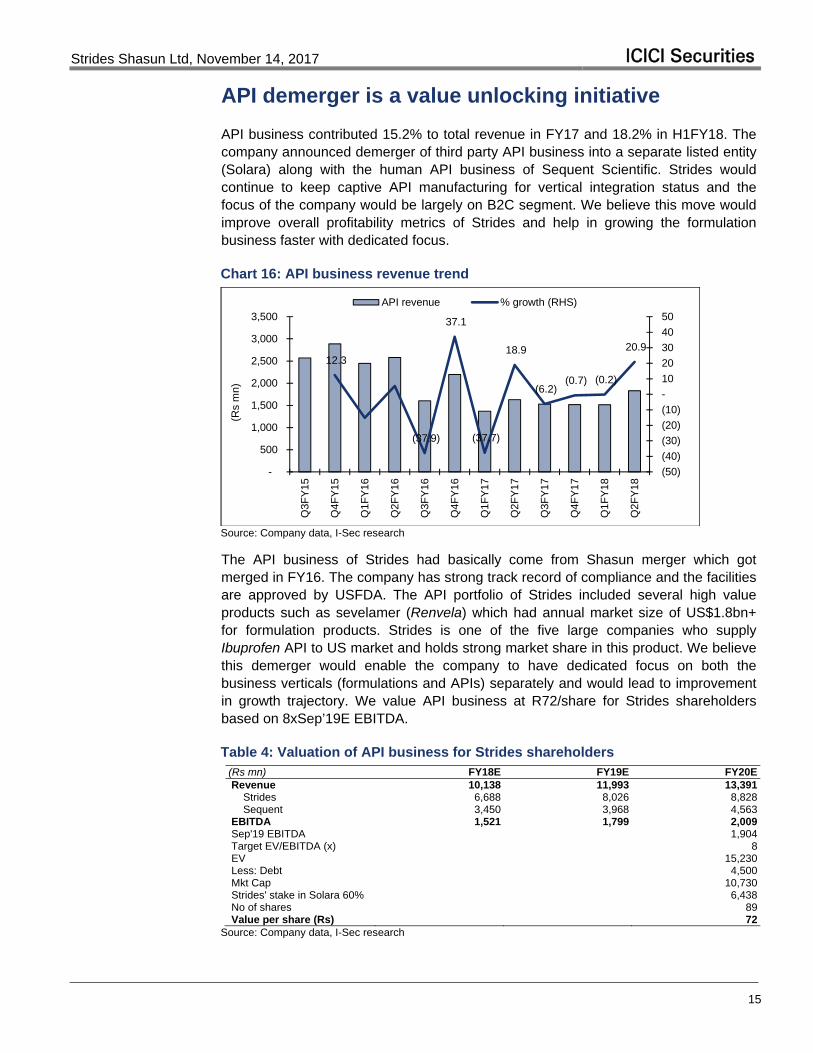
API demerger is a value unlocking initiative
API business contributed 15.2% to total revenue in FY17 and 18.2% in H1FY18. The company announced demerger of third party API business into a separate listed entity (Solara) along with the human API business of Sequent Scientific. Strides would continue to keep captive API manufacturing for vertical integration status and the focus of the company would be largely on B2C segment. We believe this move would improve overall profitability metrics of Strides and help in growing the formulation business faster with dedicated focus.
Chart 16: API business revenue trend
12.3
(37.9)
37.1
(37.7)
18.9
(6.2)(0.7) (0.2)
20.9
(50)
(40)
(30)
(20)
(10)
-
10
20
30
40
50
-
500
1,000
1,500
2,000
2,500
3,000
3,500Q
3FY
15
Q4F
Y15
Q1F
Y16
Q2F
Y16
Q3F
Y16
Q4F
Y16
Q1F
Y17
Q2F
Y17
Q3F
Y17
Q4F
Y17
Q1F
Y18
Q2F
Y18
(Rs
mn)
API revenue % growth (RHS)
Source: Company data, I-Sec research
The API business of Strides had basically come from Shasun merger which got merged in FY16. The company has strong track record of compliance and the facilities are approved by USFDA. The API portfolio of Strides included several high value products such as sevelamer (Renvela) which had annual market size of US$1.8bn+ for formulation products. Strides is one of the five large companies who supply Ibuprofen API to US market and holds strong market share in this product. We believe this demerger would enable the company to have dedicated focus on both the business verticals (formulations and APIs) separately and would lead to improvement in growth trajectory. We value API business at R72/share for Strides shareholders based on 8xSep’19E EBITDA.
Table 4: Valuation of API business for Strides shareholders (Rs mn) FY18E FY19E FY20E Revenue 10,138 11,993 13,391 Strides 6,688 8,026 8,828 Sequent 3,450 3,968 4,563 EBITDA 1,521 1,799 2,009 Sep'19 EBITDA 1,904 Target EV/EBITDA (x) 8 EV 15,230 Less: Debt 4,500 Mkt Cap 10,730 Strides' stake in Solara 60% 6,438 No of shares 89 Value per share (Rs) 72
Source: Company data, I-Sec research
Strides Shasun Ltd, November 14, 2017 ICICI Securities
16
Pharmaceuticals Industry
We believe increased regulatory issues pertaining to USFDA and NLEM are temporary hiccups for growth and expect recovery once base stabilises in FY17 on the back of faster ANDA approvals in the US and recovery in domestic branded formulations business.
Clearance in 483 observations and limited instances of warning letters or import alerts in CY16-YTD indicate increased regulatory compliance by the companies, hence potential for growth recovery.
Mergers and Acquisitions (M&A) would continue to be in focus for large players to achieve scale, access to new technologies/portfolio, and growth.
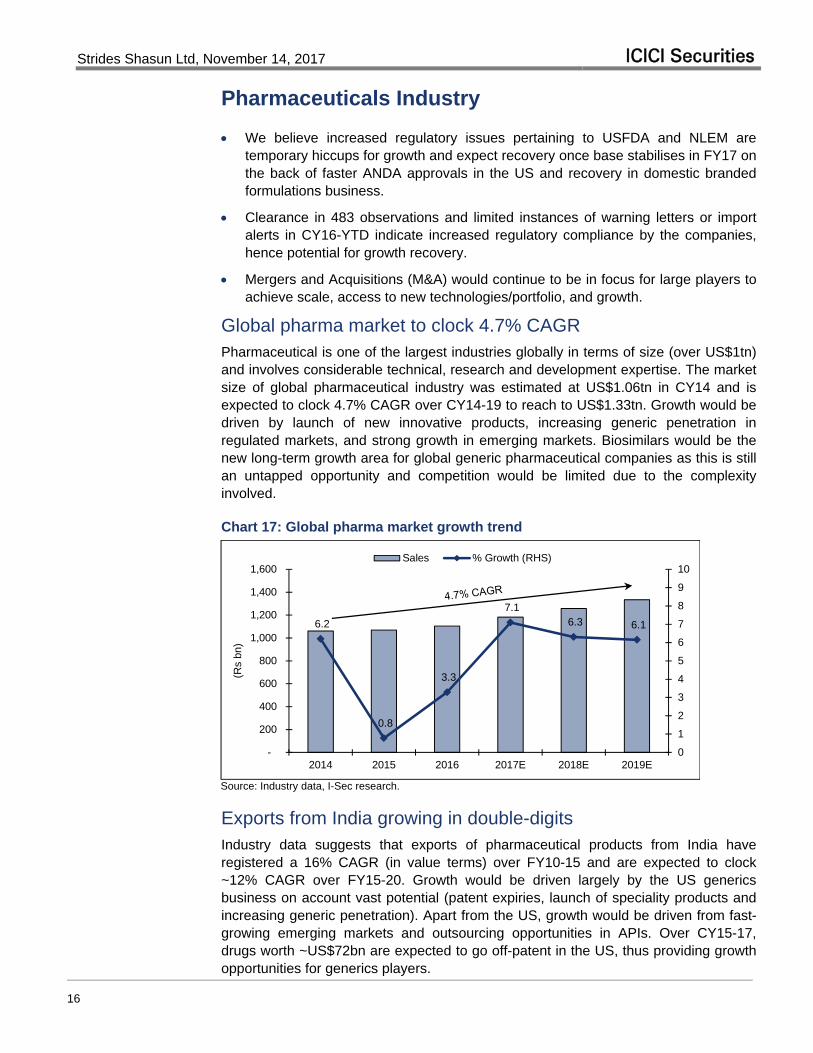
Global pharma market to clock 4.7% CAGR Pharmaceutical is one of the largest industries globally in terms of size (over US$1tn) and involves considerable technical, research and development expertise. The market size of global pharmaceutical industry was estimated at US$1.06tn in CY14 and is expected to clock 4.7% CAGR over CY14-19 to reach to US$1.33tn. Growth would be driven by launch of new innovative products, increasing generic penetration in regulated markets, and strong growth in emerging markets. Biosimilars would be the new long-term growth area for global generic pharmaceutical companies as this is still an untapped opportunity and competition would be limited due to the complexity involved.
Chart 17: Global pharma market growth trend
6.2
0.8
3.3
7.1 6.3 6.1
0
1
2
3
4
5
6
7
8
9
10
-
200
400
600
800
1,000
1,200
1,400
1,600
2014 2015 2016 2017E 2018E 2019E
(Rs
bn)
Sales % Growth (RHS)
Source: Industry data, I-Sec research.
Exports from India growing in double-digits Industry data suggests that exports of pharmaceutical products from India have registered a 16% CAGR (in value terms) over FY10-15 and are expected to clock ~12% CAGR over FY15-20. Growth would be driven largely by the US generics business on account vast potential (patent expiries, launch of speciality products and increasing generic penetration). Apart from the US, growth would be driven from fast-growing emerging markets and outsourcing opportunities in APIs. Over CY15-17, drugs worth ~US$72bn are expected to go off-patent in the US, thus providing growth opportunities for generics players.

Strides Shasun Ltd, November 14, 2017 ICICI Securities
17
Chart 18: Exports – Growth trend
11.5
24.6
39.3
0
5
10
15
20
25
30
35
40
45
FY10 FY15 FY20E
(US
$ bn
)
Source: Industry data, I-Sec research.
Export (mainly formulation exports) to regulated markets would be a major focus area for the companies considering the size and potential of the market. As per industry reports, formulation exports to regulated markets from India are expected to grow at 10-12% and that to semi-regulated markets to clock 9-12% CAGR over FY16-20.
Chart 19: Export to regulated and semi-regulated markets
5.7 5.2
9.3-10
66.8
9.5-10.4
0
1
2
3
4
5
6
7
8
9
10
FY15 FY16 FY20E
(US
$ bn
)
Regulated Semi-Regulated
Source: Industry data, I-Sec research
US generics – Large opportunity
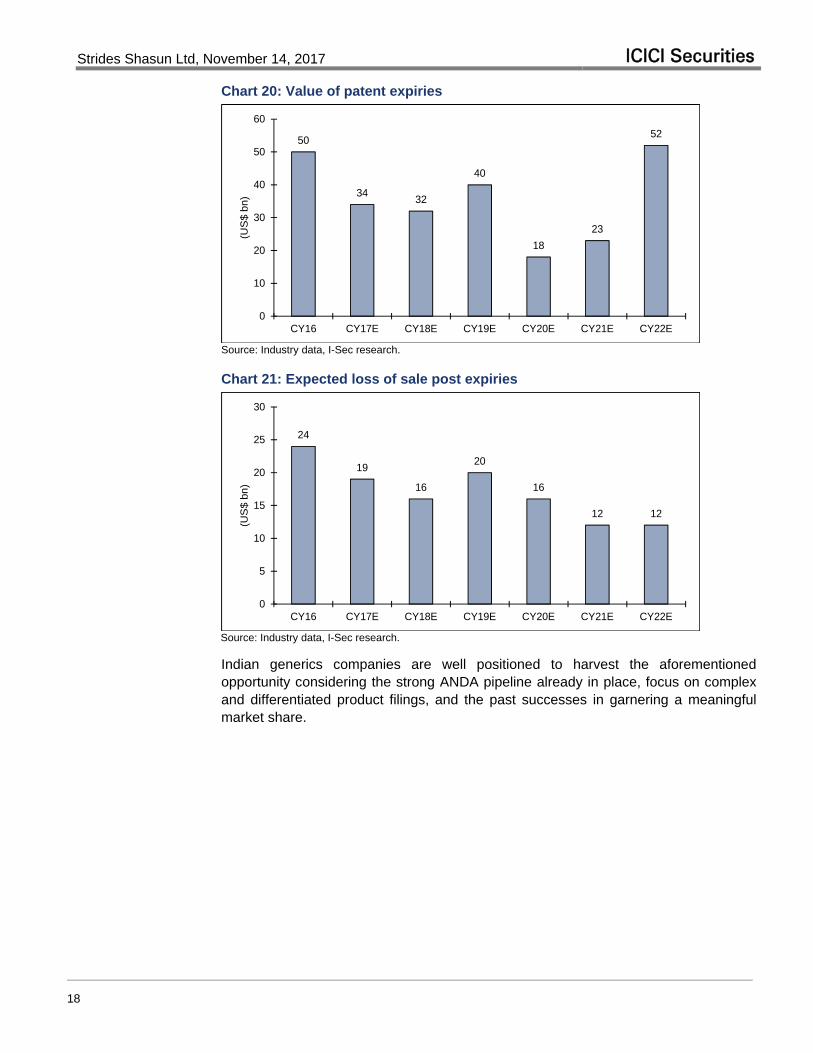
As per industry reports, the size of US pharmaceutical market stood at ~US$462bn in CY16, and the same is expected to clock 6-9% CAGR to US$645bn-675bn over CY16-21, aided by an ageing population, healthcare reforms and the focus on speciality drugs for complex diseases. In addition, the US was the top destination for pharma exports in FY16 with ~30% share of pharma exports from India, amounting to US$5.1bn. The US generics market was worth ~US$70bn in CY16 and is expected to grow driven by a huge number of patent expiries and increasing generics penetration.
Strides Shasun Ltd, November 14, 2017 ICICI Securities
18
Chart 20: Value of patent expiries
50
3432
40
18
23
52
0
10
20
30
40
50
60
CY16 CY17E CY18E CY19E CY20E CY21E CY22E
(US
$ b
n)
Source: Industry data, I-Sec research.
Chart 21: Expected loss of sale post expiries
24
19
16
20
16
12 12
0
5
10
15
20
25
30
CY16 CY17E CY18E CY19E CY20E CY21E CY22E
(US
$ b
n)
Source: Industry data, I-Sec research.
Indian generics companies are well positioned to harvest the aforementioned opportunity considering the strong ANDA pipeline already in place, focus on complex and differentiated product filings, and the past successes in garnering a meaningful market share.
Strides Shasun Ltd, November 14, 2017 ICICI Securities
19
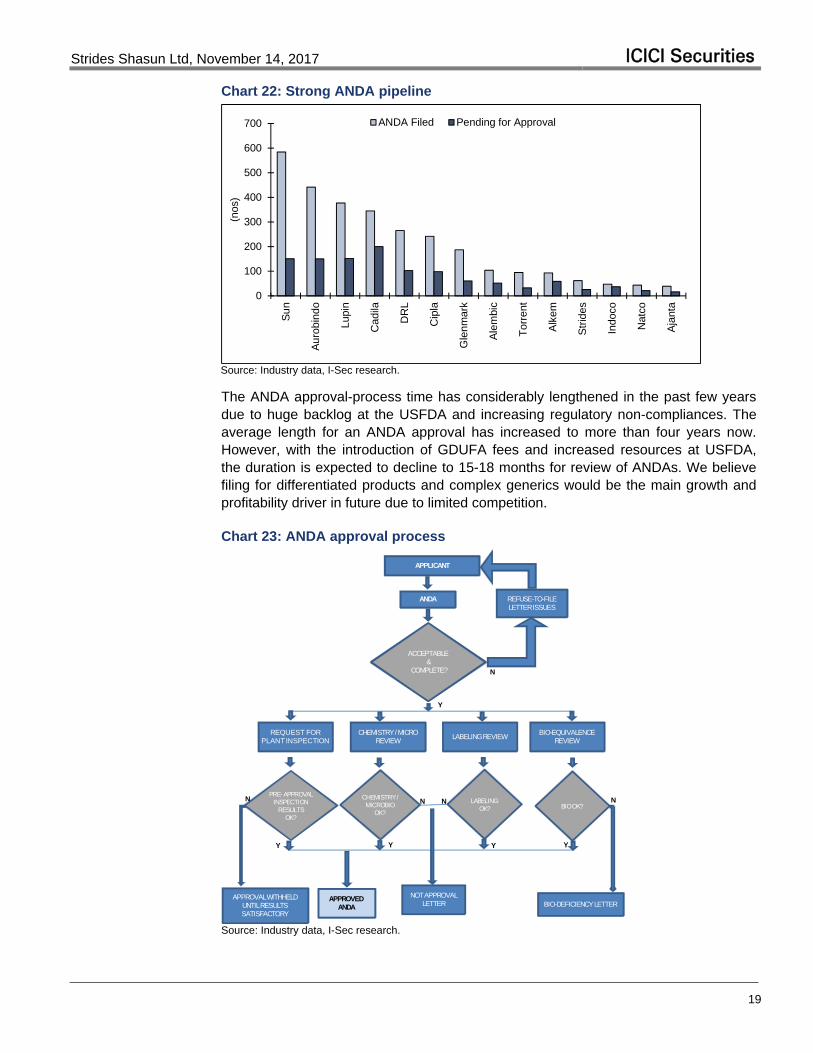
Chart 22: Strong ANDA pipeline
0
100
200
300
400
500
600
700
Su
n
Au
robi
ndo
Lupi
n
Cad
ila
DR
L
Cip
la
Gle
nmar
k
Ale
mbi
c
Tor
rent
Alk
em
Str
ides
Indo
co
Nat
co
Aja
nta
(nos
)
ANDA Filed Pending for Approval
Source: Industry data, I-Sec research.
The ANDA approval-process time has considerably lengthened in the past few years due to huge backlog at the USFDA and increasing regulatory non-compliances. The average length for an ANDA approval has increased to more than four years now. However, with the introduction of GDUFA fees and increased resources at USFDA, the duration is expected to decline to 15-18 months for review of ANDAs. We believe filing for differentiated products and complex generics would be the main growth and profitability driver in future due to limited competition.
Chart 23: ANDA approval process
APPLICANT
ANDA
ACCEPTABLE &
COMPLETE?
REFUSE-TO-FILE LETTER ISSUES
REQUEST FOR PLANTINSPECTION
CHEMISTRY / MICRO REVIEW
LABELINGREVIEWBIO-EQUIVALENCE
REVIEW
PRE-APPROVAL INSPECTION
RESULTS OK?
CHEMISTRY / MICROBIO
OK?
LABELING OK? BIO OK?
APPROVALWITHHELD UNTIL RESULTS SATISFACTORY
APPROVED ANDA
NOT APPROVAL LETTER BIO-DEFICIENCY LETTER
Y Y Y Y
Y
N N N N
N
Source: Industry data, I-Sec research.

Strides Shasun Ltd, November 14, 2017 ICICI Securities
20
India formulations industry going through regulatory challenges
The branded formulations business in India has a structurally strong business model, sustainable revenue stream from established brands, a growing population base, strong R&D capabilities and a high degree of profitability.
Regulatory challenges have risen in the recent past in terms of growing list of NLEM (products under price control) and the ongoing issue of FDC (Fixed Dose Combinations) ban. However, we believe these are temporary hiccups and would settle to a new base in FY17.
We expect the approximate mid-teen revenue growth to continue, considering increasing urbanisation leading to chronic diseases, greater awareness and rising healthcare spend.
Structurally positive business model
We expect the steady growth momentum in the Indian pharmaceutical market (domestic formulations) to continue, boosted by the rising share of chronic categories in lifestyle disorders, mounting per-capita income, rising share of medical expenditure in consumer spend and volume growth. Overall, we expect revenues of the Indian pharmaceutical sector to register 10-11% CAGR over FY17-22, to over Rs1.8tn, in line with its past average (except CY13, which was hit by implementation of the new drug-pricing policy). Key growth driver would be the increasing incidence of chronic diseases.
Chart 24: Growth in the Indian pharmaceutical sector
10.4
17.9
15.6
12.1
7.0
12.712.5
10.2
0.0
2.0
4.0
6.0
8.0
10.0
12.0
14.0
16.0
18.0
20.0
-
200
400
600
800
1,000
1,200
1,400
1,600
1,800
2,000
FY10 FY11 FY12 FY13 FY14 FY15 FY16 FY17P FY18E FY22E
(Rs
bn)
Sales % Growth (RHS)
Source: Industry data, I-Sec research
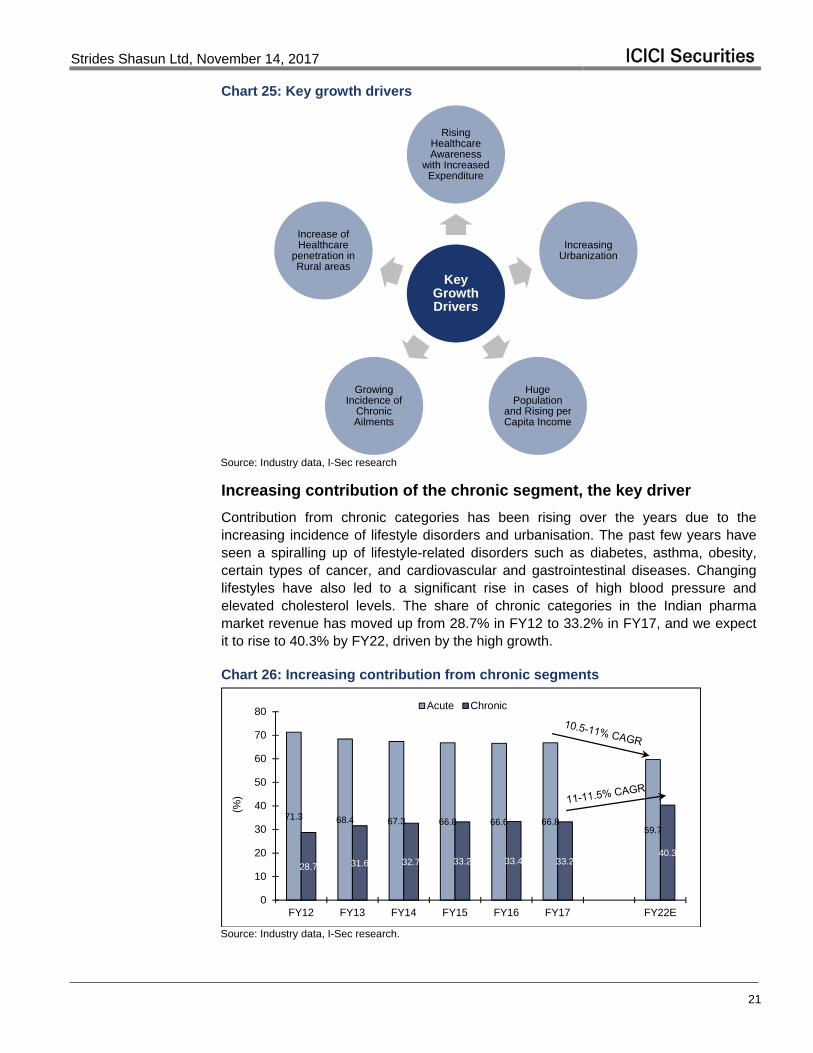
We believe qualitative factors such as increasing healthcare awareness, urbanisation spread, population size, better access to essential medicines, and higher healthcare penetration would play crucial roles in sustaining the strong growth in the domestic pharmaceutical market.
Strides Shasun Ltd, November 14, 2017 ICICI Securities
21
Chart 25: Key growth drivers
Key Growth Drivers
Rising Healthcare Awareness
with Increased Expenditure
Increasing Urbanization
Huge Population
and Rising per Capita Income
Growing Incidence of
Chronic Ailments
Increase of Healthcare
penetration in Rural areas
Source: Industry data, I-Sec research
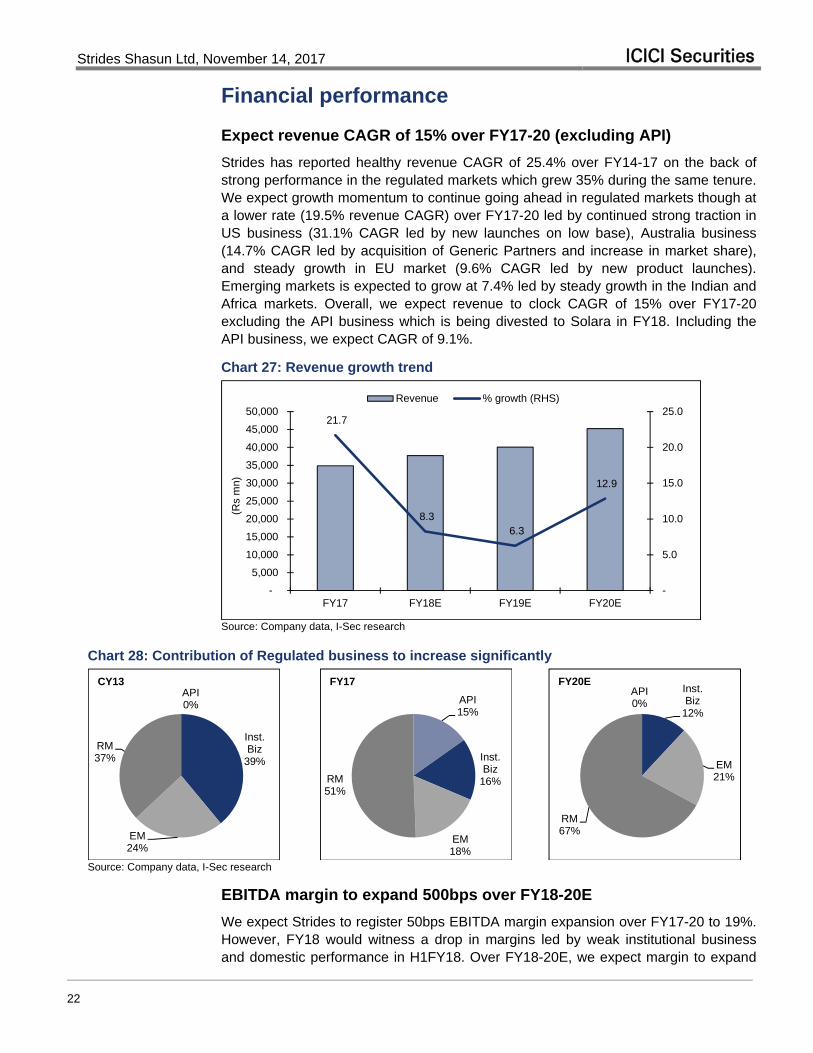
Increasing contribution of the chronic segment, the key driver
Contribution from chronic categories has been rising over the years due to the increasing incidence of lifestyle disorders and urbanisation. The past few years have seen a spiralling up of lifestyle-related disorders such as diabetes, asthma, obesity, certain types of cancer, and cardiovascular and gastrointestinal diseases. Changing lifestyles have also led to a significant rise in cases of high blood pressure and elevated cholesterol levels. The share of chronic categories in the Indian pharma market revenue has moved up from 28.7% in FY12 to 33.2% in FY17, and we expect it to rise to 40.3% by FY22, driven by the high growth.
Chart 26: Increasing contribution from chronic segments
71.3 68.4 67.3 66.8 66.6 66.859.7
28.7 31.6 32.7 33.2 33.4 33.240.3
0
10
20
30
40
50
60
70
80
FY12 FY13 FY14 FY15 FY16 FY17 FY22E
(%)
Acute Chronic
Source: Industry data, I-Sec research.
Strides Shasun Ltd, November 14, 2017 ICICI Securities
22
Financial performance
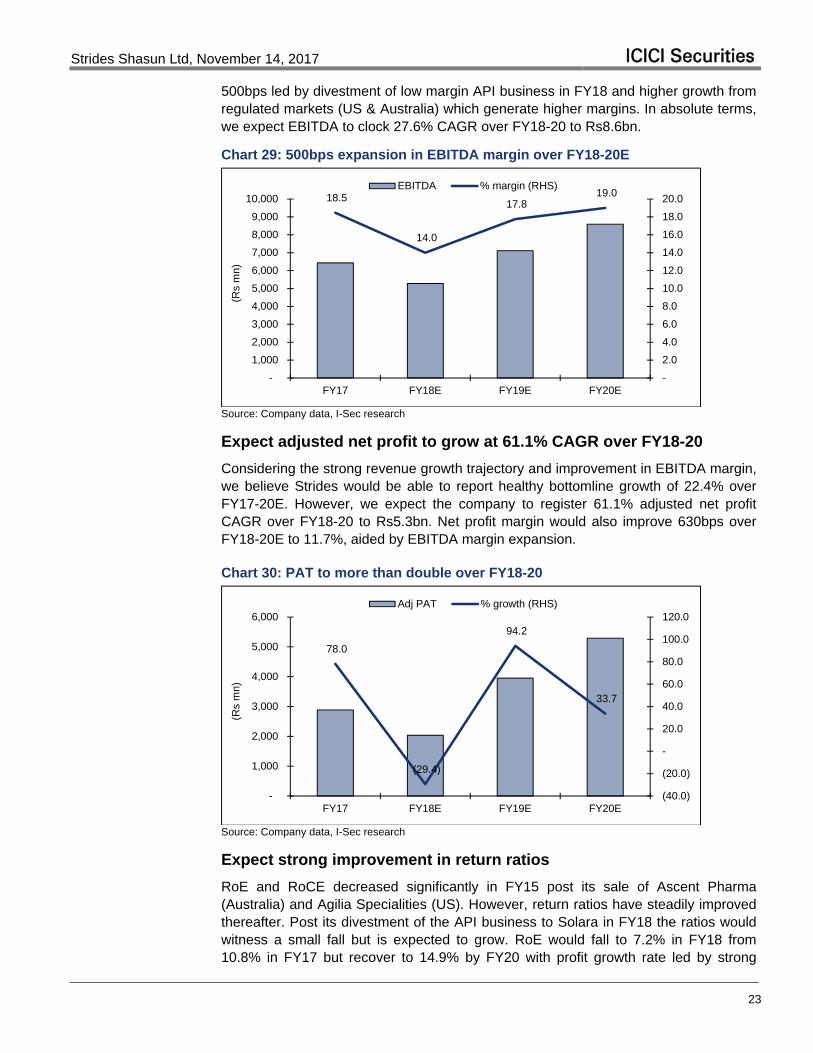
Expect revenue CAGR of 15% over FY17-20 (excluding API)
Strides has reported healthy revenue CAGR of 25.4% over FY14-17 on the back of strong performance in the regulated markets which grew 35% during the same tenure. We expect growth momentum to continue going ahead in regulated markets though at a lower rate (19.5% revenue CAGR) over FY17-20 led by continued strong traction in US business (31.1% CAGR led by new launches on low base), Australia business (14.7% CAGR led by acquisition of Generic Partners and increase in market share), and steady growth in EU market (9.6% CAGR led by new product launches). Emerging markets is expected to grow at 7.4% led by steady growth in the Indian and Africa markets. Overall, we expect revenue to clock CAGR of 15% over FY17-20 excluding the API business which is being divested to Solara in FY18. Including the API business, we expect CAGR of 9.1%.
Chart 27: Revenue growth trend
21.7
8.3 6.3
12.9
-
5.0
10.0
15.0
20.0
25.0
-
5,000
10,000
15,000
20,000
25,000
30,000
35,000
40,000
45,000
50,000
FY17 FY18E FY19E FY20E
(Rs
mn)
Revenue % growth (RHS)
Source: Company data, I-Sec research
Chart 28: Contribution of Regulated business to increase significantly
API0%
Inst. Biz
39%
EM24%
RM37%
CY13
API15%
Inst. Biz
16%
EM18%
RM51%
FY17
API0%
Inst. Biz
12%
EM21%
RM67%
FY20E
Source: Company data, I-Sec research
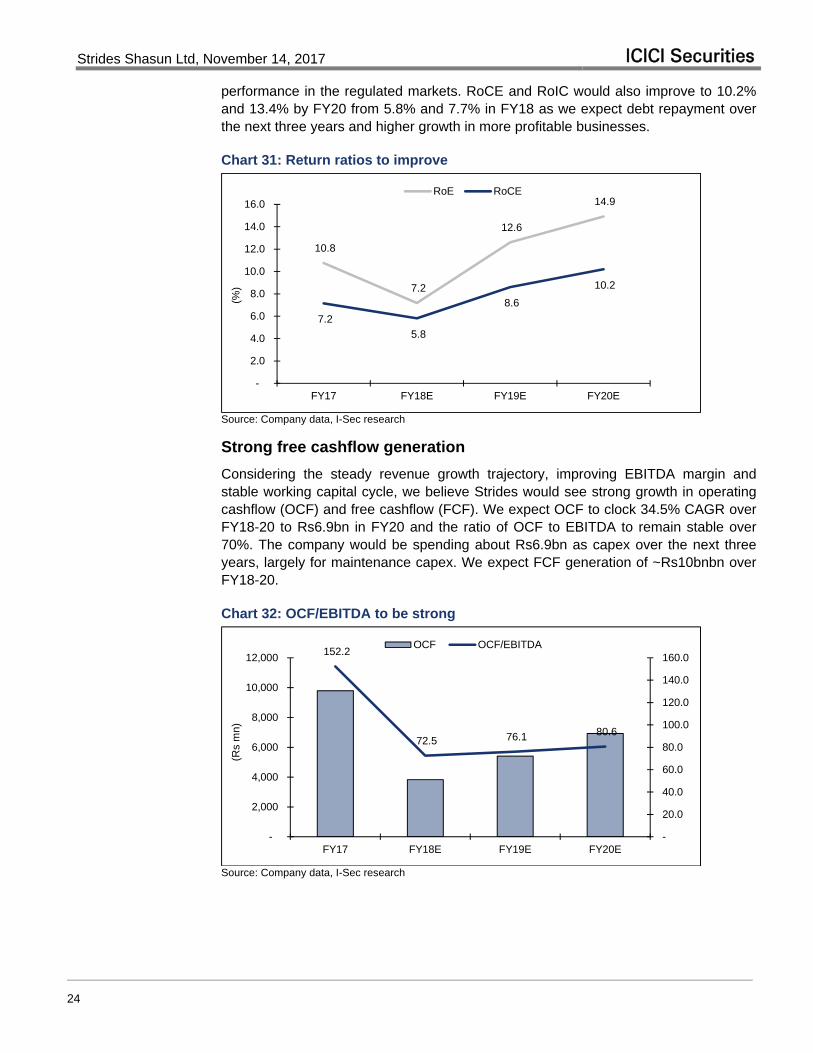
EBITDA margin to expand 500bps over FY18-20E
We expect Strides to register 50bps EBITDA margin expansion over FY17-20 to 19%. However, FY18 would witness a drop in margins led by weak institutional business and domestic performance in H1FY18. Over FY18-20E, we expect margin to expand
Strides Shasun Ltd, November 14, 2017 ICICI Securities
23
500bps led by divestment of low margin API business in FY18 and higher growth from regulated markets (US & Australia) which generate higher margins. In absolute terms, we expect EBITDA to clock 27.6% CAGR over FY18-20 to Rs8.6bn.
Chart 29: 500bps expansion in EBITDA margin over FY18-20E
18.5
14.0
17.8 19.0
-
2.0
4.0
6.0
8.0
10.0
12.0
14.0
16.0
18.0
20.0
-
1,000
2,000
3,000
4,000
5,000
6,000
7,000
8,000
9,000
10,000
FY17 FY18E FY19E FY20E
(Rs
mn)
EBITDA % margin (RHS)
Source: Company data, I-Sec research
Expect adjusted net profit to grow at 61.1% CAGR over FY18-20
Considering the strong revenue growth trajectory and improvement in EBITDA margin, we believe Strides would be able to report healthy bottomline growth of 22.4% over FY17-20E. However, we expect the company to register 61.1% adjusted net profit CAGR over FY18-20 to Rs5.3bn. Net profit margin would also improve 630bps over FY18-20E to 11.7%, aided by EBITDA margin expansion.
Chart 30: PAT to more than double over FY18-20
78.0
(29.4)
94.2
33.7
(40.0)
(20.0)
-
20.0
40.0
60.0
80.0
100.0
120.0
-
1,000
2,000
3,000
4,000
5,000
6,000
FY17 FY18E FY19E FY20E
(Rs
mn)
Adj PAT % growth (RHS)
Source: Company data, I-Sec research
Expect strong improvement in return ratios
RoE and RoCE decreased significantly in FY15 post its sale of Ascent Pharma (Australia) and Agilia Specialities (US). However, return ratios have steadily improved thereafter. Post its divestment of the API business to Solara in FY18 the ratios would witness a small fall but is expected to grow. RoE would fall to 7.2% in FY18 from 10.8% in FY17 but recover to 14.9% by FY20 with profit growth rate led by strong
Strides Shasun Ltd, November 14, 2017 ICICI Securities
24
performance in the regulated markets. RoCE and RoIC would also improve to 10.2% and 13.4% by FY20 from 5.8% and 7.7% in FY18 as we expect debt repayment over the next three years and higher growth in more profitable businesses.
Chart 31: Return ratios to improve
10.8
7.2
12.6
14.9
7.2
5.8
8.6
10.2
-
2.0
4.0
6.0
8.0
10.0
12.0
14.0
16.0
FY17 FY18E FY19E FY20E
(%)
RoE RoCE
Source: Company data, I-Sec research
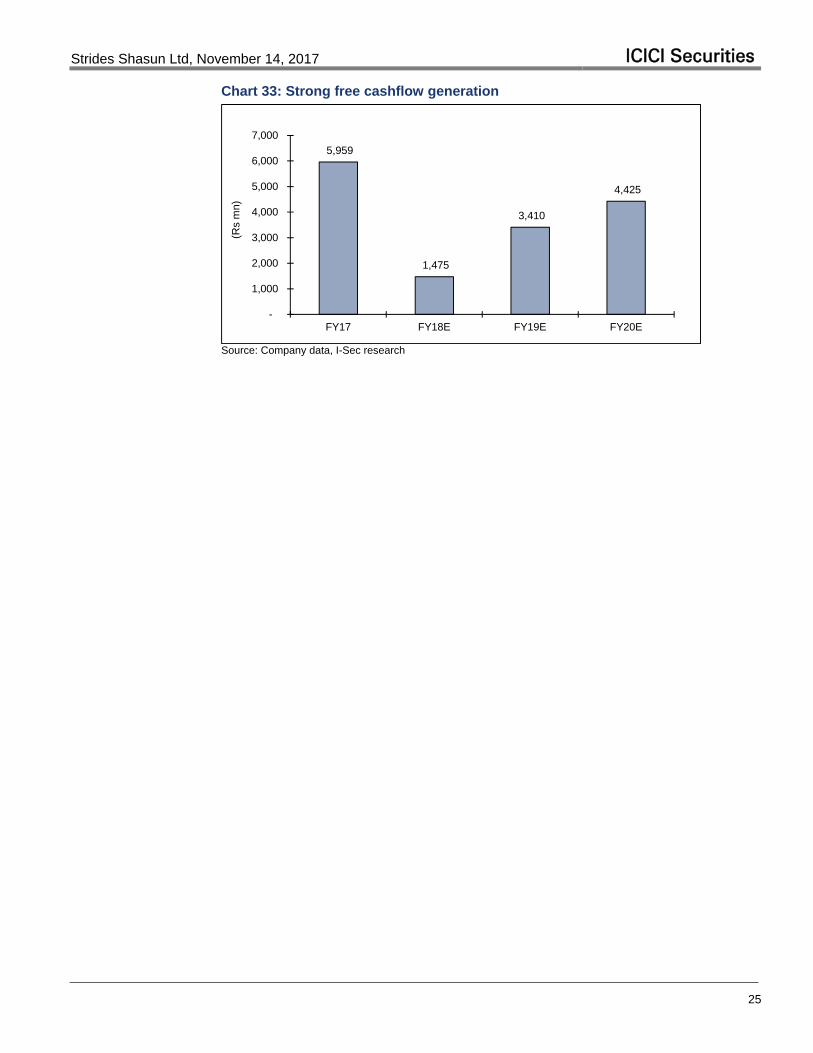
Strong free cashflow generation
Considering the steady revenue growth trajectory, improving EBITDA margin and stable working capital cycle, we believe Strides would see strong growth in operating cashflow (OCF) and free cashflow (FCF). We expect OCF to clock 34.5% CAGR over FY18-20 to Rs6.9bn in FY20 and the ratio of OCF to EBITDA to remain stable over 70%. The company would be spending about Rs6.9bn as capex over the next three years, largely for maintenance capex. We expect FCF generation of ~Rs10bnbn over FY18-20.
Chart 32: OCF/EBITDA to be strong
152.2
72.5 76.1 80.6
-
20.0
40.0
60.0
80.0
100.0
120.0
140.0
160.0
-
2,000
4,000
6,000
8,000
10,000
12,000
FY17 FY18E FY19E FY20E
(Rs
mn)
OCF OCF/EBITDA
Source: Company data, I-Sec research
Strides Shasun Ltd, November 14, 2017 ICICI Securities
25
Chart 33: Strong free cashflow generation
5,959
1,475
3,410
4,425
-
1,000
2,000
3,000
4,000
5,000
6,000
7,000
FY17 FY18E FY19E FY20E
(Rs
mn)
Source: Company data, I-Sec research
Strides Shasun Ltd, November 14, 2017 ICICI Securities
26
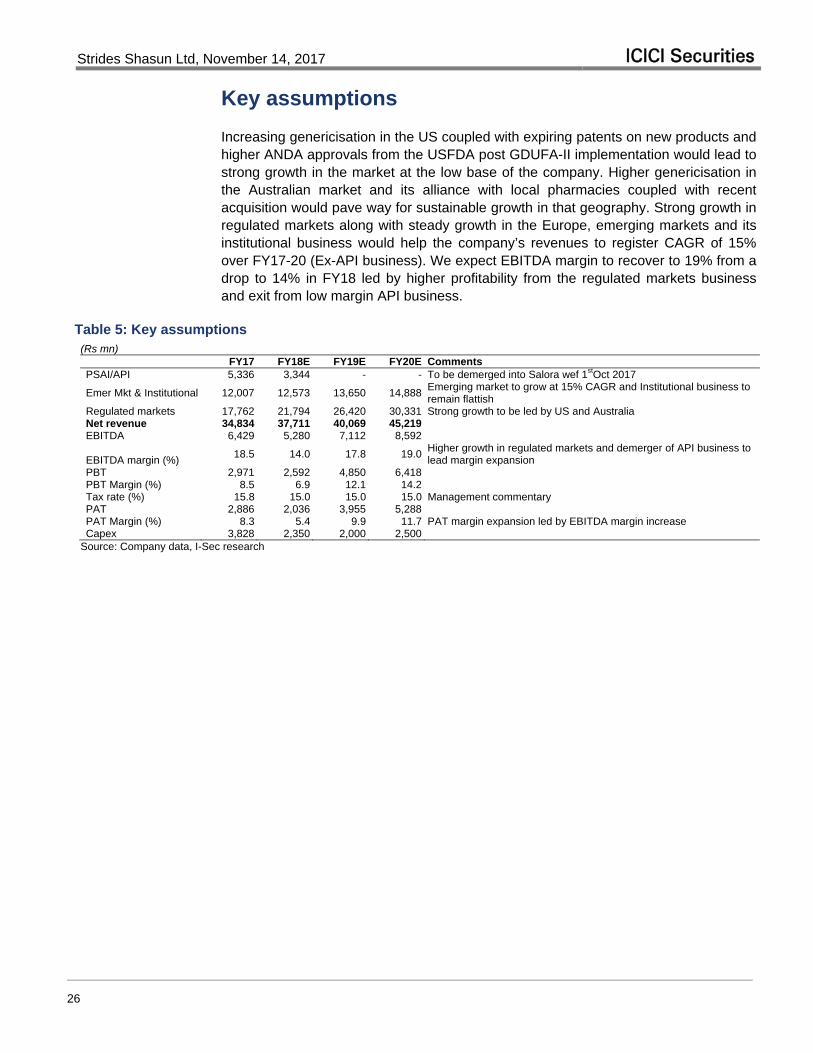
Key assumptions
Increasing genericisation in the US coupled with expiring patents on new products and higher ANDA approvals from the USFDA post GDUFA-II implementation would lead to strong growth in the market at the low base of the company. Higher genericisation in the Australian market and its alliance with local pharmacies coupled with recent acquisition would pave way for sustainable growth in that geography. Strong growth in regulated markets along with steady growth in the Europe, emerging markets and its institutional business would help the company’s revenues to register CAGR of 15% over FY17-20 (Ex-API business). We expect EBITDA margin to recover to 19% from a drop to 14% in FY18 led by higher profitability from the regulated markets business and exit from low margin API business.
Table 5: Key assumptions (Rs mn) FY17 FY18E FY19E FY20E Comments PSAI/API 5,336 3,344 - - To be demerged into Salora wef 1stOct 2017
Emer Mkt & Institutional 12,007 12,573 13,650 14,888 Emerging market to grow at 15% CAGR and Institutional business to remain flattish
Regulated markets 17,762 21,794 26,420 30,331 Strong growth to be led by US and Australia Net revenue 34,834 37,711 40,069 45,219 EBITDA 6,429 5,280 7,112 8,592
EBITDA margin (%) 18.5 14.0 17.8 19.0
Higher growth in regulated markets and demerger of API business to lead margin expansion
PBT 2,971 2,592 4,850 6,418 PBT Margin (%) 8.5 6.9 12.1 14.2 Tax rate (%) 15.8 15.0 15.0 15.0 Management commentary PAT 2,886 2,036 3,955 5,288 PAT Margin (%) 8.3 5.4 9.9 11.7 PAT margin expansion led by EBITDA margin increase Capex 3,828 2,350 2,000 2,500 Source: Company data, I-Sec research

Strides Shasun Ltd, November 14, 2017 ICICI Securities
27
Valuations and risks
We expect Strides’ earnings to clock CAGR of 61.1% over FY18-20 driven by revenue CAGR of 9.5% and EBITDA margin expansion from 14% in FY18 to 19% in FY20. Further, RoE and RoCE would improve significantly considering huge PAT growth and demerger of API business. We believe the valuation has upside potential considering the company’s clear USFDA records, new launches and low base to drive strong growth in US, pick up in the Australia business post its acquisition of Generics Partners and Arrow’s pact with Pharmacy Alliance.
The stock currently trades at attractive valuations of 17.7x FY19E and 13.2x FY20E earnings and EV/EBITDA multiple of 12.4x FY19E and 9.8x FY20E. The stock has traded at an average P/E of 38x 1-year forward earnings over past two years and has recently fallen due to weak H1FY18 performance and industry concern for US generic pricing. Our estimates are significantly lower than consensus (15-30% on EPS) and downside looks protected as valuation also appear reasonable on our estimates at 13.2x FY20E EPS vs peers’ average of 16.4x FY20E. Hence, we initiate coverage on Strides with a BUY rating and SoTP-based target price of Rs1,002/share, upside potential of 28.2%. We value the stock at P/E of 18xSep’19E EPS of continuing business and Rs72/share for value in API business (Salora – 60% stake for Strides’ shareholders) based on 8xSep’19E EBITDA.
Chart 34: 1-year forward P/E
10
20
30
40
50
Nov
-15
Dec
-15
Feb
-16
Mar
-16
May
-16
Jun
-16
Au
g-16
Se
p-16
Nov
-16
Dec
-16
Feb
-17
Mar
-17
May
-17
Jun
-17
Au
g-17
Se
p-17
Nov
-17
(x)
STR P/E -1 Std Dev. Mean +1 Std Dev.
Source: Bloomberg, I-Sec research

Strides Shasun Ltd, November 14, 2017 ICICI Securities
28
Table 6: Comparative valuations
Company CMP (Rs)
M-Cap (Rs bn)
Revenue CAGR %
(FY18-FY20)
EV/Sales (x) EBITDA CAGR %
(FY18-FY20)
EV/EBITDA (x) EPS CAGR (%) (FY18-
FY20)
P/E (x)
FY19E FY20E FY19E FY20E FY19E FY20E Alembic 516 97 15.6 2.6 2.2 23.9 11.7 9.5 25.1 18.1 15.2 Alkem 1,995 239 14.5 3.2 2.7 22.3 16.8 13.9 26.4 20.7 17.3 Aurobindo 709 415 8.3 2.3 2.0 7.2 9.7 8.4 9.5 14.6 13.2 Cadila 448 459 11.5 3.6 3.1 10.1 14.5 12.2 11.6 19.2 16.4 Cipla 605 487 12.8 2.7 2.5 17.4 13.3 11.8 23.1 23.6 19.4 Dr Reddy's 2,337 388 11.9 2.5 2.2 23.2 12.6 10.7 36.8 20.3 16.8 Glenmark 587 166 8.9 1.9 1.7 9.1 9.4 8.0 12.2 15.4 12.9 Lupin 840 379 11.4 2.4 2.0 18.3 11.0 8.8 22.8 19.2 15.2 Natco 932 163 11.3 5.2 4.8 7.4 13.0 13.1 10.0 18.0 18.5 Shilpa Medicare 642 51 23.5 4.8 3.9 29.5 17.6 13.9 38.3 21.7 17.9 Sun 526 1,262 12.8 3.4 2.9 23.4 13.6 11.0 27.5 21.6 18.3 Torrent Pharma 1,258 213 13.6 3.0 2.6 16.2 12.9 10.9 23.3 18.9 15.8 Strides Shasun 782 70 9.5 2.2 1.9 27.6 12.4 9.8 61.1 17.7 13.2
Company ROE (%) ROCE (%) ROIC (%) EBITDA Margin (%) Net D/E (x)
FY19E FY20E FY19E FY20E FY19E FY20E FY19E FY20E FY19E FY20E Alembic 22.3 22.3 20.1 20.9 20.5 22.2 22.4 23.1 (0.0) 0.1 Alkem 20.7 21.1 18.9 19.9 18.2 20.0 18.8 19.5 (0.0) (0.1) Aurobindo 21.9 20.0 19.0 18.5 21.4 22.3 23.2 23.5 (0.0) (0.2) Cadila 25.0 24.2 18.9 20.3 19.3 21.3 25.0 25.4 0.1 (0.0) Cipla 13.9 14.9 11.2 12.6 11.9 13.8 20.4 21.1 0.0 (0.1) Dr Reddy's 13.5 14.6 12.5 13.6 12.4 13.6 19.8 20.7 0.1 0.0 Glenmark 18.2 18.5 12.6 13.5 14.4 15.5 20.7 21.2 0.4 0.3 Lupin 12.5 14.2 9.1 11.0 10.2 12.4 21.7 23.4 0.2 0.1 Natco 34.6 26.3 33.5 25.8 39.3 35.5 40.2 36.9 (0.2) (0.3) Shilpa Medicare 20.2 20.3 16.4 16.9 19.6 20.6 27.3 28.0 (0.0) (0.1) Sun 14.0 14.7 11.2 12.0 14.8 16.7 24.9 26.2 (0.3) (0.4) Torrent Pharma 21.0 21.7 17.1 18.9 20.3 22.7 23.6 23.8 (0.0) (0.1) Strides Shasun 12.6 14.9 8.6 10.2 11.3 13.4 17.8 19.0 0.6 0.4
Source: I-Sec research
Risks
Regulatory hurdles
USFDA has become stringent in its inspection over the past few years. Currently all Strides facilities are approved; however, several of its facilities are due for inspection. Any non-compliance could lead to a disruption to supplies in US which is a key growth market for the company.
Delay in profitability improvement in regulated markets
We have assumed >14% EBITDA margin in the company’s regulated market FY18 onwards considering strong growth in these markets on a low base. Any delay in new product launches would adversely affect its profitability and in turn impact its growth trajectory.
Currency volatility
Strides generates more than 85% of its revenues from exports, hence adverse volatility in the currency markets would negatively impact the financials.

Strides Shasun Ltd, November 14, 2017 ICICI Securities
29
Company background and key management personnel
Company profile
Strides Ltd. was incorporated in 1990 as Strides Arcolab Ltd in Bangalore. It was launched the formulations business for emerging market with third-party manufacturing. Post divestment of Ascent (Australia’s branded business) in 2012 and Agila (injectables vertical) in 2013, the company entered a restructuring phase post which it has emerged as a diversified, vertically integrated, global pharmaceutical company.
Chart 35: Revenue mix
API15%
Inst. Biz16%
EM18%
RM51%
FY17
Source: Company data, I-Sec research
Currently, it focuses on developing niche and complex pharmaceutical products across a wide dosage format for regulated and emerging markets. The company has a portfolio of 26 approved products in the US spanning across soft gel capsules, hard gel capsules, tablets, liquids, creams and ointments, modified and extended release products. The company has undergone several successful inspections from different regulatory bodies around the world highlighting their strong adherence to compliance and quality.
Table 7: Key management personnel Name Designation Background Mr. Arun Kumar
Founder, Chairman
Has moved to a Non-Executive position effective May 18, 2017. He has been on the Board since inception of the Company in 1990. He holds a degree in Commerce. He was earlier the General Manager of British Pharmaceuticals Limited.
Mr. Shashank Sinha
Managing Director
He completed his MBA from IIM-Lucknow post engineering. He is associated with the company since 2016 and was appointed to the board in May’17. He has a variety of work experience and developed business acumen working at Huhtamaki Oyj, Godrej Consumer, Sara Lee, Reckitt Benckiser and Navis Capital.
Mr. Badree Komandur
Executive director
As a CA, CS, CWA he brings immense financial expertise to the company since Feb’10 when he joined as Group CFO. In May’17, he was appointed to board bringing in 15 years of experience at IT and engineering companies.
Mr. Ramaraju P.V.S
Chief Operating Officer
He has over 23 years of experience in the pharmaceutical industry and specialises in Manufacturing, Quality, Engineering, Sourcing, Warehouse, Distribution, and Planning & Accounts Functions. He is associated with the company for ten years and has led several successful inspections.
Source: Company

Strides Shasun Ltd, November 14, 2017 ICICI Securities
30
Financials
Table 8: Profit and Loss statement (Rs mn, year ending Mar 31)
FY16 FY17 FY18E FY19E FY20E
PSAI/API 7,314 5,336 3,344 - -
Emer Mkt & Insti. Biz 9,790 12,007 12,573 13,650 14,888
Regulated markets 11,395 17,762 21,794 26,420 30,331
Net Sales 28,622 34,834 37,711 40,069 45,219
Less:
Cost of material consumed 15,023 15,362 17,536 17,029 18,766
Employee cost 3,577 5,881 6,411 6,712 7,461
R&D cost 757 1,361 1,697 2,003 2,261
Others 5,125 5,801 6,788 7,212 8,139
Total Operating Expenses 24,482 28,406 32,431 32,957 36,627
EBITDA 4,140 6,429 5,280 7,112 8,592
Depreciation 1,313 1,872 1,914 1,917 2,119
Other income 874 1,689 1,141 1,211 1,289
EBIT 3,701 6,247 4,506 6,407 7,761
Less: Financial expenses 1,682 2,269 1,914 1,557 1,343
Recurring Pre-tax Income 1,606 2,971 2,592 4,850 6,418
Less: Taxation 425 470 389 727 963
Less: Minority Interest (135) 462 167 167 167 Add: Profit/Loss from discontinued operations
(231) 1,959 - - -
Net Income (Adjusted) 1,621 2,886 2,036 3,955 5,288
Extraordinary Items (414) (1,006) - - -
Reported Net Income 1,085 3,998 2,036 3,955 5,288 Source: Company data, I-Sec research
Strides Shasun Ltd, November 14, 2017 ICICI Securities
31
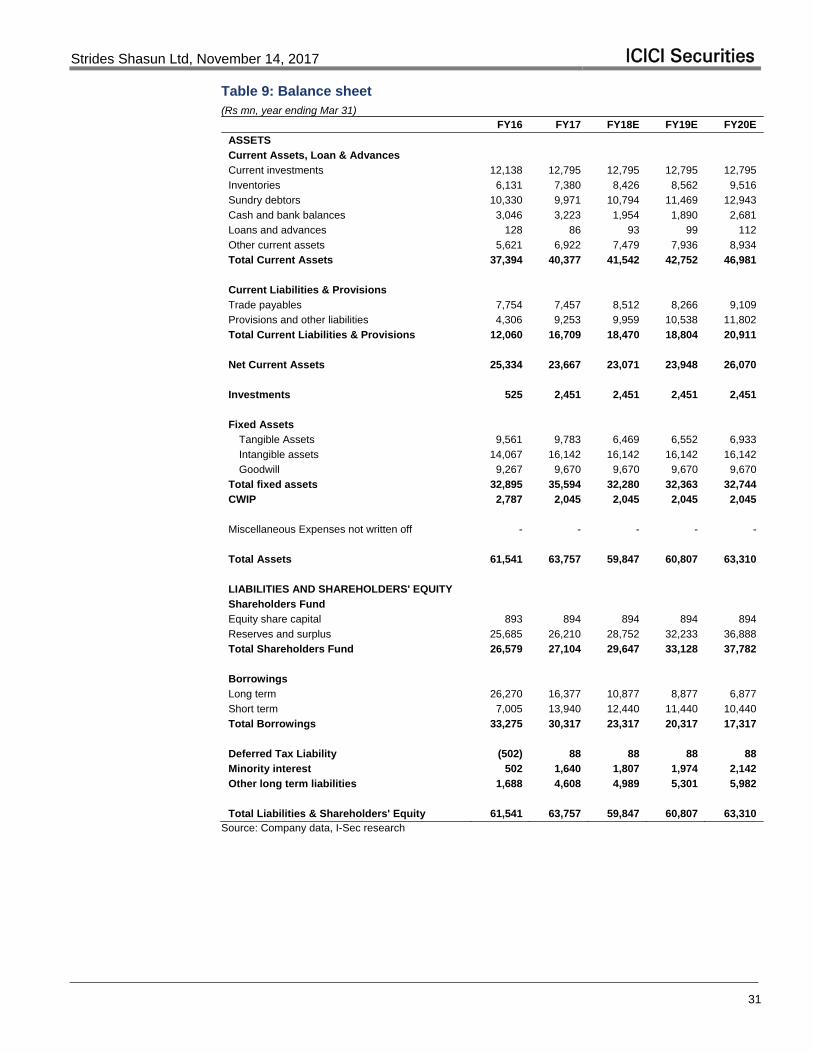
Table 9: Balance sheet (Rs mn, year ending Mar 31)
FY16 FY17 FY18E FY19E FY20E
ASSETS
Current Assets, Loan & Advances
Current investments 12,138 12,795 12,795 12,795 12,795
Inventories 6,131 7,380 8,426 8,562 9,516
Sundry debtors 10,330 9,971 10,794 11,469 12,943
Cash and bank balances 3,046 3,223 1,954 1,890 2,681
Loans and advances 128 86 93 99 112
Other current assets 5,621 6,922 7,479 7,936 8,934
Total Current Assets 37,394 40,377 41,542 42,752 46,981
Current Liabilities & Provisions
Trade payables 7,754 7,457 8,512 8,266 9,109
Provisions and other liabilities 4,306 9,253 9,959 10,538 11,802
Total Current Liabilities & Provisions 12,060 16,709 18,470 18,804 20,911
Net Current Assets 25,334 23,667 23,071 23,948 26,070
Investments 525 2,451 2,451 2,451 2,451
Fixed Assets
Tangible Assets 9,561 9,783 6,469 6,552 6,933
Intangible assets 14,067 16,142 16,142 16,142 16,142
Goodwill 9,267 9,670 9,670 9,670 9,670
Total fixed assets 32,895 35,594 32,280 32,363 32,744
CWIP 2,787 2,045 2,045 2,045 2,045
Miscellaneous Expenses not written off - - - - -
Total Assets 61,541 63,757 59,847 60,807 63,310
LIABILITIES AND SHAREHOLDERS' EQUITY
Shareholders Fund
Equity share capital 893 894 894 894 894
Reserves and surplus 25,685 26,210 28,752 32,233 36,888
Total Shareholders Fund 26,579 27,104 29,647 33,128 37,782
Borrowings
Long term 26,270 16,377 10,877 8,877 6,877
Short term 7,005 13,940 12,440 11,440 10,440
Total Borrowings 33,275 30,317 23,317 20,317 17,317
Deferred Tax Liability (502) 88 88 88 88
Minority interest 502 1,640 1,807 1,974 2,142
Other long term liabilities 1,688 4,608 4,989 5,301 5,982
Total Liabilities & Shareholders' Equity 61,541 63,757 59,847 60,807 63,310 Source: Company data, I-Sec research
Strides Shasun Ltd, November 14, 2017 ICICI Securities
32
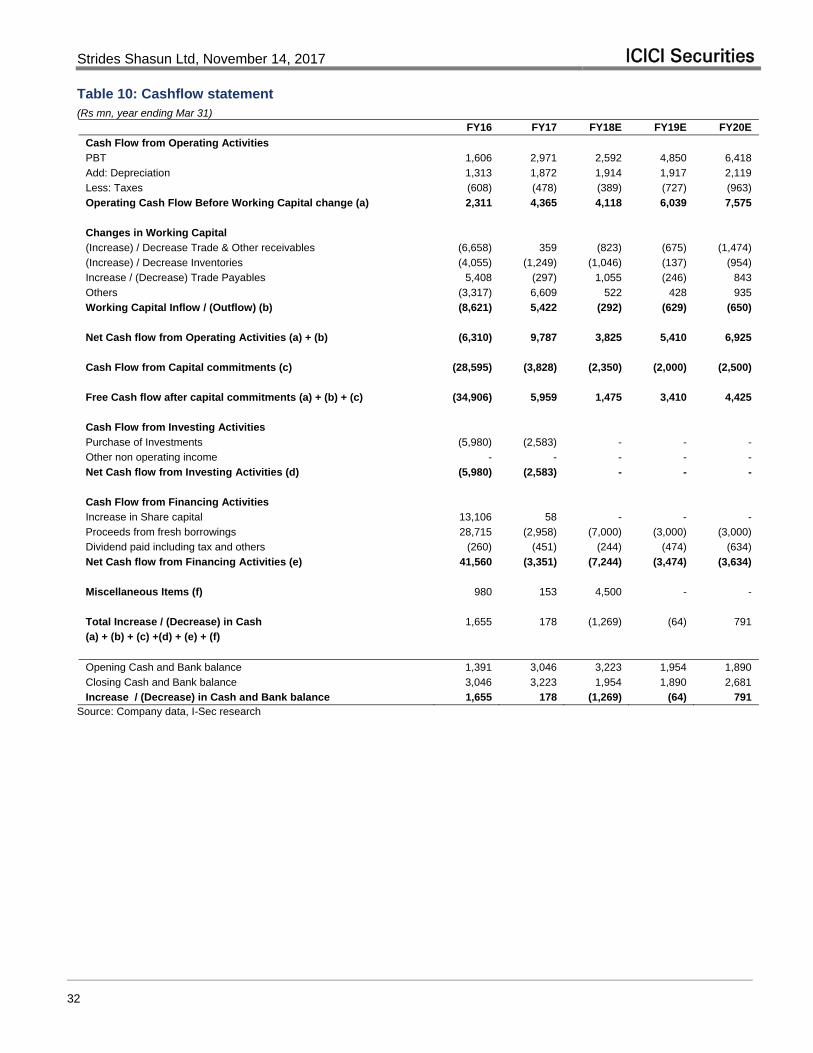
Table 10: Cashflow statement (Rs mn, year ending Mar 31)
FY16 FY17 FY18E FY19E FY20E
Cash Flow from Operating Activities
PBT 1,606 2,971 2,592 4,850 6,418
Add: Depreciation 1,313 1,872 1,914 1,917 2,119
Less: Taxes (608) (478) (389) (727) (963)
Operating Cash Flow Before Working Capital change (a) 2,311 4,365 4,118 6,039 7,575
Changes in Working Capital
(Increase) / Decrease Trade & Other receivables (6,658) 359 (823) (675) (1,474)
(Increase) / Decrease Inventories (4,055) (1,249) (1,046) (137) (954)
Increase / (Decrease) Trade Payables 5,408 (297) 1,055 (246) 843
Others (3,317) 6,609 522 428 935
Working Capital Inflow / (Outflow) (b) (8,621) 5,422 (292) (629) (650)
Net Cash flow from Operating Activities (a) + (b) (6,310) 9,787 3,825 5,410 6,925
Cash Flow from Capital commitments (c) (28,595) (3,828) (2,350) (2,000) (2,500)
Free Cash flow after capital commitments (a) + (b) + (c) (34,906) 5,959 1,475 3,410 4,425
Cash Flow from Investing Activities
Purchase of Investments (5,980) (2,583) - - -
Other non operating income - - - - -
Net Cash flow from Investing Activities (d) (5,980) (2,583) - - -
Cash Flow from Financing Activities
Increase in Share capital 13,106 58 - - -
Proceeds from fresh borrowings 28,715 (2,958) (7,000) (3,000) (3,000)
Dividend paid including tax and others (260) (451) (244) (474) (634)
Net Cash flow from Financing Activities (e) 41,560 (3,351) (7,244) (3,474) (3,634)
Miscellaneous Items (f) 980 153 4,500 - -
Total Increase / (Decrease) in Cash 1,655 178 (1,269) (64) 791
(a) + (b) + (c) +(d) + (e) + (f)
Opening Cash and Bank balance 1,391 3,046 3,223 1,954 1,890
Closing Cash and Bank balance 3,046 3,223 1,954 1,890 2,681
Increase / (Decrease) in Cash and Bank balance 1,655 178 (1,269) (64) 791 Source: Company data, I-Sec research

Strides Shasun Ltd, November 14, 2017 ICICI Securities
33
Table 11: Key ratios (Rs mn, year ending Mar 31)
FY16 FY17 FY18E FY19E FY20E
Per Share Data (Rs)
EPS 18.1 32.3 22.8 44.2 59.1
Cash EPS 32.8 53.2 44.2 65.7 82.8
Dividend per share (DPS) 2.9 5.0 2.7 5.3 7.1
Book Value per share (BV) 297.2 303.1 331.5 370.5 422.5
Growth (%)
Net Sales 139.3 21.7 8.3 6.3 12.9
EBITDA 80.9 55.3 (17.9) 34.7 20.8
PAT 78.0 (29.4) 94.2 33.7
Cash EPS 62.2 (17.0) 48.6 26.2
Valuation Ratios (x)
P/E 43.1 24.2 34.3 17.7 13.2
P/CEPS 23.8 14.7 17.7 11.9 9.4
P/BV 2.6 2.6 2.4 2.1 1.9
EV / EBITDA 24.2 15.1 17.3 12.4 9.8
EV / Sales 3.5 2.8 2.4 2.2 1.9
Operating Ratio
Raw Material / Sales (%) 52.5 44.1 46.5 42.5 41.5
Employee cost / Sales (%) 12.5 16.9 17.0 16.8 16.5
R&D / Sales (%) 2.6 3.9 4.5 5.0 5.0
SG&A / Sales (%) 17.9 16.7 18.0 18.0 18.0
Effective Tax Rate (%) 26.4 15.8 15.0 15.0 15.0
Working Capital (days) 75.2 95.4 99.6 102.6 102.0
Inventory Turnover (days) 61.2 86.8 88.9 94.1 90.1
Receivables (days) 89.3 106.4 100.5 101.4 98.5
Payables (days) 75.3 97.7 89.9 92.9 86.6
Net D/E Ratio (x) 0.3 1.1 1.0 0.7 0.6
Return/Profitability Ratio (%)
Net Income Margins (Adjusted) 5.7 8.3 5.4 9.9 11.7
RoACE 4.1 7.2 5.8 8.6 10.2
RoAE 8.5 10.8 7.2 12.6 14.9
Dividend Payout 0.4 0.6 0.3 0.7 0.9
Dividend Yield 0.0 0.0 0.0 0.0 0.0
EBITDA Margins 14.5 18.5 14.0 17.8 19.0 Source: Company data, I-Sec research
Strides Shasun Ltd, November 14, 2017 ICICI Securities
34
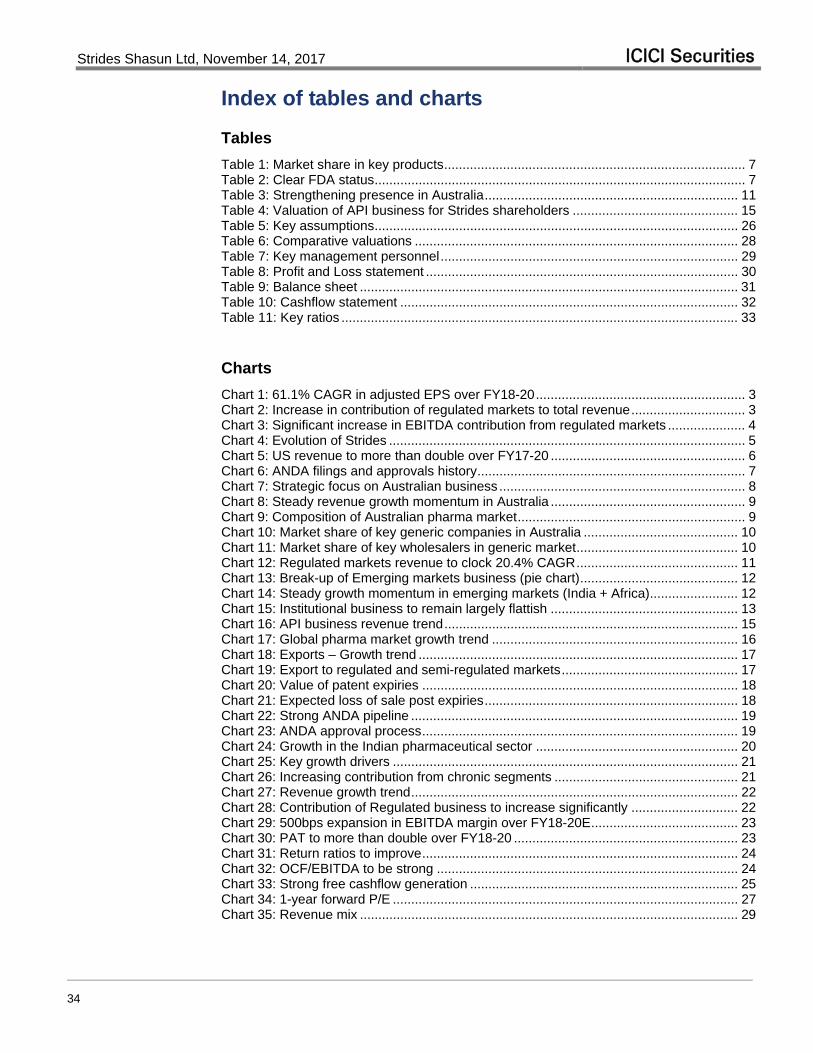
Index of tables and charts
Tables
Table 1: Market share in key products .................................................................................. 7 Table 2: Clear FDA status ..................................................................................................... 7 Table 3: Strengthening presence in Australia ..................................................................... 11 Table 4: Valuation of API business for Strides shareholders ............................................. 15 Table 5: Key assumptions ................................................................................................... 26 Table 6: Comparative valuations ........................................................................................ 28 Table 7: Key management personnel ................................................................................. 29 Table 8: Profit and Loss statement ..................................................................................... 30 Table 9: Balance sheet ....................................................................................................... 31 Table 10: Cashflow statement ............................................................................................ 32 Table 11: Key ratios ............................................................................................................ 33
Charts
Chart 1: 61.1% CAGR in adjusted EPS over FY18-20 ......................................................... 3 Chart 2: Increase in contribution of regulated markets to total revenue ............................... 3 Chart 3: Significant increase in EBITDA contribution from regulated markets ..................... 4 Chart 4: Evolution of Strides ................................................................................................. 5 Chart 5: US revenue to more than double over FY17-20 ..................................................... 6 Chart 6: ANDA filings and approvals history ......................................................................... 7 Chart 7: Strategic focus on Australian business ................................................................... 8 Chart 8: Steady revenue growth momentum in Australia ..................................................... 9 Chart 9: Composition of Australian pharma market .............................................................. 9 Chart 10: Market share of key generic companies in Australia .......................................... 10 Chart 11: Market share of key wholesalers in generic market ............................................ 10 Chart 12: Regulated markets revenue to clock 20.4% CAGR ............................................ 11 Chart 13: Break-up of Emerging markets business (pie chart) ........................................... 12 Chart 14: Steady growth momentum in emerging markets (India + Africa) ........................ 12 Chart 15: Institutional business to remain largely flattish ................................................... 13 Chart 16: API business revenue trend ................................................................................ 15 Chart 17: Global pharma market growth trend ................................................................... 16 Chart 18: Exports – Growth trend ....................................................................................... 17 Chart 19: Export to regulated and semi-regulated markets ................................................ 17 Chart 20: Value of patent expiries ...................................................................................... 18 Chart 21: Expected loss of sale post expiries ..................................................................... 18 Chart 22: Strong ANDA pipeline ......................................................................................... 19 Chart 23: ANDA approval process ...................................................................................... 19 Chart 24: Growth in the Indian pharmaceutical sector ....................................................... 20 Chart 25: Key growth drivers .............................................................................................. 21 Chart 26: Increasing contribution from chronic segments .................................................. 21 Chart 27: Revenue growth trend ......................................................................................... 22 Chart 28: Contribution of Regulated business to increase significantly ............................. 22 Chart 29: 500bps expansion in EBITDA margin over FY18-20E ........................................ 23 Chart 30: PAT to more than double over FY18-20 ............................................................. 23 Chart 31: Return ratios to improve ...................................................................................... 24 Chart 32: OCF/EBITDA to be strong .................................................................................. 24 Chart 33: Strong free cashflow generation ......................................................................... 25 Chart 34: 1-year forward P/E .............................................................................................. 27 Chart 35: Revenue mix ....................................................................................................... 29
Strides Shasun Ltd, November 14, 2017 ICICI Securities
35
This report may be distributed in Singapore by ICICI Securities, Inc. (Singapore branch). Any recipients of this report in Singapore should contact ICICI Securities, Inc. (Singapore branch) in respect of any matters arising from, or in connection with, this report. The contact details of ICICI Securities, Inc. (Singapore branch) are as follows: Address: 10 Collyer Quay, #37-16 Ocean Financial Tower, Singapore - 049315, Tel: +65 6232 2451 and email: [email protected], [email protected].
"In case of eligible investors based in Japan, charges for brokerage services on execution of transactions do not in substance constitute charge for research reports and no charges are levied for providing research reports to such investors."
New I-Sec investment ratings (all ratings based on absolute return; All ratings and target price refers to 12-month performance horizon, unless mentioned otherwise)
BUY: >15% return; ADD: 5% to 15% return; HOLD: Negative 5% to Positive 5% return; REDUCE: Negative 5% to Negative 15% return; SELL: < negative 15% return
ANALYST CERTIFICATION ANALYST CERTIFICATION We /I, Sriraam Rathi, CA; Vinay Bafna, MBA; Research Analysts, authors and the names subscribed to this report, hereby certify that all of the views expressed in this research report accurately reflect our views about the subject issuer(s) or securities. We also certify that no part of our compensation was, is, or will be directly or indirectly related to the specific recommendation(s) or view(s) in this report. Analysts are not registered as research analysts by FINRA and are not associated persons of the ICICI Securities Inc. Terms & conditions and other disclosures: ICICI Securities Limited (ICICI Securities) is a full-service, integrated investment banking and is, inter alia, engaged in the business of stock brokering and distribution of financial products. ICICI Securities Limited is a SEBI registered Research Analyst with SEBI Registration Number – INH000000990.ICICI Securities is a wholly-owned subsidiary of ICICI Bank which is India’s largest private sector bank and has its various subsidiaries engaged in businesses of housing finance, asset management, life insurance, general insurance, venture capital fund management, etc. (“associates”), the details in respect of which are available on www.icicibank.com. ICICI Securities is one of the leading merchant bankers/ underwriters of securities and participate in virtually all securities trading markets in India. We and our associates might have investment banking and other business relationship with a significant percentage of companies covered by our Investment Research Department. ICICI Securities generally prohibits its analysts, persons reporting to analysts and their relatives from maintaining a financial interest in the securities or derivatives of any companies that the analysts cover. The information and opinions in this report have been prepared by ICICI Securities and are subject to change without any notice. The report and information contained herein is strictly confidential and meant solely for the selected recipient and may not be altered in any way, transmitted to, copied or distributed, in part or in whole, to any other person or to the media or reproduced in any form, without prior written consent of ICICI Securities. While we would endeavour to update the information herein on a reasonable basis, ICICI Securities is under no obligation to update or keep the information current. Also, there may be regulatory, compliance or other reasons that may prevent ICICI Securities from doing so. Non-rated securities indicate that rating on a particular security has been suspended temporarily and such suspension is in compliance with applicable regulations and/or ICICI Securities policies, in circumstances where ICICI Securities might be acting in an advisory capacity to this company, or in certain other circumstances. This report is based on information obtained from public sources and sources believed to be reliable, but no independent verification has been made nor is its accuracy or completeness guaranteed. This report and information herein is solely for informational purpose and shall not be used or considered as an offer document or solicitation of offer to buy or sell or subscribe for securities or other financial instruments. Though disseminated to all the customers simultaneously, not all customers may receive this report at the same time. ICICI Securities will not treat recipients as customers by virtue of their receiving this report. Nothing in this report constitutes investment, legal, accounting and tax advice or a representation that any investment or strategy is suitable or appropriate to your specific circumstances. The securities discussed and opinions expressed in this report may not be suitable for all investors, who must make their own investment decisions, based on their own investment objectives, financial positions and needs of specific recipient. This may not be taken in substitution for the exercise of independent judgment by any recipient. The recipient should independently evaluate the investment risks. The value and return on investment may vary because of changes in interest rates, foreign exchange rates or any other reason. ICICI Securities accepts no liabilities whatsoever for any loss or damage of any kind arising out of the use of this report. Past performance is not necessarily a guide to future performance. Investors are advised to see Risk Disclosure Document to understand the risks associated before investing in the securities markets. Actual results may differ materially from those set forth in projections. Forward-looking statements are not predictions and may be subject to change without notice. ICICI Securities or its associates might have managed or co-managed public offering of securities for the subject company or might have been mandated by the subject company for any other assignment in the past twelve months. ICICI Securities or its associates might have received any compensation from the companies mentioned in the report during the period preceding twelve months from the date of this report for services in respect of managing or co-managing public offerings, corporate finance, investment banking or merchant banking, brokerage services or other advisory service in a merger or specific transaction. ICICI Securities or its associates might have received any compensation for products or services other than investment banking or merchant banking or brokerage services from the companies mentioned in the report in the past twelve months. ICICI Securities encourages independence in research report preparation and strives to minimize conflict in preparation of research report. ICICI Securities or its associates or its analysts did not receive any compensation or other benefits from the companies mentioned in the report or third party in connection with preparation of the research report. Accordingly, neither ICICI Securities nor Research Analysts and their relatives have any material conflict of interest at the time of publication of this report. It is confirmed that Sriraam Rathi, CA; Vinay Bafna, MBA; Research Analysts of this report have not received any compensation from the companies mentioned in the report in the preceding twelve months. Compensation of our Research Analysts is not based on any specific merchant banking, investment banking or brokerage service transactions. ICICI Securities or its subsidiaries collectively or Research Analysts or their relatives do not own 1% or more of the equity securities of the Company mentioned in the report as of the last day of the month preceding the publication of the research report. Since associates of ICICI Securities are engaged in various financial service businesses, they might have financial interests or beneficial ownership in various companies including the subject company/companies mentioned in this report. It is confirmed that Sriraam Rathi, CA; Vinay Bafna, MBA; Research Analysts do not serve as an officer, director or employee of the companies mentioned in the report. ICICI Securities may have issued other reports that are inconsistent with and reach different conclusion from the information presented in this report. Neither the Research Analysts nor ICICI Securities have been engaged in market making activity for the companies mentioned in the report. We submit that no material disciplinary action has been taken on ICICI Securities by any Regulatory Authority impacting Equity Research Analysis activities. This report is not directed or intended for distribution to, or use by, any person or entity who is a citizen or resident of or located in any locality, state, country or other jurisdiction, where such distribution, publication, availability or use would be contrary to law, regulation or which would subject ICICI Securities and affiliates to any registration or licensing requirement within such jurisdiction. The securities described herein may or may not be eligible for sale in all jurisdictions or to certain category of investors. Persons in whose possession this document may come are required to inform themselves of and to observe such restriction. This report has not been prepared by ICICI Securities, Inc. However, ICICI Securities, Inc. has reviewed the report and, in so far as it includes current or historical information, it is believed to be reliable, although its accuracy and completeness cannot be guaranteed.


![18 59.1 39 5 -198 Vol.39. No.5 May 2013 "!#$ %"$ & ''$ ( 18 59.1 39 5 -201 Vol.39. No.5 May 2013 (c) twinning 5 Hertzberg [8] 5 6 slip](https://img.dokumen.tips/doc/110x75/5fd3bfe7b4cb715c7b5abc76/18-591-39-5-198-vol39-no5-may-2013-18-591-39.jpg)


![Strides Shasun to acquire controlling stake in Universal Corporation, Kenya [Company Update]](https://img.dokumen.tips/doc/110x75/577ca5091a28abea748b5d5c/strides-shasun-to-acquire-controlling-stake-in-universal-corporation-kenya.jpg)


![Shipyard Cadmium (59.1) [Correc y Enm]](https://img.dokumen.tips/doc/110x75/56d6c09d1a28ab30169b17b4/shipyard-cadmium-591-correc-y-enm.jpg)