Embed Size (px)
Citation preview
RHT STRICTLY PRIVATE AND CONFIDENTIAL
This presentation is focused on comparing actual results from the period from 1 October 2014 to 31 December 2014 (“3Q FY15”). Other than the
comparative figures presented, no other comparative figures will be presented as the acquisition of the Portfolio of RHT as well as listing on the
Singapore Stock Exchange was completed on 19 October 2012.
This presentation may contain forward-looking statements that involve risks and uncertainties. Actual future performance, outcomes and results
may differ materially from those expressed in forward-looking statements as a result of a number of risks, uncertainties and assumptions.
Representative examples of these factors include (without limitation) general industry and economic conditions, interest rate trends, cost of capital
and capital availability, competition from other developments or companies, shifts in expected levels of income and occupancy rate, changes in
operating expenses (including employee wages, benefits and training), governmental and public policy changes and the continued availability of
financing in the amounts and the terms necessary to support future business. Investors are cautioned not to place undue reliance on these forward-
looking statements. For further information, please also refer to RHT’s press release which is released in conjunction with this set of presentation.
The Indian Rupee and Singapore Dollar are defined herein as “₹” and “S$” respectively. Any discrepancy between individual amounts and total
shown in this presentation is due to rounding.
Disclaimer
2
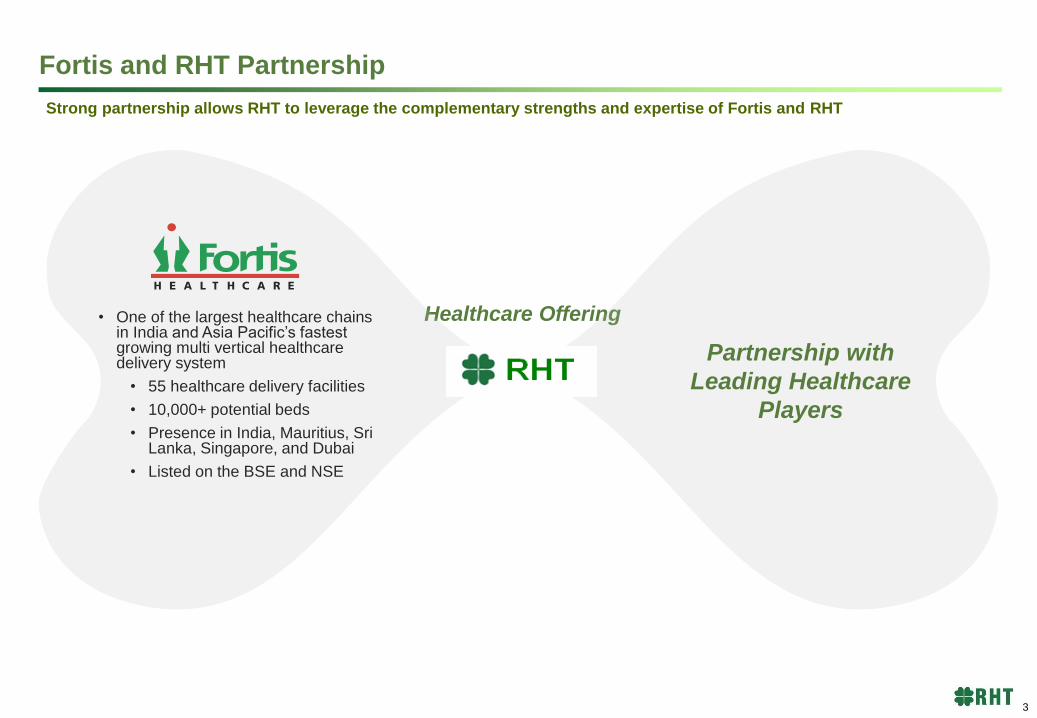
Fortis and RHT Partnership
Strong partnership allows RHT to leverage the complementary strengths and expertise of Fortis and RHT
Healthcare Offering • One of the largest healthcare chains in India and Asia Pacific’s fastest growing multi vertical healthcare delivery system
• 55 healthcare delivery facilities
• 10,000+ potential beds
• Presence in India, Mauritius, Sri Lanka, Singapore, and Dubai
• Listed on the BSE and NSE
Partnership with
Leading Healthcare
Players
3
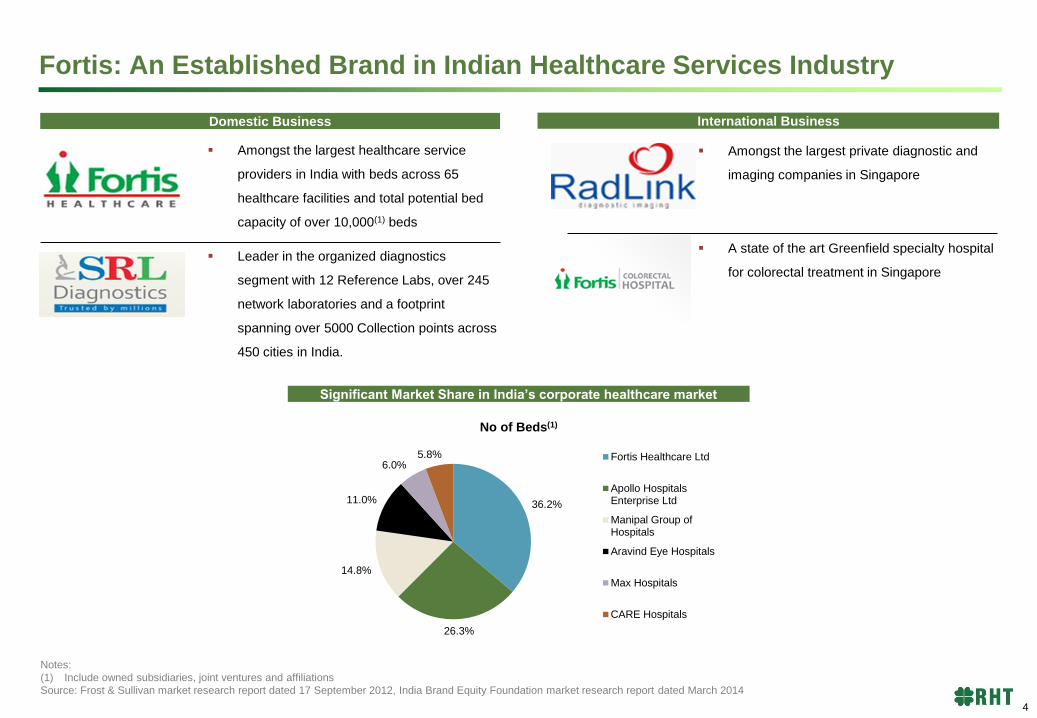
Fortis: An Established Brand in Indian Healthcare Services Industry
Amongst the largest private diagnostic and
imaging companies in Singapore
36.2%
26.3%
14.8%
11.0%
6.0% 5.8%
No of Beds(1)
Fortis Healthcare Ltd
Apollo HospitalsEnterprise Ltd
Manipal Group ofHospitals
Aravind Eye Hospitals
Max Hospitals
CARE Hospitals
Notes:
(1) Include owned subsidiaries, joint ventures and affiliations
Source: Frost & Sullivan market research report dated 17 September 2012, India Brand Equity Foundation market research report dated March 2014
Domestic Business International Business
Amongst the largest healthcare service
providers in India with beds across 65
healthcare facilities and total potential bed
capacity of over 10,000(1) beds
Significant Market Share in India’s corporate healthcare market
Leader in the organized diagnostics
segment with 12 Reference Labs, over 245
network laboratories and a footprint
spanning over 5000 Collection points across
450 cities in India.
A state of the art Greenfield specialty hospital
for colorectal treatment in Singapore
4
340
600660
720
Q1 FY-14 Q2 FY-14 Q3 FY-14 Q4 FY-14
Operating revenue
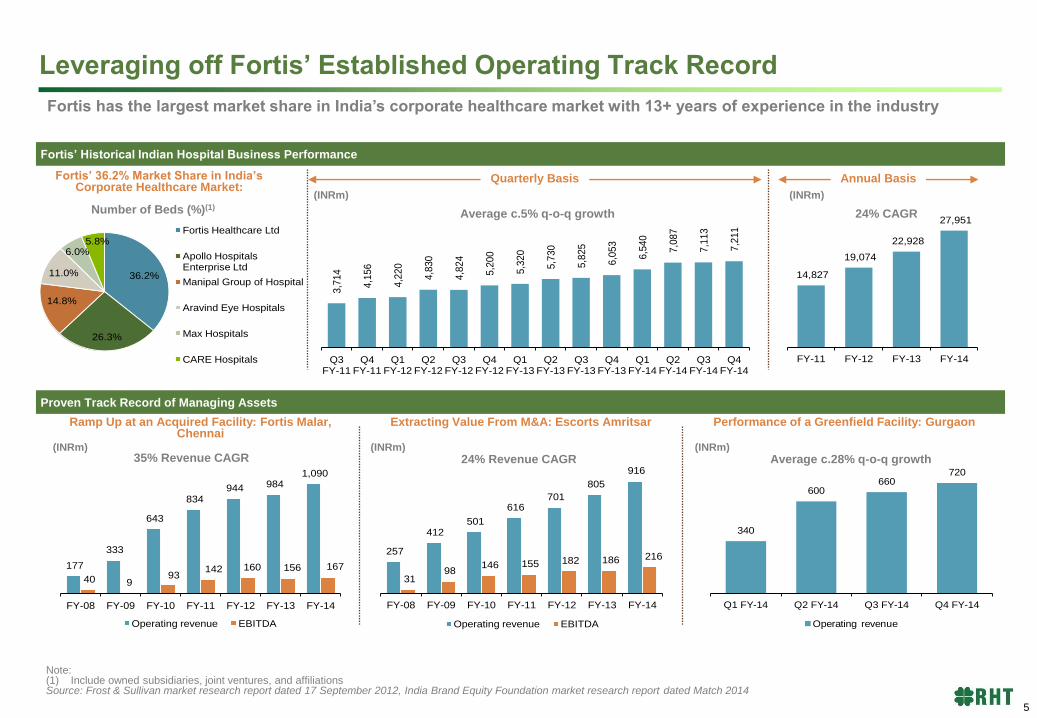
Fortis’ Historical Indian Hospital Business Performance
Proven Track Record of Managing Assets
Fortis has the largest market share in India’s corporate healthcare market with 13+ years of experience in the industry
Fortis’ 36.2% Market Share in India’s Corporate Healthcare Market:
Quarterly Basis Annual Basis
Number of Beds (%)(1) Average c.5% q-o-q growth 24% CAGR
(INRm) (INRm)
36.2%
26.3%
14.8%
11.0%
6.0%5.8%
Fortis Healthcare Ltd
Apollo Hospitals Enterprise Ltd
Manipal Group of Hospital
Aravind Eye Hospitals
Max Hospitals
CARE Hospitals
3,7
14
4,1
56
4,2
20
4,8
30
4,8
24
5,2
00
5,3
20
5,7
30
5,8
25
6,0
53
6,5
40
7,0
87
7,1
13
7,2
11
Q3 FY-11
Q4 FY-11
Q1 FY-12
Q2 FY-12
Q3 FY-12
Q4 FY-12
Q1 FY-13
Q2 FY-13
Q3 FY-13
Q4 FY-13
Q1 FY-14
Q2 FY-14
Q3 FY-14
Q4 FY-14
14,827
19,074
22,928
27,951
FY-11 FY-12 FY-13 FY-14
177
333
643
834 944 984
1,090
40 9 93
142 160 156 167
FY-08 FY-09 FY-10 FY-11 FY-12 FY-13 FY-14
Operating revenue EBITDA
257
412 501
616 701
805
916
31 98
146 155 182 186 216
FY-08 FY-09 FY-10 FY-11 FY-12 FY-13 FY-14
Operating revenue EBITDA
Ramp Up at an Acquired Facility: Fortis Malar, Chennai
Extracting Value From M&A: Escorts Amritsar Performance of a Greenfield Facility: Gurgaon
35% Revenue CAGR 24% Revenue CAGR Average c.28% q-o-q growth (INRm) (INRm) (INRm)
Note: (1) Include owned subsidiaries, joint ventures, and affiliations Source: Frost & Sullivan market research report dated 17 September 2012, India Brand Equity Foundation market research report dated Match 2014
Leveraging off Fortis’ Established Operating Track Record
5
Rising Income Increases Ability to Afford Healthcare Services Ageing Population Means Greater Healthcare Spending
Growing Health Awareness Leading to Higher Hospitalisation Increasing Access to Health Insurance
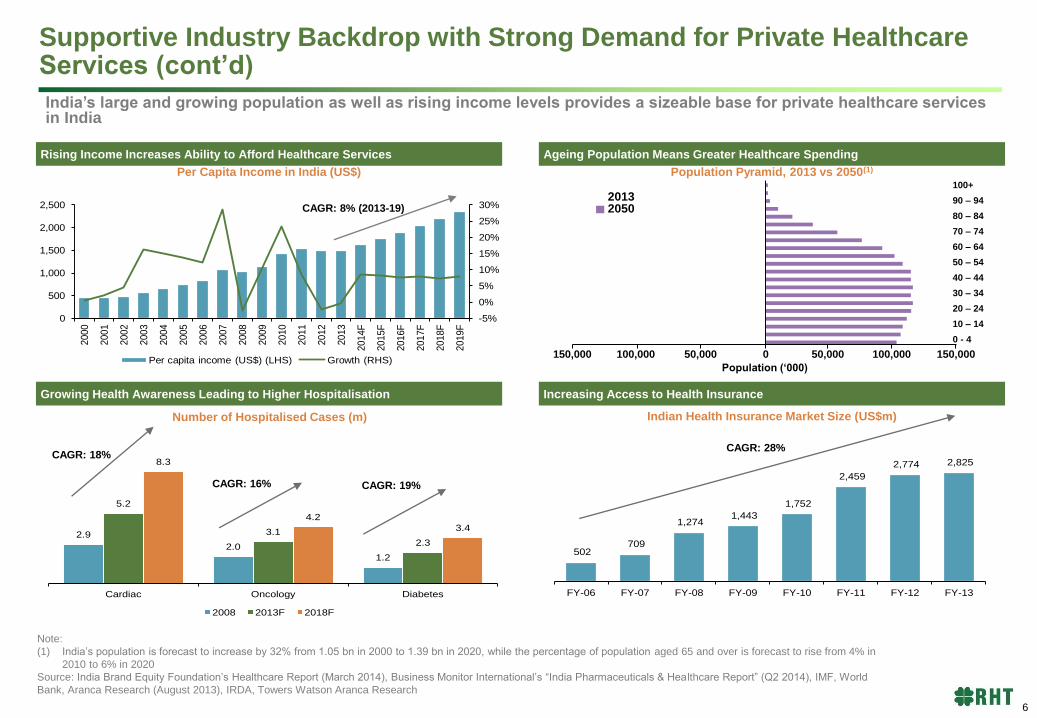
India’s large and growing population as well as rising income levels provides a sizeable base for private healthcare services in India
Population Pyramid, 2013 vs 2050(1) Per Capita Income in India (US$)
CAGR: 8% (2013-19)
150,000 100,000 50,000 0 50,000 100,000 150,000
2013 2050
100+
90 – 94
80 – 84
70 – 74
60 – 64
50 – 54
40 – 44
30 – 34
20 – 24
10 – 14
0 - 4
Number of Hospitalised Cases (m) Indian Health Insurance Market Size (US$m)
2.9
2.0
1.2
5.2
3.1
2.3
8.3
4.2
3.4
Cardiac Oncology Diabetes
2008 2013F 2018F
502 709
1,274 1,443
1,752
2,459
2,774 2,825
FY-06 FY-07 FY-08 FY-09 FY-10 FY-11 FY-12 FY-13
CAGR: 28% CAGR: 18%
CAGR: 16% CAGR: 19%
Note:
(1) India’s population is forecast to increase by 32% from 1.05 bn in 2000 to 1.39 bn in 2020, while the percentage of population aged 65 and over is forecast to rise from 4% in
2010 to 6% in 2020
Source: India Brand Equity Foundation’s Healthcare Report (March 2014), Business Monitor International’s “India Pharmaceuticals & Healthcare Report” (Q2 2014), IMF, World
Bank, Aranca Research (August 2013), IRDA, Towers Watson Aranca Research
Population (‘000)
-5%
0%
5%
10%
15%
20%
25%
30%
0
500
1,000
1,500
2,000
2,500
2000
2001
2002
2003
2004
2005
2006
2007
2008
2009
2010
2011
2012
2013
2014F
2015F
2016F
2017F
2018F
2019F
Per capita income (US$) (LHS) Growth (RHS)
Supportive Industry Backdrop with Strong Demand for Private Healthcare Services (cont’d)
6
Strong Growth Trend in Healthcare Expenditure Large Demand Supply Gap
Dominance by Private Providers to Increase Cost Advantage Leading to Increased Medical Tourism(1)
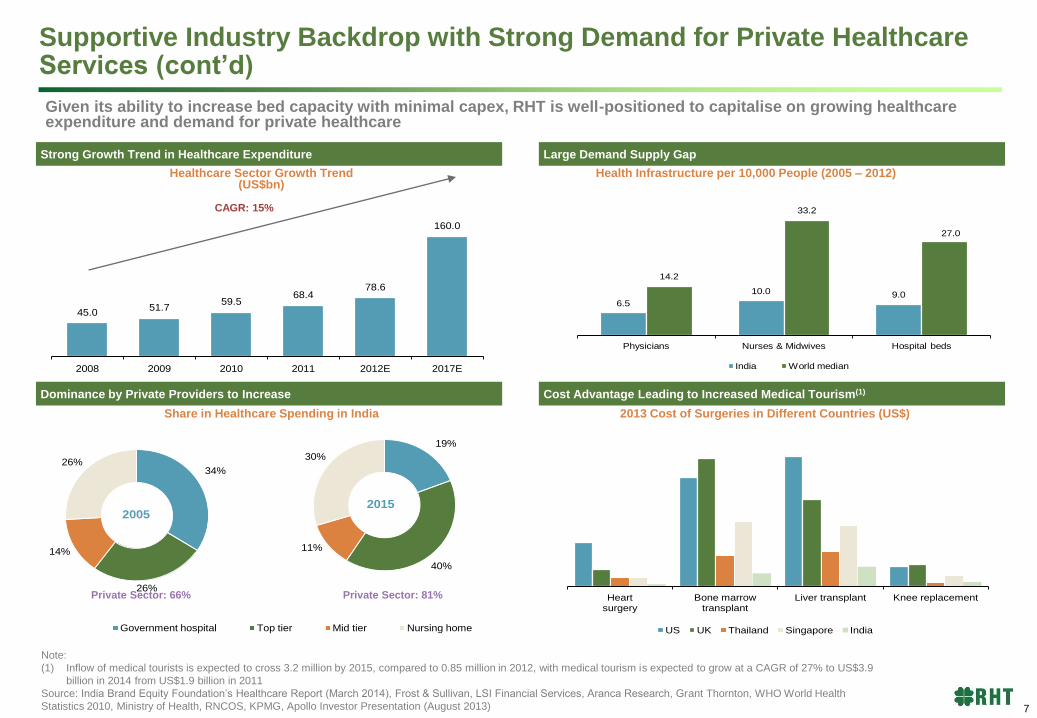
Given its ability to increase bed capacity with minimal capex, RHT is well-positioned to capitalise on growing healthcare expenditure and demand for private healthcare
Health Infrastructure per 10,000 People (2005 – 2012) Healthcare Sector Growth Trend (US$bn)
CAGR: 15%
45.051.7
59.568.4
78.6
160.0
2008 2009 2010 2011 2012E 2017E
Share in Healthcare Spending in India 2013 Cost of Surgeries in Different Countries (US$)
Private Sector: 66% Private Sector: 81%
19%
40%
11%
30%
2015
34%
26%
14%
26%
2005
Government hospital Top tier Mid tier Nursing home
Heart surgery
Bone marrow transplant
Liver transplant Knee replacement
US UK Thailand Singapore India
Note:
(1) Inflow of medical tourists is expected to cross 3.2 million by 2015, compared to 0.85 million in 2012, with medical tourism is expected to grow at a CAGR of 27% to US$3.9
billion in 2014 from US$1.9 billion in 2011
Source: India Brand Equity Foundation’s Healthcare Report (March 2014), Frost & Sullivan, LSI Financial Services, Aranca Research, Grant Thornton, WHO World Health
Statistics 2010, Ministry of Health, RNCOS, KPMG, Apollo Investor Presentation (August 2013)
6.5
10.0 9.0
14.2
33.2
27.0
Physicians Nurses & Midwives Hospital beds
India World median
Supportive Industry Backdrop with Strong Demand for Private Healthcare Services (cont’d)
7
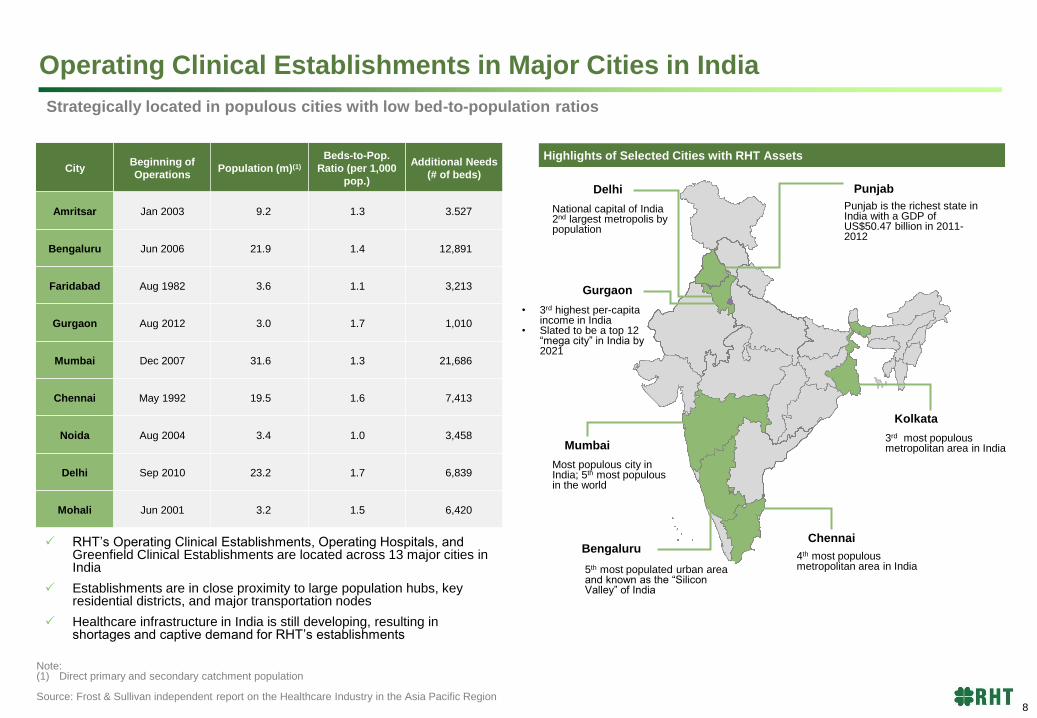
Highlights of Selected Cities with RHT Assets
Strategically located in populous cities with low bed-to-population ratios
City Beginning of
Operations Population (m)(1)
Beds-to-Pop.
Ratio (per 1,000
pop.)
Additional Needs
(# of beds)
Amritsar Jan 2003 9.2 1.3 3.527
Bengaluru Jun 2006 21.9 1.4 12,891
Faridabad Aug 1982 3.6 1.1 3,213
Gurgaon Aug 2012 3.0 1.7 1,010
Mumbai Dec 2007 31.6 1.3 21,686
Chennai May 1992 19.5 1.6 7,413
Noida Aug 2004 3.4 1.0 3,458
Delhi Sep 2010 23.2 1.7 6,839
Mohali Jun 2001 3.2 1.5 6,420
Bengaluru
5th most populated urban area and known as the “Silicon Valley” of India
Gurgaon
• 3rd highest per-capita income in India
• Slated to be a top 12 “mega city” in India by 2021
Mumbai
Most populous city in India; 5th most populous in the world
Kolkata
3rd most populous metropolitan area in India
Chennai
4th most populous metropolitan area in India
Delhi
National capital of India 2nd largest metropolis by population
Mohali, Punjab
Punjab is the richest state in India with a GDP of US$50.47 billion in 2011-2012
Note: (1) Direct primary and secondary catchment population
Source: Frost & Sullivan independent report on the Healthcare Industry in the Asia Pacific Region
RHT’s Operating Clinical Establishments, Operating Hospitals, and Greenfield Clinical Establishments are located across 13 major cities in India
Establishments are in close proximity to large population hubs, key residential districts, and major transportation nodes
Healthcare infrastructure in India is still developing, resulting in shortages and captive demand for RHT’s establishments
Operating Clinical Establishments in Major Cities in India
8
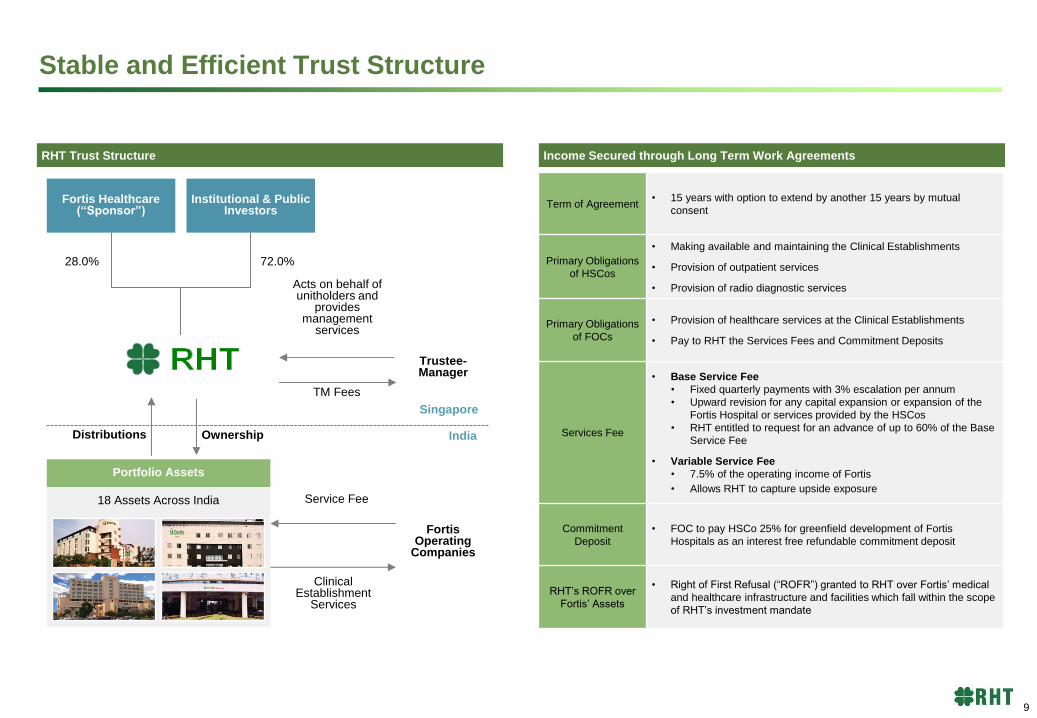
Stable and Efficient Trust Structure
RHT Trust Structure Income Secured through Long Term Work Agreements
Fortis Healthcare (“Sponsor”)
Institutional & Public Investors
Trustee-Manager
Portfolio Assets
18 Assets Across India
Fortis Operating
Companies
28.0% 72.0%
Ownership Distributions
Service Fee
Clinical Establishment
Services
TM Fees
Acts on behalf of unitholders and
provides management
services
Singapore
India
Term of Agreement • 15 years with option to extend by another 15 years by mutual
consent
Primary Obligations
of HSCos
• Making available and maintaining the Clinical Establishments
• Provision of outpatient services
• Provision of radio diagnostic services
Primary Obligations
of FOCs
• Provision of healthcare services at the Clinical Establishments
• Pay to RHT the Services Fees and Commitment Deposits
Services Fee
• Base Service Fee
• Fixed quarterly payments with 3% escalation per annum
• Upward revision for any capital expansion or expansion of the
Fortis Hospital or services provided by the HSCos
• RHT entitled to request for an advance of up to 60% of the Base
Service Fee
• Variable Service Fee
• 7.5% of the operating income of Fortis
• Allows RHT to capture upside exposure
Commitment
Deposit
• FOC to pay HSCo 25% for greenfield development of Fortis
Hospitals as an interest free refundable commitment deposit
RHT’s ROFR over
Fortis’ Assets
• Right of First Refusal (“ROFR”) granted to RHT over Fortis’ medical
and healthcare infrastructure and facilities which fall within the scope
of RHT’s investment mandate
9
2,835 2,998
1,500 1,957
923 1,067
527
829
3,758 4,064
2,027
2,785
0
1,000
2,000
3,000
4,000
5,000
FY-13 FY-14 H1-14 H1-15
8.1%
37.4%
2,550
1,044
870 4,464
Current operational beds
Potential bed capacity
3%
68%
29%
Solid Portfolio Characteristics Stability from Substantial Base Fee Component
Strong Growth from Capacity Expansion with Minimal Capex Potential to Provide Higher-End and More Advanced Services
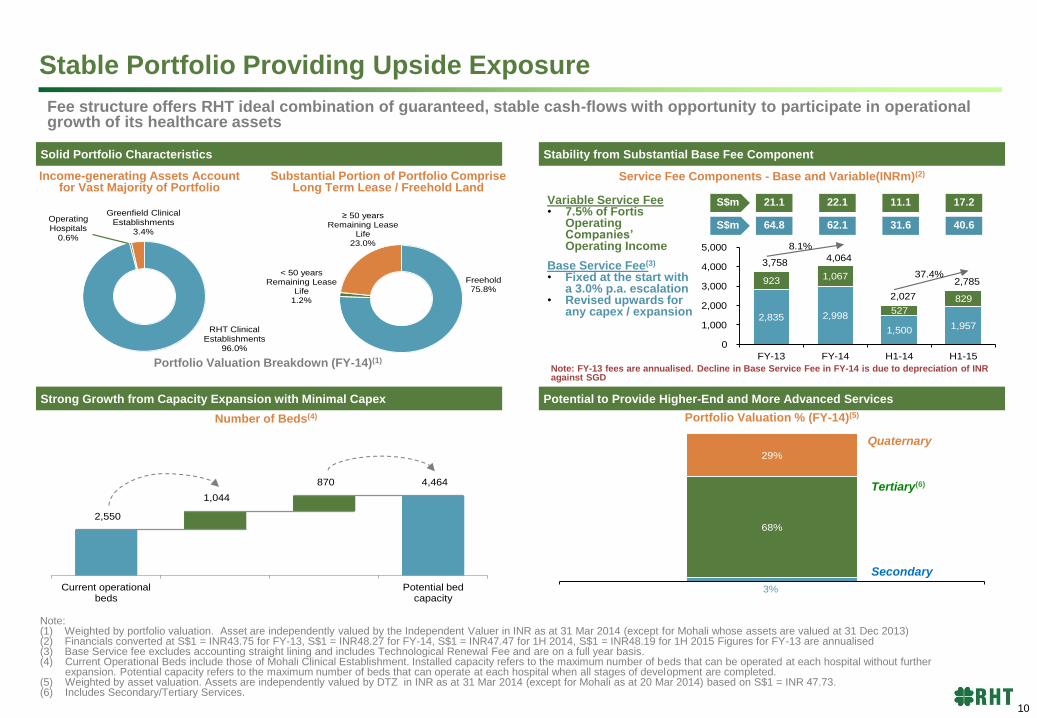
Fee structure offers RHT ideal combination of guaranteed, stable cash-flows with opportunity to participate in operational growth of its healthcare assets
Income-generating Assets Account for Vast Majority of Portfolio
Substantial Portion of Portfolio Comprise Long Term Lease / Freehold Land
RHT Clinical Establishments
96.0%
Operating Hospitals
0.6%
Greenfield Clinical Establishments
3.4%
Portfolio Valuation Breakdown (FY-14)(1)
Variable Service Fee • 7.5% of Fortis
Operating Companies’ Operating Income
Base Service Fee(3)
• Fixed at the start with a 3.0% p.a. escalation
• Revised upwards for any capex / expansion
Service Fee Components - Base and Variable(INRm)(2)
Number of Beds(4)
Note: (1) Weighted by portfolio valuation. Asset are independently valued by the Independent Valuer in INR as at 31 Mar 2014 (except for Mohali whose assets are valued at 31 Dec 2013) (2) Financials converted at S$1 = INR43.75 for FY-13, S$1 = INR48.27 for FY-14, S$1 = INR47.47 for 1H 2014, S$1 = INR48.19 for 1H 2015 Figures for FY-13 are annualised (3) Base Service fee excludes accounting straight lining and includes Technological Renewal Fee and are on a full year basis. (4) Current Operational Beds include those of Mohali Clinical Establishment. Installed capacity refers to the maximum number of beds that can be operated at each hospital without further
expansion. Potential capacity refers to the maximum number of beds that can operate at each hospital when all stages of development are completed. (5) Weighted by asset valuation. Assets are independently valued by DTZ in INR as at 31 Mar 2014 (except for Mohali as at 20 Mar 2014) based on S$1 = INR 47.73. (6) Includes Secondary/Tertiary Services.
Note: FY-13 fees are annualised. Decline in Base Service Fee in FY-14 is due to depreciation of INR against SGD
Portfolio Valuation % (FY-14)(5)
Quaternary Quaternary
Tertiary(6)
S$m 64.8 62.1 31.6 40.6
S$m 21.1 22.1 11.1 17.2
Freehold75.8%
< 50 years Remaining Lease
Life1.2%
≥ 50 years Remaining Lease
Life23.0%
Stable Portfolio Providing Upside Exposure
Secondary
10
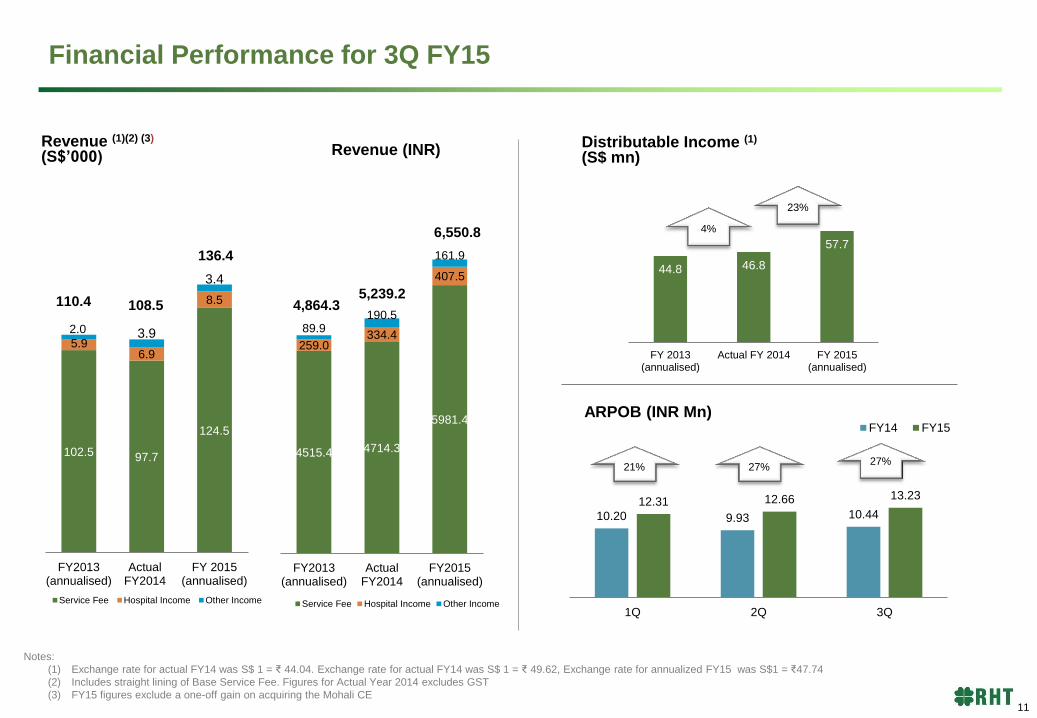
Notes:
(1) Exchange rate for actual FY14 was S$ 1 = ₹ 44.04. Exchange rate for actual FY14 was S$ 1 = ₹ 49.62, Exchange rate for annualized FY15 was S$1 = ₹47.74
(2) Includes straight lining of Base Service Fee. Figures for Actual Year 2014 excludes GST
(3) FY15 figures exclude a one-off gain on acquiring the Mohali CE
Revenue (1)(2) (3) (S$’000)
108.5
136.4
Distributable Income (1)
(S$ mn)
102.5 97.7
124.5
2.0
6.9
8.5
3.9
3.4
FY2013(annualised)
ActualFY2014
FY 2015(annualised)
Service Fee Hospital Income Other Income
5.9
110.4
44.8 46.8
57.7
FY 2013(annualised)
Actual FY 2014 FY 2015(annualised)
23%
4%
ARPOB (INR Mn)
10.20 9.93 10.44 12.31 12.66 13.23
1Q 2Q 3Q
FY14 FY15
21% 27%
Financial Performance for 3Q FY15
27% 4515.4 4714.3
5981.4
259.0 334.4
407.5
89.9 190.5
161.9
FY2013(annualised)
ActualFY2014
FY2015(annualised)
Revenue (INR)
Service Fee Hospital Income Other Income
4,864.3 5,239.2
6,550.8
11

Portfolio
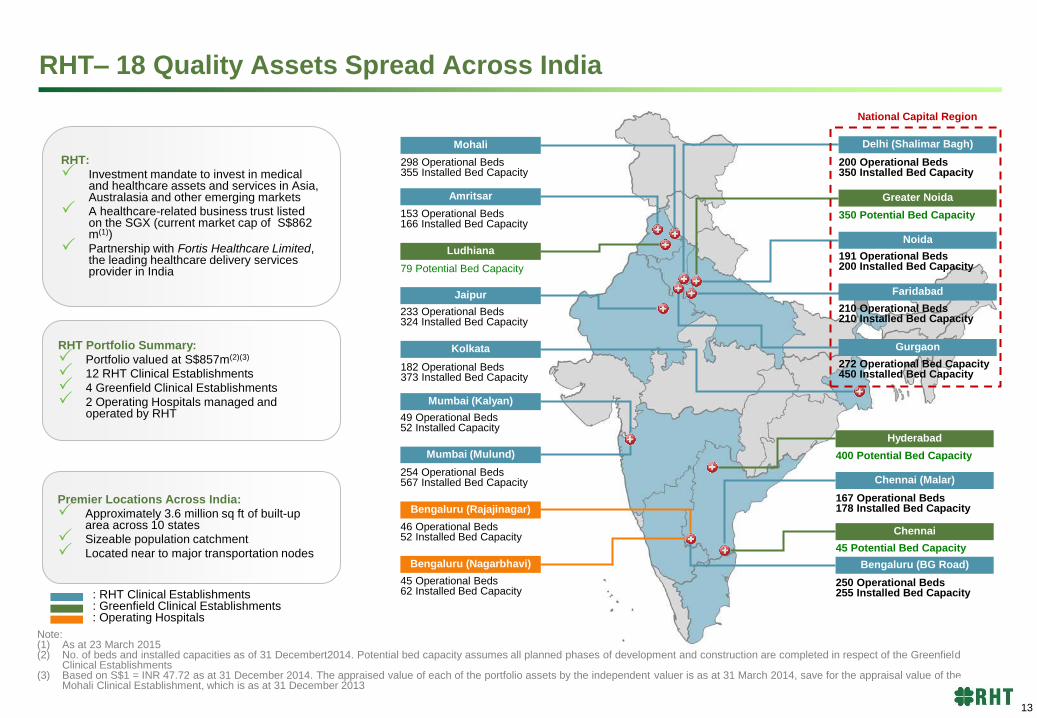
RHT– 18 Quality Assets Spread Across India
: RHT Clinical Establishments : Greenfield Clinical Establishments : Operating Hospitals
RHT Portfolio Summary:
Portfolio valued at S$857m(2)(3)
12 RHT Clinical Establishments
4 Greenfield Clinical Establishments
2 Operating Hospitals managed and operated by RHT
Premier Locations Across India:
Approximately 3.6 million sq ft of built-up area across 10 states
Sizeable population catchment
Located near to major transportation nodes
RHT:
Investment mandate to invest in medical and healthcare assets and services in Asia, Australasia and other emerging markets
A healthcare-related business trust listed on the SGX (current market cap of S$862 m(1))
Partnership with Fortis Healthcare Limited, the leading healthcare delivery services provider in India
400 Potential Bed Capacity
Amritsar
153 Operational Beds 166 Installed Bed Capacity
Ludhiana
79 Potential Bed Capacity
Jaipur
233 Operational Beds 324 Installed Bed Capacity
Faridabad
210 Operational Beds 210 Installed Bed Capacity
Mumbai (Mulund)
254 Operational Beds 567 Installed Bed Capacity
Mumbai (Kalyan)
49 Operational Beds 52 Installed Capacity
250 Operational Beds 255 Installed Bed Capacity
Bengaluru (BG Road) Bengaluru (Nagarbhavi)
45 Operational Beds 62 Installed Bed Capacity
Bengaluru (Rajajinagar)
46 Operational Beds 52 Installed Bed Capacity
Chennai (Malar)
Chennai
167 Operational Beds 178 Installed Bed Capacity
45 Potential Bed Capacity
Hyderabad
Kolkata
182 Operational Beds 373 Installed Bed Capacity
Noida
191 Operational Beds 200 Installed Bed Capacity
Greater Noida
350 Potential Bed Capacity
Mohali
298 Operational Beds 355 Installed Bed Capacity
National Capital Region
272 Operational Bed Capacity 450 Installed Bed Capacity
Gurgaon
200 Operational Beds 350 Installed Bed Capacity
Delhi (Shalimar Bagh)
Note: (1) As at 23 March 2015 (2) No. of beds and installed capacities as of 31 Decembert2014. Potential bed capacity assumes all planned phases of development and construction are completed in respect of the Greenfield
Clinical Establishments (3) Based on S$1 = INR 47.72 as at 31 December 2014. The appraised value of each of the portfolio assets by the independent valuer is as at 31 March 2014, save for the appraisal value of the
Mohali Clinical Establishment, which is as at 31 December 2013
13
3% 3%
10%4%
3%
8%
3%14%
7%
1%
11%4%
23%
6%
Nagarbhavi
Rajajinagar
Noida
Faridabad
Amritsar
Jaipur
Malar
Shalimar Bagh
BG Road
Kalyan
Mulund
Kolkata
Gurgaon
Mohali
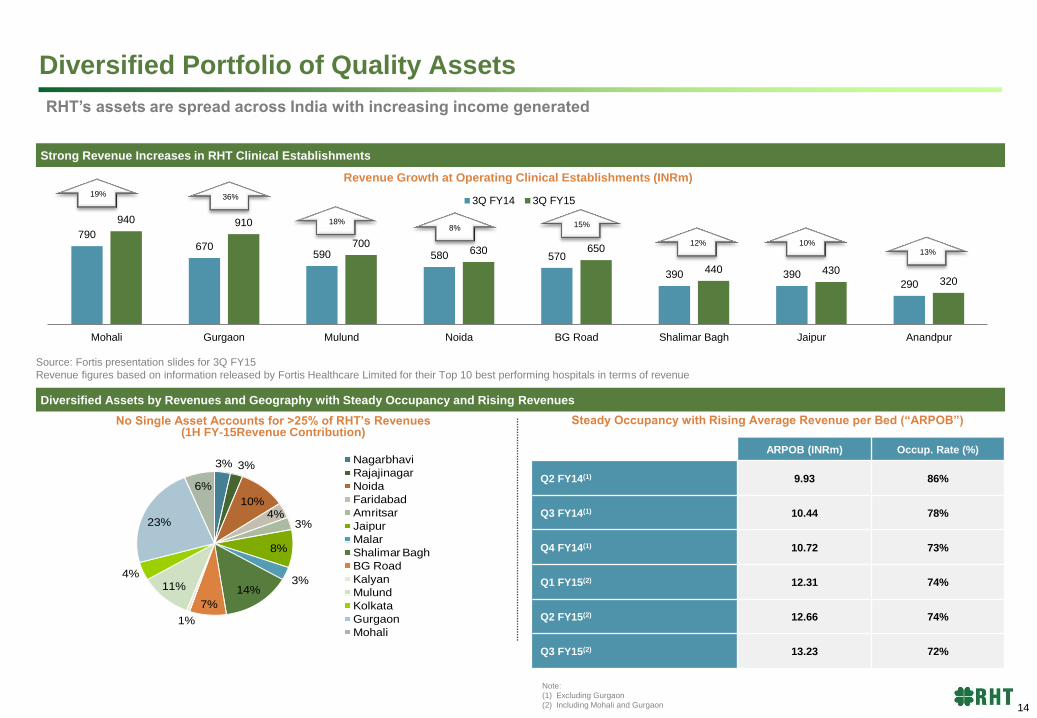
Strong Revenue Increases in RHT Clinical Establishments
Diversified Assets by Revenues and Geography with Steady Occupancy and Rising Revenues
RHT’s assets are spread across India with increasing income generated
No Single Asset Accounts for >25% of RHT’s Revenues (1H FY-15Revenue Contribution)
Steady Occupancy with Rising Average Revenue per Bed (“ARPOB”)
ARPOB (INRm) Occup. Rate (%)
Q2 FY14(1) 9.93 86%
Q3 FY14(1) 10.44 78%
Q4 FY14(1) 10.72 73%
Q1 FY15(2) 12.31 74%
Q2 FY15(2) 12.66 74%
Q3 FY15(2) 13.23 72%
Revenue Growth at Operating Clinical Establishments (INRm)
Note:
(1) Excluding Gurgaon
(2) Including Mohali and Gurgaon
Source: Fortis presentation slides for 3Q FY15
Revenue figures based on information released by Fortis Healthcare Limited for their Top 10 best performing hospitals in terms of revenue
790 670
590 580 570
390 390 290
940 910
700 630 650
440 430 320
Mohali Gurgaon Mulund Noida BG Road Shalimar Bagh Jaipur Anandpur
3Q FY14 3Q FY15
Diversified Portfolio of Quality Assets
19% 36%
18% 8% 15%
12% 10% 13%
14
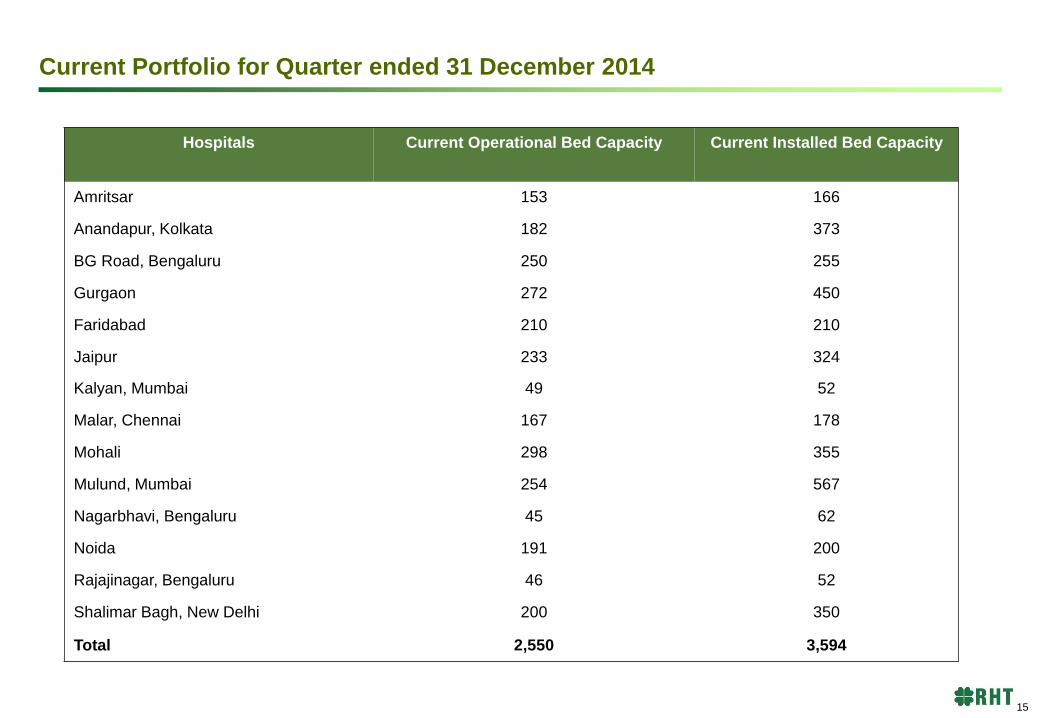
Current Portfolio for Quarter ended 31 December 2014
Hospitals Current Operational Bed Capacity Current Installed Bed Capacity
Amritsar 153 166
Anandapur, Kolkata 182 373
BG Road, Bengaluru 250 255
Gurgaon 272 450
Faridabad 210 210
Jaipur 233 324
Kalyan, Mumbai 49 52
Malar, Chennai 167 178
Mohali 298 355
Mulund, Mumbai 254 567
Nagarbhavi, Bengaluru 45 62
Noida 191 200
Rajajinagar, Bengaluru 46 52
Shalimar Bagh, New Delhi 200 350
Total 2,550 3,594
15
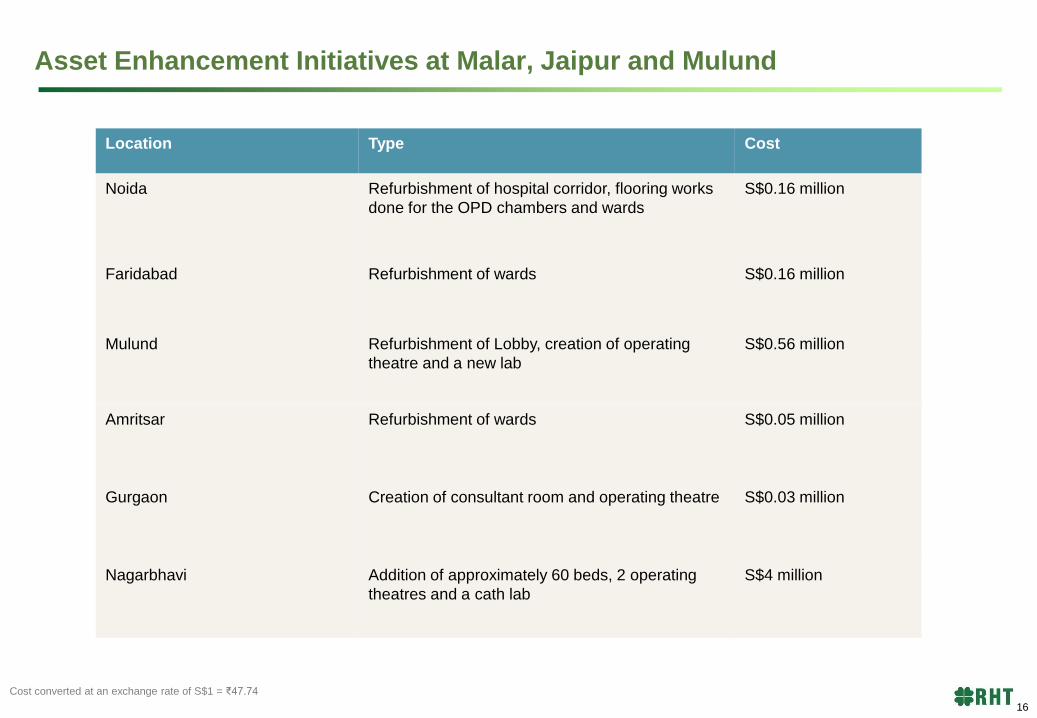
Asset Enhancement Initiatives at Malar, Jaipur and Mulund
Cost converted at an exchange rate of S$1 = ₹47.74
Location Type Cost
Noida Refurbishment of hospital corridor, flooring works
done for the OPD chambers and wards
S$0.16 million
Faridabad Refurbishment of wards S$0.16 million
Mulund Refurbishment of Lobby, creation of operating
theatre and a new lab
S$0.56 million
Amritsar Refurbishment of wards S$0.05 million
Gurgaon Creation of consultant room and operating theatre S$0.03 million
Nagarbhavi Addition of approximately 60 beds, 2 operating
theatres and a cath lab
S$4 million
16
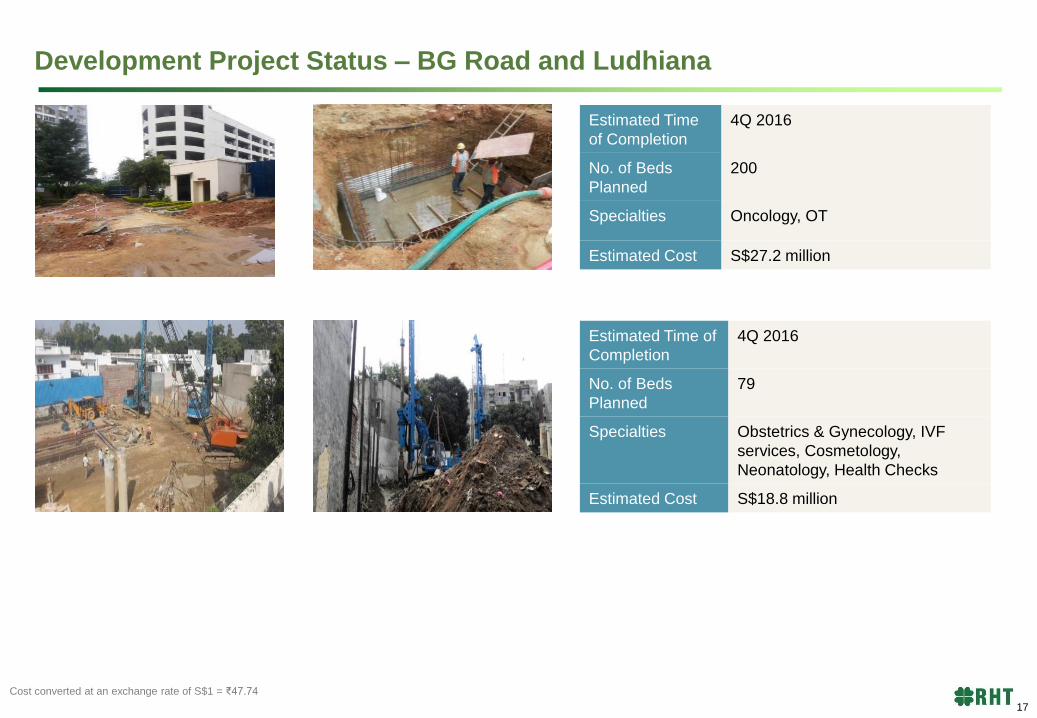
Development Project Status – BG Road and Ludhiana
Estimated Time
of Completion
4Q 2016
No. of Beds
Planned
200
Specialties Oncology, OT
Estimated Cost S$27.2 million
Estimated Time of
Completion
4Q 2016
No. of Beds
Planned
79
Specialties Obstetrics & Gynecology, IVF
services, Cosmetology,
Neonatology, Health Checks
Estimated Cost S$18.8 million
Cost converted at an exchange rate of S$1 = ₹47.74
17

Financials
Financial Highlights
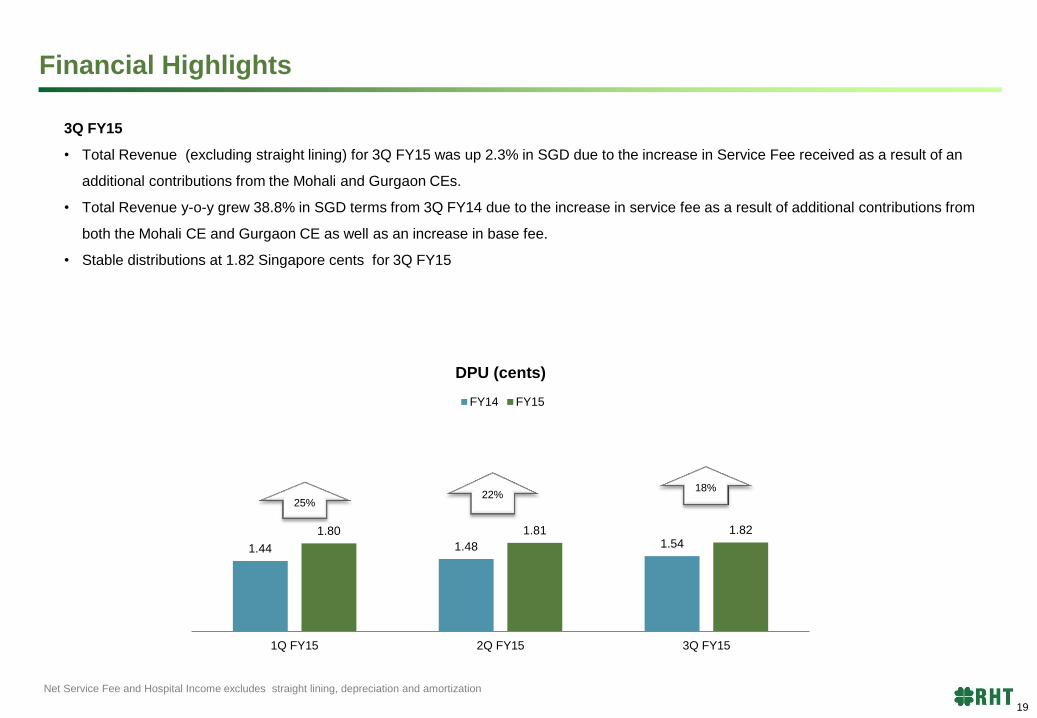
3Q FY15
• Total Revenue (excluding straight lining) for 3Q FY15 was up 2.3% in SGD due to the increase in Service Fee received as a result of an
additional contributions from the Mohali and Gurgaon CEs.
• Total Revenue y-o-y grew 38.8% in SGD terms from 3Q FY14 due to the increase in service fee as a result of additional contributions from
both the Mohali CE and Gurgaon CE as well as an increase in base fee.
• Stable distributions at 1.82 Singapore cents for 3Q FY15
Net Service Fee and Hospital Income excludes straight lining, depreciation and amortization
1.44 1.48 1.54 1.80 1.81 1.82
1Q FY15 2Q FY15 3Q FY15
DPU (cents)
FY14 FY15
22% 25%
18%
19
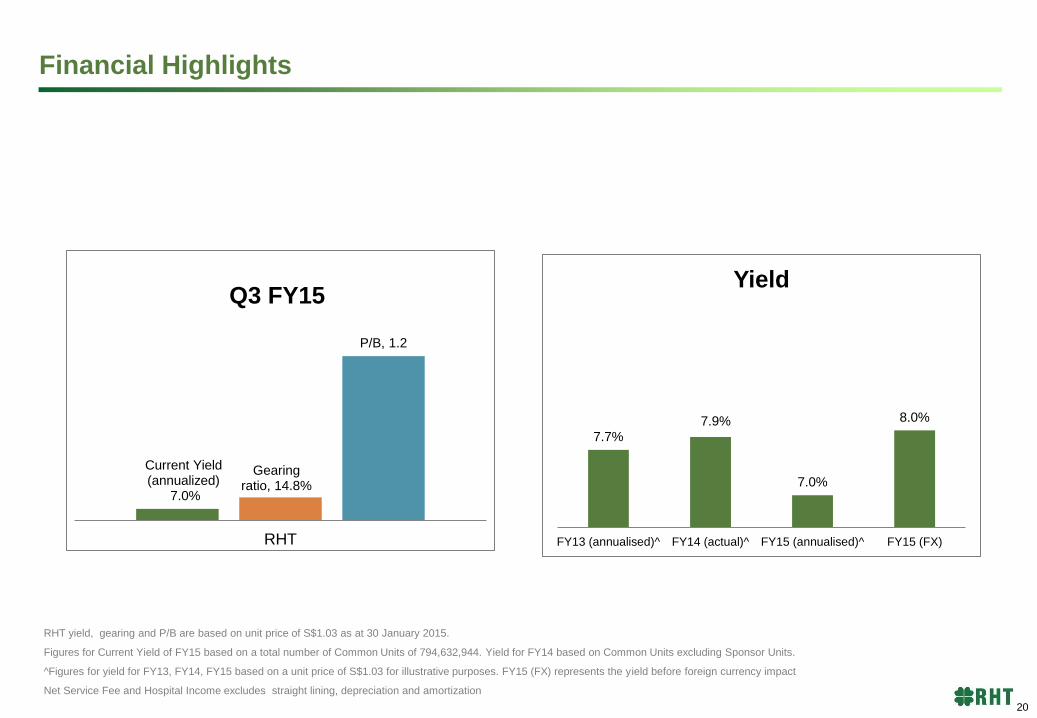
Financial Highlights
RHT yield, gearing and P/B are based on unit price of S$1.03 as at 30 January 2015.
Figures for Current Yield of FY15 based on a total number of Common Units of 794,632,944. Yield for FY14 based on Common Units excluding Sponsor Units.
^Figures for yield for FY13, FY14, FY15 based on a unit price of S$1.03 for illustrative purposes. FY15 (FX) represents the yield before foreign currency impact
Net Service Fee and Hospital Income excludes straight lining, depreciation and amortization
Current Yield (annualized)
7.0%
Gearing ratio, 14.8%
P/B, 1.2
RHT
Q3 FY15
7.7%
7.9%
7.0%
8.0%
FY13 (annualised)^ FY14 (actual)^ FY15 (annualised)^ FY15 (FX)
Yield
20
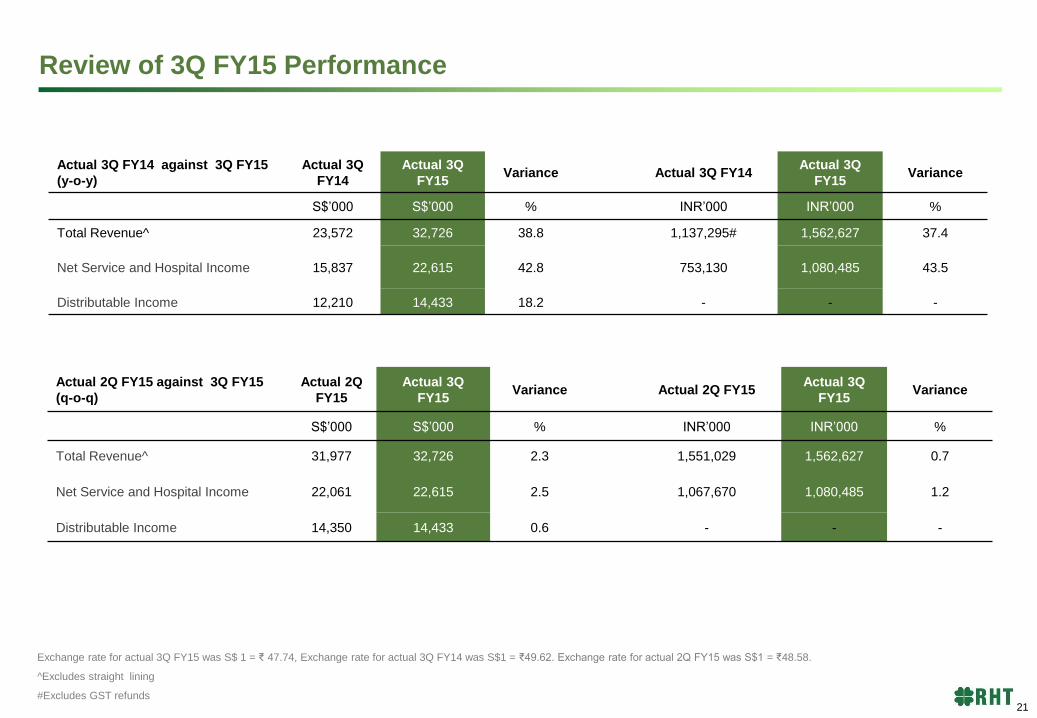
Review of 3Q FY15 Performance
Exchange rate for actual 3Q FY15 was S$ 1 = ₹ 47.74, Exchange rate for actual 3Q FY14 was S$1 = ₹49.62. Exchange rate for actual 2Q FY15 was S$1 = ₹48.58.
^Excludes straight lining
#Excludes GST refunds
Actual 3Q FY14 against 3Q FY15
(y-o-y)
Actual 3Q
FY14
Actual 3Q
FY15 Variance Actual 3Q FY14
Actual 3Q
FY15 Variance
S$’000 S$’000 % INR’000 INR’000 %
Total Revenue^ 23,572 32,726 38.8 1,137,295# 1,562,627 37.4
Net Service and Hospital Income 15,837 22,615 42.8 753,130 1,080,485 43.5
Distributable Income 12,210 14,433 18.2 - - -
Actual 2Q FY15 against 3Q FY15
(q-o-q)
Actual 2Q
FY15
Actual 3Q
FY15 Variance Actual 2Q FY15
Actual 3Q
FY15 Variance
S$’000 S$’000 % INR’000 INR’000 %
Total Revenue^ 31,977 32,726 2.3 1,551,029 1,562,627 0.7
Net Service and Hospital Income 22,061 22,615 2.5 1,067,670 1,080,485 1.2
Distributable Income 14,350 14,433 0.6 - - -
21
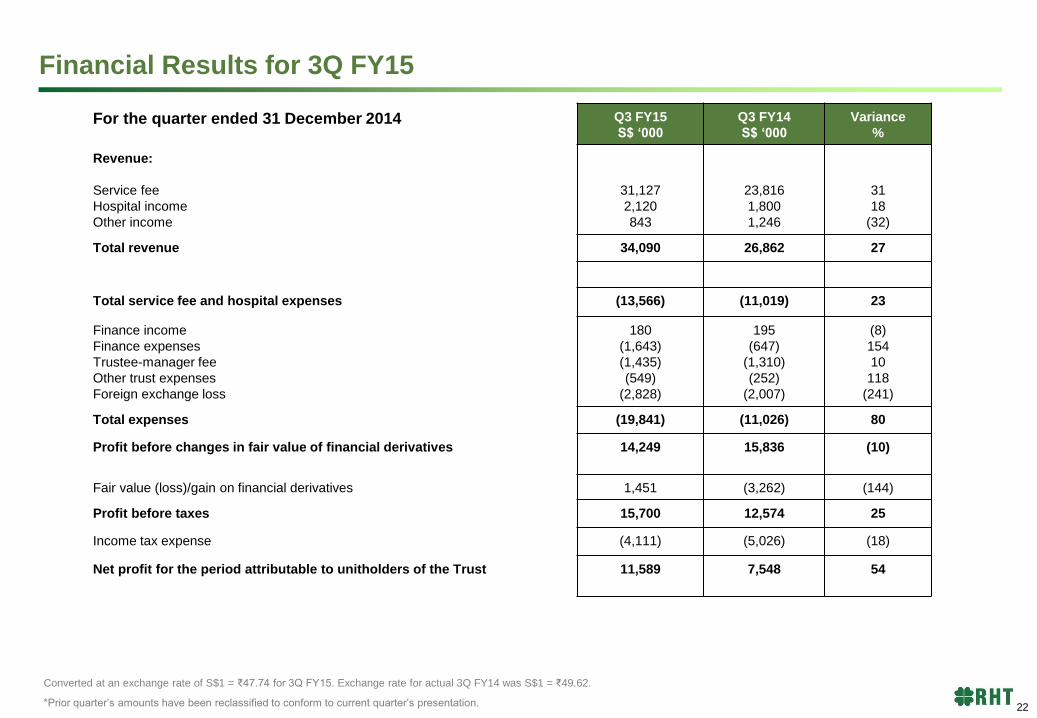
Financial Results for 3Q FY15
Converted at an exchange rate of S$1 = ₹47.74 for 3Q FY15. Exchange rate for actual 3Q FY14 was S$1 = ₹49.62.
*Prior quarter’s amounts have been reclassified to conform to current quarter’s presentation.
For the quarter ended 31 December 2014 Q3 FY15
S$ ‘000
Q3 FY14
S$ ‘000
Variance
%
Revenue:
Service fee
Hospital income
Other income
31,127
2,120
843
23,816
1,800
1,246
31
18
(32)
Total revenue 34,090 26,862 27
Total service fee and hospital expenses (13,566) (11,019) 23
Finance income
Finance expenses
Trustee-manager fee
Other trust expenses
Foreign exchange loss
180
(1,643)
(1,435)
(549)
(2,828)
195
(647)
(1,310)
(252)
(2,007)
(8)
154
10
118
(241)
Total expenses (19,841) (11,026) 80
Profit before changes in fair value of financial derivatives 14,249 15,836 (10)
Fair value (loss)/gain on financial derivatives 1,451 (3,262) (144)
Profit before taxes 15,700 12,574 25
Income tax expense (4,111) (5,026) (18)
Net profit for the period attributable to unitholders of the Trust 11,589 7,548 54
22
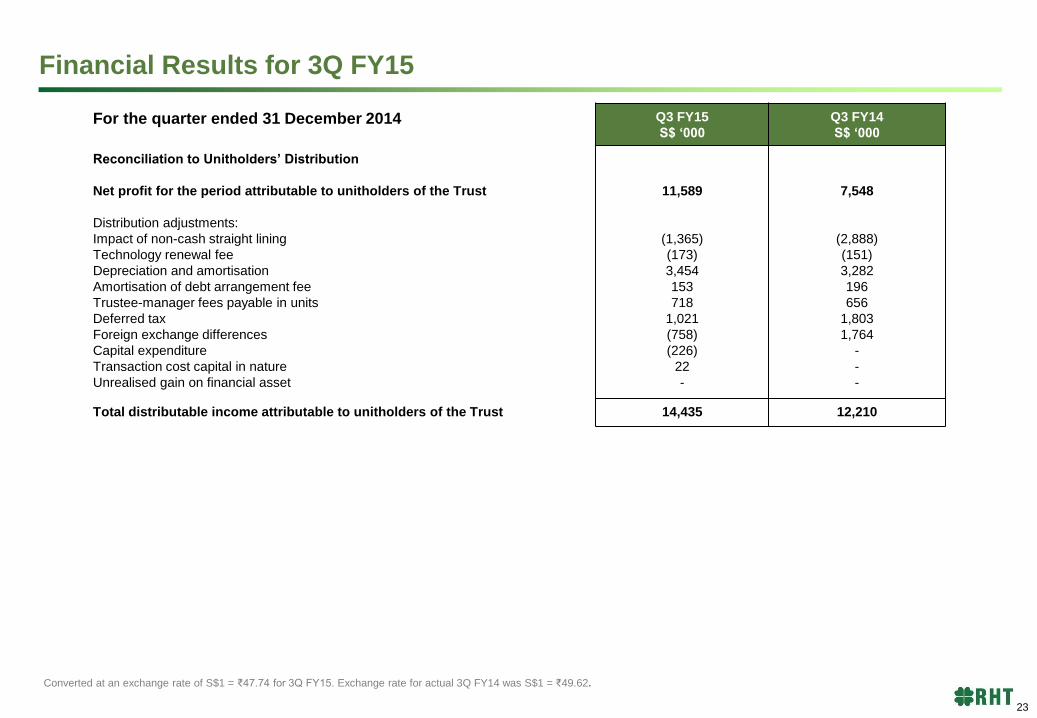
Financial Results for 3Q FY15
Converted at an exchange rate of S$1 = ₹47.74 for 3Q FY15. Exchange rate for actual 3Q FY14 was S$1 = ₹49.62.
For the quarter ended 31 December 2014 Q3 FY15
S$ ‘000
Q3 FY14
S$ ‘000
Reconciliation to Unitholders’ Distribution
Net profit for the period attributable to unitholders of the Trust
Distribution adjustments:
Impact of non-cash straight lining
Technology renewal fee
Depreciation and amortisation
Amortisation of debt arrangement fee
Trustee-manager fees payable in units
Deferred tax
Foreign exchange differences
Capital expenditure
Transaction cost capital in nature
Unrealised gain on financial asset
11,589
(1,365)
(173)
3,454
153
718
1,021
(758)
(226)
22
-
7,548
(2,888)
(151)
3,282
196
656
1,803
1,764
-
-
-
Total distributable income attributable to unitholders of the Trust 14,435 12,210
23
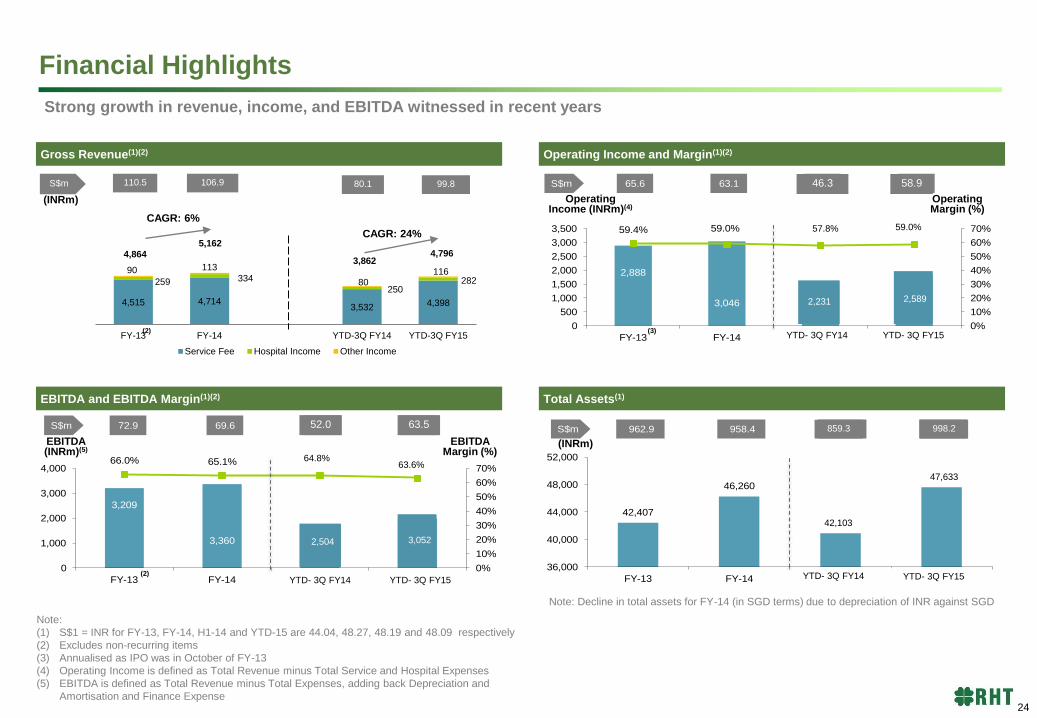
Financial Highlights
Gross Revenue(1)(2) Operating Income and Margin(1)(2)
EBITDA and EBITDA Margin(1)(2) Total Assets(1)
Strong growth in revenue, income, and EBITDA witnessed in recent years
(INRm)
CAGR: 6%
CAGR: 24%
Operating Income (INRm)(4)
Operating Margin (%)
EBITDA (INRm)(5)
EBITDA Margin (%)
(INRm)
Note:
(1) S$1 = INR for FY-13, FY-14, H1-14 and YTD-15 are 44.04, 48.27, 48.19 and 48.09 respectively
(2) Excludes non-recurring items
(3) Annualised as IPO was in October of FY-13
(4) Operating Income is defined as Total Revenue minus Total Service and Hospital Expenses
(5) EBITDA is defined as Total Revenue minus Total Expenses, adding back Depreciation and
Amortisation and Finance Expense
Note: Decline in total assets for FY-14 (in SGD terms) due to depreciation of INR against SGD
(2)
(2)
(3)
42,407
46,260
40,925
47,604
36,000
40,000
44,000
48,000
52,000
FY-13 FY-14 H1-14 H1-15
S$m 962.9 958.4 849.2 1,002.9
3,209
3,3601,692
1,975
66.0% 65.1% 65.0%63.3%
0%
10%
20%
30%
40%
50%
60%
70%
0
1,000
2,000
3,000
4,000
FY-13 FY-14 H1-14 H1-15
S$m 72.9 69.6 35.1 41.6
2,888
3,046
1,501 1,826
59.4% 59.0% 57.7%58.5%
0%
10%
20%
30%
40%
50%
60%
70%
0
500
1,000
1,500
2,000
2,500
3,000
3,500
FY-13 FY-14 H1-14 H1-15
S$m 65.6 63.1 31.1 38.5
4,515 4,714 3,532 4,398
259 334
250 282
90 113
80 116
FY-13 FY-14 YTD-3Q FY14 YTD-3Q FY15
Service Fee Hospital Income Other Income
5,162
3,862 4,796
S$m 110.5 106.9 80.1 99.8
4,864
42,103
47,633
998.2 859.3 63.5 52.0
2,504 3,052
64.8% 63.6%
58.9 46.3
57.8% 59.0%
2,231 2,589
YTD- 3Q FY14 YTD- 3Q FY14
YTD- 3Q FY14
YTD- 3Q FY15
YTD- 3Q FY15
YTD- 3Q FY15
24
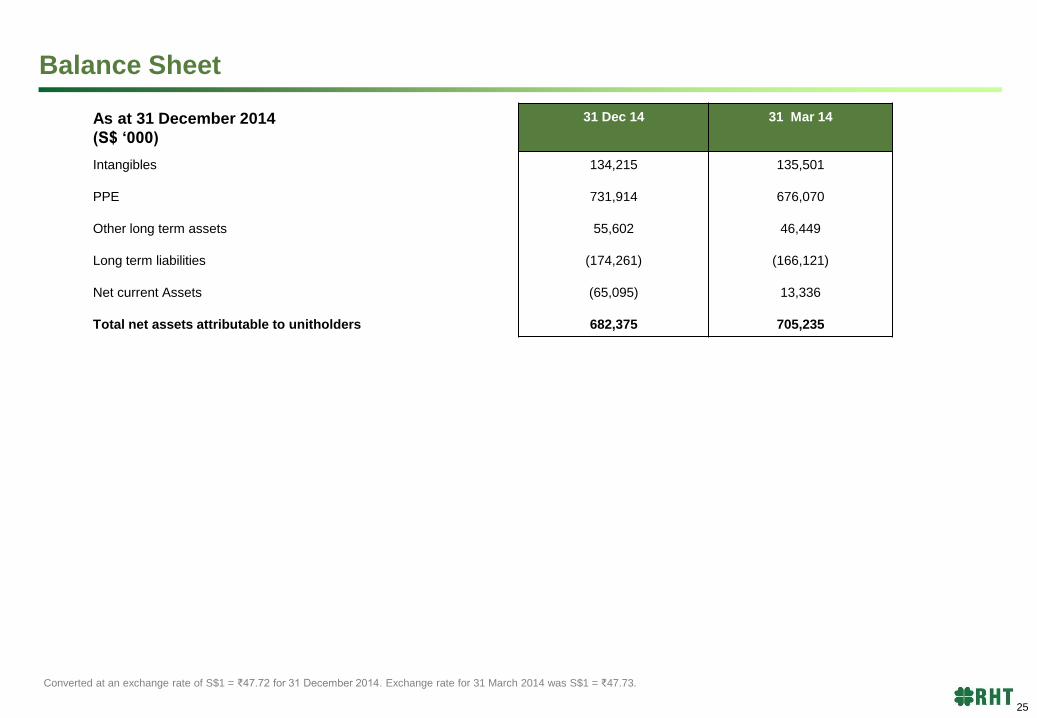
Balance Sheet
Converted at an exchange rate of S$1 = ₹47.72 for 31 December 2014. Exchange rate for 31 March 2014 was S$1 = ₹47.73.
As at 31 December 2014
(S$ ‘000)
31 Dec 14 31 Mar 14
Intangibles
PPE
Other long term assets
Long term liabilities
Net current Assets
Total net assets attributable to unitholders
134,215
731,914
55,602
(174,261)
(65,095)
682,375
135,501
676,070
46,449
(166,121)
13,336
705,235
25
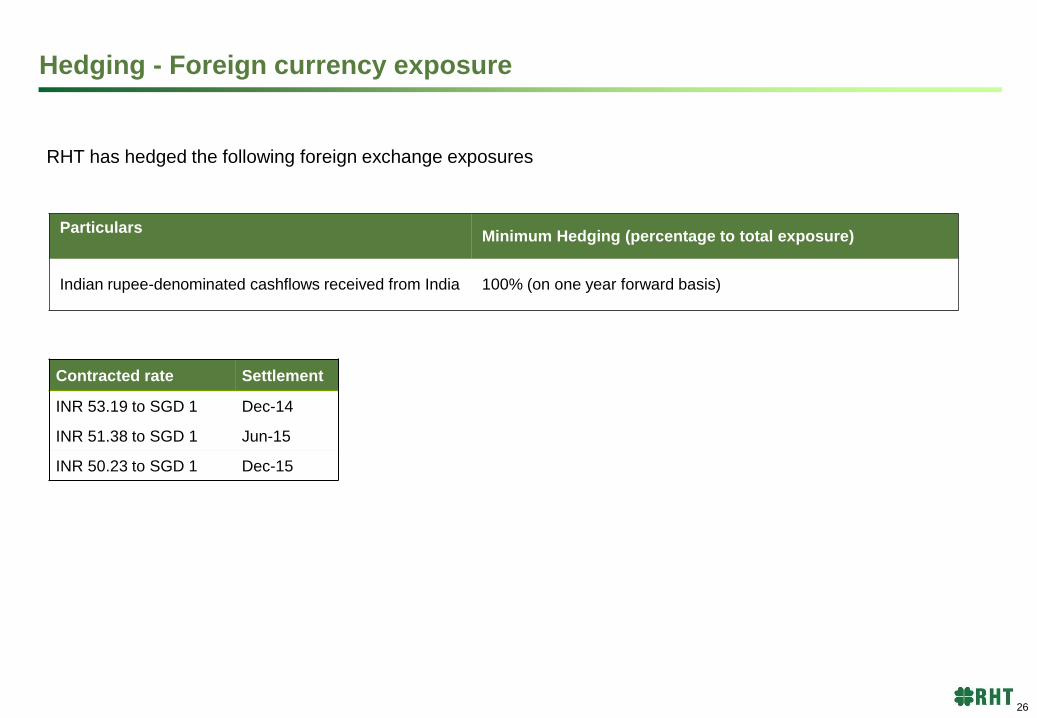
Hedging - Foreign currency exposure
RHT has hedged the following foreign exchange exposures
Contracted rate Settlement
INR 53.19 to SGD 1 Dec-14
INR 51.38 to SGD 1 Jun-15
INR 50.23 to SGD 1 Dec-15
Particulars
Minimum Hedging (percentage to total exposure)
Indian rupee-denominated cashflows received from India 100% (on one year forward basis)
26
S$ 123.8m(4)
H1-15
30.1x27.4x 27.7x
15.1x
0
4
8
12
16
20
24
28
32
FY-13 FY-14 H1-14 H1-15
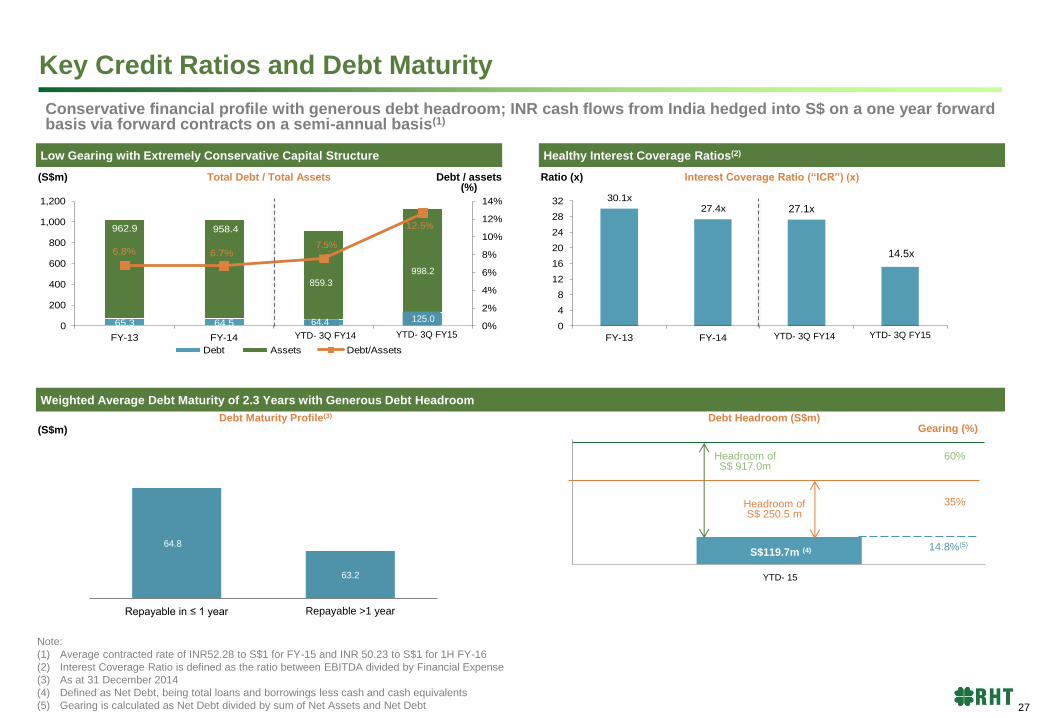
Key Credit Ratios and Debt Maturity
Low Gearing with Extremely Conservative Capital Structure Healthy Interest Coverage Ratios(2)
Weighted Average Debt Maturity of 2.3 Years with Generous Debt Headroom
Conservative financial profile with generous debt headroom; INR cash flows from India hedged into S$ on a one year forward basis via forward contracts on a semi-annual basis(1)
(S$m) Ratio (x) Total Debt / Total Assets Interest Coverage Ratio (“ICR”) (x)
Debt Maturity Profile(3) (S$m)
Headroom of S$ 917.0m
60%
35%
14.8%(5)
Debt Headroom (S$m) Gearing (%)
Headroom of S$ 250.5 m
Note:
(1) Average contracted rate of INR52.28 to S$1 for FY-15 and INR 50.23 to S$1 for 1H FY-16
(2) Interest Coverage Ratio is defined as the ratio between EBITDA divided by Financial Expense
(3) As at 31 December 2014
(4) Defined as Net Debt, being total loans and borrowings less cash and cash equivalents
(5) Gearing is calculated as Net Debt divided by sum of Net Assets and Net Debt
65.3 64.5 64.3 126.9
962.9 958.4
849.2
1,002.96.8% 6.7% 7.6%
12.7%
0%
2%
4%
6%
8%
10%
12%
14%
0
200
400
600
800
1,000
1,200
FY-13 FY-14 H1-14 H1-15
Debt Assets Debt/Assets
Debt / assets (%)
S$119.7m (4)
YTD- 15
64.8
63.2
Repayable in ≤ 1 year Repayable >1 year
27.1x
14.5x
5%
7.5%
859.3
998.2
125.0 64.4
YTD- 3Q FY14 YTD- 3Q FY15 YTD- 3Q FY15 YTD- 3Q FY14
27

Appendix
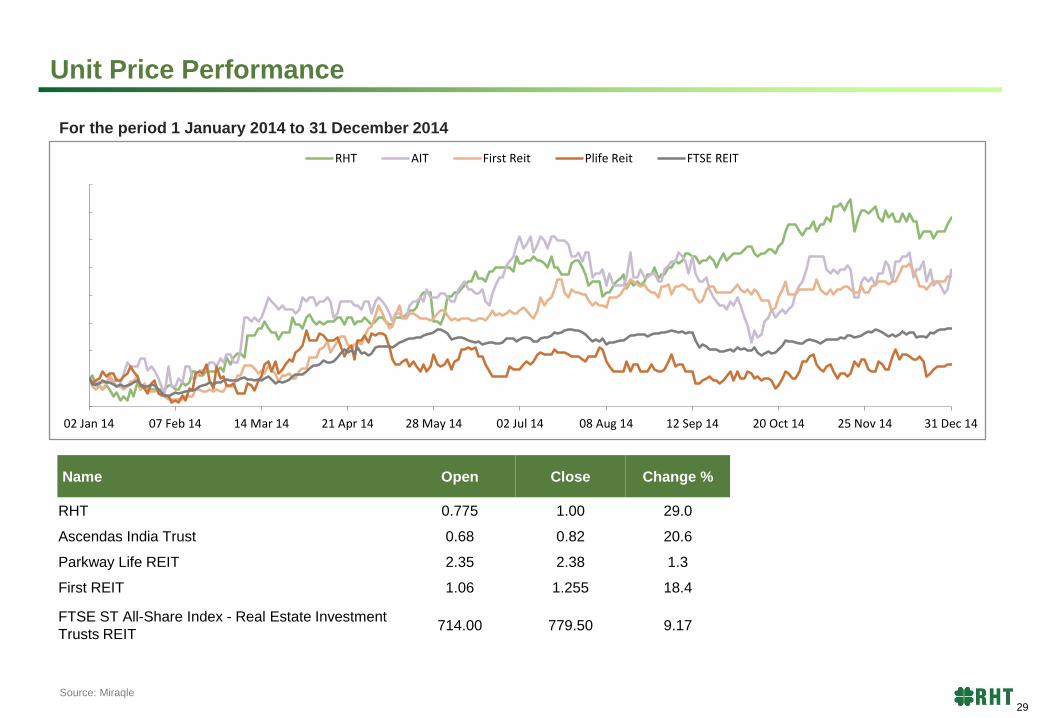
Unit Price Performance
For the period 1 January 2014 to 31 December 2014
Name Open Close Change %
RHT 0.775 1.00 29.0
Ascendas India Trust 0.68 0.82 20.6
Parkway Life REIT 2.35 2.38 1.3
First REIT 1.06 1.255 18.4
FTSE ST All-Share Index - Real Estate Investment
Trusts REIT 714.00 779.50 9.17
Source: Miraqle
95%
100%
105%
110%
115%
120%
125%
130%
135%
02 Jan 14 07 Feb 14 14 Mar 14 21 Apr 14 28 May 14 02 Jul 14 08 Aug 14 12 Sep 14 20 Oct 14 25 Nov 14 31 Dec 14
RHT AIT First Reit Plife Reit FTSE REIT
29
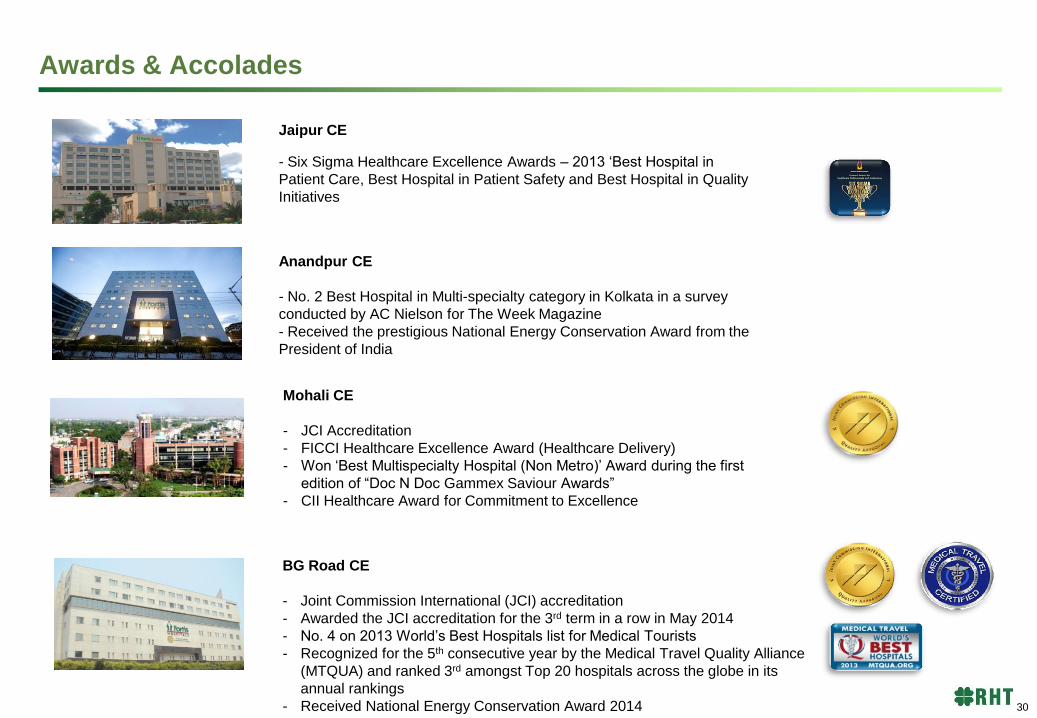
Jaipur CE
- Six Sigma Healthcare Excellence Awards – 2013 ‘Best Hospital in
Patient Care, Best Hospital in Patient Safety and Best Hospital in Quality
Initiatives
Anandpur CE
- No. 2 Best Hospital in Multi-specialty category in Kolkata in a survey
conducted by AC Nielson for The Week Magazine
- Received the prestigious National Energy Conservation Award from the
President of India
BG Road CE
- Joint Commission International (JCI) accreditation
- Awarded the JCI accreditation for the 3rd term in a row in May 2014
- No. 4 on 2013 World’s Best Hospitals list for Medical Tourists
- Recognized for the 5th consecutive year by the Medical Travel Quality Alliance
(MTQUA) and ranked 3rd amongst Top 20 hospitals across the globe in its
annual rankings
- Received National Energy Conservation Award 2014
Mohali CE
- JCI Accreditation
- FICCI Healthcare Excellence Award (Healthcare Delivery)
- Won ‘Best Multispecialty Hospital (Non Metro)’ Award during the first
edition of “Doc N Doc Gammex Saviour Awards”
- CII Healthcare Award for Commitment to Excellence
Awards & Accolades
30
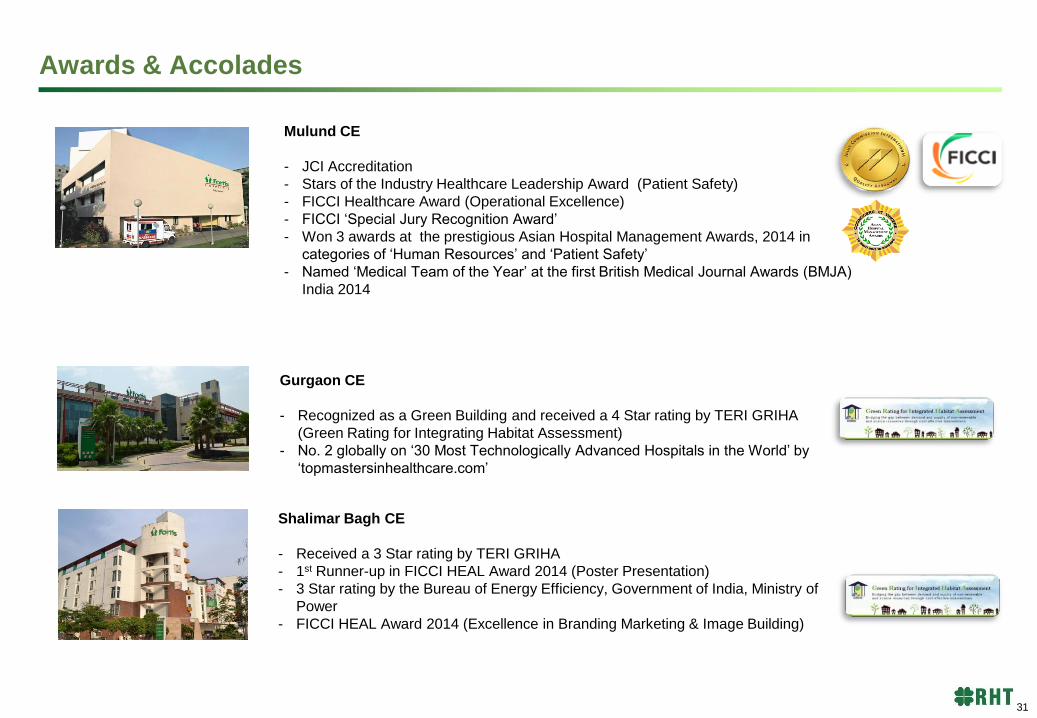
Mulund CE
- JCI Accreditation
- Stars of the Industry Healthcare Leadership Award (Patient Safety)
- FICCI Healthcare Award (Operational Excellence)
- FICCI ‘Special Jury Recognition Award’
- Won 3 awards at the prestigious Asian Hospital Management Awards, 2014 in
categories of ‘Human Resources’ and ‘Patient Safety’
- Named ‘Medical Team of the Year’ at the first British Medical Journal Awards (BMJA)
India 2014
Gurgaon CE
- Recognized as a Green Building and received a 4 Star rating by TERI GRIHA
(Green Rating for Integrating Habitat Assessment)
- No. 2 globally on ‘30 Most Technologically Advanced Hospitals in the World’ by
‘topmastersinhealthcare.com’
Shalimar Bagh CE
- Received a 3 Star rating by TERI GRIHA
- 1st Runner-up in FICCI HEAL Award 2014 (Poster Presentation)
- 3 Star rating by the Bureau of Energy Efficiency, Government of India, Ministry of
Power
- FICCI HEAL Award 2014 (Excellence in Branding Marketing & Image Building)
Awards & Accolades
31
Nagarbhavi CE - National Energy Conservation Award
Awards & Accolades
32
Appendix

0.5% - 1.0% of acquisition price
0.5% of the sale price (Divestment
to 3rd party)
No divestment fee (Divestment to
Sponsor)
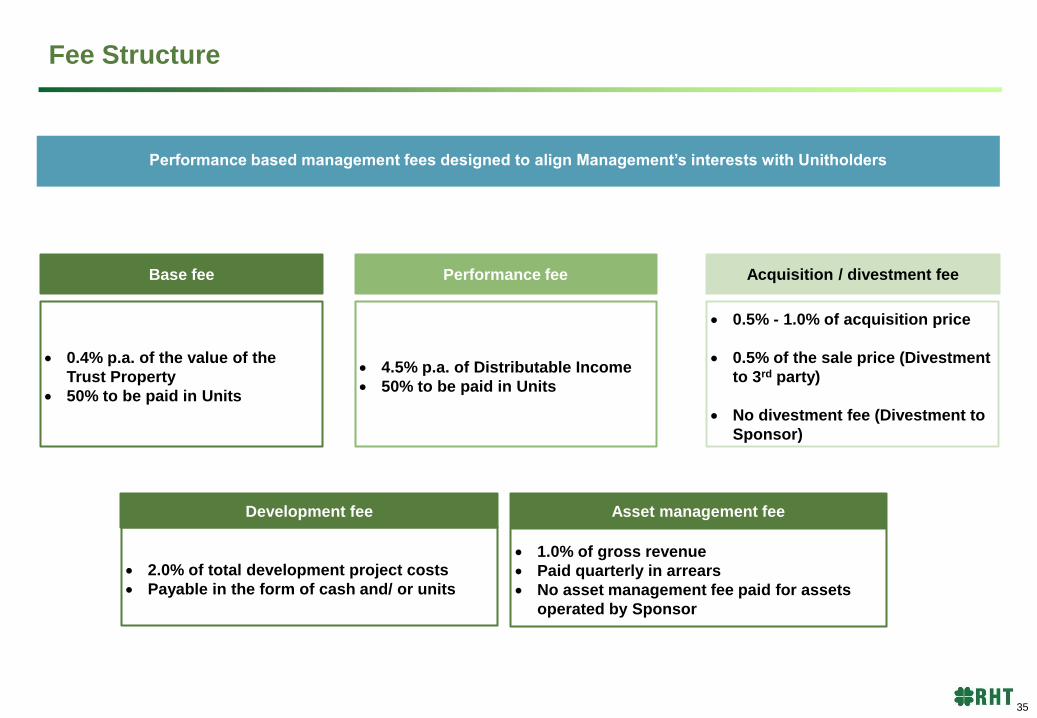
Performance based management fees designed to align Management’s interests with Unitholders
Base fee Performance fee Acquisition / divestment fee
0.4% p.a. of the value of the
Trust Property
50% to be paid in Units
4.5% p.a. of Distributable Income
50% to be paid in Units
2.0% of total development project costs
Payable in the form of cash and/ or units
Development fee Asset management fee
1.0% of gross revenue
Paid quarterly in arrears
No asset management fee paid for assets
operated by Sponsor
Fee Structure
34
0.5% - 1.0% of acquisition price
0.5% of the sale price (Divestment
to 3rd party)
No divestment fee (Divestment to
Sponsor)
Performance based management fees designed to align Management’s interests with Unitholders
Base fee Performance fee Acquisition / divestment fee
0.4% p.a. of the value of the
Trust Property
50% to be paid in Units
4.5% p.a. of Distributable Income
50% to be paid in Units
2.0% of total development project costs
Payable in the form of cash and/ or units
Development fee Asset management fee
1.0% of gross revenue
Paid quarterly in arrears
No asset management fee paid for assets
operated by Sponsor
Fee Structure
35
For further information please contact:
Tan Suan Hui
Religare Health Trust Trustee Manager Pte. Ltd
80 Raffles Place
#11-20 UOB Plaza 2
Singapore 048624
Email: [email protected]
www.religarehealthtrust.com
36
![[MS-IRDA]: IrDA Object Exchange (OBEX) Protocol Profile... · IrDA Object Exchange (OBEX) Protocol Profile ... [MS-IRDA]: IrDA Object Exchange (OBEX) Protocol Profile ... 1 Introduction](https://img.dokumen.tips/doc/110x75/5a7d57c57f8b9a49588d7cc8/ms-irda-irda-object-exchange-obex-protocol-profile-object-exchange-obex-protocol.jpg)