Embed Size (px)
Citation preview

RHTSTRICTLY PRIVATE AND CONFIDENTIAL
FY17 Financial Results

This presentation is focused on comparing actual results from the period from 1 April 2016 to 31 March 2017 (“FY17“). Other than the
comparative figures presented, no other comparative figures will be presented as the acquisition of the Portfolio of RHT as well as
listing on the Singapore Stock Exchange was completed on 19 October 2012.
This presentation may contain forward-looking statements that involve risks and uncertainties. Actual future performance, outcomes
and results may differ materially from those expressed in forward-looking statements as a result of a number of risks, uncertainties and
assumptions. Representative examples of these factors include (without limitation) general industry and economic conditions, interest
rate trends, cost of capital and capital availability, competition from other developments or companies, shifts in expected levels of
income and occupancy rate, changes in operating expenses (including employee wages, benefits and training), governmental and
public policy changes and the continued availability of financing in the amounts and the terms necessary to support future business.
Investors are cautioned not to place undue reliance on these forward-looking statements. For further information, please also refer to
RHT’s press release which is released in conjunction with this set of presentation.
The Indian Rupee and Singapore Dollar are defined herein as “INR” and “S$” respectively. Any discrepancy between individual
amounts and total shown in this presentation is due to rounding.
Disclaimer
2

Portfolio

RHT– 18 Quality Assets Spread Across India
: 100% Owned RHT Clinical Establishment: Greenfield Clinical Establishments: Operating Hospitals: 49% Owned Clinical Establishmentcommencing 12 October 2016
RHT Portfolio Summary: Portfolio valued at S$1,120.8m(3)(4)
12 RHT Clinical Establishments 4 Greenfield Clinical Establishments 2 Operating Hospitals managed and
operated by RHT
Premier Locations Across India: Approximately 3.6 million sq ft of built-up
area across 10 states Sizeable population catchment Located near to major transportation nodes
RHT: Investment mandate to invest in medical
and healthcare assets and services in Asia,Australasia and other emerging markets
A healthcare-related business trust listedon the SGX (current market cap ofS$717.6 m(1))
Partnership with Fortis Healthcare Limited,the leading healthcare delivery servicesprovider in India
400 Potential Bed Capacity
Amritsar
155 Operational Beds166 Installed Bed Capacity89 Potential Additional Capacity
Ludhiana
79 Potential Bed Capacity
Jaipur
245 Operational Beds320 Installed Bed Capacity
Faridabad
210 Operational Beds210 Installed Bed Capacity
Mumbai (Mulund)
288 Operational Beds567 Installed Bed Capacity
Mumbai (Kalyan)
49 Operational Beds52 Installed Capacity
255 Operational Beds258 Installed Bed Capacity197 Potential Additional Capacity
Bengaluru (BG Road)Bengaluru (Nagarbhavi)
45 Operational Beds62 Installed Bed Capacity43 Potential Additional Capacity
Bengaluru (Rajajinagar)
48 Operational Beds52 Installed Bed Capacity
Chennai (Malar)
Chennai
151 Operational Beds178 Installed Bed Capacity
45 Potential Bed Capacity
Hyderabad
Kolkata (Anandpur)
200 Operational Beds373 Installed Bed Capacity
Noida
191 Operational Beds200 Installed Bed Capacity31 Potential Additional Capacity
Greater Noida
350 Potential Bed Capacity
Mohali
346 Operational Beds355 Installed Bed Capacity*500 Potential Additional Capacity
National Capital Region
268 Operational Bed Capacity450 Installed Bed Capacity550 Potential Additional Capacity
Gurgaon
200 Operational Beds350 Installed Bed Capacity
Delhi (Shalimar Bagh)
Note:(1) As at 31 March 2017. Source: SGX(2) No. of beds and installed capacities as at 31 March 2017. Potential bed capacity assumes all planned phases of development and construction are completed(3) Based on S$1 = INR 46.43 as at 31 March 2017. The appraised value of each of the portfolio assets by the independent valuers is as at 31 March 2017.(4) The portfolio value has taken into the effect the disposal of 51% interest in FHTL.*The development of the Mohali land is intended to be carried out in phases and will not result in an immediate addition in capacity of 500 beds upon completion of the initialphase of development. 4

1,040980
710 660 680
450
360420
1,1601,030
810710 700
480 420 400
FMRI Mohali Mulund Noida BG Road Shalimar BaghAnandpur Jaipur
3QFY16 3QFY17
4,120 3,970
2,810 2,740 2,730
4,790
4,260
3,1902,870 2,830
Gurgaon Mohali Mulund Noida BG Road
FY16 FY177%
16%
Notes:(1) Figures are updated annually.^Bed figures at IPO exclude Gurgaon Clinical Establishment as it was under development at the time of Listing.Bed figures for FY-17 and FY-18(P) include bed capacity from ongoing projects currently under development.
Stable Portfolio and Growth
Consistent Growth in Operational Beds Since Listing
1,706 2,2522,607 2,651 2,651 3,202
IPO^ FY-14 FY-15 FY-16 FY-17 FY-18 (P)
Number of Operational Beds
32%
16%
2%
21%
5
Strong Growth from Capacity Expansion
14%
5% 4%
Quarter on Quarter Growth in Operator’s Revenue (INR m) (1)
2,651 3,593 5,8772,0002,5003,0003,5004,0004,5005,0005,5006,0006,500
Operational Bed Capacity Installed Bed Capacity Potential Bed Capacity
2,284
942
(1)
(1) (1)

RHT’s assets are spread across India with increasing income generated
Diversified Portfolio of Quality Assets
6
^ Source: Fortis presentation slides for FY16. Updated annuallyAll figures based on information released by Fortis Healthcare Limited for their Top 10 performing hospitals.(1) Installed capacity refers to the maximum number of beds that can be operated at each hospital without further expansion. Potential capacity refers to the maximum number of beds that can be
operated at each hospital when all stages of development are completed.* 3Q and 4Q FY17’s figures are presented in the manner with 100% interest in FHTL.
ARPOB Growth in RHT Clinical Establishments^ (INR m)
Stable Occupancy in RHT Clinical Establishments^
61%
79% 81% 81% 75%67%
80% 80% 84%73%
Gurgaon Mohali Mulund Noida BG Road
FY16 FY17
ARPOB (INR m) Occupancy rate
3Q FY14 10.23 78%
4Q FY14(1) 10.72 73%
1Q FY15 12.31 74%
2Q FY15 12.66 74%
3Q FY15 13.23 72%
4Q FY15 12.91 75%
1Q FY16 13.47 72%
2Q FY16 12.94 80%
3Q FY16 13.28 75%
4Q FY16 13.93 73%
1Q FY17 14.23 76%
2Q FY17 14.16 84%
3Q FY17* 14.17 75%
4Q FY17* 14.36 71%
Solid Portfolio Characteristics
25.1
15.113.4
18.8
14.4
27.1
15.6 14.5
18.715.3
Gurgaon Mohali Mulund Noida BG Road
FY16 FY17

Solid Portfolio Characteristics(4) Stability from Base Fee Component(4)
No Single Asset Accounts for >15% of RHT’s Revenues(4) Growth of Variable Fee Component*
Fee structure offers RHT ideal combination of guaranteed, stable cash-flows with opportunity to participate in operationalgrowth of its healthcare assets
Income-generating Assets Accountfor Vast Majority of Portfolio
Substantial Portion of Portfolio CompriseLong Term Lease / Freehold Land
Portfolio Valuation Breakdown (FY-17)(1)
Variable Service Fee• 7.5% of Fortis Operating
Companies’ OperatingIncome
Base Service Fee(3)
• Fixed at the start with a3.0% p.a. escalation
• Revised upwards for anycapex / expansion
Service Fee Components - Base and Variable(INRm)(2)
Note: FY-13 fees are annualised. Decline in Base Service Fee in FY-14 and FY-17 is due to depreciation ofINR against SGD.
Note:(1) Weighted by portfolio valuation. Asset are independently valued by the Independent Valuers in INR as at 31 March 2017.(2) Financials converted at S$1 = INR43.75 for FY-13, S$1 = INR48.27 for FY-14, S$1 = INR47.41 for FY-15, S$1 = INR 47.48, FY-16
S$1 = INR 47.36, Actual FY-17 S$1 = INR 48.39.(3) Base Service fee excludes accounting straight lining and includes Technological Renewal Fee and are on a full year basis.(4) The figures have taken into the effect the disposal of 51% interest in FHTL.
S$m 64.8 62.1 44.5
S$m 21.1 22.1 27.9
Stable Portfolio Providing Upside Exposure
OperatingHospitals
2.5%
RHT ClinicalEstablishments
90.2%
Greenfield ClinicalEstablishments
7.3%
Freehold69.1%
<50 years RemainingLease Life
3.2%
≥ 50 years RemainingLease Life27.7%
2,209 2,3041,8452,835 2,998
2,113 2,180
2,221923
1,067
1,321 1,436
1,530
-
1,000
2,000
3,000
4,000
5,000
6,000
7,000
FY-13 FY-14 FY-15 FY-16 FY-17
4,065
5,6438.2%
38.8%
4.9%5,920
5.5%
3,758
The Gurgaon and Shalimar Bagh Clinical Establishments owned by FHTL 49% with 51% owned by FHML.
30.3
46.1
7
57%
3%
Nagarbhavi,5% Rajajinagar,
3%
Noida, 12%
Faridabad,4%
Amritsar,3%
Jaipur, 9%
Malar, 4%
ShalimarBagh, 8%
BG Road,9%
Kalyan, 2%
Mulund,13%
Anandpur,5%
Gurgaon,14%
Mohali, 9%
(Revenue Contribution with 49%FHTL Ownership)
5,596
31.6
45.9
S$m - - 46.5 48.6 38.1
FHTL• Base and variable fee
contributed by FHTL up till 12Oct 2016 and 49% share ofFHTL’s service fee from 13Oct 2016 –31 Mar 2017.
79% 77%71% 70% 68%
21% 23%29% 30% 32%
0%
10%
20%
30%
40%
50%
60%
70%
80%
FY2013 FY2014 FY2015 FY2016 FY2017
Base fee Variable fee
Demonstrates fast growth of the Indian healthcare industry
* The figures are presented in the manner with 100% interest in FHTL and includes accounting straight lining.

In-built Capacity for Expansion within Existing Portfolio
HospitalsCurrent Operational Bed
CapacityCurrent Installed Bed
Capacity
Potential Additional BedCapacity
(ex. Greenfield ClinicalEstablishments)
Amritsar 155 166 89
Anandpur, Kolkata 200 373
BG Road, Bengaluru 255 258 197
Gurgaon 268 450 550
Faridabad 210 210
Jaipur 245 320
Kalyan, Mumbai 49 52
Malar, Chennai 151 178
Mohali 346 355 500 (Mohali land)
Mulund, Mumbai 288 567
Nagarbhavi, Bengaluru 45 62 43
Noida 191 200 31
Rajajinagar, Bengaluru 48 52
Shalimar Bagh, New Delhi 200 350
Total 2,651 3,593
8

Based on S$1 = INR 48.50.
Development Project Pipeline
Ludhiana Greenfield Clinical Establishment BG Road Brownfield Clinical Establishment
Estimated Time of Completion 2017 2017
No. of Beds Planned 79 200
Specialties Mother & Child Programmes Oncology, Operating Theatre
Civil Cost INR 880 m (S$18.0 m) INR 1,700.8m (S$34.0 m)
Expansion of Mohali Clinical Establishment
Estimated Time of Completion Phased
Potential Bed Capacity 480
Specialties -
CostLand –INR 730.0 m (S$14.6m)
Building –INR 2,822 m (S$56.4 m)
9

Based on S$1 = INR 48.50.Appraised by the independent valuer as at 31 March 2016.
.
Capacity Enhancement Initiatives Underway
Amritsar Clinical Establishment Noida Clinical EstablishmentShalimar Bagh Clinical
Establishment
Estimated Time of Completion December 2019July 2017 –brought forward from March
2018September 2017
No. of Additional Beds Planned 102 27 -
Purpose Addition of Oncology Block Addition of Gastroenterlogy unit Addition of Oncology programme
Civil Cost INR 422.6m (S$8.5 m) INR 141.5m (S$2.8 m) INR 196.9m (S$3.9 m)
Jaipur Clinical Establishment Mulund Clinical Establishment Nagarbhavi Clinical Establishment
Estimated Time of Completion Completed and operations commenced March 2018 July 2017
No. of Additional Beds Planned 59 39 45
PurposeMother and Child Health programme,
OrthopedicsMother and Child Health programme
Addition of 2 operating theatres and a cathlab
Civil Cost INR 162.9m (S$3.3 m) INR 129.6m (S$2.6 m) INR 198.2m (S$4.0 m)
10

Financials

Financial Highlights
(1) RHT current yield, gearing and P/B are based on unit price of S$0.89 as at 31 March 2017. Gearing ratio takes into consideration ongoing and future asset enhancement initiatives (BG Road, Ludhiana,Jaipur, Mulund, Nagarbhavi, Amritsar and Noida Clinical Establishments and expansion of Mohali Clinical Establishments).
(2) Figures for yield of FY-17 is based on a total number of Common Units of 806,331,944 as at 31 March 2017. Yield for FY-13 and FY-14 based on Common Units excluding Sponsor Units.Figures for yield for FY-13, FY-14, FY-15, FY-16 and FY-17 based on the unit price of the respective financial year end for illustrative purposes.
(3) Distributions paid out in FY2017 as shown above is at 95% of Distributable Income. 100% of Distributable Income was paid out in previous years.
8.8%
9.6%
6.7%
7.9%
6.7%
FY-13 (annualised) FY-14 FY-15 FY-16 FY-17
6.9% if FHTLtook place inOct 2015
Attractive yield over the financial years (2)(3)
Attractive yield, gearing & P/B(1) Gross Asset Value (S$ m)
Distributable Income (S$ m) – Y-o-Y comparison
12
44.8 46.758.2 61.6
50.5
-
10.0
20.0
30.0
40.0
50.0
60.0
70.0
FY-13 (annualised) FY-14 (actual) FY-15 (actual) FY-16 (actual) FY-17 (actual)Distributable Income
748 772 796
9911129 1121
IPO FY-13 FY-14 FY-15 FY-16 Post Disposalof FHTL
50%
53.7 if FHTLtook place inOct 2015
6.7% 20.5%1.0
26.2% *
Yield Gearing ratio P/B
With acquisition of Mohali land and development projects, post disposal of FHTL
* Post FHTL disposal and completion of asset enhancement projects, and without inclusion of NCDs

Financial Highlights
Distributions are paid on a semi-annual basis for the six-month periods ending 31 March and 30 September of each year.Based on total number of Common Units of 806,331,944 currently issued as at 31 March 2017.^Annualised as IPO was in October of FY-13.FY17 DPU represents 95% of Distributable Income. 100% of Distributable Income was paid out before FY17.
13
Period DPU Comparative DPU (2)
3Q FY16 1.91 cents per unit 1.45 cents per unit
4Q FY16 1.91 cents per unit 1.38 cents per unit
3QFY17 1.25 cents per unit
24.8 cents per unit (1)
4QFY17 1.12 cents per unit
7.90 8.197.32 7.72
5.97
-
1.00
2.00
3.00
4.00
5.00
6.00
7.00
8.00
9.00
IPO^ FY14 FY15 FY16 FY17
DPU
6.72 (2)
DPU YTD FY2017 : 5.97 cents
Total DPU FY-17 : 5.97 cents per unit
Cumulative Distribution Amount for 2HFY17: 2.37 centsEx-date: 31 May 2017 at 9.00 amBook Closure Date: 2 June 2017 at 5.00 pmPayment Date: 28 June 2017
(1) Special Distribution paid out arising from the disposal of 51% interests in FHTL was completed on 12 October 2017 (the “Disposal”).
(2) Assuming that the FHTL Disposal had occurred in the comparative period.
Drop in DPU due to:
- reduced share in FHTL- higher corporate taxes- loan interests costs.

Financial Highlights
14
63.5
2,231
1,888 1,9261,561
2,795
3,010
2,449 2,507 2,465
68.067.0
70.0 67.664.5
45.0
50.0
55.0
60.0
65.0
70.0
75.0
-500
500
1500
2500
3500
4500
FY-13(annualised)
FY-14 (actual) FY-15 (actual) FY-16 (actual) FY-17 (actual)
FHTL Net Service Fee (INR m) Margin (%)
4,337 4,026
- - 39.8 41.2
4,4333,0102,795
S$m 62.4 52.4
(INRm)
51.7 50.9
FHTLS$m
32.3
With 100%interest inFHTL, thenet servicefee marginis 66.0%
Note:(1) Exchange rate for translation at S$1 = INR for FY-13, FY-14, FY-15 and FY-16 are 44.04, 48.27, 47.41 and 47.36 respectively. Actual exchange rate for FY-17 was S$1 = INR 48.39.(2) Excludes non-recurring items.(3) Annualized as IPO was in October of FY-13.(4) Excludes straight-lining.(5) S$1 = INR for FY-13, FY-14, FY-15, FY-16 and FY-17 are 43.75, 47.73, 45.43, 49.17 and 46.43 respectively.(6) Includes FHTL’s performance up till 12 October 2016 and 49% share of FHTL’s result from 13 October 2016 to 31 March 2017.
962.9S$m
FHTLS$m
(INRm)
Total Assets (5)Adjusted Net Service Fee and Margin (1)(2)(3)(4)(6) (Operations)
958.4 717.3 747.9 734.4
Note:a) Decline in total assets for FY-14 (in SGD terms) due to depreciation of INR against SGD.b) Decline in total assets for FY-17 due to disposal of 51% interest in a subsidiary.c) Exchange rate used for FHTL’s total asset was S$1 = INR 48.26.
18,469 19,899 17,023
42,12745,743
32,58836,779
34,100
0
10000
20000
30000
40000
50000
60000
FY-13 FY-14 FY-15 FY-16 FY-17
FHTL Total Asset
- - 406.5 404.7 352.7
42,127 45,743 51,057 56,678 51,123

Notes:(1) Exchange rate for translation for annualized FY-13 was S$ 1 = INR 44.04, actual FY-14 was S$ 1 = INR 48.27, exchange rate for actual FY-15 was S$1 = INR 47.41 and actual FY-16 was S$1 = INR
47.36; actual FY-17 was S$1 = INR 48.39(2) Excludes straight-lining of Base Service Fee. Figures for Actual Year 2014 includes GST.(3) FY15 figures include a one-off gain on acquiring the Mohali Clinical Establishment.(4) Includes FHTL’s performance up till 12 October 2016 and 49% share of FHTL’s result from 13 October 2016 to 31 March 2017.
Revenue (S$’000) (1)(2)(3)(4)
6,214.7
Financial Performance Over The Years
15
47.549.7
39.164.8 62.1
44.5 46.1
45.9
21.1 22.1
27.930.3
31.6
5.9 6.9
8.09.7
9.6
2.0 3.9
3.0
2.7
2.8
FY-13 (annualised) FY-14 (actual) FY-15 (actual) FY-16 (actual) FY-17 (actual)
FHTL Base Fee Variable Fee Hospital Income Other Income
129.0
Revenue (INR ‘000) (1)(2)(3)(4)
2,255.6 2,356.2
1,892.52,835.0 2,998.0
2,113.1 2,179.52,220.8
923.01,067.0
1,321.41,436.2
1,530.2
259.0334.4
384.4457.0
463.8
89.9
190.5
140.2127.9
136.8
FY-13 (annualised) FY-14 (actual) FY-15 (actual) FY-16 (actual) FY-17 (actual)
FHTL Base Fee Variable Fee Hospital Income Other Income
6,244.1
93.8 95.0
130.9138.5
4,106.9
4,589.9
6,556.8

Review of 4Q FY17 against 4Q FY16 Performance
Portfolio
4Q FY16 against 4Q FY17 (q-o-q) 4Q FY16 4Q FY17 Variance 4Q FY16 4Q FY17 Variance
S$’000 S$’000 % INR’000 INR’000 %
Total Revenue^ 21,543 22,567 4.8 1,045,694 1,068,248 2.2
Net Service Fee and Hospital Income 12,682 13,059 3.0 615,588 618,598 0.5
16
FHTL*
4Q FY16 against 4Q FY17 (q-o-q) 4Q FY16 4Q FY17 Variance 4Q FY16 4Q FY17 Variance
S$’000 S$’000 % INR’000 INR’000 %
Total Revenue^ 12,274 13,053 6.3 595,621 618,138 3.8
Net Service Fee and Hospital Income 10,591 10,621 0.3 513,309 502,852 (2.0)
4Q FY16 4Q FY17 Variance (%)
Adjusted net service fee margin# 69% 63% (6)
Distributable Income (S$’000) 15,261 9,524& (37.6)
Distributable Income had FHTL
disposal taken place in comparative
period
11,016 9,524& (13.5)
Exchange rate for translation for actual 4QFY16 was S$1 = INR 48.50. Exchange rate for actual 4QFY17 was S$1 = INR 47.33.#Adjusted net service fee margin takes into account the performance of FHTL which was accounted as an associate.*100% of FHTL performance has been used for comparison.^Excludes straight-lining.&Excludes special distribution of S$198.3 million.

Review of 4Q FY17 against 3Q FY17 Performance
Exchange rate for translation for actual 3QFY17 was S$ 1 = INR 47.57 . Exchange rate for actual 4QFY17 was S$1 = INR 47.33.#Adjusted net service fee margin takes into account the performance of FHTL which was accounted as an associate.*100% of FHTL performance has been used for comparison.^Excludes straight-lining.&Excludes special distribution of S$198.3 million.
Portfolio
3Q FY17 against 4Q FY17 (q-o-q) 3Q FY17 4Q FY17 Variance 3Q FY17 4Q FY17 Variance
S$’000 S$’000 % INR’000 INR’000 %
Total Revenue^ 22,544 22,567 0.1 1,072,630 1,068,248 (0.4)
Net Service Fee and Hospital Income 12,781 13,059 2.2 608,280 618,598 1.7
17
FHTL*
3Q FY17 against 4Q FY17 (q-o-q) 3Q FY17 4Q FY17 Variance 3Q FY17 4Q FY17 Variance
S$’000 S$’000 % INR’000 INR’000 %
Total Revenue^ 12,981 13,053 0.6 617,921 618,138 0.0
Net Service Fee and Hospital Income 10,795 10,621 (1.6) 513,920 502,852 (2.2)
3Q FY17 4Q FY17 Variance (%)
Adjusted net service fee margin#63% 63% -
Distributable Income (S$’000) 10,645 9,524& (10.5)

Review of YTD FY17 Performance
Portfolio
YTD FY16 against YTD FY17 (y-o-y) YTD FY16 YTD FY17 Variance YTD FY16 YTD FY17 Variance
S$’000 S$’000 % INR’000 INR’000 %
Total Revenue^ 88,689 89,919 1.4 4,200,075 4,351,591 3.6
Net Service Fee and Hospital Income 52,347 50,924 (2.7) 2,478,989 2,464,500 (0.6)
18
FHTL*
YTD FY16 against YTD FY17 (y-o-y) YTD FY16 YTD FY17 Variance YTD FY16 YTD FY17 Variance
S$’000 S$’000 % INR’000 INR’000 %
Total Revenue^ 49,759 51,298 3.1 2,356,575 2,482,517 5.3
Net Service Fee and Hospital Income 41,266 42,324 2.6 1,954,334 2,048,241 4.8
YTD FY16 YTD FY17 Variance
Adjusted net service fee margin# 68% 64% (4.0)
Distributable Income (S$’000) 61,583 50,502& (18.0)
Distributable Income had FHTL
disposal taken place in comparative
period
53,652 50,502& (5.9)
Exchange rate for translation for actual FY16 was S$1 = INR 47.36. Actual exchange rate for FY17 was S$1 = INR 48.39.#Adjusted net service fee margin takes into account the performance of FHTL which was accounted as an associate.*100% of FHTL performance has been used for comparison.^Excludes straight-lining.&Excludes special distribution of S$198.3 million.

Financial Results for 4Q FY17
19
4Q FY17 4Q FY16(Restated)* Var
S$'000 S$'000 (%)
Revenue:
Service fee 19,986 19,266 4
Hospital income 2,161 2,067 5
Other income 947 798 19
Total revenue 23,094 22,131 4
Service fee and hospital expenses:
Total service fee and hospital expenses (12,477) (12,060) 3
Finance Income 4,091 74 n.m.
Finance Expenses^ (5,064) (2,629) n.m.
Trustee-Manager Fees (1,174) (1,876) n.m.
Other Trust Expenses (627) (1,370) n.m.
Foreign exchange gain / (loss) 1,111 (2,408) n.m.
Total expenses (14,140) (20,269) (30)
Gain on disposal of 51% interest in a subsidiary 602 - n.m.
Share of results of an associate 2,726 - n.m.
Profit before changes in fair value of financial derivatives 12,282 1,862 n.m.
Fair value (loss)/gain on financial derivatives (1,318) 2,450 n.m.
Profit before taxes 10,964 4,312 n.m.
Income tax expense (1,157) (2,281) n.m.
Profit for the period from continuing operations 9,807 2,031 n.m.
Discontinued Operations
Profit after tax for the period from discontinued operations 135 6,928 n.m.
Profit for the period attributable to unitholders of the Trust 9,942 8,959 n.m.
For the quarter ended 31 March 2017
Exchange rate for translation for actual 4QFY16 was S$1 = INR 48.50. Exchange rate for actual 4QFY17 was S$1 = INR 47.33.* Prior period figures have been restated to reflect the reclassification of FHTL in connection with the Disposal and Related Arrangements.^ The finance expenses includes NCD interest expenses (refer to Note 11 in announcement).n.m. –not meaningful.

Financial Results for 4Q FY17
20
Exchange rate for translation for actual 4QFY16 was S$1 = INR 48.50. Exchange rate for actual 4QFY17 was S$1 = INR 47.33.* Prior period figures have been restated to reflect the reclassification of FHTL in connection with the Disposal and Related Arrangements.
Reconciliation to Unitholders Distribution
4QFY17 4QFY16(Restated)*
S$'000 S$'000
Profit for the period attributable to unitholders of the Trust 9,942 8,959
Distribution adjustments:
Impact of non-cash straight-lining (527) (588)
Technology renewal fee (165) (161)
Depreciation and amortisation 2,969 3,199
Trustee-Manager fees payable in units 566 857
Deferred tax expense (1,515) (812)
Foreign exchange differences (944) (470)
Transaction cost capital in nature - 967
CCD interest income (3,827) -
NCD interest expense 1,613 -
Non-cash adjustments of discontinued operations 10 3,298
Non-cash adjustments of an associate 1,481 -
Gain on disposal of 51% interest in a subsidiary (602) -
Others 523 12
Total distributable income attributable to unitholders of the Trust 9,524 15,261
For the quarter ended 31 March 2017

Financial Results and Cash Flow of FHTL for 4Q FY17
Q4 FY17 - Associate Q4 FY16
S$'000 S$'000
Revenue:
Total revenue 13,757 12,771
Total expenses (6,310) (2,881)
Profit before tax 7,447 9,890
Income tax expense (1,884) (2,962)
Profit for the year 5,563 6,928
Share of 49% of profit for the period 2,726
Non-cash adjustments
Impact of non-cash straight-lining (903) (497)
Technology renewal fee (10) (10)
Depreciation and amortization 1,290 1,153
Deferred tax expense 260 2,962
Capital expenditure (228) (310)
Interest income and expense with related parties 2,613 -
FHTL’s non-cash adjustments 3,022 3,298
Share of 49% of non-cash adjustment 1,481
Net cash flow from FHTL (excluding common expenses) 8,585 10,226
Share of 49% of net cash flow from FHTL 4,207
For the quarter ended 31 March 2017
Exchange rate for translation for actual 4QFY16 was S$1 = INR 48.50. Exchange rate for actual 4QFY17 was S$1 = INR 47.33.Figures represents 100% of FHTL for the periods.
21
22
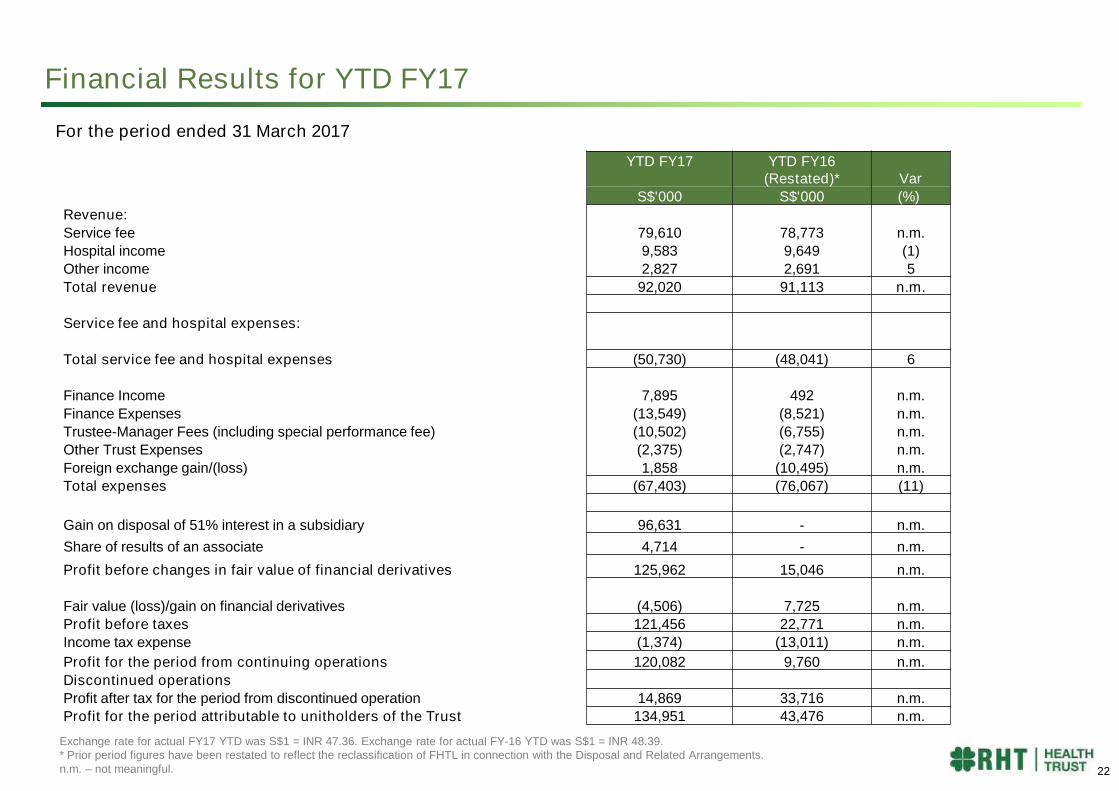
YTD FY17 YTD FY16(Restated)* Var
S$'000 S$'000 (%)
Revenue:
Service fee 79,610 78,773 n.m.
Hospital income 9,583 9,649 (1)
Other income 2,827 2,691 5
Total revenue 92,020 91,113 n.m.
Service fee and hospital expenses:
Total service fee and hospital expenses (50,730) (48,041) 6
Finance Income 7,895 492 n.m.
Finance Expenses (13,549) (8,521) n.m.
Trustee-Manager Fees (including special performance fee) (10,502) (6,755) n.m.
Other Trust Expenses (2,375) (2,747) n.m.
Foreign exchange gain/(loss) 1,858 (10,495) n.m.
Total expenses (67,403) (76,067) (11)
Gain on disposal of 51% interest in a subsidiary 96,631 - n.m.
Share of results of an associate 4,714 - n.m.
Profit before changes in fair value of financial derivatives 125,962 15,046 n.m.
Fair value (loss)/gain on financial derivatives (4,506) 7,725 n.m.
Profit before taxes 121,456 22,771 n.m.
Income tax expense (1,374) (13,011) n.m.
Profit for the period from continuing operations 120,082 9,760 n.m.
Discontinued operations
Profit after tax for the period from discontinued operation 14,869 33,716 n.m.
Profit for the period attributable to unitholders of the Trust 134,951 43,476 n.m.
Financial Results for YTD FY17
Exchange rate for actual FY17 YTD was S$1 = INR 47.36. Exchange rate for actual FY-16 YTD was S$1 = INR 48.39.* Prior period figures have been restated to reflect the reclassification of FHTL in connection with the Disposal and Related Arrangements.n.m. –not meaningful.
For the period ended 31 March 2017
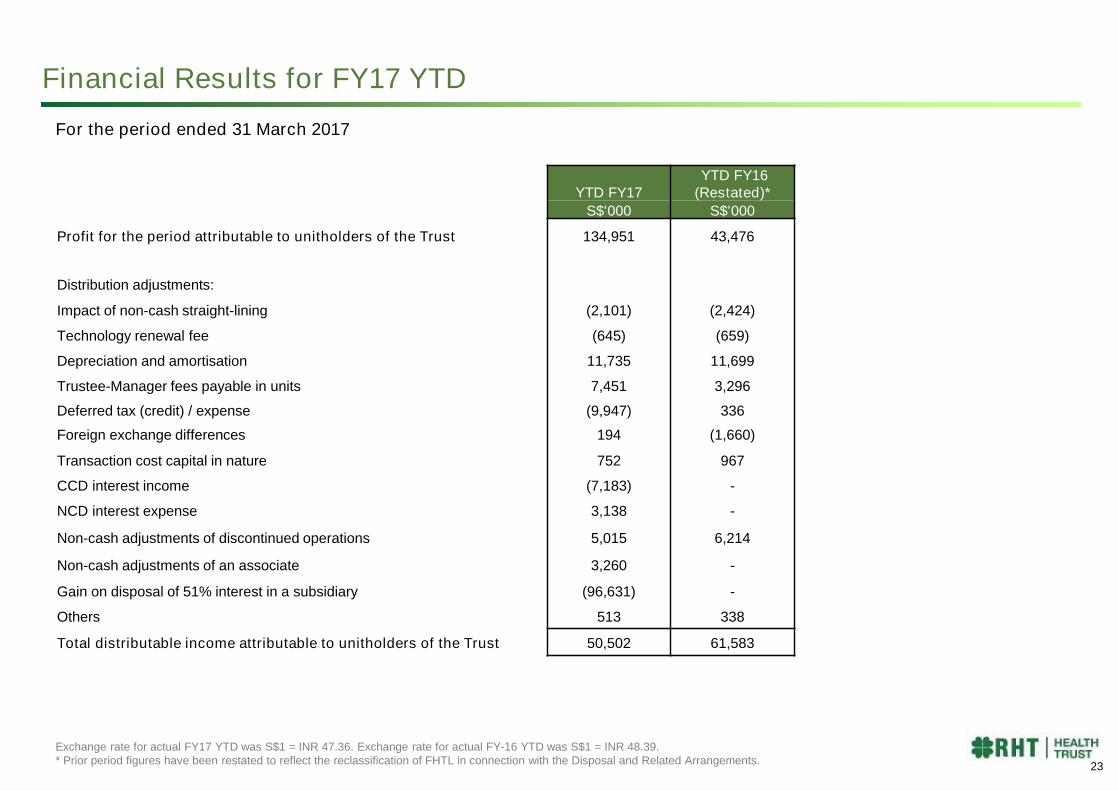
YTD FY17YTD FY16
(Restated)*
S$'000 S$'000
Profit for the period attributable to unitholders of the Trust 134,951 43,476
Distribution adjustments:
Impact of non-cash straight-lining (2,101) (2,424)
Technology renewal fee (645) (659)
Depreciation and amortisation 11,735 11,699
Trustee-Manager fees payable in units 7,451 3,296
Deferred tax (credit) / expense (9,947) 336
Foreign exchange differences 194 (1,660)
Transaction cost capital in nature 752 967
CCD interest income (7,183) -
NCD interest expense 3,138 -
Non-cash adjustments of discontinued operations 5,015 6,214
Non-cash adjustments of an associate 3,260 -
Gain on disposal of 51% interest in a subsidiary (96,631) -
Others 513 338
Total distributable income attributable to unitholders of the Trust 50,502 61,583
For the period ended 31 March 2017
Financial Results for FY17 YTD
Exchange rate for actual FY17 YTD was S$1 = INR 47.36. Exchange rate for actual FY-16 YTD was S$1 = INR 48.39.* Prior period figures have been restated to reflect the reclassification of FHTL in connection with the Disposal and Related Arrangements.
23

Financial Results and Cash Flow of FHTL for YTD FY17
YTD FY17 - Associate(13 October 2016 to
31 March 2017)
YTD FY17(up till 12 October
2016) YTD FY16
S$'000 S$'000 S$'000
Revenue:
Total revenue 25,808 28,144 51,807
Total expenses (12,132) (5,925) (13,286)
Profit before tax 13,676 22,219 38,521
Income tax expense (4,056) (7,350) (4,805)
Profit for the year 9,620 14,869 33,716
Share of 49% of profit for the period 4,714
Non-cash adjustments
Impact of non-cash straight-lining (1,903) (751) (2,048)
Technology renewal fee (18) (21) (40)
Depreciation and amortization 2,376 1,541 4,645
Deferred tax expense 1,129 4,929 4,805
Capital expenditure (508) (683) (1,148)
Interest income and expense with related parties 5,578 - -
FHTL non-cash adjustments 6,654 5,015 6,214
Share of 49% of non-cash adjustment 3,260
Net cash flow from FHTL (excluding common expenses) 16,274 19,884 39,930
Share of 49% of net cash flow from FHTL 7,974
For the period ended 31 March 2017
Exchange rate for actual FY17 YTD was S$1 = INR 47.36. Exchange rate for actual FY-16 YTD was S$1 = INR 48.39.* Prior period figures have been restated to reflect the reclassification of FHTL in connection with the Disposal and Related Arrangements.
24

Balance Sheet
(S$ ‘000) 31 March 17 31 March 16(Group) excluding FHTL
31 March 16(FHTL)
Intangibles
PPE
Other long term assets
Net assets of FHTL
Long term liabilities
Net current (liabilities)/assets
Total net assets attributable to unitholders
94,640
562,074
56,555
352,717 *
(264,643)
(104,969)
696,374
91,054
519,291
33,526
-
(247,775)
2,580
398,676
36,932
325,560
33,315
-
(65,766)
16,051
346,092
25
Exchange rate for translation for 31 March 2016 was S$ 1 = INR 49.17, 31 March 2017 was S$ 1 = INR 46.43* Represents 49.0% of the gross fair value of FHTL. This should be considered together with the NCD liabilities amounting to S$ 102.7 million.

Hedging - Foreign currency exposure
• At present, RHT hedges 100% of its Indian denominated cashflows receivable every 6 months from India.
• Commencing FY2018, RHT will hedge 50% of such cashflows.
Contracted rate Settlement
INR 53.19 to SGD 1 Dec-14
INR 51.38 to SGD 1 Jun-15
INR 50.23 to SGD 1 Dec-15
INR 49.58 to SGD 1 Jun-16
INR 49.35 to SGD 1 Dec-16
INR 52.03 to SGD 1 Jun-17
INR 50.23 to SGD 1 Dec-17
26
53.19
51.38
50.23
49.58 49.35
52.03
50.23
8.27.6
5.6 5.7 5.1 5.0
5.0
0.0
5.0
10.0
15.0
20.0
47
48
49
50
51
52
53
54
Dec 14 Jun 15 Dec 15 Jun 16 Dec 16 Jun 17 Dec 17
Contracted Premium (%)
Forward Premium over Spot
• RHT has hedged the following foreign exchange exposures:
Current Spot rate : INR 46.5 to SGD 1*
* Source: Bloomberg.com

Key Credit Ratios and Debt Maturity
Low Gearing with Conservative Capital Structure Interest Coverage Ratios(1)
Weighted Average Debt Maturity with Debt Headroom
Conservative financial profile with generous debt headroom; half of our INR cash flows from India hedged into SGD on a one year forward basis via forwardcontracts on a semi-annual basis
(S$m)
Ratio (x)
Total Debt / Total Assets Interest Coverage Ratio (“ICR”) (x)
Debt Maturity Profile(2)(S$m) Debt Headroom (S$m) Gearing (%)
Headroom ofS$394.2 m
Note:(1) Interest Coverage Ratio is defined as the ratio between EBITDA divided by Financial Expense including those capitalized during the year.(2) As at 31 March 2017, gross of upfront fees.(3) Defined as Net Debt, being total loans and borrowings less cash and cash equivalents.(4) Gearing is calculated as Net Debt divided by sum of Net Assets and Net Debt, excluding NCDs liabilities owing to an associate.(5) Gearing ratio takes into consideration ongoing and future asset enhancement initiatives (BG Road and Ludhiana Clinical Establishments and expansion of projects
including expansion of Mohali, Jaipur, Mulund, Nagabhavi, Amitsar, Noida and Shalimar Bagh Clinical Establishments).(6) Post FHTL disposal and completion of asset enhancement projects, and without inclusion of NCDs.
Debt / assets (%)
As at 31 March 2017
859.3
998.2
30.1x27.4x
13.5x9.6x
7.1x0
5
10
15
20
25
30
35
FY-13 FY-14 FY-15 FY-16 FY-17
8.2x
With 100%interest inFHTL, theICR wouldhave been8.2 times.
65 65 126 170 189963 958
1,124
1,153 1,0876.8 6.7
11.2
14.8
17.4
02468101214161820
-
200
400
600
800
1,000
1,200
1,400
FY-13 FY-14 FY-15 FY-16 FY-17
Debt Assets Debt/Assets
Interest Rate Debt (%)
Floating 66.1 %
Fixed 33.9 %
27
0
20
40
60
80
100
120
< 1 year 1 year< x < 2 years > 2 years
Gearing ratio would be33.2% on a post FHTLtransaction, with NCDs
included. (6)
-
S$ 181.5m (3)
20.5% (4)
26.2% (5)
45%
Headroom ofS$325.8 m
As at 2 June 2017, with the issuance of S$60 million notes due 2018, 70% of our total debt isnow on fixed interest rate basis and the rest on floating rates basis.

RHT Distribution Policy
Our distribution policy provides for distribution of at least 90% of the Distributable Income.
For FY2017, RHT TM is distributing 95% of its Distributable Income.
The 5% retained will be used to fund future capital expenditure and further growth.
2828

Appendix

30
Unit Price Performance Against Peers
For the quarter 1 January 2017 to 31 March 2017
Source: Miraqle
85%
90%
95%
100%
105%
110%
115%
30 Dec16 11 Jan17 20 Jan17 01 Feb 17 10 Feb 17 21 Feb 17 03 M ar17 14 M ar17 23 M ar17
R HT FirstR EIT P lifeR EIT AIT FT S ES R EIT Index
Price Volume
Name Cur Open High Low Close Change % Total Volume Daily Average Volume
RHT Health Trust SGD 0.915 0.94 0.71 0.89 (2.73) 97,047,000 1,565,274
Parkway Life REIT SGD 2.36 2.55 2.36 2.52 6.78 52,366,453 844,620
Ascendas India Trust SGD 1.015 1.165 1.005 1.125 10.84 34,500,100 556,453
First Real Estate Investment Trust SGD 1.265 1.33 1.265 1.31 3.56 25,284,400 407,813
FTSE ST All-Share Index - Real Estate InvestmentTrusts REIT
SGD 709.49 755.81 714.89 755.81 6.53

Key Highlights of RHT’s Clinical Establishments
Jaipur Clinical Establishment
Completed its 50th successful kidney transplant.
Achieved zero 30 days Mortality, zero Graft Nephrectomy, zero Re-Exploration and zero Surgical Wound Infection.
Achieved a 100% take home kidney rate.
Malar Clinical Establishment
Completed more than 125 successful heart transplants.
Successfully completed 342 kidney transplants till date.
Mulund Clinical Establishment
Conducted its 35th successful heart transplant.
Conducted first ever heart and lung transplant on a patient suffering from Congenital Ventricular Septal Defect.
BG Road Clinical Establishment
Performed 101 Neurosurgeries in October 2016.
Noida Clinical Establishment
Achieved 500th Liver Transplant milestone.
Source: Fortis FY16 Investor Slides
31

Jaipur Clinical Establishment- Six Sigma Healthcare Excellence Awards –2013 ‘Best Hospital in Patient Care, Best Hospital in Patient Safety
and Best Hospital in Quality Initiatives.- Recognised as the ‘India’s Top Hospital in Patient Safety’at the 4th National MT India Healthcare Award.- Ranked 2nd as best multispecialty hospital in respective city, The Week Magazine Awards.- Won top honours at the Quality Council of India-D.L. Shah Awards for the third time.- Won the Rajasthan State Productivity Council’s Productivity Excellence Award for reducing “Hospital Acquired
Pressure Ulcers (bed sores)” to zero.- Won the Quality Council of India (“QCI” ) D.L. Shah Award for the fourth time in a row under Lean Six Sigma
project titled “Dock to Stock Cycle Reduction Time in Critical Care Kaizen” .
Anandpur Clinical Establishment- 2nd Best Hospital in Multi-specialty category in Kolkata in a survey conducted by AC Nielson for The Week
Magazine.- Received the prestigious National Energy Conservation Award from the President of India.- Received CII Energy Management Award.
Awards & Accolades
32
RHT featured as one of “Asia’s Top 50 Healthcare Providers” by Frost and Sullivan
BG Road Clinical Establishment- Awarded as the “Best Medical Tourism Hospital” at the Karnataka Tourism Awards 2016.

33
Awards & Accolades
Mulund Clinical Establishment- Received JCI Accreditation for the 4th consecutive time.- Stars of the Industry Healthcare Leadership Award (Patient Safety).- FICCI Healthcare Award (Operational Excellence).- FICCI ‘Special Jury Recognition Award’.- Won 3 awards at the prestigious Asian Hospital Management Awards, 2014 in categories of ‘Human Resources’
and ‘Patient Safety’.- Named ‘Medical Team of the Year’at the first British Medical Journal Awards (BMJA) India 2014 for its
outstanding Antibiotic Review Program and Antibiotic Restriction Policy.- Awarded the “Best Hospital Unit in Cardiac Care” and the “Best Medical Tourism Facility” at the CIMS Healthcare
Excellence Awards 2016.- Won the “Patient Safety Award” for its insulin Super League Program and the “Outstanding Achievement in
Healthcare Award” for its efforts in organ donation.
Gurgaon Clinical Establishment- Recognized as a Green Building and received a 4 Star rating by TERI GRIHA (Green Rating for Integrating Habitat
Assessment).- 2nd globally on ‘30 Most Technologically Advanced Hospitals in the World’by ‘topmastersinhealthcare.com’.- “Green Hospital” for 2014 from the Association of Healthcare Providers India (AHPI).- Won two awards under “Process Innovation” and “Safety” categories of Frost and Sullivan ‘s Project Evaluation &
Recognition Programme 2015.
Shalimar Bagh Clinical Establishment- Received a 3 Star rating by TERI GRIHA.- 1st Runner-up in FICCI HEAL Award 2014 (Poster Presentation).- 3 Star rating by the Bureau of Energy Efficiency, Government of India, Ministry of Power.- FICCI HEAL Award 2014 (Excellence in Branding Marketing & Image Building).- 1st prize in ‘Best Poster Presentation’at National Conference of Consortium of Accredited Healthcare
Organisations (CAHOCON 2015).

34
Awards & Accolades
Nagarbhavi Clinical Establishment
- National Energy Conservation Award.
Noida Clinical Establishment
- Won ‘Comprehensive Neurosciences Service Provider of the Year’award at Frost and Sullivan’s 7th AnnualIndia Healthcare Excellence Awards 2015.
- National Energy Conservation Award.
Mohali Clinical Establishment- JCI Accreditation.- FICCI Healthcare Excellence Award (Healthcare Delivery).- Won ‘Best Multispecialty Hospital (Non Metro)’Award during the first edition of “Doc N Doc Gammex Saviour
Awards” .- CII Healthcare Award for Commitment to Excellence, Energy Management Award.- Best Case Award at TCTAP 2015.- Ranked no. 2 as best multispecialty hospital in respective city, The Week Magazine Awards.- Won two awards at the 6th MT India Healthcare Awards 2016.- National Energy Conservation Award.- Won the prestigious Asia Pacific Hand Hygiene Excellence Award 2015 for demonstrating outstanding
leadership in implementation of an effective hand hygiene campaign.

0.5% - 1.0% of acquisition price
0.5% of the sale price (Divestmentto 3rd party)
No divestment fee (Divestment toSponsor)
Base fee Performance fee Acquisition / divestment fee
0.4% p.a. of the value of theTrust Property
50% to be paid in Units
4.5% p.a. of Distributable Income 50% to be paid in Units
2.0% of total development project costs Payable in the form of cash and/ or units
Development fee Asset management fee
1.0% of gross revenue Paid quarterly in arrears No asset management fee paid for assets
operated by Sponsor
Trustee-Manager Fee Structure
Performance based management fees designed to align Management’s interests with Unitholders
35

Financial Highlights
Gross Revenue(1)(2)(3)(5)(6) Adjusted Net Service Fee and Margin(1)(2)(3)(4)(6) (Operations)
Strong growth in revenue, income, and EBITDA witnessed in recent years
(INRm)
Note:(1) Exchage rate for translation at S$1 = INR for FY-13, FY-14, FY-15 and FY-16 are 44.04, 48.27, 47.41 and 47.36 respectively. Actual exchange rate for FY-17 was S$1 = INR 48.39.(2) Excludes non-recurring items.(3) Annualized as IPO was in October of FY-13.(4) Excludes straight-lining.(5) Includes straight-lining.(6) Includes FHTL’s performance up till 12 October 2016 and 49% share of FHTL’s result from 13 October 2016 to 31 March 2017.
2,3812,453
1,9744,515 4,714
3,563 3,731
3,853
259334
384457
464
90113
121
128137
FY-13(annualised)
FY-14 (actual) FY-15 (actual) FY-16 (actual) FY-17 (actual)
Total revenue of FHTL Service Fee Hospital Income Other Income
5,161 6,449 6,769 6,428
S$m 110.5 106.9 85.9
4,864
2,504 3,052
2,231
91.1
(INRm)
36
92.0
- - 50.1 51.8 40.8FHTLS$m
With 100%interest inFHTL, thenet servicefee marginis 66.0%
1,888 1,9261,561
2,7953,010
2,449 2,507 2,465
68.067.0
70.0 67.664.5
45.0
50.0
55.0
60.0
65.0
70.0
75.0
-500
500
1500
2500
3500
4500
FY-13(annualised)
FY-14 (actual) FY-15 (actual) FY-16 (actual) FY-17 (actual)
FHTL Net Service Fee (INR m) Margin (%)
4,337 4,0264,4333,0102,795
FHTLS$m
- - 39.8 41.2 32.3
S$m 63.5 62.4 51.7 52.3 50.9

Financial Highlights
Adjusted EBITDA and EBITDA Margin(1)(2)(3)(4)(6)(7) (Operations & Trust levelexpenses)
Total Assets(5)
Strong growth in revenue, income, and EBITDA witnessed in recent years
EBITDA(INRm)(4)
(INRm)
Note:(1) Exchage rate for translation at S$1 = INR for FY-13, FY-14, FY-15 and FY-16 are 44.04, 48.27, 47.41 and 47.36 respectively. Actual exchange rate for FY-17 was S$1 = INR 48.39.(2) Excludes non-recurring items.(3) Annualized as IPO was in October of FY-13.(4) EBITDA is defined as Total Revenue minus Total Expenses, adding back Depreciation and Amortization and Finance Expense.(5) S$1 = INR for FY-13, FY-14, FY-15, FY-16 and Q3 FY-17 are 43.75, 47.73, 45.43, 49.17 and 46.96 respectively.(6) Excludes straight-lining.(7) Includes FHTL’s performance up till 12 October 2016 and 49% share of FHTL’s result from 13 October 2016 to 31 March 2017.
Note:(A) Decline in total assets for FY-14 (in SGD terms) due to depreciation of INR against SGD.(B) Decline in total assets for FY-17 due to disposal of 51% interest in a subsidiary.(C) Exchange rate used for FHTL’s total asset was S$1 = INR 48.26.
41.756.2
2,504 3,052
2,231
1,888 1,9261,561
2,477 2,712
1,974 2,095
2,465
59.9 60.1 62.4 61.3
54.5
0.0
10.0
20.0
30.0
40.0
50.0
60.0
70.0
0
500
1000
1500
2000
2500
3000
3500
4000
4500
5000
FY-13(annualised)
FY-14 (actual) FY-15 (actual) FY-16 (actual) 9mths to31Dec16
FHTL (INR m) EBITDA (INR m) EBITDA Margin (%)
4,0213,2622,477 2,712
S$m 56.2
18,469 19,899 17,023
42,12745,743
32,58836,779
34,100
0
10000
20000
30000
40000
50000
60000
FY-13 FY-14 FY-15 FY-16 FY-17
FHTL Total Asset
717.3S$m
44.2
747.9958.4962.9
37
38.0
734.4
- - 39.8 40.7 32.3FHTLS$m
- - 406.5 404.7 352.7FHTLS$m
56.9
With 100%interest inFHTL, theEBITDAmarginwould havebeen 56.9%
4,02656,67851,057 51,12342,127 45,743

For further information please contact:
Tan Suan HuiHead of Compliance and Investor Relations
RHT Health Trust Manager Pte. Ltd302 Orchard Road #18-02/03Tong BuildingSingapore 238862
Email: [email protected]
38