Embed Size (px)
Citation preview

Stress Strain Diagram:
For Ductile Materials:
Ductile Materials: Ductile materials are those which are capable of
having large strains before they are fractured. Ductile materials can
withstand high stress and are also capable of absorbing large amount of
energy before their failure. A ductile material has a large Percentage of
elongation before failure.
Some examples of ductile materials are aluminum, mild steel and some
of its alloys i.e. copper, magnesium, brass, nickel, bronze and many
others.
Stress Strain Diagram For Ductile Material:
We have taken annealed mild steel as a ductile material.
Different Points On Stress Strain Curve:

• Proportional Limit (σPL) Proportional limit is the point on
stress strain curve which shows the highest stress at which Stress and
Strain are linearly proportional to each other where the proportionality
constant is E known as modulus of elasticity. Above this point, stress is
no longer linearly proportional to strain. On stress strain curve,
proportional limit is shown by P. It is denoted by σPL. For annealed mild
steel the limit of proportionality occurs at 230 MPa.
The above graph shows that the length of graph up to proportional
limit (P) is a straight line which means that up to proportional limit
stress is linearly proportional to strain.
• Elastic Limit (σEL) Elastic limit is the point which shows the
maximum stress that can be applied to the body without resulting in
permanent deformation when stress is removed. At elastic limit when
the load is removed from the body, it returns to original size and shape.
At elastic limit stress is no longer linearly proportional to strain. It is
denoted by σEL. For stress strain graph of mild steel, elastic limit is just
close to proportional limit.
• Yield point (σY)
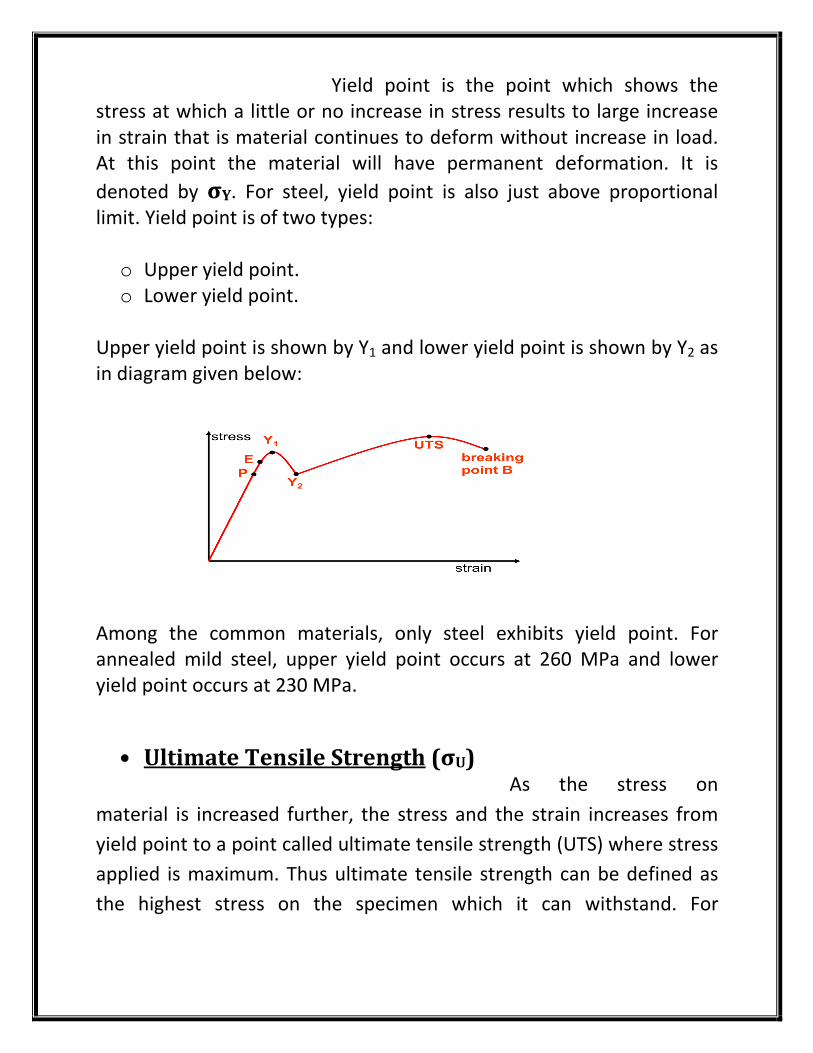
Yield point is the point which shows the
stress at which a little or no increase in stress results to large increase
in strain that is material continues to deform without increase in load.
At this point the material will have permanent deformation. It is
denoted by σY. For steel, yield point is also just above proportional
limit. Yield point is of two types:
o Upper yield point.
o Lower yield point.
Upper yield point is shown by Y1 and lower yield point is shown by Y2 as
in diagram given below:
Among the common materials, only steel exhibits yield point. For
annealed mild steel, upper yield point occurs at 260 MPa and lower
yield point occurs at 230 MPa.
• Ultimate Tensile Strength (σU) As the stress on
material is increased further, the stress and the strain increases from
yield point to a point called ultimate tensile strength (UTS) where stress
applied is maximum. Thus ultimate tensile strength can be defined as
the highest stress on the specimen which it can withstand. For

annealed mild steel, ultimate tensile strength occurs at 400 MPa. It is
denoted by σU.
• Fracture Stress (σF) After ultimate tensile strength, the
applied stress decreases until the stress is obtained where material
fractures called fracture stress. Fracture stress is also called breaking
strength. It is denoted by σF.
Different Regions under Area of Stress Strain Curve:
This is the general diagram of stress strain curve, which elaborates
different regions under stress strain curve.
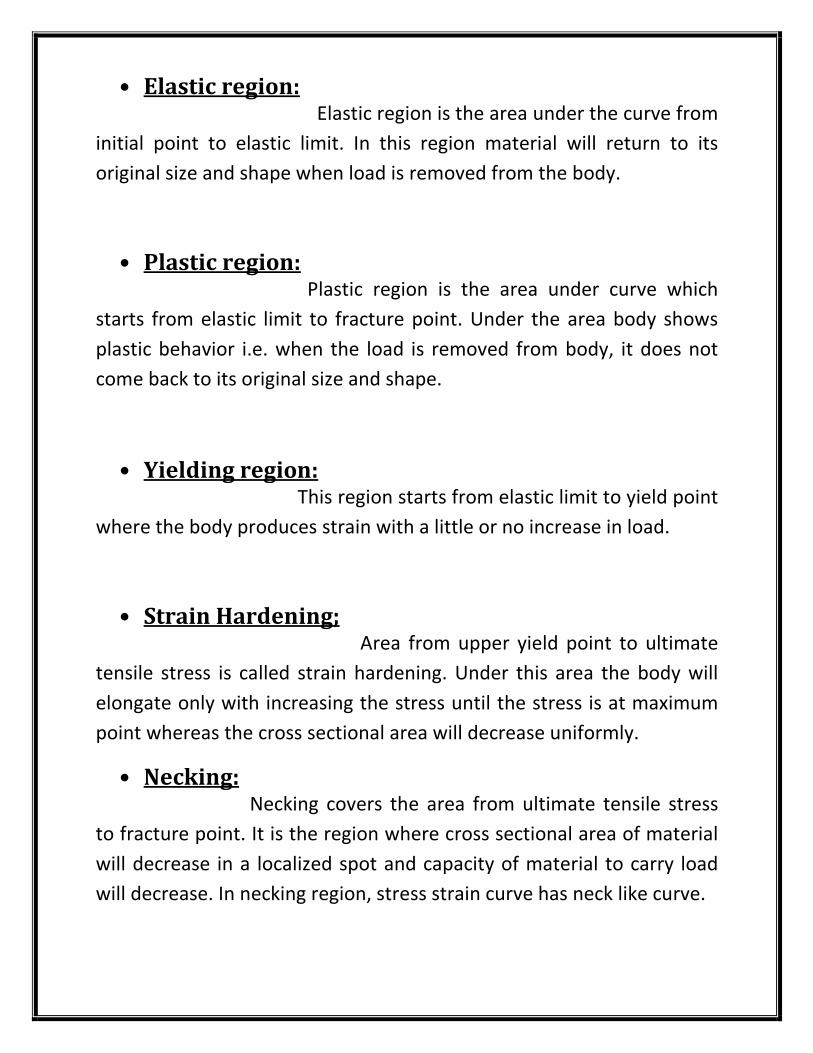
• Elastic region: Elastic region is the area under the curve from
initial point to elastic limit. In this region material will return to its
original size and shape when load is removed from the body.
• Plastic region: Plastic region is the area under curve which
starts from elastic limit to fracture point. Under the area body shows
plastic behavior i.e. when the load is removed from body, it does not
come back to its original size and shape.
• Yielding region: This region starts from elastic limit to yield point
where the body produces strain with a little or no increase in load.
• Strain Hardening; Area from upper yield point to ultimate
tensile stress is called strain hardening. Under this area the body will
elongate only with increasing the stress until the stress is at maximum
point whereas the cross sectional area will decrease uniformly.
• Necking: Necking covers the area from ultimate tensile stress
to fracture point. It is the region where cross sectional area of material
will decrease in a localized spot and capacity of material to carry load
will decrease. In necking region, stress strain curve has neck like curve.

For Brittle Materials:
Brittle Materials:
Brittle materials are those which break suddenly
under stress at a point just beyond elastic limit. They have little or no
yielding before failure and their percentage of elongation is very low. If
percentage elongation is equal to or less than 5%, we consider that
material brittle.
Brittle materials include glass, concrete, cast iron and plaster.
Stress Strain Diagram for Brittle Materials:
Above graph shows that gray cast iron exhibit less plastic region i.e it
fractures just after elastic limit so it is a brittle material.

Different Points On Stress Strain Curve:
• Proportional Limit (σPL) Like ductile material, proportional
limit of brittle material (gray cast iron) is the point on stress strain curve
which shows the highest stress at which Stress and Strain are linearly
proportional to each other where the proportionality constant is E
known as modulus of elasticity. Above this point, stress is no longer
linearly proportional to strain. It is difficult to determine the point at
which the limit of proportionality occurs, but it is approximately 200
MPa. It is denoted by σPL.
• Elastic Limit (σEL) Like ductile materials, elastic limit of brittle
material is the point which shows the maximum stress that can be
applied to the body without resulting in permanent deformation when
stress is removed.
As shown in graph when the load is removed from gray cast iron (at
elastic limit), it returns to original size and shape. At elastic limit stress
is no longer linearly proportional to strain. It is denoted by σEL.
• Ultimate Yield Stress (σY) Ultimate tensile stress is the
ratio of ultimate load to original area of cross-section. At this point
gray cast iron will have little permanent deformation and just after this
point, gray cast iron fracture. We can say that yield point is the ultimate
stress or breaking stress for gray cast iron. It is denoted by σY. For gray
cast iron, it occurs at 250 MPa. For brittle materials yield point is not
well defined.

Mechanical Properties of Materials:
Mechanical Properties:
The properties which determine the
applications and behavior of materials are called mechanical properties
of the materials. Mechanical properties are helpful in identification of
materials because every material has its own identical properties and
also tell the usefulness of materials. Mechanical properties are
determined through a series of standardized mechanical tests such that
Hardness and Tensile testing, Torque testing, Shear testing, Fatigue
testing, micro hardness testing, Bend testing and many more.
• Ductility:
Ductility is the measure of deformation in a material
which it can withstand before fracturing. The most common measure of
ductility is the percentage of change in Ductility is generally measured
by percentage elongation.
Percentage elongation = �����
��× ���
High values of percentage elongation indicate that material is very
ductile whereas low values indicate that material is brittle and has low
ductility. For mild steel, the percentage elongation usually is 20%. Gold
is most ductile material.
• Brittleness:
Brittleness is the opposite of ductility. It is the
property of material to fracture just after elastic limit when stress is
applied on it. It is also measured by percentage elongation. Clay, glass
and ceramics are some brittle materials.
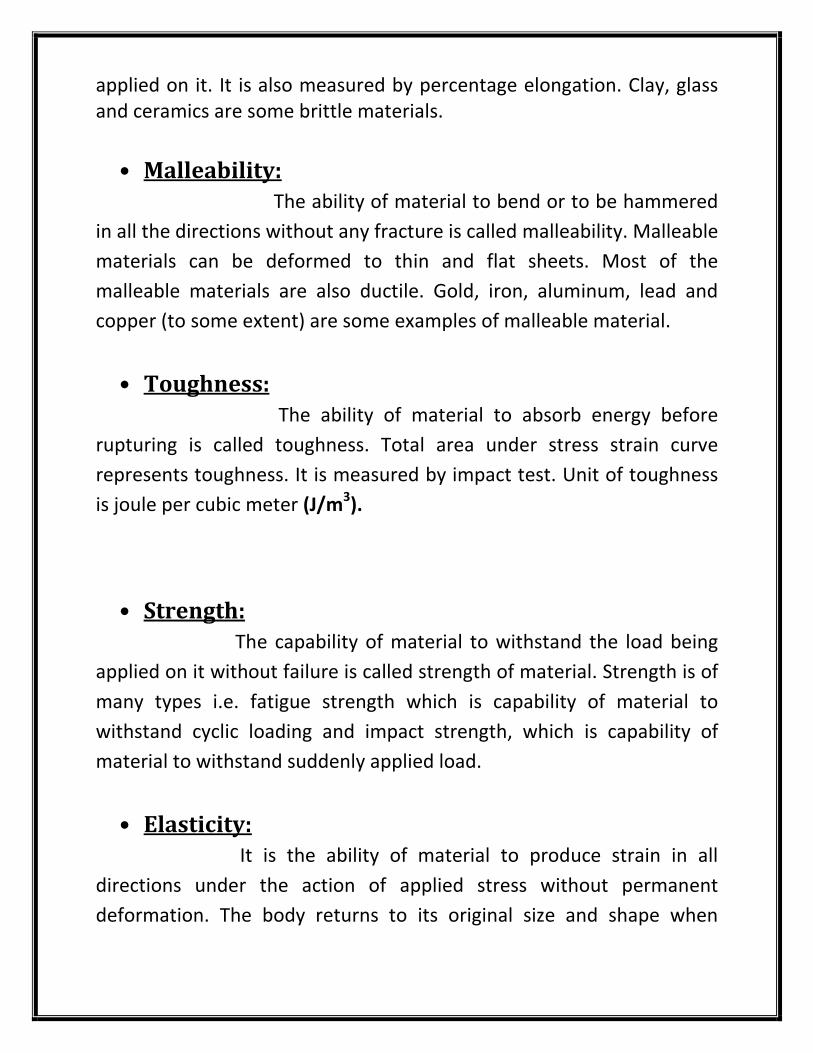
• Malleability:
The ability of material to bend or to be hammered
in all the directions without any fracture is called malleability. Malleable
materials can be deformed to thin and flat sheets. Most of the
malleable materials are also ductile. Gold, iron, aluminum, lead and
copper (to some extent) are some examples of malleable material.
• Toughness:
The ability of material to absorb energy before
rupturing is called toughness. Total area under stress strain curve
represents toughness. It is measured by impact test. Unit of toughness
is joule per cubic meter (J/m3).
• Strength:
The capability of material to withstand the load being
applied on it without failure is called strength of material. Strength is of
many types i.e. fatigue strength which is capability of material to
withstand cyclic loading and impact strength, which is capability of
material to withstand suddenly applied load.
• Elasticity:
It is the ability of material to produce strain in all
directions under the action of applied stress without permanent
deformation. The body returns to its original size and shape when

unloaded. In stress strain curve, elasticity is the region from zero to
elastic limit.
• Plasticity:
The ability of material to change in size and shape
permanently under the action of applied force is called plasticity. In
stress strain curve, plasticity starts from elastic limit and ends at
breaking stress. This property of materials is used to mold different
materials to desired form.
• Resilience:
The ability of material to absorb energy when it is deformed elastically
is called resilience. When the body will be unloaded, it’ll release energy.
It can also be defined as the maximum energy that can be absorbed per
unit volume without creating permanent distortion. The energy
absorbed in area under stress strain curve from zero to elastic limit is
resilience.
�� =��
�
Where �� is the modulus of resilience, �� is the yield strength and E is
the young’s modulus.
• Poisson’s Ratio:
Poisson’s Ratio is defined as the ratio of liner strain
to the lateral strain. Mathematically it is written as:
Poisson’s ratio = �������������
������������

� = _��
�
Poisson’s ratio has no unit.
• Hardness:
The ability of material to resist scratch, bending,
aberration, wear, tear and indentation is called hardness. A hard
material also offers resist the penetration of another bodies in it.
Diamond is the hardest naturally occurring material.
• Flexural Strength:
The flexural strength is the maximum
stress experienced by a body at its moment of fracture. Flexural
Strength is also known modulus of rupture or bends strength. It is a
mechanical parameter for brittle material. It is taken as a stress so is
used to represent it.
• Fatigue Ratio:
Fatigue ratio is the ratio of fatigue strength to
tensile strength. The material having high fatigue ratio shows that it will
crack down during loading. It is also called “Endurance ratio”.
• Young’s Modulus: Young’s modulus is the ratio of stress applied to
the strain under elastic limit. It is given as:
Young’s Modulus = !�����
!�����
E =
"
It is also known as tensile modulus or modulus of elasticity. By young’s modulus,
we can measure the stiffness of elastic material.
• Tensile Strength:
Tensile Strength or ultimate tensile
strength is the measure of maximum stress that a body can withstand
while being stretched or pulled away before necking. It is opposite of
compressive strength in which body is compressed.
Relations b/w Elastic Constants:
Following are elastic constants:
E = Young’s modulus.
K = Bulk modulus
G = Shear modulus
Ν = Poison’s ratio
Relation between E, K and ν:
Let �#, �% and �& be three stresses acting on a rectangular box as
shown below:

Let '#, '%and '& are three
respective strains in three principle directions.
In order to find '#, consider each of the stresses acting separately and
find the strain in the direction of stress �# due to each stress. Then
superimpose the results and get net strain'#.
Since �# is acting alone in its direction, the strain produced in the
direction of �# is given as:
Strain = �
Similarly:
Strain produced due to � = �+�
(negative sign indicate that strain is compressive)
Strain produced due to , = �+,
Therefore:
-� = net strain in direction of � = �
.
+�
.
+,
Hence:

-� = �
[��+(�1,)] .……….. Eq. (1)
-� = �
[��+(,1�)] ………… Eq. (2)
-, = �
[,�+(�1�)] …..……. Eq. (3)
Adding Eq. (1), Eq. (2) and Eq. (3), we get:
-� + -� + -, = �
[(�1�1,)-2+(�1�1,)]
=(�1�1,)(���+)
But: -� + -� + -, = -+
Hence:
-+ = (���+)
(�1�1,) …………. Eq. (4)
From Eq. (4), putting
�4�4, = -p, we get:
-+ = (���+)
(-3p)
-+ =,(���+)
p
-+
5 =,(���+)
5
-+ =
,(���+)
Where:
5
-+ = K (Bulk modulus)

Therefore:
K =
,(���+) Hence proved:
Relation between E, G and K:
With the reference of above relations:
E = 2G (1+ν)
E = 3K (1-2 ν)
To eliminate ν from the two expressions for E, we have:
ν =
�6 – 1
And
E = 3K [1-2(
�6 - 1)]
Solving this equation, we get:
E = 9K - ,7
6
E + ,7
6 = 9K
E = 876
61,9 Hence proved