Embed Size (px)
Citation preview
Loyola University ChicagoLoyola eCommons
Master's Theses Theses and Dissertations
1976
Stress Relaxation of Elastomeric OrthodonticThreadRobert Theodore BergmanLoyola University Chicago
This Thesis is brought to you for free and open access by the Theses and Dissertations at Loyola eCommons. It has been accepted for inclusion inMaster's Theses by an authorized administrator of Loyola eCommons. For more information, please contact [email protected].
This work is licensed under a Creative Commons Attribution-Noncommercial-No Derivative Works 3.0 License.Copyright © 1976 Robert Theodore Bergman
Recommended CitationBergman, Robert Theodore, "Stress Relaxation of Elastomeric Orthodontic Thread" (1976). Master's Theses. Paper 2851.http://ecommons.luc.edu/luc_theses/2851

STRESS RELAXATION OF ELASTOMERIC
ORTHODONTIC THREAD
by
Robert T. Bergman, B. A., D. D.S.
A Thesis Submitted to the Faculty of the Graduate School of
Loyola University in Partial Fulfillment of the
Requirements for the Degree of
Master of Science
June
1976
--
ACKNOWLEDGEMENTS
I wish to thank Dr. James L. Sandrik, for his advice and
continued guidance which provided me with a sincere appreciation of
investigative principles during the work on my thesis.
I gratefully acknowledge Marie Feng whose assistance and
advice helped during the preparation of this thesis.
I acknowledge Dr. Milton Braun for his guidance and interest
during my years of graduate work.
I also wish to thank John Cheng for all the help he gave me in
the processing of the statistics for this thesis.
ii
--
VITA
Robert Theodore Bergman was born on April 6, 1942 in Los
Angeles, California. He is the son of Russell Theodore Bergman and
Gladys Darlene (Winn) Bergman.
He graduated from San Marino Preparatory School in San
Marino, California in 1960. He then attended Pacific Union College in
Angwin, California from 1960 to 1962 and La Sierra College in River
side, California from 1962 to 1965, where he received a Bachelor of
Arts degree with a major in biology and a minor in history. He began
his dental studies at the University of Detroit School of Dentistry in
1966, and graduated in 1970 with the degree of Doctor of Dental Surgery.
After practicing general dentistry in Hollywood, California
from 1970 to 1973, he began graduate studies in the Department of Oral
Biology at Loyola University in September, 1973. Specialty training
was begun in the Department of Orthodontics under the Director of
Graduate Orthodontics, Dr. Milton L. Braun in 1974.
iii

--
DEDICATION
To Mother, Father, and Nana for their many years of guidance,
encouragement, and support. And to Barbara for her devotion and
patience.
iv

--
TABLE OF CONTENTS
CHAPTER
I. INTRODUCTION. • • e • • • •
I I. REVIEW OF THE LITERATURE
III. MATERIALS AND METHODS .•.
IV. RESULTS
V. DISC USS ION
VI. SUMMARY • •
BIBLIOGRAPHY • . . . . .
v
PAGE
1
2
. . . 9
19
38
55
56

---
CHAPTER I
INTRODUCTION
In recent years, elastomeric materials have become part of the
orthodontic armamentarium for many procedures such as ligature ties,
rotating teeth, condensing generalized spacing in the mouth and retracting
teeth. Yet, when one reviews the literature, there is very little that can
be found on the elastopolymers. With current emphasis placed upon
optimum forces in the mouth for tooth movement, it becomes extremely
important to better understand the various appliances that are used.
Up to now, use of elastomeric polymers was based on cbnical
results and impressions by the clinician. When the individual manu
factures (Unitek, TP, American Orthodontics, and Orm co) were contacted
and asked about the nature of these elastopolymers, little if any informa
tion was given in reference to their particular product. Some of the
manufacturers were even reluctant to disclose any information on the
composition of the material. It was necessary to find the patents on the
material to determine a number of fundamental facts about elastomeric
materials used in orthodontic procedures.
1

CHAPTER II
REVIEW OF THE LITERATURE
Relatively little is known about the elastopolymers used in
orthodontics. The manufacturers that supply the dental profession with
these elastomers are very reluctant to discuss their composition and
physical properties. Letters were sent to Ormco, TP Laboratories,
and American Orthodontics requesting information on the exact nature
of their elastomeric thread. American Orthodontics did not respond.
TP gave a vague response that the thread was "a special polymer blend
consisting of reaction products of isocyanates and material containing
hydroxl groups-polyols to form a polyether based thermoplastic." 1
Ormco stated that the material was a "polyether urethane base elasto
mer" which has a colorant added and an additive which they '"ere "not
at liberty to identify. 112 But from the various descriptions in the letters
received, the patent on elastomeric thread3, and the patent on the design
of the thread made for orthodontic appliances4• we can discuss to a
limited degree the nature of the material.
2
3
Elastopolymers were introduced to orthodontics for their phys
ical properties. According to Klein and Anderson 4, elastopolymers are
highly resistant to abrasion; oral fluids do not cause deterioration; and
they are capable of elasticity for a long period of time. The material is
an elastomeric, thermoset-thermoplastic, polyester-based isocyanate
terminated, urethane resin which is commercially available. Generally,
the ultimate strength is said to be about 6, 500 PSI and the ultimate elon
gation is around 600 percent.
Elastopolymers, as members of the polymer group, are made
up of long molecules of relatively simple repeating units. The mechanical
properties of these organic polymers depend a great deal on their molec
ular configuration, which is influenced by the mode of manufacture. The
strength of the polymer, for example, is affected by the degree of poly
merization, the amount of branching, and the degree of cross-linking of
the molecular structure. Therefore, understanding elastic modulus,
deformation under stress, tensile strength or yield strength, requires
simultaneous c~:msideration of composition and the mode of manufacture. 5
In materials which exhibit a rubbery behavior such as elastopoly
mers, it is characteristic for the neighboring molecules to be either
cross-linked at various intervals along the chain, or mechanically
entangled. When the material is stretched, the chain is extended or

elongated, causing an increase in the distance between the cross-links,
and reduction in the number of coiled configurations. This leads to a
decrease i.n the entrophy. 5 Stresses in a material can cause bond
straightening as well as bond-lengthening in the molecular structure. 6
4
Polyester urethane base is the fundamental material of elasto
meric thread. Polyurethane is formed by a step-reaction polymerization,
or condensation polymerization, as opposed to a chain polymerization.
Step polymers lack certain atoms in the monomer from which they are
formed, making it impossible to form repeating units by itself. Two
polyfunctional molecules are necessary to form a larger polyfuncti.onal
molecule with the possible eliminati.on of a smaller molecule such as
water. 7
Polymers are not perfectly elastic. They have characteristics
of viscoelasti.c materials. For example, a liquid will respond to a shear
stress by deforming, but the liquid will not snap back to its original
shape; whereas a perfectly elastic materi.al will return to its original
shape. Elastopolymers exhibit both of these characteristics. 8
There are a number of mechanical tests that may be used to
study viscoelastic materials. The most important tests are creep,
stress relaxation, stress-strain, and dynamic mechanical behavior. 8
The test chosen for this study was stress relaxation. When discussing

5
stress relaxation, reference is made to the force decay in a material
with stress defined as a force per unit area. Stress relaxation is a time
dependent change in the stress which is due to an internal relaxation of
the material. 9 With time, stresses are relaxed due to elastic elongation.
"Since stress relaxation depends upon the movements of atoms or mole
cules," it is found "that relaxation time has a reciprocal exponential
relationship to temperature. 116
In stress relaxation tests, the specimen is deformed to a fixed
distance and the stress required to maintain this deformation is measured
for a period of time. The maximum stress takes place immediately upon
deformation, and the stress will gradually decrease with time. 8
Stress relaxation behavior of polymers is extremely temperature
dependent. At both the high and low temperatures, the slope of the stress
relaxation lines become less. while an intermediate temperature will
show a steep slope on the stress relaxation line. 8 For this reason the
temperature must be closely controlled in all stress relaxation tests.
With the advent of elastopolymers, a new appliance was intro
duced to orthodontics by Paul Klein and Roland Anderson. 4 The first
published work on these elastopolymers in orthodontic literature was by
Andreasen and Bishara in 1970. In their study it was found that the
heavy chains of Alastiks have a stronger initial force than the standard

6
Alastik chain when placed under similar conditions, but the rate of force
decay was greater for the heavy chains after eight hours and even crossed
the curve of the standard Alastik chain. It was suggested that an initial
force of about four times that of what is desired on the tooth is necessary
since 75 percent of the original force is lost after the first day, and then
there is little change. It was also noted that even though a large percent
of the initial force is lost during the first day, the remaining force is
I greater than that of a five-eighths or a three-fourths inch elastic stretched I
from molar to molar for a three week period. lO
When a time comparison of related forces was made between
elastopolymers and latex elastics, the plastic Alastiks lost 45. 3 percent
of their initial force the first hour, while latex elastics lost about ten
percent. The average drop at the end of one day for plastic forces was
about 54. 7 percent, while it was 17. 2 percent for latex elastics. At the
end of one week the loss was 60. 5 percent for the Alastiks, and 21. 9 per-
cent for latex elastics. At the end of three weeks the force lost was
67. 5 percent, leaving only 32. 5 percent of the original force remaining
on the average for the Alastiks. The latex, on the other hand, lost only
25. 1 percent of their initial force. The authors felt that quality control
could be improved for Alastiks due to the large variation in the samples
tested. The greater the distance the Alastiks were stretched, the

7
greater was the deformation in the material. The conclusion was that the
material should not be prestretched to a distance greater than the one in
the mouth. As the force was increased, it was not linerarly proportion
ate with the increase in stretch. 11
In another work, plastic modules were stretched on an adjustable
stainless steel framework where an adjustment could be made to simulate
tooth movement. The modules were initially stretched with no adjust
ments made to simulate tooth movement. The general conclusion was
that 75 percent of the initial force remained after ten minutes, 64 percent
after one hour, 47 percent after 24 hours, and 42 percent after a six
week period. When tooth movement was taken into consideration, about
one-third of the initial force was left after one month if 0. 25 mm. of
tooth movement per week was predicted, and only one-fourth of the initial
force was left if tooth movement was estimated to be 0. 5 mm. per week.
It was also concluded that the percent of force lost was similar for mod
ules whether they were stretched to high or low force. The decay
characteristics did not seem to be related to the magnitude of the initial
force. 12'
Up to now no work has appeared in orthodontic literature on
elastomeric thread. There is very little actually known concerning the
properties and behavior of this material except for the work just reviewed

dealing with modules, Information supplied by the manufactures is
limited concerning the specific nature of the material, The purpose of
this investigation is to provide essential and basic information about
these elastomeric materials.
8

CHAPTER III
MATERIALS AND METHODS
Three companies, Ormco, TP, and American Orthodontics, were
contacted and asked to supply 100 feet of 0. 025 inch diameter elastopoly
meric thread, preferably from the same batch. Unitek was not contacted
because, although they have the patent rights on the various modules used
in orthodontics, they do not sell any of the elastomeric thread. The 0. 025
inch diameter thread was requested because it was the only specific size
that all the companies carried.
Next various grips were evaluated to see which held the elasto
mer best. The highest ultimate strength was the criteria used for evalu
ating the best grips. A table model 1130 Instron Universal Testing
Machine (Figure 1) was used to test the material. Preferably if a break
occurred in the elastomeric thread, it would be in a spot other than at the
grips themselves. After finding the ultimate load to be approximately
five to six pounds of force for a one inch piece of 0. 025 inch Duraflex
thread, a ten pound load tension cell was used on the Instron for all
further tests.
9
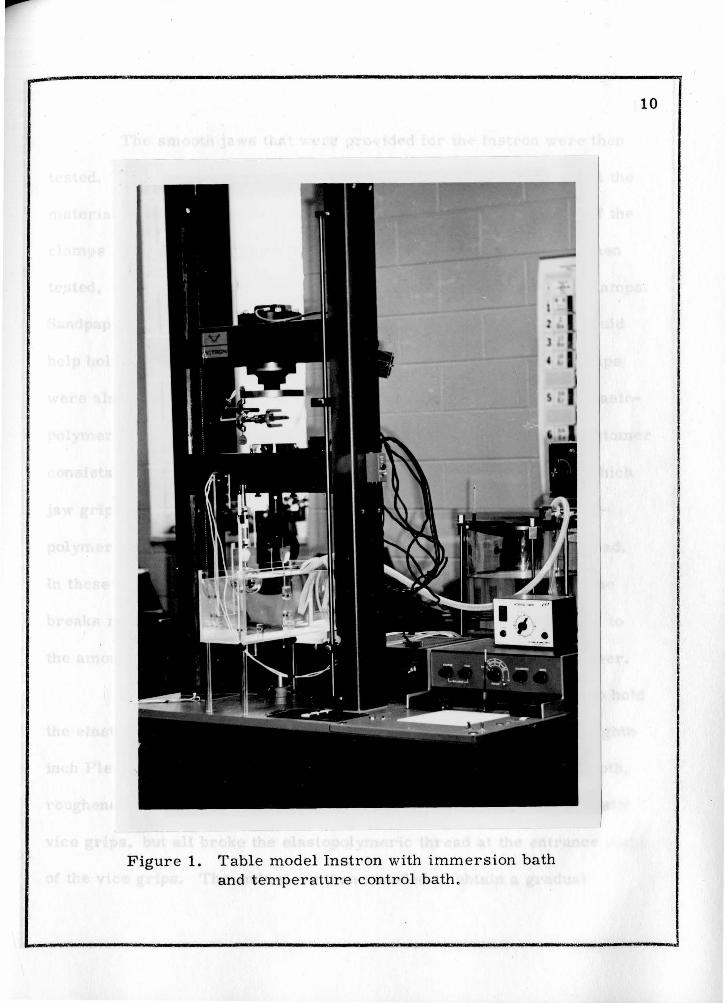
Figure 1. Table model Instron with immersion bath and temperature control bath.
10
11
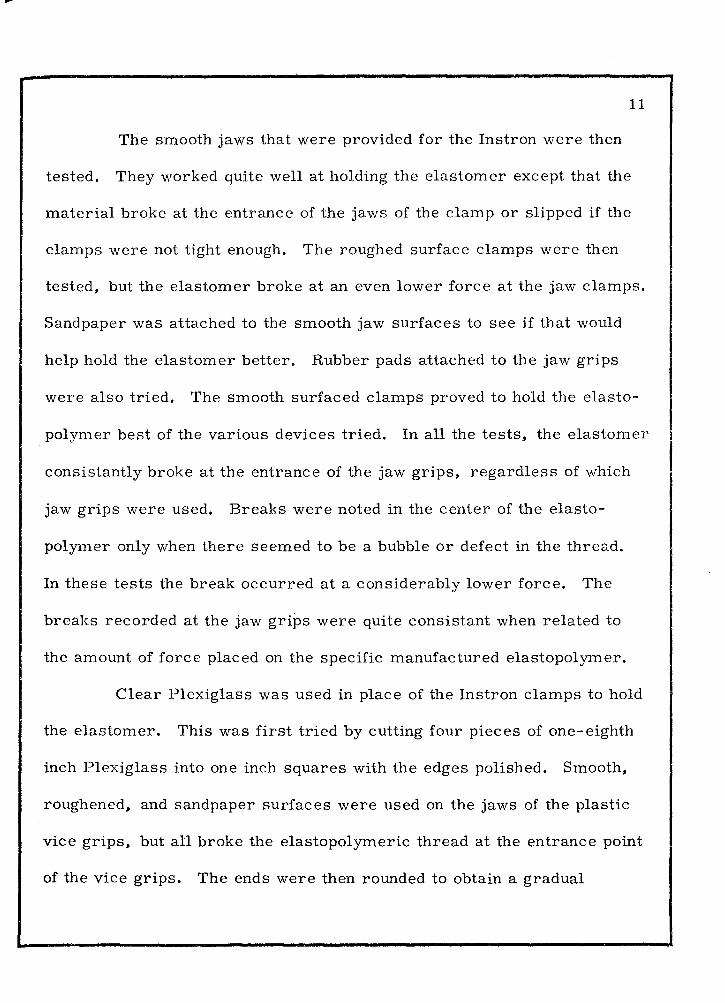
The smooth jaws that were provided for the Instron were then
tested. They worked quite well at holding the elastomer except that the
material broke at the entrance of the jaws of the clamp or slipped if the
clamps were not tight enough. The roughed surface clamps were then
tested, but the elastomer broke at an even lower force at the jaw clamps.
Sandpaper was attached to the smooth jaw surfaces to see if that would
help hold the elastomer better. Rubber pads attached to the jaw grips
were also tried. The smooth surfaced clamps proved to hold the elasto
polymer best of the various devices tried. In all the tests, the elastomer
consistantly broke at the entrance of the jaw grips, regardless of which
jaw grips were used. Breaks were noted in the center of the elasto
polymer only when there seemed to be a bubble or defect in the thread.
In these tests the break occurred at a considerably lower force. The
breaks recorded at the jaw grips were quite consistant when related to
the amount of force placed on the specific manufactured elastopolymer.
Clear Plexiglass was used in place of the Instron clamps to hold
the elastomer. This was first tried by cutting four pieces of one-eighth
inch Plexiglass into one inch squares with the edges polished. Smooth,
roughened, and sandpaper surfaces were used on the jaws of the plastic
vice grips, but all broke the elastopolymeric thread at the entrance point
of the vice grips. The ends were then rounded to obtain a gradual

12
Figure 2. Plastic jaws used to hold Elastomeric Thread.

Figure 3. Immersion bath on the Instron with Elastomeric Thread attached to the plastic jaws.
13

14
clamping of the material, but the thread still broke where it entered the
grips. Next, a hole of O. 025 inches in diameter was drilled and the
elastopolymer was knotted to hold the material when stretched. Another
attempt to hold the material was wrapping the elastomer around a plastic
dowel, then clamping the side of the dowel. After trying all these various
methods, it was decided that the material was best held using smooth
plastic jaws, since the highest ultimate strength was accomplished with
virtually no slippage (Figure 2).
The next part of the project dealt with designing an immersion
tank that could be used to run the stress relaxation tests and keep a con
stant temperature. A tank was made out of clear one-fourth inch Plexi
glass with dimentions of 12 inches by four and one-half inches by six
inches. Six inch legs were placed on the tank so that it would fit over the
metal grips on the base of the Instron. The plastic jaws that held the
elastopolymer best were modified to fit into the immersion tank. Pieces
of Plexiglass were welded to the floor of the tank. Two stainless steel
rods ran through the two pieces of Plexiglass on the floor and the lower
part of the lower vice grips. For added support, another piece of Plexi
glass was placed directly under the lower plastic grip to fit into the jaws
on the base of the Instron {Figure 3). The upper plastic clamp was mod
ified to keep the upper jaw of the Instron out of the immersion tank. A

...
15
small hole was drilled into the plastic clamps so that the elastopolymeric
material could be marked to see if slippage occurred in the jaws during
the testing. The environment of the tank was controlled to obtain a mini
mum of fluctuation in water temperature. This was accomplished by using
a Blue M Magni Whirl temperature control bath. The water bath was
attached to the immersion tank using a Cole Parmer circulating pump with
a syphon hose leading back to the temperature bath. The height of the
water level in the testing tank was controlled by a microswitch modified
with a long lever arm to keep the electrical water pump on until an air
bulb was pushed up against the extended arm of the microswitch (Figure
4). This worked well at controlling not only the water level, but also the
temperature at a constant 37 degrees Centigrade. Deionized water was
used for the experiments. To help keep consistency in the length of the
elastomer being tested a matrix was made to hold the plastic jaws so that
the same length of elastopolymer could be obtained for each test.
Experiments were begun to test the ultimate strength of one inch
of elastopolymeric thread. The 26AX-26AX gears were used on the drive,
making the crosshead speed ten inches per minute; CX-CY gears were
used on the time drive to produce a chart speed of two inches per minute.
Twenty tests were run on each kind of elastomeric thread for ultimate
tensile strength. All of the tests were run at room temperature. The

16
Figure 4. Microswitch used to control water level.
17
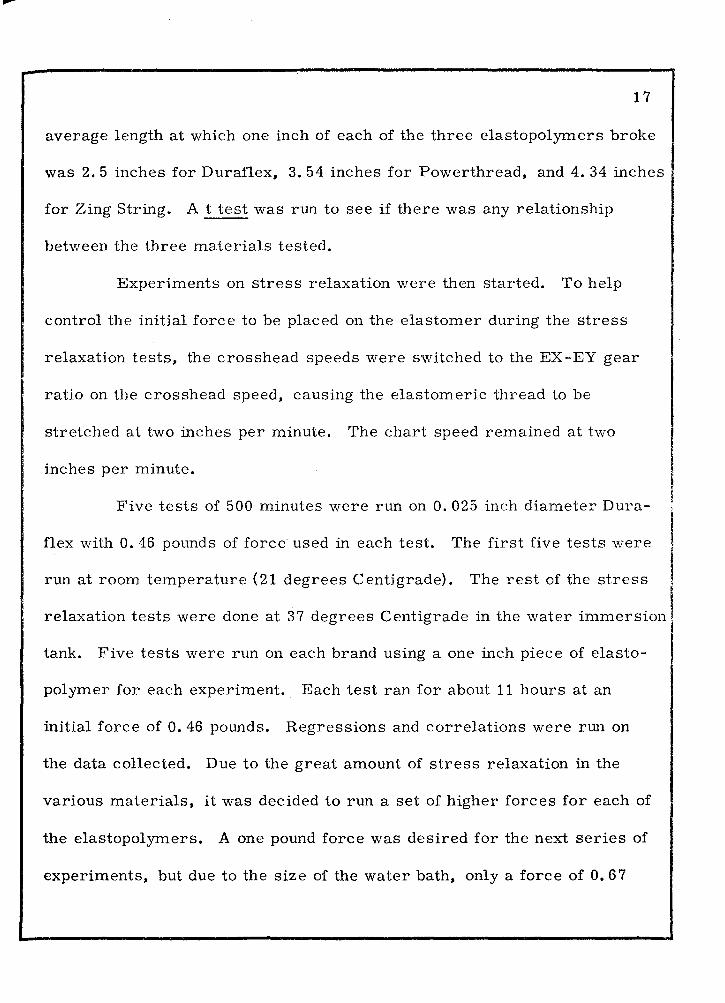
average length at which one inch of each of the three elastopolymers broke
was 2. 5 inches for Duraflex, 3. 54 inches for Powerthread, and 4. 34 inches
for Zing String. A t test was run to see if there was any relationship
between the three materials tested.
Experiments on stress relaxation were then started. To help
control the initial force to be placed on the elastomer during the stress
relaxation tests, the crosshead speeds were switched to the EX-EY gear
ratio on the crosshead speed, causing the elastomeric thread to be
stretched at two inches per minute. The chart speed remained at two
inches per minute.
Five tests of 500 minutes were run on 0. 025 inch diameter Dura-
flex with 0. 46 pounds of force used in each test. The first five tests v.rere
run at room temperature (21 degrees Centigrade). The rest of the stress
relaxation tests were done at 37 degrees Centigrade in the water immersion I tank. Five tests were run on each brand using a one inch piece of elasto-
polymer for each experiment. Each test ran for about 11 hours at an
initial force of O. 46 pounds. Regressions and correlations were run on
the data collected. Due to the great amount of stress relaxation in the
various materials, it was decided to run a set of higher forces for each of
the elastopolymers. A one pound force was desired for the next series of
experiments, but due to the size of the water bath, only a force of O. 67

18
pounds could be used for Powerthread and a force of O. 9 pounds for the
Duraflex when testing a piece of elastopolymer one inch in length. The
data was collected and correlations and regressions were used to analyse
the results.

19
CHAPTER IV
RESULTS
The results of testing the ultimate tensile strength and elongation
of the three elastopolymers are shown in Table I. A mean, standard
deviation, and t test were run on the data. By taking the mean of each set
of elastopolymers, the ultimate tensile strength was determined. For
Duraflex it was 10, 230 pounds per square inch, for Powerthread it was
7, 453 pounds per square inch and for Zing String it was 16, 246 pounds per
square inch. The elastopolymeric thread consistently broke at the jaw
grips during the tests for ultimate strength. Table II is a summary of tbe
t test showing that the three groups of elastomeric thread are of totally
different samples. The percent of elongation of the three elastopolymers
was determined from the average distance run in each of the tests according ,
to the chart and crosshead speeds. For Duraflex it was 250 percent,
Powerthread 354 percent, and Zing String 434 percent.
The stress relaxation test run on Duraflex at room temperature
showed a high correlation coefficient of 0. 90826 and an F value of 504. 23 73
when the log of time was plotted against the percentage of load relaxation.

TABLE I
STATISTICAL ANALYSIS OF BREAKING POINT FOR O. 025 INCH ELASTOMERIC THREAD
Duraflex Powerthread Zing String
Mean Breaking Point in lbs.
Std. Dev.
Ultimate Tensile Strength, PSI
Percentage (Ultimate) Elongation
5.017
0.569
10,230
250
3.655 7. 967
o. 373 0.674
7, 453 16, 246
354 434
20
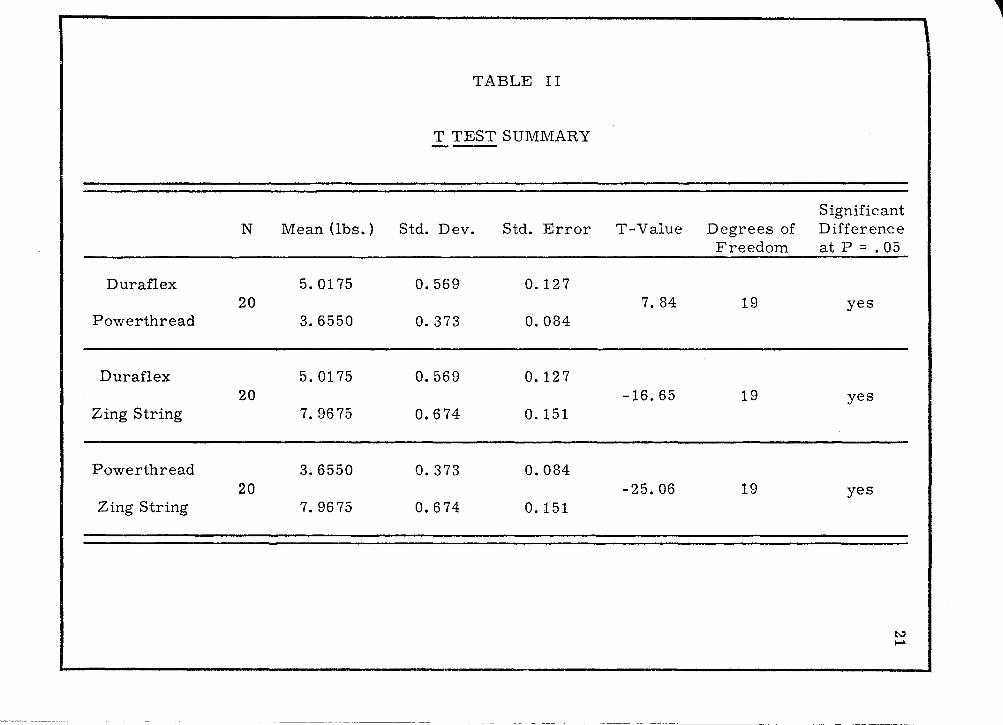
TABLE II
T TEST SUMMARY
N Mean (lbs.) Std. Dev. Std. Error
Duraflex 5.0175 0.569 0.127 20
Powerthread 3.6550 0.373 0.084
Duraflex 5.0175 0.569 o. 127 20
Zing String 7.9675 0.674 0.151
Powerthread 3.6550 0.373 0.084 20
Zing String 7. 96 75 0.674 o. 151
T-Value Degrees of Freedom
7.84 19
-16.65 19
-25.06 19
Significant Difference at P = • 05
yes
yes
yes
N> f....\
i
22
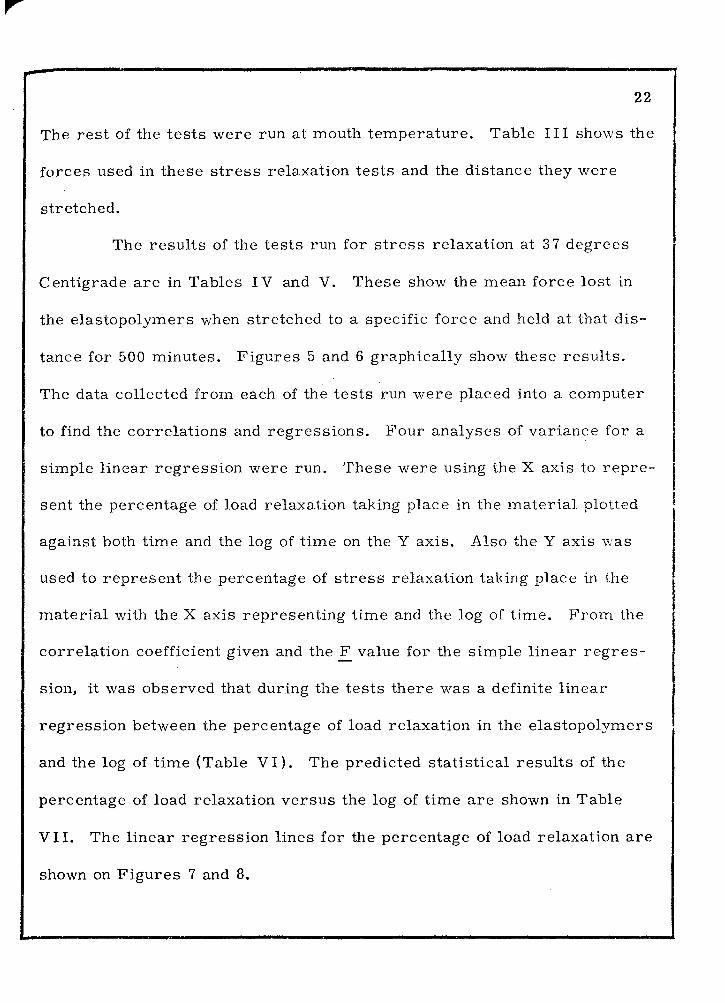
The rest of the tests were run at mouth temperature. Table I I I shows the
forces used in these stress relaxation tests and the distance they were
stretched.
The results of the tests run for stress relaxation at 3 7 degrees
Centigrade are in Tables IV and V. These show the mean force lost in
the elastopolymers when stretched to a specific force and held at that dis
tance for 500 minutes. Figures 5 and 6 graphically show these results.
The data collected from each of the tests run were placed into a computer
to find the correlations and regressions. Four analyses of variance for a
simple linear regression were run. These were using the X axis to repre
sent the percentage of load relaxation taking place in the material plotted
against both time and the log of time on the Y axis. Also the Y axis \vas
used to represent the percentage of stress relaxation taking place in the
material with the X axis representing time and the log of time. From the
correlation coefficient given and the F value for the simple linear regres
sion, it was observed that during the tests there was a definite linear
regression between the percentage of load relaxation in the elastopolymers
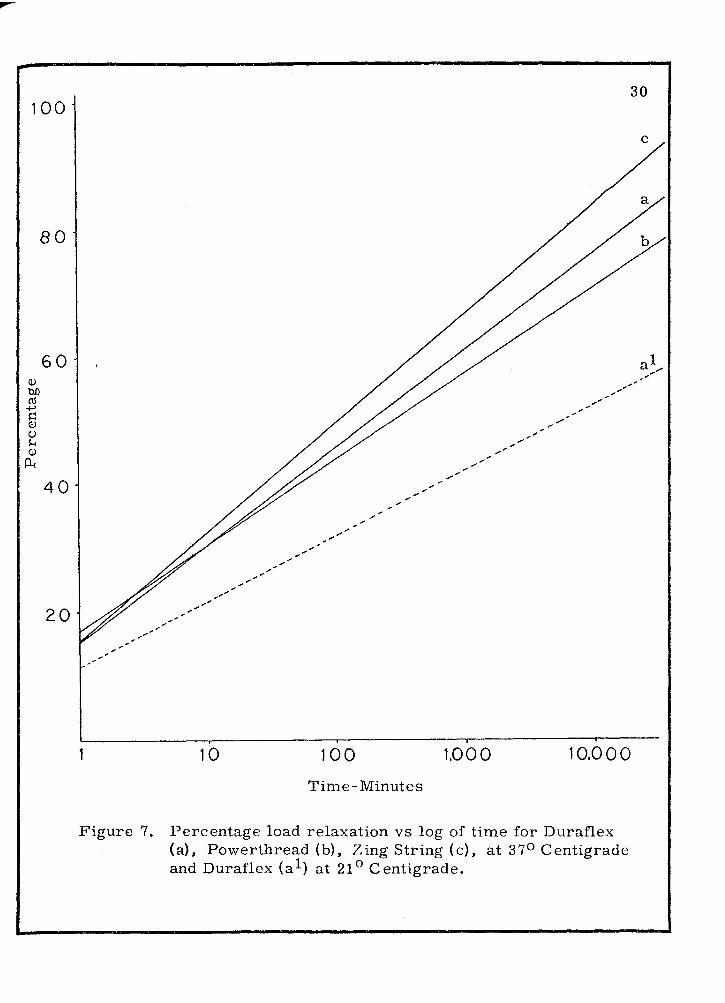
and the log of time (Table VI). The predicted statistical results of the
percentage of load relaxation versus the log of time are shown in Table
VI I. The linear regression lines for the percentage of load relaxation are
shown on Figures 7 and 8.

Duraflex
Powerthread
Zing String
TABLE III
INITIAL FORCES AND ELONGATION USED FOR THE STRESS RELAXATION TESTS (GAUGE LENGTH ONE INCH)
Force Pounds Grams
• 460 209
• 900 408
• 460 209
• 6 75 309
• 460 209
1.000 454
Elongation (including gauge length)
1. 71
3.19
2.51
3. 19
1. 28
1. 71
t-.:> w
... ~~~~~~~~~~~~~~~~~~~~~~~~~~~~~~~~~~~~·---.__._.....------..~~~~~~~~~~~~~~--~~~~~~~~~~~----~~--~~--~~~~~~
1
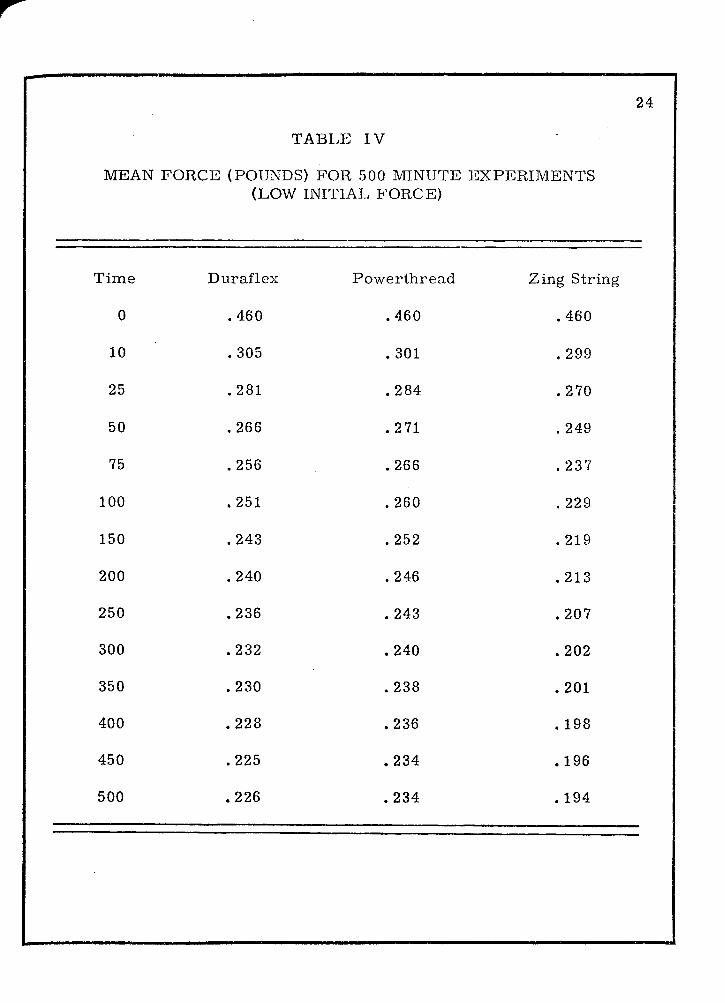
TABLE IV
MEAN FORCE (POUNDS) FOR 500 MINUTE EXPERIMENTS (LOW INITIAL FORCE)
Time Duraflex Powerthread Zing String
0 . 460 • 460 . 460
10 • 305 • 301 • 299
25 • 281 • 284 . 270
50 • 266 • 2 71 . 249
75 . 256 . 266 . 23 '7
100 • 251 . 260 . 229
150 . 243 . 252 . 219
200 . 240 • 246 • 213
250 • 236 • 243 • 207
300 .232 • 240 • 202
350 • 230 • 238 • 201
400 • 228 • 236 .198
450 • 225 • 234 • 196
500 • 226 • 234 .194
24

TABLE V
MEAN FORCE (POUNDS) FOR 500 MINUTE EXPERIMENTS (HIGH INITIAL FORCE)
Time Duraflex Powerthread Zing String
0 . 901 • 676 1.000
10 • 526 • 396 • 546
25 • 493 • 370 • 498
50 • 469 • 353 • 452
75 • 453 • 342 • 434
100 • 449 • 334 • 420
150 • 437 • 324 • 403
200 . 432 • 316 • 392
250 • 426 • 311 • 385
300 • 418 • 308 . 376
350 • 415 • 304 • 372
400 • 412 • 302 • 365
450 • 408 • 299 • 360
500 • 405 • 295 • 358
25
.s
.4
rn ~ c: ;:s 0
Poi
.2
.1
~
IO ·o JOO 200 .300 0
Time-Minutes
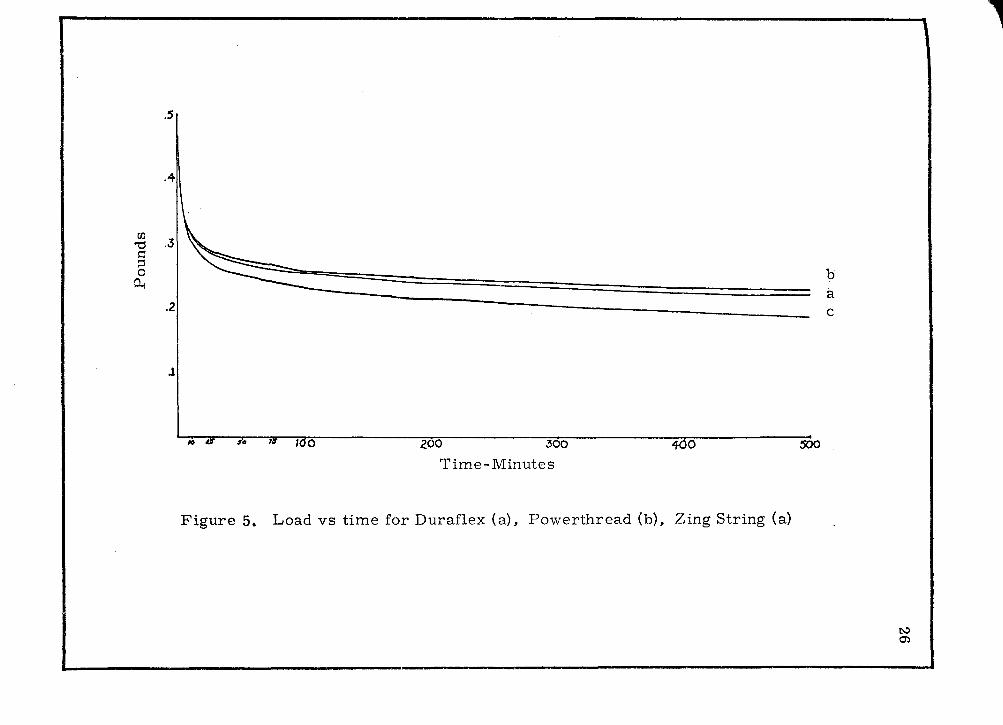
Figure 5. Load vs time for Duraflex (a), Powerthread (b), Zing String (a)
b a c
500
~ Q")
1

ti)
'g :::l 0
/.
.9
.8
. 7
·6
~ ,5
• .If
.J
• 2.
.1 ·o 16
Figure 6. Load vs time for Duraflex (a), Powerthread (b), Zing String (c)
200 300 0
Time-Minutes
a
c
b
~ -.J
1

TABLE VI
STATISTICAL RESULTS OF LOAD (Y) VERSES LOG OF TIME (X) AT 37 DEGREES CENTIGRADE
Initial load in lbs.
Correlation Coefficient
F Value (df = 120)
Intercept (a value)
Regression Coefficient (b value)
Std. Error of Regression Coefficient
Duraflex
. 46 • 90
• 928 • 872
672. 0 406. 2
18.3 26.9
13.2 11.0
.507 .872
Powerthread
• 46 . 6 75
. 914 . 880
631. 8 439. 8
20.5 26.3
11.2 11.7
.448 .558
Zing String
. 46 1. 0
.958 .912
1353. 9 637. 2
17.6 27.8
15.7 14.2
. 426 . 564
"" co
... ~~~~~~~~~~~~~~~~~~~~~~~~~~~~~~~~--- . ._,,. ~~~~~~~~~~~~~~~~~~~~~~~~~~~~~~~~~~~~~~~~~~
1

Time
1 min.
10 min.
30 min.
1 hr.
2 hrs.
6 hrs.
12 hrs.
24 hrs.
48 hrs.
72 hrs.
1 wk.
2 wks.
3 wks.
4 wks.
TABLE VII
PERCENTAGE LOAD RELAXATION (AT 37 DEGREES CENTIGRADE)
Duraflex Powerthread
Initial Force in Grams 209 408 209 306
15.40 26.94 17.08 26.34
30.66 37.99 30.55 38.05
37.95 43.26 36.97 43.64
42.54 46.58 41. 02 47.16
47.14 49.91 45.07 50.68
54.42 55.18 51. 50 56.27
59.02 58.50 55.55 59. 79
63.61 61. 83 59.60 63.32
68.20 65.16 63.66 66.84
70.89 67. 10 66.03 68.90
76.51 71. 16 70.98 73.21
81. 11 74.49 75.03 76. 74
83.79 76.44 77.40 78. 80
85. 70 77.82 79.08 80. 26
29
Zing String
209 454
15.47 23.17
32.58 40.28
40.74 48.45
45.88 53.60
51. 03 58.75
59.19 66.92
64.34 72.07
69.49 77.22
74.64 82.37
77.65 85.38
83.94 91. 68
89.09 96.83
92.10 99.84
94.24 100.00
100
Q)
b.O ro +' ~ Q)
CJ S... Q)
ill
80
60
40
20
10 100 1,000 10.000
Time-Minutes
Figure 7. Percentage load relaxation vs log of time for Duraflex (a). Powerthread (b), Zing String (c), at 37° Centigrade and Duraflex (al) at 21° Centigrade.
30
c

100
80
60
40
20
10 100 1,000 10,000
Time-Minutes
Figure 8. Percentage load relaxation vs log of time for Duraflex (a), Powerthread (b), and Zing String (c), at 37° Centigrade.
31c
b
32
From the statistical data received it was possible to predict that
the rate of load relaxation of elastopolymers would remain constant if
plotted against the log of time. A summary of the predictions is given on
Tables VI I I and IX for the load relaxation of the three elastopolymers
at low and high forces. Figures 9 and 10 show graphically the load relax
ation.
From the forces predicted in load relaxation the amount of stress
relaxation was determined as shown in Table X. This was calculated by
dividing the original cross- section area into the force left in the material
at the various time intervals.

TABLE VIII
LOAD VS TIME FOR THREE ELASTOMERIC THREADS EMPLOYING HIGH AND LOW INITIAL FORCES
Time Duraflex Powerthread Zing String
Pounds
0 • 460 • 900 • 460 • 675 • 460 1.000
1 min. . 389 .658 • 381 • 497 . 389 • 768
10 min. • 319 • 558 ~'319 . 418 • 310 .597
30 min. • 285 .511 • 290 • 380 • 273 . 516
1 hr. • 264 . 481 • 2 71 • 357 . 249 • 464
2 hrs. . 243 . 451 . 252 • 333 • 225 . 412
6 hrs. • 210 • 403 • 223 • 295 .188 • 331
12 hrs. • 188 • 374 • 204 • 271 .164 • 279
24 hrs. .167 • 344 • 186 .248 .140 • 228
48 hrs. • 146 • 314 .167 • 224 • 117 • 1 76
72 hrs. • 134 • 296 • 156 • 210 .103 • 146
1 wk. • 108 .260 .134 • 181 • 074 • 083
2 wks. • 087 .230 • 115 .157 • 050 • 032
3 wks. • 074 • 212 .104 .143 • 036 • 002
4 wks. • 066 • 200 • 096 . 133 • 026 0
33

TABLE IX
LOAD VS TIME FOR THREE ELASTOMERIC THREADS EMPLOYING HIGH AND LOW INITIAL FORCES
Time Duraflex Powerthread Zing String
Grams
0 209 408 209 306 209 454
1 min. 176 298 173 225 176 348
10 min. 145 253 145 190 141 271
30 min. 129 232 132 172 124 234
1 hr. 120 218 123 162 113 210
2 hrs. 110 204 114 151 102 187
6 hrs. 95 183 101 134 85 150
12 hrs. 85 170 92 123 74 126
24 hrs. 76 156 84 112 64 103
48 hrs. 66 142 76 102 53 80
72 hrs. 61 134 71 95 47 66
1 wk. 49 118 61 82 34 38
2 wks. 39 104 52 71 23 14
3 wks. 34 96 47 65 16 1
4 wks. 30 91 44 60 12 0
34

180
UJ s C'd H
Cj
120
60
Figure 9.
10 100 1,000 10.000 Time -Minutes
Load vs log of time for Duraflex (a), Powerthread (b), and Zing String (c), at 37° Centigrade, employing low forces.
35

300
240
18 0
12 0
10 100 1.000 1.0.000 Time-Minutes
Figure 10. Load vs log of time for Duraflex (a), Powerthread (b). and Zing String (c) at 37° Centigrade employing high forces

TABLE X
CALCULATED STRESS RELAXATION FOR THREE ELASTOMERIC ORTHODONTIC MATERIALS
(PSI)
Time Duraflex Powerthread Zing String
0 938.8 1836. 7 938.8 1377.5 938.8 2040.8
1 min. 793.9 1342.8 777.5 1014. 3 793.9 1567.3
10 min. 651. 0 1138. 8 651. 0 853. 1 632.6 1218.4
30 min. 581. 6 1042.8 591. 8 775.5 557.1 1053.1
1 hr. 538.8 981.6 553.1 728.6 508.2 946.9
2 hrs. 495.9 920.4 514. 3 679.6 459.2 840.8
6 hrs. 428.6 822.4 455.1 602.0 383. 7 675. 5
12 hrs. 383. 7 763.3 416.3 553.1 334.7 569.4
24 hrs. 340.8 702.0 379.6 506.1 285. 7 465.3
48 hrs. 298.0 640.8 340.8 457.1 238.8 359.2
72 hrs. 273.5 604.1 318.4 428.6 210.2 298.0
1 wk. 220.4 530.6 273.5 369.4 151. 0 169.4
2 wks. 1 77. 5 469.4 234. 7 320.4 102.0 65.3
3 wks. 151. 0 432.6 212.2 291.8 73.5 4. 1
4 wks. 134. 7 408.2 195.9 271. 4 53. 1 0
37
CHAPTER V
DISCUSSION
Elastopolymers have been used extensively in orthodontics the past
few years, yet very little is known about the material with respect to its
chemical and physical property. The limited work done has been oriented
toward the elastopolymer modules; virtually no mention of elastomeric
thread is made in the literature. Use of elastomeric polymers should not
be on a trial and error basis, but with a basic understanding of the material.
To take full advantage of elastomeric thread, response of teeth to the
material must be better understood.
Nielson 8 states that, "The synthetic polymer chemist wants to
know how mechanical behavior is related to chemical structure in order
that he can tailor-make materials with any desired properties. " If this is
the case, orthodontists, being clinicians, should be able to tell the manu
facturers the desirable and undesirable properties in the material so that
a better product may be produced.
To better understand mechanical behavior of materials a review of
certain basic definitions should be stated. Mechanical behavior of elasto
polymers involves deformation of the material by applied forces. Stress is
38

39
a force which is defined as the force per unit area of cross-section. 8 It
is measured in units such as pounds per square inch or dynes per square
centimeter. Tension stress pulls the material apart with the two forces
working directly opposite one another. 13
Strain is the forced change in shape of a material being subjected
to stress and is measured in units of length such as inches or millimeters.
Internal distortion produces internal stress which requires a balanced
external stress. In other words, stress and strain go together. It is
impossible to have one without the other. When a material is deformed
under stress, the material absorbs energy from the force as it resists it.
This absorbed energy is actually stored energy which is instantly ready
when the stress is released. The tendency for a material to return to its
original form is due to this absorbed energy and is called elasticity. 13
Polymers are not perfectly elastic materials. They have some
characteristics of both elastic materials and viscous liquids: for this
reason they are known as viscoelastic materials. 8 The test chosen to
study the viscoelastic material was stress relaxation. The first portion
of the study was to find the best way to hold the elastomeric thread. This
was done by testing for ultimate tensile strength. Ultimate tensile strength
of a material is the maximum stress that the material can stand before its
failure or breakage. In tensile tests, its value is measured by dividing

40
the maximum load in tension by the original cross-sectional area of the
test sample. 13 After trying several types of vice grips, it was decided
that the plain flat jaw grips worked by far the best for a tensile test. By
having a matrix in which the jaw grips fit, it vrns relatively easy to get a
consistent length of the elastomeric thread. Slippage of the thread was
also minimal and, if slippage did occur, it could easily be detected because
of the clear plastic jaws.
The ultimate strength for the elastomeric thread was considerably
higher than expected, 6, 500 pounds per square inch as stated by Ormco
for Powerthread. 2 Powerthread seemed to be the weakest \\'ith 7, 45 3
pounds per square inch. Duraflex was 10, 230 pounds per square inch, and
Zing String was 16, 246 pounds per square inch. Since the Instron could
not be stopped instantly at the breaking point, measurements vvere not
taken of the length at which the elastomeric thread broke. Instead ultimate
elongation was estimated from the graph recording the tests. By taking a
mean from the Instron readings, the ultimate elongation for Duraflex was
250 percent, Powerthread 354 percent, and Zing String 434 percent. All
of these were considerably below the expected 600 percent elongation. In
any tests where slippage was recorded, the test results were not counted.
In one of the tests on Duraflex, breakage occurred other than at the edge of
the jaw grips. Because of the obvious defect in the thread that particular
test was not incorporated into the statistical results.
41
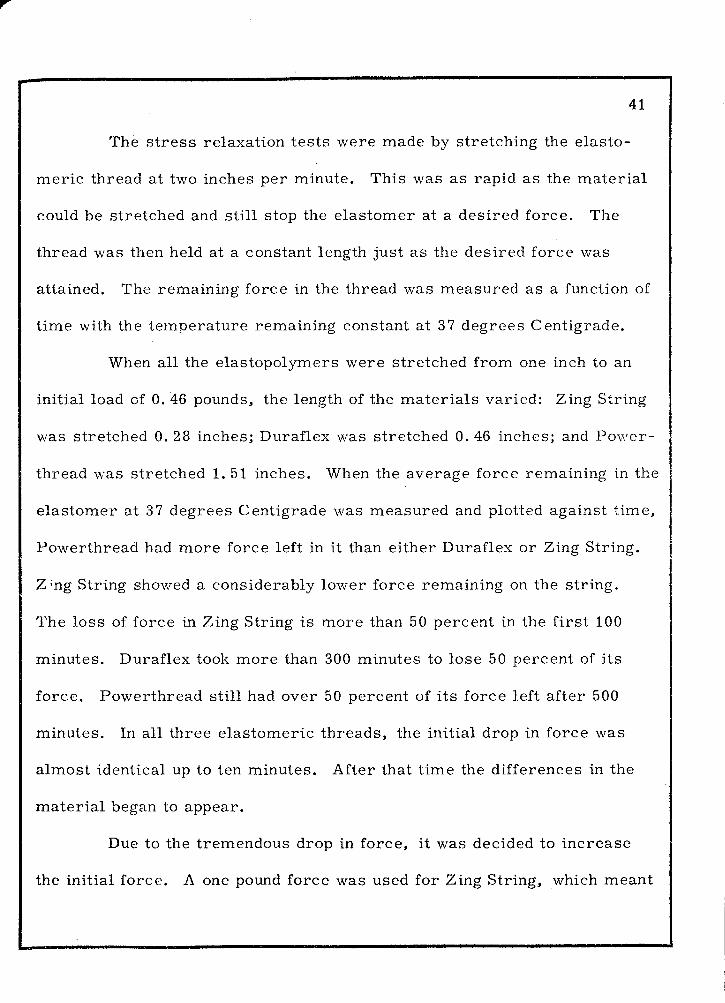
The stress relaxation tests were made by stretching the elasto
meric thread at two inches per minute. This was as rapid as the material
could be stretched and still stop the elastomer at a desired force. The
thread was then held at a constant length just as the desired force was
attained. The remaining force in the thread was measured as a function of
time with the temperature remaining constant at 3 7 degrees Centigrade.
When all the elastopolymers were stretched from one inch to an
initial load of 0. 46 pounds, the length of the materials varied: Zing String
was stretched 0. 28 inches; Duraflex was stretched 0. 46 inches; and Po1,yer
thread was stretched 1. 51 inches. When the average force remaining in the
elastomer at 37 degrees Centigrade was measured and plotted against time,
Powerthread had more force left in it than either Duraflex or Zing String.
Z ;ng String showed a considerably lower force remaining on the string.
The loss of force in Zing String is more than 50 percent in the first 100
minutes. Duraflex took more than 300 minutes to lose 50 percent of its
force. Powerthread still had over 50 percent of its force left after 500
minutes. In all three elastomeric threads, the initial drop in force was
almost identical up to ten minutes. After that time the differences in the
material began to appear.
Due to the tremendous drop in force, it was decided to increase
the initial force. A one pound force was used for Zing String, which meant

42
stretching a one inch piece of elastomer only 0. 7 inches. Both Duraflex
and Powerthread were stretched as far as possible in the 37 degree water
bath, 2. 19 inches. An initial force of 0. 900 pounds was used for Duraflex
and 0. 675 pounds was used for Powerthread.
At these higher forces, Zing String lost 50 percent of its force at
the end of 25 minutes. The force consistently decreased even surpassing
the force on Duraflex. There was 1 7 percent less force in Zing String than
in Duraflex after 500 minutes even though Duraflex started out with an
initial force of only 0. 9 pounds. Duraflex lost 50 percent of its initial
force in 25 minutes but the dramatic drop tapered off much quicker than
the Zing String.
The initial force on Powerthread was much lower even though it
was stretched the same distance as Duraflex. It too lost 50 percent of its
force, but it took 90 minutes to do so. Its decline in force after the initial
drop seemed to parallel the Duraflex as to percent of load relaxation except
at a lower force.
Readings were taken on all of the tests and correlations and regres
sions were run on the data collected. The correlation and regression
showed evidence that there was a close correlation between the percentage
of load relaxation and the log of time. Both the coefficient of correlation
and the F value confirmed that as seen in Table VI. It became evident

43
that a regression line could be predicted with some degree of accuracy.
From the a and b values given, a line could be predicted for the load relax
ation in the material. The predicted values are given in Table VI. A
graph showing the lines predicted from the table can be seen in Figure 7
and Figure 8.
Table IX shows the load left with respect to time in grams. In
the initial few hours, the decrease in force is relatively equal when you
compare the initial load of 209 grams for each thread. It is after twelve
hours that the differences start to become more evident. When the three
are predicted to a four week period, the variation ranges from 12 grams of
force for Zing String with 30 grams and 44 grams for Duraflex and Power
thread respectively.
When the initial load was increased, the comparison is more
difficult since various initial forces were used. When a one pound force
was used on Zing String, there was only 28 percent of the initial force left
after 24 hours with no force being left after four weeks. Duraflex had 38
percent of its initial force after 24 hours and 21 percent of the initial force,
or 91 grams, left after four weeks. Powerthread had 37 percent of its
initial force after 24 hours and 20 percent, or 60 grams, left after four
weeks. From the predicted data both Duraflex and Powerthread were quite

44
effective up to four weeks, while Zing String was virtually ineffective after
one week regardless of the initial force used.
It should be noted that depending on the force desired, one should
be selective as to the initial force used so that a more optimal force can be
used to move the teeth. Optimal force for tooth movement is one of the
more disputed areas in orthodontics. Burstone14 defines it as a force
"which produces a rapid rate of tooth movement without discomfort to the
patient or ensuing tissue damage." From a histological standpoint this
would mean that vitality would remain throughout the periodontal membrane
and that a maximum cellular response would take place causing resorption
on the pressure side and apposition of bone on the tension side.
Because of the numerous variables involved, it is difficult to make
any definitive statement as to the force that should be applied to a tooth
even though there have been numerous articles written on the subject.
Depending on who you read, the treatment philosophy that you follow, and
your clinical experience, the force used for retraction of teeth may vary.
There are three ways to determine optimum force clinically:
Pain, which is largely empirical because it is based on subjective appraisal;
tooth mobility, which is also subjective but is a good indication; and jaw
reflex, which is caused by tapping the jaw lightly. Tapping the maxillary
teeth will cause the mandible to jump forward as in closing, while tapping

45
the mandibular teeth will cause the mandible to relax momentarily or have
the jaw open. These responses are proportional to the threshold of pain.
If the threshold is low, the response is very quick. If the response is low,
the threshold is high. These clinical observations along with cephalograms
and intraoral roentgenograms can give a good indication of optimal forces
for patients. 15
The majority of work on optimal force for tooth movement has been
done on cuspids and for our discussion we will limit our review to optimum
forces for cuspid retraction. Using the criteria as described above, the
optimal range for cuspid retraction, according to J arabak15 , \'1.'ill vary
from 85 grams for a mandibular cuspid with short roots to 1 70 grams for
maxillary cuspids with long roots.
Universal orthodontists base their forces on work done by
Schwartz16 . He states that to move teeth physiologically, the force must
not use pressure more than that of capillary blood pressure, approximately
20 to 26 grams per square centimeter of root surface. Pressure under 20
grams per centimeter squared is considered light, while over 26 grams
per centimeter is heavy. Therefore the force could be between 20 and 60
grams to move a maxillary cuspid. 1 7
In discussing tooth movement, it is important to know whether the
experimental work was referring to a bodily movement or tipping motion on

46
the teeth. Work by Hixon et al. 18, suggested that with forces of 300 grams
or less, the average rate of tooth movement increases as the load per unit
area of the periodontal ligament increases. This was true whether the
tooth was being tipped or bodily moved. They also hypothesized that the
metabolic activity of the crestal bone was more responsive to pressure than
bone around the apex. It is therefore important to keep the tooth upright at
least up to the force of 300 grams to take advantage of the maximum space
available as in canine retraction. Hixon et al. 18, felt that the optimal force
could not be determined prior to treatment but, they postulated from their
work that up to three or four grams per square millimeter increases the
biologic response. But when dealing with optimum force, other problems
must be taken into consideration such as deflection of arch wires, the large
variation between patients with respect to root area, the rate of tooth
movement, and the time of beginning tooth movement. All of these factors
vary; but, in general, heavier forces produced more rapid movement than
lighter forces. There are two phases of tooth movement, the initial
mechanical displacement of tissue, which probably includes measurable
deformation of the alveolar bone as well as compression of the periodontal
ligament when forces exceed 100 grams; and a delayed metabolic response
of the connective tissue. The variation in the physiologic or biochemical
response of the tooth supporting apparatus is large. 19

47
Another study using laminographs used latex elastics for re
tracting maxillary cuspids on a 0. 016 inch round arch wire. It was sug
gested that an effective force for retracting was between 50 and 75 grams.
Cervical headgear and a transpalatal bar for posterior anchorage were used
and there was complete absence of mesial movement of the maxillary first
molar and second bicuspid. 20
Nikoli21 developed an orthodontic force theory from clinical
research based on the average optimal force being 33 grams per square
centimeter of root surface. This estimate took into account both the pres
sure side or distal root surface and the tension on the mesial root surface
during retraction. When the movement of a cuspid used this force, the
calculated optimum force for tipping a maxillary canine is 60 grams, while
210 grams is necessary for bodily movement, and 365 grams vrnuld be ideal
for crown move1nent.
In another experiment where patients had a four bicuspid extrac
tion, each quadrant had different forces placed on the cuspids for retraction.
The first quadrant had a force of two ounces (about 55 grams) as advocated
by Paulson, Reitan and Stoner. In another quadrant five ounces were used
(about 140 grams) as suggested by Storey and Smith. Eight ounces (about
225 grams) was used in the third quadrant, and the last quadrant used
about 11 ounces (about 310 grams). The results of the experiment

48
suggested that a two ounce force produced less movement than five, eight,
or eleven ounces. Space closure was the same for the five, eight, or
eleven ounce quadrants. There was no significant evidence to support the
differential force concept as presently advocated by Hixon. The relative
anchorage loss was independent of the force employed, and no significant
difference was seen among two, five, eight, and eleven ounces of force used
for retraction of cuspids with regard to tooth discomfort. 22
It is necessary to place a heavy force initially on the tooth with
elastomeric thread if an effective force is desired for a period of time.
The amount of force initially applied is of primary importance, since it
determines the force at the cellular level which, in turn, is responsible
for the tissue changed during tooth movement. 13 To understand what
happens during tooth movement when the force is applied for a long period
of time, it is important to know some of the basic features of the perio
dontium.
The fiber bundel from both the cementum and bone are individual
fibers and they meet in the center forming what is kno\vn as the intermediate
plexus. Also the fibers on the root surface are small and regularly distrib
uted where as the peripheral fibers attached to the bone are larger and are
distributed irregularly since they are separated by foramina and grooves
in the alveolus. 23

49
Another part of the periodontal ligaments are the blood vessels.
The number of blood vessels in the periodontal ligament is high considering
the ligament is principally collegen fibers. These arteries are about 21
microns in diameter and appear to be similar to any other type of artery.
The larger arteries in the area appear to pass longitudinally between the
fiber bundles peripherally, or in grooves of the alveolus itself. Therefore,
when the bundles are tensed or compressed, occlusion of these larger
arteries is avoided. 23
The form and complexity of the vessels in the periodontium indicate 1
they play an important part in protecting the tooth against sudden stress by
supporting the tooth like a hydraulic dampening device and an initial force
to the tooth is resisted by blood as it squeezes out of the alveolus or out
from one region of the ligament to another. 23
The intracellular and extracellular fluids assist as part of the
hydraulic dampening device by changing the shape of the cells and displacing
fluid from the region due to the pressure. Since the socket is extensively
perforated with foramina, there is a tendency for the fluid to be displaced
from a region of compression to a region of tension. 21
It is difficult to relate the reaction of the tissue to elastomeric
thread since the heavy force that is initially placed is soon dissipated. All
that can be done is to review what happens to the periodontium if a constant
I I

heavy force is applied and estimate how long it will take until permenent
damage is sustained to the tissue.
50
The long term effect of a relatively heavy force is our main con
cern. There is no clear evidence to show what constitutes a heavy or light
force. All that can be shown is that within a 24 hour period, structural
changes take place on the side which the tooth is being displaced by a force.
The other side of the tooth will also show change, but at a slower rate.
Experiments with rats have shown that cells in the tension side were
synthesizing DNA a few hours after elastic bands were placed between the
teeth, while nothing took place on the compression side. 23 Although,
according to Reitan24, in orthodontic movement, four or five days are
needed before tension forces stimulate bone formation.
The tension side will show osteoblastic activity with bundle bone
being laid down along the straightened collegen fiber bundles of the perio
dontial ligament. Forces ever 20 grams show a greater destruction on the
compression side due to hyalinization of cells and fibers. Compression is
eventually relieved in this region because of osteoclastic activity followed
by vascularization and cellular invasion of the necrotic tissue. Eventually
the ligament and alveolus regain their normal dimentions. 23
Bone resorption is usually divided into two periods. The first
period is during initial compression and hyalinization. The time can vary

51
from a few days up to 80 days for this initial period. The second period
starts after the hyalinized tissue has disappeared. Compression of the
periodonti.um causes the periodontal fibers to become cell free which re
sults in a cessation of the tooth movement. Hyalinization is the term used
to describe this cell free or glass like appearance of the periodontal
tissue. This condition is regarded as a nonpathologic reaction to com
pression of tissue. All teeth moved either with a continuous or intermit
tent force undergo some degree of hyalinization. 25
When a strong initial force is placed on a tooth, there is bound to
be an extensive hyalinized zone along its flat bone surface. It takes an
average of five or six days before the periodontal fibers are compressed
to the extent to produce a cessation in tooth movement. After the initial
period the hyalinization period then takes place which usually lasts two
or three weeks. 24
During formation of hyalinized zones, there is a gradual compres
sion of the periodontal fibers which leads to cells undergoing early loss of
the cytoplasm with incipient shrinkage of the nucleus. This takes place in
a few hours due to an autolytic process from various enzymes. Connective
tissue cells accumulate around the compressed area. Fibroblasts appear
soon after compression starts with macrophages appearing a little later.
Changes, such as degraded capillaries and fibrils, in the compression con-

52
nective tissue develop, but the changes vary and are largely influenced by
the duration and magnitude of force. But even after two days of compres
sion, the periodontic fibrils will remain intact with more or less their
normal cross- striations. 24
Osteoclasts form in the bone marrow spaces and adjacent areas of
the inner bone surface after a 20 to 30 hour period. The osteoclasts do not
attack the cell free area of hyalinized tissue but their chemical action
removes the organic and inorganic portions of the bone. An increase of
young connective tissue forms around the osteoclasts and in areas where
bone resorption is occurring. There is a tendency to over react by the
osteoclasts because once the resorption of bone is started, it will continue
for ten to twelve days even if no pressure is exerted. 24
If elastomeric thread is to be used for retraction of teeth, none
of the materials tested would be expected to provide an effective force for
a clinically reasonable length of time. If a 100 gram force is desired to
move a tooth for a three week period, the material which comes closest
to attaining that goal is Duraflex using an initial force of 408 grams with 96
grams remaining after three weeks. One hundred grams could probably
be attained using Powerthread but the initial force would have to be higher
than the 306 grams used. Zing String would be ineffective regardless of
the force used.

53
The initial drop in load relaxation is similar to the findings of
Bishara and Andreason11 after the first hour. However, after 24 hours the
load relaxation of the elastomeric thread projected to be approximately ten
percent higher for the elastomeric thread and about 12 percent after one
week, when compared to their findings.
Latex elastics are much closer to the optimal range desired for
tooth movement. They lose about ten percent of their initial force after
one hour, 17. 2 percent after one day, 21. 9 percent in one week and 25. 1
percent after three weeks. 11 This means that if a 100 gram force is
desired for a three week period, an initial force of 134 grams must be
applied. This brings latex elastics much closer to the optimal range for
tooth movement.
Because of the tremendous drop in force of elastomeric thread at
the start, it seem feasible for the forces to drop low enough so that little
damage will develop to the tooth. The forces will reach an optimal range
for the tooth movement to take place. From the work done on heavy ortho
dontic forces, relatively little harm will take place to the tooth for the
first two or three days due to heavy forces. By this time, the elastomeric
thread will reach a slowly decreasing force of only a few grams each week,
and the force should be down to a range easily tolerated by the tooth and
periodontium. Another factor that may help protect the tooth is that if

54
elastomeric thread is used in retracting teeth, it is accomplished by
slidding the tooth down a straight arch wire where part of the force is used
up in the friction that takes place between the brackets on the tooth, the
arch wire, and the elastomeric thread.
Even though the elastomeric threads are basically the same
material, there is considerable variation among the ones available to us on
the market. Because of this it is important to know the properties of these
materials so that the greatest advantage can be taken of them. Williams 25
in his book about stress relaxation of polymers states that "no real
material completely obeys the assumption exactly. But materials can be
described correctly with quite a limited representation of their behavior
is provided. 11 If the initial force is measured on the elastomeric thread,
we can predict with a certain degree of confidence the force left in the
material after a three or four week period. This would help us tremen-
.dously to get the maximum benefit out of the elastomeric thread and yet
cause a minimum amount of damage to the tooth and the periodontium.
CHAPTER VI
SUMMARY
Elastopolymeric thread was introduced to orthodontics a few years
ago. It has been used various ways to move teeth and has become quite
popular because of its physical properties and its effectiveness at moving
teeth.
This investigation studied the ultimate tensile strength and stress
relaxation of three elastomers and compared the differences among them.
The results of the data for each elastomer tested suggests that it is possible
to predis:t, with a certain degree of accuracy, how these materials will
react over a long period of time. With this ability the maximum potential
of the elastopolymer that is compatible with optimal forces on the tooth
may be more closely attained. Further study in this area is definitely
warrented so that the mechanical properties may better be understood and
that this orthodontic appliance may better be handled by the clinician.
55

BIBLIOG HA PHY
56
BIBLIOGRAPHY
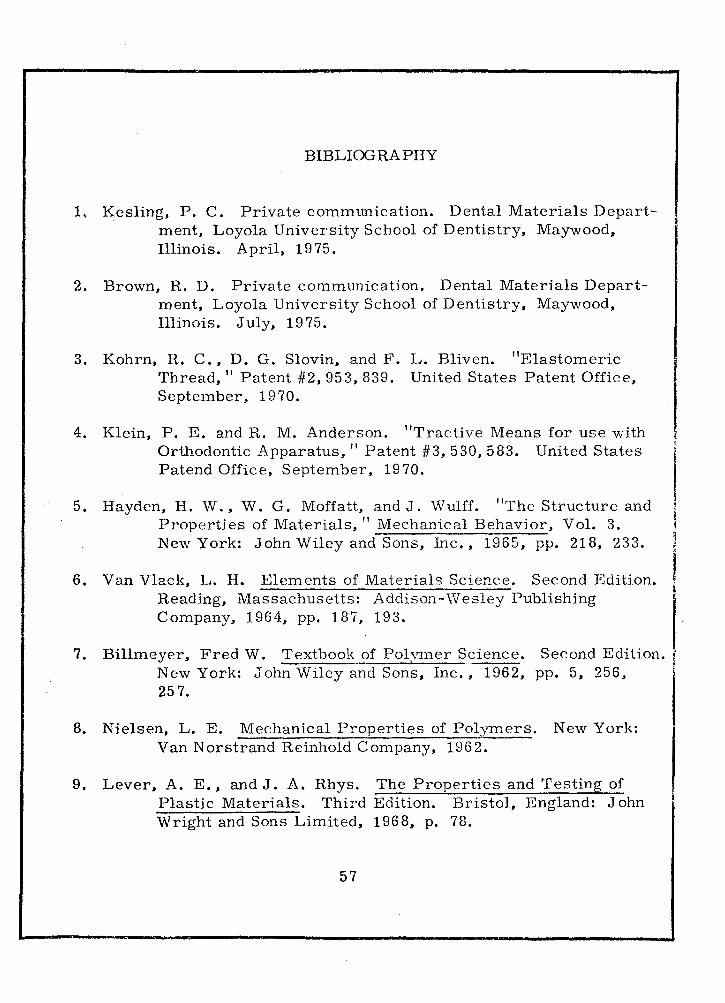
1. Kesling, P. C. Private communication. Dental Materials Department, Loyola University School of Dentistry, Maywood, Illinois. April, 19 75.
2. Brown, R. D. Private communication. Dental Materials Department, Loyola University School of Dentistry, Maywood, Illinois. July, 19 75.
3. Kohrn, R. C., D. G. Slovin, and F. L. Bliven. "Elastomeric Thread," Patent #2, 953, 839. United States Patent Office, September, 1970.
4. Klein, P. E. and R. M. Anderson. "Tractive Means for use with Orthodontic Apparatus, 11 Patent #3, 530, 583. United States Patend Office, September, 1970.
5. Hayden, H. W., W. G. Moffatt, and J. Wulff. "The Structure and Properties of Materials, 11 Mechanical Behavior, Vol. 3. New York: John Wiley and Sons, Inc., 1965, pp. 218, 233.
6. Van Vlack, L. H. Elements of Materials Science. Second Edition. Reading, Massachusetts: Addison-\Vesley Publishing Company, 1964, pp. 187, 193 .
. 7. Billmeyer, Fred W. Textbook ~f Poh'1ner Science. Second Edition. l New York: John Wiley and Sons, Inc., 1962, pp. 5, 256, · 25 7.
8. Nielsen, L. E. Mechanical Properties of Polymers. New York: Van Norstrand Reinhold Company, 1962.
9. Lever, A. E., and J. A. Rhys. The Properties and Testing of Plastic Materials. Third Edition. Bristol, England: John Wright and Sons Limited, 1968, p. 78.
57

10. Andreasen, G. F. and S. E. Bishara. "Comparison of Alastic Chains with Elastics Involved with Intra-arch Molar to Molar Forces," Angle Orthod., 40:151-158, 1970.
11. Bishara, S. E. and G. F. Andreasen. "A Comparison of Time Related Forces Between Plastic Alastiks and Latex Elastics," Angle Orthod., 40:319-328, 1970.
58
12. Hershey, H. G. and W. G. Reynolds. "The Plastic Module and an Orthodontic Tooth-moving Mechanism, 11 American Journal of Orthodontics, 67:554-562, 1975.
13. Thurow, Raymond C. Edgewise Orthodontics. Saint Louis: The C. V. Mosby Company, 1972, Chapters 8, 10, and 11.
14. Burstone, C. "Application of Bioengineering to Clinical Orthodontics," Current Orthodontic Concepts and Techniques. Second Edition. T. M. Graber and B. F. Swain, editors. Philadelphia: W. B. Saunders Company, 1975, p. 240.
15. Jarabak, J. R. and J. A. Fizzell. Technique and Treatment with Light Wire Edgewise Appliances. Second Edition. Saint Louis: The C. V. Mosby Company, 1972, pp. 352-353.
16. Schwartz, A. M. "uber die Bewegung belastetor Zahne," ~ Stomat, 26:350, 1928.
17. Stoller, A. E. The Universal Appliance. Saint Louis: The C. V. MosbyCompany, 1971, pp. 10-11.
18. Hixon, E. H., I-I. Atikian, G. E. McDonald, and R. J. Tracy. "Optimal Force, Differential Force, and Anchorage, " American Journal of Orthodontics, 55:437-457, 1969.
19. Hixon, E. H., T. 0. Aasen, J. Aranzo, R. A. Clark, R. Klosterman, S. S. Miller, and W. M. Odom. "On Force and Tooth Movement," American Journal of Orthodontics, 57: 476-489, 19 70.
20. Paulson, R. C., T. M. Speidel, and R. J. Isaacson. "Cuspid Retraction verses Molar Anchorage, " Angle Orthod. 40:20-27, 1970.

59
21. Nikolai, R. J. "On Optimum Orthodontic Force Theory as Applied to Canine Retraction, 11 American Journal of Orthodontics, 68:290-302, 1975.
22. Boester, C. H. and L. E. Johnston. 11A Clinical Investigation of the Concepts of Differential and Optimal Force in Canine Retraction, 11 Angle Orthod., 44:113-119, 1974.
23. Picton, D. C. A. "The Effect of External Forces on the Periodontium, 11 Biology of the Periodontium. A. H. Melcher and W. H. Bowen, Editors. New York: Academic Press, 1969, pp. 376-416.
24. Reitan, K. "Biomechanical Principles and Reactions," Current Orthodontic Concepts and Techniques. Second Edition. T. M. Graber and B. F. Swain, Editors. Philadelphia: W. B. Saunders Company, 1975, Chapter 2.
25. Reitan, K. "Tissue Changes in Orthodontic Tooth Movement, JI
Orthodontics in Daily Practice. J. A. Salzmann. Philadelphia, 1974, Chapter 35.
26. Williams, J. G. Stress Analysis of Polymers. New York: John Wiley and Sons, 1972, p. 43.

APPROVAL SHEET
The thesis submitted by Robert Theodore Bergman has been read
and approved by the following Committee:
Dr. James L. Sandrik, Director Assistant Professor, Dental Materials, Loyola
Mrs. Marie Feng Assistant Professor, Dental Materials, Loyola
Dr. Milton L. Braun Professor, Orthodontics, Loyola
The final copies have been examined by the director of the thesis
and the signature which appears below verifies the fact that any necessary
changes have been incorporated and that the thesis is nov.r given final
approval by the Committee with reference to content and form.
The thesis is therefore accepted in partial fulfillment of the
requirements for the degree of Master of Science.
Date 7 ) Signature of Director