Embed Size (px)
Citation preview
ELSEVlER PII:SO958-9465(96)00011-X
Cement and Concrete Composites 18 (1996) 141-151 0 1996 Elsevier Science Limited
Printed in Great Britain. All rights reserved 0958-9465/96/$15.00
Stress Analysis of a Fracture Test Specimen for Cementitious Materials
B. B. Sabir” & M. Asili
Department of Civil Engineering and Building, The University of Glamorgan, Pontypridd, Mid Glamorgan CF37 lDL, UK
(Received 24 July 1995; accepted 9 February 1996)
Abstract
Stress analysis of a compact compression speci- men used for the determination of the fracture toughness of cementitious materials is cam’ed out by the finite element method. The specimen, which is based on 100 mm cubes, contains two notches on opposite faces. It is found that the geometry and loading result in large tensile stresses at the root of the notch remote from the load. These stresses are sujjicient to propagate the crack in the opening mode of fracture thus enabling the fracture toughness of the material to be deter- mined. The fracture toughness is evaluated from the failure load and the stress intensity factor computed from the finite element results. Several finite element mesh refinements were employed and accurate estimates of the stress intensity factor were obtained by modelling the specimen by a relatively small number of elements. The accu- racy of the results was largely independent of the evaluation method which included displacement extrapolation, conic section simulation, strain energy release rate and the J-integral. Whereas the stress intensity factor varied with the notch size, the tests conducted in the present work did not show significant variation in the j?acture tough- ness.
Keywords: Concrete, fracture testing, compact compression geometry, isoparametric finite ele- ments, stress distribution, compliance, fracture toughness.
*Author to whom all correspondence should be addressed.
NOTATION
a
b
: ds E G K KC P r,o
T t u ux,uy
u W “,Y &,~yY,Cq
V
crack size in tension zone, semi-minor axis of an elliptic surface semi-major axis of an elliptic surface crack size in compression zone specimen width element of an arc length elasticity modulus rigidity modulus stress intensity factor fracture toughness eccentric compressive load polar coordinate system with origin at crack tip in tension zone traction vector specimen thickness in-plane displacement vector in-plane displacements in x- and y- directions strain energy strain energy density rectangular coordinate system direct and shear stresses Poisson’s ratio
INTRODUCTION
The validity of applying linear elastic fracture mechanics (LEFM) theory to cementitious materials has been a subject of study by many research workers in this field. The controversy over this subject is largely due to the hetero- geneous nature of the material and the
141
142 B. B. Sabil; M. Asili
microcracking that takes place in the matrix particularly in the immediate vicinity ahead of the crack tip. Hillerborg et al.l accounted for the microcracking using a fictitious crack model in which the pre-crack length is augmented by the size of the crack nucleation zone. Other workers2-’ used the model to represent a generalised non-yielding stress-strain behaviour for concrete. Another problem associated with the evaluation of the fracture toughness of cementitious materials is that related to the size of the test specimen. 5,6 The way to overcome this problem is to test large specimens and these concerns have led to the recommenda- tion7 for the use of beams tested in bending. This recommendation has been the subject of many investigations, for example the work reported in Refs 8-10 and there are currently two proposals, i.e. the size-effect law” and the two parameter model12 for the evaluation of the fracture toughness of concrete from notched beams in three-point bending. These test pro- posals suffer the disadvantage that they employ large test specimens (100 x 100 x 840 mm), par- ticularly in relation to the length of untracked ligament (50 mm), and are not suitable in prac- tice.
Modified 100 mm cube specimens which do not suffer from the above problems have been used13 to evaluate the fracture toughness and fracture energy of concrete. The test is based on the compact compression specimen14 which was shown to yield fracture toughness values that are independent of the size of the specimen and crack length. The testing arrangement employed gives linear load-displacement response resulting in sudden and unstable failure and, therefore, slow crack growth is not considered to be a problem. This paper presents the results of a detailed analysis of the test geo- metry which was carried out by the finite element method. The stress distribution con- firmed the existence of large tensile stresses at the root of the notch in the tension zone which are responsible for the crack propagation evident during testing. A series of tests was con- ducted on modified concrete cubes and the fracture toughness of the concrete was evalu- ated through the stress intensity factor, from the results of the finite element analysis. The stress intensity factor was evaluated by direct and energy methods. In the direct approach, the displacements of the free crack surfaces were correlated with the classical solutions whereas
the energy methods utilised the results for the strains and other displacement derivatives throughout the body. In the majority of the tests, failure occured in the opening mode of fracture at the root of the notch remote from the loading. It is found that the fracture tough- ness is largely unaffected by the size of the pre-notch. In few of the tests, with small pre- notches, failure took place in a shear mode and it is recommended that such sizes are to be avoided.
SPECIMEN GEOMETRY
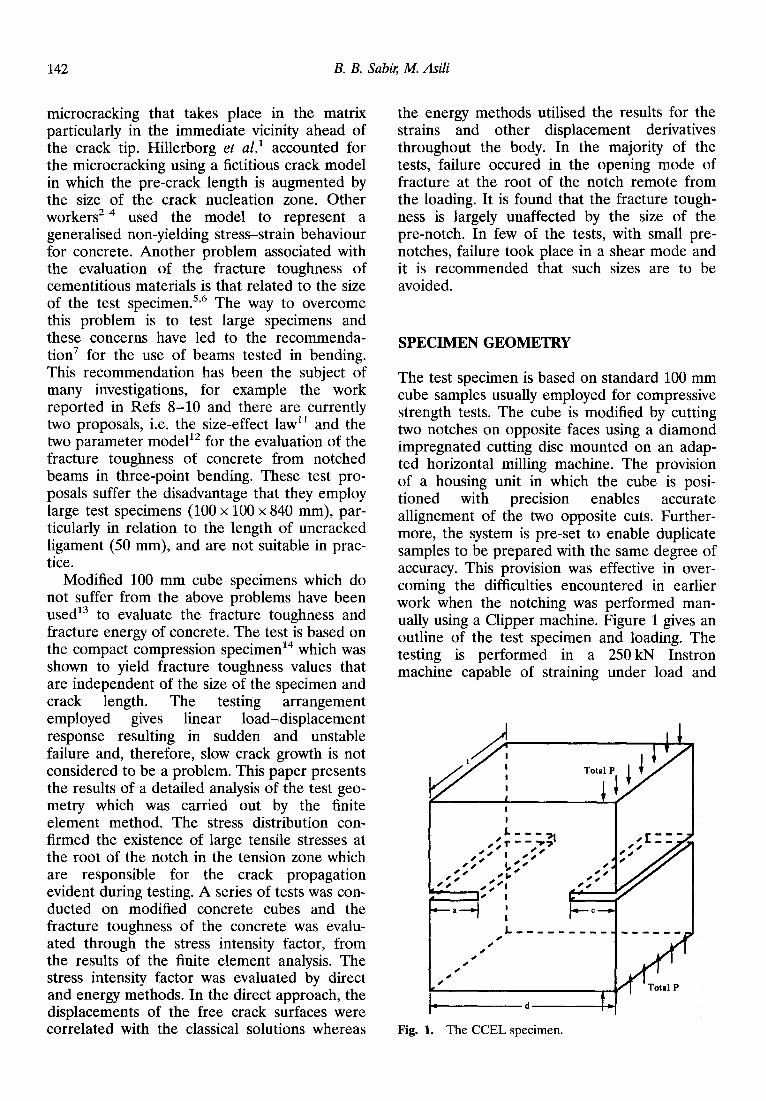
The test specimen is based on standard 100 mm cube samples usually employed for compressive strength tests. The cube is modified by cutting two notches on opposite faces using a diamond impregnated cutting disc mounted on an adap- ted horizontal milling machine. The provision of a housing unit in which the cube is posi- tioned with precision enables accurate allignement of the two opposite cuts. Further- more, the system is pre-set to enable duplicate samples to be prepared with the same degree of accuracy. This provision was effective in over- coming the difficulties encountered in earlier work when the notching was performed man- ually using a Clipper machine. Figure 1 gives an outline of the test specimen and loading. The testing is performed in a 250 kN Instron machine capable of straining under load and
I 1 t P I
I
/
I
I
I
I ““71 ,;r-‘V7
‘0 I ,;’ ‘0 0)
)0 L” @0 l k’
He ;-- y’;
-
---------~ ,
, ,
, ,
CL*
Fig. 1. The CCEL specimen.

Stress analysis of a fracture lest specimen 143
displacement control. In the present work the straining is carried out in the displacement mode at a rate of 0.4 mm/min which is close to the RILEM recommended speed of 0.3 mm/ min. Under the load, the specimen fails by crack propagation from the root of the notch in the tensile zone remote from the loading. Due to its compact nature and the configuration of the load, the test specimen is referred to as the compact compression eccentrically loaded (CCEL) specimen.
FINITE ELEMENT ANALYSIS
The finite element method was used to analyse the geometry shown in Fig. 1 for a range of values of a/d and c/d ratios. This was done by means of six-noded triangular or eight-noded quadrilateral isoparametric elements. Earlier work14 using constant strain triangular finite elements necessitated the adoption of very fine mesh idealisations in order to obtain accurate estimates of the stress intensity factor. Further- more, the constant strain triangles were not capable of producing sufficiently accurate results for the strains and other displacement derivatives, which are required for the evalu- ation of the stress intensity factor by the energy approaches adopted in the present work. The use of isoparametric elements is preferred not only because considerably coarser meshes can be employed, but also the accuracy for the dis- placements and their derivatives is maintained throughout the body. In the work reported in this paper the crack tip in the tensile zone is surrounded by triangular elements in which the mid-side nodes were moved to the quarter points. This modification ensures the appro- priate singularity type at the crack tip associated with LEFM.
All the geometries were analysed under plane strain conditions with Young’s modulus E = 30 kN/mm2 and Poisson’s ratio v = 0.2. It was observed that as the test proceeded the load was concentrated at the inner edge of the load- ing bar and hence in the analysis the load was applied on a line 6 mm from the edge of the specimen. Owing to symmetry only one half of the specimen as shown in Fig. 2 was analysed. The symmetry conditions were imposed by restraining the nodes along the untracked liga- ment (y=O) in the y-direction. In addition an arbitrary point was restrained in the x-direction
Y P
t 6mm
T -I I-
Fig. 2. The half-specimen analysed.
in order to ensure stability and facilitate a solu- tion.
Idealisation of the specimen geometry The half specimen shown in Fig. 2 was idealised in several ways using the triangular and quadri- lateral elements described above. The finite element representations are described below.
TRIANGULAR ELEMENTS
The half-specimen was initially divided into IO blocks as shown in Fig. 3 with each block being automatically subdivided into triangular ele- ments. In the idealisations the area in the vicinity of the crack tip in the tension zone was represented by a relatively fine mesh of ele- ments. The use of element blocks, a facility often provided in commercial finite element packages, not only reduces the amount of data required to generate the finite element mesh, but also provides a facility for implementing dif-
Fig. 3. Element blocks used in analysing half the speci- men. All dimensions are in mm.

144 B. B. Sabil; M. Asili
ferent element sub-divisions for convergence studies. Using this approach two meshes were generated, a coarse mesh with 220 elements and 952 degrees of freedom (d.o.f.) and a fine mesh with 880 elements and 3664 d.o.f. Figure 4 gives the deformed configuration and the details of the coarse element idealisation adopted for half the specimen.
QUADRILATERAL ELEMENTS
Two geometrically different meshes were employed to analyse the half-specimen using quadrilateral elements, with the exception of the elements enclosing the crack tip in the ten- sion zone which were of the singular triangular type. In the first the crack geometry was repre- sented by a ‘fan’ arrangement of elements centred around the crack tip as shown in Fig. 5. This idealisation results in a relatively coarse mesh having 44 elements and 326 d.o.f. In order to facilitate the use of this mesh for analysis of several geometries with varying notch depths, both crack tips were enclosed by 5 mm square elements, which were surrounded by progres- sively larger elements arranged in a fan-like pattern. While such an approach ensures some control over the number of elements employed and the choice of element sizes throughout the geometry, it places a considerable restriction on
the mesh topology particularly when automatic mesh generation schemes are to be employed. Nevertheless, it was possible to use this con- figuration to analyse specimens with the cracks in the tension and compression zones ranging between 25 and 40 mm.
In the second type, an arrangement of regu- lar rectangular elements such as that, for a = c = 30 mm, shown in Fig. 6 was employed. This mesh was progressively refined in size as the elements approached the crack tip in the tension zone. In this idealisation the half-speci- men is modelled with 55 elements with a total of 396 d.o.f. This idealisation was implemented by the use of an automatic mesh generation scheme which was incorporated into the finite element program. In this way the data prepara- tion work was greatly reduced over that required for generating the ‘fan’ mesh described in the previous section. This mesh formed the basis of a detailed convergence study which is reported in Ref. 15. Although this type of ele- ment topology offers little control over the choice of element numbers and sizes, this did not prove to be disadvantageous as accurate estimates for the stress intensity factor could be obtained using relatively coarse meshes. This was particularly true when using energy evalu- ation methods, such as the strain energy release rate or the J-integral, which do not rely on raw data for points near the crack tip.
Crack Tips
Fig. 4. Deformed finite element mesh under eccentric compressive load - 220 triangular elements (952 degrees of freedom).

Stress analysis of a fracture test specimen 145
STRESS DISTRIBUTION
The main objective of investigating the geo- metry under consideration is to produce a suitable test for assessing the fracture toughness of cementitious materials. This will depend on whether sufficiently large tensile stresses are developed at the root of the notch remote from the loading. This condition will be largely influ- enced by the size of the notches (a and c) introduced into the cube samples. Although in the majority of the tests carried out in this study the specimens failed in the opening mode of fracture, it was thought necessary to confirm the existence of such stresses by numerical analysis.
The oy stress contours (tension positive) in the half-specimen obtained from the fine mesh analysis for the CCEL specimen with a = c = 30 mm are shown in Fig. 7. It can be seen that large tensile stresses are present in the vicinity of the crack tip in the tension zone. Compressive stresses of similar order of magni- tudes are present near the crack tip in the compression zone.
The variations of aY and gxy along the line containing the pre-notches are shown in Fig. 8. These results demonstrate the rapid increase in the o,, stress as the crack tips are approached. Figure 8 also shows that, except for small values near the crack tips, the shear stress oq is non- existent. The absence of G+, along the untracked ligament area confirms that the frac-
/ /
1
Tension crack tip Compression crack tip / / Tension crack tip Compression crack tip
Fig. 5. Finite element mesh for the half-specimen - 44 Fig. 6. Finite element mesh for the half-specimen - 5.5 quadrilateral elements (326 degrees of freedom). rectangular elements (396 degrees of freedom).
-\
Crack Tips
.0.85
Fig. 7. Contours of ay (N/mm* x 10w3) for unit applied load - a = c = 30 mm.

146 B. B. Sabil; M. Asili
-7 4: K
“E E
g
1.5
1.0
0.5
0
-0.5
-1.0
-1.5
-2.0
-2.5
-3.0
-3.5 I
I
30mm _I_ 40 mm uncrrcked ligament notch I
Fig. 8. Distribution of q, and uxy (N/mm2 x 10e3) along the crack plane.
ture process is predominantly in the opening mode, which is evidenced in the actual test. On examination of the results for the stresses it is found that the ratio of the maximum compres- sive stress (by = -3.60 x low3 N/mm*) under the loading bar to the maximum tensile stress
(% = 1.45 x 10m3 N/mm*) near the crack tip in the tension zone is 2.5. The corresponding principal stress ratio is 2.4. These are approxi- mately one order of magnitude less than the ratio of the ultimate compressive and tensile strengths of concrete. These conditions demon- strate that, for specimens with a = c = 30 mm, failure takes place in the tensile mode rather than by crushing of the concrete.
Examination of the stress distribution for the range of specimen geometries studied revealed that the above stress ratio, i.e. the ratio of the compressive stress under the loading bar to the tensile stress near the root of the notch remote from the loading varied between 2.9 (for a = c = 20 mm) to 2.2 (for a = c = 40 mm). For both classes of problems (symmetrically and unsymmetrically notched specimens) the stress ratio decreased as either a or c or both decreased. This was to be expected as for a fixed position of the eccentric load, the bending stress component increases with decreasing liga- ment length available for crack propogation.
STRESS INTENSITY FACTORS
Several methods are available for the determi- nation of the stress intensity factor K from the finite element results. The displacement extrap- olation and the conic section simulation
methods are based on the displacements (uy) of the free surface of the crack normal to the plane containing the crack. The J-integral, how- ever, is an energy quantity based on displacement derivatives evaluated along a path surrounding the crack tip. The procedures involved in applying these methods for calculat- ing K are discussed in detail elsewhere16 and only the resulting relationships (for plane strain conditions) are given below. All symbols are defined in the Notations.
Displacement extrapolation (DE)
where
f(v,e) = 4-4v-2~0s’;
Conic section simulation (CSS)
K= bE&
2a(l -v”)
(1)
(2)
J-integral:
du Wdy-TzdS (3)
Strain energy release rate (SERR) If 6U is the strain energy release associated with a crack of length a advancing by an incremental amount 6a, then the elastic strain energy release rate (SERR) (per unit crack extension) is &Y/da. In the present work the SERR per unit crack extension is evaluated as the energy difference obtained from finite element analyses performed on two geometries with incremen- tally different crack lengths. Using LEFM the stress intensity factor K is related to the SERR
bY E 6U
K2= (l-v2) 6a (4)
Stress analysis of a fracture test specimen 147
Table 1. Stress intensity factor K for different mesh idealisations: CCEL problem of Fig. 2
Degrees of freedom
K (me312) (per unit load P)
326(fan mesh) 270 396 546 720
DE css SERR J-integral
114.3 109.0 125.3 126.6 118.0 116.6 121.0 113.8 121.2 119.4 122.4 117.4 122.0 120.7 122.3 118.6 122.2 121.8 120.5 119.3
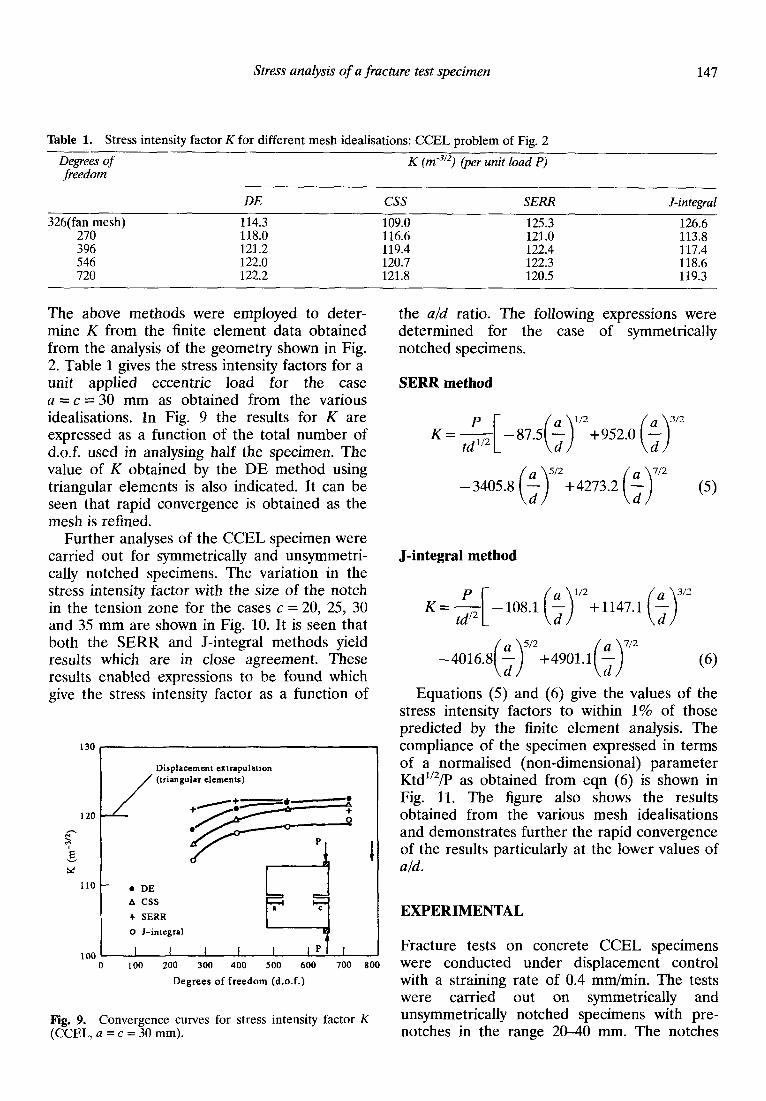
The above methods were employed to deter- mine K from the finite element data obtained from the analysis of the geometry shown in Fig. 2. Table 1 gives the stress intensity factors for a unit applied eccentric load for the case a = c = 30 mm as obtained from the various idealisations. In Fig. 9 the results for K are expressed as a function of the total number of d.o.f. used in analysing half the specimen. The value of K obtained by the DE method using triangular elements is also indicated. It can be seen that rapid convergence is obtained as the mesh is refined.
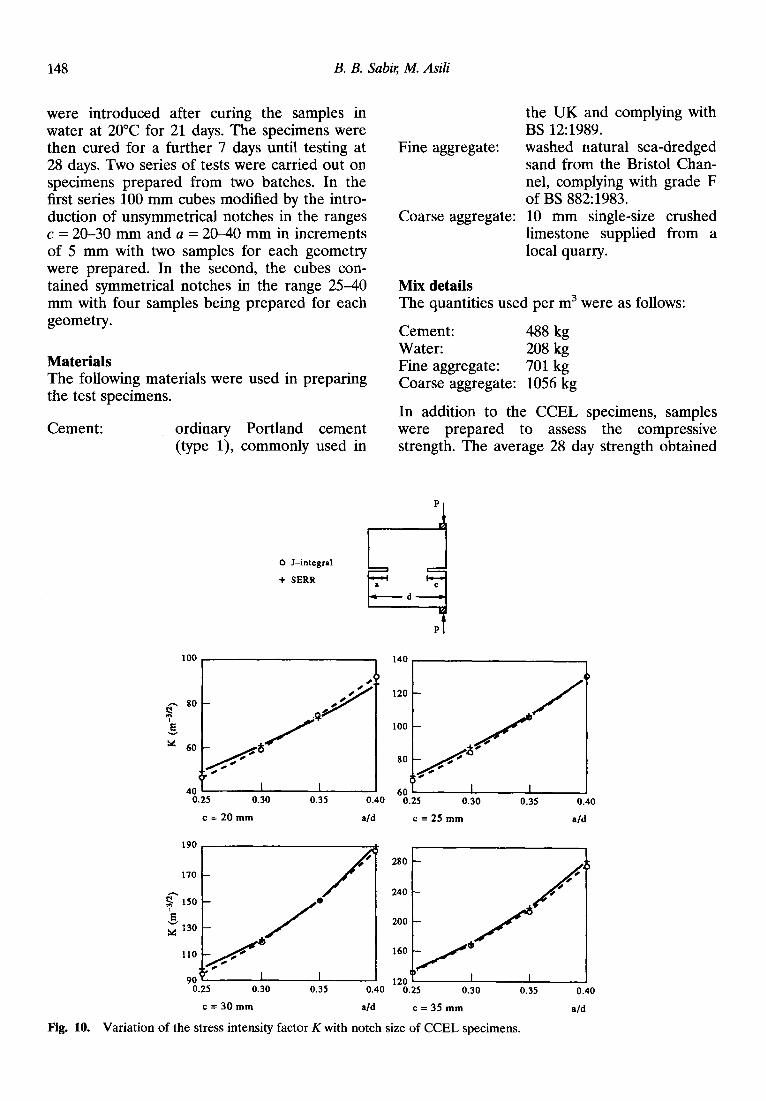
Further analyses of the CCEL specimen were carried out for symmetrically and unsymmetri- cally notched specimens. The variation in the stress intensity factor with the size of the notch in the tension zone for the cases c = 20, 25, 30 and 35 mm are shown in Fig. 10. It is seen that both the SERR and J-integral methods yield results which are in close agreement. These results enabled expressions to be found which give the stress intensity factor as a function of
130
Displacement extrapulation / (triangular elements)
120
c 7
g b+
110 . DE
A CSS
+ SERR
0 J-integral
100 I I I 0 100 200 300 400 500 600 700 800
Degrees of freedom (d.o.f.)
Fig. 9. Convergence curves for stress intensity factor K (CCEL, a = c = 30 mm).
the a/d ratio. The following expressions were determined for the case of symmetrically notched specimens.
SERR method
K = -&[ -8%5($‘+952.0 ($
-3405.8 (;7+4273.2 (;y (5)
J-integral method
K= -$[ -108.1 (;y+ll47.1 (;r
-4016.8(~)50f1901.1(;~ (6)
Equations (5) and (6) give the values of the stress intensity factors to within 1% of those predicted by the finite element analysis. The compliance of the specimen expressed in terms of a normalised (non-dimensional) parameter Ktd1’2/P as obtained from eqn (6) is shown in Fig. 11. The figure also shows the results obtained from the various mesh idealisations and demonstrates further the rapid convergence of the results particularly at the lower values of a/d.
EXPERIMENTAL
Fracture tests on concrete CCEL specimens were conducted under displacement control with a straining rate of 0.4 mm/min. The tests were carried out on symmetrically and unsymmetrically notched specimens with pre- notches in the range 20-40 mm. The notches
148 B. B. Sub& M. Asili
were introduced after curing the samples in water at 20°C for 21 days. The specimens were then cured for a further 7 days until testing at 28 days. Two series of tests were carried out on specimens prepared from two batches. In the first series 100 mm cubes modified by the intro- duction of unsymmetrical notches in the ranges c = 20-30 mm and a = 20-40 mm in increments of 5 mm with two samples for each geometry were prepared. In the second, the cubes con- tained symmetrical notches in the range 25-40 mm with four samples being prepared for each geometry.
Materials The following materials were used in preparing the test specimens.
Cement: ordinary Portland cement (type l), commonly used in
Fine aggregate:
Coarse aggregate:
the UK and complying with BS 12:1989. washed natural sea-dredged sand from the Bristol Chan- nel, complying with grade F of BS 8821983. 10 mm single-size crushed limestone supplied from a local quarry.
Mix details The quantities used per m3 were as follows:
Cement: 488 kg Water: 208 kg Fine aggregate: 701 kg Coarse aggregate: 1056 kg
In addition to the CCEL specimens, samples were prepared to assess the compressive strength. The average 28 day strength obtained
0 J-integral
+ SERR
5.2:
80
-I 60 L I I
5 0.30 0.35 0.40 0.25 0.30 0.35 0.40
c=20mm c=25mm a/d
c=30mm a/d c=35mm a/d
Fig. 10. Variation of the stress intensity factor K with notch size of CCEL specimens.

Stress analysis of a fracture test specimen 149
from three 100 mm cubes for the two batches were 54.2 and 50.7 N/mm*.
Fracture toughness
failure will also be influenced by the grade of concrete (compressive strength) which is not considered to be a contributory factor in the present work.
The first batch of tests involved 28 cubes modi- In the majority of tests the CCEL specimen fied with un-symmetrical notches. Some of the failed by fracturing from the root of the notch specimens with small notch depths failed by in the tension zone. The failure was sudden and shearing under the applied load. The shear line extended along the plane containing the not- extended from the loading point to the tip of ches. In all the tests, following a brief and small the notch in the compression zone. This type of non-linearity due to the bedding-in of the load- failure is avoided if higher tensile stress levels ing bars, the load-displacement relationships are developed within the specimen by introduc- were linear and it is considered reasonable to ing sufficiently deep notches. The mode of assume linear elastic conditions.
12
4
2
A 270 d.o.f.
+ 396 d.o.f.
O/ 0.10 0.15 0.20 0.25 0.30 0.35 0.40 0.45
a/d
Fig. 11. Variation of stress intensity factor K for sym- metrically loaded CCEL specimens.
The fracture toughness values obtained by multiplying the stress intensity factor (per unit load) by the average load at failure are shown in Table 2. Statistical analysis on the results revealed that the maximum coefficient of varia- tion between the results of each group is 2.2% and that based on all 14 results is 1.1%.
The results of the first batch of tests revealed that there is no advantage to be gained by employing unsymmetrical notches and in the second batch only symmetrical notches were employed with four specimens being prepared for each geometry. In all, 16 fracture tests were conducted on specimens having notches ranging from 25 to 40 mm. All the specimens failed in the opening mode of fracture described above and the results are shown in Table 3. The maxi- mum coefficient of variation for the failure loads is 5.4% and occurs in the case of the specimens pre-notched with 40 mm notches. The average fracture toughness for this series is
Table 2. Fracture toughness K, for un-symmetrically notched CCEL specimens
Notch depth Average failure Stress intensi 3x
(mm) load (kN) factor K (m- ) Fracture toughness
KC (MN/m”‘)
C
20
25
30
a
2.5 30 35 40
20
::, 35 40
20 25 30 35 40
19.06* 46.8 0.89 15.06* 59.1 0.89 11.49 74.0 0.85 8.18 91.6 0.75
14.02 46.7 0.65
12.21 11.05 67.1 84.3 0.82 0.93 9.82 105.3 1.03 7.27 130.6 0.95
12.71 80.3 1.02 10.19 94.8 0.97 8.05 119.3 0.96 6.41 142.6 0.91 4.63 188.0 0.87
*One sample failed in shear.

150 B. B. Sub& M. Asili
Table 3. Fracture toughness K, for symmetrically notched specimens
Notch depth Failure load Coefficient of (mm) WV variation (Yo)
25 13.25 13.19 0.2 13.14 13.19 13.19
30 7.47 7.49 2.9 7.33 7.67
35 3.87 4.01 1.7 4.01 3.99 4.19
40 2.26 1.94 5.4 1.79 1.95 1.75
Stress intensi 32 factor K (m- )
67.1
119.3
215.2
435.3
Fracture toughness K, (MNlm3’2)
0.89
0.89
0.86
0.84
0.87 MN/m3’2 with a coefficient of variation less than 0.1% and a standard deviation 2.4%.
CONCLUSIONS
of of
Stress analysis of the CCEL specimen con- firmed that for all the geometries considered large tensile stresses prevailed in the vicinity of the crack tip in the tension zone. In the major- ity of the laboratory tests, these stresses resulted in unstable propagation of the crack which led to splitting of the specimen into halves. The absence of shearing stresses along the plane containing the pre-cracks confirmed that the fracture failure is predominantly in the opening mode.
The finite element analysis demonstrated that accurate estimates of the stress intensity factor can be obtained using a relatively small number of elements. Furthermore, the accuracy of the finite element solution was maintained for all the methods employed in evaluating the stress intensity factor. Amongst these methods, and in view of the data processing required, it is con- sidered that the direct energy methods are more convenient. These approaches, i.e. strain anergy release rate and J-integral, were used to develop compliance relationships which give the stress intensity factor to an accuracy of 1%.
Some of the CCEL specimens failed by shear under the loading bar. This mode of failure was confined to specimens with shallow notches (20-25 mm) and is attributed to the hetero- geneous nature of concrete and to stress
concentrations under the loading bar. To avoid shear failure the level of the tensile stress in the vicinity of the crack tip in the tension zone must be sufficiently high in relation to the compres- sive strength of the concrete. Whereas these conditions can be ensured by employing deep notches it is important to have a sufficiently long ligament available for crack propagation, the size of which will depend on the maximum aggregate size employed. With respect to this, it is interesting to note that the failure loads for the 40 mm symmetrically notched specimens (20 mm ligament length) had a coefficient of variation which was significantly higher than those for the shallower notches. Further work needs to be carried out in this area and it is concluded that for the concrete used in this study notches in the range 25-35 mm are the most appropriate. The study also demonstrated that there is no advantage to be gained in using unsymmetrical notches.
REFERENCES
A. Hillerborg, M. Modeer & P.E. Petersson, Analysis of crack formation and crack growth in concrete by means of fracture mechanics and finite elements. Cement and Concrete Research, 6 (1976) 773-82. Bazant, Z. P. & Oh, B. H., Concrete fracture via stress- strain relations, Centre for Concrete and Geomaterials, Northwestern University, USA, 1981, report 81-10/665c. Magge, M. & Hammer, T. A., Mod&en portlandse- ment delrapport 3 fasthetsutvikling og E-modulus, Norwegian Institute of Technology, Trondheim, report STF65 A85041. R.L. Carrasquillo et al., Properties of high strength concrete subjected to short-term loads. Journal of the Concrete Institute, 78 (3) (1981) 171-8.

Stress analysis of a fracture test specimen 151
5. S. Mindess, The effect of specimen size on the frac- ture energy of concrete. Cement and Concrete Research, 14 (3) (1984) 431-6.
6. P. Nallathambi et al., Effect of specimen and crack sizes, water/cement ratio and coarse aggregate texture upon fracture toughness of concrete. Magazine of Concrete Research, 36 (129) (1984) 227-36.
7. RILEM Technical Committee 50-FMC, Draft recom- mendation: Determination of fracture energy of mortar and concrete by means of three-point bend tests on notched beams. Materials and Structures, 18 (1985) 287-290.
8. A. Hilierborg, Results of three comparative test series for determining the fracture energy of concrete. Muteri& and Structures, 18 (107) (1992) 407-12.
9. G.V. Guinea, J. Planas & M. Elites, Measurement of the fracture energy using three-point bend tests. Materials and Structures, 25 (148) (1992) 212-218.
10. X.Z. Hu & F.H. Wittmann, Fracture energy and frac- ture process zone. Materials and Structures, 25 (1992) 319-26.
11. Draft RILEM Recommendation Size-effect method for determining fracture energy and process zone size of concrete. Materials and Structures, 23 (123) (1990) 461-465.
12. Draft RILEM Recommendation, Determination of fracture parameters of plain concrete using three- lx&L4Erid tests. Materials and Structures, 23 (1990)
13. B.B. Sal&, Fracture energy and fracture toughness of concrete. Magazine of Concrete Research, 46 (169) (1994) 235-241.
14. B.I.G. Barr & B.B. Sabir, Fracture toughness testing by means of the compact compression specimen. Magazine of Concrete Research, 37 (131) (1985) 88-94.
15. B.B. Sabir, The performance of isoparametric finite elements in stress intensity factor determination. International Journal of Fracture, 72 (3) (1995) 259-275.
16. B.B. Sabir, The use of compression splitting tests in evaluating the fracture toughness of concrete. Cement and Concrete Composites, 16 (1994) 83-91.