Embed Size (px)
Citation preview

1
STRENGTHENING OF HIGH STRENGTH REINFORCED
CONCRETE SLABS WITH CFRP LAMINATES
by
Hasan Saleh Mahmoud
A Thesis Presented to the Faculty of the
American University of Sharjah
College of Engineering
in Partial Fulfillment
of the Requirements
for the Degree of
Master of Science in
Civil Engineering
Sharjah, United Arab Emirates
May 2016

2
© 2016 Hasan Saleh Mahmoud. All rights reserved.

3
Approval Signatures
We, the undersigned, approve the Master’s Thesis of Hasan Saleh Mahmoud
Thesis Title: Strengthening of High Strength Reinforced Concrete Slabs with CFRP
Laminates
Signature Date of Signature
(dd/mm/yyyy)
___________________________ _______________
Dr. Rami Hawileh
Associate Professor, Department of Civil Engineering
Thesis Advisor
___________________________ _______________
Dr. Jamal El-Din Abdalla
Professor, Department of Civil Engineering
Thesis Co-Advisor
___________________________ _______________
Dr. Farid Hamid Abed
Associate Professor, Department of Civil Engineering
Thesis Committee Member
___________________________ _______________
Dr. Basil Darras
Associate Professor, Department of Mechanical Engineering
Thesis Committee Member
___________________________ _______________
Dr. Osman Akan
Head, Department of Civil Engineering
___________________________ _______________
Dr. Mohamed El-Tarhuni
Associate Dean, College of Engineering
___________________________ _______________
Dr. Leland Blank
Dean, College of Engineering
___________________________ _______________
Dr. Khaled Assaleh
Interim Vice Provost for Research and Graduate Studies

4
Acknowledgments
First and foremost, I thank Allah the most compassionate, the most merciful
for guiding me and helping me throughout my life as I have grown as an individual
and as an educated person.
I would like to thank my father, Saleh and my mother, Aida for supporting me
throughout my life and for being the rock that I can lean on whenever I am in need to.
I would also like to thank my sister Sara and my three brothers; Husam, Bassam, and
Yousef for bearing with me in this journey. I would like to thank my whole family for
being the greatest source of encouragement. I would also like to thank my friends
Ayham, Mohammad, and all others for extending the helping hand and being my
guide in my life.
I would also like to thank my two advisors Dr. Rami Haweeleh, and Dr. Jamal
Abdalla for helping me and guiding me. I would also like to thank Mr. Aqeel Ahmed
for being the big brother and the supporter. I would like to acknowledge the help that
was extended to me from Eng Mohammad Ansari and Eng Arshi Faridi. Many thanks
go to all my professors who sparked the love of knowledge in my heart. I would like
to thank the two companies that provided me with all the support that I needed: Rak
Precast and Structural Technologies.
At the end, I can’t thank enough my second home, the American University of
Sharjah for supporting me in every way and providing me with the chance of being a
GTA and work closely with some of the greatest minds in civil engineering.

5
Dedication
To my two superheroes; my father and my mother who bestowed on me their
unconditional love… I hope I made you proud.

6
Abstract
During the last few decades, engineers and researchers used high-strength
concrete to cast reinforced concrete (RC) structures. Accordingly, the dead weight of
buildings and structures were reduced significantly, which allowed engineers to
construct higher and larger buildings. Reinforced concrete slabs are the largest
structural members in buildings. This research aims to reduce the thickness of RC
slabs using high-strength concrete strengthened with carbon reinforced polymers
(CFRP) laminates in flexural. In this study the behavior of 100 mm thick RC slabs
with different concrete compressive strengths of 40, 70, and 100 MPa was inspected.
A total of 54 RC slab specimens were cast and tested under two-point loading until
failure. The specimens were divided into three groups having different flexural steel
reinforcement ratios of 0.45, 1.00, and 1.79%, respectively. Each group of specimens
was strengthened with one and two layers of CFRP sheets, which were externally
attached to the soffit of the RC slabs, to enhance their flexural capacity. The test
results indicated an increase in the load-carrying capacity of the strengthened slabs in
the range between 12 to 378 %. It was also observed that the highest contribution was
for those specimens with low reinforcement ratio, in which their control specimens
failed by tensile membrane action. The mid-span deflection response curves and load-
carrying capacity of the slabs were also predicted with a good level of accuracy using
the design guidelines of ACI 440-2R-08. In conclusion, strengthening of high-strength
thin RC slabs with CFRP laminates is a valid choice to enhance their flexural
behavior, with a minimal increase in their dead load, due to the lightweight of the
CFRP laminates.
Search Terms: CFRP laminates, strengthening, flexibility model, thin slabs, high
strength concrete, and reinforcement ratio.

7
Table of Contents
Abstract ........................................................................................................................... 6
Table of Contents ............................................................................................................ 7
List of Figures ............................................................................................................... 10
List of Tables ................................................................................................................ 15
Chapter 1: Introduction ................................................................................................. 16
1.1. Background ....................................................................................................... 16
1.2. Research Significance ....................................................................................... 18
1.3. Research Objectives .......................................................................................... 19
1.4. Thesis Organization ........................................................................................... 19
Chapter 2: Literature Review ........................................................................................ 21
2.1 General Overview .............................................................................................. 21
2.2 High Strength Concrete ...................................................................................... 22
2.3 CFRP Laminates for Flexure Strengthening ...................................................... 23
Chapter 3: Experimental Program ................................................................................ 25
3.1. Test Specimens Properties ................................................................................ 25
3.2. Materials ........................................................................................................... 25
3.2.1. Concrete material properties ....................................................................... 25
3.2.2. Steel material properties ............................................................................. 28
3.2.3. Epoxy V-Wrap 700 ..................................................................................... 29
3.2.4. CFRP sheets: V-Wrap C200H properties ................................................... 30
3.3 Specimens Preparation ....................................................................................... 30
3.4 Test Matrix and slab detailing ............................................................................ 33
Chapter 4: Experimental Results and Discussion ......................................................... 45
4.1. Load versus Micro-strain, and Failure Modes .................................................. 45

8
4.1.1 Group C 40 LR ............................................................................................ 46
4.1.2 Group C 40 MR ........................................................................................... 51
4.1.3 Group C 40 HR: ........................................................................................... 55
4.1.4 Group C 70 LR ............................................................................................ 59
4.1.5 Group C 70 MR ........................................................................................... 63
4.1.6 Group C 70 HR: ........................................................................................... 67
4.1.7 Group C 100 LR .......................................................................................... 71
4.1.8 Group C 100 MR ......................................................................................... 76
4.1.9 Group C 100 HR .......................................................................................... 80
4.2. Summary of the Results Obtained:.................................................................... 85
4.3. Repeatability of Results: ................................................................................... 90
4.3.1 Load versus mid-span deflection ................................................................. 91
Chapter 5: Discussion of Results .................................................................................. 98
5.1 Group (C 40) ...................................................................................................... 98
5.1.1 Load-deflection and ultimate performance .................................................. 98
5.1.2 Strain response ............................................................................................. 99
5.1.3 Ductility measures ..................................................................................... 102
5.1.4 Toughness measures .................................................................................. 103
5.2 Group (C 70) .................................................................................................... 104
5.2.1 Load-deflection and ultimate performance ................................................ 104
5.2.2 Strain response ........................................................................................... 105
5.2.3 Ductility measures ..................................................................................... 107
5.2.4 Toughness measures .................................................................................. 108
5.3 Group (C 100) .................................................................................................. 109
5.3.1 Load-deflection and ultimate performance ................................................ 109
5.3.2 Strain response ........................................................................................... 110
5.3.3 Ductility measures ..................................................................................... 112

9
5.3.4 Toughness measures .................................................................................. 113
5.4 Conclusions ...................................................................................................... 114
5.4.1 Effect of reinforcement ratio ..................................................................... 114
5.4.2 Effect of concrete compressive strength .................................................... 116
5.4.3 Effect of CFRP reinforcement ratio ........................................................... 119
Chapter 6: Theoretical Models.................................................................................... 123
6.1. Flexibility Model for Cracked Sections .......................................................... 123
6.2. Beams graphs and predicted curves ................................................................ 125
6.3. Ultimate Moment Capacity Prediction: ........................................................... 139
Chapter 7: Summary and Conclusion ......................................................................... 143
References ................................................................................................................... 147
Appendix ..................................................................................................................... 150
Appendix A: Load deflection graphs ..................................................................... 150
Vita .............................................................................................................................. 167

10
List of Figures
Figure 1: Stress- Strain Curve of tested Steel Rebars .................................................. 29
Figure 2: CFRP location marking ................................................................................ 31
Figure 3: Surface preparation....................................................................................... 31
Figure 4: Mixing, painting of the epoxy, and the soaking of the CFRP sheets in
epoxy. ........................................................................................................................... 32
Figure 5: Rolling and leveling of the CFRP sheets on the concrete surface. .............. 32
Figure 6: Testing method and elevation view of the tested slabs. ............................... 37
Figure 7: Front view of the slab specimens. ................................................................ 37
Figure 8: Cross-section a-a of the slab specimens. ...................................................... 37
Figure 9: Strain Gauge locations.................................................................................. 42
Figure 10: Strain Gauge locations................................................................................ 43
Figure 11: General Test Arrangement ......................................................................... 44
Figure 12: Load (kN) versus mid-span deflection (mm) schematic ............................ 45
Figure 13: Load versus microstrain for slab specimen (C 40 LR C) ........................... 47
Figure 14: Failed slab specimen (C 40 LR C) ............................................................. 48
Figure 15: Load versus microstrain slab specimen (C 40 LR 1L) ............................... 49
Figure 16: Failed slab specimen (C 40 LR 1L)............................................................ 49
Figure 17: Load versus microstrain slab specimen (C 40 LR 2L) ............................... 50
Figure 18: Failed slab specimen (C 40 LR 2L)............................................................ 50
Figure 19: Load versus microstrain for slab specimen (C 40 MR C) .......................... 51
Figure 20: Failed slab specimen (C 40 MR C) ............................................................ 52
Figure 21: Load versus microstrain slab specimen (C 40 MR 1L) .............................. 53
Figure 22: Failed slab specimen (C 40 MR 1L) .......................................................... 53
Figure 23: Load versus microstrain for slab specimen (C 40 MR 2L) ........................ 54
Figure 24: Failed slab specimen (C 40 MR 2L) .......................................................... 55
Figure 25: Load (kN) versus micro strain .................................................................... 56
Figure 26: Concrete crushing and final failure ............................................................ 56
Figure 27: Load versus microstrain for slab specimen (C 40 HR 1L) ......................... 57
Figure 28: Failed slab specimen (C 40 HR 1L) ........................................................... 57
Figure 29: Load versus microstrain for slab specimen (C 40 HR 2L) ......................... 58
Figure 30: Failed slab specimen (C 40 HR 2L) ........................................................... 58
Figure 31: Load versus microstrain for slab specimen (C 70 LR C) ........................... 59

11
Figure 32: Slab Steel Rupture and beam failure .......................................................... 60
Figure 33: Load versus microstrain for slab specimen (C 70 LR 1L) ......................... 61
Figure 34: Failed slab specimen (C 70 LR 1L)............................................................ 61
Figure 35: Load versus microstrain for slab specimen (C 70 LR 2L) ......................... 62
Figure 36: Failed slab specimen (C 70 LR 2L)............................................................ 62
Figure 37: Load versus microstrain for slab specimen (C 70 MR C) .......................... 63
Figure 38: Failed slab specimen (C 70 MR C) ............................................................ 64
Figure 39: Load versus microstrain for slab specimen (C 70 MR 1L) ........................ 65
Figure 40: Failed slab specimen (C 70 MR 1L) .......................................................... 65
Figure 41: Load versus microstrain for slab specimen (C 70 MR 2L) ........................ 66
Figure 42: Failed slab specimen (C 70 MR 2L) .......................................................... 67
Figure 43: Load versus microstrain for slab specimen (C 70 HR C)........................... 68
Figure 44: Failed slab specimen (C 70 HR C) ............................................................. 68
Figure 45: Load versus microstrain for slab specimen (C 70 HR 1L) ......................... 69
Figure 46: Failed slab specimen (C 70 HR 1L) ........................................................... 70
Figure 47: Load versus microstrain slab specimen (C 70 HR 2L) .............................. 71
Figure 48: Failed slab specimen (C 70 HR 2L) ........................................................... 71
Figure 49: Load versus microstrain for slab specimen (C 100 LR C) ......................... 72
Figure 50: Failed slab specimen (C 100 LR C) ........................................................... 73
Figure 51: Load versus microstrain for slab specimen (C 100 LR 1L) ....................... 74
Figure 52: Failed slab specimen (C 100 LR 1L).......................................................... 74
Figure 53: Load versus microstrain for slab specimen (C 100 LR 2L) ....................... 75
Figure 54: Failed slab specimen (C 100 LR 2L).......................................................... 75
Figure 55: Load versus microstrain for slab specimen (C 100 MR C) ........................ 76
Figure 56: Failed slab specimen (C 100 MR C) .......................................................... 77
Figure 57: Load versus microstrain for slab specimen (C 100 MR 1L) ...................... 78
Figure 58: Failed slab specimen (C 100 MR 1L) ........................................................ 78
Figure 59: Load versus microstrain for slab specimen (C 100 MR 2L) ...................... 79
Figure 60: Failed slab specimen (C 100 MR 2L) ........................................................ 80
Figure 61: Load versus microstrain for slab specimen (C 100 HR C)......................... 81
Figure 62: Failed slab specimen (C 100 HR C) ........................................................... 81
Figure 63: Load versus microstrain slab specimen (C 100 HR 1L) ............................ 82
Figure 64: Failed slab specimen (C 100 HR 1L) ......................................................... 83

12
Figure 65: Load versus microstrain for slab specimen (C 100 HR 2L) ....................... 84
Figure 66: Failed slab specimen (C 100 HR 2L) ......................................................... 84
Figure 67: Load versus Mid-span Deflection for (C 40 LR 1L) slabs ......................... 91
Figure 68: Load versus Mid-span Deflection for (C 40 LR 2L) slabs ......................... 91
Figure 69: Load versus Mid-span Deflection (C 70 HR C) slabs ................................ 92
Figure 70: Load versus Mid-span Deflection for (C 70 HR 1L) slabs ........................ 92
Figure 71: Load versus Mid-span Deflection for (C 70 HR 2L) slabs ........................ 93
Figure 72: Load versus Mid-span Deflection for (C 100 MR 1L) slabs ...................... 93
Figure 73: Load versus Mid-span Deflection for (C 100 HR 1L) ............................... 94
Figure 74: Group C 40 - load (kN) versus deflection (mm) ........................................ 98
Figure 75: Steel strain response for Group C 40........................................................ 100
Figure 76: FRP strain response for Group C 40 ........................................................ 101
Figure 77: Concrete strain response for Group C 40 ................................................. 102
Figure 78: Ductility comparison ................................................................................ 103
Figure 79: Toughness comparison (UT/UTCB) ............................................................ 103
Figure 80: Group C 70 - load (kN) versus deflection (mm) ...................................... 104
Figure 81: Group C 70 – Steel strain response .......................................................... 105
Figure 82: Group C 70 –FRP strain response ............................................................ 106
Figure 83: Group C 70 –Concrete strain response ..................................................... 107
Figure 84: Ductility comparison ................................................................................ 108
Figure 85: Toughness comparison (UT/UTCB) ............................................................ 109
Figure 86: Group C100 - load (kN) versus deflection (mm) ..................................... 109
Figure 87: Steel strain response for Group C100....................................................... 111
Figure 88: FRP strain response for Group C 100 ...................................................... 111
Figure 89: Concrete strain response for Group C 100 ............................................... 112
Figure 90: Ductility comparison ................................................................................ 113
Figure 91: Toughness comparison (UT/UTCB) ............................................................ 114
Figure 92: Reinforcement ratio effect on C40 ........................................................... 114
Figure 93: Reinforcement ratio effect on C70 ........................................................... 115
Figure 94: Reinforcement ratio effect on C100 ......................................................... 116
Figure 95: Concrete compressive strength effect on LR ........................................... 117
Figure 96: Concrete compressive strength effect on MR .......................................... 118
Figure 97: Concrete compressive strength effect on HR ........................................... 119

13
Figure 98: CFRP ratio effect on LR ........................................................................... 120
Figure 99: CFRP ratio effect on MR ......................................................................... 121
Figure 100: CFRP ratio effect on HR ........................................................................ 122
Figure 101: Load versus Mid-span Deflection of C 40 LR C.................................... 125
Figure 102: Load versus Mid-span Deflection of C 40 LR 1L .................................. 125
Figure 103: Load versus Mid-span Deflection of C 40 LR 2L .................................. 126
Figure 104: Load versus Mid-span Deflection of C 40 MR C .................................. 126
Figure 105: Load versus Mid-span Deflection of C 40 MR 1L ................................. 127
Figure 106: Load versus Mid-span Deflection of C 40 MR 2L ................................. 127
Figure 107: Load versus Mid-span Deflection of C 40 HR C ................................... 128
Figure 108: Load versus Mid-span Deflection of C 40 HR 1L ................................. 128
Figure 109: Load versus Mid-span Deflection of C 40 HR 2L ................................. 129
Figure 110: Load versus Mid-span Deflection of C 70 LR C.................................... 129
Figure 111: Load versus Mid-span Deflection of C 70 LR 1L .................................. 130
Figure 112: Load versus Mid-span Deflection of C 70 LR 2L .................................. 130
Figure 113: Load versus Mid-span Deflection of C 70 MR C .................................. 131
Figure 114: Load versus Mid-span Deflection of C 70 MR 1L ................................. 131
Figure 115: Load versus Mid-span Deflection of C 70 MR 2L ................................. 132
Figure 116: Load versus Mid-span Deflection of C 70 HR C ................................... 132
Figure 117: Load versus Mid-span Deflection of C 70 HR 1L ................................. 133
Figure 118: Load versus Mid-span Deflection of C 70 HR 2L ................................. 133
Figure 119: Load versus Mid-span Deflection of C 100 LR C.................................. 134
Figure 120: Load versus Mid-span Deflection of C 100 LR 1L ................................ 134
Figure 121: Load versus Mid-span Deflection of C 100 LR 2L ................................ 135
Figure 122: Load versus Mid-span Deflection of C 100 LR 2L ................................ 135
Figure 123: Load versus Mid-span Deflection of C 100 MR 1L ............................... 136
Figure 124: Load versus Mid-span Deflection of C 100 MR 2L ............................... 136
Figure 125: Load versus Mid-span Deflection of C 100 HR C ................................. 137
Figure 126: Load versus Mid-span Deflection of C 100 HR 1L ............................... 137
Figure 127: Load versus Mid-span Deflection of C 100 HR 2L ............................... 138
Figure 128: Section behavior under loading .............................................................. 139
Figure 129: Experimental versus predicted ultimate load capacities......................... 142
Figure 130: Load versus Mid-span Deflection for C40 LR C specimens.................. 150

14
Figure 131: Load versus Mid-span Deflection for C40 LR 1L specimens ................ 150
Figure 132: Load versus Mid-span Deflection for C40 LR 2L specimens ................ 151
Figure 133: Load versus Mid-span Deflection for C40 MR C specimens ................ 151
Figure 134: Load versus Mid-span Deflection for C40 MR 1L specimens ............... 152
Figure 135: Load versus Mid-span Deflection for C40 MR 2L specimens ............... 152
Figure 136: Load versus Mid-span Deflection for C40 HR C specimens ................. 153
Figure 137: Load versus Mid-span Deflection for C40 HR 1L specimens ............... 153
Figure 138: Load versus Mid-span Deflection for C40 HR 2L specimens ............... 154
Figure 139: Load versus Mid-span Deflection for C70 LR C specimens.................. 154
Figure 140: Load versus Mid-span Deflection for C70 LR 1L specimens ................ 155
Figure 141: Load versus Mid-span Deflection for C70 LR 2L specimens ................ 155
Figure 142: Load versus Mid-span Deflection for C70 MR C specimens ................ 156
Figure 143: Load versus Mid-span Deflection for C70 MR 1L specimens ............... 156
Figure 144: Load versus Mid-span Deflection for C70 MR 2L specimens ............... 157
Figure 145: Load versus Mid-span Deflection for C70 HR C specimens ................. 157
Figure 146: Load versus Mid-span Deflection for C70 HR 1L specimens ............... 158
Figure 147: Load versus Mid-span Deflection for C70 HR 2L specimens ............... 158
Figure 148: Load versus Mid-span Deflection for C100 LR C specimens................ 159
Figure 149: Load versus Mid-span Deflection for C100 LR 1L specimens .............. 159
Figure 150: Load versus Mid-span Deflection for C100 LR 2L specimens .............. 160
Figure 151: Load versus Mid-span Deflection for C100 MR C specimens .............. 160
Figure 152: Load versus Mid-span Deflection for C100 MR 1L specimens ............. 161
Figure 153: Load versus Mid-span Deflection for C100 MR 2L specimens ............. 161
Figure 154: Load versus Mid-span Deflection for C100 HR C specimens ............... 162
Figure 155: Load versus Mid-span Deflection for C100 HR 1L specimens ............. 162
Figure 156: Load versus Mid-span Deflection for C100 HR 2L specimens ............. 163

15
List of Tables
Table 1: Properties of different types of FRP fibers [18] ............................................ 17
Table 2 : Comparison between FRP and other materials [21] .................................... 22
Table 3: C 40/20 OPC Mix Design .............................................................................. 26
Table 4: C 70/20 OPC + MS mix Design .................................................................... 26
Table 5: C 100/20 OPC + MS mix Design .................................................................. 27
Table 6: Compressive strength for the concrete cylinders ........................................... 28
Table 7: Steel Dimensions ........................................................................................... 28
Table 8: Coupon test results of steel ............................................................................ 29
Table 9: Mechanical properties of the epoxy ............................................................... 30
Table 10: Mechanical properties of the cured CFRP laminate .................................... 30
Table 11: C 40 group organization .............................................................................. 34
Table 12: C 70 group organization .............................................................................. 35
Table 13: C 100 group organization ............................................................................ 36
Table 14: Test Matrix................................................................................................... 38
Table 15: Summary of the average load data ............................................................... 85
Table 16: Summary of deflection data ......................................................................... 87
Table 17: Summary of deflection data ......................................................................... 89
Table 18: Summary of all tested specimens ................................................................ 95
Table 19: Load predictions and error estimations. ..................................................... 141
Table 20: Repeatability comparison .......................................................................... 164

16
Chapter 1: Introduction
1.1. Background
Throughout the advancement of the human race, new technologies have been
innovated and improved to keep up with the needs of today’s world. One of these
technologies is constructing buildings. Humans have always used structures as
homes, theaters, libraries, and other purposes. However, home and shelter use is the
most critical one. In the stone ages, people used to live in tents, caves, and other made
shelters that were of no strength or permanent use. Thus, when the technology of
building structures out of the known building materials started, it was of a great
benefit to the human race. Since the development of those structures, civil engineers
are trying to continue experimenting and evolving those structures and materials to
keep up with the huge demand of the modern world. As the populations of the world
continue skyrocketing, high-rise building technology was invented to keep people in
shelters while not using huge spaces of land.
In the modern days, the construction materials field had grown in complexity
and applications, so there are materials invented for almost all modern uses. One of
the most critical technologies developed in the construction materials field is fiber-
reinforced polymer (FRP) composite material that is used to repair, strengthen and
rehabilitate structures. There are many materials that can be used for these purposes.
They vary with the type and the extent of damage to structural members.
Structural damage can occur due to many reasons, such as fires, earthquakes,
terrorist’s attacks, wear and tear, and change of occupancy. Each type of damage
should be analyzed and studied to assess the repairing material and strengthening
method that should be used. One of the most commonly and widely used methods
now is the strengthening of RC structural members (slabs, beams, columns, and walls)
in shear and flexure by externally bonding FRP composite sheets and plates to
concrete surfaces [1-14]. The old method of strengthening RC slabs and beams in
flexure was done by attaching steel plates to concrete surfaces [15]. Since the
invention of FRP strengthening systems, it has proven to have enormous potential and
advantages over the steel alternative [15].

17
FRP systems also demonstrated many advantages over the old method of steel
plating [16, 17]. Those advantages can be summarized in the ease of FRP installation
and insulation, cost of materials, structural bonding, weight-to-strength ratio, and
decrease of labor forces required to install them. As this system started to grow its
range of applications, engineers and researches have conducted many research studies
on how to best optimize this technology [16, 17]. It was found from these studies that
bonding FRP sheets and plates to surfaces of RC members would increase their
flexural and shear capacities significantly.
There are many types of FRP composite materials in the construction market.
Some of the most commonly used FRP types include carbon (CFRP), glass (GFRP),
and aramid (AFRP) fibers [17]. Table 1 summarizes the different physical and
mechanical properties of the types of FRP fibers and compares them to steel and
aluminum plates [18].
Table 1: Properties of different types of FRP fibers [18]
Fiber Density
(g/cc)
Youngs
Modulus
(GPa)
Strength
(GPa)
Strain
to
Failure
(%)
Specific
Strength
Specific
Modulus
Diameter
(μm)
Upper
use
Temp
(C)
E-Glass 2.6 69-72 1.7-3.5 3.0 1.18 27.6 5-25 350
S-Glass 2.49 85 4.8 5.3 1.9 34.3 5-15 300
Carbon(HM) 1.96 517 1.86 0.38 0.95 264 7-8 600
Carbon(HS) 1.8 295 5.6 1.8 3-11 164 7-8 500
Kevlar
49(Aramid) 1.45 135 3.0 8.1 2.1 93 12 250
Steel 7.9 200 0.45 20 0.05 25 - -
Aluminum 2.7 70 0.26 17 0.1 26 - -
In summary, there are many advantages of using FRP composite materials in
strengthening RC structural elements. The main advantages are high tensile strength,
low densities, and absence of sensitivity to corrosion, which is ten times less than that
of steel, which allows possible reduction in cross-sections of structural elements. All
the mentioned advantages can be offset with the high cost of the FRP materials and
the high cost of installation [19].
In addition, it is even hard sometimes to use those materials in some structural
elements, such as the elements that are subjected to harsh environmental impact. In

18
such cases, those composites should be inserted inside the elements to protect them
from those attacks [19].
FRP systems have been primarily investigated to be used for flexural and
shear strengthening by two application methods: Externally Bonded Reinforcing
(EBR) and Near Surface Mounted (NSM) [20]. On the structural engineering side,
there are many structural elements that could use the extra capacity and reduction of
cross section that FRP can provide. One important structural element that this
research deals with is slabs. Slabs are flexural members that are used for flooring and
roofing purposes. They act like beams in transferring and reacting to loads and are
also the largest elements in any structure. The general trend of strengthening those
elements is attaching the FRP system to the soffit of the slab with epoxy resin
adhesives. In this case, the FRP system will act as secondary flexural reinforcement to
help the main longitudinal steel reinforcement in increasing the flexural capacity of
slabs.
1.2. Research Significance
Slabs are the largest elements in most reinforced concrete structural buildings.
Hence, most of the self-weight of the structure is due to the weight of slabs. The
weight of a slab is a function of its surface area and thickness. In order to reduce the
weight of slabs, one of these two parameters should be reduced. Since the surface area
of slabs is controlled by architectural plan views of each floor, the slab thickness is
the key parameter in reducing the slab weight. An important question that needs to be
asked is how could this thickness be reduced without compromising the capacity of
the slab? The answer to this question is the use of high-strength concrete instead of
normal strength concrete in casting slabs. This would reduce the total dead weight of
buildings and thus will save cost, construction materials, and ability to construct
higher and larger buildings.
The use of externally bonded CFRP composite materials to the bottom surface
of slabs would act as internal longitudinal steel reinforcement which would increase
the flexural capacity of slab. Thus, in theory, one could design externally strengthened
thin high strength slabs to provide the same flexural capacity as that of conventional
RC slabs.

19
This research aims to study the behavior of externally strengthened 100 mm
thick high-strength RC slabs with CFRP composite sheets bonded to their soffit to
improve their flexural capacity. In addition, the effect of concrete compressive
strength and flexural steel reinforcement ratio on the performance of slab specimens
will be investigated.
1.3. Research Objectives
This research aims to study the behavior of high-strength RC slabs bonded
externally with CFRP composite sheets to improve their flexural capacity. A total of
fifty-four slabs have been cast and tested to prove the theory and the objective of the
proposed study. The slabs were tested in a two-point loading arrangement until
failure. The variables of the experimental program were the concrete compressive
strength, longitudinal steel reinforcement ratio, and number of layers of CFRP
composite sheets. The results of these tests were compared together to conclude the
range of the enhancement of the CFRP and the effect of the mentioned variables on
the performance of high-strength RC slabs. The main objectives of this study are to:
1. study the effect of the concrete compressive strength variation on the flexural
performance of un-strengthened and externally strengthened 100 mm thick RC
slabs.
2. examine the effect of flexural steel reinforcement ratio on the flexural
performance of the tested slab specimens.
3. investigate the effect of the number of CFRP layers when externally bonded to
the slab’s soffit on the flexural performance of high-strength composite slabs.
4. compare the load-carrying capacity; load verses mid-span deflection curves,
and ductility of the tested specimens.
5. predict the flexural capacity of the tested slab specimens using the ACI318-11
and ACI 440.2R-08 guidelines.
6. develop analytical models to predict the mid-span deflection response of the
tested slab specimens.
1.4. Thesis Organization
This thesis is divided into a total of 7 chapters. The first chapter introduces the
thesis topic in general; it is also subdivided into subchapters that explain the general
idea of the study, significance of the research, and the objectives of the research. The

20
second chapter presents the literature review that spots light on the papers and studies
that are associated with either the field of FRP strengthening of flexural members or
the use of high strength concrete. The third chapter deals with the experimental
program. This chapter is organized in subchapters to explain the materials used in the
study, the test setup, cross sectional detailing of the tested specimens, and the test
matrix. The fourth chapter in this study deals with the results of the experimental
program of the study. It also discusses the load verses mid-span deflections, and load
verses strains diagrams in an elaborate manner. The fifth chapter has technical
discussions on the data and observations of different comparisons within the groups of
specimens. It also compares the differences between the capacities of the tested
specimens. The sixth chapter in this thesis has analytical predictions according to ACI
440-08.2R of the load carrying capacity, and load verses mid-span deflections
compared to the actual tested data. The final chapter has an overall conclusion on the
results, discussion, and technical outcomes of the study.

21
Chapter 2: Literature Review
2.1 General Overview
There are many research studies on the effect of CFRP composite sheets and
plates in strengthening RC structural members [1-15]. These studies paved the way
for the use of such composite materials in repair and strengthening of structural RC
members nowadays. The main feature that allowed this wide range of applications is
material properties of the carbon fibers themselves.
Carbon fibers are made from carbon atoms consolidated together to create
long stands, which eventually creates thin sheet that is used in strengthening
applications. The low weight-to-volume ratio of the carbon atoms is the main reason
that allows the CFRP system to have a high strength-to-weight ratio [19]. Those
carbon fibers can never be used alone; they have to be consolidated with different
resins to allow the bond between the atoms to grow strong. This is what differentiates
the different CFRP types that are available in the construction market. Some of the
amazing properties that carbon fibers have are [21]:
High tensile strength
Low density
High modulus of elasticity
Low thermal conductivity
Thus, there are many benefits of using FRP composite over the conventional
steel material.
Table 2 compares the physical and mechanical properties of FRP materials to
other metals used in the field of construction [21]. The superior properties landed the
FRP composites many applications, not only in the field of construction but also in
the fields of aerospace, oil and gas, automobiles, and many others.

22
Table 2 : Comparison between FRP and other materials [21]
2.2 High Strength Concrete
The main aspect of this research study is the use of high strength concrete in
casting thin RC slabs. In principle, high strength concrete (HSC) is a concrete mix
that has the ability to reach a compressive strength above 50 MPa [22]. The use of this
type of concrete mix is very obvious, with the increase in strength; HSC can provide a
stretched range of durability.
The production of HSC can be simplified in the process of increasing the
compactness of the mix by increasing the aggregates and cement materials, and by
decreasing the water to cement (w/c) ratio in order to obtain a denser mix that has
more of the stronger elements [23].
The use of HSC increased during the last decade due to many reasons. The
high strength and durability it provides, makes it an impeccable option for clients
opting for a highly conservative structure, with low maintenance costs in the long run.
Engineers have used HSC to repair parts of pre-existent structure that have suffered
from fatigue and cracking. The on-site application makes its use easier and workable.
Common HSC applications are:
Property
FRP Carbon
Steel
Stainless
Steel Hastelloy Aluminum Titanium
With Glass
Mat Roving
All Glass
Mat
AISI
1020 316L C 1050-O Grade 12
Density, Kg/m3 1799.2 1383.995 7861.1 7916.45 8968.28 2712.63 4511.82
Tensile Strength, MPa x103 0.082-0.138 0.07-0.138 0.38 0.55 0.55 0.076 0.61
Yield Strength, MPa x103 0.07-0.138 0.062-0.1 0.227 0.234 0.351 0.027 0.475
Modulus of Elasticity, MPa
x106 0.005-0.01 0.048-0.007 0.206 0.206 0.18 0.07 0.097
23
Nuclear Waste Containment
High Rise Structures
Long Span Bridges & Walkways
Maintenance
2.3 CFRP Laminates for Flexure Strengthening
The use of CFRP composite sheets and plates in strengthening RC flexural
members (slabs and beams) has been increased dramatically over the last few years.
Numerous experimental and numerical research studies have also been conducted
which shows the use of CFRP flexural strengthening in increasing the flexural
capacity of beams and slabs.
Al-Rousan et al. [24] tested eight slabs that were strengthened with different
layers and configurations of CFRP system. They also developed a nonlinear finite
element model to correlate the behavior of the test specimens with the actual test
results. They found that the results of the models were comparable with that of the
actual test specimens. Their main finding from both the tested specimens and models
is that the strengthening of under reinforced concrete slabs using CFRP laminates
could substantially improve the flexural capacity on the compromise of the ductility
of the strengthened member. Moreover, the increase in flexural strength and
corresponding reduction in ductility had been increased with the increase in the
number of CFRP layers. Their final conclusion was that strengthening RC slabs with
CFRP laminates is effective, economical, and applicable, if the increase of flexural
capacity would not change the failure mode into a shear failure mode.
Toutanji et al. [25] also tested seven strengthened RC beams in flexure in
addition to a control un-strengthened specimen. The strengthened specimens were
varied with three to six layers of CFRP sheets bonded externally to the bottom beams’
surface with the use of inorganic epoxy. They have found that the load carrying
capacity was directly proportional to the number of CFRP layers, up to almost 170%
of the strength of the control beam specimen. The failure mode also varied with the
number of CFRP layers. It was found that the specimens that had three and four layers
failed by rupture of the CFRP sheets, while specimens that had five and six layers of

24
CFRP failed by delamination of CFRP sheets. Another main finding is the reduction
of the strengthened member’s ductility compared to the control beam. The deflection
was recorded until failure, and the results showed that the deflection didn’t vary with
the increase in the number of CFRP layers, which is consistent with the findings of
other research studies [24].
Al Zaid et al. [26] developed a simple numerical model based on a cross-
sectional analysis that satisfied strain compatibility and equilibrium conditions. They
generated moment-curvature relationship with an incremental strain technique. They
also calibrated their model with experimental data published in the literature. The
results of the developed models were in close agreement with the obtained
experimental data. They concluded that their developed model could be used in the
design and analysis of FRP-strengthened RC members. The developed model can also
predict the load-deflection response curves and failure mode of the strengthened
member.
Floruţ et al. [27] discussed the effect of FRP-strengthening two-way slabs with
and without cutouts. They tested eight slabs; four with cut outs and four without
cutouts. The results of this experimental program revealed that the FRP system could
only be fitted on the edges of the cut out. In areas of high demand, the FRP composite
system must be placed in most of the soffit to enhance the load carrying capacity and
decrease the maximum deflection of the strengthened member in flexure. In fact, the
load carrying capacity has been increased in all the control samples by 121% and 57
%, for slabs with and without cut outs, respectively.
As can be seen from the literature review above, it is clear that the literature is
missing adequate information of strengthening high-strength RC slabs in flexure with
CFRP composite sheets. In this research different concrete strengths, reinforcement
ratios, and number of layers of CFRP composite sheets will be examined, to study
their effect on the performance of thin slabs. This topic was chosen due to the
importance of slabs as structural elements and to investigate the behavior of thin (100
mm) slabs when externally strengthened with CFRP laminates. The trend will be
attaching the CFRP to the soffit of the slabs to observe the change in the load carrying
capacity, load-deflection response curves, failure modes, and ductility at specified
locations within the slab specimens.

25
Chapter 3: Experimental Program
3.1. Test Specimens Properties
To accomplish the objectives of this project, a total of 54 reinforced concrete
slab specimens were cast and tested in the structures lab of the American University
of Sharjah (AUS). The slabs were cast in three batches; each with a different
compressive strength of 40, 70, and 100 MPa, respectively. In addition, the variables
within each group are the flexural steel reinforcement ratio (ρs), and the number of
CFRP layers. In particular, the specimens were strengthened with one and two layers
of CFRP sheets bonded to the bottom surface of the slab with epoxy adhesive. In
addition, each group of specimens was reinforced with three reinforcement ratios; low
= 0.45%, medium = 1.0%, and high = 1.79%.
It should be noted that for each set of specimen, two identical slabs were
tested to ensure repeatability and credibility of the obtained experimental data. The
mechanical properties of the used materials, slab detailing, testing matrix,
instrumentation, and test setup will be discussed in the subsequent sections of this
chapter.
3.2. Materials
All the materials used in this research study will be obtained from local
suppliers and are readily available in the market. The materials used are described in
the following subsection.
3.2.1. Concrete material properties
The three groups of concrete compressive strengths that were used to cast the
100mm thick slabs are:
1. 40/20 Ordinary Portland Cement (OPC)
This concrete mix has a compressive strength of 40 MPa.
Table 3 below shows the mix design of the C 40/20 OPC mix.

26
Table 3: C 40/20 OPC Mix Design
2. 70/20 OPC+Microsilica (MS)
This concrete mix has a compressive strength of 70 MPa.
Table 4 below shows the mix design of the C 70/20 OPC + MS mix.
Table 4: C 70/20 OPC + MS mix Design
CONCRETE MIX DESIGN 70/20 OPC + MS
Batch weight per m3
Material Description S.G (SSD) Water Absorption
% Weights (S.S.D) Kg
Cement OPC - - 470
Microsilica - - 30.00
20 mm Aggregate 2.88 0.6 610
10 mm Aggregate 2.86 0.7 430
0-5 mm Washed Crushed
Sand 2.67 1.2 570
Dune Sand 2.64 0.8 260
Free Water - - 140
Admixture Glenium 110 1.1 - 7 - 9
Total (Kg) 2515
REMARKS
Wet Density: 2515 Kg / m3
Max size of aggregate 20 mm
Slump / Flow 550 -650 mm
W/C Ratio 0.28 -
CONCRETE MIX DESIGN 40/20 OPC
Batch weight per m3
Material Description S.G. (SSD) Water
Absorption %
Weights (S.S.D)
Kg
Cement OPC - - 400
20 mm Aggregate 2.86 0.5 650
10 mm Aggregate 2.85 0.6 380
0-5 mm Washed Crushed Sand 2.68 1.1 590
Dune Sand 2.67 0.8 285
Free Water - - 160
Admixture ADVA XR 1.1 - 8
Total (Kg) 2473
REMARKS
Wet Density: 2473 Kg / m3
Max size of aggregate 20 mm
Slump / Flow 175 + 25 mm
W/C Ratio 0.4 -

27
3. 100/20 OPC+Microsilica(MS)
This concrete mix has a compressive strength of 100 MPa.
Table 5 below shows the mix design of the C 100/20 OPC + MS mix.
Table 5: C 100/20 OPC + MS mix Design
CONCRETE MIX DESIGN 100/20 OPC + MS
Batch weight per m3
Material Description S.G. (SSD) Water Absorption % Weights (S.S.D)
Kg
Cement OPC - - 500
Microsilica - - 50
20 mm Aggregate 2.70 0.6 580
10 mm Aggregate 2.69 0.7 350
0-5 mm Washed Crushed
Sand 2.66 1.3 550
Dune Sand 2.63 0.9 250
Free Water - - 149
Admixture Glenium 110 1.1 - 8 - 11
Total (Kg) 2430
REMARKS
Wet Density: 2430 Kg / m3
Max size of aggregate 20 mm
Slump / Flow 550 -650 mm
W/C Ratio 0.27 -
All specimens were cast in RAK Precast Company. The compressive strength
of the cubes and cylinders were tested at AUS labs and facilities.
Table 6 provides the obtained results of the cylinder’s compressive strength
that was tested at the same time of the slab testing.

28
Table 6: Compressive strength for the concrete cylinders
Design
Strength
(MPa)
Cylinder Comp. Strength Average
Ref. (MPa) (MPa)
40
1 43
42
2 41
70
3 72.6
72.8
4 73.2
100
5 103.5
102.85
6 102.2
3.2.2. Steel material properties
All the reinforcement steel that were used in this study are hot rolled deformed
bars manufactured in accordance to BS EN 10080; B500A [28]. This high grade of
steel was chosen due to its availability in the United Arab Emirates market.
Properties and dimensions of the reinforcing steel are presented in Table 7.
Table 7: Steel Dimensions
Metric Bar
size
Linear Mass
Density(kg/m)
Nominal
diameter(mm)
Cross-sectional
Area (mm²)
8 0.395 8 50.3
12 0.888 12 113.1
16 1.579 16 201.1

29
The yield stress of the steel that was used in this study is determined through a
tensile coupon test in accordance with BS 4449: 2005 grade B500B using a universal
testing machine that has a capacity of 100 kN. The obtained results in terms of stress-
strain curves, yield and tensile strength are shown in Figure 1and Table 8.
Figure 1: Stress- Strain Curve of tested Steel Rebars
Table 8: Coupon test results of steel
Specimen Rebar 1 Rebar 2 Rebar 3 Average
Yield Strength
(MPa) 553.9 546.2 550.3 550.13
Tensile Strength
(MPa) 666.4 671.3 664.5 667.4
Modulus of
Elasticity (GPa) 200.02 200.00 199.97 199.99
3.2.3. Epoxy V-Wrap 700
In this study Epoxy Adhesive V-Wrap 700 was used to attach the CFRP sheets
to the soffits of the slabs strips. The properties of the adhesive are summarized in
table 9 below.
0
100
200
300
400
500
600
700
800
0.00 0.02 0.04 0.06 0.08 0.10 0.12 0.14 0.16
Str
ess
(Mp
a)
Strain (mm/mm)
Rebar 1
Rebar 2
Rebar 3

30
Table 9: Mechanical properties of the epoxy
Property Value
Tensile Strength (MPa) 72.4
Tensile Modulus(MPa) 3180
Flexural Strength(MPa) 123.4
Flexural Modulus(MPa) 3120
Elongation at Break(%) 5
Glass Transition Temperature (Tg) (° C) 82
Density (Kg/L) 1.11
3.2.4. CFRP sheets: V-Wrap C200H properties
In this study CFRP V-Wrap C200H supplied from Structural Technologies
Company is used. Table 10 below shows the properties of the cured CFRP laminates
embedded between two layers of epoxy adhesives, as reported by the manufacturer.
They were used in this study, as provided by the manufacturer.
Table 10: Mechanical properties of the cured CFRP laminate
3.3 Specimens Preparation
All specimens were cast in RAK Precast Company and brought to AUS
construction laboratory for strengthening and testing. The materials and application of
the strengthening of the specimens were done with the help of Structural Company
that is a specialist in this field.
The first step in the strengthening process is the marking of the location of the
CFRP external reinforcement. Figure 2 shows the marking process.
Mechanical Properties Average Value Design Value
Tensile Strength (MPa) 1,240 1,034
Modulus of Elasticity (GPa) 73.77 73.77
Elongation at Break (%) 1.7 1.4
Thickness (mm) 1.02 1.02
Strength Per Unit Width
(kN/mm) 1.26 1.05

31
Figure 2: CFRP location marking
The second step is the sample preparation. This step is done to scrub the
finished cover of the specimen. The surface preparation is done with the use of an
electric grinder to remove the dirt and chemicals from the release molds. The other
reason is to expose the micro cracks for the bonding of the epoxy resin with the
concrete surface. Figure 3 shows the process of surface preparation.
Figure 3: Surface preparation
The third step is the mixing of the epoxy mix, and the painting of the surface
on the pre-specified area. The fourth step is to soak CFRP laminates in the epoxy mix
to allow full bonding. The third and fourth steps of the strengthening process are done

32
together, since the epoxy mix should not be exposed to air after mixing. Figure
4shows the third and fourth steps in the strengthening process.
Figure 4: Mixing, painting of the epoxy, and the soaking of the CFRP sheets in epoxy.
The final step of the strengthening process is to apply the soaked CFRP sheets
on the painted area. After applying the CFRP sheets, the process of consolidating and
bonding of the CFRP sheets is initiated via roller and leveler. This process is done to
ensure the full bonding and the removal of the air bubbles and the filling of the micro
cracks that exist on the surface of the concrete. Figure 5 shows the two processes of
the rolling and the leveling of the CFRP sheets on the concrete.
Figure 5: Rolling and leveling of the CFRP sheets on the concrete surface.
33
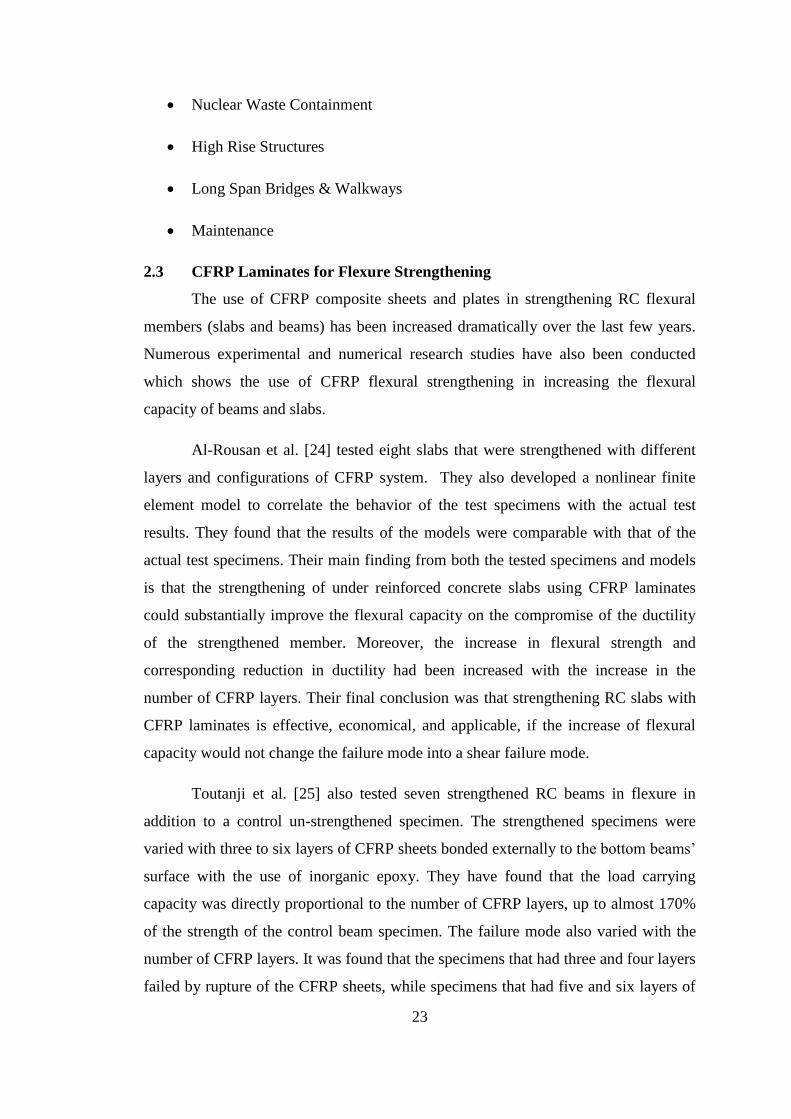
3.4 Test Matrix and slab detailing
A total of fifty-four 100 x 300 x 2000 mm slabs were cast and divided into
three major groups. Each group consisted of a total of 18 samples under it; nine of
which are originals, and the other nine were added to ensure repeatability, which is
discussed in details in other chapters.
The concrete compressive strengths of the cast slabs were 40, 70 and 100
MPa, respectively. The slabs that were strengthened with CFRP laminates had
a100mm wide CFRP sheets attached to the slab’s soffit with epoxy adhesives. This
will prove the validity and efficiency of the proposed study of casting thin RC slabs
with internal steel bars and external CFRP composite reinforcement. Tables 11 to13
explain in details the breakdown of the groups and the properties of the slabs in each
group and illustrate relation and technical information of each subgroup.
In this study, three reinforcement ratios were used with the first one close to
the minimum, the second between the minimum and the maximum and the third one
is close to the maximum. The reason behind this is to define a trend of the behavior.

34
Table 11: C 40 group organization
Group
Designation C 40
Sub-Group
Designation 40 LR 40 MR 40 HR
Size
100 x 300 x 2000 100 x 300 x 2000 100 x 300 x 2000 (mm x mm x
mm)
( Depth x Width
x Length)
Steel
Reinforcement 2 Φ8 mm 2 Φ12 mm 2 Φ16 mm
ρ % (mm2/mm
2) 0.45% 1.00% 1.79%
ρmin% 0.29%
ρb% 2.44%
ρmax % 1.83%
CFRP 0, 1, and 2 layers 0, 1, and 2 layers 0, 1, and 2 layers
Cross-section
Detailing
f’c (MPa) 40MPa
fy (MPa) 550 MPa
Number of
specimens 9 x 9 = 18 specimens

35
Table 12: C 70 group organization
Group Designation C 70
Sub-Group Designation 70 LR 70 MR 70 HR
Size
100 x 300 x 2000 100 x 300 x 2000 100 x 300 x 2000 (mm x mm x mm)
( Depth x Width x
Length)
Steel Reinforcement 2 Φ8 mm 2 Φ12 mm 2 Φ16 mm
ρ % (mm2/mm
2) 0.45% 1.00% 1.79%
ρmin% 0.38%
ρb% 3.06%
ρmax % 2.30%
CFRP 0, 1, and 2 layers 0, 1, and 2 layers 0, 1, and 2 layers
Cross-section Detailing
f’c (MPa) 70MPa
fy (MPa) 550 MPa
Number of specimens 9 x 9 = 18 specimens

36
Table 13: C 100 group organization
Group Designation C 100
Sub-Group
Designation 100 LR 100 MR 100 HR
Size
100 x 300 x 2000 100 x 300 x 2000 100 x 300 x 2000 (mm x mm x mm)
( Depth x Width x
Length)
Steel Reinforcement 2 Φ8 mm 2 Φ12 mm 2 Φ16 mm
ρ % (mm2/mm
2) 0.45% 1.00% 1.79%
ρmin% 0.45%
ρb% 2.65%
ρmax % 1.99%
CFRP 0, 1, and 2 layers 0, 1, and 2 layers 0, 1, and 2 layers
Cross-section
Detailing
f’c (MPa) 100MPa
fy (MPa) 550 MPa
Number of
specimens 9 x 9 = 18 specimens

37
Figures 6, 7, and8 show the detailing of the cast slab specimens in terms of
dimensions and location of steel and CFRP reinforcement. Figure 6 shows the slab’s
dimensions and location of loading supports. The slabs had a total length, span length,
width, and thickness of 2000, 1700, 300, and 100 mm, respectively. The slab
thickness is 100 mm, and its effective depth is 75 mm. Figure 6 shows the loaded slab
specimen, while Figure 7 shows a longitudinal section of the slab. Figure 8 shows a
cross section of the slab.
Figure 6: Testing method and elevation view of the tested slabs.
Figure 7: Front view of the slab specimens.
Figure 8: Cross-section a-a of the slab specimens.
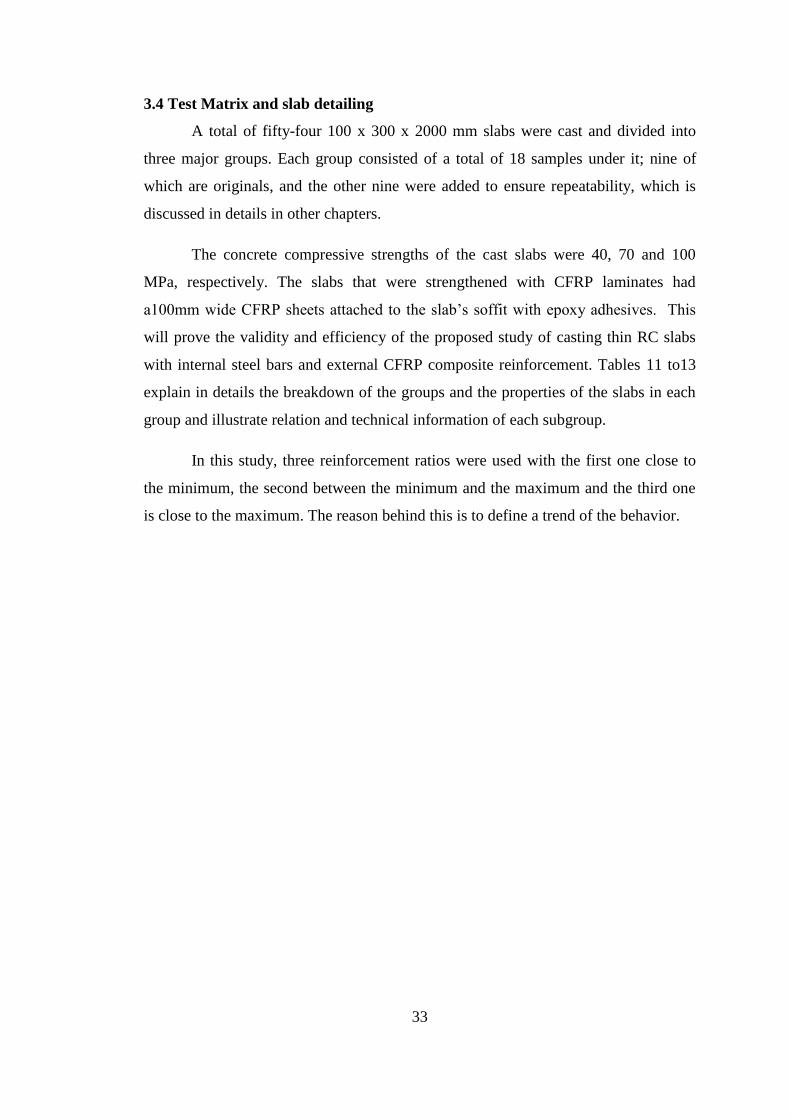
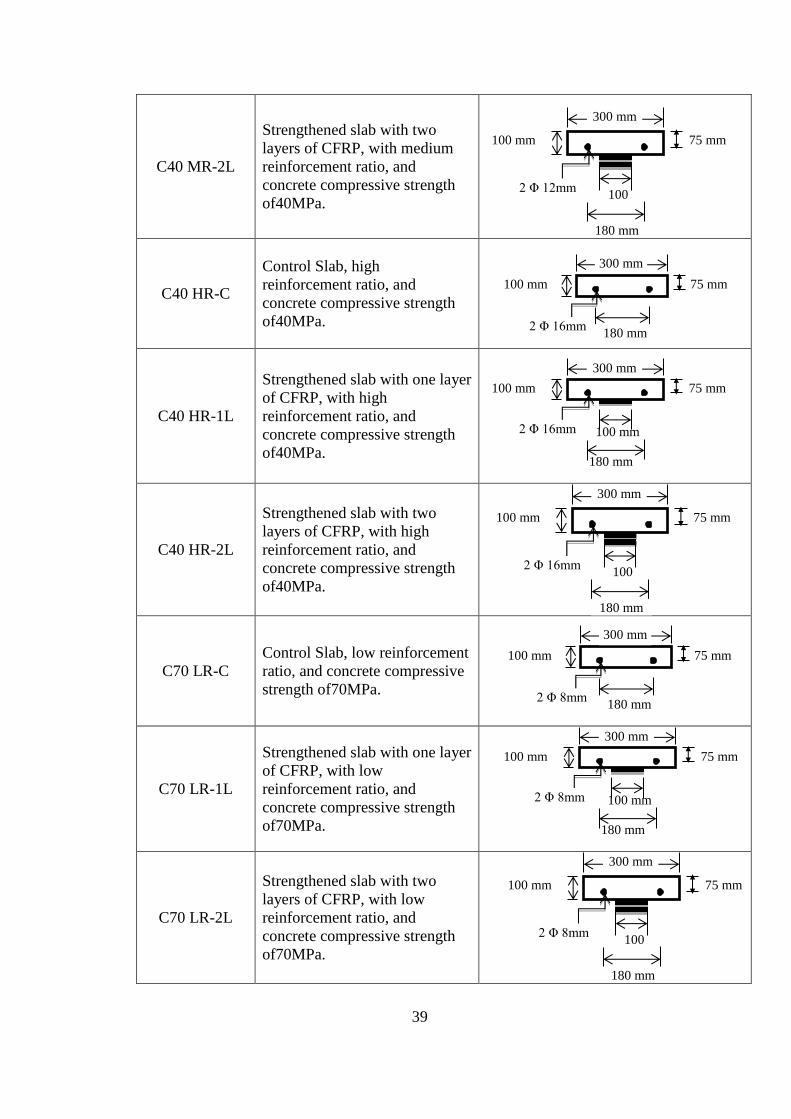
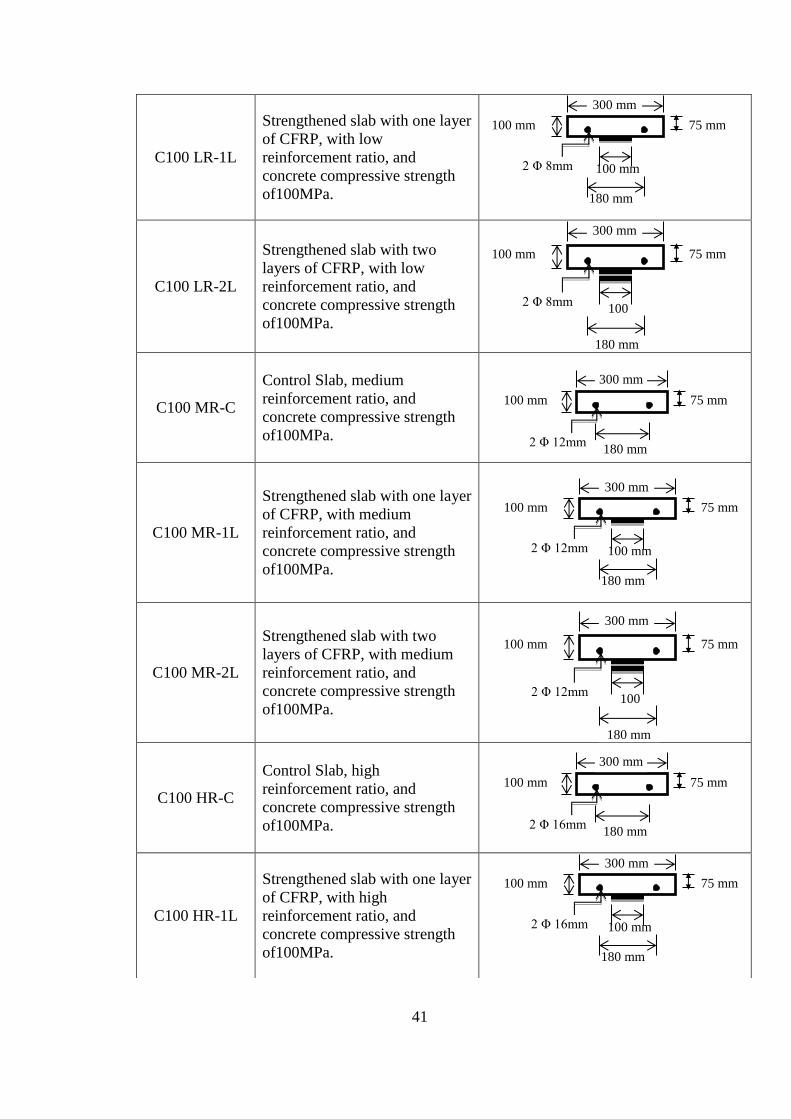
Table 14 summarizes the test matrix of this study. The designation and cross-
section of every tested slab specimen are presented in Table 14. Furthermore, it shows
567 mm h = 100 mm
CFRP Sheet/s (1500 mm length by 100 mm width)
a = 600 mm
150 mm
1700 mm
2000 mm
150 mm
2Φ 8 mm
2Φ12 mm
2Φ16 mm
150 mm a
a
100 mm
100 mm
300 mm
180 mm
75 mm

38
the parameters that were varied in order to show the technical validity of this study
and the importance aspect of the use of this technology.
Table 14: Test Matrix
Slab
Designation Slab Designation Slab Detail
C40 LR-C
Control Slab, low reinforcement
ratio, and concrete compressive
strength of40MPa.
C40 LR-1L
Strengthened slab with one layer
of CFRP, with low
reinforcement ratio, and
concrete compressive strength
of40MPa.
C40 LR-2L
Strengthened slab with two
layers of CFRP, with low
reinforcement ratio, and
concrete compressive strength
of40MPa.
C40 MR-C
Control Slab, medium
reinforcement ratio, and
concrete compressive strength
of40MPa.
C40 MR-1L
Strengthened slab with one layer
of CFRP, with medium
reinforcement ratio, and
concrete compressive strength
of40MPa.
100 mm
300 mm
180 mm
75 mm
2 Φ 8mm
100 mm
300 mm
180 mm
75 mm
100 mm 2 Φ 8mm
100 mm
300 mm
180 mm
75 mm
100 2 Φ 8mm
100 mm
300 mm
180 mm
75 mm
2 Φ 12mm
100 mm
300 mm
180 mm
75 mm
100 mm 2 Φ 12mm
39
C40 MR-2L
Strengthened slab with two
layers of CFRP, with medium
reinforcement ratio, and
concrete compressive strength
of40MPa.
C40 HR-C
Control Slab, high
reinforcement ratio, and
concrete compressive strength
of40MPa.
C40 HR-1L
Strengthened slab with one layer
of CFRP, with high
reinforcement ratio, and
concrete compressive strength
of40MPa.
C40 HR-2L
Strengthened slab with two
layers of CFRP, with high
reinforcement ratio, and
concrete compressive strength
of40MPa.
C70 LR-C
Control Slab, low reinforcement
ratio, and concrete compressive
strength of70MPa.
C70 LR-1L
Strengthened slab with one layer
of CFRP, with low
reinforcement ratio, and
concrete compressive strength
of70MPa.
C70 LR-2L
Strengthened slab with two
layers of CFRP, with low
reinforcement ratio, and
concrete compressive strength
of70MPa.
100 mm
300 mm
180 mm
75 mm
100 2 Φ 12mm
100 mm
300 mm
180 mm
75 mm
2 Φ 16mm
100 mm
300 mm
180 mm
75 mm
100 mm 2 Φ 16mm
100 mm
300 mm
180 mm
75 mm
100 2 Φ 16mm
100 mm
300 mm
180 mm
75 mm
2 Φ 8mm
100 mm
300 mm
180 mm
75 mm
100 mm 2 Φ 8mm
100 mm
300 mm
180 mm
75 mm
100 2 Φ 8mm

40
C70 MR-C
Control Slab, medium
reinforcement ratio, and
concrete compressive strength
of70MPa.
C70 MR-1L
Strengthened slab with one layer
of CFRP, with medium
reinforcement ratio, and
concrete compressive strength
of70MPa.
C70 MR-2L
Strengthened slab with two
layers of CFRP, with medium
reinforcement ratio, and
concrete compressive strength
of70MPa.
C70 HR-C
Control Slab, high
reinforcement ratio, and
concrete compressive strength
of70MPa.
C70 HR-1L
Strengthened slab with one layer
of CFRP, with high
reinforcement ratio, and
concrete compressive strength
of70MPa.
C70 HR-2L
Strengthened slab with two
layers of CFRP, with high
reinforcement ratio, and
concrete compressive strength
of70MPa.
C100 LR-C
Control Slab, low reinforcement
ratio, and concrete compressive
strength of100MPa.
100 mm
300 mm
180 mm
75 mm
2 Φ 12mm
100 mm
300 mm
180 mm
75 mm
100 mm 2 Φ 12mm
100 mm
300 mm
180 mm
75 mm
100 2 Φ 12mm
100 mm
300 mm
180 mm
75 mm
2 Φ 16mm
100 mm
300 mm
180 mm
75 mm
100 mm 2 Φ 16mm
100 mm
300 mm
180 mm
75 mm
100 2 Φ 16mm
100 mm
300 mm
180 mm
75 mm
2 Φ 8mm
41
C100 LR-1L
Strengthened slab with one layer
of CFRP, with low
reinforcement ratio, and
concrete compressive strength
of100MPa.
C100 LR-2L
Strengthened slab with two
layers of CFRP, with low
reinforcement ratio, and
concrete compressive strength
of100MPa.
C100 MR-C
Control Slab, medium
reinforcement ratio, and
concrete compressive strength
of100MPa.
C100 MR-1L
Strengthened slab with one layer
of CFRP, with medium
reinforcement ratio, and
concrete compressive strength
of100MPa.
C100 MR-2L
Strengthened slab with two
layers of CFRP, with medium
reinforcement ratio, and
concrete compressive strength
of100MPa.
C100 HR-C
Control Slab, high
reinforcement ratio, and
concrete compressive strength
of100MPa.
C100 HR-1L
Strengthened slab with one layer
of CFRP, with high
reinforcement ratio, and
concrete compressive strength
of100MPa.
100 mm
300 mm
180 mm
75 mm
100 2 Φ 8mm
100 mm
300 mm
180 mm
75 mm
100 mm 2 Φ 8mm
100 mm
300 mm
180 mm
75 mm
2 Φ 12mm
100 mm
300 mm
180 mm
75 mm
100 mm 2 Φ 12mm
100 mm
300 mm
180 mm
75 mm
100 2 Φ 12mm
100 mm
300 mm
180 mm
75 mm
2 Φ 16mm
100 mm
300 mm
180 mm
75 mm
100 mm 2 Φ 16mm

42
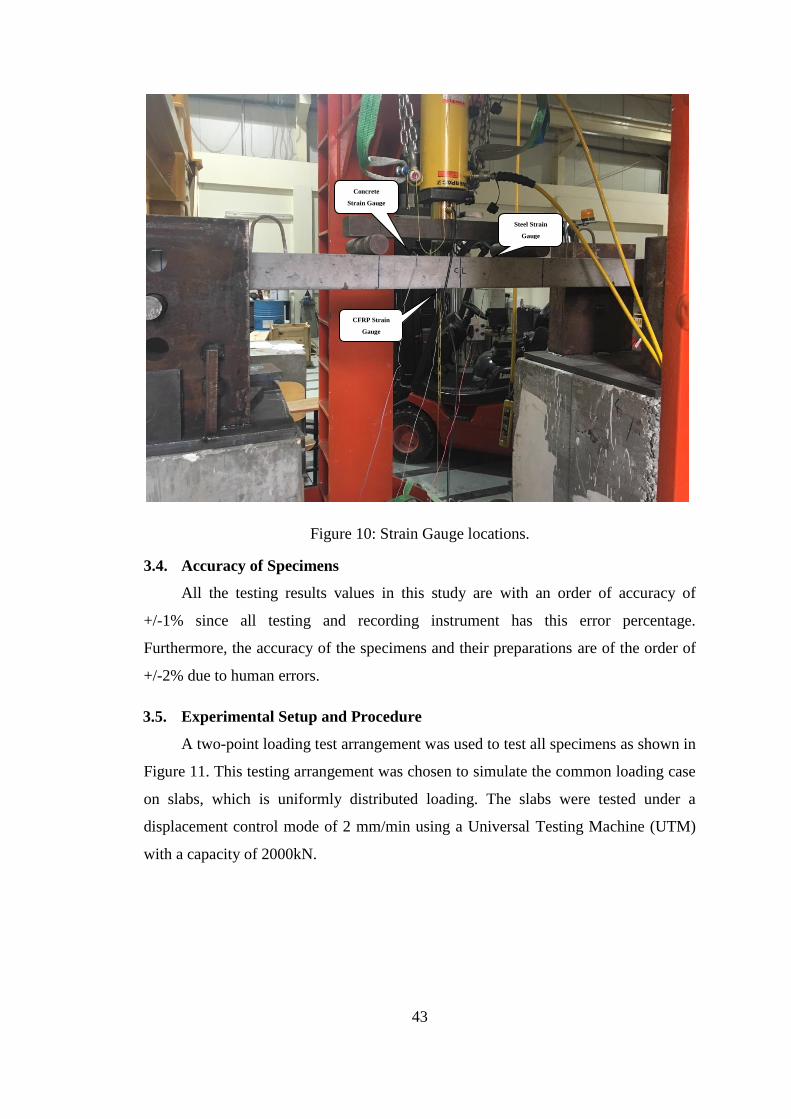
3.3. Instrumentation (Strain Gauges)
Figure 9 shows the locations of the strain gauges on the slabs. Strain gauges
were installed primarily on the concrete, steel, and CFRP materials along the
horizontal axis of the slab specimen at the slab's mid-span as shown in Figure 9.
Figure 9: Strain Gauge locations.
The strain gauges used for each material is specific to the material type. The
different sizes are due to the nature of the pre-failure behavior that is developed on the
material and the sensitivity of the strain gauge.
Figure 10 shows typical slab sample instrumentation with strain gauges. All
strain gauges were monitored and the strain values were recorded using data
acquisition system with a recording capacity of 100 Hz.
C100 HR-2L
Strengthened slab with two
layers of CFRP, with high
reinforcement ratio, and
concrete compressive strength
of100MPa.
100 mm
300 mm
180 mm
75 mm
100 2 Φ 16mm
PP
567 mm
Concrete Strain Gauge (50 mm long)
Steel Strain Gauge (15 mm long)
CFRP Strain Gauge (10 mm long)
43
Figure 10: Strain Gauge locations.
3.4. Accuracy of Specimens
All the testing results values in this study are with an order of accuracy of
+/-1% since all testing and recording instrument has this error percentage.
Furthermore, the accuracy of the specimens and their preparations are of the order of
+/-2% due to human errors.
3.5. Experimental Setup and Procedure
A two-point loading test arrangement was used to test all specimens as shown in
Figure 11. This testing arrangement was chosen to simulate the common loading case
on slabs, which is uniformly distributed loading. The slabs were tested under a
displacement control mode of 2 mm/min using a Universal Testing Machine (UTM)
with a capacity of 2000kN.
Steel Strain
Gauge
Concrete
Strain Gauge
CFRP Strain
Gauge

44
Figure 11: General Test Arrangement
P
567 mm h = 100 mm 550 mm 550 mm 600 mm
150 mm 150
1700 mm
45
Chapter 4: Experimental Results and Discussion
4.1. Load versus Micro-strain, and Failure Modes
In this chapter the experimental results are presented in the form of load
versus strain graphs in the concrete, steel, and CFRP respectively. In addition, the
failure mode of each specimen is discussed. All slab specimens were tested in two-
points loading arrangement with many parameters recorded such as: load versus mid-
span deflection, and load versus strain in steel, concrete, and CFRP where applicable.
The recorded data afterwards was plotted and discussed in the subsequent sections of
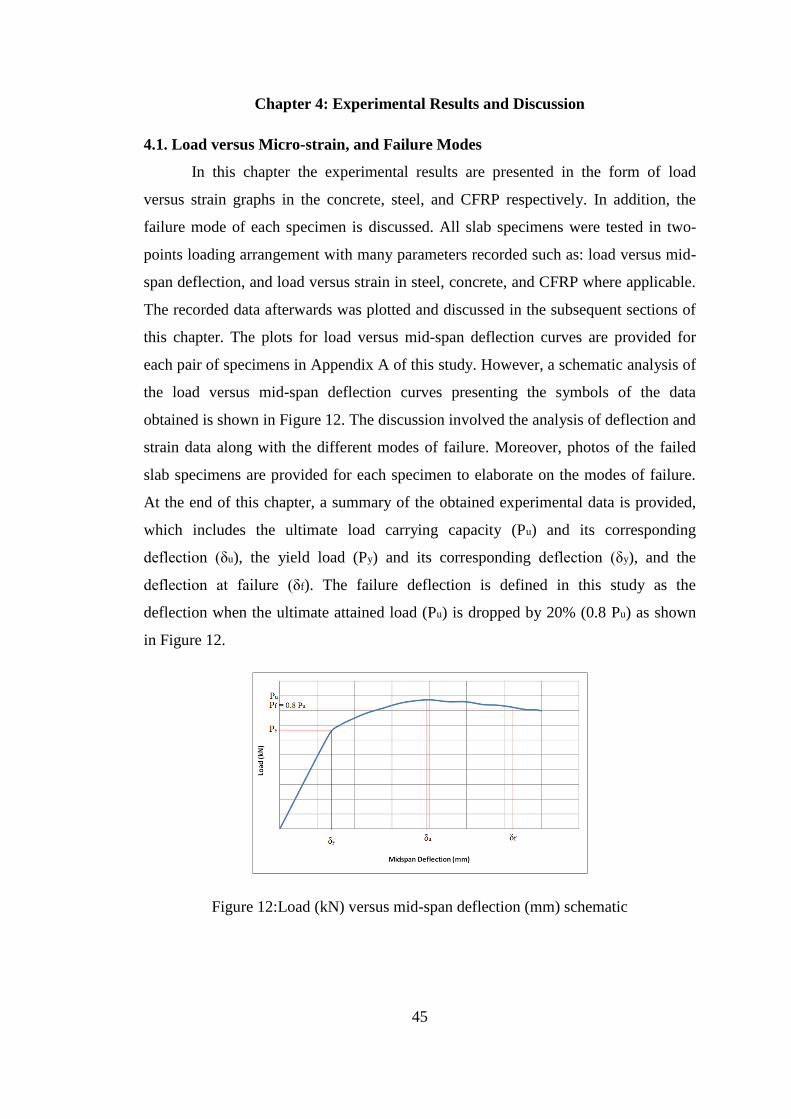
this chapter. The plots for load versus mid-span deflection curves are provided for
each pair of specimens in Appendix A of this study. However, a schematic analysis of
the load versus mid-span deflection curves presenting the symbols of the data
obtained is shown in Figure 12. The discussion involved the analysis of deflection and
strain data along with the different modes of failure. Moreover, photos of the failed
slab specimens are provided for each specimen to elaborate on the modes of failure.
At the end of this chapter, a summary of the obtained experimental data is provided,
which includes the ultimate load carrying capacity (Pu) and its corresponding
deflection (δu), the yield load (Py) and its corresponding deflection (δy), and the
deflection at failure (δf). The failure deflection is defined in this study as the
deflection when the ultimate attained load (Pu) is dropped by 20% (0.8 Pu) as shown
in Figure 12.
Figure 12:Load (kN) versus mid-span deflection (mm) schematic
46
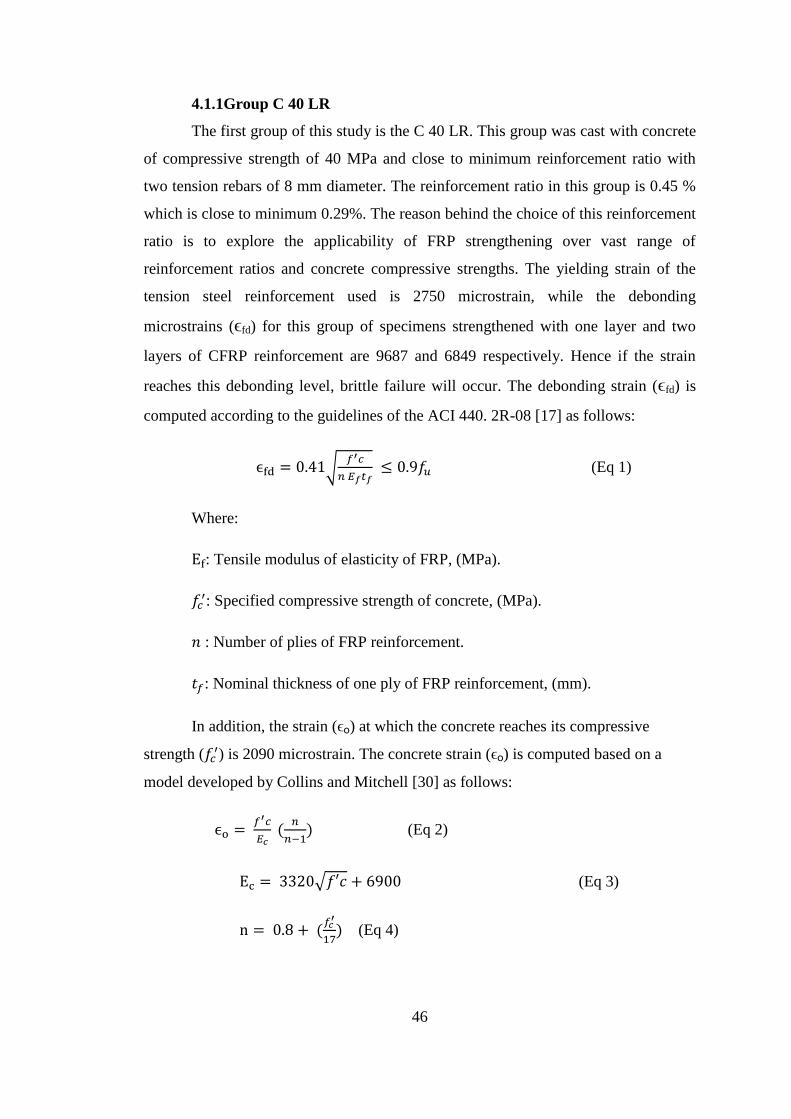
4.1.1Group C 40 LR
The first group of this study is the C 40 LR. This group was cast with concrete
of compressive strength of 40 MPa and close to minimum reinforcement ratio with
two tension rebars of 8 mm diameter. The reinforcement ratio in this group is 0.45 %
which is close to minimum 0.29%. The reason behind the choice of this reinforcement
ratio is to explore the applicability of FRP strengthening over vast range of
reinforcement ratios and concrete compressive strengths. The yielding strain of the
tension steel reinforcement used is 2750 microstrain, while the debonding
microstrains (ϵfd) for this group of specimens strengthened with one layer and two
layers of CFRP reinforcement are 9687 and 6849 respectively. Hence if the strain
reaches this debonding level, brittle failure will occur. The debonding strain (ϵfd) is
computed according to the guidelines of the ACI 440. 2R-08 [17] as follows:
ϵfd = 0.41√𝑓′𝑐
𝑛 𝐸𝑓𝑡𝑓 ≤ 0.9𝑓𝑢 (Eq 1)
Where:
Ef: Tensile modulus of elasticity of FRP, (MPa).
𝑓𝑐′: Specified compressive strength of concrete, (MPa).
𝑛 : Number of plies of FRP reinforcement.
𝑡𝑓: Nominal thickness of one ply of FRP reinforcement, (mm).
In addition, the strain (ϵο) at which the concrete reaches its compressive
strength (𝑓𝑐′) is 2090 microstrain. The concrete strain (ϵο) is computed based on a
model developed by Collins and Mitchell [30] as follows:
ϵo = 𝑓′𝑐
𝐸𝑐 (
𝑛
𝑛−1) (Eq 2)
Ec = 3320√𝑓′𝑐 + 6900 (Eq 3)
n = 0.8 + (𝑓𝑐
′
17) (Eq 4)

47
where:
𝐸𝑐: Concrete modulus of elasticity, (MPa).
𝑓𝑐′: Specified compressive strength of concrete, (MPa).
𝑛 : Curve fitting factor.
4.1.1.1 Control slab (C 40 LR C)
The control slab achieved an ultimate load (Pu) of 11.63 kN with a
corresponding deflection (δu) of 21.01 mm. The deflection at which the steel yielded
(δy) was 1.93 mm and the failure deflection (δf) was 31.07 mm. The failure mode of
the slab matched the failure mode of an under-reinforced slab which was initiated
with the yielding of the steel, followed by tensile membrane action failure without
concrete crushing at the top. The tensile membrane action failure mode happens when
the reinforcement ratio is close to the minimum, at which the neutral axis of the
concrete goes up close to the top compression fibers, and the concrete becomes under
tension. This condition happens when slabs’ experiences after the flexural mechanism
fail and undergo big deformations. Figure13 shows the load versus strain response
curve in the concrete and steel reinforcement of the specimens. It is clearly indicated
that the strain in the concrete in Figure 13 below didn’t reach 2090 microstrain; hence
below the concrete crushing strain level is presented. The failed slab specimen at
failure is shown in Figure 14.
Figure 13: Load versus microstrain for slab specimen (C 40 LR C)
0
2
4
6
8
10
12
14
16
18
-2000 -1500 -1000 -500 0 500 1000 1500
Lo
ad
(k
N)
Microstrain
Concrete
Microstrain
Steel
Microstrain

48
Figure 14: Failed slab specimen (C 40 LR C)
4.1.1.2 Slab (C 40 LR 1L)
This slab was strengthened with one 100 mm width sheet of CFRP attached to
the center of the soffit. It was cast to see the effect of one sheet strengthening on the
increase of load carrying capacity and other properties. The slab ultimate load (Pu)
was 21.69kN with a corresponding deflection (δu) of 19.86 mm. The deflection at
which the steel yielded (δy) was 0.91 mm and the failure deflection (δf) was 23.3 mm.
The failure mode of this slab started with the steel yielding followed by the CFRP
debonding and membrane action failure. The load versus micro-strain graph is shown
in Figure 15 to illustrate the mode of failure. The maximum microstrain in the
concrete was less than 2090 which indicates that no crushing happened. On the other
hand, the microstrain in the steel reached 2750, which is the yield strain. Moreover,
the microstrain in the CFRP reached below 9687, which is the debonding strain;
hence it supports the argument on the brittle failure of the specimen. Figure 16 shows
the failed specimen.

49
Figure 15: Load versus microstrain slab specimen (C 40 LR 1L)
Figure 16: Failed slab specimen (C 40 LR 1L)
4.1.1.3 Slab (C 40 LR 2L)
This slab was strengthened with two 100 mm width sheet of CFRP attached to
the center of the soffit. This slab was cast to see the effect of two sheet strengthening
0
5
10
15
20
25
-2000 -1000 0 1000 2000 3000 4000
Lo
ad
(k
N)
Microstrain
Concrete Microstrain
Steel Microstrain
CFRP Microstrain
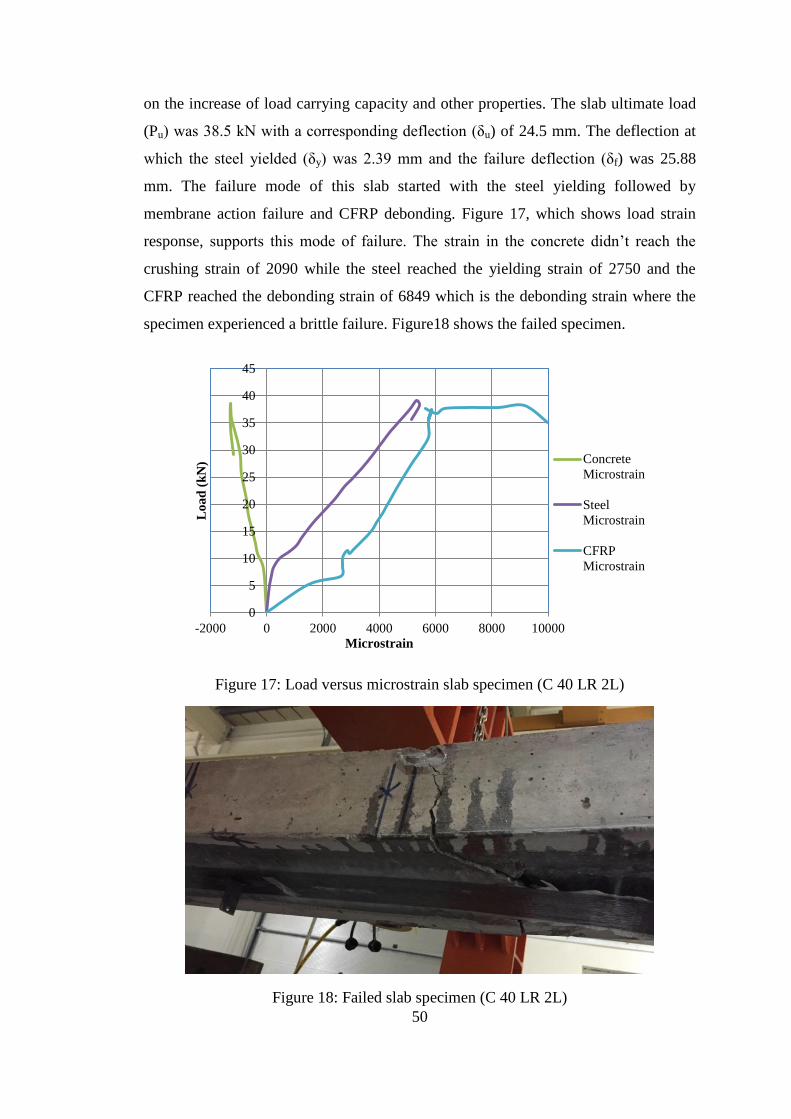
50
on the increase of load carrying capacity and other properties. The slab ultimate load
(Pu) was 38.5 kN with a corresponding deflection (δu) of 24.5 mm. The deflection at
which the steel yielded (δy) was 2.39 mm and the failure deflection (δf) was 25.88
mm. The failure mode of this slab started with the steel yielding followed by
membrane action failure and CFRP debonding. Figure 17, which shows load strain
response, supports this mode of failure. The strain in the concrete didn’t reach the
crushing strain of 2090 while the steel reached the yielding strain of 2750 and the
CFRP reached the debonding strain of 6849 which is the debonding strain where the
specimen experienced a brittle failure. Figure18 shows the failed specimen.
Figure 17: Load versus microstrain slab specimen (C 40 LR 2L)
Figure 18: Failed slab specimen (C 40 LR 2L)
0
5
10
15
20
25
30
35
40
45
-2000 0 2000 4000 6000 8000 10000
Lo
ad
(k
N)
Microstrain
Concrete
Microstrain
Steel
Microstrain
CFRP
Microstrain

51
4.1.2 Group C 40 MR
The second group of this study is the C 40 MR. This group was cast with
concrete of compressive strength of 40 MPa and a reinforcement ratio between the
minimum and the maximum reinforcement ratio with two tension rebars of 12 mm
diameter. The reinforcement ratio in this group is 1.0 %. The reason behind the choice
of this reinforcement ratio is to explore the applicability of FRP strengthening over
vast range of reinforcement ratios and concrete compressive strengths. The yielding
strain for the tension steel used is 2750 microstrain, while the debonding microstrains
of this group of one layer and two layers strengthened are 9687 and 6849 respectively;
hence if the strain reaches this level, a brittle failure is bound to happen. In addition,
the strain (ϵο) at which the concrete reaches its compressive strength (𝑓𝑐′) is 2090
microstrain.
4.1.2.1 Control slab (C 40 MR C)
The slab ultimate load (Pu) was 22.6 kN with a corresponding deflection (δu)
of 28.4 mm. The deflection at which the steel yielded (δy) was 1.3 mm and the failure
deflection (δf) was 29.2 mm. The failure mode of the slab started with the yielding of
the steel, followed by concrete crushing at the top with the neutral axis shifting up.
The load versus micro-strain graph is shown in Figure 19. Figure 20 shows the failed
specimen. The strain in the concrete almost reached the crushing strain of 2090, while
the strain in the steel reached the yielding strain of 2750.
Figure 19: Load versus microstrain for slab specimen (C 40 MR C)
0
5
10
15
20
25
30
-4000 -2000 0 2000 4000 6000 8000
Lo
ad
(k
N)
Microstrain
Concrete
Microstrai
n

52
Figure 20: Failed slab specimen (C 40 MR C)
4.1.2.3 Slab (C 40 MR 1L)
This slab was strengthened with one 100 mm width sheet of CFRP attached to
the center of the soffit. The load versus micro-strain graph is shown in Figure 21. This
slab was cast to see the effect of strengthening on the increase of load carrying
capacity and other properties. The slab ultimate load (Pu) is 36.9kN with a
corresponding deflection (δu) of 18.6 mm. The deflection at which the steel yielded
(δy) was 1.98 mm and the failure deflection (δf) was 19.38 mm. The failure mode of
this slab started with the steel yielding followed by concrete crushing at the top
shifting the neutral axis up, at the end CFRP debonding. The strain in the concrete
reached near the crushing strain of 2090 while the steel reached the yielding strain of
2750 and the CFRP almost reached the debonding strain of 9687 which is the
debonding strain where the specimen experienced a brittle failure. Figure 22 shows
the failed specimen.

53
Figure 21: Load versus microstrain slab specimen (C 40 MR 1L)
Figure 22: Failed slab specimen (C 40 MR 1L)
0
5
10
15
20
25
30
35
40
-4000 -2000 0 2000 4000 6000
Lo
ad
(k
N)
Microstrain
Concrete
Microstrain
Steel
Microstrain
CFRP
Microstrain

54
4.1.2.2 Slab (C 40 MR 2L)
This slab was strengthened with two 100 mm width sheet of CFRP attached to
the center of the soffit. This slab was cast to see the effect of double sheet
strengthening on the increase of load carrying capacity and other properties. The load
versus micro-strain graph is shown in Figure 23. The slab ultimate load (Pu) was
50.53 kN with a corresponding deflection (δu) of 24.48 mm. The deflection at which
the steel yielded (δy) was 5.03 mm and the failure deflection (δf) was 26 mm. The
failure mode of this slab started with the steel yielding followed by concrete crushing
at the top shifting the neutral axis up, at the end CFRP debonding. The maximum
microstrain in the concrete was near 2090 which indicates that crushing happened at
the top. On the other hand, the microstrain in the steel reached 2750 which is the yield
strain. Moreover, the microstrain in the CFRP reached a little below 6849 which is the
debonding strain; hence it supports the argument about the brittle failure of the
specimen. Figure 24 shows the failed specimen.
Figure 23: Load versus microstrain for slab specimen (C 40 MR 2L)
0
10
20
30
40
50
60
-4000 -2000 0 2000 4000 6000 8000 10000
Lo
ad
(k
N)
Microstrain
Concrete
Microstrain
Steel
Microstrain
CFRP
Microstrain

55
Figure 24: Failed slab specimen (C 40 MR 2L)
4.1.3 Group C 40 HR:
The third group of this study is the C 40 HR. This group was cast with
concrete of compressive strength of 40 MPa and a reinforcement ratio close to the
maximum reinforcement ratio which is 1.83 %, with two tension rebars of 16 mm
diameter. The reinforcement ratio in this group is 1.79 %. The reason behind the
choice of this reinforcement ratio is to explore the applicability of FRP strengthening
over vast range of reinforcement ratios and concrete compressive strengths. The
yielding strain for the tension steel used is 2750 microstrain, while the debonding
microstrains of this group of one layer and two layers strengthened are 9687 and 6849
respectively. Hence, if the strain reaches this level, a brittle failure is bound to happen.
In addition, the strain (ϵο) at which the concrete reaches its compressive strength (𝑓𝑐′)
is 2090 microstrain.
4.1.3.1 Control slab (C 40 HR C)
The slab ultimate load (Pu) was 44.88 kN with a corresponding deflection (δu)
of 21.5 mm. The deflection at which the steel yielded (δy) was 5.37 mm and the
failure deflection (δf) was 22.3 mm. The failure mode of the slab started with the
yielding of the steel, followed by concrete crushing at the top with the neutral axis
shifting up. The strain in the concrete almost reached the crushing strain of 2090,
while the strain in the steel reached the yielding strain of 2750. Figure 25 shows the
load strain response and Figure 26 shows the failed specimen, both of which support
the argument on the mode of failure.
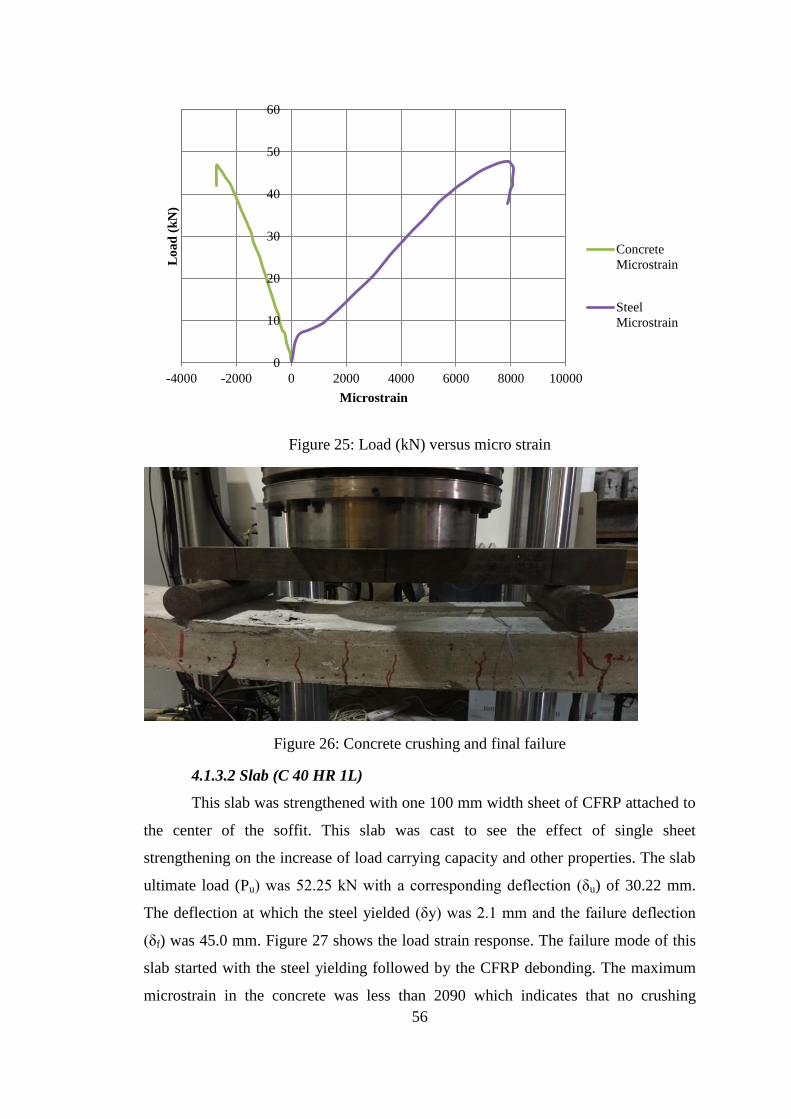
56
Figure 25: Load (kN) versus micro strain
Figure 26: Concrete crushing and final failure
4.1.3.2 Slab (C 40 HR 1L)
This slab was strengthened with one 100 mm width sheet of CFRP attached to
the center of the soffit. This slab was cast to see the effect of single sheet
strengthening on the increase of load carrying capacity and other properties. The slab
ultimate load (Pu) was 52.25 kN with a corresponding deflection (δu) of 30.22 mm.
The deflection at which the steel yielded (δy) was 2.1 mm and the failure deflection
(δf) was 45.0 mm. Figure 27 shows the load strain response. The failure mode of this
slab started with the steel yielding followed by the CFRP debonding. The maximum
microstrain in the concrete was less than 2090 which indicates that no crushing
0
10
20
30
40
50
60
-4000 -2000 0 2000 4000 6000 8000 10000
Lo
ad
(k
N)
Microstrain
Concrete
Microstrain
Steel
Microstrain

57
happened. On the other hand, the microstrain in the steel reached 2750 which is the
yield strain. Moreover, the microstrain in the CFRP reached a little below 9687 which
is the debonding strain; hence it supports the argument about the brittle failure of the
specimen. Figure 28 shows the failed specimen.
Figure 27: Load versus microstrain for slab specimen (C 40 HR 1L)
Figure 28: Failed slab specimen (C 40 HR 1L)
0
5
10
15
20
25
30
35
40
45
50
-4000 -2000 0 2000 4000 6000 8000
Lo
ad
(k
N)
Microstrain
Concrete
Microstrain
Steel
Microstrain
CFRP
Microstrain
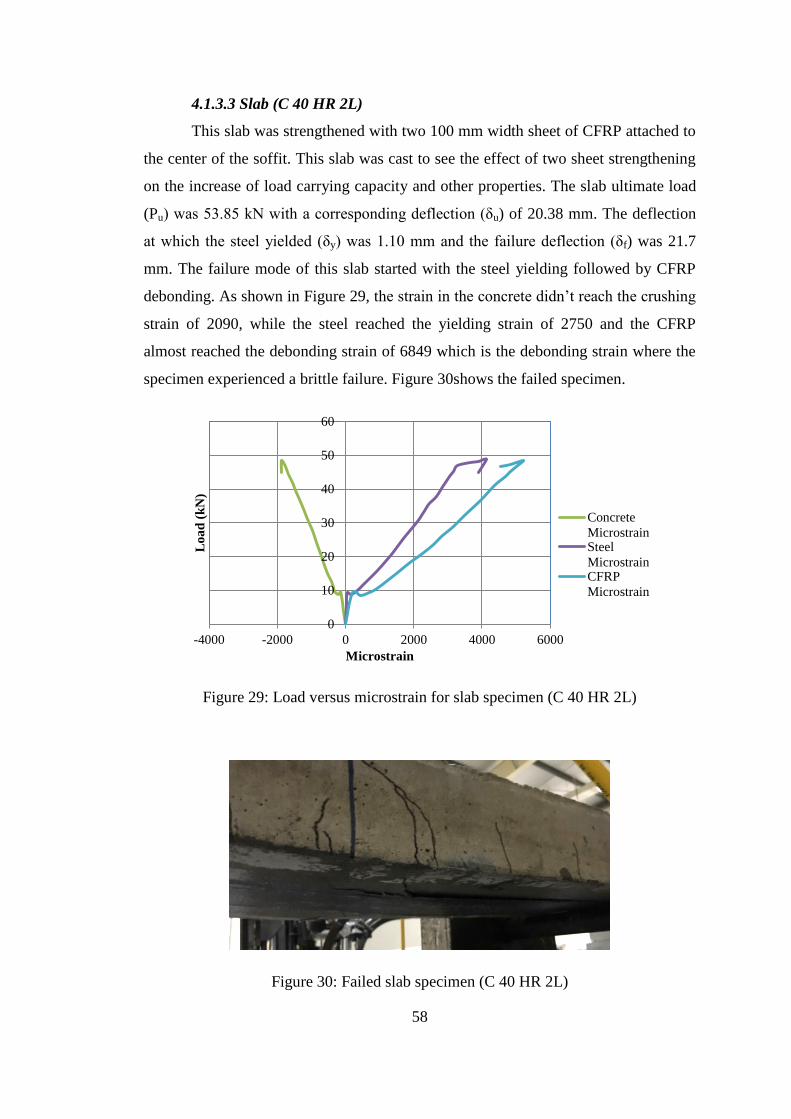
58
4.1.3.3 Slab (C 40 HR 2L)
This slab was strengthened with two 100 mm width sheet of CFRP attached to
the center of the soffit. This slab was cast to see the effect of two sheet strengthening
on the increase of load carrying capacity and other properties. The slab ultimate load
(Pu) was 53.85 kN with a corresponding deflection (δu) of 20.38 mm. The deflection
at which the steel yielded (δy) was 1.10 mm and the failure deflection (δf) was 21.7
mm. The failure mode of this slab started with the steel yielding followed by CFRP
debonding. As shown in Figure 29, the strain in the concrete didn’t reach the crushing
strain of 2090, while the steel reached the yielding strain of 2750 and the CFRP
almost reached the debonding strain of 6849 which is the debonding strain where the
specimen experienced a brittle failure. Figure 30shows the failed specimen.
Figure 29: Load versus microstrain for slab specimen (C 40 HR 2L)
Figure 30: Failed slab specimen (C 40 HR 2L)
0
10
20
30
40
50
60
-4000 -2000 0 2000 4000 6000
Lo
ad
(k
N)
Microstrain
Concrete
MicrostrainSteel
MicrostrainCFRP
Microstrain

59
4.1.4 Group C 70 LR
The fourth group of this study is the C 70 LR. This group was cast with
concrete of compressive strength of 70 MPa and close to minimum reinforcement
ratio with two tension rebars of 8 mm diameter. The reinforcement ratio in this group
is 0.45 % which is close to minimum 0.38%. The reason behind the choice of this
reinforcement ratio is to explore the applicability of FRP strengthening over vast
range of reinforcement ratios and concrete compressive strengths. The yielding strain
for the tension steel used is 2750 microstrain, while the debonding microstrain of this
group of one layer and two layers strengthened are 12600 and 9018 respectively;
hence if the strain reaches this level, a brittle failure is bound to happen. In addition,
the strain (ϵο) at which the concrete reaches its compressive strength (𝑓𝑐′) is 2530
microstrain.
4.1.4.1 Control slab (C 70 LR C)
The slab ultimate load (Pu) was 10.17 kN with a corresponding
deflection (δu) of 11.5 mm. The deflection at which the steel yielded (δy) was 2.06
mm and the failure deflection (δf) was 13. 1 mm. The failure mode of the slab
matches the typical failure mode of an under-reinforced slab which started with the
yielding of the steel, followed by membrane action failure without concrete crushing
at the top. The strain in the concrete didn’t reach the crushing strain of 2530, while the
strain in the steel reached the yielding strain of 2750. Figure 31 shows the load strain
response, andFigure32 shows the failed specimen, both of which support the
argument about the mode of failure.
Figure 31: Load versus microstrain for slab specimen (C 70 LR C)
0
2
4
6
8
10
12
-2000 -1000 0 1000 2000 3000 4000
Lo
ad
(k
N)
Microstrain
Concrete
Microstrain
Steel
Microstrain

60
Figure 32: Slab Steel Rupture and beam failure
4.1.4.2 Slab (C 70 LR 1L)
This slab was strengthened with one 100 mm width sheet of CFRP
attached to the center of the soffit. The load versus micro-strain graph is
shown in Figure 33. This slab was cast to see the effect of strengthening on the
increase of load carrying capacity and other properties. The slab ultimate load
(Pu) is 26.6kN with a corresponding deflection (δu) of 13.46 mm. The
deflection at which the steel yielded (δy) was 1.56 mm and the failure
deflection (δf) was 37.48 mm. The failure mode of this slab started with the
steel yielding followed by the CFRP debonding. Figure 32 shows the mode of
failure. The maximum microstrain in the concrete was less than 2530 which
indicates that no crushing happened, on the other hand, the microstrain in the
steel reached 2750, which is the yield strain. Moreover, the microstrain in the
CFRP was below 12600, which is the debonding strain; hence the brittle
failure of the specimen happened. Figure 34 shows the failed specimen.
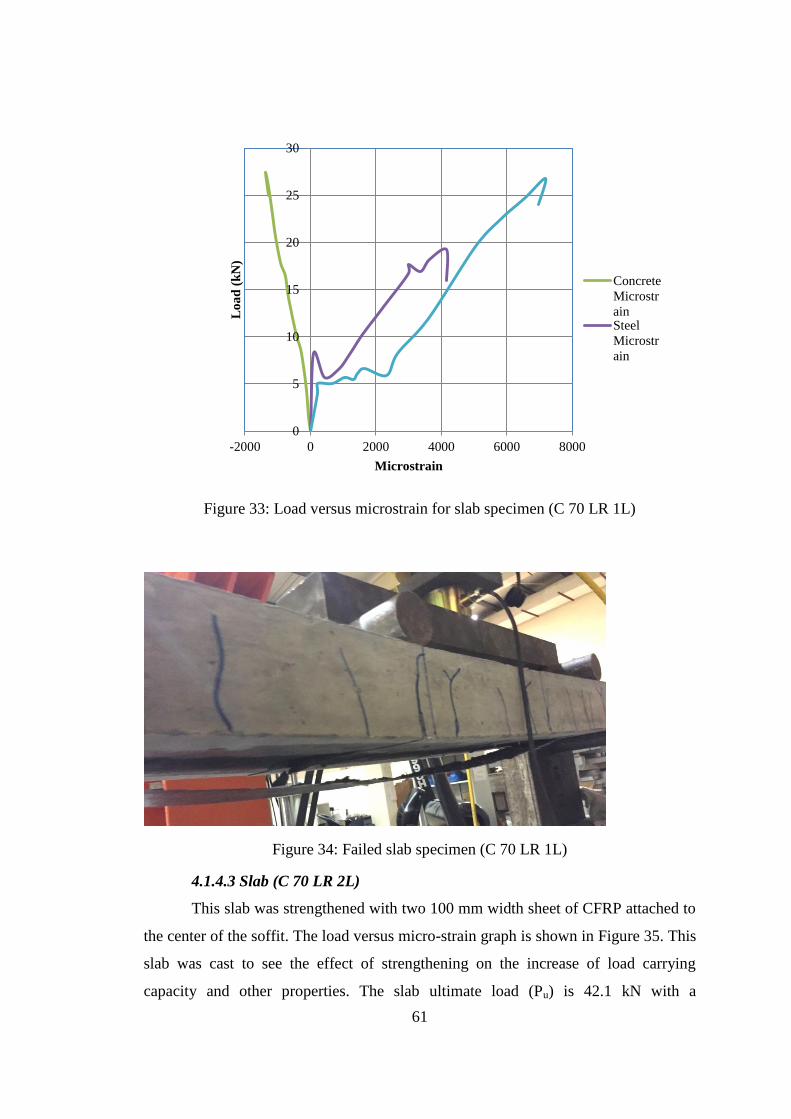
61
Figure 33: Load versus microstrain for slab specimen (C 70 LR 1L)
Figure 34: Failed slab specimen (C 70 LR 1L)
4.1.4.3 Slab (C 70 LR 2L)
This slab was strengthened with two 100 mm width sheet of CFRP attached to
the center of the soffit. The load versus micro-strain graph is shown in Figure 35. This
slab was cast to see the effect of strengthening on the increase of load carrying
capacity and other properties. The slab ultimate load (Pu) is 42.1 kN with a
0
5
10
15
20
25
30
-2000 0 2000 4000 6000 8000
Lo
ad
(k
N)
Microstrain
Concrete
Microstr
ainSteel
Microstr
ain
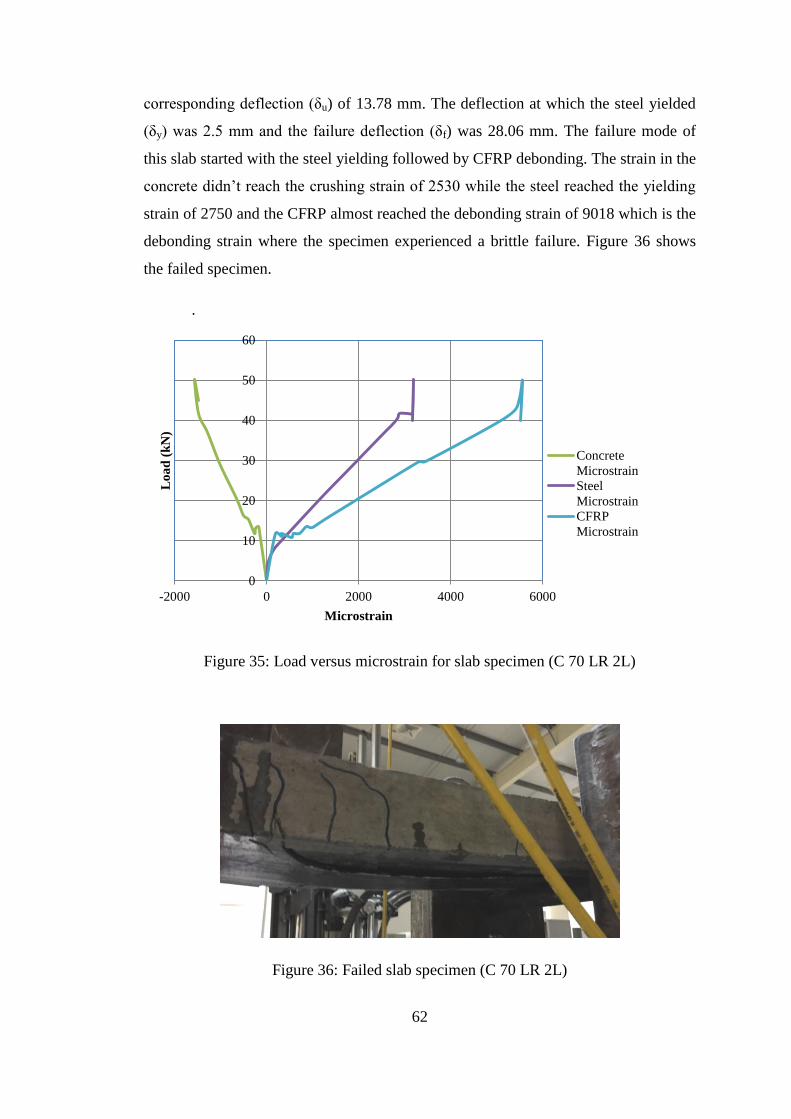
62
corresponding deflection (δu) of 13.78 mm. The deflection at which the steel yielded
(δy) was 2.5 mm and the failure deflection (δf) was 28.06 mm. The failure mode of
this slab started with the steel yielding followed by CFRP debonding. The strain in the
concrete didn’t reach the crushing strain of 2530 while the steel reached the yielding
strain of 2750 and the CFRP almost reached the debonding strain of 9018 which is the
debonding strain where the specimen experienced a brittle failure. Figure 36 shows
the failed specimen.
.
Figure 35: Load versus microstrain for slab specimen (C 70 LR 2L)
Figure 36: Failed slab specimen (C 70 LR 2L)
0
10
20
30
40
50
60
-2000 0 2000 4000 6000
Lo
ad
(k
N)
Microstrain
Concrete
Microstrain
Steel
Microstrain
CFRP
Microstrain

63
4.1.5 Group C 70 MR
The fifth group of this study is the C 70 MR. This group was cast with
concrete of compressive strength of 70 MPa and a reinforcement ratio between the
minimum and the maximum reinforcement ratio with two tension rebars of 12 mm
diameter. The reinforcement ratio in this group is 1.0 %. The reason behind the choice
of this reinforcement ratio is to explore the applicability of FRP strengthening over
vast range of reinforcement ratios and concrete compressive strengths. The yielding
strain for the tension steel used is 2750 microstrain, while the debonding microstrain
of this group one layer and two layers strengthened are 12600 and 9018 respectively,
hence if the strain reaches this level a brittle failure is bound to happen. In addition,
the strain (ϵο) at which the concrete reaches its compressive strength (𝑓𝑐′) is 2530
microstrain.
4.1.5.1 Control Slab (C 70 MR C)
The slab ultimate load (Pu) is 26kN with a corresponding deflection (δu) of
71.75 mm. The deflection at which the steel yielded (δy) was 3.7 mm and the failure
deflection (δf) was 80 mm. The failure mode of the slab started with the yielding of
the steel, followed by membrane action failure followed by concrete crushing at the
top with the neutral axis shifting up. The strain in the concrete almost reached the
crushing strain of 2530, while the strain in the steel reached the yielding strain of
2750. Figure37 shows the load strain response, andFigure38 shows the failed
specimen, both of which support the argument about the mode of failure.
Figure 37: Load versus microstrain for slab specimen (C 70 MR C)
0
5
10
15
20
25
30
-4000 -2000 0 2000 4000 6000
Lo
ad
(k
N)
Microstrain
Concrete
Microstrai
nSteel
Microstrai
n

64
Figure 38: Failed slab specimen (C 70 MR C)
4.1.5.2 Slab (C 70 MR 1L)
This slab was strengthened with one 100 mm width sheet of CFRP attached to
the center of the soffit. This slab was cast to see the effect of one sheet strengthening
on the increase of load carrying capacity and other properties. The load versus micro-
strain graphs is shown in Figure 39. The slab ultimate load (Pu) is 45.2kN with a
corresponding deflection (δu) of 33.57mm. The deflection at which the steel yielded
(δy) was 2.1 mm and the failure deflection (δf) was 37.35 mm. The failure mode of
this slab started with the steel yielding followed by the CFRP debonding. The
maximum microstrain in the concrete was less than 2530 which indicates that no
crushing happened, on the other hand, the microstrain in the steel reached 2750 which
is the yield strain. Moreover, the microstrain in the CFRP was below 12600 which is
the debonding strain; hence the brittle failure of the specimen happened. Figure 40
shows the failed specimen.

65
Figure 39: Load versus microstrain for slab specimen (C 70 MR 1L)
Figure 40: Failed slab specimen (C 70 MR 1L)
0
10
20
30
40
50
60
-4000 -2000 0 2000 4000 6000 8000 10000
Lo
ad
(k
N)
Microstrain
Concrete
Microstrain
Steel
Microstrain
CFRP
Microstrain

66
4.1.5.3 Slab (C 70 MR 2L)
This slab was strengthened with two 100 mm width sheet of CFRP attached to
the center of the soffit. This slab was cast to see the effect of double sheet
strengthening on the increase of load carrying capacity and other properties. The load
versus micro-strain graphs is shown in Figure 41. The slab ultimate load (Pu) was
47.44 kN with a corresponding deflection (δu) of 25.67 mm. The deflection at which
the steel yielded (δy) was 2.3 mm and the failure deflection (δf) was 33.33 mm. The
failure mode of this slab started with the steel yielding followed by CFRP debonding.
The strain in the concrete didn’t reach the crushing strain of 2530 while the steel
reached the yielding strain of 2750 and the CFRP almost reached the debonding strain
of 9018 where the specimen experienced a brittle failure. Figure42 shows the failed
specimen.
Figure 41: Load versus microstrain for slab specimen (C 70 MR 2L)
0
10
20
30
40
50
60
-2000 0 2000 4000 6000 8000
Lo
ad
(k
N)
Microstrain
Concrete
Microstrain
Steel
Microstrain
CFRP
Microstrain

67
Figure 42: Failed slab specimen (C 70 MR 2L)
4.1.6 Group C 70 HR:
The sixth group of this study is the C 70 HR. This group was cast with
concrete of compressive strength of 70 MPa and a reinforcement ratio close to the
maximum reinforcement ratio which is 2.30 %, with two tension rebars of 16 mm
diameter. The reinforcement ratio in this group is 1.79 %. The reason behind the
choice of this reinforcement ratio is to explore the applicability of FRP strengthening
over vast range of reinforcement ratios and concrete compressive strengths. The
yielding strain for the tension steel used is 2750 microstrain, while the debonding
microstrain of this group one layer and two layers strengthened are 12600 and 9018
respectively, hence if the strain reaches this level a brittle failure is bound to happen.
In addition, the strain (ϵο) at which the concrete reaches its compressive strength (𝑓𝑐′)
is 2530 microstrain.
4.1.6.1 Control slab (C 70 HR C)
The slab ultimate load (Pu) is 33.04kN with a corresponding deflection (δu) of
35.77 mm. The deflection at which the steel yielded (δy) was 1.1 mm and the failure
deflection (δf) was 40.45 mm. The failure mode of the slab started with the yielding of
the steel, followed by concrete crushing at the top with the neutral axis shifting up.
The strain in the concrete almost reached the crushing strain of 2530, while the strain
in the steel reached the yielding strain of 2750. Figure 43 shows the load strain

68
response, and Figure 44 shows the failed specimen, both of which support the
argument about the mode of failure.
Figure 43: Load versus microstrain for slab specimen (C 70 HR C)
Figure 44: Failed slab specimen (C 70 HR C)

69
4.1.6.2 Slab (C 70 HR 1L)
This slab was strengthened with one 100 mm width sheet of CFRP attached to
the center of the soffit. The load versus micro-strain graphs is shown in Figure 45.
This slab was cast to see the effect of single sheet strengthening on the increase of
load carrying capacity and other properties. The slab ultimate load (Pu) is 56.08kN
with a corresponding deflection (δu) of 34.91 mm. The deflection at which the steel
yielded (δy) was 3.6 mm and the failure deflection (δf) was 36.01 mm. The failure
mode of this slab started with the steel yielding followed by concrete crushing at the
top shifting the neutral axis up, at the end CFRP debonding. The maximum
microstrain in the concrete was near 2530 which indicates that crushing happened at
the top. On the other hand, the microstrain in the steel reached 2750 which is the yield
strain. Moreover, the microstrain in the CFRP was below 12600 which is the
debonding strain; hence the brittle failure of the specimen happened. Figure 46 shows
the failed specimen.
Figure 45: Load versus microstrain for slab specimen (C 70 HR 1L)
0
10
20
30
40
50
60
-4000 -2000 0 2000 4000 6000 8000 10000
Lo
ad
(k
N)
Microstrain
Concrete
Microstrain
Steel
Microstrain
CFRP
Microstrain

70
Figure 46: Failed slab specimen (C 70 HR 1L)
4.1.6.3Slab (C 70 HR 2L)
This slab was strengthened with two 100 mm width sheet of CFRP attached to
the center of the soffit. This slab was cast to see the effect of double sheet
strengthening on the increase of load carrying capacity and other properties. The load
versus micro-strain graphs are shown in Figure 47. The slab ultimate load (Pu) is
59.3kN with a corresponding deflection (δu) of 30.95 mm. The deflection at which the
steel yielded (δy) was 2.15 mm and the failure deflection (δf) was 31.67 mm. The
failure mode of this slab started with the steel yielding followed by concrete crushing
at the top shifting the neutral axis up, at the end CFRP debonding. The strain in the
concrete was near the crushing strain of 2530 while the steel reached the yielding
strain of 2750 and the CFRP almost reached the debonding strain of 9018 where the
specimen experienced a brittle failure. Figure 48supports the claim of the mode of
failure.

71
Figure 47: Load versus microstrain slab specimen (C 70 HR 2L)
Figure 48: Failed slab specimen (C 70 HR 2L)
4.1.7 Group C 100 LR
The seventh group of this study is the C 100 LR. This group was cast with
concrete of compressive strength of 100 MPa and equal to minimum reinforcement
0
10
20
30
40
50
60
70
-4000 -2000 0 2000 4000 6000 8000
Lo
ad
(k
N)
Microstrain
Concrete
Microstrain
Steel
Microstrain
CFRP
Microstrain

72
ratio with two tension rebars of 8 mm diameter. The reinforcement ratio in this group
is 0.45 % which is equal to minimum 0.45%. The reason behind the choice of this
reinforcement ratio is to explore the applicability of FRP strengthening over vast
range of reinforcement ratios and concrete compressive strengths. The yielding strain
for the tension steel used is 2750 microstrain, while the debonding microstrain of this
group one layer and two layers strengthened are 12600 and 10718 respectively, hence
if the strain reaches this level, a brittle failure is bound to happen. In addition, the
strain (ϵο) at which the concrete reaches its compressive strength ( 𝑓𝑐′ ) is 2930
microstrain.
4.1.7.1 Control slab (C 100 LR C)
The slab ultimate load (Pu) is 10.73kN with a corresponding deflection (δu) of
40.86 mm. The deflection at which the steel yielded (δy) was 2.42 mm and the failure
deflection (δf) was 41.34 mm. The failure mode of the slab matches the typical failure
mode of an under-reinforced slab which started with the yielding of the steel,
followed by the membrane action failures without concrete crushing at the top. The
strain in the concrete didn't reach the crushing strain of 2930, while the strain in the
steel reached the yielding strain of 2750. Figure 49 shows the load strain response,
and Figure 50 shows the failed specimen, both of which support the argument on the
mode of failure.
Figure 49: Load versus microstrain for slab specimen (C 100 LR C)
0
2
4
6
8
10
12
14
-2000 -1000 0 1000 2000 3000 4000
Lo
ad
(k
N)
Microstrain
Concrete
Microstrain
Steel
Microstrain

73
Figure 50: Failed slab specimen (C 100 LR C)
4.1.7.2 Slab (C 100 LR 1L)
This slab was strengthened with one 100 mm width sheet of CFRP attached to
the center of the soffit. This slab was cast to see the effect of single sheet
strengthening on the increase of load carrying capacity and other properties. The slab
ultimate load (Pu) is 30.56 kN with a corresponding deflection (δu) of 29.8 mm. The
deflection at which the steel yielded (δy) was 1.8 mm and the failure deflection (δf)
was 34.8 mm. The failure mode of this slab started with the steel yielding followed by
the CFRP debonding. Figure 51shows the load strain response and Figure 52 shows
the failed specimen, both of which support the claim about the failure mode. The
maximum microstrain in the concrete was less than 2930 which indicates that no
crushing happened, on the other hand, the microstrain in the steel reached 2750 which
is the yield strain. Moreover, the microstrain in the CFRP was below 12600 which is
the debonding strain; hence the brittle failure of the specimen happened.

74
Figure 51: Load versus microstrain for slab specimen (C 100 LR 1L)
Figure 52: Failed slab specimen (C 100 LR 1L)
4.1.7.3 Slab (C 100 LR 2L)
This slab was strengthened with two 100 mm width sheet of CFRP attached to
the center of the soffit. This slab was cast to see the effect of double sheet
strengthening on the increase of load carrying capacity and other properties. The load
versus microstrain graph is shown in Figure 53. The slab ultimate load (Pu) is 40.2 kN
0
5
10
15
20
25
30
35
-2000 0 2000 4000 6000 8000
Lo
ad
(k
N)
Microstrain
Concrete Microstrain
Steel Microstrain
CFRP Microstrain

75
with a corresponding deflection (δu) of 11.95 mm. The deflection at which the steel
yielded (δy) was 0.23 mm and the failure deflection (δf) was 12.25 mm. The failure
mode of this slab started with the steel yielding followed by CFRP debonding. Figure
54 shows the mode of failure. The strain in the concrete didn’t reach the crushing
strain of 2930 while the steel reached the yielding strain of 2750 and the CFRP almost
reached the debonding strain of 10718 which is the debonding strain where the
specimen experienced a brittle failure.
Figure 53: Load versus microstrain for slab specimen (C 100 LR 2L)
Figure 54: Failed slab specimen (C 100 LR 2L)
0
5
10
15
20
25
30
35
40
45
-2000 0 2000 4000 6000 8000
Lo
ad
(k
N)
Microstrain
Concrete
MicrostrainSteel
MicrostrainCFRP
Microstrain

76
4.1.8 Group C 100 MR
The eighth group of this study is the C 100 MR. This group was cast with
concrete of compressive strength of 100 MPa and a reinforcement ratio between the
minimum and the maximum reinforcement ratio with two tension rebars of 12 mm
diameter. The reinforcement ratio in this group is 1.0 %. The reason behind the choice
of this reinforcement ratio is to explore the applicability of FRP strengthening over
vast range of reinforcement ratios and concrete compressive strengths. The yielding
strain for the tension steel used is 2750 microstrain, while the debonding microstrain
of this group one layer and two layers strengthened are 12600 and 10718 respectively,
hence if the strain reaches this level, a brittle failure is bound to happen. In addition,
the strain (ϵο) at which the concrete reaches its compressive strength (𝑓𝑐′) is 2930
microstrain.
4.1.8.1 Control slab (C 100 MR C)
The slab ultimate load (Pu) is 38.75 kN with a corresponding deflection (δu) of
32.45 mm. The deflection at which the steel yielded (δy) was 0.83 mm and the failure
deflection (δf) was 35.68 mm. The failure mode of the slab started with the yielding of
the steel, followed by concrete crushing at the top with the neutral axis shifting up.
The strain in the concrete almost reached the crushing strain of 2930, while the strain
in the steel reached the yielding strain of 2750. Figure 55 shows the load strain
response, and Figure 56 shows the failed specimen, both of which support the
argument about the mode of failure.
Figure 55: Load versus microstrain for slab specimen (C 100 MR C)
0
5
10
15
20
25
30
35
40
45
50
-4000 -2000 0 2000 4000 6000
Lo
ad
(k
N)
Microstrain
Concrete
Microstrain
Steel
Microstrain

77
Figure 56: Failed slab specimen (C 100 MR C)
4.1.8.2 Slab (C 100 MR 1L)
This slab was strengthened with one 100 mm width sheet of CFRP attached to
the center of the soffit. This slab was cast to see the effect of single sheet
strengthening on the increase of load carrying capacity and other properties. The slab
ultimate load (Pu) is 43.5kN with a corresponding deflection (δu) of 27.15 mm. The
deflection at which the steel yielded (δy) was 1.83 mm and the failure deflection (δf)
was 38.88 mm. The load versus micro-strain graph is shown in Figure 57. The failure
mode of this slab started with the steel yielding followed by the CFRP debonding.
The maximum microstrain in the concrete was less than 2930 which indicates that no
crushing happened, on the other hand, the microstrain in the steel reached 2750 which
is the yield strain. Moreover, the microstrain in the CFRP was below 12600 which is
the debonding strain; hence the brittle failure of the specimen happened. Figure 58
shows the failed specimen.

78
Figure 57: Load versus microstrain for slab specimen (C 100 MR 1L)
Figure 58: Failed slab specimen (C 100 MR 1L)
0
10
20
30
40
50
60
70
-4000 -2000 0 2000 4000 6000 8000 10000 12000
Lo
ad
(k
N)
Microstrain
Concrete
Microstrain
Steel
Microstrain
CFRP
Microstrain

79
4.1.8.3 Slab (C 100 MR 2L)
This slab was strengthened with two 100 mm width sheet of CFRP attached to
the center of the soffit. This slab was cast to see the effect of double sheet
strengthening on the increase of load carrying capacity and other properties. The slab
ultimate load (Pu) is 49.58kN with a corresponding deflection (δu) of 24.3 mm. The
deflection at which the steel yielded (δy) was 0.78 mm and the failure deflection (δf)
was 24.86 mm. The load versus micro-strain graphs is shown in Figure 59. The failure
mode of this slab started with the steel yielding followed by CFRP debonding. The
strain in the concrete didn’t reach the crushing strain of 2930 while the steel reached
the yielding strain of 2750 and the CFRP almost reached the debonding strain of
10718 where the specimen experienced a brittle failure. Figure 60 shows the failed
specimen.
Figure 59: Load versus microstrain for slab specimen (C 100 MR 2L)
0
10
20
30
40
50
60
-4000 -2000 0 2000 4000 6000 8000
Lo
ad
(k
N)
Microstrain
Concrete
Microstrain
Steel
Microstrain
CFRP
Microstrain

80
Figure 60: Failed slab specimen (C 100 MR 2L)
4.1.9 Group C 100 HR
The ninth group of this study is the C 100 HR. This group was cast with
concrete of compressive strength of 100 MPa and a reinforcement ratio close to the
maximum reinforcement ratio which is 1.99 %, with two tension rebars of 16 mm
diameter. The reinforcement ratio in this group is 1.79 %. The reason behind the
choice of this reinforcement ratio is to explore the applicability of FRP strengthening
over vast range of reinforcement ratios and concrete compressive strengths. The
yielding strain for the tension steel used is 2750 microstrain, while the debonding
microstrain of this group one layer and two layers strengthened are 12600 and 10718
respectively, hence if the strain reaches this level, a brittle failure is bound to happen.
In addition, the strain (ϵο) at which the concrete reaches its compressive strength (𝑓𝑐′)
is 2930 microstrain.
4.1.9.1 Control slab (C 100 HR C)
The slab ultimate load (Pu) is 35.0kN with a corresponding deflection (δu) of
36.9 mm. The deflection at which the steel yielded (δy) was 1.12 mm and the failure
deflection (δf) was 42.0 mm. The failure mode of the slab started with the yielding of
the steel, followed by concrete crushing at the top with the neutral axis shifting up.
The strain in the concrete almost reached the crushing strain of 2930, while the strain

81
in the steel reached the yielding strain of 2750. Figure 61 shows the load strain
response, andFigure62 shows the failed specimen, both of which support the
argument about the mode of failure.
Figure 61: Load versus microstrain for slab specimen (C 100 HR C)
Figure 62: Failed slab specimen (C 100 HR C)
0
5
10
15
20
25
30
35
40
-4000 -2000 0 2000 4000 6000
Lo
ad
(k
N)
Microstrain
Concrete
Microstrain
Steel
Microstrain

82
4.1.9.2 Slab (C 100 HR 1L)
This slab was strengthened with one 100 mm width sheet of CFRP attached to
the center of the soffit. This slab was cast to see the effect of single sheet
strengthening on the increase of load carrying capacity and other properties. The load
versus micro-strain graph is shown in Figure 63.The slab ultimate load (Pu) is
55.14kN with a corresponding deflection (δu) of 35.3 mm. The deflection at which the
steel yielded (δy) was 1.96 mm and the failure deflection (δf) was 37.15 mm. The
failure mode of this slab started with the steel yielding followed by concrete crushing
at the top shifting the neutral axis up, at the end CFRP debonding. The maximum
microstrain in the concrete was near 2930 which indicates that crushing happened at
the top, on the other hand, the microstrain in the steel reached 2750 which is the yield
strain. Moreover, the microstrain in the CFRP was below 12600 which is the
debonding strain; hence the brittle failure of the specimen happened. Figure 64 shows
the failed specimen.
Figure 63: Load versus microstrain slab specimen (C 100 HR 1L)
0
10
20
30
40
50
60
-4000 -2000 0 2000 4000 6000 8000
Lo
ad
(k
N)
Microstrain
Concrete
Microstrain
Steel
Microstrain
CFRP
Microstrain
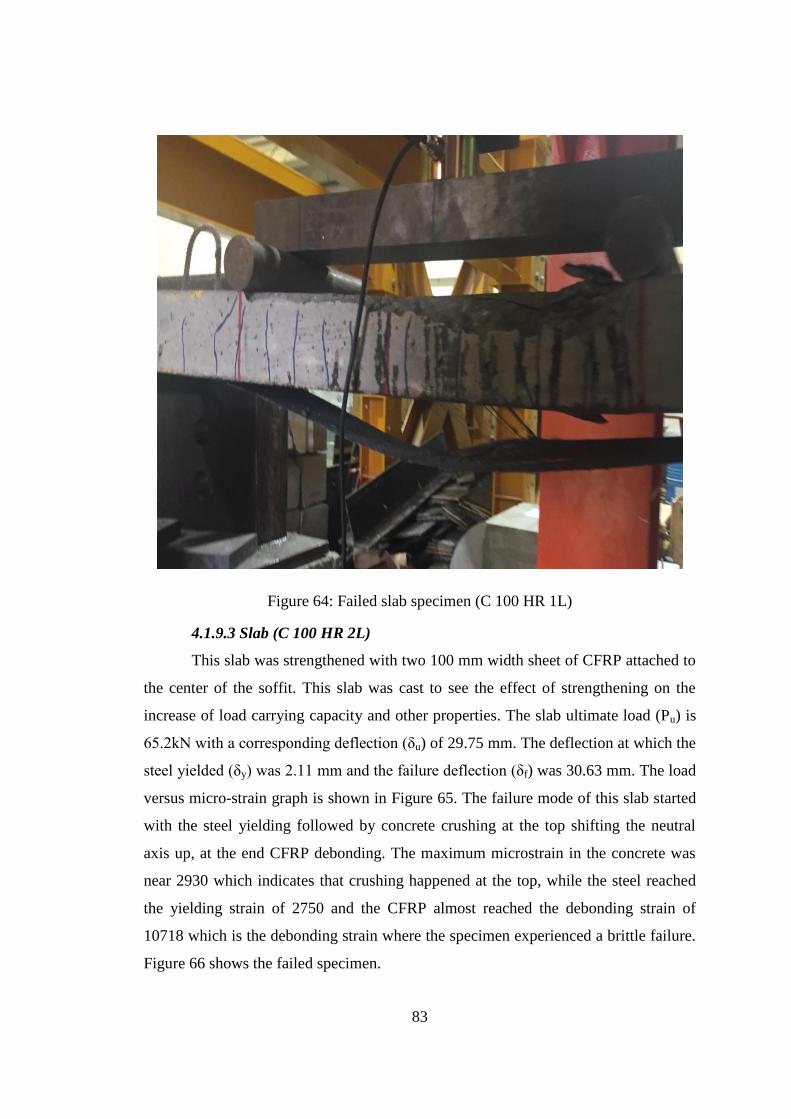
83
Figure 64: Failed slab specimen (C 100 HR 1L)
4.1.9.3 Slab (C 100 HR 2L)
This slab was strengthened with two 100 mm width sheet of CFRP attached to
the center of the soffit. This slab was cast to see the effect of strengthening on the
increase of load carrying capacity and other properties. The slab ultimate load (Pu) is
65.2kN with a corresponding deflection (δu) of 29.75 mm. The deflection at which the
steel yielded (δy) was 2.11 mm and the failure deflection (δf) was 30.63 mm. The load
versus micro-strain graph is shown in Figure 65. The failure mode of this slab started
with the steel yielding followed by concrete crushing at the top shifting the neutral
axis up, at the end CFRP debonding. The maximum microstrain in the concrete was
near 2930 which indicates that crushing happened at the top, while the steel reached
the yielding strain of 2750 and the CFRP almost reached the debonding strain of
10718 which is the debonding strain where the specimen experienced a brittle failure.
Figure 66 shows the failed specimen.
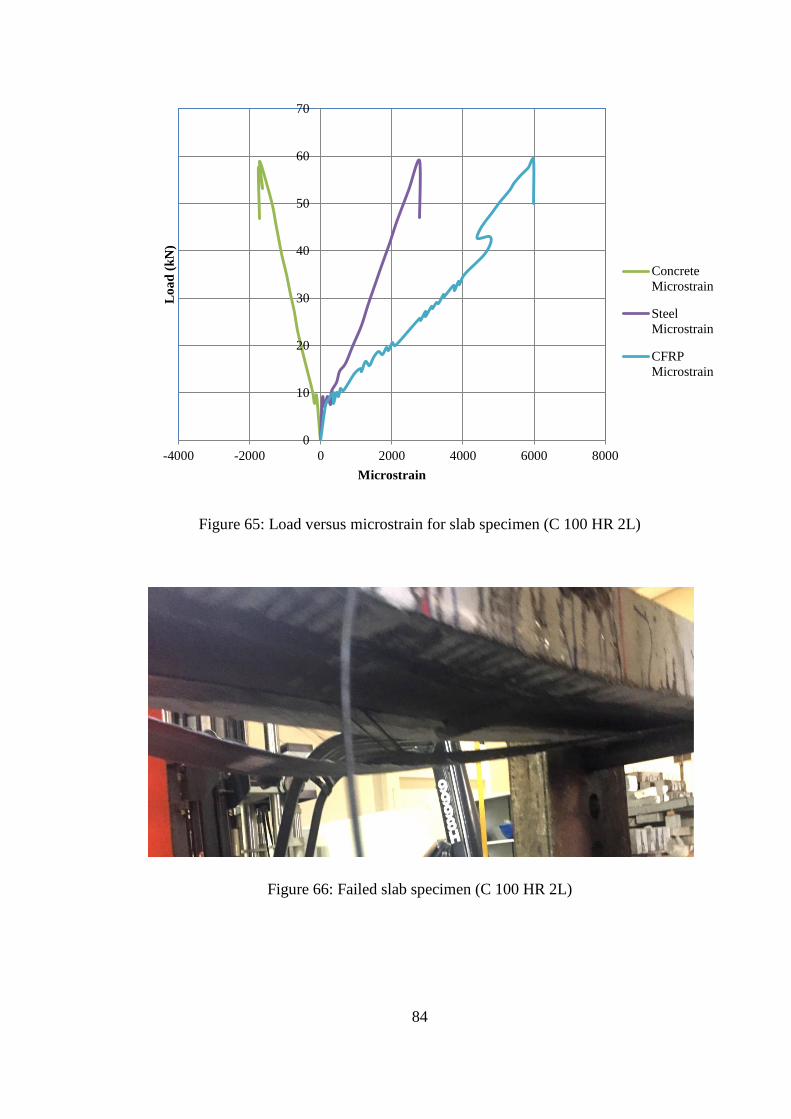
84
Figure 65: Load versus microstrain for slab specimen (C 100 HR 2L)
Figure 66: Failed slab specimen (C 100 HR 2L)
0
10
20
30
40
50
60
70
-4000 -2000 0 2000 4000 6000 8000
Lo
ad
(k
N)
Microstrain
Concrete
Microstrain
Steel
Microstrain
CFRP
Microstrain

85
4.2. Summary of the Results Obtained:
In this section, a summary of the tested data is presented. Table 15 provides
the loads including the ultimate load (Pu) and the yielding load (Py), calculation of the
slab's stiffness (K= Py/δy), percentage increase of (Pu) and (K) for each specimen over
the control slab of the group.
Table 15: Summary of the average load data
Group Specimen Py
(kN)
δy
(mm)
K=Py/δy
(kN/mm)
%
Increase
in K
Pu (kN)
%
Increase
in Pu
C 40 LR
C 40 LR
C
12.5 21.01 0.59 - 12.5 -
C 40 LR
1L
21 18.9 1.11 86.76 21.37 70.96
C 40 LR
2L
25.1 15.02 1.67 180.88 37.43 199.44
C 40 MR
C 40 MR
C
15.2 18.2 0.84 - 23.15 -
C 40 MR
1L
21.3 30.03 0.71 -15.07 45.16 95.08
C 40 MR
2L
40.6 21.78 1.86 123.20 49.57 114.13
C 40 HR
C 40 HR
C
19.1 7.5 2.55 - 45.88 -
C 40 HR
1L
36.07 20.74 1.74 -31.71 52.03 13.40
C 40 HR
2L
39.1 19.62 1.99 -21.75 53.73 17.11
C 70 LR
C 70 LR
C
8.1 10.2 0.79 - 9.49 -
C 70 LR
1L
15.84 13.01 1.22 53.32 26.25 176.61
C 70 LR
2L
40.16 22.28 1.80 126.98 45.31 377.45
C 70 MR
C 70 MR
C
15.54 10.29 1.51 - 27.45 -
C 70 MR
1L
32.44 26.22 1.24 -18.08 47.36 72.53

86
C 70 MR
2L
34.63 17.69 1.96 29.63 45.92 67.29
C 70 HR
C 70 HR
C
18.1 13.9 1.30 - 35.55 -
C 70 HR
1L
38.57 22.28 1.73 32.94 53.08 49.31
C 70 HR
2L
51.31 26.11 1.97 50.91 58.28 63.94
C 100 LR
C 100
LR C
11.26 23.7 0.48 - 11.1 -
C 100
LR 1L
26.7 21.7 1.23 158.98 29.61 166.76
C 100
LR 2L
34.11 10.21 3.34 603.18 38.35 245.50
C 100 MR
C 100
MR C
32.84 18.4 1.78 - 40.58 -
C 100
MR 1L
34.9 20.15 1.73 -2.96 43 5.96
C 100
MR 2L
36.29 17.27 2.10 17.74 48.89 20.48
C 100 HR
C 100
HR C
22.56 18.65 1.21 - 36.37 -
C 100
HR 1L
39.82 24.2 1.65 36.03 51.97 42.89
C 100
HR 2L
56.9 27.09 2.10 73.64 62.55 71.98
In principle, ductility is an advantageous property in that it allows for stress
distribution in structures in a post cracked section. Another advantage of ductility is
the warning and resiliency that it provides in times of sudden threats on the structure
such as earthquakes or impacts. Reinforced concrete beams are under reinforced by
the guidelines of ACI 318, since they recommend a reinforcement ratio of 25% less
than the balanced reinforcement ratio where the steel and concrete fail at the same
time. Due to this constraint in the design, the failure of these flexural elements starts
with the yielding of steel followed by huge deformation without compromising the
load carrying ability. At the end, the concrete crushes at the top in the compression
area causing the element to fail [29].

87
In the case of FRP strengthened sections, the process is different. The design
of FRP strengthened sections is based on compatibility of strains and the assumptions
that plane sections remain plane. This assumption is valid only if the perfect bond
between FRP and concrete remains, and the concrete is able to transfer loads to the
FRP sheets by shear loads. In FRP strengthened sections, the ductility is widely
available up to the point of steel yielding. After the yielding of steel, the section can
carry more loads but the rate of deflection with the increase of load gets lower until it
gets to the point of failure. During this process, the FRP remains in the elastic region
until failure happens suddenly. The possible modes of failure in FRP strengthened
sections are FRP debonding or rupture, or concrete crushing at the top, all of which
are considered sudden brittle failures [29].
Table 16 provides the deflection results including the deflection at the onset of
steel yielding (δy), the deflection at the ultimate (δu), and the deflection at failure (δf).
The ductility of the specimens is also reported and computed as follows:
(Eq5)
(Eq6)
Table 16: Summary of deflection data
Group Specimen δy (mm) δu (mm) δf
(mm) μ1 = δu/δy μ1/μ1CB μ2= δf/δy μ2/μ2CB
C 40 LR
C 40 LR C 21.01 21.01 31.07 1.00 1.00 1.48 1.00
C 40 LR 1L 18.9 19.86 23.3 1.05 1.05 1.23 0.83
C 40 LR 2L 15.02 24.5 25.88 1.63 1.63 1.72 1.17
C 40 MR
C 40 MR C 18.2 28.4 29.2 1.56 1.00 1.60 1.00
C 40 MR 1L 30.03 35.13 41.7 1.17 0.75 1.39 0.87
C 40 MR 2L 21.78 24.48 26 1.12 0.72 1.19 0.74
C 40 HR C 40 HR C 7.5 21.5 22.3 2.87 1.00 2.97 1.00
μ1 =δ𝑢
δ𝑦
μ2 =δ𝑓
δ𝑦

88
Toughness of a concrete flexural element by definition is the ability of the
element to absorb energy without failing in a brittle matter. The measure of toughness
in the flexural elements is equal to the area under the load versus mid-span deflection
until the point of failure is reached. In general, the higher the toughness of values in
flexural element, the larger the energy that the specimen can absorb energy before
failing in a brittle manner is. This property is as important as the ultimate capacity
since it can be very helpful in times of earth quakes, impacts, and attacks since it can
absorb more energy.
C 40 HR 1L 20.74 30.22 45 1.46 0.51 2.17 0.73
C 40 HR 2L 19.62 20.38 21.7 1.04 0.36 1.11 0.37
C 70 LR
C 70 LR C 10.2 11.15 13.1 1.09 1.00 1.28 1.00
C 70 LR 1L 13.01 27.78 37.48 2.14 1.95 2.88 2.24
C 70 LR 2L 22.28 13.78 28.06 0.62 0.57 1.26 0.98
C 70 MR
C 70 MR C 10.29 71.75 80 6.97 1.00 7.77 1.00
C 70 MR 1L 26.22 33.57 37.35 1.28 0.18 1.42 0.18
C 70 MR 2L 17.69 25.76 33.33 1.46 0.21 1.88 0.24
C 70 HR
C 70 HR C 13.9 35.77 40.45 2.57 1.00 2.91 1.00
C 70 HR 1L 22.28 34.91 36.01 1.57 0.61 1.62 0.56
C 70 HR 2L 26.11 30.95 31.67 1.19 0.46 1.21 0.42
C 100 LR
C 100 LR C 23.7 40.86 41.34 1.72 1.00 1.74 1.00
C 100 LR 1L 21.7 29.8 34.8 1.37 0.80 1.60 0.92
C 100 LR 2L 10.21 11.95 12.25 1.17 0.68 1.20 0.69
C 100 MR
C 100 MR C 18.4 32.45 35.68 1.76 1.00 1.94 1.00
C 100 MR 1L 20.15 27.15 38.88 1.35 0.76 1.93 1.00
C 100 MR 2L 17.27 24.3 24.86 1.41 0.80 1.44 0.74
C 100 HR
C 100 HR C 18.65 36.9 42 1.98 1.00 2.25 1.00
C 100 HR 1L 24.2 35.3 37.15 1.46 0.74 1.54 0.68
C 100 HR 2L 27.09 29.75 30.63 1.10 0.56 1.13 0.50
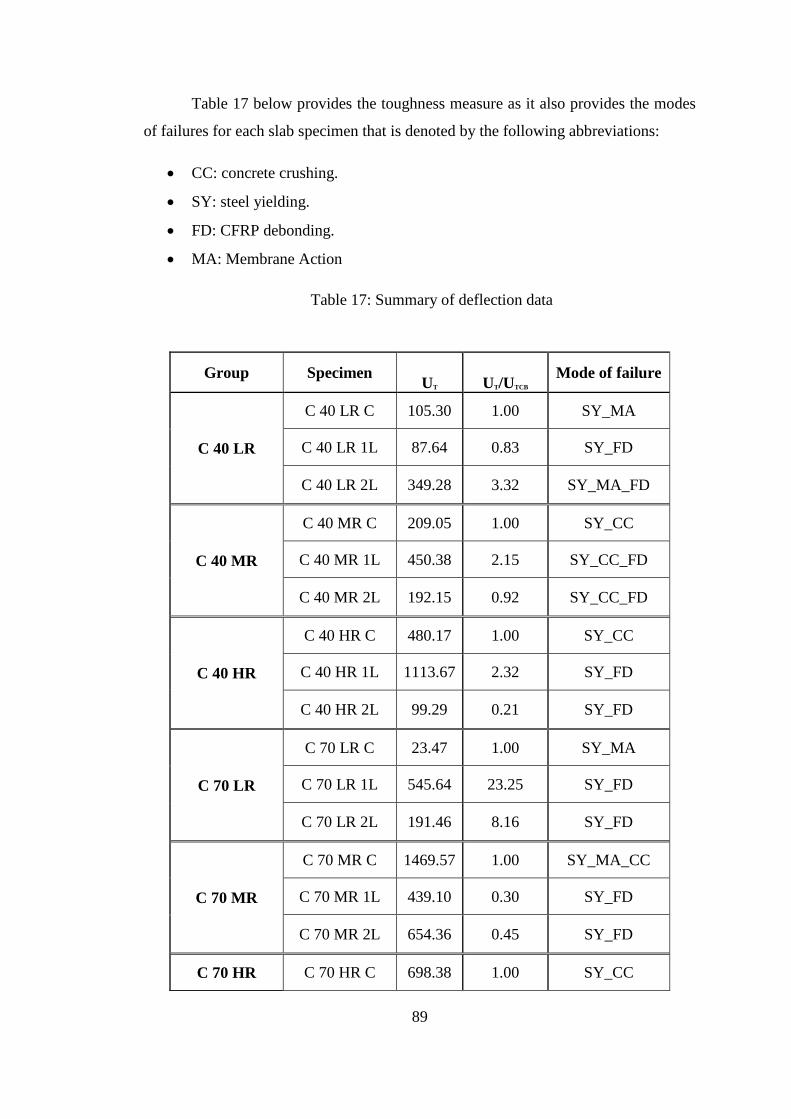
89
Table 17 below provides the toughness measure as it also provides the modes
of failures for each slab specimen that is denoted by the following abbreviations:
CC: concrete crushing.
SY: steel yielding.
FD: CFRP debonding.
MA: Membrane Action
Table 17: Summary of deflection data
Group Specimen UT UT/UTCB
Mode of failure
C 40 LR
C 40 LR C 105.30 1.00 SY_MA
C 40 LR 1L 87.64 0.83 SY_FD
C 40 LR 2L 349.28 3.32 SY_MA_FD
C 40 MR
C 40 MR C 209.05 1.00 SY_CC
C 40 MR 1L 450.38 2.15 SY_CC_FD
C 40 MR 2L 192.15 0.92 SY_CC_FD
C 40 HR
C 40 HR C 480.17 1.00 SY_CC
C 40 HR 1L 1113.67 2.32 SY_FD
C 40 HR 2L 99.29 0.21 SY_FD
C 70 LR
C 70 LR C 23.47 1.00 SY_MA
C 70 LR 1L 545.64 23.25 SY_FD
C 70 LR 2L 191.46 8.16 SY_FD
C 70 MR
C 70 MR C 1469.57 1.00 SY_MA_CC
C 70 MR 1L 439.10 0.30 SY_FD
C 70 MR 2L 654.36 0.45 SY_FD
C 70 HR C 70 HR C 698.38 1.00 SY_CC

90
4.3. Repeatability of Results:
For the purpose of this study, two samples from each type were cast to ensure
the repeatability of the result and to verify the conclusions of the study. In this
section, Figures 67 through 73 show some of the loads versus mid-span deflection
curves of this study, but the reminder of the figures are shown in Appendix A of this
thesis. It is clearly indicated from Figures 67 through 73 that the results are almost
identical for each pair of specimens. The slight differences between the same
specimens could be due to human errors which are present in casting and curing of the
concrete, positioning of the steel cages, attachment of the CFRP sheets, distribution of
the epoxy adhesive over the sheets, and other variation errors in the materials due to
manufacturing. In addition, at the end of this section, Table 18 summarizes the
ultimate load (Pu), ultimate deflections (δu), percentage difference in the ultimate
loads and deflections, and failure modes for each pair of tested specimens. The full
comparison is presented in the Appendix.
C 70 HR 1L 653.23 0.94 SY_CC_FD
C 70 HR 2L 306.10 0.44 SY_CC_FD
C 100 LR
C 100 LR C 193.31 1.00 SY_MA
C 100 LR 1L 369.42 1.91 SY_FD
C 100 LR 2L 75.50 0.39 SY_FD
C 100 MR
C 100 MR C 615.57 1.00 SY_CC
C 100 MR 1L 733.63 1.19 SY_FD
C 100 MR 2L 326.82 0.53 SY_FD
C 100 HR
C 100 HR C 685.89 1.00 SY_CC
C 100 HR 1L 618.84 0.90 SY_CC_FD
C 100 HR 2L 214.03 0.31 SY_CC_FD
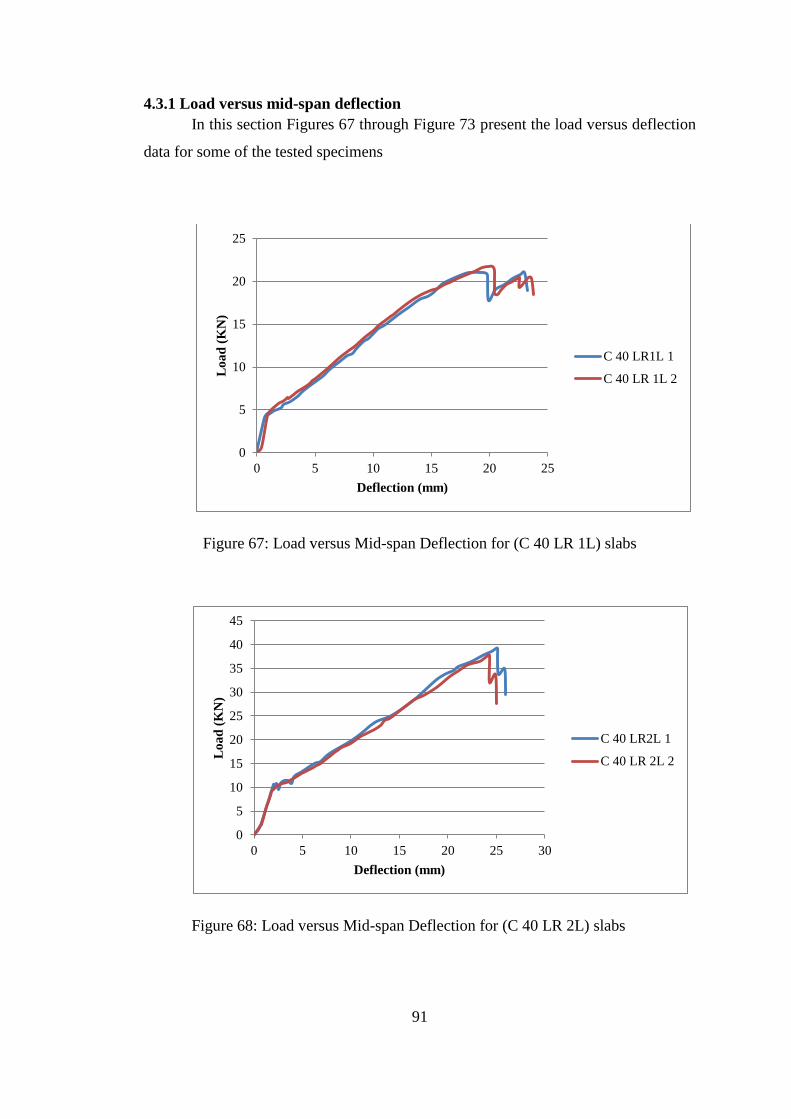
91
4.3.1 Load versus mid-span deflection
In this section Figures 67 through Figure 73 present the load versus deflection
data for some of the tested specimens
Figure 67: Load versus Mid-span Deflection for (C 40 LR 1L) slabs
Figure 68: Load versus Mid-span Deflection for (C 40 LR 2L) slabs
0
5
10
15
20
25
0 5 10 15 20 25
Lo
ad
(K
N)
Deflection (mm)
C 40 LR1L 1
C 40 LR 1L 2
0
5
10
15
20
25
30
35
40
45
0 5 10 15 20 25 30
Lo
ad
(K
N)
Deflection (mm)
C 40 LR2L 1
C 40 LR 2L 2

92
Figure 69: Load versus Mid-span Deflection (C 70 HR C) slabs
Figure 70: Load versus Mid-span Deflection for (C 70 HR 1L) slabs
0
5
10
15
20
25
30
35
40
45
0 10 20 30 40 50
Lo
ad
(K
N)
Deflection (mm)
C 70 HR C 1
C 70 HR C 2
0
10
20
30
40
50
60
0 10 20 30 40
Lo
ad
(K
N)
Deflection (mm)
C 70 HR 1L 1
C 70 HR 1L 2

93
Figure 71: Load versus Mid-span Deflection for (C 70 HR 2L) slabs
Figure 72: Load versus Mid-span Deflection for (C 100 MR 1L) slabs
0
10
20
30
40
50
60
70
0 5 10 15 20 25 30 35
Lo
ad
(K
N)
Deflection (mm)
C 70 HR 2L 1
C 70 HR 1L 2
0
5
10
15
20
25
30
35
40
45
50
0 10 20 30 40 50
Lo
ad
(K
N)
Deflection (mm)
C 100 MR 1L 1
C 100 MR 1L 2

94
Figure 73: Load versus Mid-span Deflection for (C 100 HR 1L)
0
10
20
30
40
50
60
0 10 20 30 40
Lo
ad
(K
N)
Deflection (mm)
C 100 HR 1L 1
C 100 HR 1L 2

95
Table 18: Summary of all tested specimens
Group Specimen δu (mm) % Difference
of δu Average δu Pu (kN)
% Difference
of Pu Average Pu Failure Mode
C 40 LR
C 40 LR C 1 21.01 28.03 23.96
11.63 8.94 12.15
SY_MA
C 40 LR C 2 26.9 12.67 SY_MA
C 40 LR 1L 1 19.36 2.58 19.61
21.04 3.09 21.37
SY_FD
C 40 LR 1L 2 19.86 21.69 SY_FD
C 40 LR 2L 1 24.5 -5.06 23.88
38.5 -5.56 37.43
SY_MA_FD
C 40 LR 2L 2 23.26 36.36 SY_MA_FD
C 40
MR
C 40 MR C 1 28.4 5.81 29.23
22.6 4.87 23.15
SY_CC
C 40 MR C 2 30.05 23.7 SY_CC
C 40 MR 1L 1 32.7 7.43 33.92
43.52 7.54 45.16
SY_CC_FD
C 40 MR 1L 2 35.13 46.8 SY_CC_FD
C 40 MR 2L 1 28.02 -12.63 26.25
48.6 3.97 49.57
SY_CC_FD
C 40 MR 2L 2 24.48 50.53 SY_CC_FD
C 40 HR
C 40 HR C 1 22.5 -4.44 22.00
46.88 -4.27 45.88
SY_CC
C 40 HR C 2 21.5 44.88 SY_CC
C 40 HR 1L 1 29.34 3.00 29.78
51.8 0.87 52.03
SY_FD
C 40 HR 1L 2 30.22 52.25 SY_FD
C 40 HR 2L 1 20.38 1.08 20.49
53.85 -0.46 53.73
SY_FD
C 40 HR 2L 2 20.6 53.6 SY_FD
C 70 LR
C 70 LR C 1 13.46 -5.65 13.08
10.17 -13.47 9.49
SY_MA
C 70 LR C 2 12.7 8.8 SY_MA
C 70 LR 1L 1 27.78 -10.26 26.36 26.6 -2.63 26.25 SY_FD
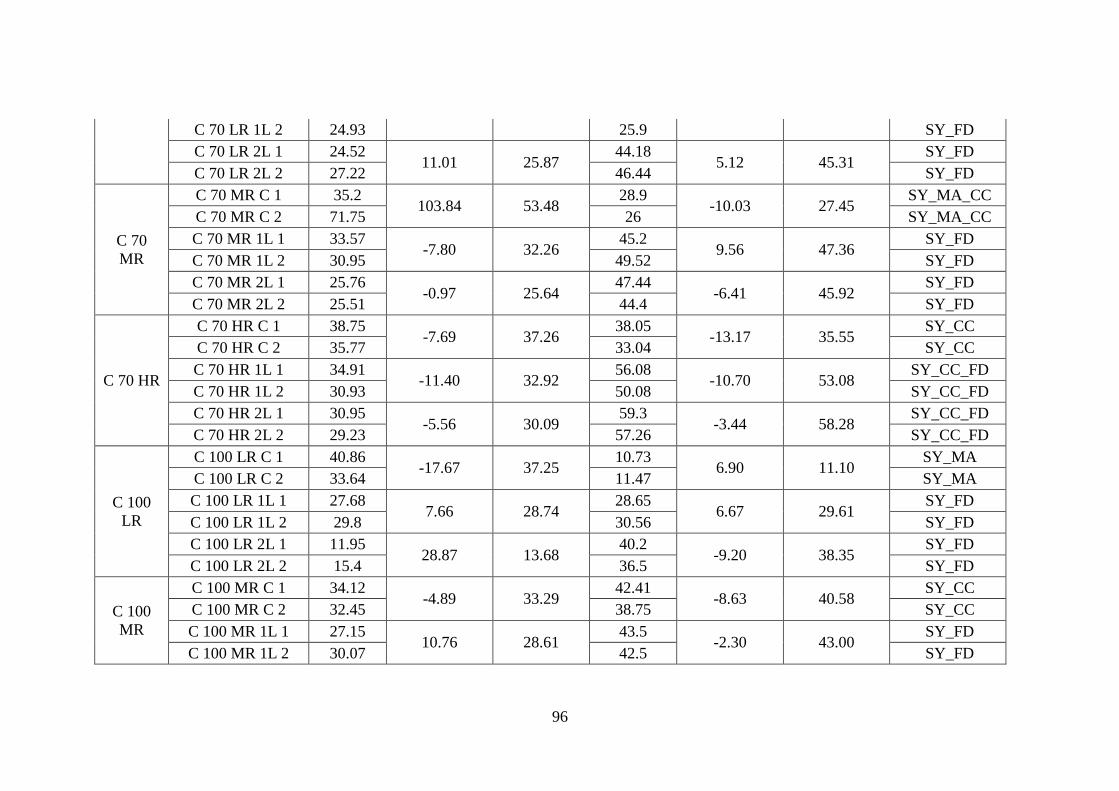
96
C 70 LR 1L 2 24.93 25.9 SY_FD
C 70 LR 2L 1 24.52 11.01 25.87
44.18 5.12 45.31
SY_FD
C 70 LR 2L 2 27.22 46.44 SY_FD
C 70
MR
C 70 MR C 1 35.2 103.84 53.48
28.9 -10.03 27.45
SY_MA_CC
C 70 MR C 2 71.75 26 SY_MA_CC
C 70 MR 1L 1 33.57 -7.80 32.26
45.2 9.56 47.36
SY_FD
C 70 MR 1L 2 30.95 49.52 SY_FD
C 70 MR 2L 1 25.76 -0.97 25.64
47.44 -6.41 45.92
SY_FD
C 70 MR 2L 2 25.51 44.4 SY_FD
C 70 HR
C 70 HR C 1 38.75 -7.69 37.26
38.05 -13.17 35.55
SY_CC
C 70 HR C 2 35.77 33.04 SY_CC
C 70 HR 1L 1 34.91 -11.40 32.92
56.08 -10.70 53.08
SY_CC_FD
C 70 HR 1L 2 30.93 50.08 SY_CC_FD
C 70 HR 2L 1 30.95 -5.56 30.09
59.3 -3.44 58.28
SY_CC_FD
C 70 HR 2L 2 29.23 57.26 SY_CC_FD
C 100
LR
C 100 LR C 1 40.86 -17.67 37.25
10.73 6.90 11.10
SY_MA
C 100 LR C 2 33.64 11.47 SY_MA
C 100 LR 1L 1 27.68 7.66 28.74
28.65 6.67 29.61
SY_FD
C 100 LR 1L 2 29.8 30.56 SY_FD
C 100 LR 2L 1 11.95 28.87 13.68
40.2 -9.20 38.35
SY_FD
C 100 LR 2L 2 15.4 36.5 SY_FD
C 100
MR
C 100 MR C 1 34.12 -4.89 33.29
42.41 -8.63 40.58
SY_CC
C 100 MR C 2 32.45 38.75 SY_CC
C 100 MR 1L 1 27.15 10.76 28.61
43.5 -2.30 43.00
SY_FD
C 100 MR 1L 2 30.07 42.5 SY_FD

97
C 100 MR 2L 1 24.3 -0.82 24.20
49.58 -2.78 48.89
SY_FD
C 100 MR 2L 2 24.1 48.2 SY_FD
C 100
HR
C 100 HR C 1 39.9 -7.52 38.40
37.74 -7.26 36.37
SY_CC
C 100 HR C 2 36.9 35 SY_CC
C 100 HR 1L 1 35.3 -4.67 34.48
55.14 -11.50 51.97
SY_CC_FD
C 100 HR 1L 2 33.65 48.8 SY_CC_FD
C 100 HR 2L 1 27.1 9.78 28.43
59.9 8.85 62.55
SY_CC_FD
C 100 HR 2L 2 29.75 65.2 SY_CC_FD
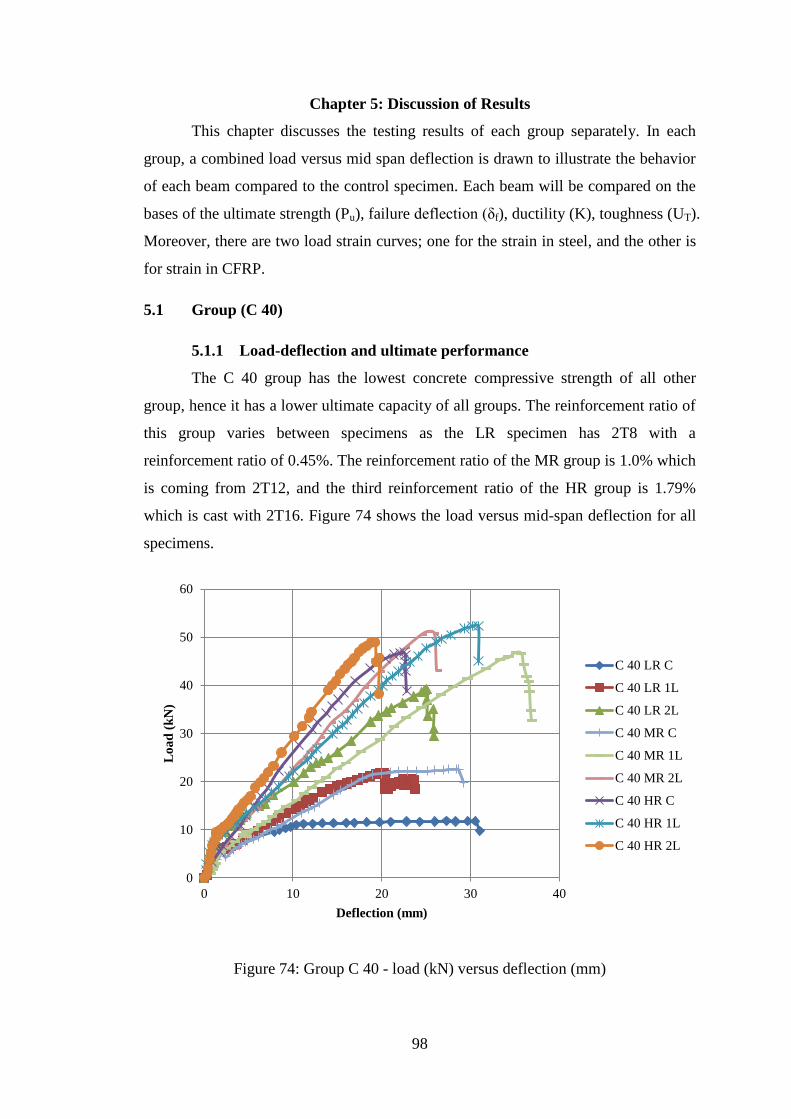
98
Chapter 5: Discussion of Results
This chapter discusses the testing results of each group separately. In each
group, a combined load versus mid span deflection is drawn to illustrate the behavior
of each beam compared to the control specimen. Each beam will be compared on the
bases of the ultimate strength (Pu), failure deflection (δf), ductility (K), toughness (UT).
Moreover, there are two load strain curves; one for the strain in steel, and the other is
for strain in CFRP.
5.1 Group (C 40)
5.1.1 Load-deflection and ultimate performance
The C 40 group has the lowest concrete compressive strength of all other
group, hence it has a lower ultimate capacity of all groups. The reinforcement ratio of
this group varies between specimens as the LR specimen has 2T8 with a
reinforcement ratio of 0.45%. The reinforcement ratio of the MR group is 1.0% which
is coming from 2T12, and the third reinforcement ratio of the HR group is 1.79%
which is cast with 2T16. Figure 74 shows the load versus mid-span deflection for all
specimens.
Figure 74: Group C 40 - load (kN) versus deflection (mm)
0
10
20
30
40
50
60
0 10 20 30 40
Lo
ad
(k
N)
Deflection (mm)
C 40 LR C
C 40 LR 1L
C 40 LR 2L
C 40 MR C
C 40 MR 1L
C 40 MR 2L
C 40 HR C
C 40 HR 1L
C 40 HR 2L

99
All specimens in this group followed a similar behavior in the pre-cracked
(elastic) region. However, when the cracks started to initiate, each specimen followed
a different path. There was no clear sign on a similar system performance although
some specimens have similar effective reinforcement ratio.
Typically, in all subgroups, the control specimen has the highest deflection,
hence the highest ductility. This is due to the fact that the more capacity the section
has, the less ductility it has since they are inversely proportional. This phenomenon
happens because of the increase in the cracked stiffness which will increase the
tension force in the tension steel. It is noted that among all control specimens across
all subgroups, the MR control has the highest load carrying capacity. This indicates
that the combination between the concrete compressive strength and the
reinforcement ratio.
Slabs in all strengthening scenarios have shown a better percentage of increase
when a 2 sheets are attached to the soffits of the slab. This is due to the fact that the
width of the specimen is relatively larger than the depth and the 2 bars are not enough
to resist all applied loads. The only outlier of this conclusion is the MR 1L since it
achieved more than the MR 2L, which is due to the fact that the effective
reinforcement of this group is considered sufficient to use the full capacity of the
concrete block until crushing. Moreover, a notable outcome is that with an increase of
reinforcement ratio, the contribution of the CFRP in load carrying capacity decreases.
Another conclusion is the fact that this study proves the effectiveness of using CFRP
in external strengthening for increasing the load carrying capacity of flexural
members.
It is clearly shown in Figure 74 that the load carrying capacities of
strengthened specimens have increased by 19.99% to 231.04% over the control
specimens; this shows the validity of strengthening of thin slabs with CFRP laminated
attached to their soffits. With this percentage of increase, it is safe to say that the
CFRP can be used to increase the load carrying capacity of the specimens that are cast
with C40 concrete.
5.1.2 Strain response
In this section, detailed discussion of the load strain response is done for both
the strain response of the steel and the CFRP. The concrete crushing microstrain of

100
concrete as defined in ACI 318-14 is equal to 2090. The yielding strain for the tension
steel used is 2750 microstrain, while the debonding microstrains of this group one
layer and two layers strengthened are 9687 and 6849 respectively; hence if the strain
reaches this level, a brittle failure is bound to happen. Figure 75 below shows the
strain response of tension steel in this group.
Figure 75: Steel strain response for Group C 40
The strain steel response shows similar response in the elastic region while
going into the inelastic region. The response starts to deviate and that is due to the
different arrangement and configurations of the CFRP strengthening. It is clear from
Figure 75 that almost all specimens reached the yielding strain. However, control
specimens and specimens with one CFRP layer reached the yielding strength and
continued yielding until failure, while the specimens with two CFRP layers didn’t
show any plastic behavior after the yielding point, which supports the claim of the
brittle failure. This is due to the fact that CFRP is considered reinforcement and with
the double layers strengthening, the section becomes over reinforced, hence the
section doesn’t have enough tension capacity to yield the steel until failure and
debond or rupture the CFRP happens.
0
10
20
30
40
50
60
0 1000 2000 3000 4000 5000 6000 7000 8000 9000
Lo
ad
(k
N)
Microstrain
C 40 LR C
C 40 LR 1L
C 40 LR 2L
C 40 MR C
C 40 MR 1L
C 40 MR 2L
C 40 HR C
C 40 HR 1L
C 40 HR 2L

101
The CFRP strain response is shown in Figure 76.
Figure 76: FRP strain response for Group C 40
It is noted that the single sheet has the maximum utilization of the CFRP since
the area of the CFRP present in this configuration is less than the area present in the
double sheet configuration. This phenomenon is explained with the fact that with
double sheet strengthening, not all the area is used since it is considered as over
reinforcement of the section. Another conclusion reached form Figure 76 can be that
in the specimens with low reinforcement ratio, the CFRP sheets sustained the largest
strain in all specimens with the two arrangements; the single and the double layers. It
is clearly noted that all specimens experienced brittle failure mode, although not all of
them reached the debonding strain in Figure 76. The reason behind this is that the
strain gauge, that was installed on the specimens, might not have been in the location
of maximum strain, or that the application and distribution of the epoxy were not
equal, hence not all the sheet experienced equal stain distribution.
0
10
20
30
40
50
60
0 1000 2000 3000 4000 5000 6000 7000 8000
Lo
ad
(k
N)
Microstrain
C 40 LR 1L
C 40 LR 2L
C 40 MR 1L
C 40 MR 2L
C 40 HR 1L
C 40 HR 2L

102
As for the strain response of concrete, some samples experienced crushing of
concrete at the top while others didn’t. Figure 77 shows the strain versus load
response of the specimens in this group.
Figure 77: Concrete strain response for Group C 40
It is clear that all of the specimens didn’t reach the crushing strain of
2090.This doesn’t mean that the specimens didn’t experience crushing of concrete at
the top; it only means that the strain gauge wasn’t placed in the location of maximum
strain. It's clearly noted that some specimens had low ultimate strain. This particularly
happened in the specimens that experienced the membrane action tensile failure and
the FRP debonding failure. Another notable conclusion is with the increase of the
reinforcement ratio, the ultimate strain in the specimens increased. This easily
explained with the fact that when the reinforcement ratio increases, the tension force
in the specimen increases, hence increasing the balancing compression forces.
5.1.3 Ductility measures
Figure 78 shows the elastic and final ductility with respect to the control
specimen from each group.
0
10
20
30
40
50
60
0 500 1000 1500 2000 2500 3000
Lo
ad
(k
N)
Microstrain
C 40 LR C
C 40 LR 1L
C 40 LR 2L
C 40 MR C
C 40 MR 1L
C 40 MR 2L
C 40 HR C
C 40 HR 1L
C 40 HR 2L

103
Figure 78: Ductility comparison
Figure 78 shows that the highest ductility was recorded for both ultimate and
final in the high reinforced group. This means that high reinforced slabs with one and
two layers of CFRP have almost four times of ductility as the control slab. This
ductility could be due to the perfect utilization of CFRP and steel with the concrete
crushing. All other specimens have shown same ductility as the control specimen.
5.1.4 Toughness measures
Figure 79 shows the comparison between the specimen and the control of each
group.
Figure 79: Toughness comparison (UT/UTCB)
0.00
0.20
0.40
0.60
0.80
1.00
1.20
1.40
1.60
1.80
C 40 LR C C 40 LR 1L C 40 LR 2L C 40 MR C C 40 MR 1LC 40 MR 2L C 40 HR C C 40 HR 1L C 40 HR 2L
µ1/µ1CB
µ2/µ2CB
0.00
0.50
1.00
1.50
2.00
2.50
3.00
3.50
C 40 LR C C 40 LR 1L C 40 LR 2L C 40 MR C C 40 MR 1L C 40 MR 2L C 40 HR C C 40 HR 1L C 40 HR 2L

104
It is noted from the Figure 79 that in the group of low reinforcement ratio, the
two layers showed a substantial increase in the toughness over the control specimen
as it showed 113% increase while the single layer showed an increase of only 13%.
This can be simply explained in the fact that double layered has better utilization of
materials. The same explanation is applicable for the difference in the increase of the
high reinforced group since the one layer showed an increase of 209%, while the
double layer showed only 33%. The case is different for the medium reinforcement
ratio group. For this group, there is full utilization of the concrete crushing capacity,
since all specimens experienced concrete crushing before the final failure. This
explains the increase of toughness with the increase of effective reinforcement.
5.2 Group (C 70)
5.2.1 Load-deflection and ultimate performance
This group has a compressive strength on 70 MPa with different reinforcement
ratios. The reinforcement ratios used in this group are the same as the C 40 group.
This was done to examine the effect of the reinforcement ratio in strengthening of the
sections. Figure 80 shows the load versus mid-span deflection response for this group.
Figure 80: Group C 70 - load (kN) versus deflection (mm)
0
10
20
30
40
50
60
70
0 10 20 30 40 50 60 70 80 90
Lo
ad
(k
N)
Deflection (mm)
C 70 LR C
C 70 LR 1L
C 70 LR 2L
C 70 MR C
C 70 MR 1L
C 7O MR 2L
C 70 HR C
C 70 HR 1L
C 70 HR 2L

105
It is shown from Figure 80 that the strengthening of the specimens adds to the
ultimate strength of the section while compromising its ductility. Moreover, it is
shown that it is valid to assume that over strengthening of section does increase the
capacity. Another conclusion is that the low reinforcement subgroup of this group is
the greatest since there are deficiencies due to the low reinforcement.
It is clearly indicated in Figure 80 that the load carrying capacities of
strengthened specimens have increased by 69.73% to 378.41% over the control
specimens; this shows the validity of strengthening of thin slabs with CFRP laminated
attached to their soffits. With this percentage of increase, it is safe to say that the
CFRP can be used to increase the load carrying capacity of the specimens that are cast
with C70 concrete. It also shows that the increase in the load carrying capacity in this
group is greater than the increase in the load carrying capacity of the C40 group. This
is due to the extra force that the concrete can endure due to the increase of the
compressive strength until the CFRP debonds.
5.2.2 Strain response
Figure 81 shows the steel strain response for this group.
Figure 81: Group C 70 – Steel strain response
The steel strain response showed in Figure 81 shows that not all the specimens
have reached the yielding stage and only three of the specimens have reached the
rupture strain. This happens usually in the control specimens that are under
0
10
20
30
40
50
60
70
0 1000 2000 3000 4000 5000 6000
Lo
ad
(k
N)
Microstrain
C 70 LR C
C 70 LR 1L
C 70 LR 2L
C 70 MR C
C 70 MR 1L
C 70 MR 2L
C 70 HR C
C 70 HR 1L
C 70 HR 2L
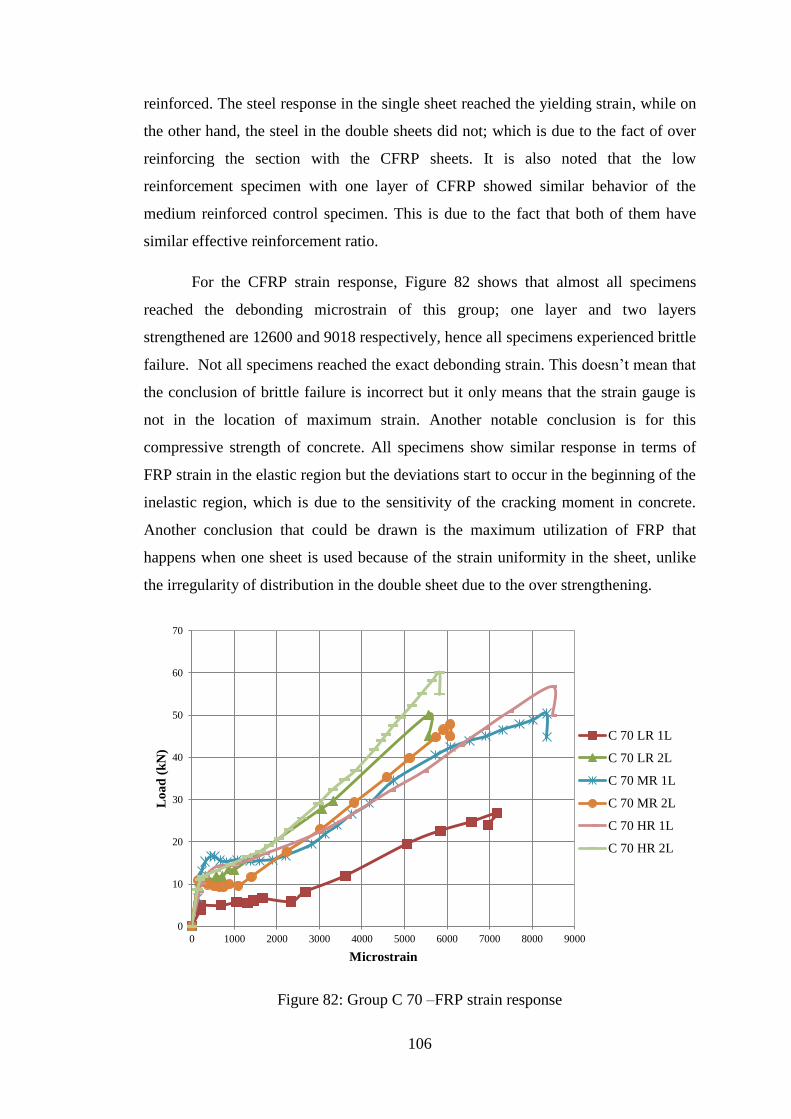
106
reinforced. The steel response in the single sheet reached the yielding strain, while on
the other hand, the steel in the double sheets did not; which is due to the fact of over
reinforcing the section with the CFRP sheets. It is also noted that the low
reinforcement specimen with one layer of CFRP showed similar behavior of the
medium reinforced control specimen. This is due to the fact that both of them have
similar effective reinforcement ratio.
For the CFRP strain response, Figure 82 shows that almost all specimens
reached the debonding microstrain of this group; one layer and two layers
strengthened are 12600 and 9018 respectively, hence all specimens experienced brittle
failure. Not all specimens reached the exact debonding strain. This doesn’t mean that
the conclusion of brittle failure is incorrect but it only means that the strain gauge is
not in the location of maximum strain. Another notable conclusion is for this
compressive strength of concrete. All specimens show similar response in terms of
FRP strain in the elastic region but the deviations start to occur in the beginning of the
inelastic region, which is due to the sensitivity of the cracking moment in concrete.
Another conclusion that could be drawn is the maximum utilization of FRP that
happens when one sheet is used because of the strain uniformity in the sheet, unlike
the irregularity of distribution in the double sheet due to the over strengthening.
Figure 82: Group C 70 –FRP strain response
0
10
20
30
40
50
60
70
0 1000 2000 3000 4000 5000 6000 7000 8000 9000
Lo
ad
(k
N)
Microstrain
C 70 LR 1L
C 70 LR 2L
C 70 MR 1L
C 70 MR 2L
C 70 HR 1L
C 70 HR 2L

107
The strain response in the concrete was similar in almost all specimens, as
shown by Figure 83.
Figure 83: Group C 70 –Concrete strain response
Figure 83 shows that the specimens that had crushing of concrete at the top
have reached values near to the crushing strain of 2530. In contrast, specimens who
incurred membrane action tensile failure, and specimens who experienced brittle
failure of FRP debonding didn’t come close to the crushing strain because the
specimens failed before the compressive force in the concrete reaches a value that will
be able to strain the concrete and cause it to crush.
5.2.3 Ductility measures
Figure 84 shows the ductility comparison between the specimen and the
control specimen of the group. It is noted that the highest ductility was recorded for
the ultimate ductility in the low reinforcement ratio group with the single and double
layer strengthening. Although the single layer showed a huge difference over the
double layer, low reinforced slabs with one and two layers of CFRP have huge
increase in the ductility over the control slab. This ductility could be due to the perfect
utilization of CFRP and steel with the concrete crushing. All other specimens have
shown same ductility as the control specimen. The reason behind this behavior can be
0
10
20
30
40
50
60
70
0 500 1000 1500 2000 2500 3000
Lo
ad
(k
N)
Microstrain
C 70 LR C
C 70 LR 1L
C 70 LR 2L
C 70 MR C
C 70 MR 1L
C 70 MR 2L
C 70 HR C
C 70 HR 1L
C 70 HR 2L

108
accredited to the increase in the compressive strength of the concrete, so the crushing
happens instantly before the final failure.
Figure 84: Ductility comparison
5.2.4 Toughness measures
Figure 85 shows the toughness ratio between the specimen and the control of
the group. It is noted that the behavior of toughness in the low reinforcement group is
the highest due to the fact that this group has the maximum utilization of the materials
in all groups. Another reason behind the high increase in toughness is also the fact
that this group has the biggest increase in the ultimate load over the control slab, and
since the toughness is equivalent to the area under the curve, the more increase in the
ultimate load, the more toughness or energy the specimen absorbs. All other
specimens had almost equivalent toughness as the control specimen. This is logical
since none of the specimens showed substantial increase in the ultimate load over the
control specimen.
0.00
0.50
1.00
1.50
2.00
2.50
C 70 LR C C 70 LR 1L C 70 LR 2L C 70 MR C C 70 MR 1L C 70 MR 2L C 70 HR C C 70 HR 1L C 70 HR 2L
µ1/µ
1CB
µ2/µ
2CB
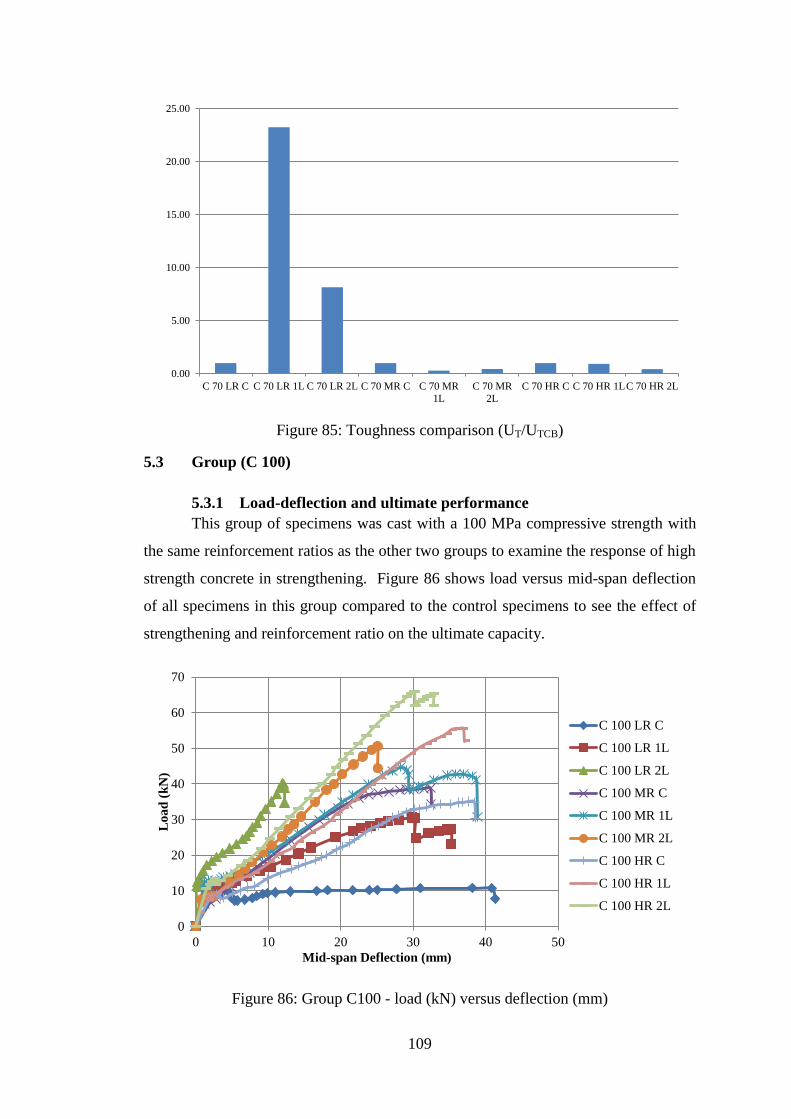
109
Figure 85: Toughness comparison (UT/UTCB)
5.3 Group (C 100)
5.3.1 Load-deflection and ultimate performance
This group of specimens was cast with a 100 MPa compressive strength with
the same reinforcement ratios as the other two groups to examine the response of high
strength concrete in strengthening. Figure 86 shows load versus mid-span deflection
of all specimens in this group compared to the control specimens to see the effect of
strengthening and reinforcement ratio on the ultimate capacity.
Figure 86: Group C100 - load (kN) versus deflection (mm)
0.00
5.00
10.00
15.00
20.00
25.00
C 70 LR C C 70 LR 1L C 70 LR 2L C 70 MR C C 70 MR
1L
C 70 MR
2L
C 70 HR C C 70 HR 1LC 70 HR 2L
0
10
20
30
40
50
60
70
0 10 20 30 40 50
Lo
ad
(k
N)
Mid-span Deflection (mm)
C 100 LR C
C 100 LR 1L
C 100 LR 2L
C 100 MR C
C 100 MR 1L
C 100 MR 2L
C 100 HR C
C 100 HR 1L
C 100 HR 2L

110
From Figure 86, it is clear that almost all specimens showed the same behavior
of ductility and showed the same deflections. This could be explained with the fact
that with the increase of the compressive strength of concrete, the cracking moment
increases and it becomes less sensitive. This graph also confirms the validity of
strengthening the section to increase the ultimate load carrying capacity.
It is clearly indicated in Figure 86 that the load carrying capacities of
strengthened specimens have increased by 12.26% to 274.65% over the control
specimens; this shows the validity of strengthening of thin slabs with CFRP laminated
attached to their soffits. With this percentage of increase, it is safe to say that the
CFRP can be used to increase the load carrying capacity of the specimens that are cast
with C70 concrete. It also shows that the increase in the load carrying capacity in this
group is less than the increase in the load carrying capacity of the C70 group, which is
due to the fact that the CFRP cannot handle the applied force before the crushing of
the concrete, and hence the CFRP debonds before the concrete reaches its
compressive strength.
5.3.2 Strain response
Figure 87 shows the load versus steel strain response for all specimens in this
group. It is clear that all specimens reached the yield strength of the tensile strain of
the steel. It is also noted that almost all specimens had similar response in the elastic
and plastic region. It is also noted that the medium reinforcement ratio configuration
utilizes the steel capacity better than the other two configurations. The reason behind
this utilization is the high strength of concrete for the delay of concrete crushing until
the steel reaches the yielding point.
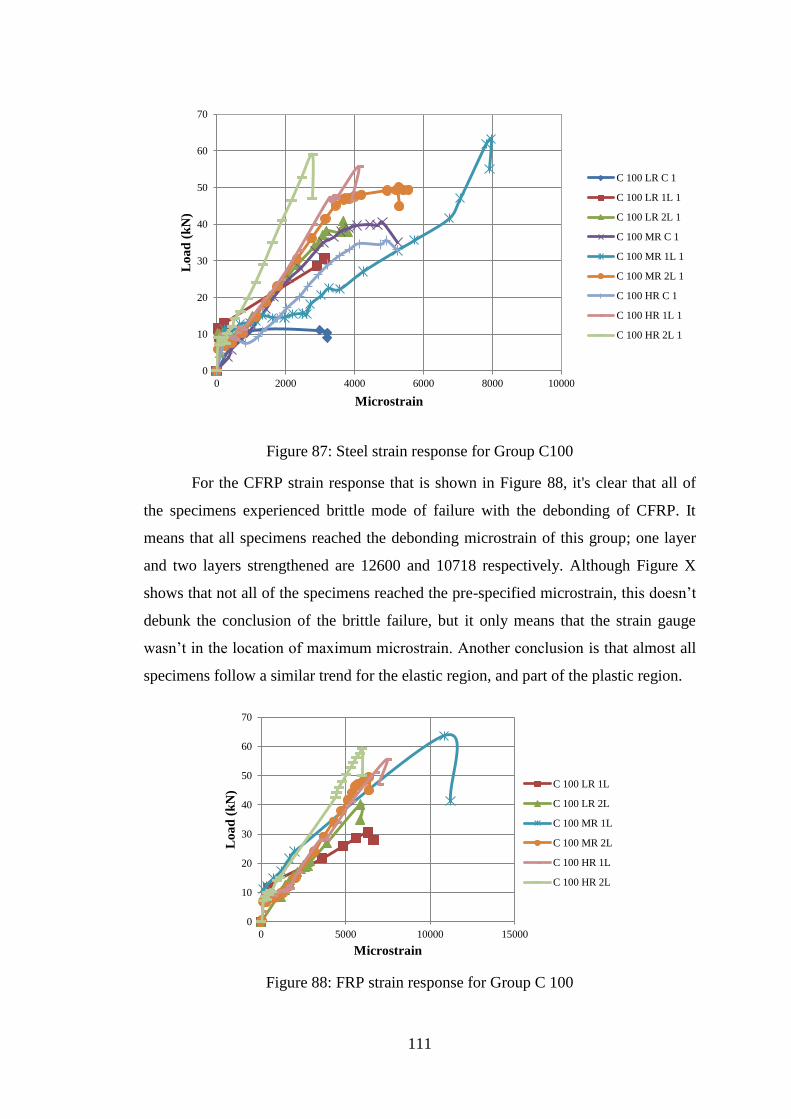
111
Figure 87: Steel strain response for Group C100
For the CFRP strain response that is shown in Figure 88, it's clear that all of
the specimens experienced brittle mode of failure with the debonding of CFRP. It
means that all specimens reached the debonding microstrain of this group; one layer
and two layers strengthened are 12600 and 10718 respectively. Although Figure X
shows that not all of the specimens reached the pre-specified microstrain, this doesn’t
debunk the conclusion of the brittle failure, but it only means that the strain gauge
wasn’t in the location of maximum microstrain. Another conclusion is that almost all
specimens follow a similar trend for the elastic region, and part of the plastic region.
Figure 88: FRP strain response for Group C 100
0
10
20
30
40
50
60
70
0 2000 4000 6000 8000 10000
Lo
ad
(k
N)
Microstrain
C 100 LR C 1
C 100 LR 1L 1
C 100 LR 2L 1
C 100 MR C 1
C 100 MR 1L 1
C 100 MR 2L 1
C 100 HR C 1
C 100 HR 1L 1
C 100 HR 2L 1
0
10
20
30
40
50
60
70
0 5000 10000 15000
Lo
ad
(k
N)
Microstrain
C 100 LR 1L
C 100 LR 2L
C 100 MR 1L
C 100 MR 2L
C 100 HR 1L
C 100 HR 2L

112
The strain response for the concrete is shown in Figure 89.
Figure 89: Concrete strain response for Group C 100
As shown in Figure 89, all specimens have shown similar response in the pre-
cracking region. Moreover, this similarity in behavior also continued in the after-
cracking region. It is also noted that specimens who experienced concrete crushing of
the microstrain values were close to 2930 which is the crushing strain, unlike the
specimens that incurred either tensile membrane action failure or the brittle failure of
FRP debonding where the microstrain values were far from the crushing strain.
5.3.3 Ductility measures
Figure 90 shows the ductility comparison between the specimen and the
control specimen of the group. It is noted that the highest ductility was recorded for
the ultimate ductility in the low reinforcement ratio group with the double layer
strengthening. This means that low reinforced slabs with double layers of CFRP have
huge increase in the ductility over the control slab. This ductility could be due to the
perfect utilization of CFRP and steel with the concrete crushing. All other specimens
have shown same ductility as the control specimen or even lower. The reason behind
this behavior can be the increase in the compressive strength of the concrete, so the
0
10
20
30
40
50
60
70
0 500 1000 1500 2000 2500 3000
Lo
ad
(k
N)
Microstrain
C 100 LR C
C 100 LR 1L
C 100 LR 2L
C 100 MR C
C 100 MR 1L
C 100 MR 2L
C 100 HR C
C 100 HR 1L
C 100 HR 2L

113
crushing happens instantly before the final failure or the crushing might not even
happen before the final failure.
Figure 90: Ductility comparison
5.3.4 Toughness measures
Figure 91 shows the toughness ratio between the specimen and the control of
the group. It is noted that the behavior of toughness in the low reinforcement double
layer CFRP strengthened specimen is the highest due to the fact that this specimen has
the maximum utilization of the materials in all groups. Another reason behind the
high increase in toughness is also the fact that that this group has the largest increase
in the ultimate load over the control slab and since the toughness is equivalent to the
area under the curve, the more increase in the ultimate load, the more toughness or
energy the specimen absorbs. Some other specimens showed some notable increase in
toughness although it is low in the range of 40%. All other specimens had almost
equivalent toughness as the control specimen. This is logical since none of the
specimens showed substantial increase in the ultimate load over the control specimen.
0.00
0.20
0.40
0.60
0.80
1.00
1.20
C 100 LR C C 100 LR
1L
C 100 LR
2L
C 100 MR C C 100 MR
1L
C 100 MR
2L
C 100 HR C C 100 HR
1L
C 100 HR
2L
µ1/µ
1CB
µ2/µ
2CB

114
Figure 91: Toughness comparison (UT/UTCB)
5.4 Conclusions
5.4.1 Effect of reinforcement ratio
5.4.1.1 Group C 40
Figure 92 shows the effect of reinforcement ratio on the increase of flexural
capacity in the C40 group.
Figure 92: Reinforcement ratio effect on C40
0.00
0.50
1.00
1.50
2.00
2.50
C 100 LR C C 100 LR
1L
C 100 LR
2L
C 100 MR C C 100 MR
1L
C 100 MR
2L
C 100 HR C C 100 HR
1L
C 100 HR
2L
0.00
0.50
1.00
1.50
2.00
2.50
3.00
3.50
0.00 0.50 1.00 1.50 2.00
Mn
/Mn
con
t
Reinforcment Ratio
C 40 C
C 40 1L
C 40 2L

115
It is clear from the above graph that with the increase of the reinforcement
ratio, the contribution of the CFRP reduces. This trend is very clear in the two layers
strengthened specimens. For the case of one layer strengthened specimens, the
contribution is at its highest with the medium reinforcement because it is the point of
over reinforcement where the steel doesn’t yield before the crushing of the concrete.
5.4.1.1 Group C 70
Figure 93 shows the effect of reinforcement ratio on the increase of flexural
capacity in the C70 group.
Figure 93: Reinforcement ratio effect on C70
It is clear from the above graph that with the increase of the reinforcement
ratio, the contribution of the CFRP reduces and it becomes constant with the high
reinforcement ratio as well. The reason behind this is that with the increase in CFRP
layers, most of the area of the CFRP becomes unstressed, and the section becomes
over reinforced.
5.4.1.3 Group C 100
Figure 94 shows the effect of reinforcement ratio on the increase of flexural
capacity in the C100 group.
0.00
1.00
2.00
3.00
4.00
5.00
6.00
0.00 0.20 0.40 0.60 0.80 1.00 1.20 1.40 1.60 1.80 2.00
Mn
/Mn
con
t
Reinforcment Ratio
C 70 C
C 70 1L
C 70 2L

116
Figure 94: Reinforcement ratio effect on C100
It is clear from the above graph that with the increase of the reinforcement
ratio, the contribution of the CFRP reduces until the point of over reinforcement
where the steel doesn’t yield before the crushing of the concrete. In the region of high
reinforcement ratio, the contribution increases although this increase is not high but it
is notable.
5.4.2 Effect of concrete compressive strength
5.4.2.1 Low reinforcement
Figure 95 shows the effect of compressive strength of concrete on the increase
of flexural capacity in the low steel reinforcement group.
0.00
0.50
1.00
1.50
2.00
2.50
3.00
3.50
4.00
0.00 0.20 0.40 0.60 0.80 1.00 1.20 1.40 1.60 1.80 2.00
Mn
/Mn
con
t
Reinforcment Ratio
C 100 C
C 100 1L
C 100 2L

117
Figure 95: Concrete compressive strength effect on LR
It is noted from the above graph that for the low reinforcement ratio group that
the contribution of CFRP in increasing the flexural capacity was at its maximum
when the compressive strength of concrete was equal to 70 MPa. After that the
contribution is more seen in the high compressive strength of concrete over the low
compressive strength. It is safe to say that the best arrangement that should be used in
low reinforcement group is a medium strength concrete.
5.4.2.2 Medium reinforcement
Figure 96 shows the effect of compressive strength of concrete on the increase
of flexural capacity in the medium steel reinforcement group.
0.00
1.00
2.00
3.00
4.00
5.00
6.00
0.00 20.00 40.00 60.00 80.00 100.00 120.00
Mn
/Mn
con
t
f'c (Mpa)
LR C (0.45)
LR 1L (0.45)
LR 2L (0.45)

118
Figure 96: Concrete compressive strength effect on MR
It is noted from Figure 96 that for the medium reinforcement ratio group that
when the contribution of CFRP increases, the flexural capacity reduces with the
increase of the compressive strength of the concrete. This response is explained
because with the increase in the compressive strength of concrete, the CFRP debonds
without the concrete crushing at the top. Hence, no full utilization of the materials is
achieved.
5.4.2.3 High reinforcement
Figure 97 shows the effect of compressive strength of concrete on the increase
of flexural capacity in the high steel reinforcement group.
0.00
0.50
1.00
1.50
2.00
2.50
0.00 20.00 40.00 60.00 80.00 100.00 120.00
Mn
/Mn
con
t
f'c (Mpa)
MR C (1.0)
MR 1L (1.0)
MR 2L (1.0)

119
Figure 97: Concrete compressive strength effect on HR
From Figure 97 above, it is noted that the contribution CFRP strengthening
increases when the compressive strength of concrete increases in the high
reinforcement ratio group. This is due to the fact that with the increase in the
reinforcement ratio, increasing the number CFRP sheets will allow the concrete at the
top to reach the crushing strain hence all of the materials are utilized.
5.4.3 Effect of CFRP reinforcement ratio
5.4.3.1 CFRP reinforcement ratio on low steel reinforcement ratio
Figure 98 shows the effect of CFRP reinforcement ratio on the increase of
flexural capacity in the low steel reinforcement group.
0.00
0.20
0.40
0.60
0.80
1.00
1.20
1.40
1.60
1.80
2.00
0.00 20.00 40.00 60.00 80.00 100.00 120.00
Mn
/Mn
con
t
f'c (Mpa)
HR C (1.79)
HR 1L (1.79)
HR 2L (1.79)

120
Figure 98: CFRP ratio effect on LR
There is a clear trend in Figure 98; it is clear that with the increase of the
CFRP reinforcement ratio, the load carrying capacity increases. This is due to the fact
that the CFRP will aid in the deficiency in the flexural steel reinforcement, hence
increasing the load carrying capacity.
5.4.3.2 CFRP reinforcement ratio on medium steel reinforcement ratio
Figure 99 shows the effect of CFRP reinforcement ratio on the increase of
flexural capacity in the medium steel reinforcement group.
0.00
1.00
2.00
3.00
4.00
5.00
6.00
0.0000 0.0020 0.0040 0.0060 0.0080 0.0100
Mn
/Mn
con
t
FRP Ratio
C 40 LR
C 70 LR
C 100 LR
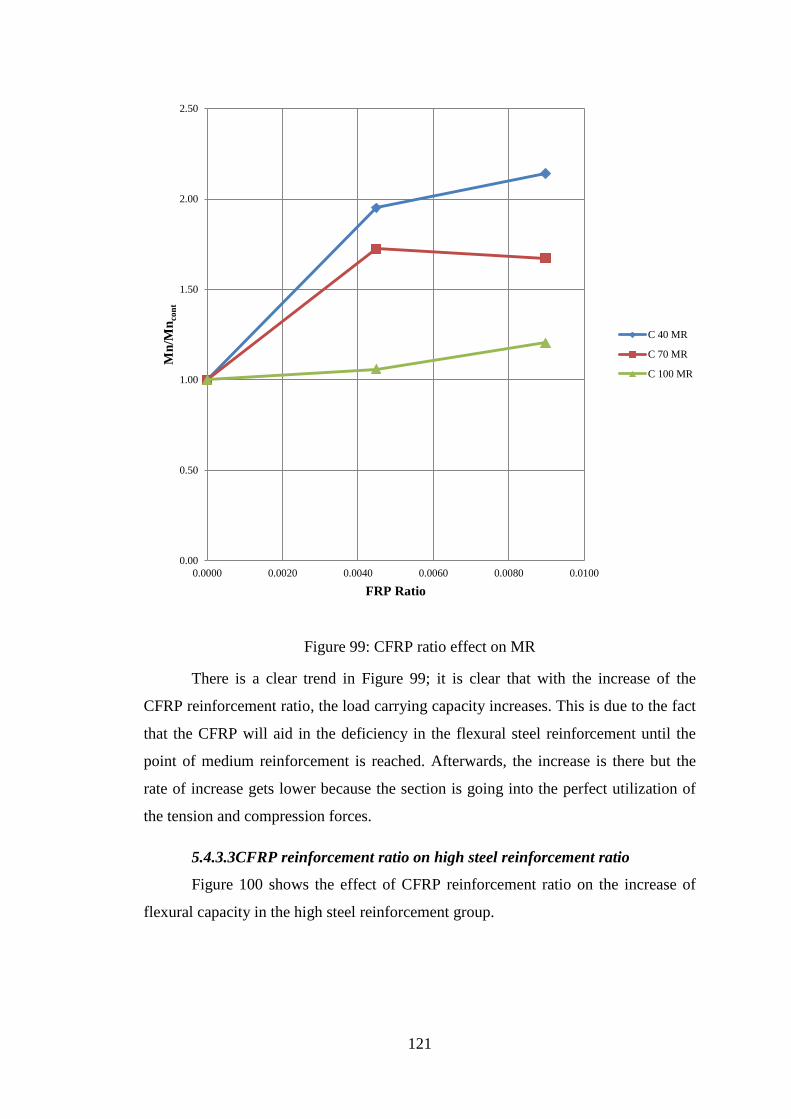
121
Figure 99: CFRP ratio effect on MR
There is a clear trend in Figure 99; it is clear that with the increase of the
CFRP reinforcement ratio, the load carrying capacity increases. This is due to the fact
that the CFRP will aid in the deficiency in the flexural steel reinforcement until the
point of medium reinforcement is reached. Afterwards, the increase is there but the
rate of increase gets lower because the section is going into the perfect utilization of
the tension and compression forces.
5.4.3.3CFRP reinforcement ratio on high steel reinforcement ratio
Figure 100 shows the effect of CFRP reinforcement ratio on the increase of
flexural capacity in the high steel reinforcement group.
0.00
0.50
1.00
1.50
2.00
2.50
0.0000 0.0020 0.0040 0.0060 0.0080 0.0100
Mn
/Mn
con
t
FRP Ratio
C 40 MR
C 70 MR
C 100 MR

122
Figure 100: CFRP ratio effect on HR
It is clear that for this group that the contribution of the CFRP reinforcement
ratio is maximum with the 100 MPa compressive strength of concrete. This can be
attributed to the fact that the concrete crushes in the lower compressive strengths
faster than the higher one before it allows for steel yielding.
0.00
0.20
0.40
0.60
0.80
1.00
1.20
1.40
1.60
1.80
2.00
0.0000 0.0020 0.0040 0.0060 0.0080 0.0100
Mn
/Mn
con
t
FRP Ratio
C 40 HR
C 70 HR
C 100 HR

123
Chapter 6: Theoretical Models
In this chapter, the theoretical behavior will be validated through two
theoretical models. The first model is the flexibility model which relies on concept of
effective flexibility of cracked reinforced concrete. This model will be able to predict
the theoretical deflection versus the loads applied on the slabs. The second model is
used to predict the load carrying capacity of the slab specimens and the mode of
failure; this model relies on the concept of strain compatibility. Both models are found
in ACI- 440.02R-08. On the other hand, the moment capacity of the control sections
where calculated using ACI318-11. All capacities calculations are the nominal
capacities; hence no reduction factor is included.
6.1. Flexibility Model for Cracked Sections
In general, flexibility is the inverse of stiffness. In a structural element, both
flexibility and stiffness are properties of the cross sections that are used to predict
maximum deflections of loaded members. For the field of reinforced concrete
elements, the definition of flexibility and stiffness is well defined using theoretical
and empirical approaches. However, for the field of strengthening, there are many
difficulties due to differences of properties of FRP and steel reinforcements, and the
fact that both of them behave and fail differently under loading. However, ACI-
440.02R-08 provided the concept of flexibility in a semi-empirical equation that is
able to predict the max deflection under different loading scenarios.
Equations 7 through 9[17] outline the procedure of finding the deflection
response of the tested specimens under the two points loading scenario that is adopted
in the study.
1
𝐸𝑐𝐼𝑒𝑓𝑓=
1
𝐸𝑐𝐼𝑐𝑟[1 +
𝜔
1 + 𝜔] ≤
1
𝐸𝑐𝐼𝑔, 𝑓𝑜𝑟 𝑀 ≥ 𝑀𝑐𝑟 (Eq7)
where:
𝜔 = (𝑀𝑐𝑟
𝑀)
3
(𝛽𝑑𝐼𝑔
𝐼𝑐𝑟− 1) (Eq8)
and,
𝛽𝑑 = 𝛼𝑏 (𝐸𝑓
𝐸𝑠+ 1) , 𝛼𝑏 = 0.5 (Eq9)

124
Where:
Ec: Modulus of elasticity of concrete
Ef: Modulus of elasticity of FRP
Es: Modulus of elasticity of steel
M: The applied bending moment on the element
Mcr: The cracking moment of reinforced concrete
Ig: Gross moment of inertia
Icr: Cracked moment of inertia
The main assumption of this flexibility model is that the moment of inertia is
the gross one until the section reaches the cracking load. Afterwards, the moment of
inertia changes to be a combination of the gross moment of inertia and the cracked
moment of inertia. These moments of inertia are used to estimate the instantaneous
flexibility to the applied load. Another main result of this model is with the increase
of load, where the stiffness reduces due to the fact that the neutral axis of the section
shifts up with the increase of load. Equation 10 [17] is the final product of this model
which has the calculation of the maximum deflection of the tested specimens, hence
mid-span deflection.
∆𝑚𝑎𝑥 =𝑃𝑎
24(
1
𝐸𝑐𝐼𝑒𝑓𝑓) (3𝑙2 − 4𝑎2) (Eq10)
where:
P: The applied load
a: The shear span of the point load from the support in the third-point loading
configuration
Ec: Modulus of elasticity of concrete
Ieff: Effective moment of inertia
l: The total beam’s span

125
6.2. Beams graphs and predicted curves
Figures 101 through 127 below compare the predicted deflection model with
the actual load mid-span deflection that is obtained from testing.
Figure 101: Load versus Mid-span Deflection of C 40 LR C
Figure 102: Load versus Mid-span Deflection of C 40 LR 1L
0
2
4
6
8
10
12
14
0 5 10 15 20 25 30 35
Lo
ad
(k
N)
Deflection (mm)
Actual Data
Predicted Data
0
5
10
15
20
25
0 5 10 15 20 25
Lo
ad
(k
N)
Deflection (mm)
Actual Data
Predicted Data

126
Figure 103: Load versus Mid-span Deflection of C 40 LR 2L
Figure 104: Load versus Mid-span Deflection of C 40 MR C
0
5
10
15
20
25
30
35
40
45
0 5 10 15 20 25 30
Lo
ad
(k
N)
Deflection (mm)
Actual Data
Predicted Data
0
10
20
30
40
50
60
0 5 10 15 20 25 30
Lo
ad
(k
N)
Deflection (mm)
Actual Data
Predicted Data

127
Figure 105: Load versus Mid-span Deflection of C 40 MR 1L
Figure 106: Load versus Mid-span Deflection of C 40 MR 2L
0
5
10
15
20
25
30
35
40
45
50
0 5 10 15 20 25 30 35
Lo
ad
(k
N)
Deflection (mm)
Actual Data
Predicted Data
0
10
20
30
40
50
60
0 5 10 15 20 25
Lo
ad
(k
N)
Deflection (mm)
Actual Data
Predicted Data
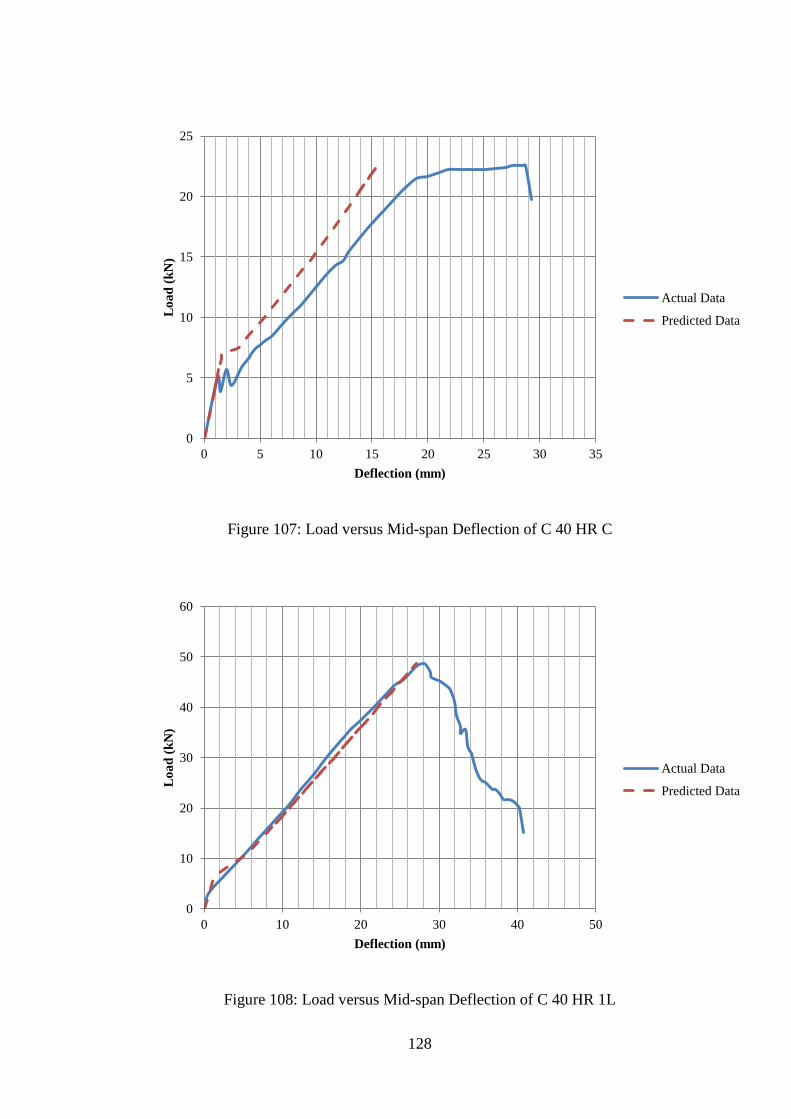
128
Figure 107: Load versus Mid-span Deflection of C 40 HR C
Figure 108: Load versus Mid-span Deflection of C 40 HR 1L
0
5
10
15
20
25
0 5 10 15 20 25 30 35
Lo
ad
(k
N)
Deflection (mm)
Actual Data
Predicted Data
0
10
20
30
40
50
60
0 10 20 30 40 50
Lo
ad
(k
N)
Deflection (mm)
Actual Data
Predicted Data

129
Figure 109: Load versus Mid-span Deflection of C 40 HR 2L
Figure 110: Load versus Mid-span Deflection of C 70 LR C
0
5
10
15
20
25
30
35
40
45
0 5 10 15 20 25
Lo
ad
(k
N)
Deflection (mm)
Actual Data
Predicted Data
0
2
4
6
8
10
12
0 5 10 15
Lo
ad
(k
N)
Deflection (mm)
Actual Data
Predicted Data

130
Figure 111: Load versus Mid-span Deflection of C 70 LR 1L
Figure 112: Load versus Mid-span Deflection of C 70 LR 2L
0
5
10
15
20
25
30
0 5 10 15 20 25 30 35 40
Lo
ad
(k
N)
Deflection (mm)
Actual Data
Predicted Data
0
5
10
15
20
25
30
35
40
45
50
0 5 10 15 20 25 30
Lo
ad
(k
N)
Deflection (mm)
Actual Data
Predicted Data

131
Figure 113: Load versus Mid-span Deflection of C 70 MR C
Figure 114: Load versus Mid-span Deflection of C 70 MR 1L
0
5
10
15
20
25
30
0 20 40 60 80 100
Lo
ad
(k
N)
Deflection (mm)
Actual Data
Predicted Data
0
5
10
15
20
25
30
35
40
45
50
0 10 20 30 40
Lo
ad
(k
N)
Deflection (mm)
Actual Data
Predicted Data

132
Figure 115: Load versus Mid-span Deflection of C 70 MR 2L
Figure 116: Load versus Mid-span Deflection of C 70 HR C
0
5
10
15
20
25
30
35
40
45
50
0 10 20 30 40
Lo
ad
(k
N)
Deflection (mm)
Actual Data
Predicted Data
0
5
10
15
20
25
30
35
40
45
0 10 20 30 40 50
Lo
ad
(k
N)
Deflection (mm)
Actual Data
Predicted Data

133
Figure 117: Load versus Mid-span Deflection of C 70 HR 1L
Figure 118: Load versus Mid-span Deflection of C 70 HR 2L
0
10
20
30
40
50
60
0 5 10 15 20 25 30 35 40
Lo
ad
(k
N)
Deflection (mm)
Actual Data
Predicted Data
0
10
20
30
40
50
60
70
0 5 10 15 20 25 30 35
Lo
ad
(k
N)
Deflection (mm)
Actual Data
Predicted Data

134
Figure 119: Load versus Mid-span Deflection of C 100 LR C
Figure 120: Load versus Mid-span Deflection of C 100 LR 1L
0
5
10
15
20
25
30
0 20 40 60 80 100
Lo
ad
(k
N)
Deflection (mm)
Actual Data
Predicted Data
0
5
10
15
20
25
30
35
0 5 10 15 20 25 30 35 40
Lo
ad
(k
N)
Deflection (mm)
Actual Data
Predicted Data
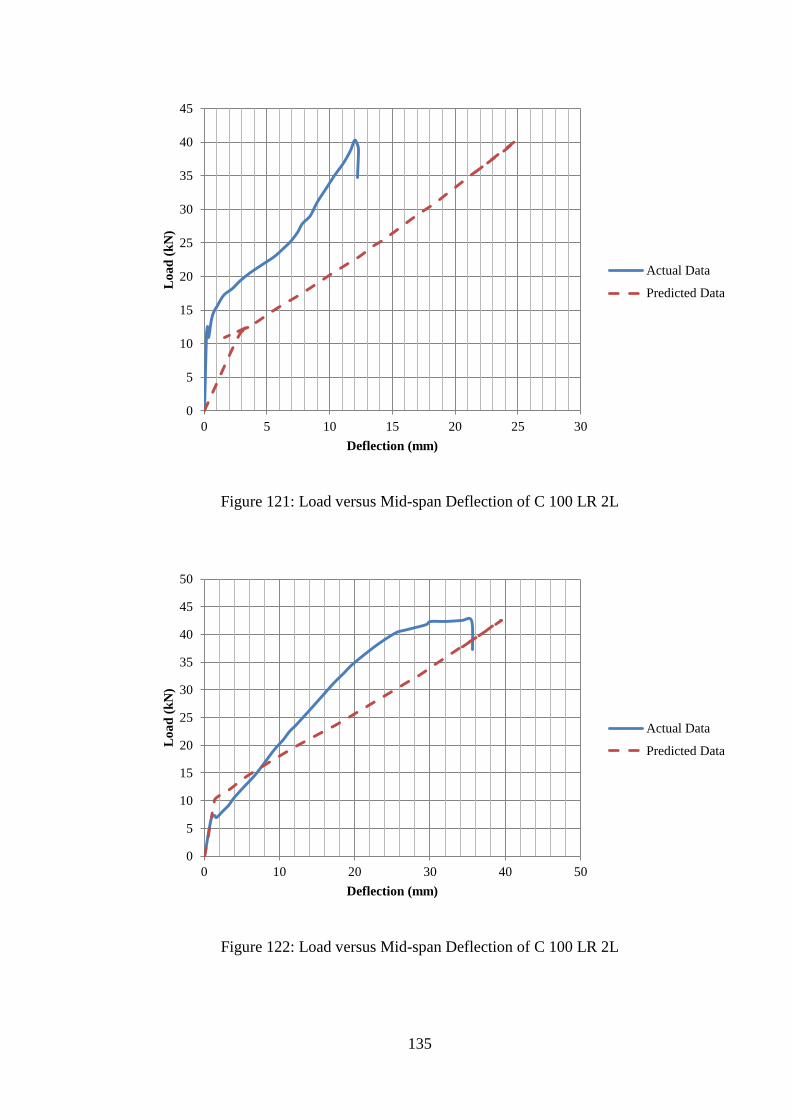
135
Figure 121: Load versus Mid-span Deflection of C 100 LR 2L
Figure 122: Load versus Mid-span Deflection of C 100 LR 2L
0
5
10
15
20
25
30
35
40
45
0 5 10 15 20 25 30
Lo
ad
(k
N)
Deflection (mm)
Actual Data
Predicted Data
0
5
10
15
20
25
30
35
40
45
50
0 10 20 30 40 50
Lo
ad
(k
N)
Deflection (mm)
Actual Data
Predicted Data

136
Figure 123: Load versus Mid-span Deflection of C 100 MR 1L
Figure 124: Load versus Mid-span Deflection of C 100 MR 2L
0
5
10
15
20
25
30
35
40
45
50
0 10 20 30 40 50
Lo
ad
(k
N)
Deflection (mm)
Actual Data
Predicted Data
0
10
20
30
40
50
60
0 5 10 15 20 25 30
Lo
ad
(k
N)
Deflection (mm)
Actual Data
Predicted Data
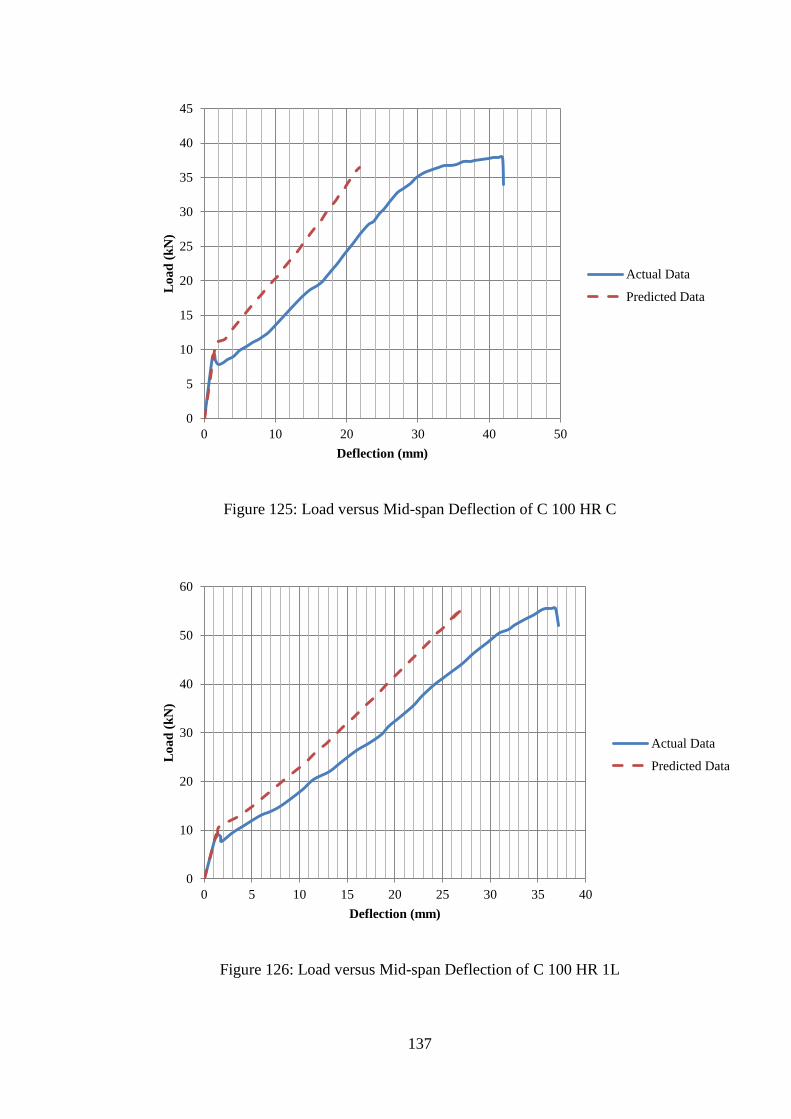
137
Figure 125: Load versus Mid-span Deflection of C 100 HR C
Figure 126: Load versus Mid-span Deflection of C 100 HR 1L
0
5
10
15
20
25
30
35
40
45
0 10 20 30 40 50
Lo
ad
(k
N)
Deflection (mm)
Actual Data
Predicted Data
0
10
20
30
40
50
60
0 5 10 15 20 25 30 35 40
Lo
ad
(k
N)
Deflection (mm)
Actual Data
Predicted Data

138
Figure 127: Load versus Mid-span Deflection of C 100 HR 2L
There are many conclusions that can be drawn from the above models. One
conclusion is that most of the specimens showed a typical trend in the elastic range of
loading. After the specimens reach the plastic range, the behavior of the model
deviates from the tested data as they are increasing with steeper slopes than the tested
specimens. Some specimens, however, followed the exact, actual tested specimens,
which could be due to the fact that the theoretical cracking moment is the actual
cracking moment; hence the flexibility model used the true moment of inertia.
Another conclusion from the models is that after ultimate the models don’t predict the
mode of failure, hence they backtrack as the load decreases. To cope with this effect,
the models were terminated after the ultimate load capacity of the specimens. In
conclusion, flexibility models validate the testing results since both models and the
tested data follow similar trends.
0
10
20
30
40
50
60
70
0 5 10 15 20 25 30 35
Lo
ad
(k
N)
Deflection (mm)
Actual Data
Predicted Data
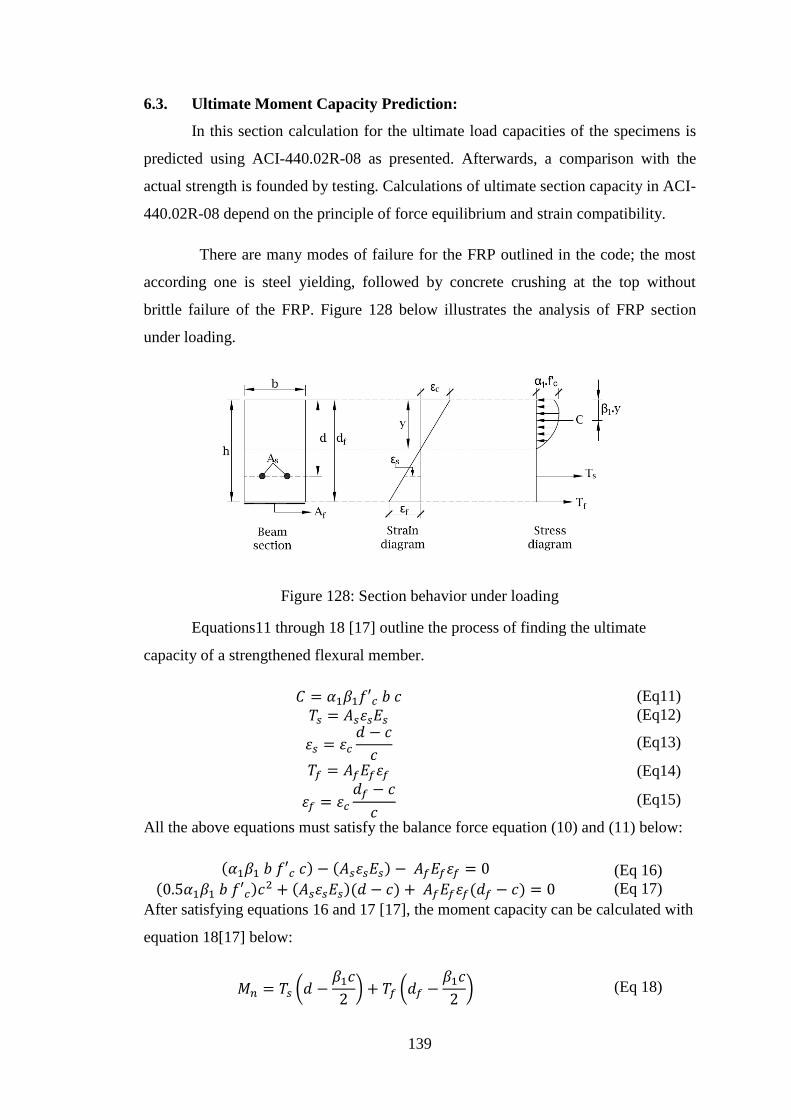
139
6.3. Ultimate Moment Capacity Prediction:
In this section calculation for the ultimate load capacities of the specimens is
predicted using ACI-440.02R-08 as presented. Afterwards, a comparison with the
actual strength is founded by testing. Calculations of ultimate section capacity in ACI-
440.02R-08 depend on the principle of force equilibrium and strain compatibility.
There are many modes of failure for the FRP outlined in the code; the most
according one is steel yielding, followed by concrete crushing at the top without
brittle failure of the FRP. Figure 128 below illustrates the analysis of FRP section
under loading.
Figure 128: Section behavior under loading
Equations11 through 18 [17] outline the process of finding the ultimate
capacity of a strengthened flexural member.
𝐶 = 𝛼1𝛽1𝑓′𝑐 𝑏 𝑐 (Eq11)
𝑇𝑠 = 𝐴𝑠𝜀𝑠𝐸𝑠 (Eq12)
𝜀𝑠 = 𝜀𝑐
𝑑 − 𝑐
𝑐 (Eq13)
𝑇𝑓 = 𝐴𝑓𝐸𝑓𝜀𝑓 (Eq14)
𝜀𝑓 = 𝜀𝑐
𝑑𝑓 − 𝑐
𝑐 (Eq15)
All the above equations must satisfy the balance force equation (10) and (11) below:
(𝛼1𝛽1 𝑏 𝑓′𝑐 𝑐) − (𝐴𝑠𝜀𝑠𝐸𝑠) − 𝐴𝑓𝐸𝑓𝜀𝑓 = 0
(0.5𝛼1𝛽1 𝑏 𝑓′𝑐)𝑐2 + (𝐴𝑠𝜀𝑠𝐸𝑠)(𝑑 − 𝑐) + 𝐴𝑓𝐸𝑓𝜀𝑓(𝑑𝑓 − 𝑐) = 0
(Eq 16)
(Eq 17)
After satisfying equations 16 and 17 [17], the moment capacity can be calculated with
equation 18[17] below:
𝑀𝑛 = 𝑇𝑠 (𝑑 −𝛽1𝑐
2) + 𝑇𝑓 (𝑑𝑓 −
𝛽1𝑐
2) (Eq 18)

140
where:
C: Compressive force in the concrete.
TS: Tension force from the steel.
𝜀𝑠: Strain of the steel in the section.
𝑇𝑓: Tension force from the FRP.
𝜀𝑓: Strain of the FRP in the section.
𝛼1, 𝛽1 : Concrete compression blocks parameters.
The process of calculations FRP strengthened section above involves an
iterative process for finding the neutral axis since the other option is to solve a
quadratic equation. In this iterative process, a neutral axis depth and mode of failure
are assumed. This process was followed by iterations until force equilibrium
equations are satisfied, hence strain compatibility is met. For the purpose of this
study, all reduction factors are dropped since the aim is to analyze the section not to
design it.
Table 19 illustrates the ultimate capacity of sections with the error estimations.
The results presented in Table 19 are plotted in figure 129. A 100% line was also
plotted to demonstrate the % error. The results show the over and under estimation of
the results, hence any value that falls under the line is over estimated and any value
that stands over the line is over estimated. Furthermore, it is clear that almost all of
the results are over estimated. This is anticipated since the ACI-440.02R-08 usually
over estimates the load carrying capacities of flexural sections. Moreover, a
regression line was plotted and the coefficient of regression was determined to be
0.754 which is a measure of data precision. This means for this study that the ACI-
440.02R-08 predicted the ultimate load with a75.4 % of accuracy. This load accuracy
could be due to the fact that the section of this study is thin and the code is not
capable of predicting these sections with 100% accuracy. Another reason for this
inaccuracy might be due to human errors associated with the human errors that are
induced with every step of fabrication. From the data points, we can see that for this

141
type of specimens some calculations are over estimated while the others are under
estimated.
Table 19: Load predictions and error estimations.
Group Specimen Pu, exp
(kN)
Pu, pred
(kN) % Error Pu/Pn
C 40 LR
C 40 LR C 11.63 13.12 -11.36 0.89
C 40 LR 1L 21.69 16.71 29.80 1.30
C 40 LR 2L 38.5 19.01 102.52 2.03
C 40
MR
C 40 MR C 22.6 28.19 -19.83 0.80
C 40 MR 1L 46.8 33.50 39.70 1.40
C 40 MR 2L 50.53 35.70 41.54 1.42
C 40 HR
C 40 HR C 44.88 46.92 -4.35 0.96
C 40 HR 1L 52.25 54.33 -3.83 0.96
C 40 HR 2L 53.85 55.70 -3.32 0.97
C 70 LR
C 70 LR C 10.17 13.31 -23.59 0.76
C 70 LR 1L 26.6 16.86 57.77 1.58
C 70 LR 2L 42.1 19.81 112.52 2.13
C 70
MR
C 70 MR C 26 29.14 -10.78 0.89
C 70 MR 1L 45.2 34.21 32.13 1.32
C 70 MR 2L 47.44 36.49 30.01 1.30
C 70 HR
C 70 HR C 33.04 49.46 -33.20 0.67
C 70 HR 1L 56.08 57.53 -2.52 0.97
C 70 HR 2L 59.3 59.71 -0.69 0.99
C 100
LR
C 100 LR C 10.73 13.38 -19.81 0.80
C 100 LR 1L 30.56 16.92 80.61 1.81
C 100 LR 2L 40.2 19.26 108.72 2.09
C 100
MR
C 100 MR C 38.75 29.53 31.22 1.31
C 100 MR 1L 43.5 34.54 25.94 1.26
C 100 MR 2L 49.58 36.74 34.95 1.35
C 100
HR
C 100 HR C 35 51.19 -31.63 0.68
C 100 HR 1L 55.14 58.27 -5.37 0.95
C 100 HR 2L 65.2 60.50 7.77 1.08

142
Figure 129: Experimental versus predicted ultimate load capacities
0
10
20
30
40
50
60
70
80
90
0 10 20 30 40 50 60 70 80 90
Pu
, p
red
(K
N)
Pn, exp (KN)

143
Chapter 7: Summary and Conclusion
The field of reinforced concrete strengthening is ever-growing. There are
many advantages of strengthening of the concrete structure elements, such as helping
in the case of damage, design errors, or deficiencies of flexural steel. The use of fiber
polymers is gaining great popularity because of the attractive properties that fiber
polymers have. The main property that makes them very attractive is the high strength
to weight ratio.
The use of FRP for strengthening of structural elements is best option over its
ancestries such as steel plating and jacketing. The problem with the older methods is
the durability of steel used in strengthening, as steel is a very corrosive material, and
that it tends to degrade with the environment. Another advantage of the FRP is the
practicality and the ease of installation and protection.
This research aimed to study the behavior of high-strength reinforced concrete
slabs bonded externally with CFRP composite sheets to improve their flexural
capacity. A total of fifty-four slabs has been cast and tested to prove the theory and
the objective of the proposed study. The slabs were tested in a two-point loading
arrangement until failure. The variables of the experimental program were the
concrete compressive strength, longitudinal steel reinforcement ratio, and number of
layers of CFRP composite sheets. The results of these tests were compared together to
conclude the range of the enhancement of the CFRP and effect of the mentioned
variables on the performance of high-strength RC slabs. Another aim of this study
was to validate and check the ACI440.2R-08 capacity prediction equations, and to
develop analytical models with flexibility formula to ensure the limits of code
provisions applicability.
As many variables were examined in this study, many observations have been
noticed in this study, many of which are listed below:
1. Typically, in all groups the control specimen has the highest deflection,
hence the highest ductility.
2. The strain steel response of all specimens within the same group showed
similar response in the elastic region. However, the response starts to

144
deviate in the plastic region, which is due to the different CFRP
strengthening reinforcement ratio.
3. It was noted that single sheet configurations have the maximum utilization
of the CFRP since the area of the CFRP present in this configuration is
less than the area present in the double sheet configuration.
4. It is clearly noted that all strengthened specimens experienced brittle
failure mode by debonding of CFRP Laminates.
5. With the increase of the reinforcement ratio, the ultimate strain in the
concrete at the top fibers increases.
6. Slabs in all subgroups under the C70 groups have reached the yielding
strain in steel, unlike the C40 group where in some specimens, the
concrete crushed before the steel gets to the yielding stage.
7. Specimens who incurred tensile membrane action (tension-controlled)
failure and specimens who experienced brittle failure of FRP debonding,
their ultimate compressive strain of concrete didn’t come close to the
crushing strain that is because the specimens failed before the
compressive force in the concrete reaches the crushing strain.
8. It is noted that in the C70 group, the highest ductility was recorded for the
specimens in the low reinforcement ratio group, with single and double
CFRP layers strengthening.
9. It was noted in the C70 group that the behavior of toughness in the low
reinforcement group was the highest, due to the fact that this group had
the maximum utilization of the materials among all other groups.
10. In the C100 group, it was also noted that the medium reinforcement ratio
configuration utilizes the steel capacity better than the other two
configurations.
11. In the C100 group it was noted that the highest ductility was recorded for
the low reinforcement ratio group with double layer strengthening.
12. It was noted in the C100 group that the behavior of toughness in the low
reinforcement ratio group with two layers of CFRP sheet was the highest
due to the fact that this specimen has the maximum utilization of the
materials in all groups.

145
13. It was also noted in all groups of specimens that as the steel reinforcement
ratio increases, the percent increase in the load-carrying capacity
decreases.
14. For the low reinforcement ratio group, it was noted that when the
contribution of CFRP was increasing, the flexural capacity was at its
maximum when the compressive strength of concrete was equal to 70
MPa.
15. For the medium reinforcement ratio group, it was noted that the
contribution of CFRP increases, the gain in flexural capacity is reduced
with the increase in the compressive strength of concrete.
16. For the concrete compressive strength effect on HR group, it is noted that
the contribution CFRP strengthening increases when the compressive
strength of concrete increases in the high reinforcement ratio group.
From the above, the following conclusions could be drawn;
1. Strengthening of high strength thin concrete slab in flexural is a valid
option to increase in their load carrying capacity. In some specimens, an
increase of over 350% was recorded, while in others, the increase was just
a little over 15%.
2. The system of thin slabs cast with high strength concrete with CFRP
strengthening can be equivalent to conventional RC slabs system if
designed properly.
3. Slabs with low reinforcement ratios had shown the highest increase in the
load-carrying capacity, since CFRP strengthening increased the flexural
reinforcement ratio.
4. ACI 440 provisions gave accurate results for the load carrying capacities
and the deflection response which indicated the applicability of the code
for such elements.
5. For strengthened specimens, the single layer configuration showed better
utilization of the material over that with double layer configurations.
6. For the contribution of CFRP strengthening with different concrete
compressive strengths, the C70 group showed the best response since
specimens cast with 70 MPa concrete compressive strength were able to
reach the CFRP debonding strain and concrete crushing strain at failure.

146
It should be noted that specimens in high reinforcement ratio group (HR) has a
reinforcement ratio close to the balanced reinforcement ratio and with CFRP
strengthening the section goes from tension-controlled to compression-controlled
which proves the conclusion of the stability of the increase in the load-carrying
capacity with the increase in the CFRP strengthening ratio.
For future research studies, it is recommended to develop Finite Element (FE)
models to study the performance of thin high strength slabs strengthened with
different composite materials and configurations. This will ensure a better
understanding of the subject in hand and assess the contribution of each variable in
increasing the flexural strength in high strength thin slabs. Furthermore, a crack based
monitoring system would be installed on the specimens in future research studies to
assess the cracking moment variability with different combinations of variables.

147
References
[1] A. El-Sayed, R. Al-Zaid, A. Al-Negheimish, A. Shuraim, and A. Alhozaimy,
“Long-term behavior of wide shallow RC beams strengthened with externally
bonded CFRP plates,” Construction and Building Materials, vol. 51, pp. 473-
483, Sep 2014.
[2] H. Niu, A. Vasquez, and V. Karbhari, “Effect of material configuration on
strengthening of concrete slabs by CFRP composites,” Composites Part B:
Engineering, vol. 37, pp. 213-226, 2006.
[3] H. Lee, S. Cheong, S. Haw, and C. Lee, “Concrete girders with composites:
Installation, design and inspection,” Construction and Building Materials, vol.
23, pp. 1495-1507, 2010.
[4] A. Al-Saidy, F. Klaiber, T. Wipf, K. Al-Jabri, and A. Al-Nuaimi, “Parametric
study on the behavior of short span composite bridge girders strengthened
with carbon fiber reinforced polymer plates,” Construction and Building
Materials, vol. 22, pp. 729-737, 2008.
[5] M. Islam, M. Mansur, and M. Maalej, “Shear strengthening of RC deep beams
using externally bonded FRP systems,” Cement and Concrete Composites,
vol. 27, pp. 413-420, 2005.
[6] H. Lee, S. Cheong, S. Haw, and C. Lee, “Behavior and performance of RC T-
section deep beams externally strengthened in shear with CFRP sheets,”
Composite Structures, vol. 93, pp. 911-922, 2011.
[7] C. Wu, D. Oehlers, M. Rebentrost, J. Leach, and A. Whittaker, “Blast testing
of ultra-high performance fiber and FRP-retrofitted concrete slabs,”
Engineering Structures, vol. 31, pp. 2060-2069, 2009.
[8] J. Dong, Q. Wang, and Z. Guan, “Structural behaviour of RC beams with
external flexural and flexural–shear strengthening by FRP sheets,) Composites
Part B: Engineering, vol. 44, pp. 604-612, 2013.
[9] Ö. Anil, N. Kaya, and O. Arslan, “Strengthening of one way RC slab with
opening using CFRP strips,” Construction and Building Materials, vol. 48, pp.
883-893, 2013.
[10] E. Rochdi, D. Bigaud, E. Ferrier, and P. Hamelin, “Ultimate behavior of
CFRP strengthened RC flat slabs under a centrally applied load,” Composite
Structures, vol. 72, pp. 69-78, 2006.
[11] D. Faria, J. Einpaul, A. Ramos, M. Ruiz, and A. Muttoni, “On the efficiency
of flat slabs strengthening against punching using externally bonded fiber
reinforced polymers,” Construction and Building Materials, vol. 73, 366-377,
2014.

148
[12] B. Mohammed, L. Ean, and M. Malek, “One way RC wall panels with
openings strengthened with CFRP,” Construction and Building Materials, vol.
40, pp. 575-583, 2013.
[13] L. Michel, E. Ferrier, D. Bigaud, and A. Agbossou, “Criteria for punching
failure mode in RC slabs reinforced by externally bonded CFRP,” Composite
Structures, vol. 81, pp. 438-449, 2007.
[14] F. Fathelbab, M. Ramadan, and A. Al-Tantawy, “Strengthening of RC bridge
slabs using CFRP sheets,” Alexandria Engineering Journal, vol. 53, pp. 843-
854, 2014.
[15] J. L. Borgerson and W. L. Vogt, “Evaluation of Externally Bonded Fiber-
Reinforced Polymer Systems to Concrete Structures,” Concrete Repair
Bulletin, pp. 18-21, Sep. 2011.
[16] M. Rezazadeh, I. Costa, and J. Barros, “Influence of prestress level on NSM
CFRP laminates for the flexural strengthening of RC beams,” Composite
Structures, vol. 117, pp. 489-500, Nov. 2014.
[17] American Concrete Institute, "ACI 440.2-08: Guide for the Design and
Construction of Externally Bonded FRP Systems for Strengthening Concrete
Structures," USA, 2008.
[18] A. R. Bunsell “Fiber Reinforcement,” in Int. Encyclopedia of Composites,
vol. 2, New York: VCH publishers, 1990, pp. 149.
[19] F. Al-Mahmoud, A. Castel, R. François, and C. Tourneur, “Strengthening of
RC members with near-surface mounted CFRP rods,” Composite Structures,
vol. 42, pp. 138-147, 2009.
[20] M. Rezazadeh, J. Barros, and I. Costa, “Analytical approach for the flexural
analysis of RC beams strengthened with prestressed CFRP,” Composites Part
B: Engineering, vol. 28, pp. 16-34, 2015.
[21] S. Bagherpour, “Fiber Reinforced Polyester Composites,” Polyester, vol. 41,
pp. 211, 2012.
[22] G. Campione, A. Monaco, and G. Minafò, “Shear strength of high-strength
concrete beams: Modeling and design recommendations,” Engineering
Structures, vol. 85, pp.116-122, 2014.
[23] A. Cladera, and A. Marí, “Experimental study on high-strength concrete
beams failing in shear,” Engineering Structures, vol. 29, pp.1519-1527, 2005.
[24] R. Al-Rousan, M. Issa, and H. Shabila, “Performance of reinforced concrete
slabs strengthened with different types and configurations of CFRP,”
Composites Part B: Engineering, vol. 77, pp. 510-521, 2012.
[25] H. Toutanji, L. Zhao, and Y. Zhang, “Flexural behavior of reinforced
concrete beams externally strengthened with CFRP sheets bonded with an
inorganic matrix,” Engineering Structures, vol. 89, pp. 557-566, 2006.

149
[26] R. Al-Zaid, A. Al-Negheimish, M. Al-Saawani, and A. El-Sayed, “Analytical
study on RC beams strengthened for flexure with externally bonded FRP
reinforcement,” Composites Part B: Engineering, vol. 55, pp. 129-14, 2012.
[27] S. Floruţ, G. Sas, C. Popescu, and V. Stoian, “Tests on reinforced concrete
slabs with cut-out openings strengthened with fibre-reinforced polymers,”
Composites Part B: Engineering, vol. pp. 71, 484-493, 2014.
[28] British Standards Institution, "BS EN 10080; B500A Steel for the
reinforcement of concrete, weldable, ribbed reinforcing steel," London, 2005.
[29] T. Dat, and A. Starnes, “Strength and ductility of concrete beams reinforced
with carbon FRP and steel,” Gaithersburg, MD: U.S. Dept. of Commerce,
Technology Administration, National Institute of Standards and Technology,
vol. 9, pp. 15-17, 2013.
[30] P. Collins, and D. Mitchell, “Materials,” in Prestressed Concrete Structures,
5th
ed., Englewood Cliffs: Prentice Hall, 1991, pp. 766.

150
Appendix
Appendix A: Load deflection graphs
Figure 130: Load versus Mid-span Deflection for C40 LR C specimens
Figure 131: Load versus Mid-span Deflection for C40 LR 1L specimens
0
2
4
6
8
10
12
14
0 10 20 30 40
Lo
ad
(K
N)
Deflection (mm)
C 40 LR C 1
C 40 LR C 2
0
5
10
15
20
25
0 5 10 15 20 25
Lo
ad
(K
N)
Deflection (mm)
C 40 LR1L 1
C 40 LR 1L 2

151
Figure 132: Load versus Mid-span Deflection for C40 LR 2L specimens
Figure 133: Load versus Mid-span Deflection for C40 MR C specimens
0
5
10
15
20
25
30
35
40
45
0 5 10 15 20 25 30
Lo
ad
(K
N)
Deflection (mm)
C 40 LR2L 1
C 40 LR 2L 2
0
5
10
15
20
25
30
0 10 20 30 40
Lo
ad
(K
N)
Deflection (mm)
C 40 MR C 1
C 40 MR C 2

152
Figure 134: Load versus Mid-span Deflection for C40 MR 1L specimens
Figure 135: Load versus Mid-span Deflection for C40 MR 2L specimens
0
10
20
30
40
50
60
0 10 20 30 40
Lo
ad
(K
N)
Deflection (mm)
C 40 MR1L 1
C 40 MR 1L 2
0
10
20
30
40
50
60
0 5 10 15 20 25 30 35
Lo
ad
(K
N)
Deflection (mm)
C 40 MR 2L 1
C 40 MR 2L 2

153
Figure 136: Load versus Mid-span Deflection for C40 HR C specimens
Figure 137: Load versus Mid-span Deflection for C40 HR 1L specimens
0
10
20
30
40
50
60
0 5 10 15 20 25
Lo
ad
(K
N)
Deflection (mm)
C 40 HR C 1
C 40 HR C 2
0
10
20
30
40
50
60
0 5 10 15 20 25 30 35
Lo
ad
(K
N)
Deflection (mm)
C 40 HR 1L 1
C 40 HR 1L 2

154
Figure 138: Load versus Mid-span Deflection for C40 HR 2L specimens
Figure 139: Load versus Mid-span Deflection for C70 LR C specimens
0
10
20
30
40
50
60
0 5 10 15 20 25
Lo
ad
(K
N)
Deflection (mm)
C 40 HR 2L 1
C 40 HR 2L 2
0
2
4
6
8
10
12
0 5 10 15
Lo
ad
(K
N)
Deflection (mm)
C 70 LR C 1
C 70 LR C 2

155
Figure 140: Load versus Mid-span Deflection for C70 LR 1L specimens
Figure 141: Load versus Mid-span Deflection for C70 LR 2L specimens
0
5
10
15
20
25
30
0 10 20 30 40
Lo
ad
(K
N)
Deflection (mm)
C 70 LR 1L 1
C 70 LR 1L 2
0
10
20
30
40
50
60
0 5 10 15 20 25 30 35
Lo
ad
(K
N)
Deflection (mm)
C 70 LR 2L 1
C 70 LR 2L 2

156
Figure 142: Load versus Mid-span Deflection for C70 MR C specimens
Figure 143: Load versus Mid-span Deflection for C70 MR 1L specimens
0
5
10
15
20
25
30
0 20 40 60 80 100
Lo
ad
(K
N)
Deflection (mm)
C 70 MR C 1
C 70 MR C 2
0
10
20
30
40
50
60
0 10 20 30 40
Lo
ad
(K
N)
Deflection (mm)
C 70 MR 1L 1
C 70 MR 1L 2
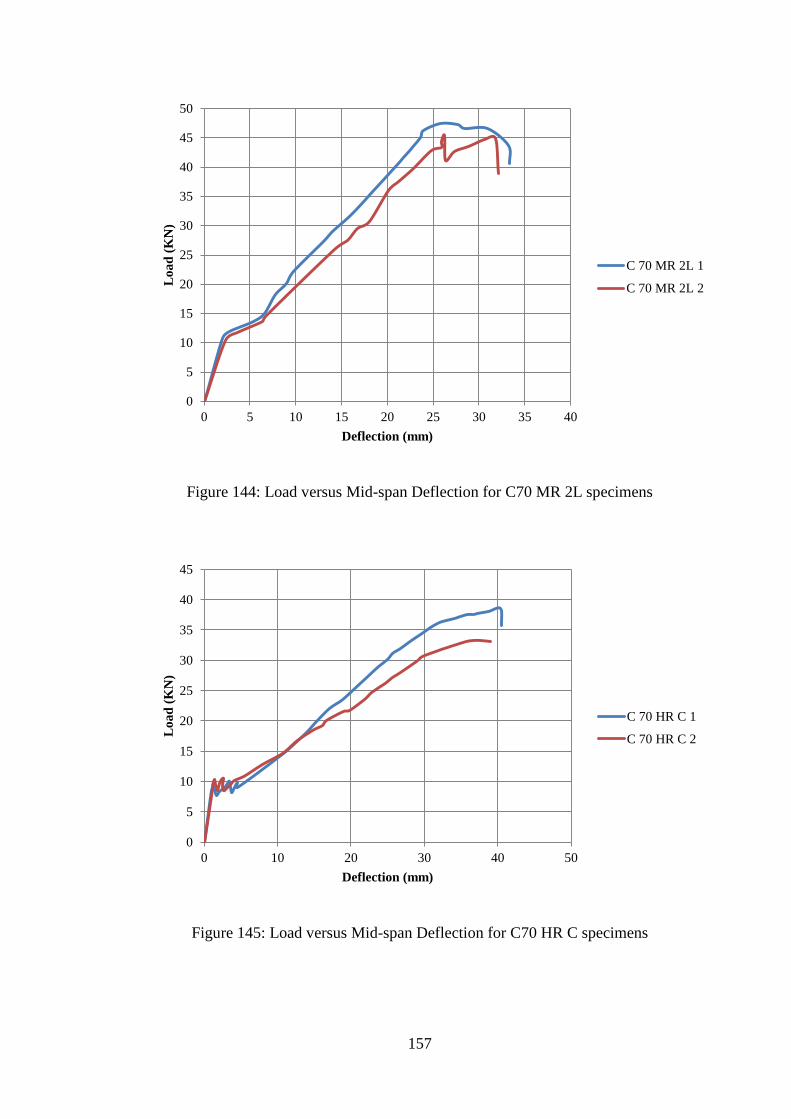
157
Figure 144: Load versus Mid-span Deflection for C70 MR 2L specimens
Figure 145: Load versus Mid-span Deflection for C70 HR C specimens
0
5
10
15
20
25
30
35
40
45
50
0 5 10 15 20 25 30 35 40
Lo
ad
(K
N)
Deflection (mm)
C 70 MR 2L 1
C 70 MR 2L 2
0
5
10
15
20
25
30
35
40
45
0 10 20 30 40 50
Lo
ad
(K
N)
Deflection (mm)
C 70 HR C 1
C 70 HR C 2

158
Figure 146: Load versus Mid-span Deflection for C70 HR 1L specimens
Figure 147: Load versus Mid-span Deflection for C70 HR 2L specimens
0
10
20
30
40
50
60
0 10 20 30 40
Lo
ad
(K
N)
Deflection (mm)
C 70 HR 1L 1
C 70 HR 1L 2
0
10
20
30
40
50
60
70
0 5 10 15 20 25 30 35
Lo
ad
(K
N)
Deflection (mm)
C 70 HR 2L 1
C 70 HR 1L 2

159
Figure 148: Load versus Mid-span Deflection for C100 LR C specimens
Figure 149: Load versus Mid-span Deflection for C100 LR 1L specimens
0
2
4
6
8
10
12
14
0 10 20 30 40 50 60
Lo
ad
(K
N)
Deflection (mm)
C 100 LR C 1
C 100 LR C 2
0
5
10
15
20
25
30
35
0 10 20 30 40
Lo
ad
(K
N)
Deflection (mm)
C 100 LR 1L 1
C 100 LR 1L 2

160
Figure 150: Load versus Mid-span Deflection for C100 LR 2L specimens
Figure 151: Load versus Mid-span Deflection for C100 MR C specimens
0
5
10
15
20
25
30
35
40
45
0 5 10 15 20
Lo
ad
(K
N)
Deflection (mm)
C 100 LR 2L 1
C 100 LR 2L 2
0
5
10
15
20
25
30
35
40
45
50
0 10 20 30 40
Lo
ad
(K
N)
Deflection (mm)
C 100 MR C 1
C 100 MR C 2

161
Figure 152: Load versus Mid-span Deflection for C100 MR 1L specimens
Figure 153: Load versus Mid-span Deflection for C100 MR 2L specimens
0
5
10
15
20
25
30
35
40
45
50
0 10 20 30 40 50
Lo
ad
(K
N)
Deflection (mm)
C 100 MR 1L 1
C 100 MR 1L 2
0
10
20
30
40
50
60
0 5 10 15 20 25 30
Lo
ad
(K
N)
Deflection (mm)
C 100 MR 2L 1
C 100 MR 2L 2

162
Figure 154: Load versus Mid-span Deflection for C100 HR C specimens
Figure 155: Load versus Mid-span Deflection for C100 HR 1L specimens
0
5
10
15
20
25
30
35
40
45
0 10 20 30 40 50
Lo
ad
(K
N)
Deflection (mm)
C 100 HR C 1
C 100 HR C 2
0
10
20
30
40
50
60
0 5 10 15 20 25 30 35 40
Lo
ad
(K
N)
Deflection (mm)
C 100 HR 1L 1
C 100 HR 1L 2

163
Figure 156: Load versus Mid-span Deflection for C100 HR 2L specimens
0
10
20
30
40
50
60
70
0 5 10 15 20 25 30 35
Lo
ad
(K
N)
Deflection (mm)
C 100 HR 2L 1
C 100 HR 2L 2

164
Table 20: Repeatability comparison
Group Specimen Py (kN) δy(mm) Pf (kN) δf (mm) δu (mm) Pu (kN) Failure Mode
C 40 LR
C 40 LR C 1 11.63 21.01 9.304 31.07 21.01 11.63 SY_MA
C 40 LR C 2 12.67 22.3 9.5 32.1 26.9 12.67 SY_MA
C 40 LR 1L 1 21 18.9 17.352 23.3 19.36 21.04 SY_FD
C 40 LR 1L 2 20.5 19.2 17.22 24.11 19.86 21.69 SY_FD
C 40 LR 2L 1 25.1 15.02 30.8 25.88 24.5 38.5 SY_MA_FD
C 40 LR 2L 2 25.22 16.1 29.42 22.31 23.26 36.36 SY_MA_FD
C 40 MR
C 40 MR C 1 15.2 18.2 18.08 29.2 28.4 22.6 SY_CC
C 40 MR C 2 14.45 20.2 19.01 32.14 30.05 23.7 SY_CC
C 40 MR 1L 1 21.3 30.03 37.44 41.7 32.7 43.52 SY_CC_FD
C 40 MR 1L 2 20.98 29.3 39.8 42.1 35.13 46.8 SY_CC_FD
C 40 MR 2L 1 40.6 21.78 40.424 26 28.02 48.6 SY_CC_FD
C 40 MR 2L 2 39.6 22.45 39.88 27.1 24.48 50.53 SY_CC_FD
C 40 HR
C 40 HR C 1 19.1 7.5 35.904 22.3 22.5 46.88 SY_CC
C 40 HR C 2 20.12 7.04 34.91 23.01 21.5 44.88 SY_CC
C 40 HR 1L 1 36.07 20.74 41.8 45 29.34 51.8 SY_FD
C 40 HR 1L 2 35.34 20.55 42.5 44.13 30.22 52.25 SY_FD
C 40 HR 2L 1 39.1 19.62 43.08 21.7 20.38 53.85 SY_FD
C 40 HR 2L 2 40.15 20.9 41.66 23.3 20.6 53.6 SY_FD
C 70 LR
C 70 LR C 1 8.1 10.2 7.04 13.1 13.46 10.17 SY_MA
C 70 LR C 2 9.3 11.34 7.56 14.6 12.7 8.8 SY_MA
C 70 LR 1L 1 15.84 13.01 21.28 37.48 27.78 26.6 SY_FD
C 70 LR 1L 2 16.32 14 22.1 36.34 24.93 25.9 SY_FD

165
C 70 LR 2L 1 40.16 22.28 33.68 28.06 24.52 44.18 SY_FD
C 70 LR 2L 2 40.44 24.11 34.63 29.15 27.22 46.44 SY_FD
C 70 MR
C 70 MR C 1 15.54 10.29 20.8 80 35.2 28.9 SY_MA_CC
C 70 MR C 2 16.24 10.87 25.1 82.2 71.75 26 SY_MA_CC
C 70 MR 1L 1 32.44 26.22 36.16 37.35 33.57 45.2 SY_FD
C 70 MR 1L 2 33.4 25.98 36.65 35.94 30.95 49.52 SY_FD
C 70 MR 2L 1 34.63 17.69 37.952 33.33 25.76 47.44 SY_FD
C 70 MR 2L 2 33.96 16.99 36.13 33.94 25.51 44.4 SY_FD
C 70 HR
C 70 HR C 1 18.1 13.9 26.432 40.45 38.75 38.05 SY_CC
C 70 HR C 2 19.44 14.65 27.01 41.53 35.77 33.04 SY_CC
C 70 HR 1L 1 38.57 22.28 44.864 36.01 34.91 56.08 SY_CC_FD
C 70 HR 1L 2 39.23 23.86 45.12 32.11 30.93 50.08 SY_CC_FD
C 70 HR 2L 1 51.31 26.11 47.44 31.67 30.95 59.3 SY_CC_FD
C 70 HR 2L 2 50.24 25.54 48.45 30.3 29.23 57.26 SY_CC_FD
C 100 LR
C 100 LR C 1 11.26 23.7 8.584 41.34 40.86 10.73 SY_MA
C 100 LR C 2 12.54 24.1 9.05 42.43 33.64 11.47 SY_MA
C 100 LR 1L 1 26.7 21.7 24.448 34.8 27.68 28.65 SY_FD
C 100 LR 1L 2 25.6 23.1 24.45 34.5 29.8 30.56 SY_FD
C 100 LR 2L 1 34.11 10.21 32.16 12.25 11.95 40.2 SY_FD
C 100 LR 2L 2 34.53 10.6 32.95 11.94 15.4 36.5 SY_FD
C 100 MR
C 100 MR C 1 32.84 18.4 31 35.68 34.12 42.41 SY_CC
C 100 MR C 2 33.1 19.3 30.94 36.1 32.45 38.75 SY_CC
C 100 MR 1L 1 34.9 20.15 34.8 38.88 27.15 43.5 SY_FD
C 100 MR 1L 2 33.66 21.3 35.4 40.1 30.07 42.5 SY_FD
C 100 MR 2L 1 36.29 17.27 39.664 24.86 24.3 49.58 SY_FD
C 100 MR 2L 2 35.22 18.3 41.3 25.5 24.1 48.2 SY_FD

166
C 100 HR
C 100 HR C 1 22.56 18.65 28 42 39.9 37.74 SY_CC
C 100 HR C 2 23.14 19.23 29.26 41.54 36.9 35 SY_CC
C 100 HR 1L 1 39.82 24.2 44.112 37.15 35.3 55.14 SY_CC_FD
C 100 HR 1L 2 38.95 23.93 44.13 36.64 33.65 48.8 SY_CC_FD
C 100 HR 2L 1 56.9 27.09 52.16 30.63 27.1 59.9 SY_CC_FD
C 100 HR 2L 2 56.1 27.5 52.53 30.01 29.75 65.2 SY_CC_FD

167
Vita
Hasan Saleh Mahmoud was born on February 26th
, 1992, in Kuwait City,
Kuwait. He is originally from Palestine, but his parents moved to Kuwait in the
1970s. Hasan graduated from NWPS with honors in 2009. He continued his higher
education in the American University of Sharjah, which he joined as a student to
pursue a Bachelor of Science degree in Civil Engineering in 2010. He was awarded
the Bachelor degree in 2014. He then decided to continue his graduate studies in the
Master's program in the American University of Sharjah. During his master program,
he won the Huston Technology Center Award in Mai Bangkok Business Challenge
2016, making AUS the first Arab university to win such a prestigious award. Hasan
worked as a research assistant on many project, where he showed excellent problem
solving and leadership skills.


![[EMPA] Flexural Strengthening of Reinforced Concrete](https://img.dokumen.tips/doc/110x75/577cdab51a28ab9e78a65444/empa-flexural-strengthening-of-reinforced-concrete.jpg)


