Embed Size (px)
Citation preview

Strength Quality StabilityR e a l e s t a t e I n v e s t m e n t t R u s t 2011 Annual Report

Financial Highlights (1)
(millions of dollars unless otherwise noted) 2011 2010 2009
Balance Sheet
Cash and cash equivalents 80.0 267.8 134.0 Long-term debt, including current portion 1,134.4 1,241.2 1,234.0 Total assets 1,830.7 1,994.6 1,668.1
Unitholder Information(2)
Funds from operations (FFO) 63.4 108.1 146.8 FFO ($ per basic unit) 0.76 1.33 2.01 Adjusted funds from operations (AFFO) 69.8 110.7 146.1 AFFO ($ per basic unit) 0.84 1.36 2.00 Distributions declared 70.1 68.8 61.3 Distributions declared ($ per basic unit) 0.84 0.84 0.84 Weighed average units – Basic (thousands) 83,408 81,533 73,000 – Fully diluted (thousands) 97,205 95,346 86,817
(1) This information has been prepared in accordance with IFRS, except for the selected information presented for 2009, which was prepared under previous Canadian GAAP.
(2) Refer to non-GAAP measures on page 71.
Net Operating Income(2)
(in millions of dollars)
351326
280
09 10 11
2.16 2.10 2.09
09 10 11
Revenue(in billions of dollars)
146
111
70
09 10 11
AFFO(2)
(in millions of dollars)
266242
200
09 10 11
EBITDA(2)
(in millions of dollars)
Corporate Profile
Extendicare Real Estate Investment Trust (“Extendicare REIT”) is a leading North American provider of post-acute and long-term senior care services. The direct ownership and operation of the senior care centers and ancillary businesses is conducted by wholly owned subsidiaries of Extendicare REIT (collectively “Extendicare”). Through its network of owned and operated health care centers, Extendicare REIT’s qualified and experienced workforce of 38,100 individuals is dedicated to helping people live better through a commitment to quality service that includes skilled nursing care, rehabilitative therapies and home health care services. Extendicare REIT’s 261 senior care centers in Canada and the United States have capacity to care for approximately 28,100 residents.
Extendicare REIT is a specified investment flow-through trust (SIFT) that has been subject to SIFT tax since January 1, 2007. Monthly cash distributions paid to its unitholders are at the discretion of its board of trustees. Extendicare REIT’s units trade on the TSX under the symbol EXE.UN.
More information is available at www.extendicare.com.
Forward-looking Statements – Information provided by Extendicare REIT from time to time, including this Annual Report, contains or may contain forward-looking statements concerning anticipated future events, results, circumstances, economic performance or expectations with respect to Extendicare REIT and its subsidiaries, including its business operations, business strategy and financial condition. Please refer to page 11 for a caution to the reader on the reliance of such statements.

Investment Highlights
Extendicare REIT generates strong cash flow and has a proven track record of growth through organic operations, new developments and acquisitions resulting from:
n Strong demographic trends toward an aging population in North America, leading to increased demand for rehabilitative and long-term resident health care services.
n Successful operation of health care business and ownership of real estate assets, which provide financial and operating flexibility and control.
n Long-term growth strategy enabled by property development experience, disciplined reinvestment programs, accretive acquisitions and expansion into ancillary lines of business.
Contents
2 CEO’s Message
5 Operations Overview
6 Strength. Quality. Stability
10 Mission, Vision, Values
11 Financial Review
148 Corporate Governance
149 Officers and Executives
150 Five-year Summary
IBC Unitholder Information

2 Extendicare Real Estate Investment Trust
Fellow Unitholders, Extendicare REIT delivered solid financial and operational results in 2011 in spite of persistent weakness in the economy, a challenging U.S. regulatory and funding environment and the need to strengthen our reserves for self-insured liabilities. We were successful at implementing a wide range of operational and organizational changes well ahead of schedule that were aimed at improving efficiencies and lowering our overhead costs. Also, we created greater financial stability through prudent risk management and a focus on building a strong balance sheet for the long term. Through it all, we maintained our focus on our core business principles with an emphasis on the delivery of quality care and service to our residents in each of our centers across North America. In doing so, we continue to position Extendicare for ongoing success in a challenging health care environment.
Highlights of the YearDebt Refinancing
Among our successes, the highlight of the year was clearly our achievement in refinancing a significant portion of our U.S. long-term debt, which is now in the final stages of completion. This was a huge undertaking, the significance of which cannot be overstated in terms of its contribution to strengthening our balance sheet with low-cost, long-term financing. Once finalized, our U.S. operations will have refinanced approximately US$636 million of its debt with US$520 million in 71 loan mortgages insured by the U.S. Department of Housing and Urban Development and cash on hand of US$116 million. Collectively, the weighted average all-in interest rate of the closed and committed loans is 4.35%, with an average term to maturity of about 33 years. We expect to realize savings of US$20 million in interest costs annually and have approximately 50 unencumbered centers valued at an estimated US$250 million.
In December 2011, the REIT’s Canadian operations refinanced $72.4 million in mortgages on 20 centers insured by the Canadian Mortgage and Housing Corporation (CMHC) that were at fixed rates
of 9.81% and due to mature in March 2013. The new debt consists of a total of $59.0 million in mortgages on 18 centers at a blended fixed rate of approximately 2.69% maturing in 2017-2022, and a variable-rate bridge loan of $13.3 million secured by two centers due in June 2013. The estimated annualized interest savings from this refinancing is $5 million.
U.S. Operations
In August, Extendicare’s Sheboygan Progressive Care Center, located in Sheboygan, Wisconsin won the American Health Care Association’s Silver Quality Award in recognition of its outstanding performance in the health care profession. Sheboygan Progressive was one of only 31 centers in the nation to receive this prestigious award. Twenty-four additional Extendicare centers received the Bronze Quality Award in 2011, bringing the total to 88 Extendicare centers to have been recognized with this award of excellence since the program’s inception.
In January 2012, we completed the sale of our U.S. group purchasing organization to Managed Health Care Associates, Inc. for cash proceeds of US$56.0 million. While this business has been a good operation for Extendicare for a long time, we believed the time was right to participate in an industry consolidation that is under way in the group purchasing sector and monetize this investment.
Canadian Operations
Extendicare’s Canadian operations EBITDA margin was 9.4%, down from 10.1% in 2010, primarily due to the effect of prior period adjustments recorded in both years. Excluding the impact of the prior period adjustments, the EBITDA margin improved to 9.7% this year from 9.5% in 2010. The average daily revenue rate increased by 3.5% over 2010 and our occupancy rates remained unchanged at a solid 98%. During 2011, we benefited from increased accommodation funding in Ontario that is estimated to improve our annual revenue by $2.6 million.
On the development side, Extendicare opened a new center in Edmonton, Alberta in November 2011. The new 180-bed, state-of-the-art nursing center replaces an existing 113-bed
CEO’s Message

“ We maintained our focus on our core business principles with an emphasis on the delivery of quality care and service to our residents.“Timothy L. Lukenda President & Chief Executive Officer
center that Extendicare owned and operated in the area. We have also secured CMHC financing for 89% of the cost of the center at a 10-year fixed rate of 3.81%.
In Ontario, Extendicare was awarded projects in Timmins and Sault Ste. Marie under Phase 1 of the province’s redevelopment program. We broke ground last spring and the projects are proceeding well with expected completion for both to be in the first half of 2013.
ChallengesMedicare Funding Reductions
In the third quarter, as part of the ongoing U.S. health care reform, the Centers for Medicare & Medicaid Services (CMS) announced reductions to Medicare funding that effectively reversed the 2010 advances in the reimbursement system through the implementation of MDS 3.0 and RUG-IV last October. The resulting CMS Final Rule included an 11.1% reduction in Medicare funding, the elimination of group therapy and changes in assessment practices that had been introduced in 2010. In response, we conducted a comprehensive operational review to identify greater system efficiencies and cost savings to mitigate the effects of the prospective reduction on EBITDA. These savings, which are now largely in place, are anticipated to reduce our general, administrative and non-wage operating costs by an estimated US$24 million on an annualized basis to contain our net reduction of EBITDA to between US$40 million and US$50 million. Throughout this process, our employees worked effectively as a team to minimize the effects of the funding reductions while ensuring that levels of quality care and service to our residents were protected.
Financial Results
For the year, Extendicare’s revenue was $2,094.1 million, a 2.6% increase over 2010, excluding the adverse effect of foreign exchange. EBITDA was $200.1 million in 2011, a $36.5 million decline over 2010, excluding the adverse effect of foreign exchange. Excluding an increase in prior years’ reserves for self-insured liabilities,
We were successful at implementing a wide range of operational and organizational changes well ahead of schedule that were aimed at improving efficiencies and lowering our overhead costs.
2011 Annual Report 3

4 Extendicare Real Estate Investment Trust
subject to the approval of two-thirds of unitholders at the annual and special meeting to be held on May 8, 2012. The Board is confident that the reorganization is in the best interest of unitholders as it will facilitate a more attractive environment for Extendicare’s securities, while broadening the potential investor base and positioning Extendicare for greater profitability and future growth.
At Extendicare, we believe quality is the key to our business. As we go forward, we will continue to work to enhance the programs and services we provide to our customers and to make strategic investments in our properties. We will also explore opportunities to expand in related health care businesses. Efforts such as these, combined with our strategic marketing initiatives, will help us successfully grow value for our unitholders in today’s challenging economic environment.
Extendicare has a winning combination of strength, quality and stability. We have the financial strength and flexibility to adjust to changing financial conditions, to deliver consistently high quality levels of service to all of our customers, and the stability to drive our future growth and profitability for our stakeholders. We have a proven track record and history of success, a sound business model and an experienced management team with the determination and skills to succeed.
I would like to thank our Extendicare employees for their dedication and hard work, our customers for their loyalty, our Board for their support and our unitholders for their continued support. We remain confident in our future and believe that Extendicare will continue to be a leading provider of post-acute and long-term senior care services in North America.
(signed)
Timothy L. Lukenda President & Chief Executive Officer
EBITDA declined by $5.8 million due to the 2011 CMS Final Rule, with a margin of 11.6% this year compared to 12.2% in 2010.
In spite of these challenges, our distributions in 2011 totalled $70.1 million, or $0.84 per unit, representing 100% of AFFO for the same period.
Liability Reserves
As is the case each year, we conducted a year-end actuarial review of our self-insured general and professional liabilities, the results of which indicated the necessity to further strengthen our prior years’ reserves by US$11.2 million in the 2011 fourth quarter. This was in addition to a previously reported strengthening of US$32.1 million after the third quarter review. The total adverse impact of these non-taxable reserves to our 2011 EBITDA, net earnings and AFFO was $42.8 million, or $0.51 per basic unit.
As a result of our initiative to aggressively resolve and close our portfolio of pre-existing claims, we experienced an escalation in settlement activity in the last half of 2011, resulting in a modification of our actuarial projections. Based on current claims activity levels, we believe that our future exposure has been adequately addressed. Barring any significant adverse new developments, we do not anticipate the need to make further material adjustments to our reserves. Extendicare continues to pursue strategies to mitigate liability claims with a view to reducing our exposure in the future. These efforts include dedicating additional resources to risk management, as well as expanding our best practices in the analysis and defense of pre-existing and new claims to reduce their frequency and cost. In addition, we have commenced a review of our portfolio with a strategy to divest of properties in geographic areas with a significantly higher than average loss experience or where other factors exist that have contributed to the need for unusual reserve adjustments.
Looking Ahead
In November 2011, the board of trustees of the REIT (the “Board”) unanimously approved the conversion of the REIT from an income trust structure to a corporation by way of a plan of arrangement,
As we go forward, we will continue to work to enhance the programs and services we provide to our customers and we will continue to make strategic investments in our properties.
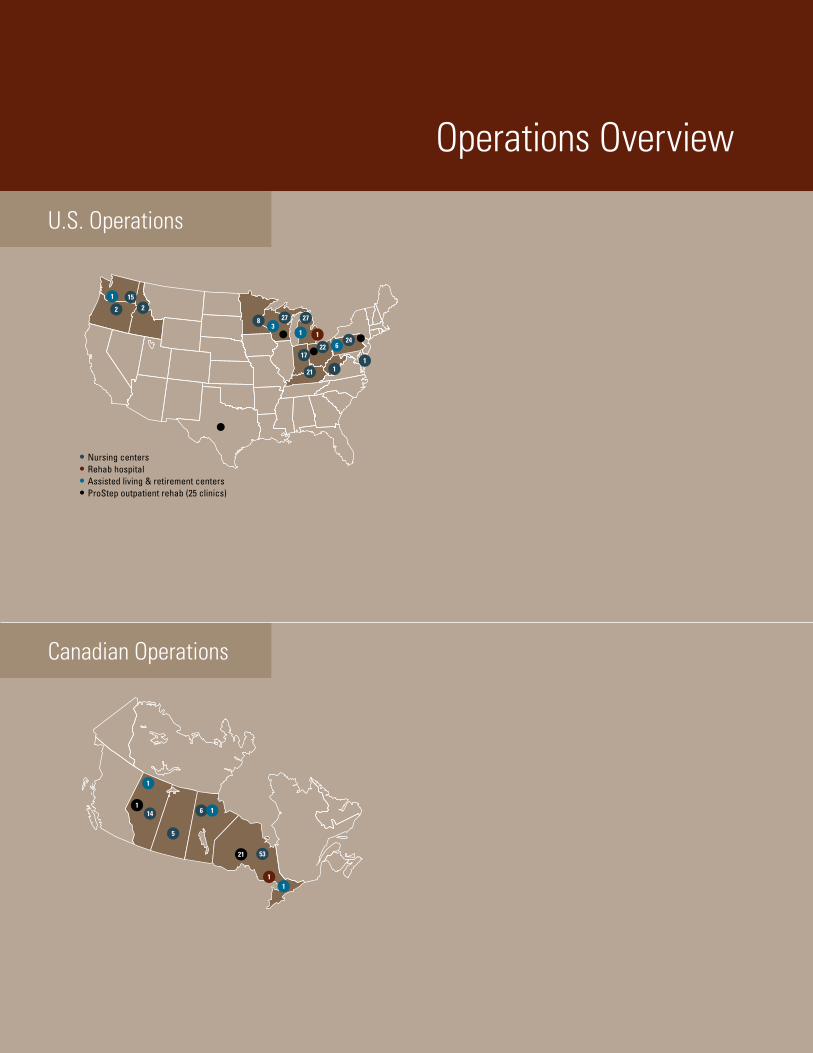
Operations Overview
U.S. Operations
Canadian Operations
1 15
2
8 27 27
21
1 13
2
2217
624
11
• Nursing centers • Rehab hospital • Assisted living & retirement centers • ProStep outpatient rehab (25 clinics)
114
5
6
21 53
11
1
1

6 Extendicare Real Estate Investment Trust
Strength. Quality. Stability.
Extendicare prides itself on developing extensive programs and services designed to help people live better, and we have demonstrated our strength, quality and stability for close to 45 years.
Gardens, walking paths and outdoor seating areas encourage residents and guests to linger outside and socialize.

8 Extendicare Real Estate Investment Trust
We believe in continuous improvement and are constantly assessing our care processes to improve delivery of care, enhance communication across the continuum, and provide a seamless transition from an acute care setting to a post-acute center. Going forward, we will work to further develop best practices for clinical quality and operational efficiency, while aligning with key health care providers to better coordinate care delivery.
Extendicare’s achievements in the delivery of quality care and service continue to be recognized on a national basis. In Canada, all of our long-term care homes as well as our home health care centers are accredited by third-party associations. In the U.S., our Sheboygan Progressive Care Center in Wisconsin was one of only 31 centers in the U.S. to receive the American Health Care Association and National Center for Assisted Living 2011 Achievement in Quality Silver Award. Also in 2011, 24 of our U.S. centers achieved the
2011 Commitment to Quality Bronze Award, bringing the total number of Extendicare centers to have received the award to 88, which is almost half of our U.S. centers. These awards are a testament to both our commitment to quality and delivery of quality care for residents in our communities and our determination to be the service provider of choice in our profession.
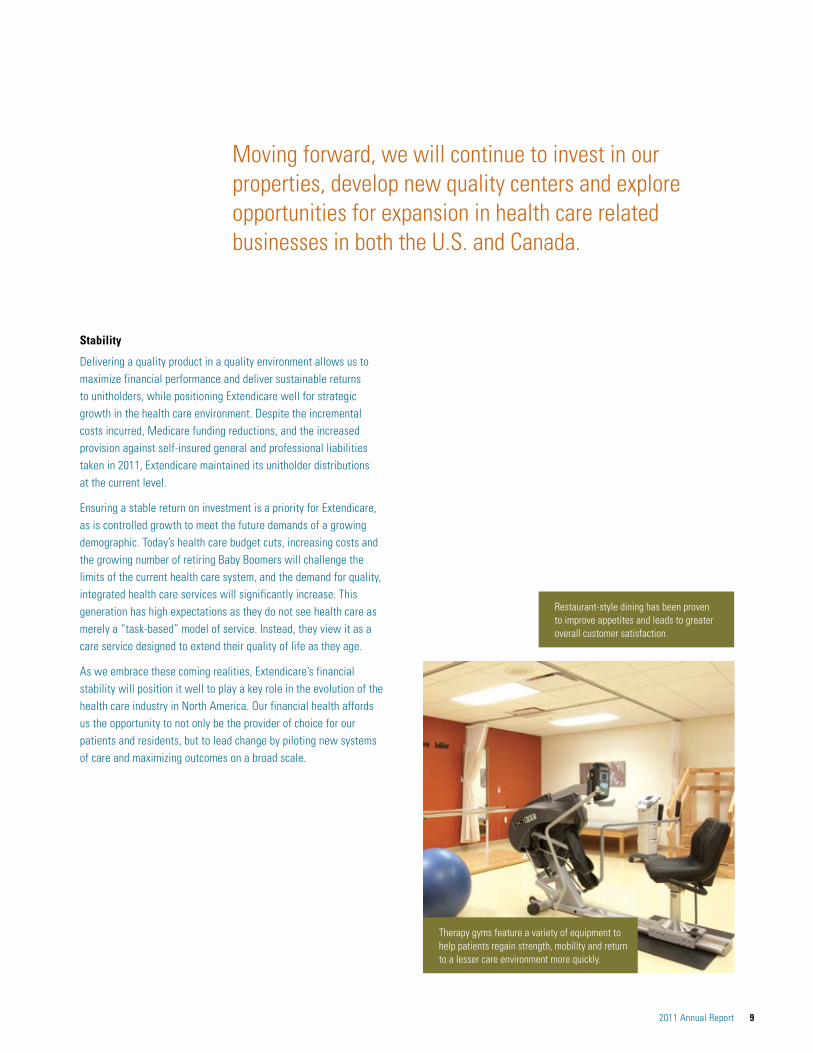
Moving forward, we will continue to invest in our properties, develop new quality centers and explore opportunities for expansion in health care related businesses in both the U.S. and Canada.
Extendicare employees are committed to delivering quality care in the most cost-effective manner. The overriding objective throughout this past year has been tightly focused on continuous quality improvement and solidifying operations so that our residents receive the care and services they expect from individuals they have come to know and trust.
Personalized rehabilitation plans help identify patient goals and objectives to be accomplished in order to achieve the best results.

2011 Annual Report 9
Stability
Delivering a quality product in a quality environment allows us to maximize financial performance and deliver sustainable returns to unitholders, while positioning Extendicare well for strategic growth in the health care environment. Despite the incremental costs incurred, Medicare funding reductions, and the increased provision against self-insured general and professional liabilities taken in 2011, Extendicare maintained its unitholder distributions at the current level.
Ensuring a stable return on investment is a priority for Extendicare, as is controlled growth to meet the future demands of a growing demographic. Today’s health care budget cuts, increasing costs and the growing number of retiring Baby Boomers will challenge the limits of the current health care system, and the demand for quality, integrated health care services will significantly increase. This generation has high expectations as they do not see health care as merely a “task-based” model of service. Instead, they view it as a care service designed to extend their quality of life as they age.
As we embrace these coming realities, Extendicare’s financial stability will position it well to play a key role in the evolution of the health care industry in North America. Our financial health affords us the opportunity to not only be the provider of choice for our patients and residents, but to lead change by piloting new systems of care and maximizing outcomes on a broad scale.
Therapy gyms feature a variety of equipment to help patients regain strength, mobility and return to a lesser care environment more quickly.
Moving forward, we will continue to invest in our properties, develop new quality centers and explore opportunities for expansion in health care related businesses in both the U.S. and Canada.
Restaurant-style dining has been proven to improve appetites and leads to greater overall customer satisfaction.
10 Extendicare Real Estate Investment Trust
Mission, Vision, Values
Properties – with a track record of over 40 years as an owner and operator of industry-leading North American senior care centers, we are at the forefront in design and excellence in quality care.
Technology – we incorporate technologies into the delivery of health care services to improve care and efficiency.
Our ValuesAt Extendicare, we value our customers and our team who cares for them. We are committed to treating them with dignity and respect in an atmosphere of compassion. As health care professionals, we take pride in being responsive to the needs of those who rely on us.
Our MissionWe help people live better by providing quality, cost-effective health care and rehabilitation primarily to seniors in a resident- directed environment.
We accomplish this by providing remarkable services through highly engaged and motivated members of our team, resulting in an appropriate return to our investors.
Our VisionHelping people live better, one life at a time, through our people, properties and technology.
People – our experienced and dedicated workforce help improve the quality of people’s lives through a commitment to the highest standards of service to residents and their families who entrust us with their health care needs.
Respect n Integrity n Pride n Compassion n Responsiveness n Dignity

2011 Annual Report 11
Forward-looking Statements
Information provided by Extendicare REIT from time to time, including this Annual Report, contains or may contain forward-looking statements concerning anticipated future events, results, circumstances, economic performance or expectations with respect to the REIT and its subsidiaries, including its business operations, business strategy, and financial condition. Forward-looking statements can be identified because they generally contain the words “anticipate”, “believe”, “estimate”, “expect”, “intend”, “objective”, “plan”, “project” or other similar expressions or the negative thereof.
Forward-looking statements reflect management’s current expectations, beliefs and assumptions and are based on information currently available, and the REIT assumes no obligation to update or revise any forward-looking statement, except as required by applicable securities laws. These statements are not representations or guarantees of future performance and are based on estimates and assumptions that involve known and unknown risks, uncertainties and other factors that may cause actual results, performance or achievements of the REIT to differ materially from those expressed or implied in the statements. In addition to the assumptions and other factors referred to specifically in connection with these statements, such factors are identified in the REIT’s public filings with the Canadian securities regulators and include, but are not limited to, the following: changes in the overall health of the economy and government; the ability to attract and retain qualified personnel; changes in the health care industry in general and the long-term care industry in particular because of political and economic influences; changes in applicable accounting policies; changes in regulations governing the industry and the compliance of the REIT and its subsidiaries with such regulations; changes in government funding levels for health care services; changes in tax laws; resident care and class action litigation, including exposure for punitive damage claims and increased insurance costs, and other claims asserted against the REIT and its subsidiaries; the ability to maintain and increase census levels; changes in competition; changes in demographics and local environment economies; changes in foreign exchange and interest rates; changes in the financial markets that may affect refinancing of debt; the availability and terms of capital to fund capital expenditures; and the impact of the proposed conversion from an income trust structure to a corporate structure, subject to unitholder approval.
The forward-looking statements contained in this Annual Report are expressly qualified by this cautionary statement. Given these risks and uncertainties, readers are cautioned not to place undue reliance on the forward-looking statements of the REIT.
Financial Review
Table of ContentsManagement’s Discussion and Analysis 12 Basis of Presentation 12Overview 13Key Performance Indicators 20Impact of U.S. Dollar and Foreign Currency Translation 26Adjusted Funds from Operations 27Distributions 28Summary of Quarterly Results 292011 Financial Review 35Other Significant Developments 41Update of Regulatory and Reimbursement Changes Affecting Revenue 48
Liquidity and Capital Resources 57Related Party Transactions 64Off-balance Sheet Arrangements 64Risks and Uncertainties 65Accounting Policies and Estimates 71Additional Information 77
Financial Statements and Notes 78Management’s Responsibility for Financial Statements 78Independent Auditors’ Report 79Consolidated Financial Statements 80Notes to Consolidated Financial Statements 85

12 Extendicare Real Estate Investment Trust
Basis of Presentation Extendicare Real Estate Investment Trust (“Extendicare REIT” or the “REIT”) has prepared this Management’s Discussion and Analysis (MD&A) to provide information to assist its current and prospective investors’ understanding of the financial results for the year ended December 31, 2011. This MD&A should be read in conjunction with Extendicare REIT’s audited consolidated financial statements for the years ended 2011 and 2010, and the notes thereto, found in Extendicare REIT’s 2011 Annual Report. This material is available on Extendicare REIT’s website at www.Extendicare.com. Additional information about Extendicare REIT, including its Annual Information Form, can be found on SEDAR at www.sedar.com.
Extendicare REIT is a leading North American provider of post-acute and long-term senior care services. The REIT itself is not a provider of services or products. The direct ownership and operation of the senior care centers and ancillary businesses is conducted by the subsidiaries of the REIT. This MD&A provides information on Extendicare REIT and its subsidiaries. References to “Extendicare REIT”, the “REIT”, “we”, “us” and “our” in this report mean Extendicare Real Estate Investment Trust alone or together with its subsidiaries, as the context requires. The registered office of Extendicare REIT is located at 3000 Steeles Avenue East, Markham, Ontario, Canada, L3R 9W2.
Extendicare REIT is the successor in interest to Extendicare Inc. (Extendicare) resulting from the conversion of Extendicare to an unincorporated, open-ended limited purpose trust on November 10, 2006, pursuant to a plan of arrangement (the “Arrangement”). Extendicare REIT was established under the laws of the Province of Ontario pursuant to a deed of trust, dated September 11, 2006, as amended and restated on October 28, 2006, and on December 15, 2010 (the “Deed of Trust”). The conversion has been accounted for as a continuity of interest, and accordingly, the consolidated financial statements of the REIT are reflective as if the REIT had always carried on the business formerly carried on by Extendicare.
This MD&A and the accompanying audited consolidated financial statements for the years ended 2011 and 2010, and the notes thereto, have been prepared in accordance with International Financial Reporting Standards (IFRS), with effect from January 1, 2010. Periods prior to January 1, 2010, have not been restated. Note 27 of the 2011 consolidated financial statements contains a detailed description of the REIT’s conversion to IFRS, including a line-by-line reconciliation of its consolidated financial statements prepared under previous Canadian generally accepted accounting principles (GAAP) to those under IFRS for the 2010 year. All dollar amounts are in Canadian dollars unless otherwise indicated. Except as otherwise specified, references to years indicate the fiscal year ended December 31, 2011, or December 31 of the year referenced.
The discussion and analysis in this MD&A is based upon information available to management as of February 29, 2012. This MD&A should not be considered all-inclusive, as it excludes changes that may occur in general economic, political and environmental conditions. Additionally, other elements may or may not occur, which could affect the REIT in the future.
We use a number of key performance indicators in this document for monitoring and analyzing our financial results. These performance indicators are not defined by IFRS, and are therefore considered to be non-GAAP measures, which may not be comparable to similar measures presented by other companies. Please refer to the “Key Performance Indicators” section of this MD&A. In addition, a discussion of the non-GAAP measures is provided under the heading “Accounting Policies and Estimates – Non-GAAP Measures”.
Management’s Discussion and AnalysisFebruary 29, 2012

2011 Annual Report 13
Overview Business Strategy
At Extendicare REIT, our strategy is to create value for our unitholders through the effective operation and growth of our core senior care operations, and complementary long-term care services. By emphasizing the quality of care provided to our residents, our goal is to build upon our reputation as a leading provider of a full range of post-acute services in the community. In pursuing this strategy, an overriding objective is to continually enhance the quality of clinically based services provided to our residents and other clients. The key components of our value-creation strategy include:
• ensuring the continued delivery of quality care and customer service throughout our organization;
• focusing on accommodating short-term, high-acuity and rehabilitation residents that result in increasing the percentage of revenue from Medicare and Managed Care (Skilled Mix) funding sources and higher average daily revenue rates;
• actively maintaining and improving our asset portfolio through a disciplined capital reinvestment program or, where appropriate, through disposition of underperforming or non-strategic centers;
• focusing on achieving operational efficiencies and internal growth in our core business and, when available, growth through new developments and value-creating acquisitions;
• expanding non-government based revenue sources and diversifying within the long-term care industry through our rehabilitative services, information technology, management and consulting businesses;
• enhancing our Canadian businesses, including long-term care and home health care operations; and
• increasing funds from operations and adjusted funds from operations.
For the past several years, the REIT has committed resources to its “back-to-basics” strategy and the prudent stewardship of the management, growth and operations of the business of the REIT carried on through its subsidiaries. This commitment has been successful, particularly in the circumstances involving a weak U.S. economy and a challenging and uncertain regulatory environment.
Effective October 1, 2011, the Centers for Medicare & Medicaid Services (CMS) implemented reductions in Medicare funding to skilled nursing centers along with other changes (the “2011 CMS Final Rule”) that, based upon our revised estimates, will reduce EHSI’s revenue and EBITDA by between US$64 million and US$74 million on an annualized basis. In light of the 2011 CMS Final Rule, and the uncertainty surrounding further potential Medicare and Medicaid funding reductions, management implemented aggressive cost saving measures to reduce operating and administrative costs by an estimated US$24 million, approximately two-thirds of which were in effect as of October 1, 2011, with the remainder fully in effect as of January 1, 2012. However, none of these cost reduction measures involved a reduction of direct care staffing at our centers. Therefore, the net impact of the 2011 CMS Final Rule on our EBITDA is estimated to be between US$40 million and US$50 million. For more information on recent Medicare and Medicaid funding changes and our mitigation strategies, refer to the discussion under the heading “Update of Regulatory and Reimbursement Changes Affecting Revenue – United States”.
During 2011, the REIT strengthened its balance sheet by refinancing a significant portion of its long-term debt with government insured mortgages at lower rates and longer terms to maturity. By the end of 2011, we had closed on US$370.2 million of mortgages insured by the U.S. Department of Housing and Urban Development Program (HUD) to refinance debt in our U.S. operations. In February 2012, we paid off the remaining balance of US$109.9 million on our commercial mortgage backed securitization (CMBS) financing that was due in May 2012, and had closed on a further US$83.2 million of HUD loans. We anticipate closing on the majority of the balance of the approximate US$520 million of new HUD loans by the end of June 2012. As well in Canada, in December 2011, we refinanced $72.4 million of mortgages that were due in March 2013 and insured by the Canadian Mortgage and Housing Corporation (CMHC) with new CMHC mortgages with maturity dates of 2017 and 2022. Collectively, we estimate the savings in annual debt service costs to the REIT will be approximately $25 million. For more information on the debt refinancing plan, refer to the discussion under the heading “Overview – Significant 2011 Events and Developments – 2011 Refinancing Plan”.

14 Extendicare Real Estate Investment Trust
Management’s Discussion and Analysis
The board of trustees of the REIT (the “Board” or the “REIT Board”) and management continuously review possible strategies, opportunities and alternatives available to the REIT with a view to enhancing the value of the REIT. Provisions of the Income Tax Act (Canada) (the “Tax Act”) facilitate the conversion of an income trust structure to a corporate structure by 2013 (the “Conversion Rules”). In view of the Conversion Rules, among other things, the Board unanimously approved on November 8, 2011, the conversion of Extendicare REIT (the “Conversion”) from an income trust structure to a corporate structure under a new corporation (New Extendicare). The Conversion, which is anticipated to be completed on July 1, 2012, requires two-thirds approval of the unitholders of the REIT (the “Unitholders”) voting in person or by proxy at a special meeting of Unitholders (the “Special Meeting”) to be held in conjunction with the annual meeting on May 8, 2012. The Board believes that the Conversion is in the best interests of the REIT and the Unitholders and recommends that the Unitholders vote in favour of it. For more information on the proposed conversion, refer to the discussion under the heading “Overview – Significant 2011 Events and Developments – Proposed Corporate Conversion”.
Following the completion of the Conversion, it is anticipated that the board of directors of New Extendicare (the “New Extendicare Board”) will be comprised of the current members of the REIT Board and that senior management of New Extendicare will be comprised of the current senior management of the REIT and Extendicare Inc.
The declaration and payment of dividends by New Extendicare will be subject to the discretion of the New Extendicare Board, as to the amount of and if and when a dividend is declared and paid, after consideration of the same factors that are currently taken into account by the REIT Board, which factors include results of operations, requirements for capital, future financial prospects and debt covenants, as well as other factors that may be considered to be relevant by the New Extendicare Board. The REIT Board currently anticipates that the New Extendicare Board will declare its first monthly dividend in the month of July, 2012.
The distribution payout ratio of the REIT was approximately 100% for 2011. The 2011 payout ratio increased from prior years due to the strengthening of our reserves for self-insured liabilities in 2011, along with the negative effect of the 2011 CMS Final Rule that took effect October 1, 2011. In 2009, the REIT reduced its distributions in order to manage the uncertainty surrounding the economy, U.S. health care reform and our debt refinancing plans. Consequently, during 2009 and 2010, the payout was at conservative levels of approximately 42% and 62%, respectively. The Board regularly monitors the REIT’s cash flow position and projected distribution payout ratio to consider the appropriateness of the REIT’s distributions. In spite of the recent and potential for further U.S. funding reductions, the Board has made a determination to maintain distributions at the current level of $0.07 per month. The Board will continue to review the distribution policy on a regular basis, taking into consideration factors as they arise.
We believe that Extendicare REIT is a financially stable company with a conservative capital structure. The ownership of our real estate coupled with our geographic diversity position us favourably to address the numerous funding and regulatory challenges facing the industry. While the U.S. funding reductions will have real consequences in the way we operate our business, we are confident that our efforts, combined with our strategic marketing initiatives, will enable us to be successful in this environment.
Investment Overview
An investment in the units of Extendicare REIT entitles the holder to a monthly cash flow stream, through distributions at the discretion of the REIT Board, as well as the opportunity, or exposure, to changes in the price of the trust units of the REIT (the “REIT Units”), which trade on the Toronto Stock Exchange (TSX) under the symbol “EXE.UN”. The Board regularly reviews its distribution policy. The present policy of the Board is to pay monthly distributions of $0.07 per unit, or $0.84 per unit annually. Based on the closing price of the REIT Units on February 29, 2012, of $8.50, this represents a yield of 9.9%. More information about distributions, including tax considerations, is provided under the heading “Distributions”.
The REIT is a specified investment flow-through trust, or SIFT, and since 2007 has been subject to SIFT tax at tax rates that are comparable to the general corporate tax rate applicable to Canadian corporations. Therefore, the Conversion itself will not impact the funds available for distribution by New Extendicare to its shareholders.

Management’s Discussion and Analysis
2011 Annual Report 15
Our long-term growth and financial performance is influenced by a number of factors. First and foremost among these factors is the demand for senior care centers and other related long-term care services in the United States and Canada. In both countries, the outlook for these services is favourable due to an aging population as the “baby-boomer” generation enters its senior years. For example, the U.S. Census Bureau estimates that the number of Americans aged 65 to 84 will increase by 36.2% between 2010 and 2020 compared to a total population growth of 10.0%. Secondly, other important factors affecting results are developments related to government funding in such programs as Medicare and Medicaid in the United States and the envelope funding systems in Ontario. Given that 66.7% of our revenue from continuing operations that was earned in 2011 (2010 year – 68.4%) was generated from our U.S. operations, Medicare and Medicaid funding is particularly significant for our financial performance. In March 2010, the U.S. government passed health care reform legislation and in July 2011, CMS announced the 2011 CMS Final Rule that includes Medicare funding reductions and other policy changes that will have a significant impact on the industry. For a discussion of health care reform, recent Medicare and Medicaid funding changes, and other factors affecting the outlook for future funding, please refer to the section “Update of Regulatory and Reimbursement Changes Affecting Revenue – United States”. Lastly, the long-term care services that we provide are in competition to a degree with other health care providers including assisted living centers, home health agencies, hospice providers and long-term acute care, or LTAC, units within hospitals. Increasingly, state Medicaid programs in the U.S. and provincial programs in Canada are attempting to divert potential admissions to assisted living centers and home care programs. In addition, Medicaid programs are utilizing Managed Care programs to limit the length of stay of our residents in the United States.
Our financial performance is also affected by changes in the U.S./Canadian dollar exchange rate as the results of our U.S. operations are reported in Canadian dollars and the REIT’s distributions are made in Canadian dollars. Consequently, our financial performance benefits when the Canadian dollar weakens relative to the U.S. currency, and conversely our results are negatively impacted when the U.S. dollar weakens relative to the Canadian dollar. Our distributions are funded from both our U.S. and Canadian operations and, therefore, changes in the value of the U.S. dollar could have an impact on our cash available for distribution. We have a foreign currency hedging strategy whereby we monitor and consider entering into foreign currency forward contracts (FCFCs) to reduce the risks associated with changes in the U.S. dollar and the impact such changes could have on our Canadian dollar distributions. Information about the impact of currency translation on our financial results and a review of our foreign currency hedging strategy is provided in the section “Impact of U.S. Dollar and Foreign Currency Translation”.
Business Overview
Extendicare REIT, through its wholly owned subsidiary operating entities, is a major provider of short-term and long-term senior care services through its network of owned and operated health care centers in North America, operating 261 senior care centers with capacity for 28,107 residents at December 31, 2011.
The REIT’s wholly owned U.S. subsidiary, Extendicare Health Services, Inc. and its subsidiaries (collectively “EHSI”), operates 179 senior care centers with capacity for 17,369 residents, and has a significant presence (more than 10% of its resident capacity) in each of Pennsylvania, Michigan, Wisconsin, Ohio and Kentucky. EHSI offers a continuum of health care services, including nursing care, assisted living and related medical specialty services, such as post-acute care and rehabilitative therapy on an inpatient and outpatient basis.
The REIT’s wholly owned Canadian subsidiary, Extendicare (Canada) Inc. and its subsidiaries (collectively “ECI”), operates 82 senior care centers, with capacity for 10,738 residents. ECI has a significant presence in Ontario and Alberta, where approximately 70% and 15% of its residents are served, respectively. Also, through its ParaMed Home Health Care (ParaMed) division, ECI is a major provider of home health care in Ontario and Alberta.
Extendicare REIT owns rather than leases a majority of its properties, unlike a number of other long-term care providers. At December 31, 2011, excluding centers under management contracts, we owned or operated under lease arrangements with options to purchase 222 centers, or approximately 98%, of our 227 owned or leased centers. We believe that ownership increases our operating flexibility by allowing us to: refurbish centers to meet changing consumer demands; expand or add assisted living and retirement centers adjacent to our nursing centers; adjust licensed capacity to avoid occupancy-based rate penalties; and divest centers and exit markets at our discretion.

16 Extendicare Real Estate Investment Trust
Management’s Discussion and Analysis
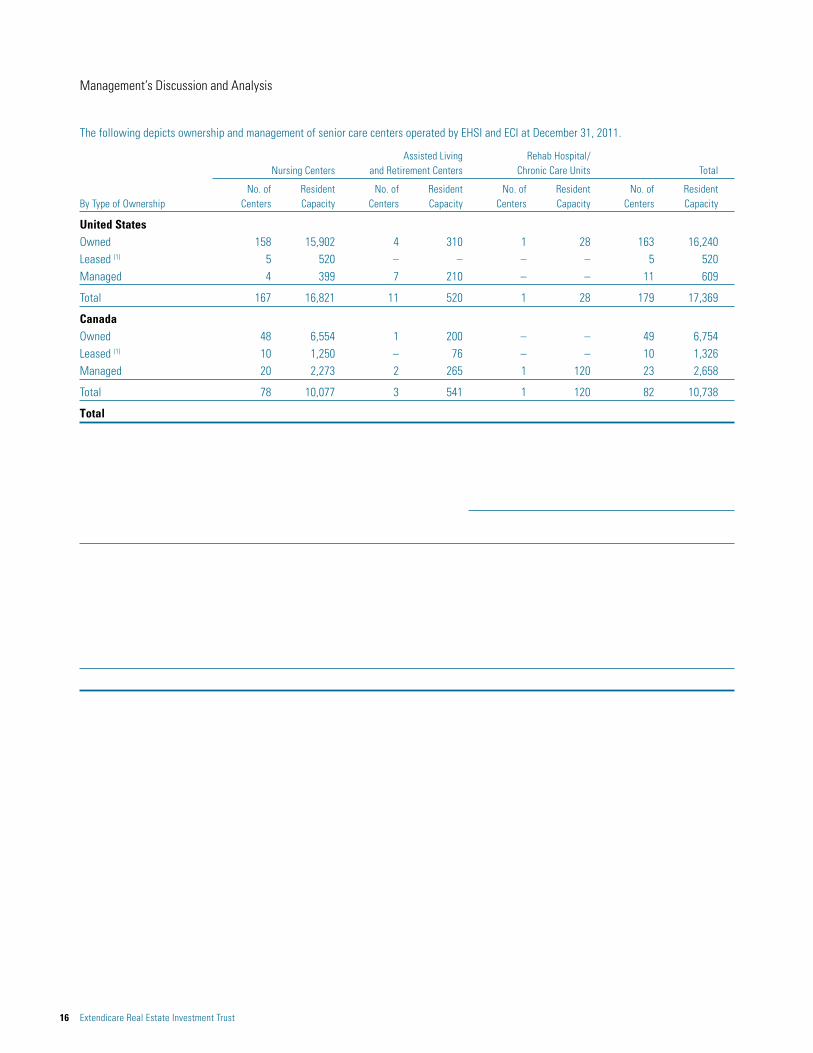
The following depicts ownership and management of senior care centers operated by EHSI and ECI at December 31, 2011.
Assisted Living Rehab Hospital/ Nursing Centers and Retirement Centers Chronic Care Units Total
No. of Resident No. of Resident No. of Resident No. of Resident By Type of Ownership Centers Capacity Centers Capacity Centers Capacity Centers Capacity
United StatesOwned 158 15,902 4 310 1 28 163 16,240Leased (1) 5 520 – – – – 5 520Managed 4 399 7 210 – – 11 609
Total 167 16,821 11 520 1 28 179 17,369
CanadaOwned 48 6,554 1 200 – – 49 6,754Leased (1) 10 1,250 – 76 – – 10 1,326Managed 20 2,273 2 265 1 120 23 2,658
Total 78 10,077 3 541 1 120 82 10,738
Total 245 26,898 14 1,061 2 148 261 28,107
(1) Of the centers operated under lease arrangements: 10 centers are under capital lease arrangements, representing nine centers in Canada under 25-year capital lease arrangements maturing beginning in 2026 through to 2028; and one center in the U.S. is under a 10-year capital lease arrangement maturing in 2020.
The following reflects the change in operating capacity of our senior care centers during the 2011 and 2010 years.
2011 2010
No. of Operational No. of Operational Extendicare REIT Senior Care Centers Centers Beds/Units Centers Beds/Units
As at beginning of the year 266 29,447 268 29,957Development (owned and leased) (1) 3 500 2 320Managed contracts added 6 349 5 272Managed contracts matured (2) (11) (1,765) (1) (148)Closed (3) (2) (175) – (34)Divested (4) (1) (92) (8) (898)Operational capacity adjustments (5) – (157) – (22)
As at the end of the year 261 28,107 266 29,447
(1) 2011 activity: In January we opened a 140-unit designated assisted living unit in Lethbridge, Alberta, and a 120-bed skilled nursing center in Lansing, Michigan. In February and November, we opened the 60 designated assisted living units of our Red Deer center, and the 180-bed nursing center in Edmonton, Alberta, respectively. 2010 activity: In September we opened a 220-bed nursing center in Red Deer, Alberta, and in November we entered into a lease arrangement on a 100-bed skilled nursing center in South Bend, Indiana.
(2) The 11 matured managed contracts during 2011 related primarily to eight centers that had been managed by ECI under a bankruptcy action that were sold to a third party effective January 1, 2011.
(3) The closed nursing centers relate to our Lethbridge and Edmonton, Alberta nursing centers that closed upon the opening of our new centers in the region. The operational beds of the Lethbridge nursing center were reduced by 34 in the 2010 fourth quarter prior to its closure.
(4) Refer to the discussion under the heading “Other Significant Developments – Divestitures and Assets Held for Sale”.(5) The 2011 and 2010 reduction in operational capacity was due primarily to U.S. beds that have been pulled out of service in order to increase our Medicaid rate and to accommodate
rehabilitation suites.
Significant 2011 Events and Developments
This section summarizes the impact of the following items on the operations of the REIT: the 2011 CMS Final Rule, the impairment charge for property and goodwill, the status of our 2011 refinancing plan, divestiture of our U.S. group purchasing organization, the additional provision for self-insured general and professional liabilities, the proposed corporate conversion, and the redemption of Extendicare Limited Partnership units. Refer to the discussion under the heading “Other Significant Developments” for a summary of other developments affecting the financial results or operations of Extendicare REIT.
Management’s Discussion and Analysis
2011 Annual Report 17
2011 CMS FINAL RULE
The 2011 CMS Final Rule includes an 11.1% reduction in Medicare funding to skilled nursing centers along with the elimination of group therapy and changes in the assessment process. As previously announced, we estimated that the impact of these changes, prior to implementing cost saving initiatives, would reduce our revenue and EBITDA in the range of US$70 million to US$80 million. However, we estimate that the actual impact on our 2011 fourth quarter results has been approximately US$15 million. The adverse effect was not as much as anticipated due to the transitional rules that delayed the full implementation of the changes during the 2011 fourth quarter. Though we continue to assess the impact of the 2011 CMS Final Rule, our revised estimate of the negative effect on our revenue and EBITDA is in the range of US$64 million to US$74 million, prior to our cost saving measures. We have taken measures to help mitigate the adverse effect of the elimination of group therapy and the assessment process changes, such as employing more therapists and improving productivity.
Prior to October 1, 2011, we completed a thorough review of our operations and implemented a number of changes within our organization and secured vendor pricing concessions. These savings are anticipated to reduce our general, administrative and non-wage operating costs by an estimated US$24 million on an annualized basis, approximately two-thirds of which were in effect as of October 1, 2011, with the remainder fully in effect as of January 1, 2012. None of these cost saving measures involved a reduction of direct care staffing at our centers. Therefore,

18 Extendicare Real Estate Investment Trust
Management’s Discussion and Analysis
As at February 29, 2012, of the 71 HUD-loan applications submitted totalling US$520 million, we have closed on 61 HUD loans with a principal balance of US$453.4 million. In addition, we have received commitments to close on a further five HUD loans totalling US$43.8 million, all of which are under rate lock agreements and are anticipated to close in the 2012 first quarter. Collectively, the weighted average interest rate of the closed loans and those under commitment with a rate lock is 4.35% (including MIP fees of 0.50%), with an average term to maturity of about 33 years. We anticipate obtaining and closing on the majority of the remaining five HUD commitments before the end of June 2012.
In July 2010, EHSI received approval as a corporate entity to proceed with HUD applications, subject to an overall limit of US$550.0 million, and in December 2011, received approval to increase the financing capacity to an overall limit of US$585.0 million. EHSI already had approximately US$27 million of HUD loans issued prior to this refinancing plan, and therefore, anticipates utilizing approximately US$547 million of its US$585 million overall limit. EHSI plans to secure further HUD financed loans in 2012 and 2013. As at December 31, 2011, EHSI had US$53 million of cash on hand and upon completion of the refinancing anticipates having US$20 million of cash, and approximately 50 unencumbered centers valued at an estimated US$250 million.
Canadian Operations
In December 2011, the REIT’s Canadian operations refinanced $72.4 million in mortgages secured by 20 centers insured by CMHC that were at fixed rates of 9.81% and due to mature in March 2013. The new debt consists of $36.2 million secured by nine centers at a fixed rate of 2.986% maturing in 2022, $22.9 million secured by nine centers at a fixed rate of 2.22% maturing in 2017, and a variable-rate bridge loan of $13.3 million secured by two centers due in June 2013, for which we are seeking to secure new CMHC certificates to replace the existing ones that mature in 2022. A prepayment penalty of approximately $7.5 million was recognized in the 2011 fourth quarter. The estimated annualized interest savings from this refinancing is $5 million.
For further information on the U.S. and Canadian refinancings, refer to note 11 of the 2011 consolidated financial statements.
DIVESTITURE OF U.S. GROUP PURCHASING ORGANIZATION
In December 2011, EHSI reached an agreement in principle to sell its U.S. group purchasing organization, or GPO, to Navigator Group Purchasing, a subsidiary of Managed Health Care Associates, Inc., resulting in the reclassification of the GPO earnings to discontinued operations for the 2011 and 2010 comparative periods. The transaction was finalized and closed in January 2012, for cash proceeds of US$56 million, and will result in an after-tax gain of approximately US$33 million in the 2012 first quarter.
SELF-INSURED GENERAL AND PROFESSIONAL LIABILITY PROVISION
The REIT assesses the adequacy of its self-insured general and professional liability provision based upon an independent actuary report of its liability claims, which is conducted three times a year, in the second and third quarters and at year end. The accrual for self-insured liabilities is based on management’s best estimate of the ultimate cost to resolve general and professional liability claims, including both known claims and claims that have been incurred but not yet reported by the end of the reporting period. Actual results can differ materially from the estimates made due to a number of factors including both other market forces and the assumptions used by management.
The results of the actuarial reviews conducted during the 2011 third quarter and at year end necessitated the strengthening of our prior years’ reserves by $31.4 million (US$32.1 million) and $11.4 million (US$11.2 million), respectively. These additional reserves were necessary as a result of higher than anticipated paid settlement amounts, increases for settlements on known and unknown claims and adverse claim developments in the second half of 2011. The total adverse impact of these non-taxable reserves to our 2011 EBITDA, net earnings and AFFO was $42.8 million (US$43.3 million), or $0.51 per basic unit, of which $31.4 million (US$32.1 million), or $0.38 per basic unit, was recorded in the 2011 third quarter and the balance in the fourth quarter.
The REIT has experienced an increase in the volume of claims received and has accelerated settlements on prior years’ claims, where appropriate, through bulk settlements and other more aggressive claims management practices. These factors were the primary contributors to the determination by the actuary of a need to strengthen the reserves in the 2011 third quarter. As a result of our initiative to aggressively resolve and close our portfolio of pre-existing claims, we experienced an acceleration in settlement activity in the last half of 2011, which we believe resulted in a further modification of our actuarial projections at year end. We believe that the steps we have taken during the past year, including a more proactive case evaluation and acceleration of the time to resolve existing claims, have improved our positioning relative to our exposures for pre-existing claims. As such, we believe we are adequately reserved for our current exposure on known and unknown claims as at December 31, 2011. Barring any significant adverse new developments, we do not anticipate the need to make further material adjustments to our reserves. Furthermore, we have undertaken a review of our portfolio with a strategy to divest of properties in geographic areas with a significantly higher than average loss experience or where other factors exist that have contributed to the need for unusual reserve adjustments.

Management’s Discussion and Analysis
2011 Annual Report 19
For further information on our self-insured liabilities, refer to the discussion under the heading “Accrual for Self-insured Liabilities”.
PROPOSED CORPORATE CONVERSION
At a meeting held on November 8, 2011, the Board unanimously approved the conversion of the REIT from an income trust structure to a corporate structure under a new corporation. The Conversion will be implemented by way of a plan of arrangement, subject to the approval of the Unitholders, as recommended by the Board.
In evaluating and approving the Conversion and in making its determination and recommendation, the REIT Board relied upon legal, tax and other advice and information received during the course of its deliberations and considered, among other things, the following factors and benefits of the Conversion:
• the Conversion provides Extendicare REIT with an effective and efficient method of converting from an income trust structure to a corporate structure consistent with the Conversion Rules that were designed to facilitate tax-efficient conversions of income trusts to corporations if completed on or before December 31, 2012 (the “Termination Date”);
• because a conversion by the REIT from an income trust structure to a corporate structure after the Termination Date would have negative tax consequences to the REIT and/or subsidiaries of the REIT, and in view of the fact that the REIT has been subject to SIFT tax since its formation, the Board determined (taking into account the advice of counsel) that it would be imprudent for the REIT not to utilize the Conversion Rules to effect the Conversion before the Termination Date;
• the Conversion will be completed in accordance with the “exchange method” provided by the Conversion Rules and Unitholders will be able to exchange their REIT Units for common shares of New Extendicare on a tax-deferred basis for Canadian federal income tax purposes;
• the reorganized structure of the REIT as a corporation with share capital will remove the restriction on non-Canadian ownership imposed on income trusts, which may attract new investors, including U.S. and other non-resident investors, and provide a more liquid and attractive market for the common shares of New Extendicare than the market that currently exists for the REIT Units;
• a corporate structure will potentially enhance New Extendicare’s access to larger pools of capital;
• New Extendicare will be able to utilize certain provisions of the Tax Act which provide for flexibility in structuring acquisitions on a tax-deferred basis and which will allow New Extendicare to use its shares as currency on acquisitions; and
• the Conversion will eliminate the administrative costs associated with the REIT’s income trust structure.
The REIT Board also considered the unavailability to taxable Canadian Unitholders of the Canadian income tax deferral associated with distributions made by Extendicare REIT that are “returns of capital”, but concluded that the benefits of the Conversion and the consequences of not completing the Conversion by the Termination Date were compelling reasons to approve the Conversion and to recommend that Unitholders vote in favour of it.
Under the Conversion, which is anticipated to be completed on July 1, 2012, Unitholders will exchange their REIT Units for common shares of New Extendicare on the basis of one common share of New Extendicare for each REIT Unit. In addition, New Extendicare will assume all of the obligations of Extendicare REIT in respect of the REIT’s outstanding 5.70% convertible unsecured subordinated debentures due June 30, 2014, and 7.25% convertible unsecured subordinated debentures due June 30, 2013 (collectively, the “Convertible Debentures”). As a result, following the completion of the Conversion, holders of the Convertible Debentures will be entitled to receive common shares of New Extendicare on the same basis as REIT Units were previously issuable on the conversion thereof.
Following the completion of the Conversion, it is anticipated that the New Extendicare Board will be comprised of the current members of the REIT Board and that senior management of New Extendicare will be comprised of the current senior management of the REIT and Extendicare Inc.
Subject to the discretion of the REIT Board to determine the amount of and when a distribution is declared and paid by the REIT to Unitholders, the REIT expects to continue to pay a monthly distribution of $0.07 per REIT Unit to the Unitholders of record on the last business day of each month up to and including the month immediately preceding the month in which the Conversion is completed. If the Conversion is approved by the Unitholders and completed on July 1, 2012, as anticipated, any distribution in respect of the month of June, 2012 would be the last distribution made by the REIT. After the completion of the Conversion, any distributions made by New Extendicare to its shareholders will be paid as dividends.

20 Extendicare Real Estate Investment Trust
Management’s Discussion and Analysis
The REIT has been subject to SIFT tax since 2007 at tax rates that are comparable to the general corporate tax rate applicable to Canadian corporations. Therefore, the Conversion itself will not impact the funds available for distribution by New Extendicare to its shareholders. The declaration and payment of dividends by New Extendicare will be subject to the discretion of the New Extendicare Board, as to the amount of and if and when a dividend is declared and paid, after consideration of the same factors that are currently taken into account by the REIT Board, which factors include results of operations, requirements for capital, future financial prospects and debt covenants, as well as other factors that may be considered to be relevant by the New Extendicare Board. The REIT Board currently anticipates that the New Extendicare Board will declare its first monthly dividend in the month of July, 2012.
The Conversion must be approved by two-thirds of the votes cast by Unitholders voting in person or by proxy at the Special Meeting to be held in conjunction with the annual meeting on May 8, 2012, approval of the Ontario Superior Court of Justice and various regulatory approvals (including the approval of the TSX). Further details relating to the Conversion will be contained in a management information and proxy circular to be prepared and distributed in connection with the Special Meeting.
REDEMPTION OF EXTENDICARE LIMITED PARTNERSHIP UNITS
In accordance with the Limited Partnership Agreement dated September 11, 2006, on November 10, 2011, Extendicare Limited Partnership (Extendicare LP) redeemed all of its then outstanding units (the “Exchangeable LP Units”). The redemption price for each Exchangeable LP Unit (the “Redemption Price”) was $7.31, being the amount equal to the sum of: (a) the $7.24 closing price of a REIT Unit on the TSX on November 9, 2011; and (b) the amount of all declared and unpaid distributions on such Exchangeable LP Unit as of November 10, 2011 (being the October distribution of C$0.07 per unit). The Redemption Price was satisfied by Extendicare LP causing to be delivered to each registered holder of Exchangeable LP Units a certificate or certificates representing one REIT Unit for each Exchangeable LP Unit held by such holder together with a cheque in respect of the remaining portion of the Redemption Price for each Exchangeable LP Unit held by such holder, less any applicable withholding taxes.
Key Performance Indicators In order to compare the REIT’s financial performance between periods, management assesses the key performance indicators for all of its continuing operations. In addition, we assess the operations on a same-facility basis between the reported periods. Set forth below is an analysis of the key performance indicators and a discussion of significant trends when comparing the REIT’s financial results.
The following is a glossary of terms for some of our key performance indicators:
“ADC” means average daily census, and is the number of residents occupying a bed over a period of time, divided by the number of days in that period;
“Census” is defined as the number of residents occupying beds (or units in the case of an assisted living center);
“CI” means commercial insurance, which is a form of health care coverage in the United States;
“CMI” means case mix index, which is a measure of the relative cost or resources needed to treat the mix of patients or residents;
“HMO” means health maintenance organization, which is a type of managed care organization that provides a form of health care coverage in the United States;
“Managed Care” refers collectively to HMO and CI payor sources, but does not include HMOs serving Medicaid residents, which are included in the Medicaid category;
“Non-same facility”, in the context of comparing our 2011 and 2010 operations in this document, refers to those centers that we have either ceased operating (including those under a sale agreement) or those centers that are new to our portfolio, since January 1, 2010;
“Occupancy” is measured as the percentage of census relative to the total available resident capacity. Total operational resident capacity is the number of beds (or units in the case of an assisted living center) available for occupancy multiplied by the number of days in the period;
“Quality Mix” is the measure of the level of non-Medicaid payor sources. In most states, Medicaid is the least attractive payor source as rates are the lowest among all payor types;

Management’s Discussion and Analysis
2011 Annual Report 21
“Same facility”, in the context of comparing our 2011 and 2010 operations in this document, refers to those centers that were operated by us on January 1, 2010, and throughout 2010 and 2011; and
“Skilled Mix” refers collectively to Medicare and Managed Care payor sources. These sources generally include residents with short-term rehabilitative needs that we focus on accommodating.
U.S. Operations
We focus on short-term stay programs and offering care to residents with higher acuity and those requiring rehabilitative care and services in our skilled nursing center operations. These residents are primarily admitted into our centers with Medicare and Managed Care as their primary funding source. Medicaid rates are generally lower than rates earned from other sources. Therefore, we consider Skilled Mix to be an important performance measurement indicator. During 2011 approximately 82% (2010 – 81%) of our admissions were Medicare or Managed Care funded, with 53% (2010 – 54%) funded by Medicare and 29% (2010 – 27%) funded by Managed Care.
Our goal in the U.S. skilled nursing center operations is to grow revenue by providing higher acuity and short-term rehabilitative services to our residents, thereby increasing the revenue derived from Medicare programs and Managed Care organizations providing Medicare and Medicaid replacement products. Individuals who do not qualify for a funded program pay for the services directly. Therefore, we focus on these payor types to increase average daily revenue rates and improve Quality Mix census as a percentage of the total ADC. After the short-term rehab portion of a resident’s stay, residents who require further longer-term care and who do not have the financial means to pay for their care, seek funding from state Medicaid programs at rates that are generally lower than those earned from other sources.
Our data collection and reporting system allows us to electronically track the condition of the residents and services provided for them. This electronic system enables us to operate more efficiently within the Resource Utilization Groupings (RUGs) classifications system, by ensuring that appropriate payment is received for services being delivered and, thereby, increasing our average Medicare rates.
SKILLED NURSING CENTER REVENUE BY PAYOR SOURCE
EHSI’s average daily Medicare Part A rate, excluding prior period settlement adjustments, increased by 7.2% in 2011 to US$503.75 from US$470.11 in 2010. However, the financial impact of the October 2010 implementation of MDS 3.0 and RUG-IV, followed by the 2011 CMS Final Rule, significantly impacted the average daily Medicare Part A rates in each of the quarters subsequent to October 1, 2010. Following the October 2010 funding changes that CMS stated were intended to be budget neutral, our average Medicare Part A rates increased by 12.7% for the first nine months of 2011 over the same 2010 period, or from US$458.01 in 2010 to US$516.23 in 2011. Following the implementation of the 2011 CMS Final Rule, our average Medicare Part A rates declined by 8.9% in the 2011 fourth quarter to US$463.89 from US$508.95 in the 2010 fourth quarter and decreased by 11.0% from the 2011 third quarter rate of US$521.24. The decline in our average Medicare Part A rates in the 2011 fourth quarter was not as much as anticipated due to the transitional rules provided for in the changeover to the new assessment process. For a discussion of recent Medicare funding changes, please refer to the section “Update of Regulatory and Reimbursement Changes Affecting Revenue – United States”.
The percentage of Medicare residents receiving therapy services declined to 86.3% in 2011 from 90.0% in 2010, and for the 2011 fourth quarter, was 85.7% as compared to 84.6% in the 2010 fourth quarter. We believe the declines in therapy services experienced over 2010 were primarily due to the implementation of MDS 3.0 and RUG-IV, the result of more frequent assessments, the limitations on the look-back period and the elimination of billing for concurrent and group therapy services.
The average revenue rate for Managed Care clients, excluding prior period settlement adjustments, improved by 5.2% in 2011 to US$442.81 from US$421.11 in 2010. The CMS changes implemented in October 2010 and 2011 discussed above, likewise impacted the Managed Care rates as approximately 45% of our Managed Care residents have rates that are RUGs-based or partially aligned to the Medicare rates. Following the October 2010 funding changes, our average Managed Care rates increased by 8.3% for the first nine months of 2011 over the same 2010 period, or from US$414.02 in 2010 to US$448.30 in 2011. Following the implementation of 2011 CMS Final Rule, our average Managed Care rates declined by 3.9% to US$425.80 in the 2011 fourth quarter from US$442.88 in the 2010 fourth quarter and decreased by 7.0% from the 2011 third quarter of US$457.71. The decline in our average Managed Care rates in the 2011 fourth quarter was not as much as anticipated due to the transitional rules provided for in the changeover to the new assessment process. The Managed Care segment represents the second highest rate component of our Quality Mix of residents. As such we will continue to focus on building relationships with key Managed Care organizations and establishing rates that are reflective of the services we are providing.

22 Extendicare Real Estate Investment Trust
Management’s Discussion and Analysis
Though we continue to assess the impact of the 2011 CMS Final Rule, our revised estimate of the negative effect on our revenue and EBITDA is in the range of US$64 million to US$74 million, prior to our cost saving measures.
Our average daily Medicaid rate, excluding prior period settlement adjustments, increased by 1.2% in 2011 to US$182.49 over US$180.27 in 2010. For the 2011 fourth quarter, our average Medicaid rate increased by 1.8% to US$184.83 from US$181.58 in the 2010 fourth quarter and by 0.8% over the 2011 third quarter rate of $183.42. However, revenue from the Medicaid rate increases was partially offset by higher state provider taxes, resulting in a net increase of 0.9% in 2011. For the majority of the states in which we operate, Medicaid funding changes take effect in July and October. For a discussion of recent Medicaid funding changes, please refer to the section “Update of Regulatory and Reimbursement Changes Affecting Revenue – United States”.
The following table provides the percentage of EHSI’s revenue by payor source and the average revenue rates for its skilled nursing centers from total operations (includes operations formerly designated as “discontinued”), excluding prior period settlement adjustments, for the past eight quarters and the 2011 and 2010 years.
Q1 Q2 Q3 Q4 Year
(total operations) 2011 2010 2011 2010 2011 2010 2011 2010 2011 2010
Revenue by Payor Source (%)Medicare 36.7 33.3 36.2 33.6 34.8 32.6 32.2 33.9 34.9 33.3Managed Care 10.3 9.4 10.1 9.4 10.0 9.4 9.6 9.7 10.0 9.5
Skilled Mix 47.0 42.7 46.3 43.0 44.8 42.0 41.8 43.6 44.9 42.8Private/other 8.1 9.0 8.0 9.1 8.6 9.3 9.1 9.2 8.5 9.2
Quality Mix 55.1 51.7 54.3 52.1 53.4 51.3 50.9 52.8 53.4 52.0Medicaid 44.9 48.3 45.7 47.9 46.6 48.7 49.1 47.2 46.6 48.0
100.0 100.0 100.0 100.0 100.0 100.0 100.0 100.0 100.0 100.0
Average Revenue Rate by Payor Source (US$)Medicare Part A 515.49 456.35 515.90 457.23 521.24 460.61 463.89 508.95 503.75 470.11Medicare Parts A and B 552.58 499.38 555.03 499.38 569.12 509.19 513.24 554.94 546.91 514.96Managed Care 447.77 406.85 441.06 416.18 457.71 419.31 425.80 442.88 442.81 421.11Private/other 221.07 224.42 228.04 222.74 226.49 218.81 224.17 221.51 224.91 221.85Medicaid 180.20 178.56 180.99 180.08 183.42 180.39 184.83 181.58 182.49 180.27Weighted average 266.40 249.71 266.27 252.15 266.56 250.75 255.46 260.08 263.56 253.22
The following table provides the percentage of EHSI’s revenue by payor source for its skilled nursing centers on a same-facility basis, excluding prior period settlement adjustments, for the past eight quarters and the 2011 and 2010 years.
Q1 Q2 Q3 Q4 Year
(same-facility operations) 2011 2010 2011 2010 2011 2010 2011 2010 2011 2010
Revenue by Payor Source (%)Medicare 36.5 33.5 35.8 33.8 34.3 32.6 31.9 33.8 34.6 33.5Managed Care 10.3 9.5 10.2 9.5 10.0 9.5 9.7 9.8 10.0 9.5
Skilled Mix 46.8 43.0 46.0 43.3 44.3 42.1 41.6 43.6 44.6 43.0Private/other 8.1 9.0 8.0 9.0 8.7 9.3 9.0 9.2 8.5 9.1
Quality Mix 54.9 52.0 54.0 52.3 53.0 51.4 50.6 52.8 53.1 52.1Medicaid 45.1 48.0 46.0 47.7 47.0 48.6 49.4 47.2 46.9 47.9
100.0 100.0 100.0 100.0 100.0 100.0 100.0 100.0 100.0 100.0

Management’s Discussion and Analysis
2011 Annual Report 23
On a same-facility basis, the proportion of our Skilled Mix revenue to total revenue improved to 44.6% in 2011 from 43.0% in 2010. However, in the 2011 fourth quarter we experienced a decline to 41.6% from 43.6% in the 2010 fourth quarter, and a decline from 44.3% in the 2011 third quarter. The improvement over 2010 is largely reflective of the higher average daily rates resulting from the October 2010 funding changes, while the decline in the 2011 fourth quarter is largely a result of the October 2011 funding reductions. In addition, the percentage of Skilled Mix revenue was impacted by lower Skilled Mix census levels, as discussed in the following section.
For more information on Medicare and Medicaid funding in the U.S., including recent developments and their impact or expected impact on Extendicare REIT, please see “Update of Regulatory and Reimbursement Changes Affecting Revenue – United States”.
SKILLED NURSING CENTER AVERAGE DAILY CENSUS
We continue to be adversely affected by the U.S. economic recession that has reduced disposable income of individuals and resulted in a general restraint by the public on health care spending. Lower hospital census has resulted in fewer admissions, and the implementation of MDS 3.0 and RUG-IV as of October 2010 has also resulted in a small reduction in our average length of stay for short-term admissions. In addition, certain state Medicaid programs are attempting to divert potential admissions to assisted living centers and home care programs.
We have implemented a number of short and longer-term tactics, which take a more strategic approach to identifying and meeting the program and service needs of each community in which we are located. Included in these initiatives are the establishment of Active Life Transition Units (ALTUs) that are upgraded suites targeted to attract our short-term rehab residents. We currently have 11 ALTUs and plan to continue to expand the number of centers with ALTUs within certain of our centers. As a result, we have been successful in sustaining our Skilled Mix census as a percentage of total ADC.
The following table provides the ADC, percentage of total ADC, and average occupancy of EHSI’s skilled nursing centers from total operations, for the past eight quarters and the 2011 and 2010 years.
Q1 Q2 Q3 Q4 Year
(total operations) 2011 2010 2011 2010 2011 2010 2011 2010 2011 2010
Average Daily Census Medicare 2,524 2,498 2,451 2,499 2,296 2,303 2,250 2,249 2,379 2,387Managed Care 871 867 862 835 818 814 814 810 841 831
Skilled Mix 3,395 3,365 3,313 3,334 3,114 3,117 3,064 3,059 3,220 3,218Private/other 1,396 1,517 1,317 1,512 1,434 1,530 1,455 1,529 1,401 1,522
Quality Mix 4,791 4,882 4,630 4,846 4,548 4,647 4,519 4,588 4,621 4,740Medicaid 9,476 10,142 9,477 9,855 9,545 9,715 9,532 9,583 9,508 9,822
Total 14,267 15,024 14,107 14,701 14,093 14,362 14,051 14,171 14,129 14,562
Census by Payor Type (%) Medicare 17.7 16.6 17.4 17.0 16.3 16.0 16.0 15.9 16.8 16.4Managed Care 6.1 5.8 6.1 5.7 5.8 5.7 5.8 5.7 6.0 5.7
Skilled Mix 23.8 22.4 23.5 22.7 22.1 21.7 21.8 21.6 22.8 22.1Private/other 9.8 10.1 9.3 10.3 10.2 10.7 10.4 10.8 9.9 10.5
Quality Mix 33.6 32.5 32.8 33.0 32.3 32.4 32.2 32.4 32.7 32.6Medicaid 66.4 67.5 67.2 67.0 67.7 67.6 67.8 67.6 67.3 67.4
100.0 100.0 100.0 100.0 100.0 100.0 100.0 100.0 100.0 100.0
Average occupancy (%) 86.3 86.2 85.3 86.1 85.6 86.0 85.4 85.6 85.7 86.0

24 Extendicare Real Estate Investment Trust
Management’s Discussion and Analysis
EHSI’s total skilled nursing center ADC declined by 3%, or 433 ADC, to 14,129 in 2011 from 14,562 in 2010, with declines in Medicaid ADC of 314 and private/other ADC of 121, partially offset by an improvement in Skilled Mix ADC of 2. Of the 433 decline in total ADC, 237 related to non same-facility operations consisting of 11 centers, and the balance of 196 related to a decline in same-facility census. EHSI’s non same-facility operations represent eight skilled nursing facilities disposed of during 2010, one center disposed of in May 2011, and two new skilled nursing facilities that opened since January 1, 2010. Despite the decline in ADC, our Skilled Mix of residents improved to 22.8% in 2011 from 22.1% in 2010, reflecting success from our new centers and renovation projects, which are focused on attracting and meeting the needs of short-term, high-acuity residents. Our average occupancy in 2011 was 85.7% compared to 86.0% for 2010.
Our same-facility ADC of 13,990 in 2011 was 1.4%, or 196 ADC, below the 2010 level of 14,186 due to lower Medicaid ADC of 112 and lower private/other ADC of 92, partially offset by an increase in Skilled Mix ADC of 8. Our Skilled Mix represented 22.5% of our residents in 2011 compared to 22.2% in 2010. Our average same-facility occupancy was 86.0% this year compared to 86.3% in 2010.
The following table provides the ADC, percentage of total ADC, and average occupancy of EHSI’s skilled nursing centers on a same-facility basis, for the past eight quarters and the 2011 and 2010 years.
Q1 Q2 Q3 Q4 Year
(same-facility operations) 2011 2010 2011 2010 2011 2010 2011 2010 2011 2010
Average Daily Census Medicare 2,476 2,405 2,381 2,431 2,237 2,272 2,200 2,228 2,323 2,333Managed Care 863 826 858 819 808 804 802 806 832 814
Skilled Mix 3,339 3,231 3,239 3,250 3,045 3,076 3,002 3,034 3,155 3,147Private/other 1,388 1,439 1,303 1,438 1,415 1,507 1,428 1,519 1,384 1,476
Quality Mix 4,727 4,670 4,542 4,688 4,460 4,583 4,430 4,553 4,539 4,623Medicaid 9,408 9,640 9,431 9,529 9,498 9,558 9,466 9,525 9,451 9,563
Total 14,135 14,310 13,973 14,217 13,958 14,141 13,896 14,078 13,990 14,186
Census by Payor Type (%) Medicare 17.5 16.8 17.0 17.1 16.0 16.0 15.8 15.8 16.6 16.5Managed Care 6.1 5.8 6.2 5.8 5.8 5.7 5.8 5.7 5.9 5.7
Skilled Mix 23.6 22.6 23.2 22.9 21.8 21.7 21.6 21.5 22.5 22.2Private/other 9.8 10.0 9.3 10.1 10.2 10.7 10.3 10.8 9.9 10.4
Quality Mix 33.4 32.6 32.5 33.0 32.0 32.4 31.9 32.3 32.4 32.6Medicaid 66.6 67.4 67.5 67.0 68.0 67.6 68.1 67.7 67.6 67.4
100.0 100.0 100.0 100.0 100.0 100.0 100.0 100.0 100.0 100.0
Average occupancy (%) 86.6 87.0 86.0 86.4 86.0 86.0 85.6 85.9 86.0 86.3
Canadian Operations
The funding received by ECI for its nursing homes and home health care services is regulated by provincial authorities (rather than federal authorities), who often set the rates following consultation with the providers and their industry associations. This type of system reduces the potential for a single change or event to significantly affect the reimbursement or regulatory environment for ECI. For more information on government funding in Canada, including recent developments and their impact or expected impact on Extendicare REIT, please see “Update of Regulatory and Reimbursement Changes Affecting Revenue – Canada”.
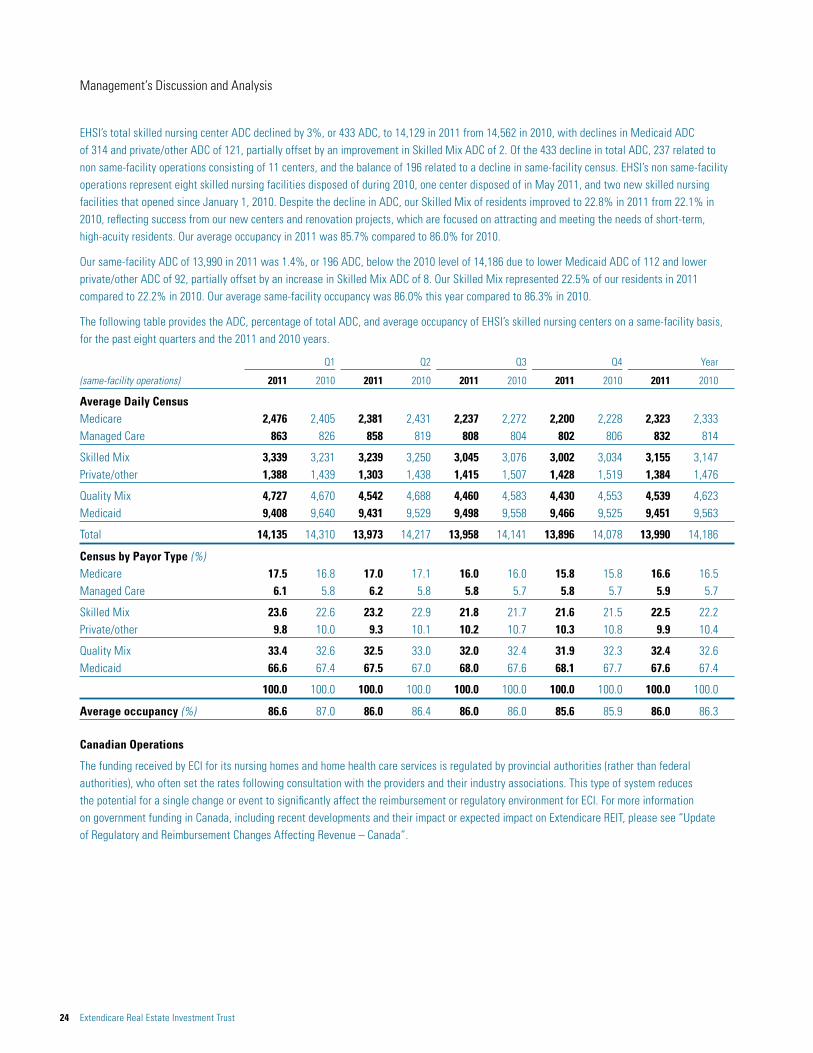
Management’s Discussion and Analysis
2011 Annual Report 25
The following are ECI’s average daily revenue rates and occupancy levels for the past eight quarters and the 2011 and 2010 years.
Q1 Q2 Q3 Q4 Year
2011 2010 2011 2010 2011 2010 2011 2010 2011 2010
Average revenue rate ($) 181.16 174.13 182.94 178.04 181.66 175.53 191.00 183.97 184.25 177.97Average occupancy (%) 96.4 98.0 96.7 98.3 97.5 97.8 97.2 98.0 96.9 98.0Average same-facility occupancy (%) 97.8 98.1 97.8 98.4 98.1 98.5 97.8 98.4 97.9 98.3
Revenue from provincial programs represented approximately 66% of ECI’s nursing home revenue in 2011 (2010 – 65%). ECI’s average daily revenue rate increased by 3.5% to $184.25 in 2011 from $177.97 in 2010. The majority of ECI’s nursing home operations are in Ontario, which operates under a funding envelope system, under which a substantial portion of the revenue is tied to flow-through funding, and is therefore matched with the related costs for resident care in the periods in which they are incurred. As a result, ECI’s average revenue rates fluctuate by quarter, and are generally at their lowest in the first quarter and their highest in the fourth quarter. In addition, ECI received retroactive funding adjustments that affected the comparability of the rates between periods, as follows: $1.2 million in the 2010 second quarter; and $1.0 million in the 2010 fourth quarter. For further information on funding in Canada, refer to the discussion under the heading “Update of Regulatory and Reimbursement Changes Affecting Revenue – Canada”.
In Canada, where the supply of long-term care beds historically has been very restricted in comparison to the United States, nursing home operators typically enjoy higher occupancy levels than operators in the United States. Our same-facility average occupancy in Canada, excluding one new leased center in Ontario and the three new centers and two closed centers in Alberta, was 97.9% in 2011 compared to 98.3% in 2010. In terms of the quarterly trends throughout the year, slightly lower occupancy levels are to be expected during the winter months as a result of flu outbreaks which can lead to temporary freezes on admissions.
Revenue from provincial programs represented approximately 97% of ECI’s home health care revenue in 2011 (2010 – 96%). Our average daily home health care hours of service increased by 5.3% this year to 12,695 from 12,061 in 2010. During the 2011 year, ParaMed provided 4,634,000 hours of home health care service (2010 – 4,402,000), of which 95.1% (2010 – 95.0%) was from business in Ontario and the remainder from our Alberta operations. Since 2004, we have been unable to compete for new government contracts in Ontario due to the government’s freeze on the competitive bidding process. We have not received any confirmation of when or if the bidding process will resume.

26 Extendicare Real Estate Investment Trust
Management’s Discussion and Analysis
Impact of U.S. Dollar and Foreign Currency Translation Impact on Financial Statements
The majority of our operations are conducted in the United States, which accounted for 66.7% of consolidated revenue from continuing operations in 2011 (2010 – 68.4%). As a result, changes in the exchange rates used to translate the results of the U.S. operations to Canadian dollars can affect the comparison of the consolidated results. The table below illustrates the positive/(negative) effect of changes in the average exchange rates used in translating the U.S. results for the 2011 fourth quarter and the 2011 year.
Q4 Year
2011 2010 2011 2010
Average U.S./Canadian dollar exchange rate 1.0217 1.0130 0.9891 1.0299
Impact on Periods (millions of dollars)
Revenue 3.9 (57.6) EBITDA 0.9 (5.5) Net loss (0.1) 1.1 AFFO 0.2 (2.0)
Same-facility Operations Revenue 3.8 (56.9) EBITDA 0.9 (5.5)
The following table illustrates the contribution from our U.S. operations to selected line items of our financial results for 2011, and the resulting impact of a one-cent change in the Canadian dollar against the U.S. dollar. However, a change in the exchange rate has had limited impact on the cash flow from our U.S. operations to fund distributions, because we had foreign currency forward contracts (FCFCs) in place until June 2011 (refer to discussion below under the heading “Impact of Foreign Currency Forward Contract Strategy on Distributions”).
Impact of One-Cent U.S. Operations 2011 Change in Exchange Rate (1)
(millions of dollars) US$ C$
Revenue 1,411.1 14.1EBITDA 135.8 1.4AFFO 48.5 0.5
(1) A weaker Canadian dollar against the U.S. dollar has a positive effect on reported results; while a stronger Canadian dollar has a negative effect on reported results.
The valuation of our FCFCs is marked to market and reported on our balance sheet based upon the current value of the future stream of converted funds. A fluctuation in the Canadian to U.S. dollar exchange rates and valuation of the FCFCs can result in unrealized gains or losses that are reported within our statement of earnings as part of “loss (gain) on foreign exchange and financial instruments”. Gains or losses on the FCFCs are not subject to cash taxes until realized.
Impact of Foreign Currency Forward Contract Strategy on Distributions
We have a foreign currency hedging strategy whereby we monitor and consider entering into FCFCs to reduce the risks associated with changes in the U.S. dollar and the impact such changes could have on our Canadian dollar cash available for distribution. EHSI had a contract that matured in June 2011, which converted US$4.0 million into Canadian dollars on a monthly basis at the prevailing exchange rate at that time subject to a floor of 1.00 and a ceiling of 1.09 (whereby US$1.00 converts to C$1.09). Management continues to monitor the U.S. to Canadian dollar exchange rate and to consider future FCFCs to the extent that they may be beneficial to us.

Management’s Discussion and Analysis
2011 Annual Report 27
Adjusted Funds from Operations The following table provides a reconciliation of our EBITDA to Funds from Operations (FFO), Distributable Income (DI) and AFFO for each of the eight most recently completed quarters and for the years ended 2011 and 2010.(1)
(millions of dollars unless Q1 Q2 Q3 Q4 Year
otherwise noted) 2011 2010 2011 2010 2011 2010 2011 2010 2011 2010
EBITDA 58.0 58.2 63.3 68.9 38.7 49.3 40.1 65.7 200.1 242.1Depreciation for FFEC (5.9) (5.5) (5.6) (5.5) (5.8) (5.7) (6.1) (5.7) (23.4) (22.4)Accretion costs (0.5) (0.5) (0.5) (0.6) (0.5) (0.5) (0.5) (0.5) (2.0) (2.1)Interest expense, net (21.5) (21.5) (22.1) (19.9) (21.9) (21.6) (19.8) (21.8) (85.3) (84.8)
30.1 30.7 35.1 42.9 10.5 21.5 13.7 37.7 89.4 132.8Current income tax expense (2) (9.4) (10.8) (11.0) (11.5) (8.8) (6.7) (1.8) (0.7) (31.0) (29.7)
FFO (continuing operations) 20.7 19.9 24.1 31.4 1.7 14.8 11.9 37.0 58.4 103.1Amortization of financing costs and accretion costs 1.9 1.9 2.9 2.0 4.1 1.9 2.5 1.9 11.4 7.7Principal portion of government capital funding payments 0.6 0.6 0.7 0.6 0.7 0.6 0.6 0.6 2.6 2.4
DI (continuing operations) 23.2 22.4 27.7 34.0 6.5 17.3 15.0 39.5 72.4 113.2Additional facility maintenance capital expenditures (3) 1.2 0.9 (1.5) 0.4 (3.3) (2.8) (4.0) (6.0) (7.6) (7.5)
AFFO (continuing operations) 24.4 23.3 26.2 34.4 3.2 14.5 11.0 33.5 64.8 105.7AFFO (discontinued operations) (4) 1.2 1.4 1.1 1.2 1.3 1.2 1.4 1.2 5.0 5.0
AFFO (5) 25.6 24.7 27.3 35.6 4.5 15.7 12.4 34.7 69.8 110.7
Per Basic Unit (6) ($) FFO (continuing operations) 0.249 0.256 0.290 0.384 0.020 0.175 0.142 0.449 0.701 1.264AFFO (continuing operations) 0.294 0.300 0.315 0.420 0.037 0.170 0.131 0.406 0.777 1.296AFFO 0.308 0.317 0.328 0.435 0.054 0.185 0.147 0.421 0.837 1.358
Per Diluted Unit (6) ($)FFO (continuing operations) 0.236 0.239 0.271 0.349 0.039 0.172 0.143 0.406 0.689 1.166AFFO (continuing operations) 0.274 0.276 0.292 0.380 0.055 0.169 0.134 0.369 0.755 1.194AFFO 0.286 0.291 0.304 0.393 0.068 0.181 0.148 0.381 0.806 1.246
Distributions (6) ($) Declared (thousands) 17,453 16,673 17,484 17,346 17,534 17,382 17,630 17,416 70,101 68,817 Declared per unit 0.2100 0.2100 0.2100 0.2100 0.2100 0.2100 0.2100 0.2100 0.8400 0.8400
Weighted Average Number of Units (6) (thousands)Basic 83,082 77,839 83,230 82,576 83,442 82,742 83,869 82,906 83,408 81,533Diluted 96,895 91,652 96,980 96,389 97,255 96,555 97,682 96,720 97,205 95,346
(1) “EBITDA”, “FFO”, “DI” and “AFFO” are not recognized measures under IFRS and do not have a standardized meaning prescribed by IFRS. Refer to the discussion of non-GAAP measures.(2) Excludes current tax with respect to fair value adjustments, and gains or losses on foreign exchange, financial instruments, asset impairment, disposals and other items that are excluded
from the computation of AFFO.(3) Represents total facility maintenance capital expenditures less depreciation for furniture, fixtures, equipment and computers, or FFEC, already deducted in determining DI.(4) The impact of discontinued operations affects FFO, DI and AFFO by the same amount.(5) A reconciliation of AFFO to cash flow from operating activities is provided under the heading “Liquidity and Capital Resources”.(6) Per unit amounts, distributions declared and the number of units are based on the total of the REIT Units and Exchangeable LP Units.

28 Extendicare Real Estate Investment Trust
Management’s Discussion and Analysis
AFFO Review
2011 FOURTH QUARTER AFFO
AFFO was $12.4 million ($0.1470 per basic unit) in the 2011 fourth quarter compared to $34.7 million ($0.421 per basic unit) in the 2010 fourth quarter, representing a decline of $22.5 million, excluding a $0.2 million positive effect of the weaker Canadian dollar. Excluding the $11.5 million (US$11.2 million) change in prior years’ reserves for self-insured liabilities, AFFO was lower by $11.0 million, primarily due to a decline in EBITDA of $15.0 million as a result of the 2011 CMS Final Rule along with lower census. Further information on the 2011 CMS Final Rule and increase in reserves for self-insured liabilities can be found under the heading “Overview – Significant 2011 Events and Developments”. A discussion of the EBITDA by segmented division can be found under the heading “Summary of Quarterly Results – 2011 Fourth Quarter Financial Review”.
2011 AFFO
AFFO of $69.8 million ($0.837 per basic unit) was lower by $38.9 million in comparison to 2010 of $110.7 million ($1.358 per basic unit), after excluding a $2.0 million negative effect of the stronger Canadian dollar. Excluding the $30.7 million (US$29.8 million) increase between periods in prior years’ reserves for self-insured liabilities, AFFO declined by $8.2 million this year, primarily due to a decline in EBITDA of $5.8 million, an increase in current income taxes in comparison to the level of pre-tax earnings adjusted for the non-taxable reserves, and increased facility maintenance capital expenditures, partially offset by lower net interest costs. The 2010 results included a current income tax recovery of $4.4 million (US$4.3 million) in connection with the acceleration of tax depreciation. A discussion of the EBITDA by segmented division can be found under the heading “2011 Financial Review”.
Facility maintenance capital expenditures were $10.1 million in the 2011 fourth quarter, compared to $11.7 million in the 2010 fourth quarter and $9.1 million in the 2011 third quarter, representing 1.9%, 2.2% and 1.7% of revenue, respectively. For 2011, facility maintenance capital expenditures were $31.0 million compared to $29.9 million, representing 1.5% and 1.4% of revenue, respectively. These costs fluctuate on a quarterly basis with the timing of projects and seasonality. It is our intention to spend between 1.5% and 2.0% of revenue annually, which is consistent with our objective to maintain and upgrade our centers. We are projecting to spend up to approximately $38 million in facility maintenance capital expenditures and approximately $70 million in growth capital expenditures in 2012.
As previously indicated, the effective tax rates on funds from operations (FFO) can be impacted by: adjustments to our estimates of annual timing differences, particularly when dealing with cash-based tax items versus accruals; changes in earnings of our non-taxable entities; as well as from book-to-file adjustments for prior year filings. We anticipate that our normal annual effective tax rate on FFO, excluding the impact of reserve adjustments in our non-taxable captive insurance company, will be in the range of 27% to 30%, with quarterly fluctuations due to estimates of timing differences and mix of earnings between jurisdictions.
Distributions The current policy of the REIT is to pay distributions of $0.07 per REIT Unit to the holders thereof on a monthly basis. The declaration and payment of future distributions is subject to the discretion of the Board and will be dependent upon a number of factors including results of operations, requirements for capital expenditures and working capital, future financial prospects of the REIT, debt covenants and obligations, and any other factors deemed relevant by the Board. If the Board determines that it would be in the REIT’s best interests, it may reduce, for any period, the percentage of Distributable Income to be distributed to holders of REIT Units.
Distributions declared in 2011 totalled $70.1 million, or $0.84 per unit, representing approximately 100% of total AFFO of $69.8 million. For the year ended 2010, distributions declared totalled $68.8 million, or $0.84 per unit, representing approximately 62% of AFFO of $110.7 million.
Approximately 70% of the distributions made by Extendicare REIT since 2006 were tax-deferred returns of capital for Canadian residents. Management estimates that approximately 70% of the monthly distributions to be made by the REIT in 2012 will also be tax-deferred returns of capital for Canadian residents. Such estimate is based on the current organizational structure of the REIT, certain financial information, the current provisions of the Tax Act, published statements of the current administrative and assessing practices of the Canadian Revenue Agency

30 Extendicare Real Estate Investment Trust
Management’s Discussion and Analysis
The following provides a reconciliation of the line items: (i) “net earnings (loss)” to “earnings (loss) from continuing operations before separately reported gains/losses and distributions on Exchangeable LP Units”; and (ii) “(loss) earnings before income taxes” to “EBITDA” for each of the eight most recently completed quarters. This information has been prepared in accordance with IFRS.
Q1 Q2 Q3 Q4
(thousands of dollars) 2011 2010 2011 2010 2011 2010 2011 2010
Net earnings (loss) (8,394) 5,421 30,278 23,692 (34,383) (15,620) (17,897) 28,336Add (Deduct): Fair value adjustment on convertible debentures, net of taxes 8,033 4,993 (7,576) (4,780) (9,566) 14,005 9,686 (8,783)Fair value adjustment on Exchangeable LP Units, net of taxes 10,555 3,377 (7,305) (6,766) (10,468) 5,247 618 (3,437)Loss (gain) on foreign exchange and financial instruments, net of taxes (988) (3,955) (90) 5,422 308 (3,921) 115 (2,350)Loss (gain) from asset impairment, disposals and other items, net of taxes 417 − (672) 2,583 40,779 171 6,284 (2,034)Distributions on Exchangeable LP Units, net of taxes 662 686 652 674 649 673 216 669Discontinued operations, net of taxes (1,167) (1,349) (1,088) (1,207) (1,300) (1,186) (1,372) (1,183)
Earnings (loss) from continuing operations before separately reported gains/losses and distributions on Exchangeable LP Units, net of taxes 9,118 9,173 14,199 19,618 (13,981) (631) (2,350) 11,218
Earnings (loss) before income taxes (2,036) 11,413 37,213 32,998 (36,933) (8,979) (20,125) 38,999Add (Deduct): Depreciation and amortization 19,200 18,106 18,694 18,203 19,096 18,685 19,587 18,775Net finance costs 40,231 28,653 8,330 13,737 2,409 39,239 31,974 9,293Loss (gain) from asset impairment, disposals and other items 569 − (942) 4,031 54,202 319 8,667 (1,402)
EBITDA 57,964 58,172 63,295 68,969 38,774 49,264 40,103 65,665

Management’s Discussion and Analysis
2011 Annual Report 31
The following provides the segmented EBITDA for our U.S. and Canadian operations.
Q1 Q2 Q3 Q4
(thousands of dollars) 2011 2010 2011 2010 2011 2010 2011 2010
Segmented EBITDA U.S. operations (US$) 44,422 40,610 47,199 49,266 20,125 30,245 24,097 49,690
U.S. operations (C$) 43,782 42,235 45,713 50,679 19,803 31,483 25,064 50,490Canadian operations 14,182 15,937 17,582 18,290 18,971 17,781 15,039 15,175
EBITDA 57,964 58,172 63,295 68,969 38,774 49,264 40,103 65,665
There are a number of factors affecting the trend of our quarterly results. For seasonal trends, while year-over-year quarterly comparisons will remain appropriate, sequential quarters will vary materially. We already report as separate line items “fair value adjustments”, “distributions on Exchangeable LP Units”, “loss (gain) on foreign exchange and financial instruments” and “loss (gain) from asset impairment, disposals and other items”, which are transitional in nature and would otherwise distort historical trends. With respect to our core operations, the significant factors that impact the results from period to period are as follows:
• MedicareandManagedCareadmissionsareusuallythehighestinthefirstandsecondquarters;begintodeclineduringthelatterportion of the second quarter; and are generally at their lowest in the summer months as there tends to be fewer elective surgeries performed;
• Medicaidratechanges,includingadjustmentsforCMIandprovidertaxes,occurwitheachstate’sfiscalyear,whichisJuly1stforthemajorityof the major states in which EHSI operates, and October 1st for Michigan;
• MedicareratechangesgenerallyoccurOctober1st(federalfiscalyear),andtypicallyincludeamarketbasketinflationaryincrease;
• Ontariolong-termcareprovidersgenerallyreceiveannualacuity-basedflow-throughfundingadjustmentseffectiveApril1standaccommodationfunding increases July 1st, and Alberta long-term care providers generally receive annual inflationary rate increases and acuity-based funding adjustments on April 1st;
• independentactuarialreviewsareconductedthreetimesayear,inthesecondandthirdquartersandatyearend,whichmaylead to a strengthening, or conversely, a release of the reserves for self-insured liabilities;
• utility costs are generally at their highest in the first quarter and their lowest in the third quarter, with variances between the two of as much as $3.5 million; and
• foreign currency exchange rate fluctuations between the U.S. and Canadian dollars and impact on translation of our U.S. operations from U.S. dollars to Canadian dollars.
Further details on the above can be found under the sections “Overview – Significant 2011 Events and Developments”, “Key Performance Indicators”, “Impact of U.S. Dollar and Foreign Currency Translation”, “Other Significant Developments” and “Update of Regulatory and Reimbursement Changes Affecting Revenue”.

32 Extendicare Real Estate Investment Trust
Management’s Discussion and Analysis
2011 Fourth Quarter Financial Review
CONSOLIDATED CONTINUING OPERATIONS Q4 Change
(millions of dollars unless otherwise noted) 2011 2010 $ %
Revenue 531.8 529.1 2.7 0.5%Operating expenses 471.5 441.2 30.3 6.9%Administrative costs 17.3 19.5 (2.2) (11.3)%Lease costs 2.9 2.7 0.2 7.4%
EBITDA 40.1 65.7 (25.6) (39.0)%
EBITDA as a % of revenue 7.5% 12.4% Average U.S./Canadian dollar exchange rate 1.0217 1.0130
The average exchange rates used to translate the results of the U.S. operations to Canadian dollars were 1.0217 for the 2011 fourth quarter and 1.0130 for the 2010 fourth quarter. However, separately reported items such as fair value adjustments, gains or losses related to financial instruments, foreign exchange, asset impairment, disposals and other items, are translated at the rates of exchange in effect at the time of the transactions.
Consolidated Continuing Operations Compared to the 2010 Fourth Quarter
Consolidated revenue from continuing operations improved by $2.7 million to $531.8 million in the 2011 fourth quarter from $529.1 million in the 2010 fourth quarter. Non same-facility operations contributed $17.3 million to revenue this quarter and $10.1 million in the 2010 fourth quarter, for a net improvement between quarters of $7.2 million. The non same-facility operations related to 17 centers as follows: eight U.S. skilled nursing centers that were disposed of throughout 2010, a U.S. skilled nursing center that was sold in May 2011, two new leased U.S. skilled nursing centers that opened in November 2010 and January 2011, a newly leased Canadian center in May 2011, three new Canadian centers that opened in September 2010, January 2011 and November 2011, and two Canadian nursing centers that closed in January and November 2011. Excluding the $3.8 million positive effect of the weaker Canadian dollar, revenue from same-facility operations declined between periods by $8.3 million as a result of U.S. funding reductions and lower U.S. census levels. We estimate that the adverse effect of the 2011 CMS Final Rule on our 2011 fourth quarter revenue was approximately $14.8 million (US$15.0 million). Details by segmented operations are discussed below.
Consolidated EBITDA from continuing operations declined by $25.6 million to $40.1 million in the 2011 fourth quarter from $65.7 million in the 2010 fourth quarter, and was 7.5% and 12.4% of revenue, respectively. Non same-facility operations generated EBITDA of $2.8 million in the 2011 fourth quarter compared to a loss of $0.6 million in the same 2010 period, for a net improvement of $3.4 million between periods. Excluding a $0.9 million positive effect of a weaker Canadian dollar, same-facility EBITDA declined by $29.9 million primarily due to the U.S. funding reductions and an $11.5 million (US$11.2 million) increase in reserves for prior years’ self-insured liabilities. Details by segmented operations are discussed below.
Consolidated labour-related costs represented 72.5% of operating and administrative costs in the 2011 fourth quarter compared to 73.8% in the 2010 fourth quarter, and as a percent of revenue, were 66.6% and 64.2%, respectively.
U.S. CONTINUING OPERATIONS Q4 2011 Q4 2010 Change of US$
(millions of dollars unless otherwise noted) US$ C$ US$ C$ US$ %
Revenue 342.2 350.3 350.3 354.8 (8.1) (2.3)%Operating expenses 305.0 311.7 285.4 288.9 19.6 6.9%Administrative costs 11.4 11.8 13.6 13.8 (2.2) (16.2)%Lease costs 1.7 1.7 1.6 1.6 0.1 6.3%
EBITDA 24.1 25.1 49.7 50.5 (25.6) (51.5)%
EBITDA as a % of revenue 7.0% 14.2%

Management’s Discussion and Analysis
2011 Annual Report 33
U.S. Continuing Operations Compared to the 2010 Fourth Quarter
Revenue from U.S. operations in its functional currency declined by US$8.1 million to US$342.2 million in the 2011 fourth quarter compared to US$350.3 million in the 2010 fourth quarter. Non same-facility revenue was US$4.2 million this quarter compared to US$2.1 million in the same 2010 period, an improvement of US$2.1 million between quarters. Revenue from same-facility operations declined by US$10.2 million between periods primarily due to lower average Medicare and Managed Care rates and lower census levels, partially offset by higher average Medicaid and private/other rates. The decline in our average Medicare and Managed Care rates reflected changes implemented by the 2011 CMS Final Rule. We estimate that the adverse effect of the 2011 CMS Final Rule on our 2011 fourth quarter revenue was approximately US$15.0 million. More information on revenue rates and census is provided under “Key Performance Indicators – U.S. Operations”.
The following table provides further details on the change in revenue this quarter in comparison to the 2010 fourth quarter from same-facility U.S. operations.
(US$ millions)
(8.6) – decrease in average skilled nursing center rates (decrease in Medicare $9.4 million and Managed Care $2.1 million, partially offset by an increase in Medicaid $2.6 million and private/other $0.3 million)
(4.2) – decrease in skilled nursing center resident census (Medicare $1.3 million, Managed Care $0.1 million, Medicaid $1.0 million and private/other $1.8 million)
0.9 – increase in prior period revenue settlement adjustments ($0.9 million in 2011 versus nil in 2010) 1.7 – increase in outpatient therapy, technology services and other revenue
(10.2)
The operating, administrative and lease costs of our U.S. operations increased by US$17.5 million to US$318.1 million this quarter in comparison to the 2010 fourth quarter of US$300.6 million. Non same-facility operations contributed US$0.6 million to the increase in costs between periods. Same-facility costs increased by US$16.9 million and included an US$11.2 million increase in prior years’ reserves for self-insured liabilities this quarter, higher labour-related costs of US$4.4 million, and other cost increases, net of the cost saving initiatives, of US$1.3 million. Total labour-related costs represented 67.4% of operating and administrative costs this quarter, compared to 69.5% in the 2010 fourth quarter, and as a percent of revenue were 62.3% and 59.3%, respectively.
EBITDA from U.S. operations declined by US$25.6 million to US$24.1 million in the 2011 fourth quarter from US$49.7 million in the 2010 fourth quarter, and represented 7.0% and 14.2% of revenue, respectively. Non same-facility operations contributed US$0.1 million to EBITDA this quarter compared to a loss of US$1.4 million in the 2010 fourth quarter, for a net contribution of US$1.5 million between periods. Excluding the increase this quarter in prior years’ reserves of US$11.2 million, same-facility operations declined by US$15.9 million, resulting from the decline in revenue of US$10.2 million and higher costs, net of cost saving initiatives, of US$5.7 million, as previously discussed.
CANADIAN CONTINUING OPERATIONS Q4 Change
(millions of dollars unless otherwise noted) 2011 2010 $ %
Revenue 181.5 174.3 7.2 4.1%Operating expenses 159.8 152.3 7.5 4.9%Administrative costs 5.5 5.7 (0.2) (3.5)%Lease costs 1.2 1.1 0.1 9.1%
EBITDA 15.0 15.2 (0.2) (1.3)%
EBITDA as a % of revenue 8.3% 8.7%

34 Extendicare Real Estate Investment Trust
Management’s Discussion and Analysis
Canadian Continuing Operations Compared to the 2010 Fourth Quarter
Revenue from Canadian operations grew by $7.2 million, or 4.1%, to $181.5 million in the 2011 fourth quarter from $174.3 million in the 2010 fourth quarter. Of this improvement, $5.8 million was derived from nursing home operations and included an increase of $5.0 million from non same-facility operations. Results were negatively impacted by prior period funding adjustments of $3.0 million (a reversal of $2.0 million this quarter compared to $1.0 million received in the 2010 fourth quarter). Consequently, growth in the 2011 fourth quarter from remaining same-facility nursing home operations was $3.8 million primarily due to funding enhancements. Revenue from home health care operations improved by $2.5 million this quarter primarily due to a 5.5% increase in volumes. Other revenue declined by $1.1 million primarily due to the completion of management contracts.
Operating, administrative and lease costs increased by $7.4 million to $166.5 million this quarter from $159.1 million in the 2010 fourth quarter, of which $3.0 million was from non same-facility operations. Costs from same-facility operations increased by $4.4 million in the 2011 fourth quarter primarily due to higher labour-related costs of approximately $4.3 million. Labour-related costs from total operations represented 82.3% of operating and administrative costs in the 2011 fourth quarter compared to 82.1% in the 2010 fourth quarter, and as a percent of revenue were 75.0% and 74.4%, respectively.
EBITDA from Canadian operations declined by $0.2 million to $15.0 million in the 2011 fourth quarter from $15.2 million in the 2010 fourth quarter and represented 8.3% and 8.7% of revenue, respectively. Non same-facility operations contributed EBITDA of $2.7 million this quarter compared to $0.7 million in the 2010 fourth quarter, for a net improvement of $2.0 million between periods. Same-facility operations declined by $2.2 million and was negatively impacted by prior period revenue adjustments of $3.0 million (a reversal of $2.0 million this quarter compared to $1.0 million received in the 2010 fourth quarter).
DEPRECIATION AND AMORTIZATION
Depreciation and amortization costs of $19.6 million in the 2011 fourth quarter were higher by $0.8 million from $18.8 million in the 2010 fourth quarter. Completed construction projects and capital maintenance expenditures, net of closed or disposed properties, contributed $0.7 million to the increase, with the remainder due to the weaker Canadian dollar between quarters.
LOSS (GAIN) FROM ASSET IMPAIRMENT, DISPOSALS AND OTHER ITEMS
The REIT recorded a pre-tax loss from asset impairment, disposals and other items of $8.7 million in the 2011 fourth quarter compared to a pre-tax gain of $1.4 million in the same 2010 period. The 2011 charge included $8.3 million of penalty fees on the early retirement of debt, primarily the Canadian CMHC mortgages that were refinanced in December. The remaining balance of $0.4 million related to advisor fees incurred in the quarter on the proposed plan to convert the REIT to a corporation. The gain of $1.4 million recorded in the 2010 fourth quarter primarily related to a $1.8 million gain on disposal of assets partially offset by refinancing fees of $0.4 million. For further information, refer to note 17 of the 2011 consolidated financial statements.
NET FINANCE COSTS
Net finance costs of $31.9 million in the 2011 fourth quarter were $22.6 million higher than the $9.3 million in the 2010 fourth quarter. This was primarily due to the $23.7 million change in the fair value adjustments of the convertible debt and Exchangeable LP Units, and the $1.4 million change in the loss (gain) on foreign exchange and financial instruments between periods. Distributions on the Exchangeable LP Units were lower by $0.5 million because the Exchangeable LP Units were fully redeemed in November 2011 for REIT Units. Net interest costs were lower by $2.0 million and included a charge of $1.2 million related to the amortization of deferred financing costs associated with the modification of the May 2012 CMBS Financing. Remaining net interest costs were lower by $3.2 million and benefited from reduced rates and debt levels, partially offset by the negative effect of a weaker Canadian dollar.

Management’s Discussion and Analysis
2011 Annual Report 35
The following table summarizes the components of net finance costs.
Q4 Change
(millions of dollars unless otherwise noted) 2011 2010 $ %
Interest, net Interest expense 20.4 22.5 (2.1) (9.3)%Interest income (0.6) (0.7) 0.1 (14.3)%
19.8 21.8 (2.0) (9.2)%
Accretion Accretion of decommissioning provisions 0.4 0.4 – –Other accretion 0.1 0.1 – –
0.5 0.5 – –
Exchangeable LP Unit distributions 0.2 0.7 (0.5) (71.4)%
Fair Value Adjustments and Loss (Gain) on Foreign Exchange and Financial Instruments Fair value adjustment on convertible debentures 10.8 (8.8) 19.6 (222.7)%Fair value adjustment on Exchangeable LP Units 0.6 (3.5) 4.1 (117.1)%Loss (gain) on foreign exchange and financial instruments – (1.4) 1.4 (100.0)%
11.4 (13.7) 25.1 (183.2)%
Net finance costs 31.9 9.3 22.6 243.0%
INCOME TAXES
The tax provision from continuing operations was a recovery of $0.9 million on a pre-tax loss of $20.1 million in the 2011 fourth quarter compared to a tax provision of $11.8 million on pre-tax earnings of $39.0 million in the 2010 fourth quarter. The effective tax rates for each period were distorted by, among other things, the fair value adjustments, gains and losses from financial instruments, foreign exchange, asset impairment, disposals, and other items. As well, the effective tax rate of the 2011 fourth quarter was impacted by the non-taxable adjustment to prior years’ reserves for self-insured liabilities of $11.4 million (US$11.2 million) this quarter. Excluding these items, the effective tax rate for the 2011 fourth quarter was 22.2% compared to 54.5% in the 2010 fourth quarter. The lower effective tax rate for the 2011 fourth quarter was primarily due to the proportion of income or losses among our taxable and non-taxable entities. As well, the fourth quarter results typically include book-to-file adjustments and adjustments to deferred taxes for changes in future tax rates. This contributed to the higher effective tax rate reported in the 2010 fourth quarter.
2011 Financial Review Selected Annual Information
Except for the 2009 results, the selected annual information has been prepared in accordance with IFRS. The selected information presented for 2009 was prepared under previous Canadian GAAP and has not been restated for discontinued operations identified in 2011 under IFRS. The major differences between Canadian GAAP and IFRS impact “distributions on Exchangeable LP Units”, “fair value adjustments” and “discontinued operations”. Refer to the discussion under the heading “Basis of Presentation”.
At the end of 2010, a significant portion of the REIT’s long-term debt was due to mature in 2011 and was therefore classified as part of current liabilities. During 2011, the majority of this debt was refinanced. Refer to the discussion under the heading “Overview – Significant 2011 Events and Developments – 2011 Refinancing Plan”.
A comparison between the 2011 and the 2010 results is provided in the following discussion “2011 Divisional Financial Review” and under the heading “Liquidity and Capital Resources”.

36 Extendicare Real Estate Investment Trust
Management’s Discussion and Analysis
The following is a summary of selected annual financial information.
(thousands of dollars unless otherwise noted) Years ended December 31 2011 2010 2009
Revenue 2,094,082 2,097,416 2,161,567
Operating expenses 1,813,792 1,771,168 1,810,978Administrative costs 69,155 72,630 72,818Lease costs 10,999 11,548 12,101
1,893,946 1,855,346 1,895,897
EBITDA 200,136 242,070 265,670Depreciation and amortization 76,577 73,769 66,032Loss (gain) from asset impairment, disposals, financing and other items 62,496 2,948 (219)
Results from operating activities 61,063 165,353 199,857
Interest, net 85,312 84,723 92,815Accretion 2,029 2,128 1,569Distributions on Exchangeable LP Units 2,179 2,702 –Fair value adjustments (6,023) 4,649 –Loss (gain) on foreign exchange and financial instruments (553) (3,280) (20,289)
Net finance costs 82,944 90,922 74,095
Earnings (loss) from continuing operations before income taxes (21,881) 74,431 125,762Income tax expense 13,442 37,527 45,603
Earnings (loss) from continuing operations (35,323) 36,904 80,159Discontinued operations 4,927 4,925 (2,451)
Net earnings (loss) (30,396) 41,829 77,708Add (Deduct): Fair value adjustment on convertible debentures, net of taxes 577 5,435 –Fair value adjustment on Exchangeable LP Units, net of taxes (6,600) (1,579) –Gain on foreign exchange and financial instruments, net of taxes (655) (4,804) (20,742)Loss (gain) from asset impairment, disposals and other items, net of taxes 46,808 720 (252)Distributions on Exchangeable LP Units, net of taxes 2,179 2,702 –Discontinued operations, net of taxes (4,927) (4,925) 2,451
Earnings from continuing operations before separately reported gains/losses and distributions on Exchangeable LP Units, net of taxes 6,986 39,378 59,165
Cash distributions per Unit ($) 0.8400 0.8400 0.8400Total assets (at year end) 1,830,704 1,994,634 1,668,065Long-term debt (at year end) 941,742 670,028 1,205,494Long-term debt including current portion (at year end) 1,134,440 1,241,196 1,234,032U.S./Canadian dollar exchange rate Average rate for the year 0.9891 1.0299 1.1420 Closing rate at year end 1.0170 0.9946 1.0510

Management’s Discussion and Analysis
2011 Annual Report 37
2011 Divisional Financial Review
The following is a summary by reporting segment of “revenue”, “EBITDA”, “net finance costs” and “net earnings”, and “earnings before separately reported gains/losses and distributions on Exchangeable LP Units”.
2011 2010
(millions of dollars unless otherwise noted) U.S. U.S. Canada Total U.S. U.S. Canada Total
(US$) (US$)
Revenue 1,411.1 1,395.8 698.3 2,094.1 1,392.8 1,434.5 662.9 2,097.4
Operating expenses 1,220.2 1,206.9 606.9 1,813.8 1,166.1 1,201.0 570.2 1,771.2Administrative costs 48.4 48.0 21.2 69.2 49.9 51.4 21.2 72.6Lease costs 6.7 6.5 4.5 11.0 7.0 7.2 4.3 11.5
1,275.3 1,261.4 632.6 1,894.0 1,223.0 1,259.6 595.7 1,855.3
EBITDA 135.8 134.4 65.7 200.1 169.8 174.9 67.2 242.1Depreciation and amortization 58.9 58.3 18.3 76.6 56.7 58.4 15.4 73.8Loss (gain) from asset impairment, disposals and other items 56.0 56.2 6.3 62.5 2.9 3.0 – 3.0
Results from operating activities 20.9 19.9 41.1 61.0 110.2 113.5 51.8 165.3
Interest, net 52.8 52.2 33.1 85.3 50.3 51.8 32.9 84.7Accretion 1.6 1.6 0.4 2.0 1.7 1.7 0.4 2.1Distributions on Exchangeable LP Units – – 2.2 2.2 – – 2.7 2.7Fair value adjustments – – (6.0) (6.0) – – 4.6 4.6Gain on foreign exchange and financial instruments (0.2) (0.3) (0.3) (0.6) (0.9) (0.9) (2.3) (3.2)
Net finance costs 54.2 53.5 29.4 82.9 51.1 52.6 38.3 90.9
Earnings (loss) from continuing operations before income taxes (33.3) (33.6) 11.7 (21.9) 59.1 60.9 13.5 74.4Income tax expense 11.1 10.8 2.6 13.4 29.1 30.0 7.5 37.5
Earnings (loss) from continuing operations (44.4) (44.4) 9.1 (35.3) 30.0 30.9 6.0 36.9Discontinued operations 5.0 4.9 – 4.9 4.8 4.9 – 4.9
Net earnings (loss) (39.4) (39.5) 9.1 (30.4) 34.8 35.8 6.0 41.8Add (Deduct): Fair value adjustment on convertible debentures, net of taxes – – 0.6 0.6 – – 5.4 5.4Fair value adjustment on Exchangeable LP Units, net of taxes – – (6.6) (6.6) – – (1.5) (1.5)Gain on foreign exchange and financial instruments, net of taxes (0.3) (0.4) (0.3) (0.7) (2.3) (2.4) (2.4) (4.8)Loss (gain) from asset impairment, disposals and other items, net of taxes 42.7 42.9 3.9 46.8 0.6 0.7 – 0.7Distributions on Exchangeable LP Units, net of taxes – – 2.2 2.2 – – 2.7 2.7Discontinued operations, net of taxes (5.0) (4.9) – (4.9) (4.8) (4.9) – (4.9)
Earnings from continuing operations before separately reported gains/losses and distributions on Exchangeable LP Units, net of taxes (2.0) (1.9) 8.9 7.0 28.3 29.2 10.2 39.4
Average U.S./Canadian dollar exchange rate 0.9891 1.0299

38 Extendicare Real Estate Investment Trust
Management’s Discussion and Analysis
The average exchange rates used to translate the results of the U.S. operations to Canadian dollars were 0.9891 for 2011, and 1.0299 for 2010. However, separately reported items such as fair value adjustments, gains or losses related to financial instruments, foreign exchange, asset impairment, disposals and other items, are translated at the rates of exchange in effect at the time of the transactions.
HIGHLIGHTS
• Revenue was $2,094.1 million in 2011, a 2.6% increase over 2010, excluding the adverse effect of foreign exchange.
• EBITDA was $200.1 million in 2011, a $36.5 million decline over 2010, excluding the adverse effect of foreign exchange. Excluding an increase in prior years’ reserves for self-insured liabilities, EBITDA declined by $5.8 million due to the 2011 CMS Final Rule, with a margin of 11.6% this year compared to 12.2% in 2010.
• AFFO was $69.8 million ($0.837 per basic unit) in 2011 compared to $110.7 million ($1.358 per basic unit) in 2010. Excluding the adjustment to prior years’ reserves, AFFO was $112.6 million ($1.350 per basic unit) this year and $124.7 million ($1.530 per basic unit) in 2010.
• Distributions in 2011 totalled $70.1 million, or $0.84 per unit, representing 100% of AFFO for the same period.
CONSOLIDATED CONTINUING OPERATIONS
Consolidated revenue from continuing operations declined by $3.3 million to $2,094.1 million in 2011 from $2,097.4 million in 2010. Non same-facility operations contributed $60.2 million to revenue this year and $55.0 million in 2010, representing an increase of $5.2 million between years. Exclusive of the negative effect of $56.9 million from the stronger Canadian dollar, growth from same-facility operations of $48.4 million, or 2.4%, benefited from funding improvements, partially offset by the negative effect of the 2011 CMS Final Rule, lower U.S. census levels and prior period revenue. We estimate that the adverse effect of the 2011 CMS Final Rule on our 2011 fourth quarter revenue was approximately $14.8 million (US$15.0 million). Details by segmented operations are discussed below.
Consolidated EBITDA from continuing operations declined by $42.0 million to $200.1 million in 2011 from $242.1 million in 2010, and was 9.6% and 11.5% of revenue, respectively. Non same-facility operations contributed $7.8 million to EBITDA in 2011 compared to $2.8 million in 2010, representing an improvement of $5.0 million between years. Same-facility results were negatively affected by $5.5 million due to the stronger Canadian dollar and a $30.7 million increase in reserves for prior years’ self-insured liabilities (US$43.3 million this year compared to US$13.5 million in 2010). EBITDA from remaining same-facility operations declined by $10.8 million, with revenue improvements of $48.4 million offset by higher costs of $59.2 million. Details by segmented operations are discussed below.
Consolidated labour-related costs represented 72.8% and 73.6% of operating and administrative costs in 2011 and 2010, respectively, and were 65.4% and 64.7% of revenue, respectively.
U.S. CONTINUING OPERATIONS
Revenue from U.S. operations grew by 1.3% in its functional currency to US$1,411.1 million in 2011 compared to US$1,392.8 million in 2010, representing an increase of US$18.3 million. Non same-facility revenue was US$17.5 million this year compared to US$32.3 million in 2010, representing a decline of US$14.8 million. Revenue from same-facility operations improved by US$33.1 million primarily due to the contribution from higher average nursing center rates of US$42.5 million, partially offset by lower census levels. Higher average rates reflected the October 2010 changes in Medicare funding for the implementation of MDS 3.0 and RUG-IV, inflationary increases, as well as higher average acuity levels of residents served, partially offset by the 2011 CMS Final Rule implemented on October 1, 2011. We estimate that the adverse effect of the 2011 CMS Final Rule on our 2011 fourth quarter revenue was approximately US$15 million. More information on revenue rates and census is provided under “Key Performance Indicators – U.S. Operations”.

Management’s Discussion and Analysis
2011 Annual Report 39
The following table provides further details on the change in revenue during 2011 in comparison to 2010 from same-facility U.S. operations.
(US$ millions)
42.5 – increase in average skilled nursing center rates (Medicare $28.6 million, Managed Care $5.4 million, Medicaid $7.9 million, and private/other $0.6 million)
(13.6) – decrease in skilled nursing center resident census (decrease in Medicare $1.8 million, Medicaid $7.3 million, and private/other $7.2 million, partially offset by an increase in Managed Care $2.7 million)
(0.5) – decrease in prior period revenue settlement adjustments ($4.5 million in 2011 versus $5.0 million in 2010) 4.7 – increase in technology services, outpatient therapy and other revenue
33.1
The operating, administrative and lease costs of our U.S. operations increased by US$52.3 million to US$1,275.3 million in 2011 from US$1,223.0 million in 2010. Non same-facility operations resulted in a decline in costs of US$16.5 million between years. Same-facility costs increased by US$68.8 million primarily due to the increase in prior years’ reserves for self-insured liabilities of US$29.8 million (US$43.3 million in 2011 compared to US$13.5 million in 2010), higher labour-related costs of US$25.3 million and other cost increases, net of cost saving measures, of US$13.7 million. The increase in labour costs of US$25.3 million was primarily due to higher staffing levels and a 0.7% average wage increase in nursing home operations. As well, payroll taxes were higher by US$4.5 million between years and we incurred severance charges of US$1.2 million, while the provision for UARs was lower at US$0.1 million this year compared to a charge of US$0.5 million last year. Total labour-related costs represented 67.4% of operating and administrative costs in 2011, compared to 69.0% in 2010, and represented 60.6% and 60.3% of revenue, respectively. The other cost increases of US$13.7 million included higher state provider taxes of US$4.2 million that were implemented with increases in Medicaid revenue rates, along with increases in food, supplies, recruitment costs, utilities and travel.
EBITDA from U.S. operations declined by US$34.0 million to US$135.8 million in 2011 from US$169.8 million in 2010, and was 9.6% and 12.2% of revenue, respectively. Non same-facility operations contributed US$1.2 million to EBITDA this year compared to a loss of US$0.5 million in 2010, for an improvement of US$1.7 million between years. Excluding the increase of US$29.8 million in prior years’ reserves between years, EBITDA from same-facility operations declined by US$5.9 million, resulting from higher revenue of US$33.1 million offset by an increase in costs of US$39.0 million, as previously discussed. In addition to the impact of the 2011 CMS Final Rule, the lack of net Medicaid funding increases in 2010 and 2011 that would normally offset our wage rate and non-wage inflationary increases has contributed to compression of our U.S. operating margin.
CANADIAN CONTINUING OPERATIONS
Revenue from Canadian operations grew by $35.4 million, or 5.3%, to $698.3 million in 2011 from $662.9 million in 2010. Of this improvement, $30.3 million was derived from nursing home operations and included an increase of $21.2 million from non same-facility operations. Growth from same-facility nursing home operations of $9.1 million was primarily due to funding enhancements, partially offset by unfavourable prior period funding adjustments of $1.5 million (a $2.0 million revenue reversal in 2011 compared to $0.5 million received in the 2010 period). Revenue from home health care operations improved by $7.8 million in 2011 due to a 5.3% increase in volumes and higher rates, partially offset by lower retroactive funding (nil this period compared to $2.1 million received in the 2010 period). Other revenue declined by $2.7 million primarily due to the completion of management contracts.
Operating, administrative and lease costs increased by $36.9 million to $632.6 million in 2011 from $595.7 million in 2010, of which $17.8 million was from non same-facility operations and $1.7 million was due to adjustment to prior period accruals that reduced costs in 2010. Remaining costs from same-facility operations increased by $17.4 million primarily due to higher labour-related costs, which included a lower provision for UARs of $0.2 million ($0.2 million this year compared to $0.4 million in 2010). Total labour-related costs represented 83.5% of operating and administrative costs in 2011 and 83.2% in 2010, and represented 75.1% and 74.2% of revenue, respectively.
EBITDA from Canadian operations was $65.7 million in 2011 compared to $67.2 million in 2010, and represented 9.4% and 10.1% of revenue, respectively. Excluding the adverse impact of $6.3 million of prior period adjustments (unfavourable $2.0 million this year compared to a favourable $4.3 million recorded in 2010), EBITDA improved by $4.8 million, and represented 9.7% of revenue this year compared to 9.5% in 2010. Non same-facility operations contributed EBITDA of $6.6 million this year compared to $3.2 million in 2010, for a net improvement of $3.4 million

40 Extendicare Real Estate Investment Trust
Management’s Discussion and Analysis
between years. Excluding prior period adjustments, EBITDA from same-facility operations improved by $1.4 million reflecting higher revenue of $18.8 million partially offset by higher operating and administrative costs of $17.4 million. This resulted primarily from improvements in nursing home and home health care operations partially offset by a lower contribution from managed operations of approximately $1.6 million, as previously discussed.
DEPRECIATION AND AMORTIZATION
Depreciation and amortization costs of $76.6 million in 2011 were higher by $2.8 million from $73.8 million in 2010. Completed construction projects and capital maintenance expenditures, net of closed or disposed properties, contributed $5.2 million to the increase, partially offset by a $2.4 million favourable effect of the stronger Canadian dollar.
LOSS (GAIN) FROM ASSET IMPAIRMENT, DISPOSALS AND OTHER ITEMS
The REIT recorded a pre-tax loss from asset impairment, disposals and other items of $62.5 million in 2011 compared to $2.9 million in 2010. The 2011 charge included a non-cash impairment charge of $54.0 million (after-tax $41.5 million) in connection with the revaluation of our U.S. property and goodwill, resulting from the Medicare funding and therapy changes that took effect October 1, 2011. The portion related to non-taxable goodwill was $22.4 million. As well, we incurred fees of $11.0 million in 2011 on the early retirement of debt. The remaining balance, a gain of $2.5 million, included a $2.4 million release of excess provisions on the settlement of claims, a $0.5 million gain on disposal, net of other charges of $0.4 million. The 2010 loss of $2.9 million related to a $1.2 million asset impairment charge, a $1.0 million lease termination fee and other charges of $0.7 million. For further information, refer to note 17 of the 2011 consolidated financial statements.
NET FINANCE COSTS Change
(millions of dollars unless otherwise noted) 2011 2010 $ %
Interest, net Interest expense 89.6 88.9 0.7 0.8%Interest income (4.3) (4.2) (0.1) 2.4%
85.3 84.7 0.6 0.7%
Accretion Accretion of decommissioning provisions 1.6 1.6 – –Other accretion 0.4 0.5 (0.1) (20.0)%
2.0 2.1 (0.1) (4.8)%
Exchangeable LP Unit distributions 2.2 2.7 (0.5) (18.5)%
Fair Value Adjustments and Gain on Foreign Exchange and Financial Instruments Fair value adjustment on convertible debentures 0.6 6.2 (5.6) (90.3)%Fair value adjustment on Exchangeable LP Units (6.6) (1.6) (5.0) 312.5%Gain on foreign exchange and financial instruments (0.6) (3.2) 2.6 (81.3)%
(6.6) 1.4 (8.0) (571.4)%
Net finance costs 82.9 90.9 (8.0) (8.8)%
Net finance costs were lower by $8.0 million at $82.9 million in 2011 compared to $90.9 million in 2010. This was primarily due to the $10.6 million change in the fair value adjustments of the convertible debt and Exchangeable LP Units, partially offset by the $2.6 million change in the gain on foreign exchange and financial instruments between periods. Distributions on the Exchangeable LP Units were lower by $0.5 million because the Exchangeable LP Units were fully redeemed in November 2011 for REIT Units. Net interest costs were higher by $0.6 million and included a charge of $4.8 million related to the amortization of deferred financing costs associated with the modification of the May 2012 CMBS Financing. Remaining net interest costs were lower by $4.2 million and benefited from reduced rates and debt levels and the favourable effect of the stronger Canadian dollar of $2.2 million.


Management’s Discussion and Analysis
2011 Annual Report 43
Another reason for the decline in census has been the concerted effort by state Medicaid programs to shift potential residents to home care programs and assisted living centers along with Managed Care programs constraining the period of coverage in skilled nursing centers in order to reduce costs to the Medicaid program.
In response to the decline in short-term admissions in the U.S., we have refocused and refined our strategic marketing plans, are working on strategic alliances within the marketplaces in which we operate, and have invested to improve the number of rehabilitation suites within our portfolio to increase our market share in communities where we anticipate returns on our investments that meet our criteria. Included in these initiatives are the establishment of Active Life Transition Units (ALTUs) that are upgraded suites targeted to attract our short-term rehab residents. We currently have 11 ALTUs and plan to continue to expand the number of centers with ALTUs within certain of our centers.
Development Projects
COMPLETED PROJECTS (2010 AND 2011)
The following table summarizes the construction projects completed during 2010 and 2011. The two Alberta projects were completed at a cost of $55.0 million, net of government grants. The two U.S. projects are owned by third-parties, and are operated by EHSI under 10-year lease arrangements.
No. of Operational Completed Projects (2010 and 2011) Date Opened for Admissions Centers Beds/Units
Canada – Owned Centers Continuing care center, Red Deer, Alberta Sept./10; Feb./11 (1) 1 280Designated assisted living center, Lethbridge, Alberta Jan./11 (2) 1 140Nursing Center, Edmonton, Alberta Nov./11 (3) 1 180U.S. – Leased Centers Skilled nursing center, South Bend, Indiana Nov./10 1 100Skilled nursing center, Lansing, Michigan Jan./11 1 120
5 820
(1) The Red Deer center consists of 220 long-term care beds that opened for admissions in September 2010, and an attached designated assisted living wing (60 units) opened for admissions in February 2011.
(2) The new Lethbridge center was completed in December 2010 and opened in January 2011. Our existing Lethbridge center closed upon the opening of the new center, and had been transitioned down to 62 beds at the end of 2010 (from 120 beds) in anticipation of its closure in January 2011.
(3) The new Edmonton center was completed in October 2011 and opened in November 2011. Residents from our existing Edmonton center (122 beds) that closed and 9 beds from another one of our centers were transferred to the new center.
PROJECTS UNDER DEVELOPMENT
The following table depicts the status of the development projects in progress in Ontario, Canada. Two of our existing nursing centers in the region will close upon completion of the new centers. Further details of these projects are provided below.
Existing Owned New Centers Centers to Close
Estimated No. of No. of Development Projects (as at December 31, 2011) Completion Date Centers Beds/Units Centers Beds/Units
Canada – Owned Long-term Care Centers Sault Ste. Marie, Ontario (1) Q1/13 1 256 (1) (161)Timmins, Ontario Q2/13 1 180 (1) (119)
2 436 (2) (280)
(1) In addition to closing and transferring 161 beds from the owned nursing center that ECI operates in Sault Ste. Marie to the new center when it opens, ECI will also transfer 95 beds from a leased center that it operates in the region.

44 Extendicare Real Estate Investment Trust
Management’s Discussion and Analysis
Owned Centers Completed and/or under Development in 2011
The new 180-bed long-term care center in Edmonton, Alberta was completed in October and began admitting residents in November 2011. The cost of the Edmonton project was approximately $19.5 million, net of government grants. Residents from ECI’s existing nursing center in Edmonton (113 operational beds) that closed and nine beds from another one of our nursing centers were transferred to the new center. ECI is in the process of seeking a purchaser for its closed Edmonton property.
Also in Alberta, ECI completed construction of a designated assisted living center in Lethbridge, Alberta, in December 2010, and began admitting residents in January 2011 (140 units). An existing nursing center in the region (120 beds) was closed and sold following the opening of the new center.
The combined annual EBITDA of the two new centers in Alberta (Lethbridge and Edmonton), once fully operational, is expected to exceed $5.0 million. The combined annual EBITDA of the two centers that closed was approximately $2.7 million in 2009 (when they were fully operational).
Ontario Redevelopment Projects � 2010 Awarded
As part of the Government of Ontario’s initiative to redevelop 35,000 long-term care beds over the next 10 to 15 years (refer to discussion under the heading “Update of Regulatory and Reimbursement Changes Affecting Revenue – Canada – Ontario Long-term Care Legislation”), ECI received approval to redevelop 280 of its class “C” beds in the cities of Timmins and Sault Ste. Marie and, in connection with this award, we will add a further 156 long-term care beds. ECI began construction in the spring of 2011 and expects to complete a new 180-bed nursing center in Timmins and a new 256-bed nursing center in Sault Ste. Marie by the end of the 2013 first quarter. ECI currently owns and operates three nursing centers with 387 class “C” beds in these areas. Following completion of the new projects, ECI will own and operate 436 beds in two new centers and 107 class “C” beds in an existing center to be considered for redevelopment at a later date. The additional 156 long-term care beds that were awarded included 95 beds at a nursing center in Sault Ste. Marie that ECI previously managed for a third party, and which ECI now operates under a lease arrangement. The 95 beds from this leased center will move to the new center when it’s completed.
The cost of the two Ontario projects is estimated to be $80 million, of which $2.5 million had been spent to December 31, 2011. Conventional financing for approximately 88% of the total estimated cost for the two projects was secured at the end of October 2011. In addition, we will receive capital funding from the government of approximately $2.0 million annually over a 25-year period. The combined annual EBITDA of the three existing owned centers (387 beds) for 2011 was approximately $2.8 million. It is anticipated that upon completion of the projects the incremental EBITDA for the three centers (536 beds) will be approximately $2.0 million, excluding the capital funding for the two new centers (436 beds).
Financing Activity
For details on the refinancing of a significant portion of the REIT’s U.S. and Canadian long-term debt, refer to the discussion under the heading “Overview – Significant 2011 Events and Developments – 2011 Refinancing Plan”.
CANADA
2011 Mortgage Activity � Development Projects
In October 2011, ECI secured conventional long-term financing on its Sault Ste. Marie and Timmins projects in Ontario for up to $41.4 million and $28.6 million, respectively. The first two years of the loans is for construction with interest-only payments, following which the loans will be amortized over 25 years. Both loans contain fixed rates for the full 27-year term of 5.637% and 5.558%, respectively, and a requirement to maintain a debt service coverage ratio of 1.2 to 1.
In January 2012, ECI executed a 10-year $17.4 million CMHC-insured mortgage agreement at a fixed rate of 3.81%, with payments amortized over 30 years, on its new Edmonton nursing center, to replace a construction loan.
Public Offering of REIT Units � February 2010
On February 4, 2010, Extendicare REIT completed a public equity offering of 9,228,750 REIT Units, including the exercise in full of an over-allotment option of 1,203,750 REIT Units, at a price of $9.35 per unit for aggregate gross proceeds of $86.3 million ($82.2 million net of underwriters’ fees and offering expenses, before income taxes). The net proceeds of the offering increased the REIT’s liquidity and balance sheet flexibility, and were used to repay indebtedness, fund redevelopment of the REIT’s existing properties, and for general trust purposes.

Management’s Discussion and Analysis
2011 Annual Report 45
2010 Mortgage Activity
In September 2010, ECI executed a 10-year $28.7 million CMHC-insured mortgage agreement at a fixed rate of 4.57%, with monthly payments amortized over 30 years, for the Red Deer project, to replace a construction loan.
UNITED STATES
Sovereign Loans � June 2011
On June 1, 2011, EHSI paid off the remaining balance of its Sovereign Loans of US$43.0 million using borrowings under the EHSI Credit Facility that were subsequently repaid upon closing of the first phase of the HUD loans at the end of June.
In May 2011, EHSI repaid US$1.7 million of the Sovereign Loans relating to the sale of the Saginaw, Michigan, nursing center.
EHSI Credit Facility � March 2011
In March 2011, EHSI obtained approval from all of the lenders of the EHSI Credit Facility to extend the term from June 2011 to June 2012 with no change in the financial terms of the US$70.0 million loan. The amount available to be borrowed under the EHSI Credit Facility is the lesser of: (i) 60% of the appraised values of the skilled nursing centers collateralizing the EHSI Credit Facility; or (ii) an amount based on the actual net cash flow of these centers for the last 12 months. At EHSI’s option, the interest rate is either the eurodollar rate, with a floor set at 2%, plus a margin from 4% to 4.75%, or the U.S. prime rate plus a margin from 3% to 3.75%, with the specific margin based on EHSI’s consolidated leverage ratio as defined in the EHSI Credit Facility. The interest rate at December 31, 2011 was 6.43% (December 31, 2010 – 6%).
EHSI is currently in the process of renewing the EHSI Credit Facility prior to its June 2012 maturity date.
PrivateBank Mortgage Loans due 2013 � November 2010
On November 30, 2010, EHSI secured a non-recourse term loan for up to US$35.0 million on six skilled nursing centers and one assisted living center located in Minnesota, Wisconsin and Michigan, with the PrivateBank (the “PrivateBank Loans”). On closing, EHSI drew US$25.0 million of the term loan and in March 2011 drew the remaining US$10.0 million. The resulting mortgages on the seven centers are cross-collateralized with each center. The PrivateBank Loans have a three-year term that matures on November 30, 2013. The loans are repaid with monthly principal payments based on a 25-year amortization period. Under the mortgage agreement, the combined operations are required to maintain a minimum consolidated fixed charge coverage ratio and debt service coverage ratio. At EHSI’s option, the interest rate is equal to: (i) LIBOR, subject to a LIBOR floor set at 2%, plus a margin of 4%, or (ii) the U.S. prime rate, subject to a floor of 6%. The interest rate at December 31, 2011 was 6% (December 31, 2010 – 6%). EHSI has the option to prepay the balance in whole or in part subject to a prepayment fee of 2% for the first two years of the agreement and 1% during the final year, with no prepayment fee during the last six months of the agreement.
Divestitures and Assets Held for Sale
Extendicare REIT continually assesses the performance of its asset portfolio, and for those assets that fail to meet operating and financial standards, a decision may be made to dispose of the asset. Assets to be disposed of are recorded at the lower of the carrying value or estimated fair value net of disposal costs.
Prior to the adoption of IFRS, earnings and associated taxes derived from both divested operations and operations that have been classified for disposition were reported separately within the consolidated statements of earnings as discontinued operations. However, the definition of discontinued operations under IFRS is narrower, and requires that the classification to discontinued operations be limited to a component that represents a major line of business or geographical area of operations. Consequently, with the adoption of IFRS, results previously reported as discontinued operations in 2010 have been reclassified as part of continuing operations. The REIT’s financial results prior to 2010 have not been restated under IFRS and therefore, still reflect the classification for discontinued operations as reported at the end of 2010 under previous Canadian GAAP. As well, the results presented prior to 2010 under previous Canadian GAAP have not been restated for operations identified as discontinued under IFRS in 2011. During 2011, the REIT classified its U.S. group purchasing operations as discontinued operations as a result of its pending sale in January 2012, as discussed further below.

46 Extendicare Real Estate Investment Trust
Management’s Discussion and Analysis
The following table reflects the owned centers that have been disposed of during 2011 and 2010. In addition, during 2010, EHSI ceased operating two leased Ohio skilled nursing centers (235 beds) following their transfer to new operators in the 2010 second quarter.
2011 2010
Net Net No. of Month Proceeds No. of Month Proceeds Disposed Owned Centers Centers Beds/Units Sold (millions) Centers Beds/Units Sold (millions)
Canadian Operations Alberta (closed nursing center) 1 − June $1.0
U.S. Operations Michigan – SNFs 1 92 May 4 456 August Ohio – SNF − − − 1 100 April Pennsylvania – SNF − − − 1 107 April
1 92 US$3.9 6 663 US$20.3
In May 2011, EHSI completed the sale of the Saginaw, Michigan, skilled nursing center for net proceeds of $3.8 million (US$3.9 million) that resulted in a pre-tax gain of $0.3 million (US$0.3 million).
In June 2011, ECI completed the sale of its closed nursing center in Lethbridge, Alberta, for net proceeds of $1.0 million that resulted in a pre-tax gain of $0.2 million in the 2011 second quarter. During the 2011 first quarter, a charge of $0.6 million was recorded related to the prepayment penalty on the mortgage for this property when the center was closed.
In December 2011, EHSI reached an agreement in principle to sell its group purchasing organization, or GPO, to Navigator Group Purchasing, a subsidiary of Managed Health Care Associates, Inc., resulting in the reclassification of our U.S. GPO operations to discontinued operations. The transaction was finalized and closed in January 2012, for cash proceeds of US$56.0 million, and will result in an after-tax gain of approximately US$33 million in the 2012 first quarter.
As at December 31, 2011, the REIT had assets held for sale with a net book value of $3.4 million consisting of a closed nursing center in Alberta, a closed nursing center in Washington and the U.S. group purchasing operations.
Legal Proceedings and Regulatory Actions
The REIT and its consolidated subsidiaries are defendants in actions brought against them from time to time in connection with their operations. Recently adopted U.S. health care reform legislation is calling for more government oversight of the long-term care industry and operators are experiencing an increase in government investigations, audits and scrutiny of their operations. It is not possible to predict the ultimate outcome of the various proceedings at this time or to estimate additional costs that may result. However, based on current knowledge, management does not believe that liabilities, if any, arising from pending litigation will have a material adverse effect on the consolidated financial position, or results of operations of the REIT.
As previously disclosed, EHSI has received subpoenas from the U.S. Department of Health and Human Services (DHHS), Office of the Inspector General (OIG), relating to the possible submission of claims that may be in violation of the U.S. Social Security Act and to the provision of rehabilitation services. EHSI and its subsidiaries believe that they are in material compliance with the requirements imposed on them by the U.S. Social Security Act, and intend to furnish all requested information and to cooperate with the OIG in its investigations. The DHHS, OIG, CMS and other federal, state and provincial enforcement agencies may conduct additional investigations related to our business in the future that may, individually or in the aggregate, have a material adverse effect on the business or financial condition of the REIT.
The provision of health care services is subject to complex laws and regulations at the federal, state and provincial government levels, including laws that are intended to prevent health care fraud and abuse. On an ongoing basis, long-term care providers are subject to surveys, inspections, audits and investigations by various government authorities to ensure compliance with applicable laws and licensure requirements. In such circumstances, the REIT cooperates in responding to information requests and takes the necessary corrective actions and, where appropriate, estimates costs that may result from such investigations to the extent such costs are predictable or determinable.

Management’s Discussion and Analysis
2011 Annual Report 47
Canadian and U.S. Income Tax Updates
CANADIAN FEDERAL INCOME TAX ON INCOME TRUSTS
On October 31, 2006, the day before Extendicare was initially scheduled to complete the Arrangement, the Minister of Finance (Canada) (the “Finance Minister”) announced proposals to amend the Tax Act to alter the taxation regime applicable to certain publicly traded entities that are specified investment flow-through trusts or partnerships, or “SIFTs”, and their investors (the “SIFT Rules”). The SIFT Rules were subsequently enacted by Bill C-52, the Budget Implementation Act, 2007, which received Royal Assent on June 22, 2007. Because Extendicare completed the Arrangement on November 10, 2006, Extendicare REIT has been subject to the SIFT Rules since its formation. Furthermore, Extendicare REIT was not eligible for transitional relief from the SIFT tax through 2010 and due to the nature of its income and investments, did not qualify for the exemption from the SIFT Rules applicable to “real estate investment trusts” (as defined in the SIFT Rules). As a result, Extendicare REIT has been subject to the SIFT tax since January 1, 2007.
Bill C-10, which received Royal Assent on March 12, 2009, included certain amendments to the SIFT Rules (the “SIFT Amendments”), including revisions to the definitions of “SIFT trust” and “SIFT partnership” to specifically exclude certain trusts and partnerships that are wholly owned by a SIFT, with effect from October 31, 2006. The SIFT Amendments do not change the status of Extendicare REIT as a SIFT, although they confirm that Extendicare Trust, which is wholly owned by Extendicare REIT, is not a SIFT. Management has assessed the impact of the SIFT Amendments on Extendicare LP and has concluded that Extendicare LP should not be treated as a SIFT, but there can be no assurance that this will be the case.
New rules contained in the SIFT Amendments also facilitate the conversion of SIFT trusts into corporations, either through the distribution by a SIFT trust of shares of a taxable Canadian corporation to its unitholders or by the transfer of units of a SIFT trust to a taxable Canadian corporation, followed by a winding up of the SIFT trust. The automatic tax-deferred rollover treatment applies to transactions that occur before 2013.
In view of, among other things, the Conversion Rules that expire on December 31, 2012, the Board will be seeking Unitholder approval for the conversion of the REIT to a corporate structure at a Special Meeting to be held in conjunction with its next annual meeting in May 2012. For further information on the Conversion, refer to the discussion under the heading “Overview – Significant 2011 Events and Developments – Proposed Corporate Conversion”.
U.S. FEDERAL INCOME TAX ON REITS
On July 30, 2008, the U.S. Housing and Economic Recovery Act of 2008 was signed into law containing certain revisions to the REIT Investment Diversification and Employment Act (the “RIDEA”) that provide, among other things, greater structural and operating flexibility to U.S. health care REITs. The RIDEA permits U.S. health care REITs to use taxable REIT subsidiaries (TRSs) in the same manner as lodging REITs. A TRS will continue to be required to use an independent contractor to manage or operate health care centers, but payments collected by a REIT from its TRS in connection with renting health care centers will now be treated as qualified income under the REIT tests.
ALC SPIN-OFF
The Arrangement included the distribution of Assisted Living Concepts, Inc. (ALC) to Extendicare’s shareholders and a number of pre-Arrangement transactions. As part of the spin-off of ALC in 2006 to Extendicare’s shareholders, EHSI and ALC entered into a tax allocation agreement dated as of November 10, 2006 (the “Tax Allocation Agreement”).
In 2009, ALC asserted a claim against EHSI under the Tax Allocation Agreement relating to additional depreciation deductions allowed by the U.S. Internal Revenue Service for years 2005 and 2006 relating to limitations computed under Section 382 of the Code. In December 2010, the parties agreed to settle this matter along with all past and future differences arising from the Tax Allocation Agreement for US$0.8 million (US$0.5 million after tax). This settlement was charged directly to retained earnings since the spin-off of ALC was accounted for as a capital transaction in 2006.
In connection with the Arrangement, EHSI received a note upon the transfer of ALC to its Canadian affiliate, which was subsequently repaid by way of cash, settlement against other notes and dividends of US$476.6 million. Based upon internal calculations, management believes there was sufficient surplus as to not attract any Canadian taxes from the transactions relating to the repayment of the note. The REIT and its Canadian subsidiaries are currently under audit by the CRA. Should the CRA determine that the available surplus was less than the amount determined by management, Canadian capital gains tax would apply to the shortfall.
48 Extendicare Real Estate Investment Trust
Management’s Discussion and Analysis
Update of Regulatory and Reimbursement Changes Affecting RevenueWe operate in a competitive marketplace and depend substantially on revenue derived from government sources, with the remaining revenue derived from commercial insurers, managed care plans and private individuals. Ongoing pressures from government programs, along with other health care payors seeking to control costs and/or limit reimbursement rates for medical services, are a risk to us. Government agencies have steadily increased their enforcement activity over the past several years. As a result, in addition to increasing resources to improve the quality of services provided to our residents, we are continually allocating increased resources to ensure compliance with applicable regulations and to respond to inspections, investigations and/or enforcement actions. Our costs to respond to and/or defend surveys, inspections, audits and investigations are significant and are likely to increase in the current environment.
Non-compliance with applicable laws and licensure requirements governing long-term care could result in adverse consequences, including severe penalties, which may include criminal sanctions and fines, civil monetary penalties and other sanctions, including the loss of our right to participate in the Medicare and Medicaid programs, or one or more third-party payor networks. We may be required to refund amounts that have been paid to us by federal, state and/or provincial funding programs. These penalties could have a material adverse effect on the business, results of operations or financial condition of the REIT.
United States
The majority of the REIT’s operations are in the United States where 66.7% of its revenue from continuing operations was earned in 2011 (2010 year – 68.4%). EHSI receives payment for its services and products from the federal (Medicare) and state (Medicaid) medical assistance programs, Managed Care organizations (including HMO and preferred provider organizations), commercial insurers, the Department of Veterans Affairs, as well as from private payors. During 2011, approximately 53% of our U.S. resident admissions were Medicare funded and approximately 29% were Managed Care funded.
MEDICARE FUNDING
Market Basket Annual Increases
Changes in Medicare funding levels typically occur on October 1st of each year to coincide with the federal government’s fiscal year, and generally represent an inflationary increase for the Medicare Part A funding, otherwise referred to as a “market basket” increase. In addition, Medicare increases are also periodically adjusted for “forecasting errors” that are identified by CMS based upon filed cost reports.
The net market basket increases on October 1, 2011 and 2010 were both 1.7%. Changes to the Medicare Part A rates for fiscal 2012, effective October 1, 2011, included a market basket update of 2.7% minus a productivity adjustment of approximately 1.0%. For fiscal 2011, effective October 1, 2010, the net 1.7% increase represented a 2.3% market basket increase, less a 0.6% forecasting error adjustment. We estimated that this net rate increase of 1.7% would increase our annual Medicare revenue of approximately US$6.8 million. These market basket increases were prior to the impact of the implementation of MDS 3.0 and RUGs-IV in October 1, 2010, and the 2011 CMS Final Rule implemented on October 1, 2011, that included a parity adjustment, the elimination of group therapy and changes in the assessment process, as discussed below.
Medicare Reimbursement Changes Effective October 1, 2011
The implementation of the RUG-IV rate set and MDS 3.0 by CMS in October 2010 was intended to be budget neutral. The post-implementation review completed by CMS determined that the majority of operators, including EHSI, realized increased Medicare reimbursement beyond the intended 1.7%. EHSI realized a net increase in its average Medicare Part A rates of 12.7% for the first nine months of 2011 over the same 2010 period.
In response to this, the 2011 CMS Final Rule includes a parity adjustment of 12.6% along with changes in the assessment process and the elimination of payment for group therapy. More specifically, the 2011 CMS Final Rule included, among other things, the following changes effective October 1, 2011:
• a parity adjustment of an estimated aggregate reduction of 11.1% (a 12.6% recalibration of the CMI, partially offset by a market basket increase net of a productivity adjustment);
• changes to group therapy, which will be defined to be four patients who are simultaneously performing similar activities, and minutes will be allocated;
• implementation of Change of Therapy Medicare-required assessments, or “OMRAs”, whenever a patient’s RUG-IV classification changes;

Management’s Discussion and Analysis
2011 Annual Report 49
• clarification that End of Therapy (EOT) OMRAs must be completed following three consecutive calendar days without therapy services;
• implementation of the EOT-Resumption of therapy (EOT-R) OMRAs, in place of a Start-of-Therapy OMRAs, in cases where the resumption of therapy is no more than five consecutive calendar days after the last day of therapy provided, and there has been no change in the RUG-IV classification; and
• implementation of a new assessment to be completed every seven calendar days to update current therapy provided, regardless of whether there has been a significant change in condition.
Following the implementation of the 2011 CMS Final Rule, EHSI’s 2011 fourth quarter average Medicare Part A rates declined by 11.0% to US$463.89 from US$521.24 in the 2011 third quarter. Also, EHSI’s 2011 fourth quarter average Managed Care rates declined by 7.0% to US$425.80 from US$457.71 in the 2011 third quarter. This decline in rates represented lower revenue in the 2011 fourth quarter of approximately US$15 million. This revenue reduction was not as much as our initial estimate of the negative effect of US$70 million to US$80 million on an annualized basis, due to the transitional rules provided for in the changeover to the new assessment process that minimized the full impact of the changes in the 2011 fourth quarter. Though we continue to assess the impact of the changes, our revised estimate of the negative effect on our revenue and EBITDA, prior to our cost saving measures, is in the range of US$64 million to US$74 million. We have taken measures to help mitigate the adverse effect of the elimination of group therapy and the assessment process changes, such as employing more therapists and improving productivity.
To mitigate as much of this adverse impact as possible, we completed a thorough review of our operations and implemented a plan to drive efficiencies and reduce costs wherever possible. These savings are anticipated to reduce the general, administrative and non-wage operating costs of EHSI by an estimated US$24 million on an annualized basis. Approximately two-thirds of these savings were in effect as of October 1, 2011, with the balance fully implemented as of January 1, 2012. None of these cost saving measures involved a reduction of direct care staffing at our centers. Consequently, based upon our revised estimate of the impact of the 2011 CMS Final Rule, we anticipate the negative effect on our EBITDA to be in the range of US$40 million to US$50 million.
MDS 3.0/RUG-IV Medicare Reimbursement Change Effective October 1, 2010
On October 1, 2010, CMS implemented MDS 3.0, a revised resident assessment tool, and RUG-IV, a revised case-mix classification methodology and implementation schedule, which among other things, increased the RUGs categories from 53 to 66 and provided for the elimination of billing for concurrent therapy services and services provided by technicians. CMS stated that these initiatives were intended to be budget neutral. In order to meet the needs of the new reimbursement system, EHSI increased nursing and therapy staff and realigned its staffing practices to meet the incremental assessment requirements and therapy needs of its residents. As a result of these initiatives, together with the realigned funding rates, EHSI’s average Medicare Part A rate increased by 12.7% in the first nine months of 2011 over the same 2010 period.
Medicare Part B Rates
In November 2011, CMS issued a final payment rule for the 2012 Medicare Physician Fee Schedules that includes revised fee screen rates for our Part B therapy services that are proposed to decrease by 27.4% effective January 1, 2012. The estimated annual impact of the rate decrease to EHSI is approximately US$11 million. The proposed reduction in physician fees along with the fee screen rates is a contentious issue. In December 2011, U.S. Congress passed and the President signed a law that delayed the rate decreases until March 1, 2012, and it is expected that U.S. Congress will pass another law further delaying or modifying these rate decreases.
Effective January 1, 2006, CMS implemented a cap on Part B therapy services for physical and speech therapy, and a second cap for occupational therapy. The annual caps per eligible Part B recipient amounted to US$1,740 in 2006, and increased annually for inflation to US$1,870 in 2011 and US$1,880 in 2012. A one-year exemption process to the therapy caps was established in 2005 for individuals who were able to prove medical necessity for the therapy, which exemption was extended to December 31, 2011, by the Medicare and Medicaid Extenders Act of 2010. On December 23, 2011, U.S. Congress passed and the President signed a two-month continuation of the Medicare therapy cap exemptions process, and on February 16, 2012, the therapy cap exemptions were extended through to December 31, 2012. Based on information currently available, EHSI estimates that without the extension of this exemption, its annual therapy revenue may decline by as much as US$22 million, or US$16 million should the Part B fee screen rate changes as part of the 2012 Medicare Fee Schedules Bill discussed above become effective. This estimated decline in annual therapy revenue is based on therapy services provided by EHSI in excess of the proposed cap, and assumes no mitigating actions taken and no recovery for services rendered from the individual receiving such services. The impact of these caps on EHSI may be mitigated to the extent that such patients find other means of paying for these services, or if EHSI is able to reduce associated costs.

50 Extendicare Real Estate Investment Trust
Management’s Discussion and Analysis
Effective January 1, 2011, CMS implemented the application of the multiple procedure reduction policy that reduced EHSI’s Medicare Part B inpatient and outpatient therapy billings by approximately 7.5%, or approximately US$3.2 million in annual revenue.
2012 President�s Budget and Budget Control Act of 2011
On August 2, 2011, the U.S. President signed the Budget Control Act (BCA) as passed by the House of Representatives and Senate. The BCA brings significant change to the federal budget process by forcing significant cuts to future federal spending while raising the national debt limit. Following months of negotiations and facing default, a process was put into place to reduce the federal deficit. We have been advised that the BCA imposes caps on discretionary spending starting October 1, 2011, that will generate US$917 billion in savings over the next 10 years. It also puts in place a process to find, by the end of the year, another US$1.2 trillion to US$1.5 trillion in deficit reductions over the next 10 years. While caps on discretionary spending are put into place, the act does not specifically make hard policy choices on how to implement cuts. It will be up to Congress and a special bipartisan and bicameral committee to establish policy. The BCA does not make any changes to entitlements but rather imposes caps on spending. To comply with the law, Congress must reduce spending by about US$25 billion for the budget cycle starting in October.
The special Joint Select Committee on Deficit Reduction, referred to as the “Super Committee” was to propose legislation no later than January 15, 2012, to reduce spending by the additional US$1.2 trillion. As the Super Committee was unable to make a recommendation and U.S. Congress failed to pass legislation, a process of sequestration will be put into place on January 2, 2013. Sequestration would be applied proportionally to non-exempt programs (Medicaid, Medicare benefits, Social Security, unemployment insurance, low-income programs, and civilian and military retirement programs are exempt). Medicare payments to providers are not exempt but are limited by law to a maximum of a 2% reduction. In addition, a number of recommendations also impacting the industry are being considered including a phased-in clawback of Medicare funds that CMS believes to have overpaid to the long-term care sector as a result of the October 1, 2010, implementation of MDS 3.0 and RUG-IV.
In February 2011, the U.S. President released the 2012 fiscal year budget (the “President’s Budget”). The significant item within the President’s Budget impacting the long-term care sector is the proposed reduction in the Medicaid Provider Tax Threshold. Commencing in 2015, the Medicaid Provider Tax Threshold would be reduced in phases over a three-year period. In the interim, the maximum percentage would be allowed to rise to 6.0% from 5.5% on October 1, 2011. Commencing in fiscal year (FY) 2015, the percentage would be phased down to: 4.5% in FY 2015; 4.0% in FY 2016; and 3.5% in FY 2017 and beyond. Provider taxes provide a significant source of FMAP funding and therefore could have a negative effect on state budgets during the phase-down period.
On March 5, 2011, House Budget Chairman Paul Ryan (R-WI) released his budget proposal for FY 2012 (the “House Budget Proposal”). Compared to the President’s Budget, the House Budget Proposal would cut spending by US$6.2 trillion over the next 10 years and cut the federal deficit by US$4.4 trillion over 10 years. When compared to current policy funding levels, known as the Congressional Budget Office baseline, the plan would cut spending by US$5.8 trillion over the coming decade and reduce projected deficits by US$1.6 trillion.
The House Budget Proposal serves as a blueprint for setting monetary targets for savings. The committees of jurisdiction, Ways & Means for Medicare, and Energy & Commerce for Medicaid, must put together separate legislation to meet the savings targets through cuts to these programs. Most notably, the House Budget Proposal would transition Medicaid from an entitlement to a state block grant giving states the spending authority on the use of federal funds and Medicare would be transitioned to a voucher system to supplement the purchase of private health insurance. The bill would also repeal the Patient Protection and Affordable Care Act (H.R. 3590), which is discussed below and remains a possibility if there is a change in the Presidency and Senate control following the 2012 election.
President�s Jobs Bill
On September 19, 2011, the Office of Management and Budget released the President’s Plan for Economic Growth and Deficit Reduction, otherwise known as the President’s Jobs Bill. This bill included a provision for the extension of the payroll tax cuts enacted as part of the Tax Relief, Unemployment Insurance Reauthorization, and Job Creation Act of 2010, and contained several proposals intended to fund the tax cut extension.
Although the President’s Jobs Bill was not passed in its original form, similar proposals contained in the bill have been legislated in order to fund the tax cut extension. For example, U.S. Congress passed a two-month payroll tax cut extension on December 23, 2011.

Management’s Discussion and Analysis
2011 Annual Report 51
More recently the Conference Committee dealing with the payroll tax cut, the extension of the Part B therapy cap exemptions, and the 2012 Medicare Physician Fee Schedules reached agreement on the reduction to reimbursable bad debts, which was also proposed in the President’s Jobs Bill. On February 16, 2012, the Conference Committee reached agreement for a 35% phased-in reduction to reimbursable bad debts for dually eligible residents starting in fiscal year 2013 to 88%, 76% in fiscal year 2014 and ultimately to 65% in fiscal year 2015. For dually eligible (Medicare & Medicaid eligible) residents, should the resident be unable to pay their Part A co-insurance amounts due to a lack of resources, long-term care operators are to bill the Medicaid program for unpaid amounts. In certain states, the Medicaid program reimburses the operator for unpaid amounts, whereas if they do not, the operator can obtain reimbursement through the Medicare program by submitting unpaid claims through their annual filing of cost reports. In the majority of states where EHSI operates, the Medicaid program does not reimburse its centers for unpaid Part A co-insurance and therefore, EHSI files for reimbursement of approximately US$21 million per annum in reimbursable bad debts. The phased-in reduction of ultimately 35% over three years would result in an annual reduction of revenue to EHSI of approximately US$2.5 million in the first year, reaching approximately US$7.3 million in the third year. This is essentially cutting the Medicare rates of the nursing centers upon commencement of the co-insurance period, being day 20 of the resident’s stay. Separately, EHSI obtains reimbursable bad debts for non-dually eligible Part A co-insurance bad debts of approximately US$0.6 million that is currently reimbursed at 70% that will be reduced to 65% in 2012.
We anticipate the inclusion of similar proposals contained in the President’s Jobs Bill in future legislation in order to fund the tax cut extension, which would significantly affect Medicare reimbursement for nursing homes. For example, the President’s Jobs bill also called for the “realigning” of payments with costs through adjustments to the market basket annual increases for 2014 through 2021. Although sufficient detail is not known, these adjustments were expected to incorporate MedPAC’s March 2011 proposal to eliminate these increases beginning in 2012. These annual increases have averaged 2.7% in the last two fiscal years, prior to the productivity adjustment of a negative 1.0%.
MedPAC Recommendations Issued January 2012
The Medicare Payment Advisory Committee (MedPAC) made several recommendations to Congress in January 2012 to address what it considers Part A overpayments to skilled nursing centers. The recommendations include the elimination of the skilled market basket index for October 1, 2012 and rate rebasing beginning with October 1, 2013. The proposed rebasing would be accomplished via an initial reduction of 4%, with subsequent reductions over an appropriate transition period until Medicare’s payments are more aligned with what MedPAC considers providers’ costs. MedPAC is also proposing that U.S. Congress should direct the U.S. Secretary to reduce payments to skilled nursing centers with high risk-adjusted rehospitalization rates for their Medicare-covered skilled nursing center stays.
The American Health Care Association (AHCA) has stated publicly that MedPAC continues to make recommendations on Medicare rates without taking into consideration Medicaid rates that do not reimburse nursing centers for the costs of care. Therefore, AHCA disagrees with the elimination of the market basket index for October 1, 2012 as well as the proposed rebasing. It is important to note that MedPAC can only make recommendations to Congress.
2010 Health Care Reform Legislation Remains a Signi�cant Factor
In March 2010, historic health care reform legislation, the Patient Protection and Affordable Care Act (H.R. 3590), or “PPACA”, was enacted into law at a cost of US$940 billion over 10 years. Amendments to the PPACA were enacted into law on March 30, 2010, with the passage of the Health Care Education Affordability Act (HCEAA), which contains several changes to the PPACA. The legislation is complex and there is considerable controversy surrounding its passage. Several states have challenged whether the PPACA is in breach of the U.S. Constitution and during 2012 the result of either of those challenges, or the election, could impact the full implementation of PPACA.
It is generally believed that additional amendments may be introduced to address certain unintended consequences of the sweeping legislation before it is fully implemented in 2014. In addition, various government agencies will be required to issue regulations to properly implement the new legislation, which could have a significant impact on individuals, health care providers and employers. At this point in time, management is not able to determine the final form of the health care reform changes, nor estimate the impact of such on the business, results of operations and financial condition of the REIT.
The key aspects of the legislation that are specific to and impact long-term care providers, among other aspects, are as follows:
(i) A productivity adjustment to Medicare rates commencing October 1, 2011, that will reduce the annual market basket increases by approximately 1%, representing a reduction in Medicare funding of US$14.6 billion over a 10-year period. We anticipate that the annual impact from this Medicare reduction in rates to be approximately US$5 million per annum;
(ii) New transparency requirements and additional employee background check requirements for nursing centers;

52 Extendicare Real Estate Investment Trust
Management’s Discussion and Analysis
(iii) The creation of a new Independent Medicare Payment Advisory Board that will make recommendations to U.S. Congress on Medicare payment rates for health care providers, including skilled nursing centers; and
(iv) A mandate for CMS to create a national, voluntary pilot bundling payment program by 2013.
The additional following provisions were included in the final act:
(i) language that requires MedPAC to take Medicaid into consideration during its analyses for providers including skilled nursing and home health;
(ii) a federal mandate for states to expand home and community-based services with increased FMAP to states that rebalance spending between institutional and community-based care by October 1, 2015;
(iii) DHHS must submit a Medicare value-based purchasing plan for skilled nursing centers by October 1, 2011; and
(iv) as of July 1, 2011, Medicaid will no longer provide payments to states for services related to health care acquired conditions, including conditions acquired in other than hospital settings.
In addition, the health care reform legislation requires all individuals to have a minimum level of health care coverage and requires employers
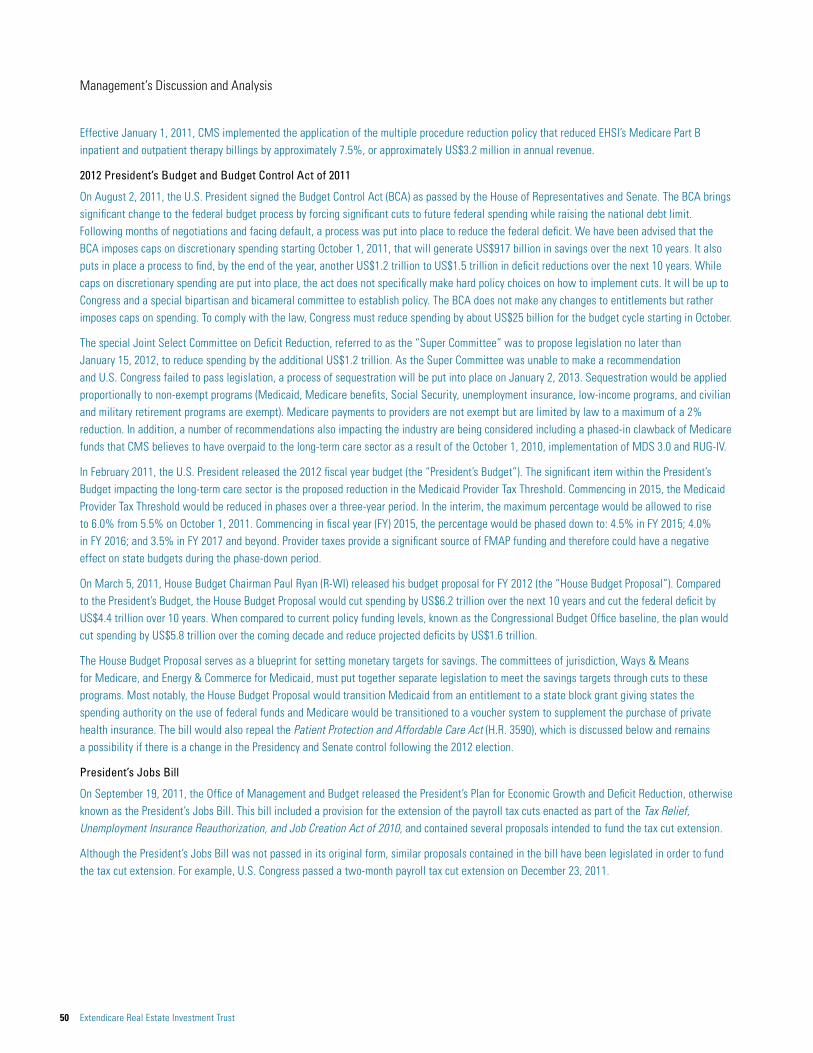
54 Extendicare Real Estate Investment Trust
Management’s Discussion and Analysis
Ontario is ECI’s largest market for both its long-term care and home health care services. Currently, funding for Ontario long-term care centers is based on reimbursement for the level of care assessed to be required by the residents. The provincial government allocates funds through “funding envelopes”, specifically: nursing and personal care, programs and support services, food and accommodation. Providers may retain excess funding over costs incurred only with respect to the accommodation envelope, while funding for the other envelopes, otherwise referred to as “flow-through envelopes”, is returned to the extent costs incurred are less than the funding provided. The province sets the rates for standard accommodation, as well as the maximum amounts that a provider can charge for semi-private and private accommodation. The accommodation rates are substantially paid for by the resident; however, the province guarantees funding for standard accommodation through resident subsidies. Overall funding is occupancy-based, but once the average occupancy level of 97% or higher is achieved, operators in Ontario receive 100% funding. During 2011, if the average occupancy fell below 97%, but remained above 85%, the center was funded based on actual occupancy plus 3%, and if it fell below 85%, then funding was based on actual occupancy. At this time it is unclear what the policy will be for 2012 should occupancy fall below 97%. Prior to 2011, if the average occupancy level fell below 97%, then funding was based on the actual occupancy level.
ONTARIO LONG-TERM CARE LEGISLATION
Ontario Redevelopment Program
In July 2007, the Ontario government initiated plans to redevelop 35,000 older long-term care beds in five phases over the next 10 to 15 years, and provide qualified applicants with a 25-year construction funding subsidy. In November 2008, the government released the range of the base construction funding subsidy, which for nursing centers larger than 100 beds is a daily subsidy of $13.30 per bed over a 25-year period, and an additional $1.00 per bed if the center is LEEDs silver compliant. The majority of operators believe that the level of capital funding is insufficient given the current costs of construction and the new design standards. Should operators choose not to replace their centers, it could have a significant impact on the number of nursing center beds in the province, which will offer both risks and opportunities for others in the marketplace. ECI and other operators continue to express concerns about the adequacy of the construction funding subsidy. The government has commenced a review of the program and we are awaiting a report on their recommendations and or proposed changes to the program.
ECI has 23 class “C” nursing centers (3,572 beds) that require redevelopment to meet the new standards. The first round of submissions for approval under the redevelopment plan began in July 2009, and the next round was expected to take place in mid-2011. There has been no announcement on the timing of the second round of submissions. Under the first phase of the redevelopment program, ECI received approval to redevelop 280 of its class “C” beds and is reviewing its remaining buildings to determine the priorities for redevelopment over the next four phases. Should ECI decide to replace or redevelop all of its remaining class “C” beds, management estimates that the total capital outlay will be in the range of $375 million to $475 million, depending on a number of factors including construction costs. Management estimates that approximately 20% to 25% of the total cost will be required to be funded by equity. ECI may choose not to replace certain of its centers and in other cases, form strategic partnerships with other providers for the replacement of their centers.
ONTARIO LONG-TERM CARE FUNDING
All Ontario long-term care centers have implemented a new resident assessment instrument, referred to as MDS 2.0. In April 2010, the Ontario government began using the MDS 2.0 data to drive a new case-mix classification methodology using 34 categories under a RUGs-based funding model. This RUGs model will tie resident needs to costs of care in a more impartial and transparent way. Twenty-seven of ECI’s centers have now been affected by this change and will be fully transitioned to the new funding model by April 2012. ECI’s remaining seven homes will begin transitioning to the new funding model in April 2012, and will have completely transitioned by April 2015.
In June 2010, the Ontario Ministry of Health and Long-Term Care (MOHTLC) released details of additional funding to assist providers with the implementation of the LTC Act of 2007, which was proclaimed into force on July 1, 2010. This funding increased the daily rate by $1.18, of which $0.26 was one-time funding for staff training over a period of nine months ending on March 31, 2011. The annual revenue impact to ECI of the $0.92 increase in base funding was approximately $1.7 million. The impact to ECI of the one-time daily rate increase of $0.26 for staff training was approximately $0.3 million over nine months. The funds were spread across the envelopes, with $0.57 of the daily rate allocated to the flow-through envelopes to provide for more registered dieticians, restorative and recreational programs and staff training, and $0.61 of the daily rate was allocated to the accommodation envelope to provide for more nutrition managers, food service workers and staff training. As well, the increase in daily rates was staggered, such that $0.60 took effect on July 1, 2010, and $0.58 took effect on October 1, 2010.

Management’s Discussion and Analysis
2011 Annual Report 55
The Ontario government’s budget for 2011 released on March 29, 2011 (the “2011 Ontario Budget”), included a 3% annual funding increase to the long-term care flow-through envelopes for the next three years on April 1st, to assist providers in offsetting costs required to meet the ministry standards in nursing and programming. Given the province’s fiscal situation and the recommendations contained in a February 2012 report published by the Commission on the Reform of Ontario’s Public Services, commonly referred to as the “Drummond Report”, the province’s ability to follow through on their funding commitments is unclear, although health and education have been identified as priorities. The 3% increase in the flow-through envelopes was estimated to represent annual revenue to ECI of approximately $4.9 million. This year the government also provided increased flow-through funding to hire personal support workers and enhance staff training. In addition, each April 1st, Ontario long-term care providers receive CMI funding adjustments based on the provincial resident classification results of the previous year, which resulted in a funding decrease in 2011 for ECI. The funding improvements, coupled with our CMI adjustments, were estimated to increase ECI’s annual revenue in the flow-through envelopes by approximately $3.6 million, and were offset by additional costs for resident care and services. In addition to the funding changes in the flow-through envelopes, the Ontario government provided a 1.2% increase ($0.58) in accommodation funding effective April 1, 2011, to address costs associated with the new regulation requirements and enhance staff training, which was estimated to provide ECI with annual revenue of approximately $1.1 million.
On July 1st each year, the Ontario government generally implements annual accommodation funding increases for long-term care providers (the portion of the fees paid for by the residents to the nursing center operators). In 2011, instead of increasing the resident fees, the Ontario government provided a one-time funding increase to long-term care providers that would have otherwise been received through a co-payment increase. The government indicated that this funding would continue to June 30, 2012, with a continued review of the co-payment and per diem funding on an annual basis. This July 2011 increase in the daily rates was $0.13 for food costs and $0.69 for the non flow-through component, representing annual revenue to ECI of approximately $1.5 million (2010 – $0.3 million).
In response to the economic downturn, the Ontario government implemented a wage freeze for labour contracts being renewed over the next two years beginning in 2010, and indicated its expectation that this should be extended to the government-funded long-term care sector, by announcing that it would not provide funding for any wage increases. ECI has complied with these expectations. However, arbitrators have awarded increased union wages in the long-term care sector affecting ECI, despite this mandate. As a result, the incremental cost of these arbitrated wage increases to ECI, and other operators in the sector, will put pressure on ECI’s operating margins. ECI expects to mitigate these cost pressures by implementing further cost containment measures at the corporate and regional office levels.
ALBERTA LONG-TERM CARE LEGISLATION AND FUNDING
In Alberta, a new activity-based funding system for continuing care centers commenced on April 1, 2010. However, Alberta Health Services (AHS) continues to adjust the formulas and has begun the process of determining the quality indicators that will also impact the funding. The quality indicators are anticipated to be implemented in three phases over three years and include such things as: family satisfaction survey results; immunization rates; medication reconciliations; and the implementation of quality improvement initiatives based on the RAI-MDS indicators. The first phase has been announced and consists of four unequally weighted quality indicators, which will determine an operators’ eligibility for 0.2% of its government funding for the fiscal year 2011-2012.
Effective April 1, 2011, the Alberta government provided a funding increase to long-term care providers of up to 3.8%, and additional acuity-adjusted funding of up to 1% for those operators below target provincial funding levels. ECI’s funding improved by an average of 3.7% representing annual revenue of approximately $2.7 million.
In August and December 2010, Alberta long-term care providers received funding increases under the new funding system retroactive to April 1, 2010, which increased ECI’s annual funding by about $3.3 million, and resulted in the receipt by ECI of $1.0 million of funding in the 2010 fourth quarter that related to prior quarters.

56 Extendicare Real Estate Investment Trust
Management’s Discussion and Analysis
In April 2010, we received notification from AHS of one-time funding to be provided to offset expenses incurred in preparation for the new activity-based funding system, as well as to offset costs incurred in maintenance, repairs and equipment needs within the nursing centers for the period April 1, 2009 to March 31, 2010. As a result, ECI received retroactive funding of $1.2 million in the 2010 second quarter, of which $0.9 million related to 2009.
In October 2010, the Alberta government announced a 3% increase in the long-term care accommodation fees (the portion paid directly by the residents), effective February 1, 2011, to reflect the rising costs of delivering accommodation and related services. The last time there was an increase in the accommodation fees was in November 2008. ECI estimates that this 3% increase will contribute additional annual revenue of approximately $0.7 million.
ONTARIO HOME HEALTH CARE LEGISLATION AND FUNDING
ECI is a major private-sector provider of home health care services in Canada through ParaMed, which operates in Alberta and Ontario. Ontario is ParaMed’s largest market, representing approximately 96% of its revenue in 2011.
The 2011 Ontario Budget included a 3% funding increase for home health care. It is not clear how the additional funding has been utilized by the Community Care Access Centres (CCACs) and consequently how it has impacted home health care providers, such as ParaMed.
The home health care competitive bidding process in Ontario was frozen in 2004 as a result of a government study intended to improve the procurement model. Consequently, contracts that were due to expire are being extended until the bidding process resumes, with a focus on strengthening accountability and ensuring fairness and transparency. ParaMed had recommended the use of a public reporting system similar to the long-term care industry. The government is in the process of developing performance measures and has indicated its intention of publicly reporting them. There has been no indication from the government of when or if the bidding process will resume.
Beginning on January 2, 2009, the Ontario government eliminated the provisions that exempted elect-to-work employees from the entitlement to public holiday pay. As the majority of our home health care employees are elect-to-work employees, this resulted in increased operating costs for ParaMed of $3.1 million in 2010 and $2.5 million in 2009. Requests for reimbursement for these added costs were made directly to the MOHTLC by ParaMed and the Ontario Home Care Association. Consequently in 2010, the CCACs reimbursed providers for their 2009 costs related to the CCAC contracts, of which ParaMed’s portion was approximately $2.1 million. The CCACs continued to directly fund these costs until the additional funding was embedded in the billing rates as the contracts were renewed.
The Employment Standards Amendment Act (Temporary Help Agencies), 2009 (the “ESAA”), came into effect in November 2009, and established, among other things, that temporary employees are covered by the Employment Standards Act, 2000, thereby providing them with entitlements to severance and notice of termination. Currently, the ESAA does not apply to elect-to-work employees of agencies, such as ParaMed, providing services pursuant to contracts with the CCACs. However, this exemption expires September 30, 2012, following which the ESAA will apply to all elect-to-work employees. Through the Ontario Home Care Association, we will be making submissions to retain the elect-to-work exemptions or provide funding to cover the added costs. The current impact of the ESAA on ParaMed’s contracts to parties other than the CCACs is minimal and it is too early to determine what impact it may have on our operations in 2012.

Management’s Discussion and Analysis
2011 Annual Report 57
Liquidity and Capital Resources Sources and Uses of Cash
At December 31, 2011, the REIT had cash and cash equivalents of $80.0 million compared with $267.8 million at December 31, 2010, representing a decrease of $187.8 million, largely due to cash used in the refinancing of a significant portion of our U.S. debt. Cash pledged of $16.8 million (US$16.6 million) is excluded from our available cash balance as it relates to US$10.2 million held by RBC as collateral against a letter of credit and US$6.4 million held in escrow pursuant to the HUD regulatory agreements for working capital purposes.
(thousands of dollars unless otherwise noted) 2011 2010
Cash provided by operating activities, before working capital changes and interest and income taxes 238,547 257,741
Net change in operating assets and liabilities Accounts receivable (10,545) (10,588) Other current assets (11,210) 1,691 Accounts payable and accrued liabilities (4,525) (8,477)
(26,280) (17,374)
Interest and taxes paid Interest paid (83,531) (85,797) Interest received 4,278 4,214 Income taxes paid (26,235) (13,391)
(105,488) (94,974)
Cash provided by operating activities 106,779 145,393Cash used in investing activities (67,906) (41,017)Cash provided by (used in) financing activities (227,243) 36,139Foreign exchange gain (loss) on U.S. cash held 629 (6,768)
Increase (decrease) in cash and cash equivalents (187,741) 133,747Cash and cash equivalents at beginning of year 267,759 134,012
Cash and cash equivalents at end of year 80,018 267,759
Average U.S./Canadian dollar exchange rate 0.9891 1.0299
Cash provided by operating activities was $106.8 million in 2011 compared to $145.4 million in 2010, representing a decline of $38.6 million. This decline was primarily due to the decline in earnings during the year and the increase in income taxes paid of $12.8 million between years. The lower amount of cash taxes paid in 2010 was due to taxes recoverable from the 2009 taxation year that reduced the amounts paid during 2010.
Cash used in investing activities was $67.9 million in 2011 compared to $41.0 million in 2010 and primarily reflected expenditures for property, equipment and software, the acquisition of a previously leased skilled nursing center for $7.3 million, partially offset by proceeds from dispositions. During 2011, net proceeds of $4.8 million were realized on the disposal of a skilled nursing center in Michigan and a closed nursing center in Alberta, compared to net proceeds of $29.0 million on the disposal of assets in 2010.
Purchases of property, equipment and software were $64.3 million in 2011 compared to $68.7 million in 2010. Growth capital expenditures, excluding acquisitions, were $33.5 million in 2011 compared to $40.0 million in 2010, and related to the construction of new beds, building improvements or capital costs aimed at earnings growth. Maintenance capital expenditures, which are the capital costs to sustain and upgrade existing property and equipment assets, were $31.0 million in 2011 compared to $29.9 million in 2010, representing 1.5% and 1.4% of revenue, respectively. These costs fluctuate on a quarterly basis with the timing of projects and seasonality. It is our intention to spend between 1.5% and 2.0% of revenue annually on maintenance capital expenditures, which is consistent with our objective to maintain and upgrade our centers. We are projecting to spend up to approximately $38 million in facility maintenance capital expenditures and $70 million in growth capital expenditures in 2012.

58 Extendicare Real Estate Investment Trust
Management’s Discussion and Analysis
The following table summarizes the components of property, equipment and software expenditures.
Purchase of Property, Equipment and Software (thousands of dollars unless otherwise noted) 2011 2010
Growth expenditures 33,528 39,991Facility maintenance 30,975 29,962Deduct: capitalized interest (195) (1,262)
64,308 68,691
Average U.S./Canadian dollar exchange rate 0.9891 1.0299
Cash provided by (used in) financing activities was $227.2 million used in 2011 compared to $36.1 million provided in 2010. During 2011, debt repayments were $113.2 million in excess of new debt issued, primarily reflecting the activities of the 2011 refinancing plan. As well, the REIT made cash distributions of $58.4 million to holders of REIT Units during 2011 and incurred financing fees of $28.3 million. Financing activities in 2010 primarily reflected net cash proceeds of $82.2 million, before income taxes, from the REIT Unit equity offering in February, the issuance of long-term debt on refinancing of existing debt, and draws on construction financing, partially offset by cash distributions of $60.1 million to holders of REIT Units and scheduled debt repayments. For information on the change in long-term debt, refer to “Liquidity and Capital Resources – Long-term Debt”.
Reconciliation of Cash Provided by Operating Activities to DI and AFFO
The following table provides a reconciliation of the cash provided by operating activities to DI and AFFO for the past eight quarters and the 2011 and 2010 years. (1)
Q1 Q2 Q3 Q4 Year
(millions of dollars) 2011 2010 2011 2010 2011 2010 2011 2010 2011 2010
Cash provided by operating activities 29.0 25.6 28.1 41.5 42.0 44.7 7.7 33.6 106.8 145.4Add (Deduct):Net change in operating assets and liabilities, including interest and taxes (3.4) 4.8 9.2 (6.6) (6.7) (14.7) 23.4 10.9 22.5 (5.6)Current tax on fair value adjustments, gain/loss on foreign exchange, financial instruments, asset impairment, disposals and other items − − 0.5 − (0.9) 4.2 (2.4) 0.4 (2.8) 4.6Net provisions and payments for self-insured liabilities 3.6 (2.4) (4.7) 4.6 (22.1) (11.1) (7.0) 0.6 (30.2) (8.3)Exchangeable LP Unit distributions 0.7 0.7 0.6 0.7 0.7 0.6 0.2 0.7 2.2 2.7Depreciation for FFEC (5.9) (5.4) (5.6) (5.6) (5.8) (5.7) (6.1) (5.7) (23.4) (22.4)Principal portion of government capital funding payments 0.6 0.6 0.7 0.6 0.7 0.6 0.6 0.6 2.6 2.4Other (0.2) (0.1) – – (0.1) (0.1) – (0.4) (0.3) (0.6)
DI 24.4 23.8 28.8 35.2 7.8 18.5 16.4 40.7 77.4 118.2Additional facility maintenance capital expenditures (2) 1.2 0.9 (1.5) 0.4 (3.3) (2.8) (4.0) (6.0) (7.6) (7.5)
AFFO 25.6 24.7 27.3 35.6 4.5 15.7 12.4 34.7 69.8 110.7
(1) “DI” and “AFFO” are not recognized measures under GAAP and do not have a standardized meaning prescribed by GAAP. Refer to the discussion of non-GAAP measures.(2) Represents total facility maintenance capital expenditures less depreciation for furniture, fixtures, equipment and computers (FFEC) already deducted in determining DI.

Management’s Discussion and Analysis
2011 Annual Report 59
Capital Structure
(millions of dollars unless otherwise noted) 2011 2010
Unitholders’ Equity REIT Units 453.1 421.2Contributed surplus 0.1 0.1
453.2 421.3
Accumulated deficit at beginning of year (287.5) (262.1)Net earnings (loss) for the year (30.4) 41.8Other/adjustment to prior year distribution of ALC (0.4) (1.1)Distributions declared on REIT Units (67.9) (66.1)
Accumulated deficit at end of year (386.2) (287.5)
Accumulated other comprehensive loss (18.7) (20.8)
Unitholders’ equity 48.3 113.0
U.S./Canadian dollar exchange rate (at year end) 1.0170 0.9946
Unit Information (thousands) Feb. 29, 2012 Dec. 31, 2011 Dec. 31, 2010
REIT Units (TSX symbol: EXE.UN) (1) 84,417.5 84,121.5 79,831.5Exchangeable LP Units – – 3,163.7
84,417.5 84,121.5 82,995.2
(1) Closing market value per the TSX on February 29, 2012, was $8.50.
The closing rates used to translate assets and liabilities of the U.S. operations were 1.0170 at December 31, 2011, and 0.9946 at December 31, 2010. As a result of the weaker Canadian dollar at December 31, 2011, the assets of the REIT’s U.S. operations increased by approximately $45.6 million, partially offset by an increase in the liabilities of approximately $40.3 million, with the net change in foreign currency translation of $5.3 million included in accumulated other comprehensive loss. Every one-cent increase (decrease) in the Canadian dollar against the U.S. dollar would impact the net assets of our U.S. operations by approximately $2.5 million, and would be reflected as a change in foreign currency translation adjustments in accumulated other comprehensive loss.
DISTRIBUTIONS
In 2011, we generated DI of $77.4 million and AFFO of $69.8 million and declared monthly distributions of $0.07 per unit totalling $70.1 million that were distributed to holders of REIT Units ($67.9 million) and Exchangeable LP Units ($2.2 million) from February 15, 2011 to January 16, 2012. The portion distributed in cash was $60.2 million and $9.9 million was by way of issued units under a distribution reinvestment plan. A total of 1,125,603 units (1,123,294 REIT Units and 2,309 Exchangeable LP Units) were issued during 2011 through the distribution reinvestment plan.
During 2010, monthly distributions of $0.07 were declared totalling $68.8 million, of which $63.2 million was distributed in cash and $5.6 million by way of issued units under a distribution reinvestment plan. A total of 586,407 REIT and Exchangeable LP units were issued during 2010 through the distribution reinvestment plan.
There are a number of factors that affect the quarterly funds generated for distribution that our Board takes into consideration in determining the monthly distributions for the year. Factors affecting quarterly trends in earnings are discussed under the headings “Adjusted Funds from Operations”, “Summary of Quarterly Results” and “2011 Financial Review”.

60 Extendicare Real Estate Investment Trust
Management’s Discussion and Analysis
Our current policy is to pay distributions of $0.07 per REIT Unit to the holders thereof on a monthly basis, of which approximately 70% is distributed by way of tax-deferred returns of capital to Canadian residents.
The declaration and payment of future distributions is subject to the discretion of our Board and will be dependent upon a number of factors including results of operations, requirements for capital expenditures and working capital, future financial prospects of the REIT, debt covenants and obligations, and any other factors deemed relevant by the Board. If our Board determines that it would be in the REIT’s best interests, it may reduce, for any period, the percentage of Distributable Income to be distributed to holders of REIT Units.
LONG-TERM DEBT
Long-term debt, including current portion, was $1,134.4 million at December 31, 2011, and was net of $22.2 million of financing costs. The current portion of long-term debt was $192.7 million at the end of 2011, and included the May 2012 CMBS Financing of $111.8 million (US$109.9 million) that was repaid in full in February 2012 as part of the debt refinancing plan, as discussed in further detail under the heading “Overview – Significant 2011 Events and Developments – 2011 Refinancing Plan”.
Details of the components, terms and conditions of long-term debt are provided in note 11 of the 2011 consolidated financial statements. The REIT and its subsidiaries are in compliance with all of their respective financial covenants as at December 31, 2011.
The following summarizes the changes in the carrying amounts of long-term debt for 2011 and 2010.
Continuity of Long-term Debt (millions of dollars) 2011 2010
Long-term debt at beginning of year, prior to financing costs 1,255.9 1,261.8Issue of long-term debt Mortgages 390.5 23.5 PrivateBank Loans 9.9 25.7 Construction loans 1.9 16.1 Notes payable 0.1 3.3Net issue (repayment) on the EHSI Credit Facility 35.7 (6.8)Increase in capital lease obligations, other than annual repayments (1) – 12.8Repayment of long-term debt (551.2) (46.3)Revaluation of convertible debentures carried at fair value 0.6 6.2Change due to period-end foreign exchange rate 13.2 (40.4)
1,156.6 1,255.9Financing costs at end of year (22.2) (14.7)
Long-term debt at end of year 1,134.4 1,241.2Less: current portion (192.7) (571.2)
941.7 670.0
(1) The 2010 activity reflects the new capital lease obligation entered into in November 2010 on the Indiana skilled nursing center.
Credit Rating
Moody’s Investor Services Inc. (Moody’s) has assigned the REIT a Corporate Family Rating of “B1” with a “stable” outlook. The “stable” rating outlook means that the rating is not likely to change. A “B” rating is considered speculative and subject to high credit risk. Moody’s applies numerical modifiers 1, 2 and 3 in each rating classification, and the modifier “1” indicates that the security ranks in the higher end of its generic rating category.
Moody’s Corporate Family Ratings are generally employed for speculative-grade corporate issuers. A Corporate Family Rating is an opinion of a corporate family’s ability to honour all of its financial obligations and is assigned to a corporate family as if it had a single class of debt and a single consolidated legal entity structure.
A Corporate Family Rating does not reference an obligation or class of debt and thus does not reflect priority of claim. It applies to all affiliates under the management control of the entity to which it is assigned. Moody’s employs the general long-term rating scale for Corporate Family Ratings.

Management’s Discussion and Analysis
2011 Annual Report 61
The ratings accorded to the REIT are not recommendations to purchase, hold or sell the REIT’s securities. There can be no assurance that any rating will remain in effect for any given period of time or that any rating will not be withdrawn or revised by a rating agency at any time.
Interest Rates and Aggregate Debt Maturities
In order to meet the REIT’s monthly distributions, management has limited the amount of debt that may be subject to changes in interest rates. As a result, all but $102.3 million of our long-term debt outstanding at December 31, 2011, excluding financing costs and equity allocation, was at fixed rates. The variable-rate debt related to US$53.0 million drawn on EHSI’s Credit Facility, US$34.5 million drawn on the PrivateBank Loans, and the $13.3 million bridge loan on two Canadian centers.
The 2011 refinancing of our U.S. and Canadian debt with government-insured mortgages at lower rates and with longer terms to maturity reduced our weighted average interest rates and terms to maturity.
The weighted average interest rate of our long-term debt was approximately 5.5% at December 31, 2011 (5.7% for our Canadian operations and 5.3% for U.S. operations), compared to 6.6% at December 31, 2010. The weighted average term to maturity of our long-term debt, including capital lease obligations, was 14.5 years as at December 31, 2011 (7.2 years for our Canadian operations and 20.6 years for our U.S. operations), compared to 4.1 years at December 31, 2010. Excluding our capital lease obligations, the weighted average term to maturity of our long-term debt was 14.5 years (4.9 years for our Canadian operations and 20.9 years for our U.S. operations).
Our consolidated interest coverage ratio for 2011 was 2.4 times (2010 – 2.9 times). Interest coverage is defined as EBITDA divided by net interest.
The following table presents principal, or notional, amounts and related weighted average interest rates by year of maturity for the REIT’s debt obligations as at December 31, 2011. It incorporates only exposures that existed at that date and does not consider exposures, or positions that could arise subsequently, or future interest rate movements. As a result, the information has limited predictive value. The ultimate results with respect to interest rate fluctuations will depend on the exposures that occur, hedging strategies at the time and interest rate movements.
After (millions of dollars unless otherwise noted) 2012 2013 2014 2015 2016 2016 Total Fair Value
Canadian OperationsConvertible debentures (at face value) Fixed rate – 91.8 113.9 – – – 205.7 214.3 Average interest rate – 7.25% 5.70% – – – 6.39% Long-term debt Fixed rate 10.1 41.3 15.9 9.7 15.6 94.6 187.2 194.0 Average interest rate 3.54% 4.88% 3.36% 3.27% 3.82% 4.53% 4.33% Variable rate 1.0 12.3 – – – – 13.3 13.3 Average interest rate 3.12% 3.12% – – – – 3.12% Capital lease obligations Fixed rate 4.2 4.5 4.9 5.2 5.7 90.2 114.7 132.4 Average interest rate 7.08% 7.08% 7.08% 7.08% 7.08% 7.08% 7.08% United States Operations (1)
Long-term debt Fixed rate 123.9 11.5 7.8 8.1 8.5 363.2 523.0 541.6 Average interest rate 6.57% 5.67% 4.67% 4.7% 4.7% 4.55% 5.06% Variable rate 54.5 34.5 – – – – 89.0 89.0 Average interest rate 6.43% 6.00% – – – – 6.26% Capital lease obligations Fixed rate 0.6 0.7 0.7 0.3 0.1 12.7 15.1 15.1 Average interest rate 5.90% 5.90% 5.91% 6.01% 8.71% 8.71% 8.28%
(1) U.S. dollar denominated debt is translated to Canadian dollars at a rate of 1.0170.
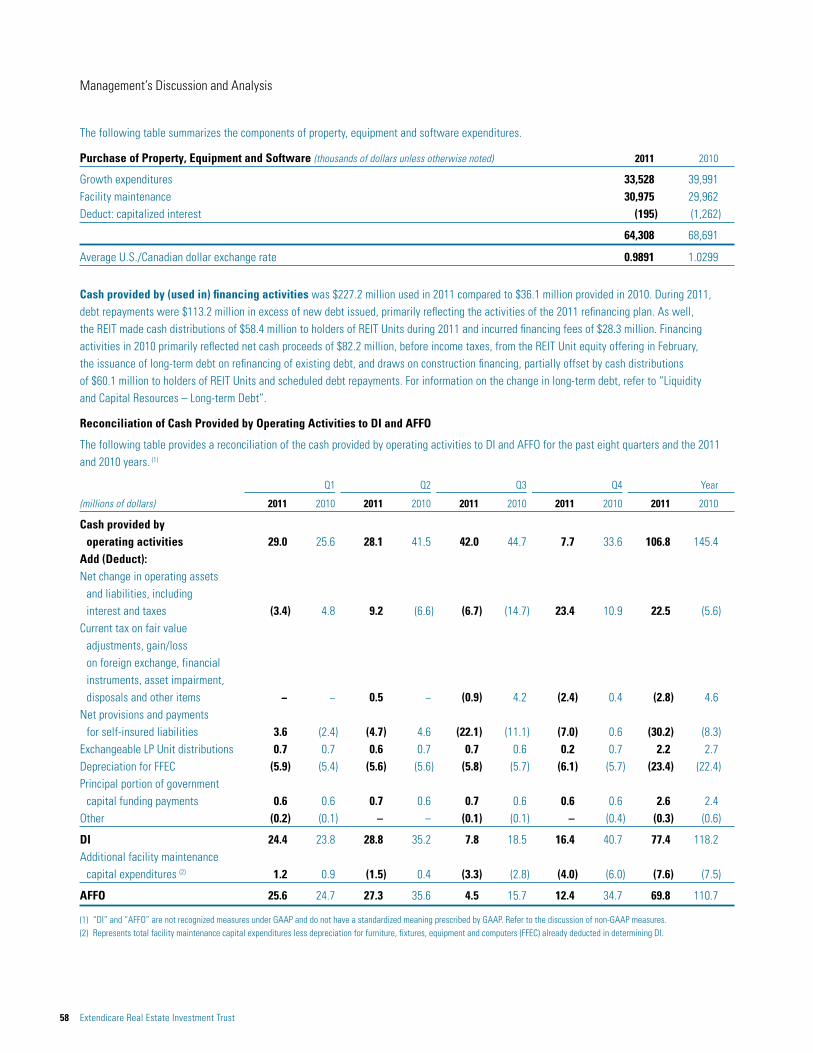
62 Extendicare Real Estate Investment Trust
Management’s Discussion and Analysis
ACCRUAL FOR SELF-INSURED LIABILITIES
The accrual for self-insured liabilities is based on management’s best estimate of the ultimate cost to resolve general and professional liability claims, including both known claims and claims that have been incurred but not yet reported by the end of the reporting period. General and professional liability claims are the most volatile and significant of the risks for which the REIT self-insures. Actual results can differ materially from the estimates made due to a number of factors including the assumptions used by management and other market factors.
At December 31, 2011, the accrual for self-insured general and professional liabilities was $79.4 million compared to $46.5 million at the beginning of the year, representing an increase of $32.9 million. The current period provision, net of claims payments, increased the accrual by $30.2 million, with the balance of the increase primarily due to the weaker Canadian dollar.
Provisions recorded in 2011 and 2010 for potential general and professional liability claims were $65.3 million and $33.1 million, respectively. Payments for self-insured liabilities were $35.1 million in 2011 and $24.9 million in 2010.
The results of the actuarial reviews conducted during the 2011 third quarter and at year end necessitated the strengthening of our prior years’ reserves by $31.4 million (US$32.1 million) and $11.4 million (US$11.2 million), respectively. These additional reserves were necessary as a result of higher than anticipated paid settlement amounts, increases for settlements on known and unknown claims and adverse claim developments in the second half of 2011.
In the 2010 third quarter, following the completion of the third quarter interim independent actuarial review of our resident care liabilities, we strengthened the level of our reserves for prior years’ claims by $14.0 million (US$13.5 million), to a level which we believed was adequate at that time. Similarly in 2009, we increased our reserves for prior years’ claims by US$3.2 million.
Management regularly evaluates and periodically engages an independent third-party actuary to provide a report to determine the appropriateness of the carrying value of this liability. In 2011, we commenced the practice of performing an independent actuarial review three times during the calendar year, and added a review in the second quarter, in addition to the normal third and fourth quarter reviews. Assumptions underlying the determination of the liability are limited by the uncertainty of predicting future events and assessments regarding expectations of several factors. Such factors include, but are not limited to: the frequency and severity of claims, which can differ materially by jurisdiction; trends in claims along with unique and identifiable settlements; coverage limits of third-party reinsurance; the effectiveness of the claims management process; and the outcome of litigation. Therefore, management’s estimate of the accrual for general and professional liability claims is significantly influenced by assumptions that are subject to judgement by management and the actuary, which may cause the provision to fluctuate from one reporting period to another. Differences between the ultimate claims costs and our historical provisions for loss and actuarial assumptions and estimates could have a material adverse effect on our business, operating results and financial condition.
Most of the risks that Extendicare self-insures are long-term in nature and accordingly, claims payments for any particular policy year occur over a long period of time. However, management estimates and allocates a current portion of the accrual for self-insured liabilities on the statement of financial position. As at December 31, 2011, management estimated that $24.4 million of the accrual for self-insured general and professional liabilities will be paid within the next year. The timing of payments is not directly within management’s control and therefore, estimates could change in the future.
Within our Bermuda-based captive insurance company, we hold investments sufficient to support the accrual for self-insured liabilities and to meet the required statutory solvency and liquidity rations. These invested funds are reported in other assets and totalled $83.6 million at December 31, 2011, compared to $60.9 million at December 31, 2010. This increase of $22.7 million reflects a cash injection of US$30.0 million into our captive insurance company to cover the estimated incremental self-insured liabilities, net of the claims payments and operating activities of the captive. A further US$8.6 million of cash was injected in the 2012 first quarter to ensure the captive was adequately capitalized for regulatory purposes. Management believes there are sufficient cash resources to meet estimated current claims payment obligations.
SPECIFIED CONTINGENT CLAIMS AGAINST CROWN LIFE
Under the June 2007 Crown Life share sale agreement with The Canada Life Assurance Company (Canada Life), Extendicare was responsible for specified contingent claims against Crown Life, and had accrued provisions for potential settlements (December 31, 2010 – $13.9 million), which were secured by letters of credit. Settlement on all of the remaining claims was reached during 2011, resulting in the release of excess provisions of $0.5 million in the 2011 second quarter and $1.9 million in the 2011 third quarter, and the elimination of the letters of credit.
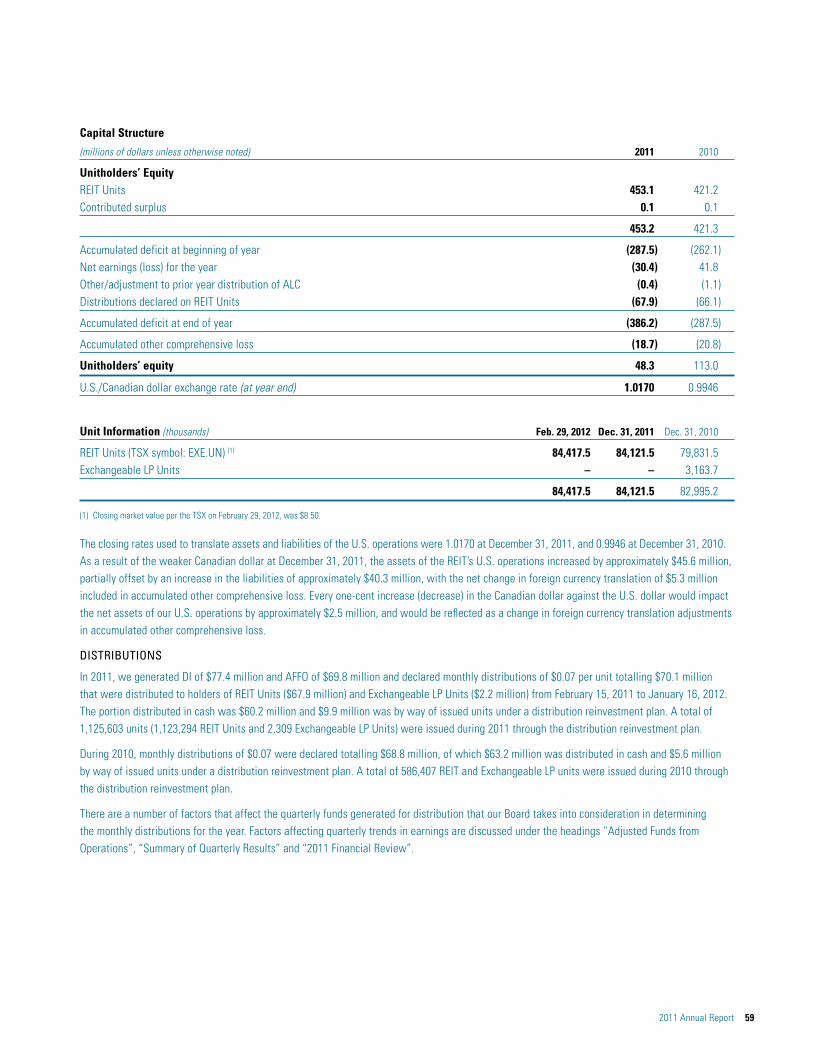


Management’s Discussion and Analysis
2011 Annual Report 65
Risks and Uncertainties General Business Risks
Extendicare REIT is subject to general business risks inherent in the long-term care industry, including increased government regulation and oversight, changing consumer preferences, fluctuations in occupancy levels, the inability to achieve adequate government funding increases, increases in labour costs and other operating costs, possible future changes in labour relations, competition from or the oversupply of other similar properties, changes in neighbourhood or location conditions and general economic conditions, health related risks, disease outbreaks and control risks, changes in accounting principles and policies, the imposition of increased taxes or new taxes, capital expenditure requirements, changes in interest rates, and changes in the availability and cost of long-term financing that may render refinancing of long-term debt difficult or unattractive. Any one of, or a combination of, these factors may adversely affect the business, results of operations and financial condition of the REIT.
Risks Related to Government Funding and Regulatory Changes
Extendicare REIT’s earnings are highly reliant on government funding and reimbursement programs, both in the U.S. and in Canada, and the effective management of staffing and other costs of operations, which are strictly monitored by government regulatory authorities. Given that we operate in a labour-intensive industry, where labour-related costs account for a significant portion of our operating and administrative costs (2011 – 72.8%), government funding constraints could have a significant adverse effect on our results from operations and cash flows. Management is unable to predict whether governments will adopt changes in their funding and reimbursement programs, and if adopted and implemented, what effect such changes will have on the REIT.
Further information on funding and legislative changes affecting the industry can be found under “Update of Regulatory and Reimbursement Changes Affecting Revenue”.
All long-term care providers are subject to surveys, inspections, audits and investigations by government authorities to ensure compliance with applicable laws and licensure requirements of the federal, state and/or provincial funding programs. Nursing centers must comply with applicable regulations which, depending on the jurisdiction in which they operate, may relate to such things as staffing levels, resident care standards, occupational health and safety, resident confidentiality, billing and reimbursement, along with environmental and other standards. The government review process is intended to determine compliance with survey and certification requirements, and other applicable laws. Remedies for survey deficiencies can be levied based upon the scope and severity of the cited deficiencies. Remedies range from the assessment of fines to the withdrawal of payments under the government funding programs. Should a deficiency not be addressed through a plan of correction, a center can be decertified from the funding program. As at December 31, 2011, we had certain centers under plans of correction at EHSI, but no centers had been decertified. While it is not possible to estimate the final outcome of the required corrective action, the REIT has accrued for known remedial costs.
Government agencies have steadily increased their enforcement activity over the past several years. As a result, in addition to increasing resources to improve the quality of services provided to its residents, we are continually allocating increased resources to ensure compliance with applicable regulations and to respond to inspections, investigations and/or enforcement actions. Our costs to respond to and/or defend surveys, inspections, audits and investigations are significant and are likely to increase in the current environment.
Non-compliance with applicable laws governing long-term care could result in adverse consequences, including severe penalties, which may include criminal sanctions and fines, civil monetary penalties and fines, administrative and other sanctions, including the loss of our right to participate in the Medicare and Medicaid programs, or one or more third-party payor networks. We may be required to refund amounts that have been paid to us by federal, state and/or provincial funding programs. These penalties could have a material adverse effect on the business, results of operations or financial condition of the REIT.

66 Extendicare Real Estate Investment Trust
Management’s Discussion and Analysis
UNITED STATES
Limitations on U.S. Medicare and Medicaid reimbursement for health care services are continually proposed. Medicare and Medicaid reimbursement programs are complicated and constantly changing as CMS and the various states continue to refine their programs. There are considerable administrative costs incurred by EHSI in monitoring the changes made within the programs, determining the appropriate actions to be taken to respond to those changes and implementing the required actions to meet the new requirements and minimize the repercussions of the changes to EHSI’s reimbursement rates and costs. There can be no assurance that Medicare and Medicaid reimbursement programs will remain at levels comparable to present levels or that they will, in the future, be sufficient to cover the costs allocable to patients eligible for reimbursement pursuant to such programs. Therefore, government funding constraints could have a significant adverse effect on the REIT’s results from operations and cash flow. Further information on funding and legislation changes affecting our industry in the United States can be found under “Update of Regulatory and Reimbursement Changes Affecting Revenue – United States”.
EHSI participates in federal and state health care programs and therefore, is subject to a variety of federal and state laws that are intended to prevent health care fraud and abuse. Violation of these laws is punishable by criminal, civil and administrative penalties, including, in some instances, exclusion from participation in federal and state health care programs. These laws include, but are not limited to, anti-kickback laws, false claims laws, physician self-referral laws and federal criminal health care fraud laws. EHSI cannot reasonably predict whether enforcement activities will increase at the federal or state level or the effect of such enforcement activities on its business and its financial results.
U.S. federal law requires each state to have a Medicaid Fraud Control Unit, which is responsible for investigating provider fraud and resident abuse in Medicaid-funded centers. EHSI has been investigated by these Medicaid Fraud Units previously, but it is not aware of any liability relating thereto at this time. Management believes that EHSI and its subsidiaries have been and continue to be in material compliance with all of these laws as they apply to its companies.
EHSI believes its billing practices, operations and compensation and financial arrangements with referral sources and others materially comply with applicable federal and state requirements. However, EHSI cannot give assurance that a governmental authority will not interpret such requirements in a manner inconsistent with EHSI’s interpretation and application.
CANADA
In Canada, provincial legislation and regulations closely control all aspects of the operation and funding of nursing centers, including the fee structure, subsidies, the adequacy of physical centers, standards of care and accommodation, equipment and personnel. There can be no assurance that the currently level of fees and subsidies will be continued or that such fees will increase commensurate with ECI’s costs of care. A reduction of such fees or subsidies could have an adverse effect on the business, results of operations and financial condition of the REIT. Further information on funding and legislation changes affecting our industry in the United States can be found under “Update of Regulatory and Reimbursement Changes Affecting Revenue – Canada”.
The revocation of a license by authorities or cancellation of a service contract due to inadequate performance by the operator has been historically infrequent in Canada and is usually preceded by a series of warnings, notices and other sanctions. ECI has never had such a license or service contract revoked. While ECI endeavours to comply with all regulatory requirements in its Canadian nursing centers, it is not unusual for stringent inspection procedures to identify deficiencies in operations. Every effort is made to avoid and mitigate notices of deficiencies through quality assurance strategies. As well, all efforts are undertaken to correct all legitimate problem areas that have been identified through regulatory inspections.
In Ontario, the LTC Act 2007, which was proclaimed into force in July 2010, provides for, among other things: new licensing procedures that include more rigorous standards for license review (including public hearings); fixed license terms for up to 25 years; more onerous duties imposed on long-term care operators; unannounced annual inspections; and a more comprehensive enforcement regime. While the Ontario government has provided funding enhancements to assist the health care sector in the transition process, it remains uncertain whether adequate funding will be provided for the additional requirements imposed by the legislation.
In July 2007, the Ontario government initiated plans to redevelop 35,000 older long-term care beds in five phases over the next 10 to 15 years, and provide qualified applicants with a 25-year construction funding subsidy. ECI currently owns and operates 3,572 older long-term care beds in 23 “C” rated centers that would benefit from this redevelopment project. ECI and other operators continue to express concerns about the adequacy of the Ontario government’s construction funding subsidy of $13.30 per bed per day (see “Ontario Long-term Care Legislation – Ontario Redevelopment Program” under the heading “Update of Regulatory and Reimbursement Changes Affecting Revenue – Canada”).

Management’s Discussion and Analysis
2011 Annual Report 67
Risks Related to Litigation
LIABILITY, INSURANCE AND LITIGATION
Operators within the long-term care industry, including the REIT, face lawsuits alleging negligence, malpractice, or other related claims, and as a result, incur significant costs in connection with defending general and professional liability claims, workers’ compensation claims, and property basis claims. In addition to large compensatory claims, plaintiffs’ attorneys also seek significant punitive damages and attorney’s fees. The REIT maintains insurance coverage for the significant majority of risk associated with claims in respect to general and professional liability, trustees’, directors’ and officers’ liability, employers’ liability, auto liability, health and dental benefits, business income and property. General and professional liability policies currently offered in the long-term care industry are generally only offered on a “claims made” basis, as opposed to “occurrence based” coverage. “Claims made” policies are subject to possible rate increases upon renewal due to a step-up factor used by the insurer.
The REIT maintains general and professional liability and property insurance policies through third-party insurers, along with retaining a portion of risk within its Bermuda-based captive insurance structure, in amounts and with the coverage and deductibles it believes are adequate based on the nature and risks of its business, historical experience and industry standards, as well as the type of insurance coverage commercially available in the marketplace. Provisions for loss for our professional liability risks are based upon management’s best available information including actuarial estimates. The Bermuda-based captive insurance company of the REIT is currently appropriately capitalized, but there can be no assurance that it will remain appropriately capitalized in the future should claims against the REIT increase significantly.
From time to time, EHSI has elected to self-insure the risk associated with workers’ compensation claims up to a certain per claim limit and aggregate exposure limit, along with the arrangement of third-party insured products. In addition, EHSI self-insures its health and dental coverage. The REIT’s costs are subject to changes caused by the number and nature of claims incurred. The REIT employs risk management personnel to assist its centers in the appropriate measures to maintain a safe workplace environment and to manage workers’ compensation claims. If the REIT is not able to control these costs, this could adversely affect the business, results of operations and financial condition of the REIT.
A successful claim against the REIT not covered by, or in excess of, such insurance, or in excess of the reserves of the REIT for self-insured retention levels, could have a material adverse effect on the business, operating results, and financial condition of the REIT. In many states, state law prohibits or limits insurance coverage for the risk of punitive damages arising from professional liability and general liability claims and/or litigation. Furthermore, there are certain types of risks, generally of a catastrophic nature, such as war, non-certified acts of terrorism, or environmental contamination, which are either uninsurable or are not insurable on an economically viable basis. Under these circumstances, the REIT may be liable for such losses. Also, in order to obtain liability insurance at a more reasonable cost or in some instances to obtain coverage at all, the REIT is required to assume self-insurance retention levels for its professional liability claims. The REIT estimates the value of losses that may occur within its self-insured retention levels based on historical claims, actuarial valuations, third-party administrator estimates, industry data and advice from consultants and legal counsel and endeavours to reserve for such liabilities. If the estimates of the REIT are inaccurate or if there are an unexpectedly large number of successful claims that result in liabilities in excess of the reserves of the REIT for losses, the operating results of the REIT could be negatively affected. Claims against the REIT, regardless of their merit or eventual outcome, also may have a material adverse effect on the ability of the REIT to attract residents and patients, expand the business of the REIT or maintain favourable standings with regulatory authorities. These claims also require management to devote time to matters unrelated to the operation of the business.
The REIT has to renew its insurance policies each year or on a periodic basis and negotiate acceptable terms for coverage, exposing it to the volatility of the insurance markets, including the possibility of rate increases resulting from the claim experience of the REIT or the aggregate claim experience of the long-term care industry. There can be no assurance that the REIT will be able to obtain insurance in the future or, if available, that such coverage will be available on acceptable terms and provide coverage for perils inherent to the senior care industry.
COMPLIANCE WITH REGULATORY REQUIREMENTS
EHSI is subject to review or audit by federal and state governmental agencies to verify compliance with the requirements of the Medicare and Medicaid programs. Audits under the Medicare and Medicaid programs have intensified in recent years. Private payors may also have the right to review or audit our files. These activities could result in an obligation to repay amounts received pursuant to these programs. The payment of penalties, exclusion from participation in one or more government programs or a loss of a contract with a private payor could materially adversely affect the business results of operations and financial condition of the REIT.

68 Extendicare Real Estate Investment Trust
Management’s Discussion and Analysis
EHSI is also subject to lawsuits under the Federal False Claims act and comparable state laws. These lawsuits, which may be initiated by whistleblowers, can involve significant monetary damages, attorneys’ fees and the award of bounties to private plaintiffs who successful bring these suits and to the government programs.
There are a number of federal, state and provincial laws protecting the confidentiality of certain patient health information, including patient records, and restricting the use and disclosure of that protected information. In particular, the privacy rules under the Health Insurance Portability and Accountability Act of 1996 (HIPAA) in the U.S. and under the Personal Information Protection and Electronic Documents Act (PIPEDA) in Canada protect medical records and other personal health information by limiting their use and disclosure of health information to the minimum amount reasonably necessary to accomplish the intended purpose. If the REIT was found to be in violation of the privacy or security rules under HIPAA, PIPEDA or other laws protecting the confidentiality of patient health information, it could be subject to sanctions and civil or criminal penalties, which could increase its liabilities, harm its reputation and have a material adverse effect on the business, results of operations and financial condition of the REIT.
INDEMNIFICATION OBLIGATIONS BETWEEN ALC AND EXTENDICARE
In connection with the distribution of ALC in 2006, Extendicare and ALC entered into the Separation Agreement, the Tax Allocation Agreement, a number of transitional service agreements, and a number of operating leases and purchase agreements relating to the transfer of EHSI assisted living centers to ALC. Pursuant to the Separation Agreement, ALC has agreed to indemnify, defend and hold harmless Extendicare and certain of its related parties for identifiable losses relating to or arising from certain specified matters, including matters relating to or arising from ALC’s assisted living care business and Extendicare has agreed to indemnify, defend and hold harmless ALC and certain related parties from certain other specified matters, including matters relating to those assets and liabilities that were not transferred to ALC as part of the separation. In 2010, EHSI and ALC agreed to terminate the Tax Allocation Agreement as all tax matters regarding the prior years had been resolved to their satisfaction.
The indemnification obligations of ALC and Extendicare under the Separation Agreement could be significant. Extendicare cannot determine whether it will have to indemnify ALC for any substantial obligations after the distribution of ALC. Also, Extendicare cannot assure that if ALC has to indemnify Extendicare for any substantial obligations, ALC will be able to satisfy those obligations.
Risks Related to Tax Rules and Regulations
Extendicare REIT is subject to audits from federal, state and provincial tax jurisdictions and therefore is subject to risk in the interpretation of tax legislation and regulations. Tax regulations are complex and require careful review by tax management of the REIT and its external tax consultants. Differences in interpretation of those tax rules and regulations could result in tax assessments and penalties for the untimely payment of the determined tax liability, which could have a material adverse effect on the business, results of operations and financial condition of the REIT.
CANADIAN FEDERAL INCOME TAX ON INCOME TRUSTS
Extendicare REIT is a specified investment flow-through trust, or SIFT, and has been subject to SIFT tax since 2007, in accordance with the Budget Implementation Act, 2007, which received Royal Assent on June 22, 2007. The SIFT Amendments, as described under the heading “Canadian and U.S. Income Tax Updates – Canadian Federal Income Tax on Income Trusts” under the “Other Significant Developments” section of this MD&A, include revisions to the definitions of “SIFT trust” and “SIFT partnership” to specifically exclude certain trusts and partnerships that are wholly owned by a SIFT. The SIFT Amendments do not change the status of Extendicare REIT as a SIFT, although they confirm that Extendicare Trust, which is wholly owned by Extendicare REIT, is not a SIFT. Management has assessed the impact of the SIFT Amendments on Extendicare LP and has concluded that Extendicare LP should not be treated as a SIFT, but there can be no assurance that this will be the case.
ALC SPIN-OFF
In connection with the Arrangement, EHSI received a note upon the transfer of ALC to its Canadian affiliate, which was subsequently repaid by way of cash, settlement against other notes and dividends of US$476.6 million. Based upon internal calculations, management believes there was sufficient surplus as to not attract any Canadian taxes from the transactions relating to the repayment of the note. The REIT and its Canadian subsidiaries are currently under audit by the CRA. Should the CRA determine that the available surplus was less than the amount determined by management, Canadian capital gains tax would apply to the shortfall.

Management’s Discussion and Analysis
2011 Annual Report 69
Risks Related to Financing and Foreign Currency Exposure
DEBT FINANCING
Due to the level of real property ownership by the REIT, a significant portion of the consolidated cash flow of the REIT is devoted to servicing debt, and there can be no assurance that the REIT will continue to generate sufficient cash flow from operations to meet required interest and principal payments. If the REIT were unable to meet interest or principal payments, it could be required to seek renegotiation of such payments or obtain additional equity, debt or other financing.
EHSI is currently in the process of renewing the EHSI Credit Facility prior to its June 2012 maturity date. At December 31, 2011, EHSI had utilized US$55.6 million of the US$70.0 million available under the line.
Extendicare’s RBC Credit Facility ($70.0 million of working capital and US$10.2 million letter of credit facility) is due on demand and is primarily used to back letters of credit that renew annually. The availability under the working capital line was $29.5 million at December 31, 2011, with letters of credit of $40.5 million and US$10.2 million issued.
Global financial markets and economic events over the past few years have resulted in heightened scrutiny of banking institutions in the lending of credit, and the financial markets continue to be affected by the state of the economy in North America. The REIT cannot predict whether future financing will be available, what the terms of such future financing will be (including, whether it will result in a higher cost of borrowing) or whether its existing debt agreements will allow for the timely arrangement and implementation of such future financing. If the REIT is unable to obtain additional financing or refinancing when needed or on satisfactory terms, it could have a material adverse affect on the business, operating results and financial condition of the REIT.
DEBT COVENANTS
The REIT is in compliance with all of its financial covenants as at December 31, 2011. However, there can be no assurance that future covenant requirements will be met. The REIT’s bank lines and other debt may be affected by its ability to remain in compliance. If the REIT does not remain in compliance with its financial covenants, its ability to amend the covenants or refinance its debt may be affected.
CREDIT AND INTEREST RATES
In order to meet its monthly distributions, the REIT has limited the amount of debt that may be subject to changes in interest rates. As a result, all but $102.3 million of the REIT’s total long-term debt outstanding at December 31, 2011, was at fixed rates. The REIT primarily finances its senior care centers through fixed-rate mortgages and considers securing interest rate swap agreements for any variable-rate debt. The REIT maintains risk management control systems to monitor interest rate risk attributable to its outstanding or forecasted debt obligations as well as its offsetting hedge positions. The REIT does not enter into financial instruments for trading or speculative purposes.
FOREIGN CURRENCY RATE FLUCTUATIONS
The majority of the REIT’s operations are conducted in the United States and the financial position and results are denominated in U.S. dollars. The U.S. operations accounted for 66.7% of our consolidated revenue from continuing operations and 68.8% of our adjusted funds from operations in 2011. The revenues and expenses of the self-sustaining U.S. operations are translated at average rates of exchange in effect during the period. Assets and liabilities are translated at the exchange rates in effect at the balance sheet date. As a result, the REIT’s consolidated financial position is subject to foreign currency fluctuation risk, which could adversely impact its operating results and its cash flows.
As well, the REIT’s distributions are denominated in Canadian dollars from the operating cash flow generated by both the Canadian and U.S. operations of the REIT. As a result, the cash available for distribution could be adversely impacted by foreign currency fluctuations. Management has a foreign currency hedging strategy whereby it monitors and considers entering into foreign currency forward contracts (FCFCs) to reduce the risks associated with changes in the U.S. dollar and the impact such changes could have on the REIT’s Canadian dollar distributions. The REIT had an FCFC contract in place until June 2011. Management continues to monitor the exchange rates and to consider future FCFCs to the extent that they may be beneficial to us. There can be no assurance that the FCFCs that the REIT may put in place in the future will be sufficient to protect against currency exchange rate losses.
70 Extendicare Real Estate Investment Trust
Management’s Discussion and Analysis
Risks of Property Ownership
REAL PROPERTY OWNERSHIP
All real property investments are subject to a degree of risk. They are affected by various factors, including changes in general economic conditions (such as the availability of long-term mortgage funds) and in local conditions (such as an oversupply of space or a reduction in demand for real estate in the area), the attractiveness of the properties to patients and residents, competition from other available space and various other factors. In addition, fluctuations in interest rates could have a material adverse effect on the business, operating results and financial condition of the REIT.
Extendicare REIT owns or operates under capital lease arrangements 98% of its senior care centers, excluding those under management contracts. Senior care centers are limited in terms of alternative uses and therefore their values are directly driven by the cash flow from operations. The value of real property depends, in part, on government funding and reimbursement programs. The income of the REIT and funds available for distributions to Unitholders would be adversely affected if federal, state or provincial governments reduced their funding or reimbursement programs, or if a significant number of patients and residents of the senior care centers were to become unable to meet their financial obligations or experienced significant economic setbacks. In addition, overbuilding in any of the market areas of the REIT could cause its properties and centers to experience decreased occupancy or depressed margins, which could adversely affect the business, operating results and financial condition of the REIT. Moreover, certain significant expenditures involved in real property investments, such as real estate taxes, maintenance costs, and mortgage payments represent liabilities which must be met regardless of whether the property is producing any income.
Real property investments are relatively illiquid. This illiquidity will tend to limit the ability of the REIT to vary its portfolio promptly in response to changed economic or investment conditions. There is a risk that the REIT would not be able to sell its assets or that it may realize sale proceeds of less than the current book value of its properties.
CAPITAL INTENSIVE INDUSTRY
The REIT must commit a substantial portion of its funds to maintain and enhance its senior care centers and equipment to meet regulatory standards, operate efficiently and remain competitive in its markets. Certain of the competitors of the REIT may operate centers that are not as old as those owned by the REIT, or that may appear more modern, and therefore may be more attractive to potential patients and residents. Over the next 10 to 15 years, ECI will be required to redevelop 23 class “C” long-term care centers in accordance with the Government of Ontario’s redevelopment program (see “Ontario Long-term Care Legislation – Ontario Redevelopment Program” under the heading “Update of Regulatory and Reimbursement Changes Affecting Revenue – Canada”). These as well as other future capital requirements could have a material adverse effect on the business, operating results and financial condition of the REIT.
Risks Related to Growth Activities
CONTINUED GROWTH
The REIT expects that it will have opportunities to acquire properties or expand existing centers which may be accretive, but there can be no assurance that this will be the case. The ability of the REIT to fund growth will be dependent, in part, on external sources of funding. Lack of availability of such funding could limit the future growth of the REIT.
State and provincial efforts to regulate the construction or expansion of health care providers could impair the ability of the REIT to expand through construction and redevelopment. Most of the states in which EHSI currently operates have adopted laws to regulate the expansion of nursing centers. Certificate of need laws generally require that a state agency approve certain acquisitions or physical plant changes and determine that a need exists prior to the addition of beds or services. Some states also prohibit, restrict or delay the issuance of certificates of need, making it difficult to grow our operations other than by acquisition of existing operations and licensure rights from other providers. Many states have established similar certificates of need processes to regulate the expansion of assisted living centers, but the restrictions are less than those for nursing centers. Similarly in Canada, the provinces restrict the number of licensed nursing center beds and any new licenses are awarded through an RFP process.
If certificates of need or other similar approvals are required in order to expand operations of the REIT, the failure of the REIT or inability to obtain the necessary approvals, changes in standards applicable to such approvals and possible delays and expenses associated with obtaining such approvals could adversely affect the ability of the REIT to expand and, accordingly, to increase its revenue and earnings.

Management’s Discussion and Analysis
2011 Annual Report 71
ACQUISITIONS
The success of the acquisition activities of the REIT will be determined by numerous factors, including the ability of the REIT to identify suitable acquisition targets, competition for acquisition opportunities, purchase price, ability to obtain adequate financing on reasonable terms, financial performance of the centers after acquisition, and the ability of the REIT to effectively integrate and operate the acquired centers. Acquired properties may not meet financial or operational expectations due to unexpected costs associated with acquiring the property, as well as the general investment risks inherent in any real estate investment or acquisition. Moreover, newly acquired long-term care centers may require significant management attention or capital expenditures that would otherwise be allocated to existing centers. Any failure by the REIT to identify suitable candidates for acquisition or operate the acquired centers effectively may have an adverse effect on the business, results of operations and financial condition of the REIT.
Accounting Policies and Estimates Non-GAAP Measures
Extendicare REIT assesses and measures operating results and financial position based on performance measures referred to as “net operating income”, “EBITDA”, “earnings (loss) from continuing operations before separately reported gains/losses and distributions on Exchangeable LP Units”, “Distributable Income”, “Funds from Operations”, “Adjusted Funds from Operations” and “Adjusted Gross Book Value”. These are not measures recognized under GAAP and do not have standardized meanings prescribed by GAAP. These non-GAAP measures are presented in this document because either: (i) management believes that they are a relevant measure of the ability of the REIT to make cash distributions; or (ii) certain ongoing rights and obligations of the REIT may be calculated using these measures. Such non-GAAP measures may differ from similar computations as reported by other issuers and, accordingly, may not be comparable to similarly titled measures as reported by such issuers. They are not intended to replace net earnings (loss) for the period, cash flow, or other measures of financial performance and liquidity reported in accordance with GAAP.
References to “net operating income” in this document are to revenue less direct operating expenses. References to “EBITDA” in this document are to earnings from operations before interest, income taxes, depreciation, amortization, and accretion. In addition, in determining EBITDA, the REIT has excluded the line items: “distributions on Exchangeable LP Units”, “fair value adjustments”, “loss (gain) on foreign exchange and financial instruments”, and “loss (gain) from asset impairment, disposals and other items”. These line items are reported separately because they relate to the change in the fair value of, or gains and losses on termination of, convertible debentures, Exchangeable LP Units, interest rate agreements and FCFCs, as well as gains or losses on the disposal or impairment of assets, and foreign exchange gains or losses on capital items. In addition, in previous years these line items have included provisions for restructuring charges and the write-off of unamortized financing costs on early retirement of debt. These items are reported separately and excluded from EBITDA, because they are transitional in nature and would otherwise distort historical trends. Management believes that certain lenders, investors and analysts use EBITDA to measure a company’s ability to service debt and meet other payment obligations, and as a common valuation measurement in the long-term care industry. For example, certain of EHSI’s debt covenants use EBITDA in their calculations. EBITDA is presented by the REIT on a consistent basis from period to period, thereby allowing for consistent comparability of its operating performance.
The separately reported line items discussed above are calculated on an after-tax basis as a means of deriving the remaining earnings from operations and related earnings per unit, the results of which are referred to as “earnings before separately reported gains/losses and distributions on Exchangeable LP Units”. This is a measure commonly used by the REIT and its investors as a means of assessing the performance of the core operations in comparison to prior periods.
Distributable Income, or “DI”, is defined by Extendicare REIT’s Deed of Trust as net earnings (loss) of the REIT, on a consolidated basis, as determined in accordance with GAAP, subject to certain adjustments as set out in the REIT’s Deed of Trust. Funds from Operations, or “FFO”, is defined as net earnings (loss) of the REIT adjusted for non-cash items and other items not representative of the REIT’s operating performance. Adjusted Funds from Operations, or “AFFO”, is defined as DI further reduced by facility maintenance (non-growth) capital expenditures not already reflected in the calculation of DI.
72 Extendicare Real Estate Investment Trust
Management’s Discussion and Analysis
Critical Accounting Policies and Estimates
For a full discussion of the REIT’s accounting policies, readers should refer to the accompanying notes to the REIT’s December 31, 2011, audited consolidated financial statements and the discussion under the heading “Future Change in Accounting Policies” that follows this section. With the adoption of IFRS on January 1, 2011, the critical accounting policies and estimates have been updated to conform to this adoption. Readers should refer to notes 2, 3 and 27 to our 2011 consolidated financial statements, for a description and detailed discussion regarding the application of critical accounting estimates and judgements, significant accounting policies and an explanation of the transition to IFRS.
Management considers an understanding of the REIT’s accounting policies in the following discussion to be essential to an understanding of the REIT’s financial statements because their application requires significant judgement and reliance on estimations of matters that are inherently uncertain. There is measurement uncertainty relating to the accounting policies applied to: revenue recognition and the valuation of accounts receivable; the determination of the recoverable amount of cash generating units (CGU) subject to an impairment test; the valuation of decommissioning provisions; the valuation of self-insured liabilities; the valuation of financial assets and liabilities; the valuation of unit appreciation rights liabilities; and accounting for tax uncertainties and the tax rates used for valuation of deferred tax assets. The recorded amounts for such items are based on management’s best available information and are subject to assumptions and judgement, which may change as time progress; accordingly, actual results could differ from those estimated.
REVENUE RECOGNITION AND ACCOUNTS RECEIVABLE
In the United States, revenue from skilled nursing centers is derived from various federal and state medical assistance programs, Managed Care providers (for residents with health maintenance and commercial insurance programs), as well as privately from the residents. EHSI derived approximately 80% of its revenue from services provided under various federal or state medical assistance programs during 2011 and 2010. EHSI records its skilled nursing center revenue in the period in which the services and products are provided at established rates less contractual adjustments. Contractual adjustments include differences between established billing rates and amounts estimated by management as reimbursable under various reimbursement formulas or contracts in effect. State plan amendments and waivers are submitted to CMS for approval, which can result in changes to revenue pertaining to prior periods. Differences between final settlements and amounts recorded in previous periods are reported as adjustments to revenue in the period such settlements are determined. Due to the complexity of laws and regulations governing the federal and state reimbursement programs, there is a possibility that recorded estimates may change by a material amount.
Extendicare REIT also offers information technology services to smaller long-term care providers through its wholly owned U.S. subsidiary, Virtual Care Provider, Inc. This revenue source is primarily derived from application hosting, customer support, telecommunications, equipment sales and consulting services, and is recognized as these services are provided and equipment is delivered to our customers.
In addition, EHSI derives outpatient therapy revenue in the U.S. by providing rehabilitation therapy services to outside third parties at its clinics. This revenue source is primarily from Managed Care, workers’ compensation, self-pay clients and partly from Medicare and Medicaid. Revenue is recognized in the period in which services are provided.
In Canada, the fees charged by ECI for its nursing homes and home health care services are regulated by provincial authorities (rather than federal authorities). Accordingly, provincial programs fund a substantial portion of these fees, with the remainder paid for by the residents or customers. Each province has a different system for managing the services provided. As a result, there can be significant variability from location to location with respect to the regulations for providing care and how centers are reimbursed. In 2011, revenue from provincial programs represented approximately 66% of ECI’s nursing home operations, and approximately 97% of its home health care services.
Accounts receivable are recorded at amounts expected from federal, state and provincial reimbursement programs, other third-party payors or from individual residents. Receivables from government agencies represent the only concentrated group of accounts receivable for the REIT. As at December 31, 2011, receivables from government agencies represented approximately 73% of the total receivables. Management does not believe there is any significant credit risk associated with these government agencies other than possible funding delays. Receivables from other than government agencies consist of receivables from Managed Care providers, commercial insurers and private individuals that are subject to differing economic conditions, none of which represents any concentrated credit risk to the REIT, as there is no significant exposure to any single party. Management estimates which receivables may be collected within one year and reflects those not expected to be collected within one year as non-current assets. Management periodically evaluates the adequacy of its allowance for doubtful accounts by conducting a specific account review of amounts in excess of predefined target amounts and aging thresholds, which vary by payor type. Provisions are considered based upon

Management’s Discussion and Analysis
2011 Annual Report 73
the evaluation of the circumstances for each of these specific accounts. In addition, management has established percentages for allowance for doubtful accounts that are based upon historical collection trends for each payor type and age of these receivables. Accounts receivable that are specifically estimated to be uncollectible, based upon the above process, are fully reserved for in the allowance for doubtful accounts until they are written off or collected. If circumstances change, for instance due to an economic downturn, resulting in higher than expected defaults or denials, management’s estimates of the recoverability of receivables could be reduced by a material amount.
Due to differences in the government funding structures for the services provided, the Canadian operations are not subject to the same risks associated with the collection of accounts receivable as are the U.S. operations. As a result, approximately 93% of the REIT’s allowance for current accounts receivable at December 31, 2011, was associated with the U.S. operations. The allowance for doubtful accounts for current accounts receivable totalled $16.7 million and $17.8 million at December 31, 2011 and 2010, respectively. Days of revenue outstanding were 38 days at December 31, 2011 compared to 37 days as at December 31, 2010. This increase was primarily due to changes in Medicare billings implemented in December 2011 that resulted in a delay in processing payments.
At December 31, 2011, EHSI had $33.5 million (US$32.9 million) in Medicare and Medicaid settlement receivables pertaining to reimbursable Medicare Part A co-insurance receivables, compared to $26.3 million (US$26.5 million) at the end of 2010. There was no allowance on these receivable balances. It is expected that $10.4 million (US$10.2 million) will be substantially collected within one year and is included in accounts receivable as a current asset, compared to $8.9 million (US$8.9 million) at December 31, 2010. The remaining balance has been classified as a long-term receivable in other assets. Differences between the final settlement and amounts previously recorded are reported as adjustments to revenue in the period of determination.
VALUATION OF CASH GENERATING UNITS AND IMPAIRMENT
Non-financial assets consist of property and equipment, intangible assets with finite lives, intangible assets with indefinite lives and goodwill. A CGU is defined to be the smallest group of assets that generates cash inflows from continuing use that is largely independent of the cash inflows of other assets. The REIT has identified each individual center as a CGU.
The carrying amounts of non-financial assets are reviewed at each reporting date to determine whether there is any indication of impairment. If any such indication exists, then the asset’s recoverable amount is estimated. For goodwill, and intangible assets that have indefinite useful lives or that are not yet available for use, the recoverable amount is estimated annually at the same time or more frequently if warranted. An impairment loss is recognized in net earnings if the carrying amount of an asset or its related CGU exceeds its estimated recoverable amount.
The recoverable amount of an asset or a CGU is the greater of its value in use and its fair value less costs to sell. In assessing value in use, the estimated future cash flows are discounted to their present value using a pre-tax discount rate that reflects current market assessments of the time value of money and the risks specific to the asset or CGU. Goodwill and indefinite life intangible assets are allocated to their respective CGUs for the purpose of impairment testing. Indefinite life intangible assets and corporate assets, which do not generate separate cash flows and are utilized by more than one CGU, are allocated to each CGU for the purpose of impairment testing and are not tested for impairment separately.
Impairment losses recognized in respect of CGUs are allocated first to reduce the carrying amount of any goodwill allocated to the CGU and then to reduce the carrying amounts of the assets in the CGU on a pro rata basis. An impairment loss in respect of goodwill is not reversed. In respect of other non-financial assets, impairment losses recognized in prior periods are assessed at each reporting date for any indication that the loss has decreased or no longer exists. An impairment loss is reversed if there has been a change in the estimates used to determine the recoverable amount, and only to the extent that the asset’s carrying amount does not exceed the carrying amount that would have been determined, net of depreciation or amortization, if no impairment loss had been recognized.
The 2011 CMS Final Rule announcement in July 2010 triggered the necessity for impairment testing of our U.S. operations in the 2011 third quarter. This resulted in the recognition of a pre-tax impairment loss of $54.0 million (US$53.9 million), of which $22.4 million (US$22.3 million) was allocated to goodwill and the balance to property and equipment. Goodwill was assessed at December 31, 2011, and there was no further impairment.
The determination of recoverable amounts can be significantly impacted by estimates related to current market valuations, current and future economic conditions in the geographical markets of each CGU, and management’s strategic plans within each of its markets. Estimates and assumptions used in the determination of the impairment loss were based upon information that was known at the time, along with future outlook.

74 Extendicare Real Estate Investment Trust
Management’s Discussion and Analysis
In performing the 2011 third quarter impairment test on the U.S. operations, the key assumptions used to determine the recoverable amounts were as follows: capitalization rates of 13.1% for nursing centers and 9.1% for assisted living centers; annual maintenance capital expenditures per bed of US$300; and management fees of 5% of revenue. The recoverable amount calculations used discounted pre-tax cash flow projections determined from financial projections based upon both historical and forecasted amounts on which capitalization rates were applied. The calculation was based on the following key assumptions: cash flows were projected based upon historical financial performance along with the forecast impact of Medicare rate reductions in the coming year and past experience on average daily census, factoring in the historical maintenance capital expenditures and management fees; and capitalization rates were based on industry standards on recent transactions.
Based upon this impairment assessment performed for the U.S. operations in the 2011 third quarter, a 10-basis point increase in the capitalization rate would cause a $0.2 million increase in goodwill impairment. Goodwill was assessed at December 31, 2011, and there is no further impairment on the goodwill. As for our Canadian operations, an impairment assessment was performed at the end of 2011, which determined that there was no impairment of the assets. A 10-basis point increase in the capitalization rate applied for the Canadian operations impairment test would have had no impact on the results.
DECOMMISSIONING PROVISIONS
Management has determined that future costs could be incurred for possible asbestos remediation of the REIT’s pre-1980 constructed centers. Though asbestos is currently not a health hazard in any of these centers, appropriate remediation procedures may be required to remove potential asbestos-containing materials, consisting primarily of floor and ceiling tiles, in connection with any major renovation or demolition.
As at December 31, 2011, the decommissioning provision, which related to asbestos remediation, was $26.1 million compared to $24.2 million at the beginning of the year, with the increase primarily due to the accretion in value. The fair value of the decommissioning provision is estimated by computing the present value of the estimated future costs of remediation based on estimated expected dates of remediation. The computation is based on a number of assumptions, which may vary in the future depending upon the availability of new information, changes in technology and in costs of remediation, and other factors.
The following assumptions were used in calculating the decommissioning provision: (a) discount rates of 6.75% for centers located in Canada and 7.10% for centers located in the U.S.; (b) an estimated timing of the settlement of the provision ranging from 10 to 30 years; and (c) an estimated undiscounted cash flow amount to settle the provision of approximately $50.0 million. There were no changes to the initial timing and estimates of undiscounted cash flow amounts in 2011.
SELF-INSURED LIABILITIES
The REIT self-insures for certain risks related to comprehensive general and professional liability (including malpractice insurance), and to a limited degree, workers’ compensation (for certain periods), auto liability and health benefits. The REIT maintains liability insurance policies through third-party insurers as well as retaining a portion of the risk within its Bermuda-based captive at a level which the REIT believes to be adequate based upon the nature and risks of its business, historical experience and industry standards along with the type of insurance coverage commercially available in the marketplace. The employee related self-insured risks are primarily due within twelve months and therefore are not discounted and are included within accrued liabilities as a current liability. The accrual for self-insured liabilities is discounted based upon the projected timing of future payment obligations.
General and professional liability claims are the most volatile and significant type of risks for which the REIT self-insures. Furthermore, claim payments for any particular policy year can occur over a period of several years that are limited by state or provincial regulations. The accrual for self-insured liabilities is based on management’s best estimate of the ultimate cost to resolve general and professional liability claims, including both known claims and claims that have been incurred but not yet reported by the end of the reporting period. The REIT estimates the value of losses that may occur within its self-insured retention levels based upon individual assessment of the settlement using historical information and industry data, supported by actuarial projections, advice from legal counsel, consultants and external risk management. Actual results can differ materially from the estimates made due to a number of factors including the assumptions used by management and other market forces.
Management regularly evaluates and periodically engages an independent third-party actuary to provide a report to determine the appropriateness of the carrying value of this liability. Assumptions underlying the determination of the liability are limited by the uncertainty of predicting future events and assessments regarding expectations of several factors. Such factors include, but are not limited to: the frequency and severity of


76 Extendicare Real Estate Investment Trust
Management’s Discussion and Analysis
Impact of IFRS Adoption on Key Performance Metrics
Adjusted Funds from Operations
AFFO did not change significantly under IFRS.
Earnings per Unit (EPU)
Under previous Canadian GAAP, both the REIT Units and Exchangeable LP Units were treated as equity, and were both considered for the EPU calculations presented on our financial statements.
Under IFRS, our REIT Units are considered “puttable instruments” under IAS 32, and can continue to be presented as equity. However, the Exchangeable LP Units are presented as a financial liability under IFRS. Therefore, the REIT is no longer reporting EPU under IFRS. However, the REIT discloses FFO, DI and AFFO on a per unit basis, treating the Exchangeable LP Units as equity, as it believes these are more relevant measures of the REIT’s performance and of its ability to distribute cash.
Impact of IFRS Adoption on the Financial Statements
Please refer to note 27 of the 2011 consolidated financial statements for a complete summary of the difference and reconciliation between previous Canadian GAAP and IFRS.
Future Change in Accounting Policies
The following new accounting policies have been issued, and will impact us at a future date.
Financial Instruments: In November 2009, the International Accounting Standards Board (the “IASB”) issued IFRS 9 “Financial Instruments (IFRS 9 (2009))”, and in October 2010, the IASB published amendments to IFRS 9 (IFRS 9 (2010)). In December 2011, the IASB issued an amendment to IFRS 9 to defer the mandatory effective date to annual periods beginning on or after January 1, 2015. The REIT has yet to assess the impact of the new standard on its results of operations, financial position and disclosures.
Financial Instruments – Disclosures: In October 2010, the IASB issued amendments to IFRS 7 “Disclosures – Transfers of Financial Assets”, which is effective for annual periods beginning on or after January 1, 2012. We do not expect the amendments to have a material impact on the financial statements, because of the nature of the REIT’s operations and the types of financial assets that it holds.
Consolidated Financial Statements: In May 2011, the IASB issued IFRS 10 “Consolidated Financial Statements”, which is effective for annual periods beginning on or after January 1, 2013, with early adoption permitted. If an entity applies this standard earlier, it shall also apply IFRS 11 “Joint Arrangements”, IFRS 12 “Disclosure of Interests in Other Entities”, IAS 27 (2011) and IAS 28 (2011) “Investments in Associates” at the same time. The REIT intends to adopt IFRS 10 in its financial statements for the annual period beginning on January 1, 2013, and does not expect this new standard to have a significant impact on its financial statements.
Disclosure of Interests in Other Entities: In May 2011, the IASB issued IFRS 12 “Disclosure of Interests in Other Entities”, which is effective for annual periods beginning on or after January 1, 2013, with early adoption permitted. If an entity applies some of the requirements of this standard earlier, it does not need to apply IFRS 10, IFRS 11, IAS 27 (2011) and IAS 28 (2011) at the same time. The REIT intends to adopt IFRS 12 in its financial statements for the annual period beginning on January 1, 2013, and does not expect this new standard to have a significant impact on its financial statements.
Fair Value Measurement: In May 2011, the IASB published IFRS 13 “Fair Value Measurement”, which is effective prospectively for annual periods beginning on or after January 1, 2013. The disclosure requirements of IFRS 13 need not be applied to comparative information for periods before initial application. The REIT is assessing the impact of this new standard.
Presentation of Financial Statement – Other Comprehensive Income: In June 2011, the IASB published amendments to IAS 1 “Presentation of Financial Statements: Presentation of Items of Other Comprehensive Income”, which are effective for annual periods beginning on or after July 1, 2012 and are to be applied retrospectively. Early adoption is permitted. The REIT intends to adopt the amendments in its financial statements for the annual period beginning on January 1, 2013. As the amendments only require changes in the presentation of items in other comprehensive income, we do not expect these amendments to have a material impact on the financial statements.

Management’s Discussion and Analysis
2011 Annual Report 77
Post-employment Benefits: In June 2011, the IASB published an amended version of IAS 19 “Employee Benefits”. Adoption of the amendments is required for annual periods beginning on or after January 1, 2013, with early adoption permitted. The amendments are generally applied retrospectively with certain exceptions. The REIT currently reflects changes in assets and liabilities from defined benefit pension plans within other comprehensive income; therefore, we do not expect the amended standard to have a significant impact on its financial statement presentation.
Offsetting Financial Assets and Liabilities: In December 2011, the IASB published “Offsetting Financial Assets and Financial Liabilities” and issued new disclosure requirements in IFRS 7 “Financial Instruments: Disclosures”. The effective date for the amendments to IAS 32 “Financial Instruments: Presentation” is annual periods beginning on or after January 1, 2014. The effective date for the amendments to IFRS 7 is annual periods beginning on or after January 1, 2013. These amendments are to be applied retrospectively. The REIT does not expect the amendments to have a significant impact on its financial statements.
Disclosure Controls and Procedures
Disclosure Controls and Procedures (DC&P) are designed to provide reasonable assurance that all relevant information is gathered and reported to senior management, including the Chief Executive Officer (CEO) and the Chief Financial Officer (CFO), on a timely basis so that appropriate decisions can be made regarding public disclosure.
An evaluation of the effectiveness of the DC&P was conducted as at December 31, 2011, by management under the supervision of the REIT’s CEO and CFO. Based on this evaluation, the CEO and CFO have concluded that as at December 31, 2011, our disclosure controls and procedures, as defined by National Instrument 52-109, Certification of Disclosures in Issuers’ Annual and Interim Filings, are effective.
Internal Control over Financial Reporting
Internal Control over Financial Reporting (ICFR) is designed to provide reasonable assurance regarding the reliability of financial reporting and the preparation of financial statements in accordance with Canadian GAAP. Management, under the supervision of the REIT’s CEO and CFO, has evaluated the effectiveness of our ICFR using the framework and criteria established by the Committee of Sponsoring Organizations of the Treadway Commission. Based on this evaluation, management has concluded that our ICFR was effective and that there were no material weaknesses in our ICFR as at December 31, 2011.
Additional InformationAdditional information about Extendicare REIT, including the Annual Information Form, may be found on the SEDAR website at www.sedar.com and on Extendicare’s website at www.extendicare.com. A copy of this document and other public documents of the REIT are available upon request to the Secretary of the REIT.

78 Extendicare Real Estate Investment Trust
Consolidated Financial Statements
Management�s Responsibility for Financial StatementsThe accompanying consolidated financial statements of Extendicare Real Estate Investment Trust (the “REIT”) and other financial information contained in this Annual Report are the responsibility of management. The consolidated financial statements have been prepared in conformity with International Financial Reporting Standards, using management’s best estimates and judgements, where appropriate. In the opinion of management, these consolidated financial statements reflect fairly the financial position, results of operations and cash flows of the REIT within reasonable limits of materiality. The financial information contained elsewhere in this Annual Report has been reviewed to ensure consistency with that in the consolidated financial statements.
A system of internal accounting and administrative controls is maintained by management to provide reasonable assurance that assets are safeguarded against loss from unauthorized use or disposition and that financial records are properly maintained to provide accurate and reliable financial statements.
The board of trustees of the REIT (the “Board of Trustees”) is responsible for ensuring that management fulfills its responsibilities for financial reporting and internal controls. The Board of Trustees carries out this responsibility principally through its independent Audit Committee comprised of unrelated and outside trustees. The Audit Committee meets regularly during the year to review significant accounting and auditing matters with management and the independent auditors and to review the interim and annual consolidated financial statements of the REIT.
The consolidated financial statements have been audited by KPMG LLP, Chartered Accountants, which has full and unrestricted access to the Audit Committee. KPMG’s report on the consolidated financial statements follows.
(signed) (signed)
TIMOTHY L. LUKENDA DOUGLAS J. HARRIS
President and Chief Executive Officer Senior Vice President and Chief Financial Officer
February 29, 2012

2011 Annual Report 79
Independent Auditors’ ReportTo the Unitholders of Extendicare Real Estate Investment Trust
We have audited the accompanying consolidated financial statements of Extendicare Real Estate Investment Trust (the “REIT”), which comprise the consolidated statements of financial position as at December 31, 2011, December 31, 2010 and January 1, 2010, and the consolidated statements of earnings (loss), comprehensive income (loss), changes in equity and cash flows for the years ended December 31, 2011 and December 31, 2010, and notes, comprising a summary of significant accounting policies and other explanatory information.
MAnAgeMent’s ResponsIbIlIty foR the consolIdAted fInAncIAl stAteMents
Management is responsible for the preparation and fair presentation of these consolidated financial statements in accordance with International Financial Reporting Standards, and for such internal control as management determines is necessary to enable the preparation of consolidated financial statements that are free from material misstatement, whether due to fraud or error.
AudItoRs’ ResponsIbIlIty
Our responsibility is to express an opinion on these consolidated financial statements based on our audits. We conducted our audits in accordance with Canadian generally accepted auditing standards. Those standards require that we comply with ethical requirements and plan and perform the audit to obtain reasonable assurance about whether the consolidated financial statements are free from material misstatement.
An audit involves performing procedures to obtain audit evidence about the amounts and disclosures in the consolidated financial statements. The procedures selected depend on our judgement, including the assessment of the risks of material misstatement of the consolidated financial statements, whether due to fraud or error. In making those risk assessments, we consider internal control relevant to the entity’s preparation and fair presentation of the consolidated financial statements in order to design audit procedures that are appropriate in the circumstances, but not for the purpose of expressing an opinion on the effectiveness of the entity’s internal control. An audit also includes evaluating the appropriateness of accounting policies used and the reasonableness of accounting estimates made by management, as well as evaluating the overall presentation of the consolidated financial statements.
We believe that the audit evidence we have obtained in our audits is sufficient and appropriate to provide a basis for our audit opinion.
opInIon
In our opinion, the consolidated financial statements present fairly, in all material respects, the consolidated financial position of the REIT as at December 31, 2011, December 31, 2010 and January 1, 2010 and its consolidated financial performance and its consolidated cash flows for the years ended December 31, 2011 and December 31, 2010 in accordance with International Financial Reporting Standards.
(signed KPMG LLP)
Chartered Accountants, Licensed Public Accountants
Toronto, Canada February 29, 2012

80 Extendicare Real Estate Investment Trust
Consolidated Financial Statements
consolidated statements of financial position December 31, December 31, January 1, (in thousands of Canadian dollars) Notes 2011 2010 2010
AssetsCurrent assets Cash and short-term investments 80,018 267,759 134,012 Restricted cash 11 16,848 10,095 22,361 Accounts receivable 5 222,707 212,610 213,477 Income taxes recoverable 8,223 3,182 29,314 Other current assets 32,279 23,670 56,123
Total current assets 360,075 517,316 455,287
Non-current assets Property and equipment 6 1,192,913 1,206,656 1,243,870 Goodwill and other intangible assets 7 87,269 110,272 115,680 Other assets 8 154,695 126,200 133,649 Deferred tax assets 20 35,752 34,190 36,400
Total non-current assets 1,470,629 1,477,318 1,529,599
Total Assets 26 1,830,704 1,994,634 1,984,886
Liabilities and EquityCurrent liabilities Accounts payable and accrued liabilities 9 266,934 266,280 283,778 Income taxes payable 10,519 – – Long-term debt 11 192,698 571,168 30,126 Provisions 10 24,408 16,013 11,321 Exchangeable LP Units 13, 18 – 29,264 –
Total current liabilities 494,559 882,725 325,225
Non-current liabilities Long-term debt 11 941,742 670,028 1,219,330 Provisions 10 81,120 60,383 61,743 Other long-term liabilities 12, 13, 18 49,638 44,155 72,830 Deferred tax liabilities 20 215,326 224,349 235,910
Total non-current liabilities 1,287,826 998,915 1,589,813
Total liabilities 26 1,782,385 1,881,640 1,915,038
Unit capital 13 453,150 421,213 332,069 Contributed surplus 81 81 81 Accumulated deficit (386,174) (287,525) (262,157)Accumulated other comprehensive loss (18,738) (20,775) (145)
Unitholders’ equity 48,319 112,994 69,848
Total Liabilities and Equity 1,830,704 1,994,634 1,984,886
See accompaning notes to consolidated financial statements.
Subsequent events (note 11).
Commitments and contingencies (notes 11 and 21).
Approved by the Trustees
Mel Rhinelander Timothy L. Lukenda Chairman and Trustee President and Chief Executive Officer
(signed) (signed)

Consolidated Financial Statements
2011 Annual Report 81
consolidated statements of earnings (loss)(in thousands of Canadian dollars) Years ended December 31 Notes 2011 2010
CONTINUING OPERATIONSRevenueNursing and assisted living centers United States 1,355,289 1,397,452 Canada 525,831 495,610 Home health care – Canada 165,030 157,177 Health technology services – United States 19,120 17,205 Outpatient therapy – United States 13,750 12,603 Management, consulting and other services 15,062 17,369
Total revenue 15, 20 2,094,082 2,097,416
Operating expenses 1,813,792 1,771,168 Administrative costs 69,155 72,630 Lease costs 10,999 11,548
Total expenses 16 1,893,946 1,855,346
Earnings before depreciation, amortization, loss from asset impairment, disposals and other items 200,136 242,070 Depreciation and amortization 76,577 73,769 Loss from asset impairment, disposals and other items 17 62,496 2,948
Results from operating activities 61,063 165,353
Interest expense 89,634 88,967 Accretion of decommissioning provisions 1,606 1,614 Other accretion 423 514 Distributions on Exchangeable LP Units 2,179 2,702 Fair value adjustments – 4,649
Finance costs 93,842 98,446
Interest revenue 4,322 4,244 Fair value adjustments 6,023 – Gains on foreign exchange and financial instruments 553 3,280
Finance income 10,898 7,524
Net finance costs 18 82,944 90,922
Earnings (loss) before income taxes (21,881) 74,431
Income tax expense (recovery)Current 28,280 34,320 Deferred (14,838) 3,207
Total income tax expense 20 13,442 37,527
Earnings (loss) from continuing operations (35,323) 36,904
DISCONTINUED OPERATIONSEarnings from discontinued operations, net of income taxes 19, 20 4,927 4,925
Net earnings (loss) (30,396) 41,829
See accompaning notes to consolidated financial statements.

82 Extendicare Real Estate Investment Trust
Consolidated Financial Statements
consolidated statements of changes in equity For the twelve months ended December 31, 2010
Total Unit- Number Unit Contributed Accumulated holders’ (amounts in thousands of Canadian dollars) of Units Capital Surplus Deficit OCI (loss) Equity
Balance at January 1, 2010 69,896,968 332,069 81 (262,157) (145) 69,848 Total comprehensive income Net earnings 41,829 41,829 Other comprehensive loss Foreign currency translation differences for foreign operations (19,007) (19,007) Net change in fair value of available-for-sale financial assets, net of tax 1,062 1,062 Net change in fair value of available-for-sale financial assets transferred to profit or loss, net of tax (488) (488) Defined benefit plan actuarial gains and losses, net of tax (2,197) (2,197)
Total other comprehensive loss – – – (20,630) (20,630)
Total comprehensive income – – 41,829 (20,630) 21,199
Transactions with unitholders, recorded directly in equity Issuance (note 13) 9,228,750 83,321 83,321 DRIP 584,112 5,324 5,324 Conversion from Exchangeable LP Units 121,636 499 499 Distributions declared (66,115) (66,115) Adjustment to prior year distribution of ALC (1,082) (1,082)
Total transactions with unitholders 9,934,498 89,144 – (67,197) – 21,947
Balance at December 31, 2010 79,831,466 421,213 81 (287,525) (20,775) 112,994
consolidated statements of comprehensive Income (loss)(in thousands of Canadian dollars) Years ended December 31 Notes 2011 2010
Net earnings (loss) (30,396) 41,829 Other comprehensive income (loss), net of income taxesUnrealized gain on available-for-sale securities 14 59 1,062 Reclassification of realized gain on available-for-sale securities to earnings 14 (115) (488)Defined benefit plan actuarial loss, net of tax (3,280) (2,197)Net change in foreign currency translation adjustment 14 5,373 (19,007)
Other comprehensive income (loss), net of tax 2,037 (20,630)
Total comprehensive income (loss) (28,359) 21,199
See accompaning notes to consolidated financial statements.
Consolidated Financial Statements
2011 Annual Report 83
consolidated statements of changes in equity For the twelve months ended December 31, 2011
Total Unit- Number Unit Contributed Accumulated holders’ (amounts in thousands of Canadian dollars) of Units Capital Surplus Deficit OCI (loss) Equity
Balance at January 1, 2011 79,831,466 421,213 81 (287,525) (20,775) 112,994 Total comprehensive loss Net loss (30,396) (30,396) Other comprehensive income Foreign currency translation differences for foreign operations 5,373 5,373 Net change in fair value of available-for-sale financial assets, net of tax 59 59 Net change in fair value of available-for-sale financial assets transferred to profit or loss, net of tax (115) (115) Defined benefit plan actuarial losses, net of tax (3,280) (3,280)
Total other comprehensive income – – – 2,037 2,037
Total comprehensive loss – – (30,396) 2,037 (28,359)
Transactions with unitholders, recorded directly in equity DRIP 1,123,294 9,245 9,245 Conversion from Exchangeable LP Units 3,166,024 22,684 22,684 Conversion from convertible debentures 704 8 8 Distributions declared (67,921) (67,921) Other (332) (332)
Total transactions with unitholders 4,290,022 31,937 – (68,253) – (36,316)
Balance at December 31, 2011 84,121,488 453,150 81 (386,174) (18,738) 48,319
See accompaning notes to consolidated financial statements.
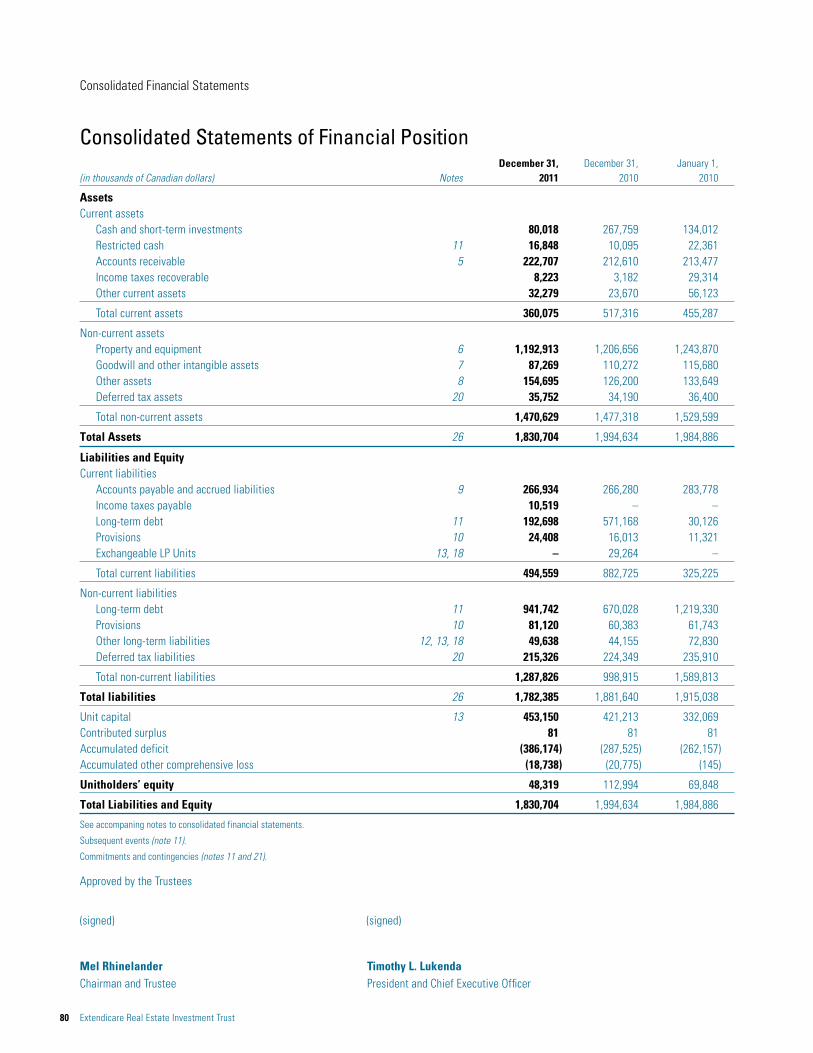
84 Extendicare Real Estate Investment Trust
Consolidated Financial Statements
consolidated statements of cash flows(in thousands of Canadian dollars) Years ended December 31 2011 2010
Operating ActivitiesNet earnings (loss) (30,396) 41,829 Adjustments for: Depreciation and amortization 76,658 73,877 Accrual for self-insured liabilities in provisions 65,266 33,137 Payments for self-insured liabilities in provisions (35,103) (24,860) Deferred taxes (14,838) 3,206 Current taxes 31,316 37,419 Loss from asset impairment, disposals and other items 62,496 2,948 Net finance costs 82,944 90,923 Interest capitalized (195) (1,262) Other 399 524
238,547 257,741 Net change in operating assets and liabilities Accounts receivable (10,545) (10,588) Other current assets (11,210) 1,691 Accounts payable and accrued liabilities (4,525) (8,477)
212,267 240,367 Interest paid (83,531) (85,797)Interest received 4,278 4,214 Income taxes paid (26,235) (13,391)
Net cash from operating activities 106,779 145,393
Investing ActivitiesPurchase of property, equipment and software (64,308) (68,691)Purchase of nursing center, net of cash acquired (7,299) – Net proceeds from dispositions 4,805 28,982 Purchase of other assets (1,104) (1,308)
Net cash from investing activities (67,906) (41,017)
Financing ActivitiesIssue of long-term debt, excluding line of credit 402,327 68,308 Repayment of long-term debt, excluding line of credit (551,250) (46,344)Issue on line of credit 81,195 – Repayment on line of credit (45,474) (6,849)Decrease (increase) in restricted cash (6,753) 12,266 Decrease in investments held for self-insured liabilities (21,053) (5,139)Distributions paid (58,375) (60,081)Issue of units – 82,212 Financing costs (28,315) (7,508)Other 455 (726)
Net cash from financing activities (227,243) 36,139
Increase (decrease) in cash and cash equivalents (188,370) 140,515 Cash and cash equivalents at beginning of year 267,759 134,012 Foreign exchange gain (loss) on cash held in foreign currency 629 (6,768)
Cash and cash equivalents at end of year 80,018 267,759
See accompaning notes to consolidated financial statements.Cash distributions for REIT and Exchangeable LP units are at the discretion of the Board of Trustees.

Consolidated Financial Statements
2011 Annual Report 85
Notes to Consolidated Financial Statements
table of contentsNote 1. General Information and Nature of the Business ........................................................................................................................................... 86Note 2. Basis of Preparation ....................................................................................................................................................................................... 86Note 3. Significant Accounting Policies ...................................................................................................................................................................... 87Note 4. Future Changes in Accounting Policies .......................................................................................................................................................... 96Note 5. Accounts Receivable ...................................................................................................................................................................................... 97Note 6. Property and Equipment ................................................................................................................................................................................. 98Note 7. Goodwill and Other Intangible Assets............................................................................................................................................................ 99Note 8. Other Assets ................................................................................................................................................................................................. 101Note 9. Accounts Payable and Accrued Liabilities .................................................................................................................................................... 102Note 10. Provisions ..................................................................................................................................................................................................... 103Note 11. Long-term Debt ............................................................................................................................................................................................ 104Note 12. Other Long-term Liabilities ........................................................................................................................................................................... 111Note 13. Unit Capital .................................................................................................................................................................................................. 112Note 14. Equity Reserves ............................................................................................................................................................................................ 113Note 15. Revenue........................................................................................................................................................................................................ 113Note 16. Expenses by Nature ...................................................................................................................................................................................... 113Note 17. Loss from Asset Impairment, Disposals and Other Items............................................................................................................................. 114Note 18. Finance Costs and Finance Income .............................................................................................................................................................. 115Note 19. Discontinued Operations .............................................................................................................................................................................. 116Note 20. Income Taxes ................................................................................................................................................................................................ 116Note 21. Commitments and Contingencies ................................................................................................................................................................. 120Note 22. Employee Benefits ........................................................................................................................................................................................ 121Note 23. Management of Risks and Financial Instruments ........................................................................................................................................ 123Note 24. Capital Management .................................................................................................................................................................................... 129Note 25. Related Party Transactions ........................................................................................................................................................................... 132Note 26. Segmented Information ................................................................................................................................................................................ 133Note 27. Explanation of Transition to IFRS ................................................................................................................................................................. 136Note 28. Significant Subsidiaries ................................................................................................................................................................................ 147

86 Extendicare Real Estate Investment Trust
Notes to Consolidated Financial Statements
years ended december 31, 2011 and 2010 (Tabular amounts in thousands of Canadian dollars, unless otherwise noted)
1. general Information and nature of the businessExtendicare Real Estate Investment Trust is an unincorporated, open-ended real estate investment trust established under the laws of the Province of Ontario by a deed of trust dated September 11, 2006, as amended and restated on October 28, 2006 and on December 15, 2010 (the “Deed of Trust”). References to “Extendicare REIT”, the “REIT”, “we”, “us” and “our” in these statements mean Extendicare Real Estate Investment Trust alone or together with its subsidiaries, as the context requires. The registered office of Extendicare REIT is located at 3000 Steeles Avenue East, Markham, Ontario, Canada, L3R 9W2. The units of Extendicare REIT are traded on the Toronto Stock Exchange (TSX) under the symbol “EXE.UN”.
Extendicare REIT is the successor in interest to Extendicare Inc. (Extendicare) resulting from the conversion of Extendicare to an unincorporated, open-ended limited purpose trust on November 10, 2006, pursuant to a plan of arrangement (the “Arrangement”). The conversion has been accounted for as a continuity of interests, and accordingly, the consolidated financial statements of the REIT are reflective as if the REIT had always carried on the business formerly carried on by Extendicare.
At a meeting held on November 8, 2011, the board of the trustees of the REIT (the “Board of Trustees”) unanimously approved the conversion of the REIT (the “Conversion”) from an income trust structure to a corporate structure under a new corporation (New Extendicare). The Board of Trustees unanimously determined that the Conversion is in the best interests of the REIT and its unitholders (the “Unitholders”) and recommends that the Unitholders vote in favour of it. In evaluating and approving the Conversion and in making its determination and recommendation, the Board of Trustees relied upon legal, tax and other advice and information received during the course of its deliberations. The Conversion must be approved by two-thirds of the votes cast by Unitholders voting in person or by proxy at a special meeting of Unitholders to be held on May 8, 2012, and is also subject to the approval of the Ontario Superior Court of Justice and regulatory approvals, including the approval of the TSX.
Under the Conversion, which is anticipated to be completed on July 1, 2012, Unitholders will exchange their REIT Units for common shares of New Extendicare on the basis of one common share of New Extendicare for each REIT Unit. In addition, New Extendicare will assume all of the obligations of Extendicare REIT in respect of the REIT’s outstanding 5.70% convertible unsecured subordinated debentures due June 30, 2014, and 7.25% convertible unsecured subordinated debentures due June 30, 2013 (collectively, the “Convertible Debentures”). As a result, following the completion of the Conversion, holders of the Convertible Debentures will be entitled to receive common shares of New Extendicare on the same basis as REIT Units were previously issuable on the conversion thereof.
Extendicare REIT is a leading North American provider of post-acute and long-term senior care services. The REIT itself is not a provider of services or products. The direct ownership and operation of the senior care centers and ancillary businesses is conducted by the subsidiaries of the REIT. Through our wholly owned U.S. subsidiary, Extendicare Health Services, Inc. and its subsidiaries (collectively “EHSI”) and our wholly owned Canadian subsidiary, Extendicare (Canada) Inc. and its subsidiaries (collectively “ECI”), our principle business is the provision of post-acute, rehabilitative therapies and long-term care through our network of owned and operated senior care centers that include skilled nursing centers in the United States and nursing centers in Canada.
2. basis of preparation(a) Statement of Compliance
The consolidated financial statements have been prepared in accordance with International Financial Reporting Standards (IFRS). These are the REIT’s first consolidated financial statements prepared in accordance with IFRS, and IFRS 1 First-time Adoption of Financial Reporting Standards has been applied. The REIT transitioned to IFRS as at January 1, 2010 (the “Transition Date”). Periods prior to January 1, 2010, have not been restated, and are prepared under previous Canadian generally accepted accounting principles (GAAP).
A summary of the differences between IFRS and previous Canadian GAAP is outlined in note 27 along with reconciliations from previous Canadian GAAP to IFRS. An explanation of how the transition to IFRS has affected the reported financial position, financial performance and cash flows of the REIT is set out in that note; reconciliations of equity and total comprehensive income for comparative periods as well as reconciliations of equity at the date of transition reported under the previous Canadian GAAP to those reported under IFRS for the same periods are also provided.
These consolidated financial statements were approved by the Board of Trustees on February 29, 2012.

Notes to Consolidated Financial Statements
2011 Annual Report 87
(b) Basis of Measurement
The consolidated financial statements have been prepared on the historical cost basis except for financial assets and liabilities classified or designated at fair value through profit or loss (FVTPL) or designated as available for sale (AFS) that have been measured at fair value. Refer to note 3 for the classification of financial assets and liabilities.
The REIT’s consolidated financial statements are presented in Canadian dollars, which is the REIT’s functional currency. All financial information presented in Canadian dollars has been rounded to the nearest thousand, unless otherwise noted.
(c) Use of Estimates and Judgement
The preparation of financial statements in conformity with IFRS requires management to make judgements, estimates and assumptions that affect the application of accounting policies and the reported amounts of assets and liabilities, disclosures of contingent assets and liabilities at the date of the consolidated financial statements, and the reported amounts of revenue and expenses during the reporting period. Estimates and underlying assumptions are reviewed on an ongoing basis. Revisions to accounting estimates are recognized in the period in which the estimates are revised and in any future periods affected.
The more subjective of such estimates and judgement are:
• revenue recognition (note 15) ; • valuation of self-insured liabilities (note 10) ;
• valuation of accounts receivable (notes 5 and 23(a)) ; • valuation of financial assets and liabilities (note 23(b)) ;
• determination of the recoverable amount of cash generating units • valuation of unit appreciation rights liabilities (note 12) ; and
(CGU) subject to an impairment test (note 7) ; • accounting for tax uncertainties and the tax rates used for • valuation of decommissioning provisions (note 10) ; valuation of deferred taxes (note 20).
The recorded amounts for such items are based on management’s best available information and are subject to assumptions and judgement, which may change as time progresses; accordingly, actual results could differ from estimates.
3. significant Accounting policiesThe accounting policies set out below have been applied consistently to all periods presented in these consolidated financial statements and in preparing the opening IFRS statement of financial position on January 1, 2010, the REIT’s Transition Date.
(a) Basis of Consolidation
The consolidated financial statements include the accounts of Extendicare REIT and its subsidiaries. All material intercompany transactions and balances have been eliminated. The financial statements of the REIT’s subsidiaries are included within the REIT’s consolidated financial statements from the date that control commences until the date that control ceases, and are prepared for the same reporting period as the REIT, using consistent accounting policies.
The acquisition method of accounting is used to account for the acquisition of subsidiaries. Consideration transferred on the acquisition is measured as the fair value of the assets given, equity instruments issued and liabilities incurred or assumed on the date of the acquisition and transaction costs are expensed as incurred. Identified assets acquired and liabilities assumed are generally measured at their fair value on the acquisition date. In determining the fair value of identifiable intangible assets acquired, values are assigned to resident relationships as described in note 3(i)ii. The excess of fair value of consideration given over the fair value of the identifiable net assets acquired is recorded as goodwill, with any negative goodwill being recognized in net earnings on the acquisition date.
For acquisitions prior to January 1, 2010, goodwill represents the amount recognized under previous Canadian GAAP, subject to an impairment test on the Transition Date. In the transition to IFRS, the REIT elected not to restate business combinations prior to January 1, 2010.

88 Extendicare Real Estate Investment Trust
Notes to Consolidated Financial Statements
(b) Foreign Currency
i. Foreign operations
The assets and liabilities of foreign operations are translated at exchange rates at the reporting date. The income and expenses of foreign operations are translated at average rates of exchange for the period. The resulting translation adjustments are included in accumulated other comprehensive income (AOCI) in unitholders’ equity. When a foreign operation is disposed of, the relevant amount in the cumulative amount of foreign currency translation differences is transferred to net earnings as part of the profit or loss on disposal. When only part of the interest in a subsidiary that includes a foreign operation is disposed of, the relevant proportion of such cumulative amount is reattributed to non-controlling interest. Foreign exchange gains and losses related to intercompany loans that are, in substance, part of the net investment in a foreign operation are included in AOCI. Foreign exchange gains and losses on intercompany loans with planned or foreseeable settlement are included in “net finance costs” within net earnings.
ii. Foreign currency transactions
Transactions in foreign currencies are translated at exchange rates at the dates of the transactions. Monetary assets and liabilities denominated in foreign currencies at the reporting date are retranslated to the functional currency at the exchange rate at that date. Non-monetary assets and liabilities denominated in foreign currencies that are measured at fair value are retranslated at the exchange rate at the date that the fair value was determined. Foreign currency differences arising on retranslation are recognized in net earnings, except for differences arising on the retranslation of available-for-sale equity instruments which are recognized in other comprehensive income (OCI). Non-monetary items that are measured at historical cost in a foreign currency are translated using the exchange rate at the date of the transaction. Foreign exchange gains and losses presented in net earnings are included in “net finance costs”.
(c) Cash and Cash Equivalents
Cash and cash equivalents include unrestricted cash and short-term investments less bank overdraft and outstanding cheques. Short-term investments, comprised of money market instruments, have a maturity of 90 days or less from their date of purchase.
(d) Accounts Receivable
Receivables from government agencies represent the only concentrated group of accounts receivable for EHSI and ECI. In the United States, EHSI has receivables from federal and state medical assistance programs, other third-party payors and from individuals. In Canada, ECI has receivables primarily from provincial government agencies. Management does not believe there is any credit risk associated with these government agencies other than possible funding delays. Accounts receivable other than from government agencies consist of receivables from Managed Care providers, commercial insurers and private individuals that are subject to different economic conditions, none of which represents any concentrated credit risk to EHSI.
The REIT periodically evaluates the adequacy of its provision for receivable impairment by conducting a specific account review of amounts in excess of predefined target amounts and aging thresholds, which vary by payor type. Allowances for uncollectibility are considered based upon the evaluation of the circumstances for each of these specific accounts. In addition, the REIT has established percentages for provision for receivable impairment, which are based upon historical collection trends for each payor type and age of the receivables. Accounts receivable that are specifically estimated to be uncollectible, based upon the above process, are fully reserved for in the provision for receivable impairment until they are written off or collected.
(e) Non-current Other Assets
Certain investments held for self-insured liabilities included in other assets are investment grade and categorized as available for sale. Invested assets included in other assets consist of primarily equity instruments that have been categorized as available for sale.
(f) Property and Equipment
Property and equipment is stated at cost less accumulated depreciation and accumulated impairment losses. The cost is based upon either the acquisition or constructed cost or the fair value determined as of the Transition Date.
Cost includes expenditures that are directly attributable to the acquisition or development of the asset. Property and equipment acquired as a result of a business combination are valued as outlined in note 3 (a). Centers that are constructed or that are in progress include all incurred expenditures for the development and other direct costs related to the acquisition of land, development and construction of the centers, including borrowing costs of assets meeting certain criteria that are capitalized until the center is completed for its intended use.

90 Extendicare Real Estate Investment Trust
Notes to Consolidated Financial Statements
(i) Goodwill and Other Intangible Assets
i. Goodwill
Goodwill represents the excess amount of consideration given over the fair value of the underlying net assets acquired in a business combination, and is measured at cost less accumulated impairment losses. Goodwill arising from acquisitions prior to January 1, 2010, is included on the basis of its deemed cost, which represents the amount recorded under previous Canadian GAAP, subject to an impairment test on the Transition Date. Goodwill is not amortized, but is tested for impairment on an annual basis or more frequently if there are indicators that goodwill may be impaired, see note 3(j).
ii. Other intangible assets
Other intangible assets that are acquired and have finite useful lives are measured at cost less accumulated amortization and accumulated impairment losses (refer to note 3(j) ). Intangible assets with finite lives are amortized based on cost. Subsequent expenditures are capitalized only if a future benefit exists. All other expenditures, including expenditures on internally generated goodwill, are recognized in net earnings as incurred.
Intangible assets with indefinite useful lives are measured at cost, without amortization, and are subject to an impairment test (refer to note 3(j) ).
Purchased licenses for resident relationships acquired through the acquisition of senior care centers are intangible assets. Acquiring resident relationships for existing residents of acquired centers represent the cost of having to obtain new residents. These intangible assets include a value of lost net resident revenue over the estimated lease-up period of the property, and are amortized on a straight-line basis, based upon a review of the residents’ average length of stay. Resident relationships are generally amortized over a 16-month period for senior care centers. Amortization of the resident relationships asset is included within amortization expense in net earnings.
Non-compete agreements acquired through acquisitions are amortized on a straight-line basis over the period until the agreement expires.
Computer software is amortized over five to seven years and internally developed software over a three-year period.
Amortization methods and useful lives are reviewed at least annually, and are adjusted when appropriate.
(j) Impairment
Impairment of financial and non-financial assets is assessed on a regular basis. All impairment losses are charged to “loss (gain) from asset impairment, disposals and other items” as part of “Results from operating activities” in net earnings.
i. Non-financial assets
Non-financial assets consist of property and equipment, intangible assets with finite lives, intangible assets with indefinite lives and goodwill.
The carrying amounts of non-financial assets are reviewed at each reporting date to determine whether there is any indication of impairment. If any such indication exists, then the asset’s recoverable amount is estimated. For goodwill, and intangible assets that have indefinite useful lives or that are not yet available for use, the recoverable amount is estimated annually at the same time or more frequently if warranted. An impairment loss is recognized in net earnings if the carrying amount of an asset or its related CGU exceeds its estimated recoverable amount. A CGU is defined to be the smallest group of assets that generates cash inflows from continuing use that is largely independent of the cash inflows of other assets. The REIT has identified each individual center as a CGU.
The recoverable amount of an asset or a CGU is the greater of its value in use and its fair value less costs to sell. In assessing value in use, the estimated future cash flows are discounted to their present value using a pre-tax discount rate that reflects current market assessments of the time value of money and the risks specific to the asset or CGU. Goodwill and indefinite life intangible assets are allocated to their respective CGUs for the purpose of impairment testing. Indefinite life intangible assets and corporate assets that do not generate separate cash flows and are utilized by more than one CGU are allocated to each CGU for the purpose of impairment testing, and are not tested for impairment separately.
Impairment losses recognized in respect of CGUs are allocated first to reduce the carrying amount of any goodwill allocated to the CGU and then to reduce the carrying amounts of the assets in the CGU on a pro rata basis. An impairment loss on goodwill is not reversed. In respect of other non-financial assets, impairment losses recognized in prior periods are assessed at each reporting date for any indications that the loss has decreased or no longer exists. An impairment loss is reversed if there has been a change in the estimates used to determine the recoverable amount. An impairment loss is reversed only to the extent that the asset’s carrying amount does not exceed the carrying amount that would have been determined, net of depreciation or amortization, if no impairment loss had been recognized.


92 Extendicare Real Estate Investment Trust
Notes to Consolidated Financial Statements
iv. Other employee benefits
The REIT self-insures, to a limited degree, certain risks in EHSI including workers’ compensation (for certain periods), auto liability and health benefits. These employee related self-insured risks are primarily due within twelve months and therefore are not discounted and are included within accounts payable and accrued liabilities as a current liability.
(m) Unit Appreciation Rights Plan
Awards under the REIT’s unit appreciation rights plan (the “UARP”) have a three-year vesting period. Until the liability is settled, the REIT reports the liability on a pro-rata basis at fair value at each reporting date. The fair value of the unit appreciation right (UAR) and the Accrued Distributions is determined by using an option pricing model based on the remaining vesting term and the amount by which the “Fair Market Value” of a trust unit of Extendicare REIT (the “REIT Unit”) exceeds the grant price, plus Accrued Distributions. “Fair Market Value” of a REIT Unit, on any particular date, means the volume-weighted average trading price of the REIT Unit on the TSX for the 10 trading days immediately preceding such date. “Accrued Distributions” means the product of the aggregate amount of cash distributions per REIT Unit declared payable to holders of record during the term of the UAR and the probability of the award being in the money at the end of the vesting period. Changes in fair value are recognized in net earnings in the period during which these are incurred.
(n) Provisions
A provision is recognized when there is a present legal or constructive obligation as a result of a past event, it is probable that an outflow of economic benefits will be required to settle the obligation, and that obligation can be measured reliably. If the effect of the time value of money is material, provisions are discounted using a current pre-tax rate that reflects the current market assessments of the time value of money and the risks specific to the obligation. The increase in the provision due to passage of time is recognized as accretion and recognized as part of net finance costs. Provisions are reviewed on a regular basis and adjusted to reflect management’s best current estimates. Due to the judgemental nature of these items, future settlements may differ from amounts recognized. Provisions are comprised of estimated self-insured liabilities, decommissioning provisions and other legal claims and obligations.
i. Self-insured liabilities
Extendicare REIT self-insures certain risks related to general and professional liability. The accrual for self-insured liabilities includes the estimated costs of both reported claims and claims incurred but not yet reported. The provision for self-insured liabilities is based on estimates of loss based upon assumptions made by management supported by actuarial projections and the advice of external risk management and legal counsel. The accrual for self-insured liabilities is discounted based upon the projected timing of future payment obligations.
ii. Decommissioning provisions
Management has determined that future costs could be incurred for possible asbestos remediation of the REIT’s pre-1980 constructed centers. Though asbestos is currently not a health hazard in any of these centers, appropriate remediation procedures may be required to remove potential asbestos-containing materials, consisting primarily of floor and ceiling tiles, in connection with any major renovation or demolition.
The fair value of the decommissioning provision related to asbestos remediation is estimated by computing the present value of the estimated future costs of remediation based on estimated expected dates of remediation. The computation is based on a number of assumptions, which may vary in the future depending upon the availability of new information, changes in technology and in costs of remediation, and other factors.
The following assumptions were used in calculating the decommissioning provision: (a) discount rates of 6.75% for ECI and 7.10% for EHSI; (b) an estimated timing of the settlement of the provision ranging from 10 to 30 years; and (c) an estimated undiscounted cash flow amount to settle the decommissioning provision of approximately $50 million.
iii. Other provisions
Other provisions include legal claims that meet the above definition of a provision, along with lease restructuring and employee termination payments. Provisions are not recognized for future operating losses.
(o) Exchangeable LP Units
Prior to November 10, 2011, the outstanding Class B limited partnership units (Exchangeable LP Units) of Extendicare Limited Partnership (Extendicare LP) contained features that were economically equivalent to the REIT Units. These units were presented as a liability of the REIT and distributions to Exchangeable LP Unitholders were presented as a finance cost. On November 10, 2011, the remaining Exchangeable LP Units were automatically converted into REIT Units.

Notes to Consolidated Financial Statements
2011 Annual Report 93
(p) Financial Instruments
i. Financial assets and liabilities
The REIT classifies financial assets and liabilities according to their characteristics and the related management’s intention for use for purposes of their valuation on the Transaction Date and on an ongoing basis. Financial assets and liabilities are classified into one of the five classifications being: held-to-maturity financial assets, loans and receivables, financial assets at FVTPL, AFS and financial liabilities. Following is a description of the valuation methodology.
Held-to-maturity financial assets
Held-to-maturity financial assets are those that the REIT has the positive intent and ability to hold to maturity. Held-to-maturity financial assets are recognized initially at fair value plus any directly attributable transaction costs. Subsequent to initial recognition, held-to-maturity financial assets are measured at amortized cost using the effective interest method, less any impairment losses. Any sale or reclassification of a more than insignificant amount of held-to-maturity investments not close to their maturity would result in the reclassification of all held-to-maturity investments as available-for-sale investments, and prevent the REIT from classifying investment securities as held to maturity for the current and the following two financial years.
Loans and receivables
Loans and receivables are financial assets with fixed or determinable payments that are not quoted in an active market. Such assets are recognized initially at fair value plus any directly attributable transaction costs. Subsequent to initial recognition loans and receivables are measured at amortized cost using the effective interest method, less any impairment losses.
Financial assets at FVTPL
Assets designated as FVTPL are financial assets that are acquired for the purpose of selling in the short term. These assets are initially recognized and subsequently carried at fair value with changes recorded in net earnings and all transaction costs are expensed as incurred.
AFS
AFS financial assets are assets that are not classified in any of the previous categories or are designated as such by management. These assets are initially recognized at fair value plus transaction costs, and subsequently carried at fair value with changes, except for impairment losses, recorded in OCI until the assets are derecognized through sale or impairment, at which time the cumulative gain or loss previously recognized in AOCI is recognized in net earnings. Interest calculated using the effective interest rate method on available-for-sale financial assets is recognized in net earnings. Dividends on available-for-sale equity instruments are recognized in net earnings when Extendicare REIT’s right to receive payment is established.
Financial liabilities
Financial liabilities include FVTPL and other financial liabilities, these are liabilities incurred or assumed in the conduct of business or specific transactions. Financial liabilities are initially measured at fair value and subsequently measured at either amortized cost or fair value. Financial liabilities that are designated as FVTPL are subsequently measured at fair value with changes recognized in net earnings as part of finance costs, whereas those that are designated as other financial liabilities are subsequently measured at amortized costs.
The REIT has convertible debentures that can be converted to units at the option of the holder and the number of units to be issued does not vary with changes in fair value. These debentures are designated as financial liabilities valued at FVTPL.
The Exchangeable LP Units were also designated as financial liabilities valued at FVTPL; therefore, they were valued at fair value initially and on an ongoing basis, with changes in fair value recognized in net earnings as part of finance costs.

94 Extendicare Real Estate Investment Trust
Notes to Consolidated Financial Statements
Summary of Financial Instruments and Classification
All of the REIT’s financial instruments are classified as loans and receivables, AFS, held to maturity or financial liabilities.
Below is a classification summary of the REIT financial instruments:
Asset / Liability Classification Measurement
Cash Loans and receivables Amortized costTotal receivables Loans and receivables Amortized costNotes, mortgages and amounts receivable Loans and receivables Amortized costInvestments held for self-insured liabilities – Available for sale AFS Fair valueInvestments held for self-insured liabilities – Held to maturity Held to maturity Amortized cost
Accounts payable, accrued liabilities Other financial liabilities Amortized costLong-term debt excluding convertible debentures Other financial liabilities Amortized costConvertible debentures FVTPL Fair valueExchangeable LP Units FVTPL Fair value
Other items on the statement of financial position including, but not limited to, prepaid expenses within other current assets, property and equipment, goodwill and intangible assets, deferred income taxes, provisions and employee benefit obligations are not financial assets or liabilities.
For financial instruments reported at fair value, the REIT uses the fair value hierarchy as follows:
Level 1 – quoted market prices in active markets for identical assets or liabilities;Level 2 – inputs other than quoted market prices included in Level 1 that are observable for the asset or liability, either directly (as prices)
or indirectly (derived from prices); orLevel 3 – unobservable inputs such as inputs for the asset or liability that are not based on observable market data.
Where possible, the REIT will use the highest of the fair value hierarchy levels.
ii. Derivative financial instruments
From time to time, the REIT uses derivative financial instruments to manage risks from fluctuations in exchange rates and interest rates. All derivative instruments, including embedded derivatives that must be separately accounted for, are valued at their respective fair values in the consolidated financial statements unless they are effective cash-flow hedging instruments.
On the date a derivative contract is entered into, the REIT assesses whether or not to designate the derivative (or non-derivative) as either a hedge of the fair value of a recognized asset or liability (a “fair-value hedge”) or a hedge of the variability of cash flows to be received or paid related to a recognized asset or liability or a forecasted transaction (a “cash-flow hedge”) or as a hedge of a net investment in a foreign operation. At the inception of any hedge and on an ongoing basis, we assess whether the derivatives that are used in the hedging transactions are highly effective in offsetting changes in fair values or cash flows of the hedged items. We currently do not have any fair-value, cash-flow or net investment hedges.
Management uses foreign currency forward contracts (FCFCs) to limit the exposure of converting U.S. cash flow into Canadian dollars. These are not designated as fair-value or cash-flow hedges for accounting purposes; therefore, gains or losses arising from the change in fair values are recognized in net earnings during the year.
The REIT does not enter into financial instruments for trading or speculative purposes.
(q) Revenue
In the United States, revenue from skilled nursing centers is derived from various federal and state medical assistance programs, Managed Care providers (for residents with health maintenance and commercial insurance programs), as well as privately from the residents. Revenue is recorded in the period in which services and products are provided at established rates less contractual adjustments. Contractual adjustments include differences between established billing rates and amounts estimated by management as reimbursable under various reimbursement formulas or contracts in effect. Differences between final settlements and amounts recorded in previous years are reported as adjustments to revenue in the period such settlements are determined.

Notes to Consolidated Financial Statements
2011 Annual Report 95
Extendicare REIT also offers information technology services to smaller long-term care providers through its wholly owned U.S. subsidiary, Virtual Care Provider, Inc., which we believe reduces their in-house technology costs for these services. This revenue source is primarily derived from application hosting, customer support, telecommunications, equipment sales and consulting services, and is recognized as these services are provided and equipment is delivered to our customers.
In addition, EHSI derives outpatient therapy revenue in the U.S. by providing rehabilitation therapy services to outside third parties at its clinics. This revenue source is primarily from Managed Care, workers’ compensation, self-pay clients and partly from Medicare and Medicaid. Revenue is recognized in the period in which services are provided.
In Canada, fees charged for its nursing centers and home health care services are regulated by provincial authorities. Provincial programs fund a substantial portion of these fees. Revenue is recorded in the period in which services and products are provided.
Assisted living center revenue in the U.S. and Canada is primarily derived from private-pay residents and is recognized in the period in which the services are provided and at rates established by the REIT based upon the services provided and market conditions in the area of operation.
Extendicare REIT also offers management, consulting, group purchasing, accounting and administrative services to third parties in both Canada and the United States. Revenue is recorded in the period in which services are provided.
(r) Lease Payments
Rental payments under operating leases are expensed as incurred. Operating leases with defined scheduled rent increases are recognized on a straight-line basis over the lease term.
(s) Finance Costs and Finance Income
Finance costs include interest expense on long-term debt, accretion of the discount on provisions and on decommissioning provisions, distributions on the Exchangeable LP Units, losses on the change in fair value of financial liabilities designated as FVTPL including convertible debentures and Exchangeable LP Units (refer to note 3(p) i ). Finance income includes interest income on funds invested, gains on the change in fair value of financial liabilities designated as FVTPL including convertible debentures and Exchangeable LP Units, and the change in foreign exchange on non-Canadian based financial assets.
(t) Income Taxes
Extendicare REIT and its subsidiaries are subject to income taxes as imposed by the jurisdictions in which they operate, in accordance with the relevant tax laws of such jurisdictions. The provision for income taxes for the period comprises current and deferred income tax.
Current income tax is calculated on the basis of the tax laws enacted or substantively enacted at the end of the reporting period in the jurisdictions in which we operate. Deferred income tax is calculated using tax rates anticipated to apply in the periods that the temporary differences are expected to reverse.
The income tax rates used to measure deferred tax assets and liabilities, for other than the REIT legal entity, are those rates enacted or substantially enacted at the reporting date, and are recognized to the extent that it is probable that future taxable profit will be available against which the temporary differences can be utilized. Deferred tax assets and liabilities recorded within the REIT legal entity that pertain to undistributed earnings and the change in fair value of the convertible debentures are recorded at the highest marginal personal tax rate. A deferred tax asset is not recorded should the fair value of the convertible debentures be in excess of the principal balance of the convertible debentures. There are no deferred taxes recorded for the change in fair value of the Exchangeable LP Units.
Current and deferred income tax assets and liabilities are offset when there is a legally enforceable right of offset; and the income taxes are levied by the same taxation authority on either the same taxable entity or different taxable entities, which intend either to settle current tax liabilities and assets on a net basis or to realize the assets and settle the liabilities simultaneously, for each future period in which significant amounts of deferred tax liabilities or assets are expected to be settled or recovered.
In assessing whether the deferred tax assets are realizable, management considers whether it is probable (which the REIT has defined as “more likely than not”) that some portion or all of the deferred tax assets will not be realized. The ultimate realization of deferred tax assets is dependent upon the generation of future taxable income during the periods in which those temporary differences become deductible. Management considers the scheduled reversal of deferred tax liabilities, projected future taxable income and tax planning strategies in making this assessment.

96 Extendicare Real Estate Investment Trust
Notes to Consolidated Financial Statements
Tax uncertainties are evaluated on the basis of whether it is more likely than not that a tax position will ultimately be sustained upon examination by the relevant taxing authorities. Tax uncertainties are measured using a probability adjusted or expected value model whereby amounts are recorded if there is any uncertainty about a filing position, determined by multiplying the amount of the exposure by the probability that the entity’s filing position will not be sustained. The assessment of tax uncertainties relies on estimates and assumptions and may involve a series of judgements about future events. New information may become available that causes the REIT to change its judgement regarding the adequacy of existing tax liabilities. Such changes to tax liabilities will impact tax expense in the period that such a determination is made.
(u) Discontinued Operations
A discontinued operation is a component of the REIT’s business that represents a separate major line of business or geographical area of operations that has been disposed of or is held for sale. Classification as a discontinued operation occurs upon disposal or when the operation meets the criteria to be classified as held for sale, if earlier. When an operation is classified as a discontinued operation, the comparative statement of earnings and cash flow information is re-presented as if the operation had been discontinued from the start of the comparative period.
4. future changes in Accounting policiesFinancial Instruments
In November 2009, the International Accounting Standards Board (the “IASB”) issued IFRS 9 “Financial Instruments (IFRS 9 (2009))”, and in October 2010, the IASB published amendments to IFRS 9 (IFRS 9 (2010)). In December 2011, the IASB issued an amendment to IFRS 9 to defer the mandatory effective date to annual periods beginning on or after January 1, 2015. The REIT has yet to assess the impact of the new standard on its results of operations, financial position and disclosures.
Financial Instruments – Disclosures
In October 2010, the IASB issued amendments to IFRS 7 “Disclosures – Transfers of Financial Assets”, which is effective for annual periods beginning on or after January 1, 2012. We do not expect the amendments to have a material impact on the financial statements, because of the nature of the REIT’s operations and the types of financial assets that it holds.
Consolidated Financial Statements
In May 2011, the IASB issued IFRS 10 “Consolidated Financial Statements” that is effective for annual periods beginning on or after January 1, 2013, with early adoption permitted. If an entity applies this standard earlier, it shall also apply IFRS 11 “Joint Arrangements”, IFRS 12 “Disclosure of Interests in Other Entities”, IAS 27 (2011) and IAS 28 (2011) “Investments in Associates” at the same time. The REIT intends to adopt IFRS 10 in its financial statements for the annual period beginning on January 1, 2013, and does not expect this new standard to have a significant impact on its financial statements.
Disclosure of Interests in Other Entities
In May 2011, the IASB issued IFRS 12 “Disclosure of Interests in Other Entities” that is effective for annual periods beginning on or after January 1, 2013, with early adoption permitted. If an entity applies some of the requirements of this standard earlier, it does not need to apply IFRS 10, IFRS 11, IAS 27 (2011) and IAS 28 (2011) at the same time. The REIT intends to adopt IFRS 12 in its financial statements for the annual period beginning on January 1, 2013, and does not expect this new standard to have a significant impact on its financial statements.
Fair Value Measurement
In May 2011, the IASB published IFRS 13 “Fair Value Measurement” that is effective prospectively for annual periods beginning on or after January 1, 2013. The disclosure requirements of IFRS 13 need not be applied to comparative information for periods before initial application. The REIT is assessing the impact of this new standard.

Notes to Consolidated Financial Statements
2011 Annual Report 97
Presentation of Financial Statement – Other Comprehensive Income
In June 2011, the IASB published amendments to IAS 1 “Presentation of Financial Statements: Presentation of Items of Other Comprehensive Income”, which are effective for annual periods beginning on or after July 1, 2012 and are to be applied retrospectively. Early adoption is permitted. The REIT intends to adopt the amendments in its financial statements for the annual period beginning on January 1, 2013. As the amendments only require changes in the presentation of items in OCI, we do not expect these amendments to have a material impact on the financial statements.
Post-employment Benefits
In June 2011, the IASB published an amended version of IAS 19 “Employee Benefits”. Adoption of the amendments is required for annual periods beginning on or after January 1, 2013, with early adoption permitted. The amendments are generally applied retrospectively with certain exceptions. The REIT currently reflects changes in assets and liabilities from defined benefit pension plans within OCI; therefore, we do not expect the amended standard to have a significant impact on our financial statement presentation.
Offsetting Financial Assets and Liabilities
In December 2011, the IASB published “Offsetting Financial Assets and Financial Liabilities” and issued new disclosure requirements in IFRS 7 “Financial Instruments: Disclosures”. The effective date for the amendments to IAS 32 “Financial Instruments: Presentation” is annual periods beginning on or after January 1, 2014. The effective date for the amendments to IFRS 7 is annual periods beginning on or after January 1, 2013. These amendments are to be applied retrospectively. The REIT does not expect the amendments to have a significant impact on its financial statements.
5. Accounts Receivable December 31, December 31, January 1, 2011 2010 2010
Trade receivables 186,938 175,853 179,395 Retroactive rate accruals 35,374 31,421 29,350 Other receivables 23,472 22,817 22,152
Total Receivables – Net of Allowance (note 23 (a)) 245,784 230,091 230,897 Less: Non-current portion (note 8) (23,077) (17,481) (17,420)
Accounts Receivable 222,707 212,610 213,477

98 Extendicare Real Estate Investment Trust
Notes to Consolidated Financial Statements
6. property and equipment Land & land Furniture & Leashold Construction improvements Buildings Equipment improvements in progress Total
Cost or deemed costJanuary 1, 2010 158,541 1,088,811 141,967 8,008 24,260 1,421,587 Additions 1,719 8,786 13,778 677 57,830 82,790 Government grants – – – – (18,592) (18,592)Interest capitalized – – – – 1,262 1,262 Transfer to assets held for sale 2,137 32,701 4,687 2,764 – 42,289 Disposals (2,211) (26,374) (4,537) (2,688) – (35,810)Write-off of fully-depreciated assets – (729) (1,458) (562) – (2,749)Transfer from (to) construction in progress 1,927 34,356 6,012 73 (42,368) – Other (945) 19,233 (11,355) 737 (4,677) 2,993 Effect of movements in exchange rates (7,310) (42,444) (5,530) (408) (245) (55,937)
December 31, 2010 153,858 1,114,340 143,564 8,601 17,470 1,437,833 Additions 2,554 15,163 14,714 295 50,400 83,126 Government grants – – – – (12,600) (12,600)Interest capitalized – – – – 195 195 Transfer to assets held for sale 348 3,202 (324) – – 3,226 Disposals (397) (7,363) (629) – – (8,389)Write-off of fully-depreciated assets – (4,142) (2,357) (3) – (6,502)Impairment loss (note 7) – (31,657) – – – (31,657)Transfer from (to) construction in progress 2,337 28,676 5,839 (2,547) (34,305) – Other (278) (90) (2,903) 2,494 (2,486) (3,263)Effect of movements in exchange rates 2,953 17,061 2,516 135 96 22,761
December 31, 2011 161,375 1,135,190 160,420 8,975 18,770 1,484,730
Accumulated depreciationJanuary 1, 2010 225 109,404 64,615 3,473 – 177,717 Additions 5,483 43,810 16,469 959 – 66,721 Transfer to assets held for sale 270 6,484 2,654 2,746 – 12,154 Disposals (296) (6,409) (2,687) (2,761) – (12,153)Write-off of fully-depreciated assets – (729) (1,458) (562) – (2,749)Other 1 (13) (5,921) (1) – (5,934)Effect of movements in exchange rates (192) (1,469) (2,729) (189) – (4,579)
December 31, 2010 5,491 151,078 70,943 3,665 – 231,177 Additions 5,364 40,119 17,071 7,446 – 70,000 Transfer to assets held for sale 26 155 (411) – – (230)Disposals (19) (3,588) (366) 33 – (3,940)Write-off of fully-depreciated assets – (4,142) (2,357) (3) – (6,502)Other (19) 2,470 (2,112) (2,505) – (2,166)Effect of movements in exchange rates 266 1,718 1,417 77 – 3,478
December 31, 2011 11,109 187,810 84,185 8,713 – 291,817
Carrying amountsAt January 1, 2010 158,316 979,407 77,352 4,535 24,260 1,243,870 At December 31, 2010 148,367 963,262 72,621 4,936 17,470 1,206,656 At December 31, 2011 150,266 947,380 76,235 262 18,770 1,192,913

Notes to Consolidated Financial Statements
2011 Annual Report 99
The cost of assets included in property and equipment under finance leases was $100.3 million (December 31, 2010 – $99.9 million; January 1, 2010 – $87.4 million) with accumulated depreciation of $20.6 million (December 30, 2010 – $17.7 million; January 1, 2010 – $15.4 million) (note 11).
In March 2011, EHSI purchased a 100-bed skilled nursing center in Ohio, which EHSI had previously leased, for cash of US$7.5 million.
Between 2008 and 2011, forgivable loans were granted by several regional Health Authorities in the Province of Alberta for a portion of construction costs of a nursing and an assisted living center in Red Deer, a designated assisted living center in Lethbridge and a nursing center in Edmonton and from a municipality in the Province of Ontario for a nursing center in Timmins. As of December 31, 2011, all forgivable loans in respect of these projects have been received. The forgivable government loans received are accounted for as government grants as the likelihood of triggering repayment is remote (note 21). All grants were netted with other costs and included in construction in progress until the development is completed and are netted with the cost of the building upon completion.
Based upon the impairment assessment we performed for the U.S. in 2011 third quarter, a 10-basis point increase in capitalization rate would cause a $0.9 million increase in impairment. As for Canada, there would be no change in our impairment as of January 1, 2010, if we increase our capitalization rate by 10 basis points.
Interest is capitalized in connection with the construction of centers and is amortized over their estimated useful life at 6.39% (2010 – 3%). Interest capitalized in 2011 was $0.2 million (2010 – $1.3 million).
7. goodwill and other Intangible Assets December 31, December 31, 2011 2010
GoodwillBalance at beginning of year 93,820 97,488Additions 349 890Impairment loss (22,357) –Effect of movements in exchange rates 1,511 (4,558)
Balance at end of year 73,323 93,820
Other Intangible Assets Gross carrying value at beginning of year 32,543 31,279Additions 1,248 4,950Write-off of fully amortized assets (73) (1,869)Effect of movements in exchange rates 2,829 (1,817)
Gross carrying value at end of year 36,547 32,543
Accumulated amortization at beginning of year (16,091) (13,087)Amortization (6,657) (5,894)Write-off of fully amortized assets 73 1,869 Effect of movements in exchange rates 74 1,021
Accumulated amortization at end of year (22,601) (16,091)
Net carrying value 13,946 16,452
Goodwill and Other Intangible Assets 87,269 110,272

100 Extendicare Real Estate Investment Trust
Notes to Consolidated Financial Statements
Goodwill
In July 2011, Centers for Medicare and Medicaid Services “CMS” announced Medicare rate reductions in conjunction with changes in the assessment process and the elimination of group therapy that reduced Medicare funding effective October 1, 2011. As a result of this announcement, EHSI tested each of its centers for impairment in the reported values of both property and equipment, and goodwill. For the purpose of impairment testing, goodwill and corporate assets are allocated to EHSI’s CGUs (note 3(j)). The carrying value of the assets was then compared to the recoverable amount for each CGU to determine if there was any impairment. The recoverable amount of a CGU is determined to be the greater of fair value less cost to sell and value-in-use calculations. Any impairment loss was allocated first to goodwill, and the remainder to property and equipment. An impairment loss on goodwill cannot be reversed in the future.
Based on the computations performed in the 2011 third quarter, EHSI has recognized a pre-tax impairment loss of $54.0 million (US$53.9 million), of which $22.4 million (US$22.3 million) was allocated to goodwill, and $31.7 million (US$31.6 million) to property and equipment. In respect of property and equipment, if future assessments indicate that there is a change in the estimates used to determine the recoverable amount, the impairment loss will be reversed subject to certain limits (note 3(j)). Goodwill was assessed at December 31, 2011, and there was no further impairment on the goodwill.
The determination of recoverable amounts can be significantly impacted by estimates related to current market valuations, current and future economic conditions in the geographical markets of each CGU, and management’s strategic plans within each of its markets. Estimates and assumptions used in the determination of the impairment loss were based upon information that was known at the time, along with future outlook.
The key assumptions used to determine recoverable amount are as follows:
Capitalization rates: Nursing centers 13.1% Assisted living centers 9.1% Maintenance capital expenditure per bed (in dollars) US$300Management fee as a % of revenue 5.0%
The recoverable amount calculations used discounted pre-tax cash flow projections determined from financial projections based upon both historical and forecasted amounts on which capitalization rates were applied. The calculation was based on the following key assumptions:
• Cash flows were projected based upon historical financial performance along with the forecast impact of Medicare rate reductions in the coming year and past experience on average daily census, factoring in the historical maintenance capital expenditures and management fees.
• Capitalization rates were based on industry standards on recent transactions.
Based upon the impairment assessment we performed for the U.S. in 2011 third quarter, a 10-basis point increase in capitalization rate would cause a $0.2 million increase in goodwill impairment. As for Canada, based upon the impairment assessment we performed at the end of the year, there would be no impairment if we increase our capitalization rate by 10 basis points.
The full impact of the 2011 CMS Final Rule can only be determined after sufficient actual results are known along with a sufficient amount of time that includes the benefit of mitigating factors. Further evaluation of the determination of recoverable amounts will be conducted in 2012. Due to uncertainties in the estimation process, actual results could differ significantly from such estimates.
Goodwill of $0.3 million and $0.9 million resulted from the purchase of three clinics by EHSI in 2011 and two clinics in 2010, respectively. Goodwill for these clinics was allocated on the same basis as other CGUs and the goodwill policy applied. These were assessed at December 31, 2011, and there was no impairment.
Other intangible assets
Other intangible assets are comprised of computer software, purchased licenses and non-compete agreements. Computer software represents the majority of other intangible assets with a gross and net carrying value of $34.8 million and $12.6 million (December 31, 2010 – $31.0 million and $15.1 million; January 1, 2010 – $30.1 million and $17.2 million), respectively.
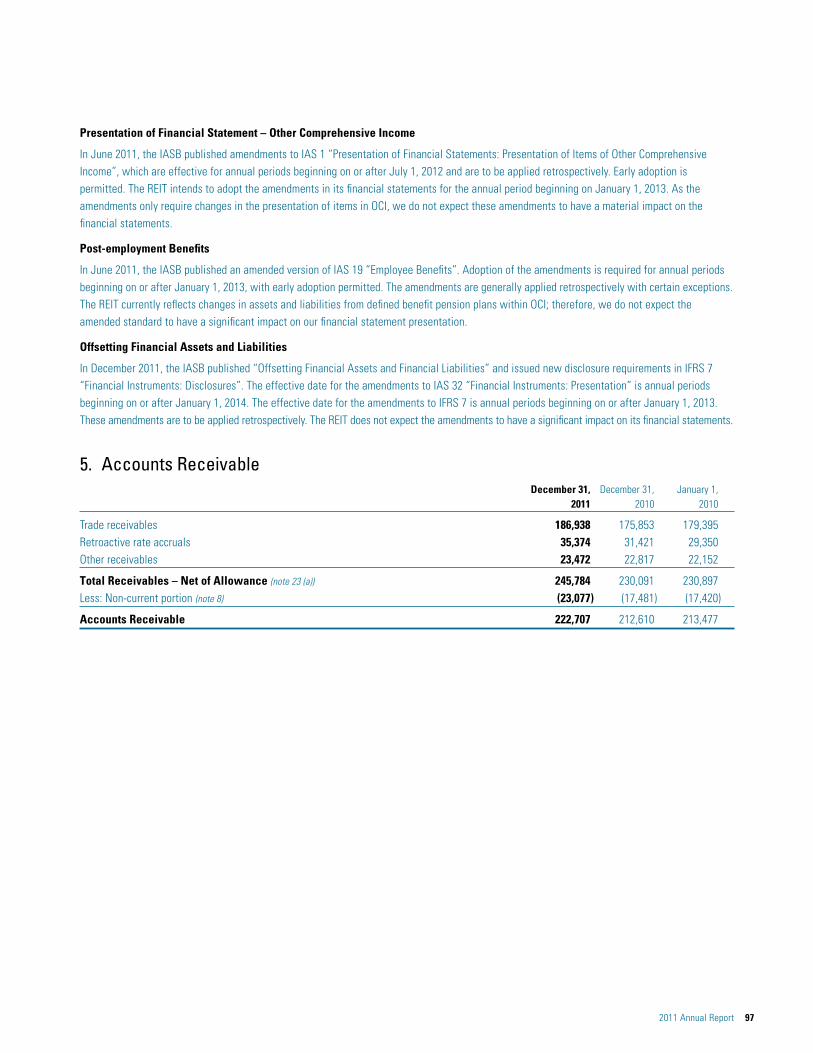
Notes to Consolidated Financial Statements
2011 Annual Report 101
8. other Assets December 31, December 31, January 1, 2011 2010 2010
Investments held for self-insured liabilities Available-for-sale securities, at fair value 83,608 60,937 59,307 Held-to-maturity securites, at amortized cost – – 6,025 Notes, mortgages and amounts receivable 48,010 47,782 50,897 Medicare and Medicaid settlement receivables, less allowance of nil (note 5) 23,077 17,481 17,420
154,695 126,200 133,649
Investments Held for Self-insured Liabilities
The REIT holds investments within its Bermuda-based captive insurance company for self-insured liabilities that are subject to insurance regulatory requirements and are categorized as held to maturity or available for sale. The investment portfolio is comprised of U.S. dollar-denominated cash, money market funds and investment-grade corporate and government securities. Certain of these investments in the amount of $15.2 million (US$14.9 million) (December 31, 2010 – $12.9 million or US$13.0 million; January 1, 2010 – $1.9 million or US$1.8 million) have been pledged as collateral for letters of credit issued by the banker of the REIT’s captive insurance company in favour of ceding companies. As at December 31, 2011, all investments were categorized as available for sale.
December 31, December 31, January 1, 2011 2010 2010
Fixed income securities, with maturities due: In one year or less 17,760 5,818 11,619 After 1 year through 5 years 36,743 32,969 31,982 After 5 years through 10 years 2,323 2,302 3,673
56,826 41,089 47,274 Cash and money market funds 26,782 19,848 14,611 Equities – – 3,447
83,608 60,937 65,332

102 Extendicare Real Estate Investment Trust
Notes to Consolidated Financial Statements
Financial assets include the following:
December 31, December 31, January 1, 2011 2010 2010
Available for sale U.S. Treasuries 13,227 11,236 14,438 U.S. Agency Bonds 17,630 15,213 371 Corporate Bonds 25,969 14,640 26,440
56,826 41,089 41,249
Held to maturity U.S. Treasuries – – 5,816 U.S. Agency Bonds – – 209
– – 6,025
56,826 41,089 47,274
Notes, Mortgages and Amounts Receivable
Included in notes, mortgages and amounts receivable are $37.2 million (December 31, 2010 – $40.0 million; January 1, 2010 – $42.6 million) of discounted amounts receivable due from government agencies. These represent amounts funded by the Ontario government for a portion of nursing home construction costs over a 20-year period. As each center was opened, a receivable from the government was recorded based on applying a discount rate equivalent to the yield on a 20-year Ontario government bond. The amounts were discounted at rates ranging from 5.3% to 6.5% and were also treated as a reduction in the cost of the property and equipment related to the center.
Medicare and Medicaid Settlement Receivables
Settlement receivables from both Medicare and Medicaid state programs at December 31, 2011, totalled $33.5 million (December 31, 2010 – $26.3 million; January 1, 2010 – $26.5 million), with no allowance. EHSI’s Medicare settlement receivables primarily relate to reimbursable Part A co-insurance receivables. Differences between the final settlement and amounts previously recorded are reported as adjustments to revenue in the period of determination. Medicaid settlement receivables pertain to cost-based reimbursement programs. The amounts expected to be substantially collected within one year are reported as current accounts receivable, and the remaining amounts totalling $23.1 million (December 31, 2010 – $17.5 million; January 1, 2010 – $17.4 million) are reported in other assets.
9. Accounts payable and Accrued liabilities December 31, December 31, January 1, 2011 2010 2010
Accounts payable 42,241 36,167 38,372 Accrued liabilities 224,693 230,113 245,406
Total 266,934 266,280 283,778

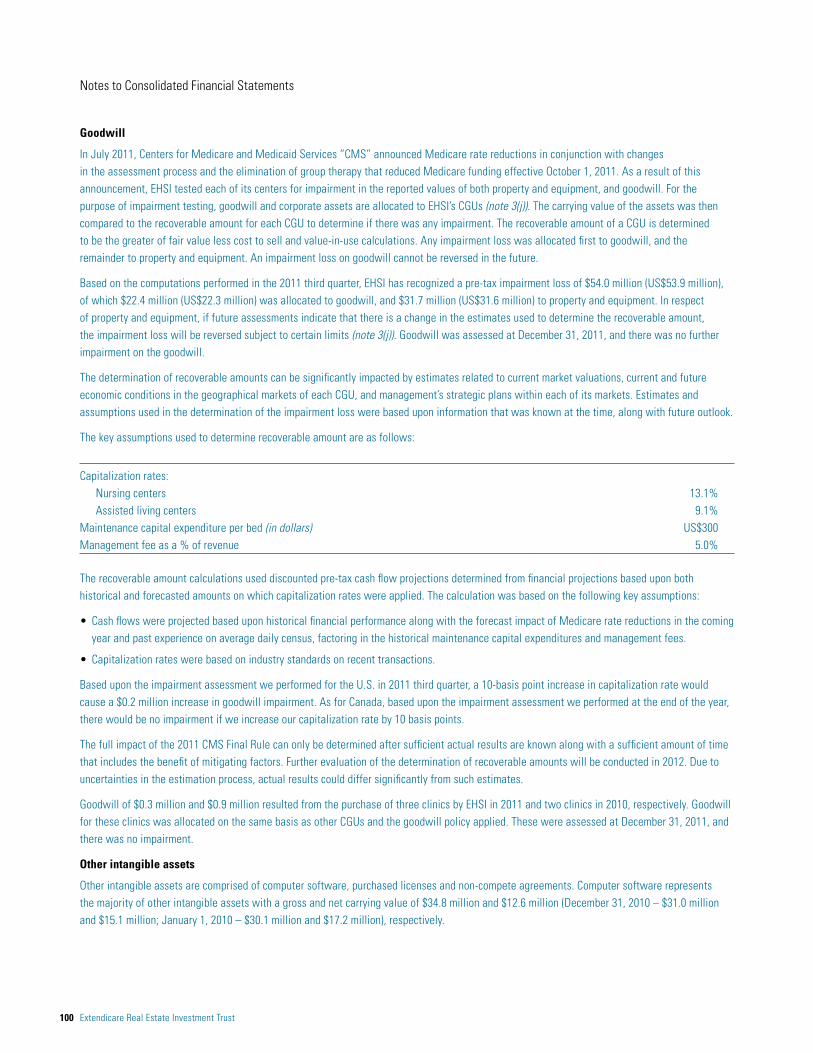
104 Extendicare Real Estate Investment Trust
Notes to Consolidated Financial Statements
reinsurance; the effectiveness of the claims management process; and the outcome of litigation. Therefore, management’s estimate of the accrual for general and professional liability claims is significantly influenced by assumptions that are subject to judgement by management and the actuary, which may cause the provision to fluctuate from one reporting period to another.
Management estimates and allocates a portion of the general and professional liability claim payments as current on the statement of financial position.
Decommissioning Provisions
The decommissioning provisions relate to possible asbestos remediation of the REIT’s pre-1980 constructed centers (note 3(n)ii).
Liabilities Assumed from Crown Life
Under the June 2007 Crown Life share sale agreement with The Canada Life Assurance Company (Canada Life), Extendicare was responsible for specified contingent claims against Crown Life, and had accrued provisions for potential settlements that were secured by letters of credit amounting to $13.9 million in December 31, 2010. Settlement on all of the remaining claims was reached during 2011, resulting in the release of the remaining excess provisions of $2.4 million in 2011 and the elimination of the letters of credit.
11. long-term debt Year of December 31, December 31, January 1, Interest rate maturity 2011 2010 2010
US$ C$ C$ C$EHSI (payable in US$)HUD mortgages 4.23% – 6.152% 2018 – 2046 395,339 402,060 27,308 24,462 May 2012 CMBS Financing 6.6525% 2012 109,887 111,755 489,054 524,816 March 2012 CMBS Financing 6.79% 2012 – – 87,152 93,569 Line of credit under Credit Facility variable 2012 53,000 53,901 16,794 24,735 PrivateBank mortgage loans variable 2013 34,490 35,076 24,835 – Finance lease liabilities 5.24% – 8.7141% 2015 – 2020 14,823 15,075 15,304 2018 – 2046 395,339
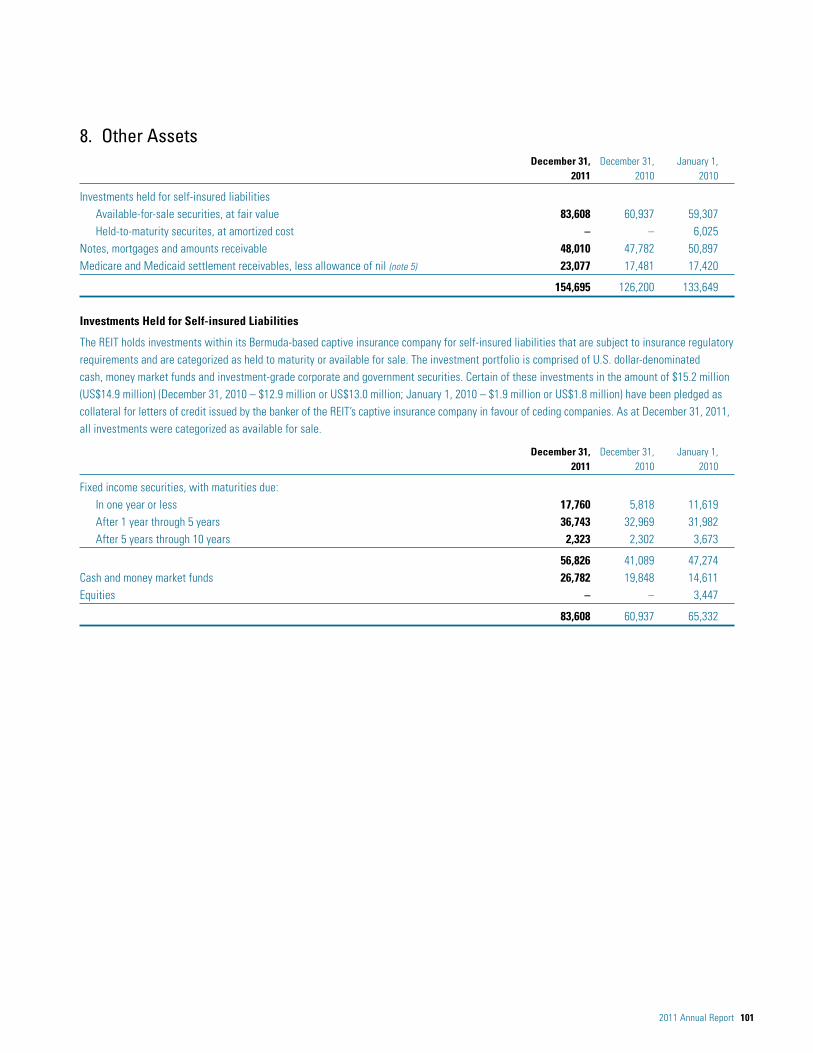
106 Extendicare Real Estate Investment Trust
Notes to Consolidated Financial Statements
All HUD-insured mortgage loans are non-recourse loans to EHSI. All mortgages are subject to HUD regulatory agreements that require escrow reserve funds to be deposited with the loan servicer for mortgage insurance premiums, property taxes, insurance and for capital replacements expenditures. As of December 31, 2011, EHSI has escrow reserve funds of US$5.8 million with the loan servicer that are reported within other current assets. In addition, cash for working capital purposes is restricted from distribution to EHSI from the real estate special purpose entities within the HUD mortgage structures. As of December 31, 2011, restricted cash for working capital was US$6.4 million.
cMbs fInAncIngs
The May 2012 CMBS Financing was completed on October 16, 2006, for US$500.0 million through commercial mortgage backed securities. The original maturity date was November 11, 2011, but this date was extended to May 11, 2012, under the Loan Modification Agreement described below. It has a fixed interest rate of 6.6525%, with interest-only monthly payments for the first three years, and monthly principal and interest payments thereafter, based upon a 25-year amortization.
The March 2012 CMBS Financing was completed on March 6, 2007, for US$90.0 million. It has a five-year term that matures on March 11, 2012, and has a fixed interest rate of 6.79%, with interest-only monthly payments for the first two years, and monthly principal and interest payments thereafter, based upon a 25-year amortization.
The CMBS financings were collateralized by first mortgages on 86 and 14 of EHSI’s skilled nursing centers, respectively, and all other assets owned by these centers including personal property and receivables. Under both financings, EHSI is required to maintain: a consolidated leverage ratio, exclusive of any notes owing to Extendicare REIT and its subsidiaries, of less than 5.5 to 1.0 and a lease debt service coverage ratio of at least 1.05 to 1.00. EHSI is required to fund capital replacement reserves on a monthly basis, plus amounts to cover any significant renovations; however, these funds are recuperated upon evidence of the work being completed. In the event of default, the lenders may appoint an interim manager and charge a default rate of interest and/or foreclose on the mortgages and other collateral securing the loans.
In May 2011, EHSI signed an agreement to modify its May 2012 CMBS Financing (the “Loan Modification Agreement”) for a fee of US$5.4 million. The Loan Modification Agreement extended the maturity date from November 2011 to May 2012 (note 17) and, during the period between August 2011 and May 2012, allowed EHSI to prepay in part and release properties from this loan without any prepayment yield maintenance payment. The Loan Modification Agreement enhanced the ability to complete the closing of the HUD mortgages in stages.
In August 2011, we defeased US$65.6 million of the March 2012 CMBS Financing followed by a defeasement of the remaining balance of US$21.0 million in December 2011. In August and October 2011, we prepaid US$194.9 million and US$172.4 million, respectively, of the May 2012 CMBS Financing. In February 2012, we prepaid the final US$108.0 million of May 2012 CMBS Financing. A total of US$2.5 million was charged to net earnings for the costs incurred on defeasement and loan modification fees along with other settlement costs (note 17).
cRedIt fAcIlIty
The EHSI Credit Facility was renewed and amended in June 2009 and provides for borrowings up to US$70.0 million. The amount available to be borrowed under the EHSI Credit Facility is the lesser of: (i) 60% of the appraised values of the skilled nursing centers collateralizing the EHSI Credit Facility, or (ii) an amount based on the actual net cash flow of these centers for the last 12 months. The amount available to be borrowed as at December 31, 2011, was US$70.0 million. The EHSI Credit Facility was extended in March 2011 to June 2012 with no change in the financial terms of the loan.
The EHSI Credit Facility is used to back letters of credit and for general corporate purposes, and requires EHSI to comply with various financial covenants, including fixed charge coverage, debt leverage, and tangible net worth ratios. It contains customary covenants and events of default and is subject to various mandatory prepayment and commitment reductions. If an event of default occurs, the lenders may accelerate the maturity of the loan under the EHSI Credit Facility, charge a default rate of interest, and/or foreclose on the mortgages and other collateral securing the EHSI Credit Facility. EHSI is permitted to make voluntary prepayments at any time.
The EHSI Credit Facility is secured by mortgages on 21 skilled nursing centers and is guaranteed by EHSI’s parent, Extendicare Holdings, Inc., and certain of EHSI’s material domestic subsidiaries. Tendercare and its subsidiaries are classified as specified non-recourse subsidiaries and unrestricted subsidiaries under the EHSI Credit Facility; however, the entities are considered restricted subsidiaries solely with respect to certain financial covenants. Tendercare and certain of its subsidiaries have also given a limited guarantee and granted a security interest in their accounts receivable, chattel paper and instruments, and any books and records pertaining thereto to the lender.

Notes to Consolidated Financial Statements
2011 Annual Report 107
At EHSI’s option, the interest rate is either the eurodollar rate, with a floor set at 2%, plus a margin from 4% to 4.75%, or the U.S. prime rate plus a margin from 3% to 3.75%. The specific margin is based on EHSI’s consolidated leverage ratio as defined in the EHSI Credit Facility.
As at December 31, 2011, US$53.0 million was drawn under the EHSI Credit Facility. The unused portion of the EHSI Credit Facility that was available for working capital, and corporate purposes, after reduction for an outstanding letter of credit of US$2.6 million in favour of a state workers’ compensation program, was US$14.4 million as at December 31, 2011. The letter of credit renews annually and matures through to June 2012.
EHSI is currently in the process of renewing the EHSI Credit Facility prior to its June 2012 maturity date.
pRIvAtebAnk MoRtgAge loAns
On November 30, 2010, EHSI secured a non-recourse term loan for up to US$35.0 million on six skilled nursing centers and one assisted living center located in Minnesota, Wisconsin and Michigan with the PrivateBank (the “PrivateBank Loans”). On closing, EHSI drew US$25.0 million of the term loan secured by five of the seven centers, and in March 2011 drew the remainder of the US$10.0 million. The resulting mortgages on the seven centers are cross-collateralized with each other. The PrivateBank Loans have a three-year term that matures on November 30, 2013. The loans are repaid with monthly principal payments based on a 25-year amortization period. Under the mortgage agreement, the combined operations are required to maintain a minimum consolidated fixed charge coverage ratio and debt service coverage ratio. At EHSI’s option, the interest rate is equal to: (i) LIBOR, subject to a LIBOR floor set at 2%, plus a margin of 4%, or (ii) the U.S. prime rate subject to a floor of 6%. EHSI has the option to prepay the balance in whole or in part subject to a prepayment fee of 2% for the first two years of the agreement and 1% during the final year, with no prepayment fee during the last six months of the agreement.
notes pAyAble
Notes payable relate to seller notes of US$8.0 million at 7.5% arising from the 2007 Tendercare acquisition (note 25). The original balance of the seller notes totalled US$26.4 million of which US$10.4 million was settled in January 2008 and March 2009, upon having met certain conditions. The balance of US$16.0 million was payable commencing in 2010 at US$4.0 million per annum until maturity in 2013, of which US$4.0 million was paid in each of November 2010 and 2011. Under the terms of the agreement, the balance of acquired working capital is subject to adjustment based upon finalization of the assets subsequently received and liabilities subsequently incurred. The adjustments occur annually 90 days after the anniversary date of the Tendercare acquisition over a four-year period until January 2012. EHSI anticipates resolution of the working capital amounts in the second quarter of 2012. Refer to note 25 for more information in respect of the settlement of working capital.
soveReIgn bAnk MoRtgAge loAns
On June 1, 2011, EHSI paid off the remaining balance of its Sovereign Loans of US$43.0 million using borrowings under the EHSI Credit Facility that were subsequently repaid upon closing of the first phase of the HUD loans. The Sovereign Loans were formally secured by first mortgages on 17 skilled nursing centers owned by Tendercare (Michigan) Inc. and its subsidiaries (collectively “Tendercare”).
Canadian Debt
conveRtIble unsecuRed suboRdInAted debentuRes
On June 19, 2008, the REIT completed a public offering of $92.0 million of 7.25% convertible unsecured subordinated debentures, with an $11.35 conversion price, due June 30, 2013 (the “2013 Debentures”), and 3,565,000 REIT Units at $9.70 per unit for aggregate proceeds of $34.6 million. Interest is payable semi-annually. On or after July 1, 2011 but prior to July 1, 2012, these debentures may be redeemed by the REIT in whole at any time or in part from time to time, at a price equal to the principal amount thereof plus accrued and unpaid interest, on a notice of not more than 60 days and not less than 30 days prior, provided that the volume-weighted average trading price of the REIT Units on the TSX for the 20 consecutive trading days ending on the fifth trading day immediately preceding the date on which notice of redemption is given is not less than 125% of the conversion price. On or after July 1, 2012, these debentures may be redeemed by the REIT in whole at any time or in part from time to time, at a price equal to the principal amount thereof plus accrued and unpaid interest, on a notice of not more than 60 days and not less than 30 days prior.
On June 21, 2007, Extendicare REIT completed a public offering of $115.0 million of 5.7% convertible unsecured subordinated debentures, with a $19.90 conversion price, due June 30, 2014 (the “2014 Debentures”). Interest is payable semi-annually. On or after July 1, 2010, but prior to July 1, 2012, the redemption features, dates, terms and conditions are identical to the 2013 Debentures described above.

108 Extendicare Real Estate Investment Trust
Notes to Consolidated Financial Statements
Both the 2013 and 2014 debentures are convertible into REIT Units, and are remeasured at fair value at each reporting date with changes recognized in net earnings, see note 18. Upon a change of control whereby more than 662/3% of the units are acquired by any person or group of persons acting jointly, each holder of the 2013 or 2014 debentures may require the REIT to purchase their debentures at 101% of the principal. If 90% or more of the debenture holders do so, the REIT has the right but not the obligation to redeem all of the remaining outstanding debentures.
cMhc MoRtgAges
Extendicare REIT’s Canadian subsidiaries have various mortgages insured through the Canadian Mortgage and Housing Corporation or “CMHC” program (the “CMHC Mortgages”). The CMHC Mortgages are secured by several Canadian financial institutions at rates ranging from 2.22% to 5.012% with maturity dates through to 2022.
On December 30, 2011, the REIT’s Canadian operations refinanced mortgages on 20 centers insured by the CMHC totalling $72.4 million at a rate of 9.81% that were due to mature in March 2013, with new mortgages totalling the same amount. The new debt consists of $36.1 million on nine centers at a rate of 2.986% maturing in 2022, $22.9 million on nine centers at a rate of 2.22% maturing in 2017, and a bridge loan of $13.3 million on two centers that are seeking to secure new CMHC certificates to replace their existing CMHC certificates maturing in 2013. A prepayment penalty of approximately $7.5 million was recognized in the 2011 fourth quarter (note 17).
In September 2010, ECI executed a 10-year agreement for a $28.7 million CMHC-insured mortgage on its Red Deer, Alberta center at a fixed rate of 4.57% to replace a construction loan.
In August 2009, ECI secured CMHC-insured construction financing of $16.6 million for the Edmonton, Alberta, development project. The loan has a term of two years, with interest-only payments based on a floating rate of 30-day banker’s acceptance plus 2.5%. In January 2012, ECI secured a 10-year CMHC-insured mortgage for $17.4 million on this center at a fixed interest rate of 3.81%, with payments amortized over 30 years.
non-cMhc MoRtgAges
Non-CMHC mortgages are related to three Manitoba nursing centers that were assumed upon acquisition in 2008 that were subsequently refinanced in the same year. These are conventional mortgages at a fixed rate of 5.75% due in 2013 .
fInAnce leAse lIAbIlItIes
In November 2010, EHSI entered into a 10-year finance lease for a 100-bed skilled nursing center in South Bend, Indiana (note 21).
ECI obtained financing of $125.4 million in 2001 from BCP Long-Term Care Facilities Inc. (BCP) to build eight Ontario nursing centers and entered into another arrangement in 2003 with BCP for $14.4 million of financing for an additional Ontario nursing home. ECI is operating the centers for BCP under 25-year finance lease arrangements at an average interest rate of 7.08%.
Finance lease liabilities are payable as follows:
Present value Present value Future minimum of minimum Future minimum of minimum lease payments Interest lease payments lease payments Interest lease payments
As at December 31 2011 2011 2011 2010 2010 2010
Less than one year 13,962 9,107 4,855 13,897 9,397 4,500 Between one and five years 54,713 32,757 21,956 55,288 34,185 21,103 More than five years 145,646 42,715 102,931 158,479 50,172 108,307
214,321 84,579 129,742 227,664 93,754 133,910
constRuctIon loAns
In October 2011, ECI secured conventional long-term financing on its Timmins and Sault Ste. Marie centers in Ontario. The first two years of the loans are for construction with interest-only payments, following which the loans will be amortized over 25 years. Both loans contain fixed rates for the full 27-year term of 5.637% and 5.558%, respectively, and a requirement to maintain a debt service coverage ratio of 1.2 to 1.
In June 2009, ECI secured long-term financing of $19.6 million on its Lethbridge, Alberta, designated assisted living center. The loan has a 27-year term, with interest during construction at a fixed rate of 4.25% that converted to a fixed rate mortgage at 7.70% in January 2011. Commencing with the opening of the center in January 2011, the interest costs were being reimbursed through government funding for the remainder of the term of the loan. The final draw on the mortgage as a construction loan was received in February 2012.

Notes to Consolidated Financial Statements
2011 Annual Report 109
Other
Rbc lIne of cRedIt And letteRs of cRedIt
Extendicare has a $70.0 million demand credit facility with the Royal Bank of Canada (the “RBC Credit Facility”) for its Canadian operations. The RBC Credit Facility is secured by 14 Canadian nursing centers and guaranteed by certain Canadian operating subsidiaries of Extendicare. This credit facility is used to back letters of credit of which there were $40.5 million issued and outstanding as at December 31, 2011, leaving $29.5 million available. The $40.5 million of letters of credit secured $40.0 million of executive pension obligations, and $0.5 million related to construction projects. The amount previously securing the contingent liabilities in connection with the sale of its investment in Crown Life Insurance Company (Crown Life) in 2007 was reduced to zero in August 2011 as a result of the settlement of the remaining claims (note 10).
In October 2011, Extendicare amended its RBC Credit Facility to reduce the maximum limit for the future transfer and assignment of the existing licensed beds at the current Timmins and Sault Ste. Marie centers upon completion of the new centers. This reduction will occur upon the assignment of the licensed beds of the Sault Ste. Marie and Timmins centers in the amounts of $5.0 million and $2.5 million, respectively.
In addition, Extendicare has a U.S. dollar letter of credit facility with the Royal Bank of Canada to provide for the issuance of a U.S. dollar letter of credit. As at December 31, 2011, a US$10.2 million letter of credit (2010 – US$10.2 million) was issued to a third-party insurer of workers’ compensation claims of EHSI and was backed by US$10.2 million in cash collateral held by RBC and invested in short-term deposits. As the cash is pledged as collateral against the letter of credit facility, its use is restricted; therefore, it is presented on the statement of financial position as restricted cash within current assets.
RestRIcted cAsh
Restricted Cash is made up of the US$10.2 million in cash held by RBC as collateral for a letter of credit issued to a third-party insurer in respect of the workers’ compensation claims described above and US$6.4 million held pursuant to the HUD regulatory agreements for working capital purposes.
undRAwn boRRowIng fAcIlItIes
The REIT has the following undrawn borrowing facilities:
December 31, December 31, 2011 2010
Variable Rate Expiring within one year 44,176 64,806 Expiring beyond one year – –
Total 44,176 64,806
The facilities expiring within one year are annual facilities subject to review at various dates during 2012.
fInAncIng costs
Financing costs are deducted from long-term debt and are amortized using the effective interest rate method over the term of the debt. Financing costs included as part of long-term debt amounted to $22.1 million at December 31, 2011 (2010 – $14.7 million). The increase of $7.4 million in 2011 related primarily to the addition of $17.3 million of costs associated with financing of new and refinancing of existing debt, partially offset by amortization charges included in finance costs and changes in foreign exchange.

110 Extendicare Real Estate Investment Trust
Notes to Consolidated Financial Statements
Below is a summary of the financing costs:
Year of December 31, December 31, January 1, Interest rate maturity 2011 2010 2010
US$ C$ C$ C$EHSI (payable in US$) HUD mortgages 4.23% – 6.152% 2018 – 2046 14,502 14,750 4,524 39 May 2012 CMBS Financing 6.6525% 2012 310 315 2,490 5,371 March 2012 CMBS Financing 6.79% 2012 – – 713 1,348 Line of credit under Credit Facility variable 2012 146 148 569 1,805 PrivateBank mortgage loans variable 2013 372 378 424 – Sovereign Bank mortgage loans variable 2011 – – 255 984 Other – – 89 118
15,330 15,591 9,064 9,665
Extendicare REIT and Canadian Subsidiaries (payable in C$) CMHC mortgages 2.22% – 5.012% 2013 – 2022 3,879 3,569 1,653 Non-CMHC mortgages 5.75% 2013 115 128 173 Finance lease obligations averaging 7.08% 2026 – 2028 482 513 545 Construction loans 5.637% – 7.7% 2037 – 2038 2,082 1,426 286
6,558 5,636 2,657
Total financing costs 22,149 14,700 12,322 Less: current portion 1,707 4,427 5,703
20,442 10,273 6,619
pRIncIpAl RepAyMents
Principal repayments on long-term debt, exclusive of finance lease liabilities, are as follows:
Year Amount
2012 189,550 2013 191,466 2014 137,614 2015 17,776 2016 24,081 2017 and beyond 457,783
1,018,270
InteRest RAtes
The weighted average interest rate of all long-term debt at December 31, 2011, was approximately 5.5% (2010 – 6.6%). At December 31, 2011, 91.1% of the long-term debt, excluding financing costs, was at fixed rates.

Notes to Consolidated Financial Statements
2011 Annual Report 111
12. other long-term liabilities December 31, December 31, January 1, 2011 2010 2010
Accrued pension plan obligation (note 22) 33,020 29,210 26,559 Exchangable LP Units (notes 13 and 18) – – 31,321 Deferred compensation 11,635 10,941 11,068 Unit appreciation rights 1,348 1,047 158 Future lease commitments 1,826 1,892 2,146 Fair value of foreign currency forward contract – – 203 Other 1,809 1,065 1,375
49,638 44,155 72,830
Deferred Compensation
EHSI maintains an unfunded deferred compensation plan offered to all corporate employees defined as highly compensated by the U.S. Internal Revenue Code in which participants may defer up to 10% of their base salary. EHSI will match up to 50% of the amount deferred. EHSI also maintains non-qualified deferred compensation plans covering certain executive employees.
Unit Appreciation Rights Plan
UARs are granted at the discretion of the Board of Trustees of the REIT. Any trustee, director, officer or employee of Extendicare REIT or its affiliates is eligible to participate.
A summary of the UARs that have been granted to date by the Board of Trustees to senior management and the trustees as at December 31st is as follows:
2011 2010
Weighted Average Weighted Average Units Vesting Price Units Vesting Price
Outstanding, beginning of year 1,100,667 $8.48 559,000 $6.64 Granted 682,000 10.99 628,000 10.04 Forfeited (320,250) (9.20) (86,333) (7.84)
Outstanding, end of year 1,462,417 $9.49 1,100,667 $8.48
The fair value of UARs was measured based on the Black-Scholes model. The inputs used in the fair value measurement for 2011 and 2010 are as follows:
• Unit price – $7.93
• Volatility – 35.00%
• Risk-free interest rate – 0.95% to 0.97%
Other inputs include:
2011 2010
Strike price $7.58 – $11.16 $8.52 – $10.09Expected remaining life 2.2 years – 2.6 years 1.2 years – 1.9 years
The vesting price represents the REIT Unit price at which the respective UARs were granted, and equates to the minimum REIT Unit price at which they can be vested. As at December 31, 2011, 1,462,417 UARs were outstanding, with an average remaining contractual life of 1.5 years (2010 – 1.9 years). During 2011, $0.3 million was expensed (2010 – $0.9 million), and the related liabilities included as part of other long-term liabilities were $1.3 million as at December 31, 2011 (2010 – $1.0 million).

112 Extendicare Real Estate Investment Trust
Notes to Consolidated Financial Statements
Awards under the UARP cliff vest after three years, subject to conditions as described below, and permit the participants to receive, at the election of the Board of Trustees, either a payment in cash or equivalent value of REIT Units acquired on the TSX. Vesting of UARs is subject to continued employment of the participant, with pro-rating provisions in the event of the participant’s death, retirement or termination of employment as described below, a minimum REIT Unit price, and may also be subject to achieving operating performance measures, as determined by the Board of Trustees at the date of grant. Consideration for vested UARs is equal to the appreciation in the Fair Market Value of the vested UARs from the date of grant of the UAR, plus Accrued Distributions.
The UARP contains provisions providing for adjustments in the event of a corporate reorganization, including an amalgamation or merger of the REIT with or into another entity, or in the event of a change in control (as defined in the UARP). Upon termination of employment (for cause) of a participant, all of his or her UARs shall be cancelled and terminated without payment. In the event of the death, retirement, or termination of employment (other than for cause) of a participant, that occurs on or after the first anniversary date of the date of grant of a particular UAR, the number of UARs available to vest for the remaining term of such grant is pro-rated based on the elapsed time since the date of grant. The balance of the number of UARs under such grant shall be cancelled and terminated without payment. If the date of any such event occurs prior to the first anniversary date of the date of grant of a particular UAR, then such UAR is cancelled and terminated without payment.
Future Lease Commitments
The effects of scheduled rent increases included in minimum lease payments are recognized on a straight-line basis over the lease term. The amount recorded as future lease commitments represents the cumulative excess of lease expense computed on a straight-line basis for the lease term over actual lease payments.
13. unit capitalAuthorized Capital
The REIT has an unlimited number of REIT Units authorized.
Each REIT Unit is transferable and represents an equal and undivided beneficial interest in the assets of the REIT. Each REIT Unit entitles the holder to one vote at all meetings of unitholders of the REIT. Holders of REIT Units are entitled to receive non-cumulative distributions from the REIT (whether of net earnings, net realized capital gains or other amounts) if, as and when declared by the Board of Trustees. REIT Units are redeemable upon demand by the unitholders, and may be purchased by the REIT for cancellation through offers made to, and accepted by, such holders. Otherwise, the REIT Units have no conversion, retraction, redemption or pre-emptive rights.
The REIT had an unlimited number of Exchangeable LP Units issued by Extendicare LP which were intended, to the greatest extent practicable, to be economically equivalent to REIT Units. Additionally, Exchangeable LP Units were accompanied by special voting units of the REIT that entitled the holder to receive notice of, attend and vote at all meetings of unitholders of the REIT. The Exchangeable LP Units were exchangeable on a one-for-one basis for REIT Units at the option of the holder, and all remaining Exchangeable LP Units were automatically exchanged for REIT Units on November 10, 2011. Each Exchangeable LP Unit entitled the holder to receive distributions from Extendicare LP that were, to the greatest extent practicable, economically equivalent to the distributions made to holders of REIT Units. During 2011, 3.2 million Exchangeable LP Units were exchanged for REIT Units on a one-for-one basis (2010 – 0.1 million).
2010 Equity Offering
On February 4, 2010, the REIT completed a public equity offering of 9,228,750 REIT Units at a price of $9.35 per unit for aggregate gross proceeds of $86.3 million ($82.2 million net of underwriters’ fees and offering expenses, before income taxes).
Distribution Reinvestment Plan
The REIT has implemented a Distribution Reinvestment Plan (DRIP) pursuant to which holders of REIT Units and holders of Exchangeable LP Units who are residents in Canada may elect to reinvest their cash distributions in additional REIT Units or Exchangeable LP Units, as the case may be, on the date of the distribution, at a price equal to 97% of the volume-weighted average trading price of the REIT Units on the TSX for the five trading days immediately preceding the corresponding date of distribution. During 2011, the REIT issued 1.1 million REIT Units at a value of $9.2 million in connection with the DRIP (2010 – $0.6 million at a value of $5.3 million).
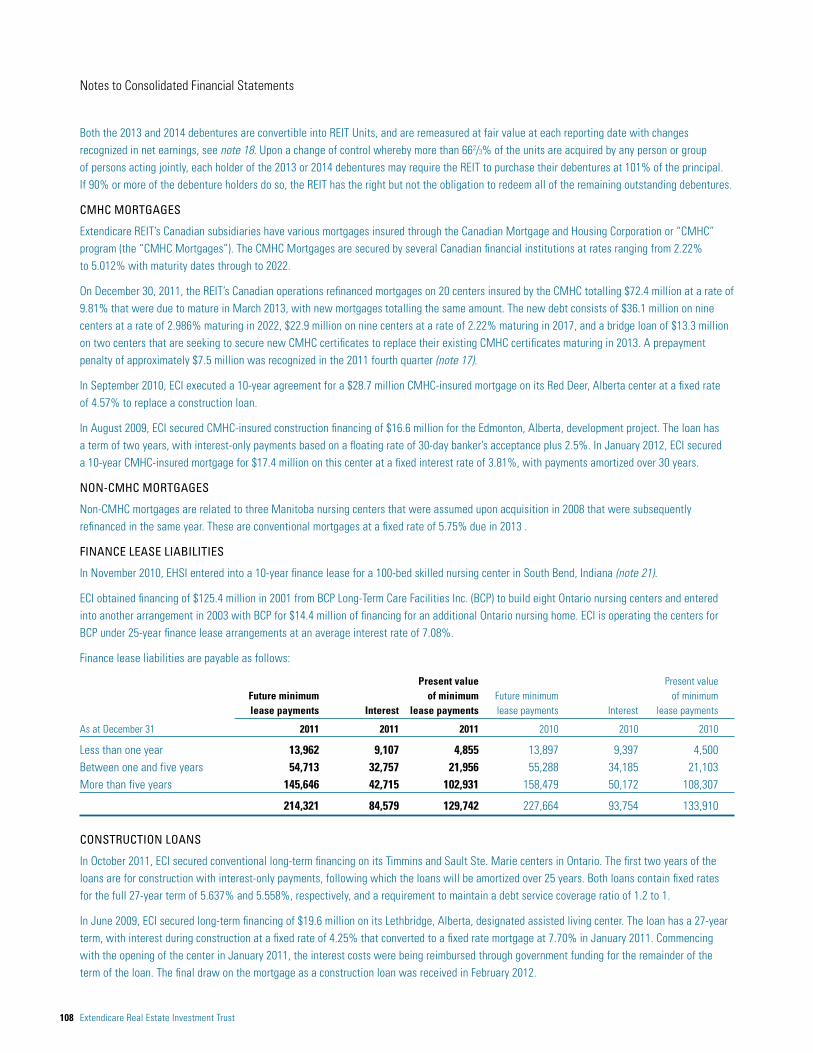
Notes to Consolidated Financial Statements
2011 Annual Report 113
Normal Course Issuer Bid
In January 2011, the REIT received approval from the TSX for its normal course issuer bid (the “2011 Bid”) to purchase for cancellation up to 7.8 million REIT Units, $11.4 million aggregate principal amount of its 2014 Debentures, and $9.2 million aggregate principal amount of its 2013 Debentures, representing, in each case, approximately 10% of the public float of the outstanding securities at December 31, 2010. There were no purchases for cancellation made and the 2011 Bid expired on January 10, 2012.
14. equity ReservesEquity reserves are included in AOCI and are comprised of fair value and translation reserves, as follows:
Unrealized Realized Total Total gains/losses gains/losses fair value Translation equity on AFS securities on AFS securities reserve reserve reserves
Balance, January 1, 2010 11 (156) (145) – (145)Recognized during the year 1,062 (488) 574 (19,007) (18,433)
Balance, December 31, 2010 1,073 (644) 429 (19,007) (18,578)Recognized during the year 59 (115) (56) 5,373 5,317
Balance, December 31, 2011 1,132 (759) 373 (13,634) (13,261)
Fair value reserve
The fair value reserve comprises the cumulative net change in the fair value of available-for-sale financial assets until the investments are derecognized or impaired.
Translation reserve
The translation reserve comprises all foreign currency differences arising from the translation of the financial statements of foreign operations.
15. RevenueEHSI derived approximately 80% of its revenue from services provided under the federal (Medicare) and state (Medicaid) programs in both 2011 and 2010. The Medicare program pays each participating center a prospectively set rate for each resident, which is based on the resident’s acuity. Most Medicaid programs fund participating centers using a case-mix based system, paying prospectively set rates. With respect to Medicaid in states that utilize retrospective reimbursement systems, nursing centers are paid on an interim basis for services provided, subject to adjustments based upon allowable costs, which are generally submitted in cost reports on an annual basis. In these states, revenue is subject to adjustments as a result of cost report settlements with the state.
Funding received by ECI for its nursing homes and home health care services is regulated by provincial authorities. Revenue from provincial programs represented approximately 66% of ECI’s nursing home revenue (2010 – 65%), and approximately 97% of ECI’s home health care revenue (2010 – 96%).
16. expenses by nature 2011 2010
Employee wages and benefits 1,370,347 1,358,686 Food, drugs, supplies and other variable costs 185,627 192,784 Property based and other costs 326,973 292,328
Total operating expenses and administrative costs 1,882,947 1,843,798 Lease costs 10,999 11,548
Total expenses 1,893,946 1,855,346

114 Extendicare Real Estate Investment Trust
Notes to Consolidated Financial Statements
17. loss from Asset Impairment, disposals and other Items 2011 2010
Asset impairment 54,012 1,244 Debt settlement 11,015 – Loss (gain) on disposals (494) 334 Release of provision for contingent liabilities (2,397) – Loss on termination of leases – 1,013 Refinancing fees – 381 Other 360 (24)
Loss from asset impairment, disposals and other items 62,496 2,948
2011
As a result of the CMS announcement in July 2011 to reduce Medicare rates along with other changes (note 7), EHSI has recognized a pre-tax impairment loss of $54.0 million (US$53.9 million) in the 2011 third quarter, of which $22.4 million (US$22.3 million) was allocated to goodwill (note 7), and $31.7 million (US$31.6 million) to property and equipment (note 6). In respect of property and equipment, if future assessments indicate that there is a change in the estimates used to determine the recoverable amount, the impairment loss will be reversed subject to certain limits (note 3(j)).
In December 2011, the REIT’s Canadian operations refinanced $72.4 million in mortgages secured by 20 CMHC-insured centers that were at fixed rates of 9.81% and due to mature in March 2013 (note 11). As a result, a prepayment penalty of approximately $7.5 million was recognized in the 2011 fourth quarter.
During the third and fourth quarters of 2011, EHSI prepaid US$367.3 million of the May 2012 CMBS debt and defeased US$86.6 million of the March 2012 CMBS debt, respectively. EHSI recorded a pre-tax loss of $2.5 million (US$2.5 million) on retirement of debt that included a defeasance penalty of $1.4 million (US$1.4 million), transaction fees of $0.3 million (US$0.3 million), and the write-off of unamortized loan fees on the debt of $0.8 million (US$0.8 million) (note 11).
In October 2011, the new 180-bed long-term care center in Edmonton, Alberta, was completed. The existing nursing center in Edmonton (113 operational beds) was closed in November and a charge of $0.4 million mortgage prepayment penalty was incurred.
In June 2011, ECI completed the sale of the Lethbridge, Alberta, property (120-bed closed nursing center) for net proceeds of $1.0 million that resulted in a pre-tax gain of $0.2 million in the 2011 second quarter. During the 2011 first quarter when the center closed, a charge of $0.6 million was incurred related to a mortgage prepayment penalty.
In May 2011, EHSI completed the sale of the Saginaw, Michigan skilled nursing center for net proceeds of $3.8 million (US$3.9 million) that resulted in a pre-tax gain of $0.3 million (US$0.3 million). This completed the transaction under the 2009 agreement described below.
Previously, Extendicare had a provision for contingent liabilities in connection with the sale of its investment in Crown Life. In April 2011, settlement was reached on one of the claims below the amount accrued for that particular item, resulting in the release of $0.5 million of the provision. Another settlement was reached in August 2011 for the remaining claim, resulting in the release of the remainder of the provision of $1.9 million (notes 10 and 11).

Notes to Consolidated Financial Statements
2011 Annual Report 115
2010
In 2009, EHSI reached an agreement to sell six Michigan skilled nursing centers (667 beds), one owned skilled nursing center in Ohio (100 beds), and one skilled nursing center in Pennsylvania (107 beds). In April 2010, EHSI completed the sale of the Pennsylvania and Ohio centers for cash consideration of US$5.5 million, which resulted in a net pre-tax loss of $1.7 million (US$1.7 million). In August 2010, EHSI completed the sale of four of the six Michigan centers for cash consideration of US$15.9 million that resulted in a pre-tax loss of $0.4 million (US$0.3 million). The agreement to sell one of the Michigan centers was terminated; and in February 2011, the purchaser exercised the option to acquire the remaining Michigan nursing center for total consideration of US$4.1 million, the sale of which was finalized in May 2011.
In December 2010, the REIT reported a pre-tax gain of $1.7 million related to the disposal of U.S. non-core assets with a book value of US$6.2 million; and EHSI incurred costs of $0.4 million relating to an application to extend the maturity date of the CMBS loan maturing November 2011 (note 11).
In the 2010 second quarter, EHSI completed the transfer of two leased skilled nursing centers to new operators, which involved a lease termination settlement of $1.0 million (US$1.0 million); and EHSI recorded an impairment loss of $1.2 million to reduce to fair value a previously closed nursing center in Washington due to the general decline in property values in the local real estate market.
18. finance costs and finance IncomeConvertible Debentures
The fair value adjustment on convertible debentures was a loss of $0.6 million for 2011 and $6.2 million for 2010. This related to the remeasurement of the liability at fair value at the end of each period.
Exchangeable LP Units
The Exchangeable LP Units were intended to be economically equivalent to the REIT Units, to the greatest extent practicable. These units were accompanied by special voting units of the REIT that entitled the holder to receive notice of, attend and vote at all meetings of unitholders of the REIT. They were exchangeable on a one-for-one basis for REIT Units at the option of the holder, and all remaining Exchangeable LP Units were automatically exchanged for REIT Units on November 10, 2011.
Each Exchangeable LP Unit entitled the holder to receive distributions from Extendicare LP that were economically equivalent to the distributions made to holders of REIT Units, to the greatest extent practicable. Distributions on Exchangeable LP Units were recognized in net earnings as part of finance costs.
These Exchangeable LP Units were designated as financial liabilities valued at FVTPL with changes in fair value recognized in net earnings as part of finance costs. The fair value adjustment on Exchangeable LP Units resulted in a gain of $6.6 million for 2011 and $1.6 million for 2010.
Notes Due between Canadian and U.S. Subsidiaries
We recorded foreign exchange gains of $0.2 million for 2011 and $3.3 million for 2010. These related primarily to the change in value of foreign currency-denominated notes between EHSI and some of the Canadian-based subsidiaries.
Foreign Currency Derivatives
The valuation adjustment on FCFCs was a gain of $0.4 million in 2011 and a loss of $0.1 million in 2010. This related primarily to the revaluation of EHSI contracts that locked in the purchase of Canadian dollars at specified foreign exchange rates for US$4.0 million per month until June 2011. There were no outstanding FCFCs as at December 31, 2011.

116 Extendicare Real Estate Investment Trust
Notes to Consolidated Financial Statements
19. discontinued operationsIn December 2011, EHSI reached an agreement in principal to sell its group purchasing organization (“GPO”) to Navigator Group Purchasing, a subsidiary of Managed Health Care Associates, Inc. The sale of EHSI’s GPO was completed in January 2012 for approximately US$56 million; therefore, GPO’s operations were reclassified as discontinued operations.
The following is a summary of results of all discontinued operations with prior periods re-presented accordingly.
2011 2010
Results from discontinued operationsOther revenue 12,286 12,546
Operating expenses 4,194 4,362 Lease costs 48 52
Total expenses 4,242 4,414
Earnings before depreciation and amortization 8,044 8,132 Depreciation and amortization 81 108
Earnings before income taxes 7,963 8,024 Income tax expense 3,036 3,099
Earnings from discontinued operations 4,927 4,925
Cash flows from discontinued operationsNet cash from operating activities 4,697 5,147 Net cash from investing activities (53) (66)Net cash from financing activities – –
Effect on cash flows 4,644 5,081
20. Income taxesTaxation of Extendicare REIT and its Corporate Subsidiaries
Extendicare REIT is a Canadian unincorporated, open-ended real estate investment trust established under the laws of the Province of Ontario by the Deed of Trust, and is a mutual fund trust and a specified investment flow-through (SIFT) trust for income tax purposes. The REIT has been subject to the tax regime applicable to SIFT trusts (the “SIFT Rules”) since January 1, 2007.
Under the SIFT Rules, an income trust that is a SIFT trust is subject to tax in respect of certain income that is distributed to its unitholders, at rates that are substantially equivalent to the general corporate tax rate applicable to Canadian corporations. Distributions from income in respect of which this tax is payable will be treated in the same manner as taxable dividends from a taxable Canadian corporation in the hands of unitholders and will be eligible for the enhanced dividend tax credit if paid to an individual resident in Canada. This distribution tax does not apply to distributions by a SIFT trust of taxable dividends received (or deemed to be received) by a SIFT trust from a Canadian corporation or income earned from non-Canadian subsidiaries. Corporate subsidiaries of the REIT are not subject to tax under the SIFT Rules but are instead subject to corporate income tax in the jurisdictions in which they operate.
The SIFT Amendments also facilitate the conversion of SIFT trusts into corporations, either through the distribution by a SIFT trust of shares of a taxable Canadian corporation to its unitholders or by the transfer of units of a SIFT trust to a taxable Canadian corporation, followed by a winding up of the SIFT trust. The automatic tax-deferred rollover treatment applies to transactions that occur before 2013.


118 Extendicare Real Estate Investment Trust
Notes to Consolidated Financial Statements
Effective Tax Rate
The major factors that caused variations from the expected combined Canadian federal and provincial statutory income tax rates were the following:
2011 2010
Earnings (loss) from continuing operations before income taxes (21,881) 74,431
Income taxes at statutory rates of 28.25% (2010 – 31%) (6,181) 23,074 Income tax effect relating to the following items: Tax rate variance of foreign subsidiaries 11,294 7,778 Foreign exchange gain (121) (668) Reversal of previously recognized benefit 1,709 2,353 Non-deductible items 9,857 3,208 Non-taxable income (2,442) (120) Other items (674) 1,902
13,442 37,527
Summary of Operating and Capital Loss Carryforwards
At December 31, 2011, the REIT’s U.S. corporate subsidiaries had net operating loss carryforwards available for U.S. state income tax purposes of $29.6 million (US$29.1 million), which expire in the years 2012 through 2031, and had $9.2 million (US$9.0 million) of net operating loss carryforwards available for U.S. federal income tax purposes, which expire in the years 2021 through 2031. In addition, the REIT’s Canadian corporate subsidiaries had $34.7 million of net operating loss carryforwards available for Canadian federal income tax purposes, which expire in the years 2015 through 2031. To the extent that it is more likely than not that some or all of the deferred tax assets will not be realized, no deferred tax asset has been established.
At December 31, 2011, there were capital losses available for Canadian income tax purposes of $21.7 million (2010 – $24.4 million) that can be carried forward indefinitely to apply against future capital gains. No deferred tax assets have been recognized for the future tax benefit of these capital losses of $2.9 million (2010 – $3.3 million).
Net deferred tax liabilities decreased in 2011 by $10.6 million to $179.6 million from $190.2 million at December 31, 2010. Management believes it is more likely than not that the REIT’s corporate subsidiaries will realize the benefits of these deductible differences.
Recognized Deferred Tax Assets and Liabilities
Deferred tax assets and liabilities are attributable to the following:
December 31, December 31, January 1, 2011 2010 2010
Deferred tax assets 35,752 34,190 36,400 Deferred tax liabilities 215,326 224,349 235,910
Deferred tax liabilities, net 179,574 190,159 199,510

Notes to Consolidated Financial Statements
2011 Annual Report 119
Movement in Temporary Differences
Deferred income taxes are provided for temporary differences between the carrying values of assets and liabilities and their respective tax values as well as available tax loss carryforwards. The significant components of deferred income tax assets and liabilities and the movement in these balances during the year are as follows.
Recognized Recognized Balance in other Recognized in other Balance January 1, Recognized comprehensive directly comprehensive December 31, 2010 in net earnings income in equity income re: FX 2010
Deferred tax liabilities Property and equipment 252,032 5,539 – – (12,110) 245,461 Leasehold rights 418 (1) – – (22) 395 Other 16,093 (56) – (1,109) (1,052) 13,876
268,543 5,482 – (1,109) (13,184) 259,732
Deferred tax assets Self-insurance reserves 13,472 (3,108) – – (606) 9,758 Employee benefit accruals 21,636 (877) 799 – (717) 20,841 Operating loss carryforwards 6,721 1,522 – – (6) 8,237 Deferred revenue 5,484 675 – – – 6,159 Accounts receivable reserves 7,435 (2,386) – – (317) 4,732 Decommissioning provision 8,189 (124) – – (332) 7,733 Other 6,096 6,573 – – (556) 12,113
69,033 2,275 799 – (2,534) 69,573
Deferred tax liabilities, net 199,510 3,207 (799) (1,109) (10,650) 190,159
Recognized Recognized Balance in other in other Balance January 1, Recognized comprehensive comprehensive December 31, 2011 in net earnings income Other income re: FX 2011
Deferred tax liabilities Property and equipment 245,461 (15,660) – – 4,497 234,298 Leasehold rights 395 (139) – – 9 265 Other 13,876 2,614 – 1,123 803 18,416
259,732 (13,185) – 1,123 5,309 252,979
Deferred tax assets Self-insurance reserves 9,758 3,241 – – 305 13,304 Employee benefit accruals 20,841 (1,580) 1,122 – 281 20,664 Operating loss carryforwards 8,237 2,628 – – 32 10,897 Deferred revenue 6,159 (1,716) – – – 4,443 Accounts receivable reserves 4,732 (2,334) – – 41 2,439 Decommissioning provision 7,733 665 – – 152 8,550 Other 12,113 749 – – 246 13,108
69,573 1,653 1,122 – 1,057 73,405
Deferred tax liabilities, net 190,159 (14,838) (1,122) 1,123 4,252 179,574
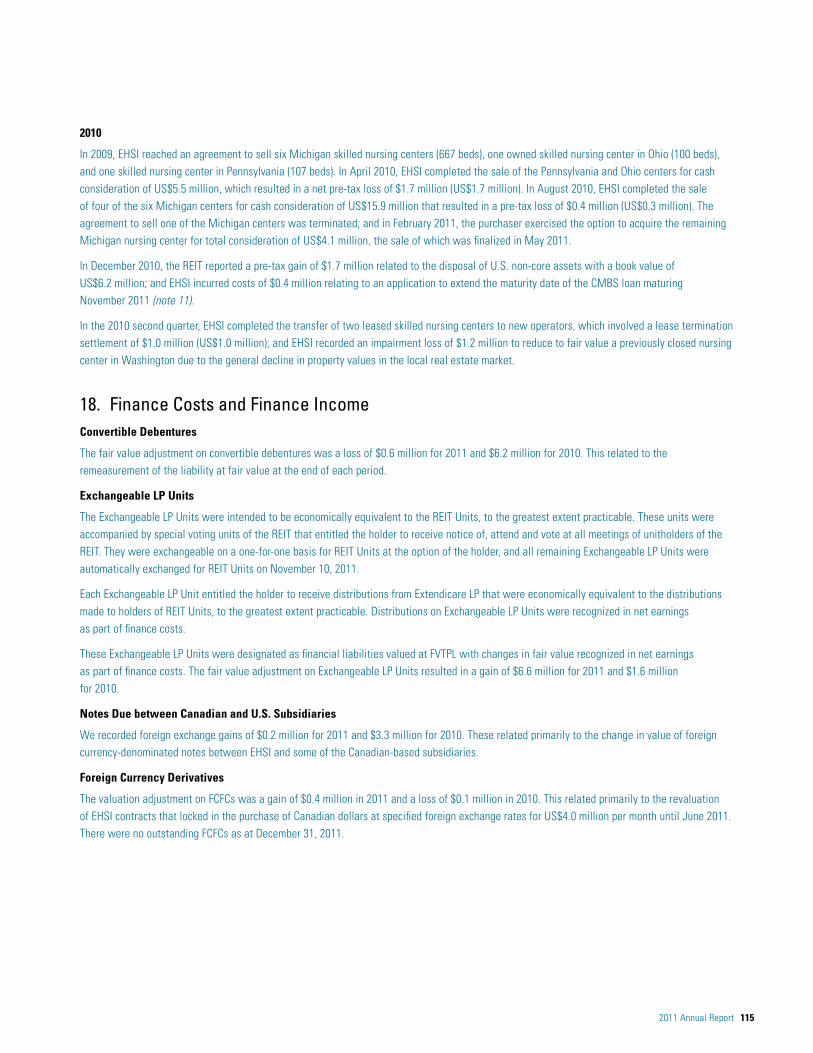
120 Extendicare Real Estate Investment Trust
Notes to Consolidated Financial Statements
21. commitments and contingenciesOperating Lease Commitments
At December 31, 2011, the REIT was committed under non-cancellable leases requiring future minimum rentals as follows:
Operating Leases
2012 7,731 2013 5,903 2014 5,328 2015 4,574 2016 4,199 2017 and beyond 13,594
Total minimum payments 41,329
Property and Equipment Commitments
At December 31, 2011, outstanding capital expenditure commitments for EHSI totalled $5.0 million (US$4.9 million). ECI had outstanding capital expenditure purchase commitments totalling $64.5 million as at December 31, 2011, relating to two redevelopment projects.
Construction of the two Ontario redevelopment projects totalling 436 beds, at a cost of approximately $80 million net of government grants, began in the spring of 2011. The new 180-bed nursing center in Timmins and a new 256-bed nursing center in Sault Ste. Marie will replace two Ontario class “C” centers (280 beds) upon completion by the end of 2013 first quarter.
Contractual and Future Skilled Nursing Property Lease Obligations
In September 2009, EHSI entered into an agreement with the company controlled by the former shareholders of Tendercare, which includes a partial interest of Mr. Lukenda, our President and Chief Executive Officer, and his immediate family (note 25). The company owns a 120-bed skilled nursing center in Lansing, Michigan. Effective January 1, 2011, under the terms of the agreement and immediately following the renovation of the center, EHSI entered into a 10-year operating lease for US$0.4 million per annum. The center was certified in March 2011.
In June 2009, EHSI entered into an agreement with an unrelated party who constructed a 100-bed skilled nursing center in South Bend, Indiana. Effective November 2010, under the terms of the agreement, EHSI entered into a 10-year finance lease for US$1.0 million in the first year and US$1.1 million thereafter (note 11).
ALC Spin-Off
The Arrangement included the distribution of Assisted Living Concepts, Inc. (ALC) in 2006 to Extendicare’s shareholders and a number of pre-Arrangement transactions. As part of the spin-off of ALC in 2006 to Extendicare’s shareholders, EHSI and ALC entered into a tax allocation agreement dated as of November 10, 2006 (the “Tax Allocation Agreement”).

Notes to Consolidated Financial Statements
2011 Annual Report 121
In 2009, ALC asserted a claim against EHSI under the Tax Allocation Agreement relating to additional depreciation deductions allowed by the IRS for years 2005 and 2006 relating to limitations computed under Section 382 of the Internal Revenue Code. In December 2010, EHSI agreed to settle this matter for US$0.8 million (US$0.5 million after tax) and terminate the Tax Allocation Agreement. The settlement was charged directly to retained earnings since the spin-off of ALC was accounted for as a capital transaction in 2006.
In connection with the Arrangement, EHSI received a note upon the transfer of ALC to its Canadian affiliate, which was subsequently repaid by way of cash, settlement against other notes and dividends of US$476.6 million. Based upon internal calculations, management believes there was sufficient surplus as to not attract any Canadian taxes from the transactions relating to the repayment of the note. The REIT and its Canadian subsidiaries are currently under audit by the Canada Revenue Agency (CRA). Should the CRA determine that the available surplus was less than the amount determined by management, Canadian capital gains tax would apply to the shortfall.
Legal Proceedings and Regulatory Actions
The REIT and its subsidiaries are defendants in actions brought against them from time to time in connection with their operations. Recently adopted U.S. health care reform legislation is calling for more government oversight of the long-term care industry and operators are experiencing an increase in government investigations, audits and scrutiny of their operations. It is not possible to predict the ultimate outcome of the various proceedings at this time or to estimate additional costs that may result. However, based on current knowledge, management does not believe that liabilities, if any, arising from pending litigation will have a material adverse effect on the consolidated financial position, or results of operations of the REIT.
EHSI has received subpoenas from the U.S. Department of Health and Human Services (DHHS), Office of the Inspector General (OIG), relating to the possible submission of claims that may be in violation of the U.S. Social Security Act and to the provision of rehabilitation services. EHSI and its subsidiaries believe that they are in material compliance with the requirements imposed on them by the U.S. Social Security Act, and intend to furnish all requested information and to cooperate with the OIG in its investigation. The DHHS, OIG, CMS and other federal and state enforcement agencies may conduct additional investigations related to our business in the future that may, individually or in the aggregate, have a material adverse effect on the business or financial condition of EHSI.
The provision of health care services is subject to complex laws and regulations at the federal and state government levels, including laws that are intended to prevent health care fraud and abuse. On an ongoing basis, long-term care providers are subject to surveys, inspections, audits and investigations by various government authorities to ensure compliance with applicable laws and licensure requirements. In such circumstances, the REIT cooperates in responding to information requests and takes the necessary corrective actions and, where appropriate, estimates costs that may result from such investigations, to the extent such costs are predictable or determinable.
22. employee benefitsRetirement compensation arrangements are maintained for certain employee groups as described below.
Defined Benefit Plans
The REIT provides a registered defined benefit pension plan, as well as a supplementary plan that is an unfunded defined benefit pension arrangement for certain of its executives, both of which have been closed to new entrants for several years. The registered defined benefit plan was fully funded with plan assets of $5.6 million and accrued benefit obligations of $7.6 million as at December 31, 2011. The accrued benefit obligations of the supplementary plan were $33.3 million as at December 31, 2011. We do not set aside assets in connection with the supplementary plan and the benefit payments made thereunder are funded from our cash from operations. We measure our accrued benefit obligations and the fair value of plan assets for accounting purposes at December 31st of each year. A discount rate of 5.0% was used to determine the benefit expense in 2011, and a discount rate of 4.0% was used to calculate the accrued benefit obligation at the end of 2011. Actuarial valuation reports of the defined benefit pension plans are completed every three years with the last one performed as of October 1, 2009. The next required funding valuation will be effective October 1, 2012.

122 Extendicare Real Estate Investment Trust
Notes to Consolidated Financial Statements
The different types of defined benefit plans of the REIT are listed below.
Funded defined Unfunded supplementary benefit plan defined benefit plan Total
Dec 31, Dec 31, Jan 1, Dec 31, Dec 31, Jan 1, Dec 31, Dec 31, Jan 1, 2011 2010 2010 2011 2010 2010 2011 2010 2010
Fair value of plan assets 5,644 6,259 6,115 – – – 5,644 6,259 6,115 Present value of obligations 7,587 6,762 6,105 33,253 30,890 28,948 40,840 37,652 35,053
Surplus (deficit) (1,943) (503) 10 (33,253) (30,890) (28,948) (35,196) (31,393) (28,938)
Experience gains (losses) arising on plan assets (582) 152 n/aExperience losses arising on plan liabilities (21) (420) n/a
Additional information for these benefit plans is provided in the following tables.
2011 2010
pResent vAlue of defIned benefIt oblIgAtIons Accrued benefit obligations Balance at beginning of year 37,652 35,053 Current service cost 149 128 Benefits paid (2,606) (2,624) Interest costs 1,825 1,947 Actuarial losses 3,820 3,148
Balance at end of year 40,840 37,652
Plan assets Fair value at beginning of year 6,259 6,115 Employer contributions 2,180 2,203 Expected return on assets 393 413 Actual return on plan assets (582) 152 Benefits paid (2,606) (2,624)
Fair value at end of year 5,644 6,259
Defined benefit obligations 35,196 31,393
The expected contribution for the coming year is approximately $2.2 million.
December 31, December 31, January 1, 2011 2010 2010
Reported in the REIT’s statement of financial position Current accrued liabilities 2,176 2,183 2,379 Other long-term liabilities (note 12) 33,020 29,210 26,559
Accrued benefit liability at end of year 35,196 31,393 28,938
December 31, December 31, January 1, 2011 2010 2010
peRcentAge of plAn AssetsEquities 60% 63% 62% Fixed income securities 34% 32% 32% Cash and short-term investments 6% 5% 6%
100% 100% 100%

Notes to Consolidated Financial Statements
2011 Annual Report 123
2011 2010
eXpense RecognIZed In net eARnIngs Annual benefit plan expense Current service costs 149 128 Interest cost 1,825 1,947 Expected return on plan assets (393) (413)
Plan benefit expense recognized in the year – included in operating expenses and administrative costs 1,581 1,662
2011 2010
ActuARIAl gAIns oR losses RecognIZed In otheR coMpRehensIve loss Amount accumulated in retained earnings, January 1 (2,197) – Recognized during the year (3,280) (2,197)
Amount recognized in retained earnings at December 31 (5,477) (2,197)
2011 2010
sIgnIfIcAnt ActuARIAl AssuMptIons
Discount rate for year-end accrued obligation 4.00% 4.75% Discount rate for period expense 5.00% 5.50% Expected long-term rate of return on plan assets 6.5% 7.0% Rate of compensation increase 2.0% 5.0% Average remaining service years of active employees 6 7
The present value of the pension obligations depends on a number of factors that are determined on an actuarial basis using a number of assumptions. The assumptions used in determining the net cost (income) for pensions include the discount rate. Any changes in these assumptions will impact the carrying amount of pension obligations.
The REIT determines the appropriate discount rate at the end of each year. This is the interest rate that should be used to determine the present value of estimated future cash outflows expected to be required to settle the pension obligations. In determining the appropriate discount rate, the REIT considers the interest rates of high-quality corporate bonds that are denominated in the currency in which the benefits will be paid, and that have terms to maturity approximating the terms of the related pension liability.
Defined Contribution Plans
Both Canada and the U.S. offer defined contribution plans. Canada maintains registered savings and defined contribution plans, while EHSI maintains defined contribution retirement 401(k) savings plans in the U.S. Canada matches up to 120% of the employees’ contributions according to seniority, subject to a maximum, based on the salary of the plan participants. Contributions expensed by Canada in 2011 and 2010 were $11.5 million and $10.9 million, respectively. EHSI also pays a matching contribution of 25% of every qualifying dollar contributed by plan participants, net of any forfeiture. Contributions expensed by EHSI in 2011 and 2010 were US$2.7 million and US$2.4 million, respectively.
23. Management of Risks and financial Instruments(a) Management of Risks
MAnAgeMent of lIquIdIty RIsk
Liquidity risk is the risk that the REIT will encounter difficulty in meeting its contractual obligations. We manage our liquidity risk through the use of budgets and forecasts. Cash requirements are monitored regularly based on actual financial results and actual cash flows to ensure that there are sufficient resources to meet operational requirements. We ensure that there are sufficient funds for declared and payable distributions and any other future commitments at any point in time. In addition, since there is a risk that long-term debt may not be refinanced or may not be refinanced on as favourable terms or with interest rates as favourable as those of the existing debt, we attempt to appropriately structure the timing of contractual long-term debt renewal obligations and exposures.

124 Extendicare Real Estate Investment Trust
Notes to Consolidated Financial Statements
The following are the contractual maturities of financial liabilities, including estimated interest payments:
Carrying Contractual Less than More than As at December 31, 2011 amount cash flows 1 year 1–2 years 2–5 years 5 years
Convertible debentures 214,309 231,951 13,150 101,624 117,177 – CMBS Financings 111,755 119,189 119,189 – – – Line of Credit 53,901 57,369 57,369 – – – HUD mortgages 402,060 420,403 7,406 7,793 25,493 379,711 PrivateBank mortgage loans 35,076 37,181 589 36,592 – – CMHC mortgages 166,308 197,593 16,760 43,094 51,601 86,138 Non-CMHC mortgages 15,912 17,571 1,293 16,278 – – Finance lease obligations 129,742 214,321 13,962 13,963 40,750 145,646 Construction loans 18,288 44,301 1,631 1,675 5,083 35,912 Notes payable 9,238 9,913 5,471 4,408 34 – Accounts payable 42,241 42,241 42,241 – – –
1,198,830 1,392,033 279,061 225,427 240,138 647,407
Carrying Contractual Less than More than As at December 31, 2010 amount cash flows 1 year 1–2 years 2–5 years 5 years
Convertible debentures 213,740 245,101 13,150 13,150 218,801 – CMBS Financings 576,206 614,656 523,184 91,472 – – Line of Credit 16,794 17,801 17,801 – – – HUD mortgages 27,308 28,786 1,128 1,196 4,034 22,428 PrivateBank mortgage loans 24,835 26,325 382 416 25,527 – Sovereign loans 44,935 46,620 46,620 – – – CMHC mortgages 171,701 211,484 24,474 20,400 109,598 57,012 Non-CMHC mortgages 16,268 18,862 1,292 1,293 16,277 – Finance lease obligations 133,910 227,664 13,897 13,921 41,367 158,479 Construction loans 16,092 32,730 1,098 5,001 3,801 22,830 Notes payable 14,107 15,130 5,247 5,413 4,470 – Accounts payable 36,167 36,167 36,167 – – –
1,292,063 1,521,326 684,440 152,262 423,875 260,749
The gross outflows presented above represent the contractual undiscounted cash flows.
MAnAgeMent of cRedIt RIsk
Credit risk is the risk that one party to a financial instrument will cause a financial loss for the REIT by failing to discharge its obligation. The nature and maximum exposure to credit risk as at December 31 was: Carrying Amount
2011 2010
Cash and short-term investments 80,018 267,759 Restricted cash (note 11) 16,848 10,095 Total receivables, net of allowance (1) (note 5) 245,784 230,091 Investments held for self-insured liabilities (note 8) 83,608 60,937 Notes, mortgages and amounts receivable (note 8) 48,010 47,782
474,268 616,664
(1) Includes non-current portion.

Notes to Consolidated Financial Statements
2011 Annual Report 125
cash and short-term Investments
The majority of our cash and cash equivalents are held with highly rated financial institutions in Canada and the United States.
Restricted cash
The restricted cash is cash held for collateral and regulatory requirements with no credit risks (note 11).
total Receivables, net of allowance
The maximum exposure to credit risk for accounts receivable at the reporting date is the carrying value of each class of receivable, denominated in the following currencies. The REIT does not hold any collateral as security.
2011 2010
Carrying amount Carrying amount
Canadian Canadian U.S. Dollar Dollar Total U.S. Dollar Dollar Total
Trade receivables 168,744 18,194 186,938 157,464 18,389 175,853 Retroactive rate receivables 33,475 1,899 35,374 26,347 5,074 31,421 Other receivables 15,821 7,651 23,472 14,161 8,656 22,817
218,040 27,744 245,784 197,972 32,119 230,091
Receivables from U.S. and Canadian government agencies, which are included in accounts receivable, notes, mortgages and amounts receivable, and Medicare and Medicaid settlement receivables, represented the only concentrated group of credit risks for the REIT. As at December 31, 2011, receivables from government agencies represented approximately 73% of the total receivables. Management does not believe that there is significant credit risk associated with these government agencies other than possible funding delays. Management continually monitors reports from trade associations or notes from provincial, state or federal agencies that announce possible delays that are rare to occur and usually associated with changes of fiscal intermediaries or changes in information technology or forms.
Receivables, other than those from government agencies, consist of receivables from various payors and do not represent any concentrated credit risks to the REIT. There is no significant exposure to any single party.
As of December 31, 2011, the U.S. operations (mainly EHSI) had trade receivables of $168.7 million (2010 – $157.5 million) which were fully performing and collectible in the amounts outlined above. EHSI continually monitors the collection of all trade receivables and assesses the collectability of accounts on an individual basis in addition to the aging of the balances by payor type. The majority of balances between 90 and 365 days pertain to residents awaiting confirmation of Medicaid eligibility or those involving deferred claims with Health Maintenance Organizations (HMOs); whereas the balances over 365 days primarily involve claims against private residents that were denied HMO or Medicaid benefits. In 2011, EHSI incurred a provision for receivable impairment of $15.6 million (2010 – $17.9 million).
As of December 31, 2011, retroactive rate receivables of $33.5 million (2010 – $26.3 million) primarily pertain to reimbursable bad debt claims under the Medicare program along with rate settlements involving cost-based state Medicaid programs with retrospective systems of reimbursement.
As of December 31, 2011, ECI had trade receivables of $18.2 million (2010 – $18.4 million) which were fully performing and collectible in the amounts outlined above. ECI continually monitors the collection of all trade receivables and assesses the collectability of accounts on an individual basis in addition to the aging of the balances by payor type. The majority of balances over 365 days involve amounts due from private individuals. In 2011, ECI incurred a provision for receivable impairment of $0.7 million (2010 – $0.6 million).

126 Extendicare Real Estate Investment Trust
Notes to Consolidated Financial Statements
The aging analysis of these trade receivables is as follows:
As at December 31 2011 2010
Current 110,554 113,279 Between 30 and 90 Days 59,441 45,505 Between 90 and 365 Days 26,828 26,428 Over 365 Days 6,790 8,437 Less: Provision for receivable impairment (16,675) (17,796)
Total 186,938 175,853
Movements on the REIT’s provision for receivable impairment are as follows:
2011 2010
At January 1 17,796 23,975 Increase in provision for receivable impairment 16,292 18,520 Receivables written off as uncollectible (17,745) (23,648)Other 332 (1,051)
At December 31 16,675 17,796
The increase in provision for receivable impairment has been included in operating expenses in net earnings. In general, amounts charged to the provision for impairment of trade receivables are written off when there is no expectation of recovering additional cash.
Investments for self-insured liabilities
The REIT’s investments held for self-insured liabilities include investments in corporate or government fixed rate bonds with ratings above a rating of AAA- along with U.S. treasuries. Cash held for self-insured liabilities are with high-quality financial institutions. The REIT limits the amount of exposure to any one institution.
notes, Mortgages and Amounts Receivable
Included in notes, mortgages and amounts receivable are $37.2 million (2010 – $40.0 million) of discounted amounts receivable due from government agencies. These represent amounts funded by the Ontario government for a portion of nursing home construction costs over a 20-year period. The REIT does not consider there to be any credit exposure for these amounts due from government agencies.
MAnAgeMent of cuRRency RIsk
Currency risk is the risk that the fair value or future cash flows of a financial instrument will fluctuate because of changes in foreign exchange rates.
The REIT finances and secures Canadian debt on only Canadian operations and assets, and similarly, finances and secures U.S. debt on only U.S. operations and assets. Therefore, there is no currency exposure in respect of the valuation of assets and associated debt. The REIT can raise capital to finance its U.S. operations through cross-border loans or an injection of capital. Intercompany advances to the U.S. operations for acquisitions or growth expenditures are subsequently repaid. Any cross-border transactions are subject to exchange fluctuations that may result in realized gains or losses as and when the balances are settled and upon the payment of interest on such loans, as well as any cross-border dividend or return of capital.
Our exposure to foreign currency risk as at December 31, 2011 and 2010 was as follows:
(in thousands of US$) 2011 2010
Assets Current assets 273,284 356,694 Property and equipment, goodwill and other intangible assets, and other assets 1,053,764 1,098,725 Liabilities Current liabilities 373,803 748,186 Long-term debt and other liabilities 706,502 423,365
Net asset exposure 246,743 283,868

Notes to Consolidated Financial Statements
2011 Annual Report 127
net earnings sensitivity Analysis
The majority of the REIT’s operations are conducted in the United States, which accounted for approximately 67% of its total revenue in 2011.
Every one cent strengthening of the Canadian dollar against the U.S. dollar would impact net earnings and OCI by the amounts shown below. This analysis assumes that all other variables, in particular interest rates and fair value of the FCFCs, remain constant.
Favourable (unfavourable) impact 2011 2010
Net earnings (2) (1)Other comprehensive income (2,467) (2,839)
cash flow sensitivity
All of the REIT’s distributions are denominated in Canadian dollars; therefore, to the extent these distributions are funded by our U.S. operations, the REIT is subject to currency risk. To limit the exposure of converting the REIT’s U.S. cash flow into Canadian dollars, we monitor the U.S. to Canadian dollar and, should the conditions be considered favourable, implement a foreign currency hedging strategy through the purchase of FCFCs.
The REIT maintains risk management control systems to monitor foreign currency cash flow risk attributable to its outstanding or forecasted debt obligations as well as its offsetting hedge positions. We do not enter into financial instruments for trading or speculative purposes.
MAnAgeMent of InteRest RAte RIsk
Interest rate risk is the risk that the fair value or future cash flows of a financial instrument will fluctuate because of changes in market interest rates.
The REIT assesses interest rate risk by continually identifying and monitoring changes in interest rates that may adversely impact expected future cash flows and by evaluating hedging opportunities. The REIT maintains risk management control systems to monitor interest rate risk attributable to its outstanding or forecasted debt obligations as well as its offsetting hedge positions.
In order to meet its monthly distributions, the REIT has limited the amount of debt that may be subject to changes in interest rates. As at December 31, 2011, 91.1% of our outstanding long-term debt was at fixed rates and $102.3 million of long-term debt was subject to interest rate fluctuations. We do not enter into financial instruments for trading or speculative purposes.
The interest rate profile of our interest-bearing financial instruments at December 31, 2011 and 2010 was as follows:
Carrying Amount
2011 2010
Fixed-rate instruments: Investments held for self-insured liabilities (1) 62,262 46,703 Less: Long-term debt (2)(3) 1,054,291 1,165,781
Net liability in fixed-rate instruments 992,029 1,119,078
Variable-rate instruments: Long-term debt (2)(3) 102,298 90,115
Total liability in variable-rate instruments 102,298 90,115
(1) Excludes variable-rate instruments.(2) Excludes financing costs.(3) Includes current portion.
fair value sensitivity Analysis for fixed-rate Instruments
We do not designate interest rate derivatives as hedging instruments under a fair-value hedge accounting model; therefore, changes in interest rates would not affect net earnings with respect to these fixed-rate instruments. As at December 31, 2011, there were no fixed-rate instruments designated as held for trading; therefore, changes in interest rates will not have any impact on net earnings for these instruments.

128 Extendicare Real Estate Investment Trust
Notes to Consolidated Financial Statements
fair value sensitivity Analysis for variable-rate Instruments
Long-term debt other than convertible debentures is classified as other financial liabilities, which are measured at amortized cost using the effective interest rate method of amortization; therefore, changes in interest rates would not affect OCI with respect to variable-rate debt.
cash flow sensitivity Analysis for variable-rate Instruments
A change of 100 basis points in interest rates would have increased or decreased net earnings by the amounts shown below. This analysis assumes that all other variables, in particular foreign currency rates, remain constant.
2011 2010
100bp 100bp 100bp 100bp Favourable (unfavourable) impact increase decrease increase decrease
Net earnings (193) 193 (623) 623
(b) Fair Values of Financial Instruments
Designated Other Total Loans and Available at fair financial carrying As at December 31, 2011 receivables for sale value liabilities amount Fair value
Financial assets: Cash and short-term investments 80,018 – – – 80,018 80,018 Invested assets (1) 650 – – – 650 650 Trade and other receivables (2) 243,029 – – – 243,029 241,889 Notes, mortgages and amounts receivable 50,765 – – – 50,765 57,090 Investments held for self-insured liabilities – 83,608 – – 83,608 83,608
374,462 83,608 – – 458,070 463,255
Financial liabilities: Accounts payable – – – 42,241 42,241 42,241 Long-term debt excluding convertible debentures (2) (3) – – – 942,280 942,280 985,451 Convertible debentures – – 214,309 – 214,309 214,309
– – 214,309 984,521 1,198,830 1,242,001
Designated Other Total Loans and Available at fair financial carrying As at December 31, 2010 receivables for sale value liabilities amount Fair value
Financial assets: Cash and short-term investments 267,759 – – – 267,759 267,759 Invested assets (1) 801 – – – 801 801 Trade and other receivables (2) 227,495 – – – 227,495 226,434 Notes, mortgages and amounts receivable 50,378 – – – 50,378 54,811 Investments held for self-insured liabilities – 60,937 – – 60,937 60,937
546,433 60,937 – – 607,370 610,742
Financial liabilities: Accounts payable – – – 36,167 36,167 36,167 Foreign currency forward contract liability – – 381 – 381 381 Long-term debt excluding convertible debentures (2) (3) – – – 1,042,156 1,042,156 1,072,059 Convertible debentures – – 213,740 – 213,740 213,740
– – 214,121 1,078,323 1,292,444 1,322,347
(1) Included in other current assets.(2) Includes current portion.(3) Excludes financing costs.

Notes to Consolidated Financial Statements
2011 Annual Report 129
basis for determining fair values
The following summarizes the significant methods and assumptions used in estimating the fair values of financial instruments reflected in the previous table.
Fair values for investments designated as held to maturity and available for sale are based on quoted market prices.
Items designated as loans and receivables include cash, accounts receivable as well as notes, mortgages and amounts receivable. Accounts receivable, including other long-term receivables, are recorded at amortized cost. The carrying values of accounts receivable approximate fair values due to their short-term maturities, with the exception of certain settlement receivables from third-party payors that are anticipated to be collected beyond one year. The fair values of these settlement receivables are estimated based on discounted cash flows at current borrowing rates. Notes, mortgages and amounts receivable primarily consist of notes and amounts receivable from government agencies, and other third-party notes. The fair values for these instruments are based on the amount of future cash flows associated with each instrument, discounted using current applicable rates for similar instruments of comparable maturity and credit quality.
The fair value of the FCFCs is based upon the valuation as provided by the financial institution that is the counterparty to the agreements.
The fair values for long-term debt are based on the amount of future cash flows associated with each instrument discounted using current applicable rates for similar instruments of comparable maturity and credit quality.
fair value hierarchy
We use a fair value hierarchy to categorize the type of valuation techniques from which fair values are derived. Our use of quoted market prices (Level 1), internal models using observable market information as inputs (Level 2) and internal models without observable market information as inputs (Level 3) for the following financial instruments recorded at fair value were as follows:
As at December 31, 2011 Level 1 Level 2 Level 3 Total
Available-for-sale securities 83,608 – – 83,608
Total assets 83,608 – – 83,608
Financial liabilities designated at fair value through profit or loss 214,309 – – 214,309
Total liabilities 214,309 – – 214,309
As at December 31, 2010 Level 1 Level 2 Level 3 Total
Available-for-sale securities 60,937 – – 60,937
Total assets 60,937 – – 60,937
Derivative liabilities – 381 – 381 Financial liabilities designated at fair value through profit or loss 213,740 – – 213,740
Total liabilities 213,740 381 – 214,121
24. capital ManagementThe REIT’s objective is to preserve a strong capital base so as to maintain investor, creditor and market confidence and to sustain future development of the business. We seek to balance the need for maintaining an attractive payout ratio with maintaining adequate capital to grow the business by acquisition or internal growth. There were no changes in the REIT’s approach to capital management during the year.
The REIT must access the capital markets periodically to fund acquisitions, growth capital expenditures and certain other expenditures. We monitor the capital markets to assess the conditions for raising capital and the cost of such capital relative to the return on any acquisitions or growth capital projects. Funds raised in the capital markets that are not deployed in acquisitions or growth projects are held in high-quality investments with surplus cash held in secure institutions. We manage our cash position and prepare monthly cash flow projections over the remaining and future fiscal period, and we continuously monitor the level, nature and maturity dates of debt and level of leverage and interest coverage ratios to ensure our compliance with debt covenants. We provide information to the Board of Trustees on a regular basis in order to carefully evaluate any significant cash flow decisions.

130 Extendicare Real Estate Investment Trust
Notes to Consolidated Financial Statements
Economic Environment
Beginning in the latter part of 2008, the economy and stock markets suffered a significant downturn as a result of the worldwide credit and liquidity crisis that impacted market values of securities, values of commodities, interest rates and the foreign exchange mark

132 Extendicare Real Estate Investment Trust
Notes to Consolidated Financial Statements
REIT Unit Redemption Rights
REIT Units are redeemable at any time on demand by the holders. Upon receipt by the REIT of a notice to redeem REIT Units, all rights to and under the REIT Units tendered for redemption shall be surrendered and the holder shall be entitled to receive a price per REIT Unit in cash equal to the lesser of:
a) 95% of the “market price” of the REIT Units on the principal stock exchange or market on which the REIT Units are quoted for trading during the 10 consecutive trading days ending on the trading day immediately prior to the redemption date; and
b) 100% of the “closing market price” of the REIT Units on the principal stock exchange or market on which the REIT Units are quoted for trading on the redemption date.
The aggregate cash redemption price payable by the REIT in respect of all REIT Units surrendered for redemption during any calendar month shall be satisfied by a cash payment no later than the last day of the month following the month in which the REIT Units were tendered for redemption, and shall not exceed $100,000, unless waived at the discretion of the Trustees. If the unitholder is not entitled to receive their redemption price in cash upon redemption as a result of the foregoing and other limitations, then each REIT Unit tendered for redemption will be redeemed by way of a distribution in specie of securities held by the REIT, subject to any applicable regulatory approvals.
Financial Covenants
EHSI is subject to external financial covenant requirements pursuant to the CMBS financings, PrivateBank Loans and the EHSI Credit Facility on the level of debt to earnings and cash flow of its operations; and ECI is also subject to external financial covenant requirements for its construction loans on the level of debt to cash flow of its operations (note 11). Management and the Board of Trustees monitor these covenant ratios on a monthly and quarterly basis, respectively. The REIT is in compliance with all these covenants as of December 31, 2011.
25. Related party transactions (a) Transactions with Key Management Personnel
In 2008, Tim Lukenda, the former President of Tendercare, was appointed President and Chief Executive Officer of Extendicare REIT. Prior to its acquisition by EHSI, Mr. Lukenda owned an approximate 4.6% direct and indirect interest in Tendercare and received, directly or indirectly, on completion of the acquisition of Tendercare an equivalent percentage of the consideration paid by EHSI. In October 2007, EHSI completed the $225.0 million acquisition (US$238.2 million) of Tendercare, which was comprised of 29 skilled nursing centers and one inpatient rehabilitation hospital in Michigan, for a total of 3,301 operational beds. As part of Mr. Lukenda’s terms of employment, the employment contract provides a mechanism and process that effectively removes Mr. Lukenda from the decision-making process in situations where a conflict of interest may arise on any matter between Extendicare REIT and his previous employer, or with respect to any financial interest that Mr. Lukenda or his family have with Extendicare REIT and its subsidiaries. As part of the acquisition of Tendercare, in addition to normal representative and warranty provisions, EHSI must agree on any adjustments to the final purchase price as described above, before making any payments to Mr. Lukenda or his family. EHSI and ECI also provide certain management services to two long-term care centers and operate, under lease arrangements, two other long-term care centers that are owned or partially owned by members of Mr. Lukenda’s immediate family.
In connection with the purchase of Tendercare, the acquired working capital is subject to annual adjustments that will occur 90 days after the anniversary date of the Tendercare acquisition over a four-year period until January 2012. The first anniversary adjustment increased net working capital by US$1.7 million and was paid by EHSI in April 2009 with no impact on the consolidated net earnings. The second and third anniversary adjustments increased net working capital by US$0.2 million and US$0.3 million, respectively, for a total net liability of US$0.5 million as of December 31st of 2011 and 2010. EHSI anticipates resolution of the fourth anniversary adjustment in the second quarter of 2012. In March 2010, the former shareholders of Tendercare (the “Tendercare Sellers Committee”) filed a notice of disagreement with respect to a working capital adjustment for accrued vacation pay of US$3.1 million sought by EHSI, stating that it was not a permitted adjustment. In April 2010, EHSI submitted a written response stating that its position is in accordance with the terms of the agreement. In February 2012, an independent accounting firm selected jointly by EHSI and the Tendercare Sellers Committee concluded in favour of the Tendercare Sellers Committee stating that Tendercare’s former treatment of vacation pay was in accordance with the terms of the agreement. There was no material financial impact in respect of this arbitration decision in the 2011 financial statements.

Notes to Consolidated Financial Statements
2011 Annual Report 133
In addition, in connection with the acquisition of LTC Professional in 2008, Tendercare’s affiliated insurance company, consideration for the acquisition is to be adjusted annually based upon the actuarial liabilities determined at December 31st of each year through to 2012, with an annual option to extend to 2015. In March of 2011, 2010 and 2009, ECI made annual settlements of US$1.3 million, US$1.5 million and US$2.2 million, respectively.
(b) Compensation of Key Management Personnel
The remuneration of key management personnel and trustees of the REIT during the years ended December 31, 2011 and 2010 was as follows:
2011 2010
Short-term benefits 4,266 4,112 Post employment benefits 203 216Unit appreciation rights 222 330
4,691 4,658
26. segmented InformationThe REIT has two reportable operating segments: United States operations and Canadian operations. These operations are managed independently of each other because of their geographic areas and regulatory environments. Each operation retains its own management team and is responsible for compiling its own financial information.
Through its subsidiaries, the REIT operates long-term care centers in the United States and Canada. Also offered in the United States are medical specialty services, such as post-acute care and rehabilitative therapy services, as well as health technology services, while home health care services are provided in Canada.
Intersegment adjustments in the following tables reflect the reversal of intercompany amounts that are eliminated prior to the preparation of the REIT’s consolidated financial statements.
United States Canada Eliminations Total
Total Assets As at December 31, 2011 1,349,608 481,272 (176) 1,830,704 As at December 31, 2010 1,447,560 547,194 (120) 1,994,634 As at January 1, 2010 1,548,538 503,051 (66,703) 1,984,886 Total Liability As at December 31, 2011 1,098,640 683,921 (176) 1,782,385 As at December 31, 2010 1,165,225 716,535 (120) 1,881,640 As at January 1, 2010 1,222,907 758,834 (66,703) 1,915,038 Total Capital Expenditures Year ended December 31, 2011 31,973 32,530 – 64,503 Year ended December 31, 2010 34,296 35,657 – 69,953

134 Extendicare Real Estate Investment Trust
Notes to Consolidated Financial Statements
December 31, 2011
United States Canada Eliminations Total
CONTINUING OPERATIONS Revenue Nursing and assisted living centers 1,355,289 525,831 – 1,881,120 Home health care – 165,030 – 165,030 Health technology services 19,120 – – 19,120 Outpatient therapy 13,750 – – 13,750 Management, consulting and other services 7,571 7,491 – 15,062
Total revenue 1,395,730 698,352 – 2,094,082
Operating expenses 1,206,881 606,911 – 1,813,792 Administrative costs 47,941 21,214 – 69,155 Lease costs 6,546 4,453 – 10,999
Total expenses 1,261,368 632,578 – 1,893,946
Earnings before depreciation, amortization, loss from asset impairment, disposals and other items 134,362 65,774 – 200,136 Depreciation and amortization 58,242 18,335 – 76,577 Loss from asset impairment, disposals and other items 56,195 6,301 – 62,496
Results from operating activities 19,925 41,138 – 61,063
Interest expense 52,539 37,226 (131) 89,634 Accretion of decommissioning provisions 1,234 372 – 1,606 Other accretion 423 – – 423 Distributions on Exchangeable LP Units – 2,179 – 2,179 Fair value adjustments – – – –
Finance costs 54,196 39,777 (131) 93,842
Interest revenue 388 4,065 (131) 4,322 Fair value adjustments – 6,023 – 6,023 Gains on foreign exchange and financial instruments 250 303 – 553
Finance income 638 10,391 (131) 10,898
Net finance costs 53,558 29,386 – 82,944
Earnings (loss) before income taxes (33,633) 11,752 – (21,881)
Income tax expense (recovery) Current 23,280 5,000 – 28,280 Deferred (12,499) (2,339) – (14,838)
Total income tax expense 10,781 2,661 – 13,442
Earnings (loss) from continuing operations (44,414) 9,091 – (35,323)
DISCONTINUED OPERATIONS Earnings from discontinued operations, net of income taxes 4,927 – – 4,927
Net earnings (loss) (39,487) 9,091 – (30,396)

Notes to Consolidated Financial Statements
2011 Annual Report 135
December 31, 2010
United States Canada Eliminations Total
CONTINUING OPERATIONS Revenue Nursing and assisted living centers 1,397,452 495,610 – 1,893,062 Home health care – 157,177 – 157,177 Health technology services 17,205 – – 17,205 Outpatient therapy 12,603 – – 12,603 Management, consulting and other services 7,245 10,124 – 17,369
Total revenue 1,434,505 662,911 – 2,097,416
Operating expenses 1,201,006 570,162 – 1,771,168 Administrative costs 51,408 21,222 – 72,630 Lease costs 7,204 4,344 – 11,548
Total expenses 1,259,618 595,728 – 1,855,346
Earnings before depreciation, amortization, loss (gain) from asset impairment, disposals and other items 174,887 67,183 – 242,070 Depreciation and amortization 58,446 15,323 – 73,769 Loss (gain) from asset impairment, disposals and other items 2,972 (24) – 2,948
Results from operating activities 113,469 51,884 – 165,353
Interest expense 54,177 36,724 (1,934) 88,967 Accretion of decommissioning provisions 1,236 378 – 1,614 Other accretion 514 – – 514 Distributions on Exchangeable LP Units – 2,702 – 2,702 Fair value adjustments – 4,649 – 4,649
Finance costs 55,927 44,453 (1,934) 98,446
Interest revenue 2,441 3,737 (1,934) 4,244 Fair value adjustments – – – – Gains on foreign exchange and financial instruments 892 2,388 – 3,280
Finance income 3,333 6,125 (1,934) 7,524
Net finance costs 52,594 38,328 – 90,922
Earnings before income taxes 60,875 13,556 – 74,431
Income tax expense (recovery) Current 25,898 8,422 – 34,320 Deferred 4,102 (895) – 3,207
Total income tax expense 30,000 7,527 – 37,527
Earnings from continuing operations 30,875 6,029 – 36,904
DISCONTINUED OPERATIONS Earnings from discontinued operations, net of income taxes 4,925 – – 4,925
Net earnings 35,800 6,029 – 41,829

136 Extendicare Real Estate Investment Trust
Notes to Consolidated Financial Statements
27. explanation of transition to IfRsThese are the REIT’s first consolidated financial statements prepared in accordance with IFRS 1. The accounting policies set out in note 3 have been applied in preparing the financial statements for the period ended December 31, 2011, the comparative period ended December 31, 2010 and in the preparation of the opening IFRS statement of financial position at the Transition Date.
IFRS 1 requires first-time adopters to retrospectively apply all effective IFRSs for all periods presented. However, it also provides for certain optional exemptions and certain mandatory exceptions for first-time IFRS adopters. Below are the applicable IFRS 1 exemptions and exceptions applied in the conversion from previous Canadian GAAP to IFRS.
IFRS 1 Elective Exemptions
i. Fair value as deemed costs
An IFRS 1 exemption is available to revalue selective land and buildings at fair value upon transition, and use that fair value as its deemed cost at that date. The exemption is applied on an asset-by-asset basis. We elected to apply the exemption to selected nursing centers upon transition.
ii. Employee benefits
An IFRS 1 exemption is available to reset the cumulative actuarial gain and loss balance to zero upon transition. We elected to apply this exemption on the Transition Date. Furthermore, we have elected to disclose the present value of the defined benefit obligation, fair value of the plan assets, surplus or deficit in the plans, and the experience adjustments arising on the plan assets or liabilities, for each accounting period prospectively from the Transition Date.
iii. Cumulative translation differences
An IFRS 1 exemption is available to reset the cumulative translation adjustment (CTA) balance to zero on the Transition Date. Without the exemption, IFRS requires the retrospective restatement of CTA in accordance with IAS 21 “The Effect of Changes in Foreign Exchange Rates”. We elected to apply the exemption to reset the CTA balance to zero on transition.
iv. Borrowing costs
Borrowing costs are required to be capitalized to the cost of qualifying assets based on specific guidance. There was no specific guidance under previous Canadian GAAP; however, we capitalized borrowing costs using a consistent formula. An IFRS 1 exemption is available which provides relief to a first-time adopter from applying the standard, IAS 23 “Borrowing Costs”, retrospectively. We elected to apply the IFRS 1 exemption; therefore, borrowing costs are only capitalized based on specific guidance post IFRS transition.
v. Business combinations
An IFRS 1 exemption is available whereby previously completed business combinations (prior to the Transition Date) are not required to be retrospectively restated in accordance with IFRS 3 “Business Combinations”, subject to some exceptions. We elected to apply this exemption and have not restated any of our past business combinations prior to the Transition Date. In addition, and as a condition under IFRS 1 for applying this exemption, goodwill relating to business combinations that occurred prior to the Transition Date is required to be tested for impairment.
vi. Decommissioning liabilities included in the cost of property, plant and equipment
IFRS provides specific guidance under IFRIC 1 “Changes in Existing Decommissioning, Restoration and Similar Liabilities” to account for changes related to decommissioning provisions. Criteria under previous Canadian GAAP are different. An IFRS 1 exemption is available which provides a simplified method for recalculating decommissioning provisions on the Transition Date. We elected to apply this exemption to measure our decommissioning provision as at the Transition Date in accordance with IAS 37 “Provisions, Contingent Liabilities and Contingent Assets”.
IFRS Mandatory Exemption
estimates
IFRS requires estimates made for the same date in accordance with previous GAAP to be consistent with those under IFRS. Hindsight cannot be used to create or revise estimates upon transition. The estimates made by the REIT under previous Canadian GAAP were not revised for the application of IFRS except where necessary to reflect revised accounting policies.
Reconciliations of Previous Canadian GAAP to IFRS
In preparing its opening IFRS statement of financial position, the REIT has adjusted amounts reported in its financial statements prepared in accordance with previous Canadian GAAP. An explanation of how the transition from previous Canadian GAAP to IFRS has affected the REIT’s financial position, financial performance and cash flows is detailed in the following tables with accompanying notes.

Notes to Consolidated Financial Statements
2011 Annual Report 137
The following is a reconciliation of the REIT’s total equity reported in accordance with previous Canadian GAAP to its total equity in accordance with IFRS as at January 1, 2010.
January 1, 2010
Previous Effect of Canadian IFRS IFRS transition Notes GAAP reclass adjustments to IFRS IFRS
AssetsCurrent assets Cash and short-term investments 134,012 – – – 134,012 Restricted cash 22,361 – – – 22,361 Accounts receivable 213,477 – – – 213,477 Income taxes recoverable 29,314 – – – 29,314 Deferred tax assets (e) 24,900 (24,900) – (24,900) – Other current assets (f) 22,187 33,936 – 33,936 56,123
Total current assets 446,251 9,036 – 9,036 455,287
Non-current assets Property and equipment (i) 863,430 – 380,440 380,440 1,243,870 Goodwill and other intangible assets (l) 191,514 – (75,834) (75,834) 115,680 Other assets (f), (i) 166,870 (33,936) 715 (33,221) 133,649 Deferred tax assets (e) 11,500 24,900 – 24,900 36,400
Total non-current assets 1,233,314 (9,036) 305,321 296,285 1,529,599
Total Assets 1,679,565 – 305,321 305,321 1,984,886
Liabilities and EquityCurrent liabilities Accounts payable and accrued liabilities (h) 283,632 146 – 146 283,778 Long-term debt (j) 28,538 – 1,588 1,588 30,126 Provisions 11,321 – – – 11,321
Total current liabilities 323,491 146 1,588 1,734 325,225
Non-current liabilities Long-term debt (j) 1,205,494 – 13,836 13,836 1,219,330 Provisions (d), (n) 32,562 30,417 (1,236) 29,181 61,743 Other long-term liabilities (d), (h), (k) 67,555 (26,045) 31,320 5,275 72,830 Deferred tax liabilities (h), (i), (j), (o) 91,366 (1,205) 145,749 144,544 235,910
Total non-current liabilities 1,396,977 3,167 189,669 192,836 1,589,813
Total liabilities 1,720,468 3,313 191,257 194,570 1,915,038
Unit capital (j), (k) 355,469 – (23,400) (23,400) 332,069 Contributed surplus 81 – – – 81 Retained earnings – IFRS transitional adjustment (g), (h), (i), (j), (k), (l), (o), (n) – (4,192) 137,464 133,272 133,272 Accumulated deficit (395,429) – – – (395,429)Accumulated other comprehensive loss (g) (1,024) 879 – 879 (145)
Unitholders’ equity (deficiency) (40,903) (3,313) 114,064 110,751 69,848
Total Liabilities and Equity 1,679,565 – 305,321 305,321 1,984,886

138 Extendicare Real Estate Investment Trust
Notes to Consolidated Financial Statements
The following is a reconciliation of the REIT’s total equity reported in accordance with previous Canadian GAAP to its total equity in accordance with IFRS as at December 31, 2010.
December 31, 2010
Previous Effect of Canadian IFRS IFRS transition Notes GAAP reclass adjustments to IFRS IFRS
AssetsCurrent assets Cash and short-term investments 267,759 – – – 267,759 Restricted cash 10,095 – – – 10,095 Accounts receivable 212,610 – – – 212,610 Income taxes recoverable 3,182 – – – 3,182 Deferred tax assets (e) 19,190 (19,190) – (19,190) – Other current assets (f) 19,843 3,827 – 3,827 23,670
Total current assets 532,679 (15,363) – (15,363) 517,316
Non-current assets Property and equipment (i) 853,760 (38) 352,934 352,896 1,206,656 Goodwill and other intangible assets (l) 182,024 12 (71,764) (71,752) 110,272 Other assets (f), (i) 129,547 (3,801) 454 (3,347) 126,200 Deferred tax assets (e) 15,000 19,190 – 19,190 34,190
Total non-current assets 1,180,331 15,363 281,624 296,987 1,477,318
Total Assets 1,713,010 – 281,624 281,624 1,994,634
Liabilities and EquityCurrent liabilities Accounts payable and accrued liabilities (h) 266,133 147 – 147 266,280 Long-term debt (j) 569,558 – 1,610 1,610 571,168 Provisions 16,013 – – – 16,013 Exchangeable LP units (k) – – 29,264 29,264 29,264
Total current liabilities 851,704 147 30,874 31,021 882,725
Non-current liabilities Long-term debt (j) 653,122 – 16,906 16,906 670,028 Provisions (d), (n) 31,382 29,849 (848) 29,001 60,383 Other long-term liabilities (d), (h), (m) 66,633 (22,727) 249 (22,478) 44,155 Deferred tax liabilities (h), (i), (j), (o) 91,482 (1,939) 134,806 132,867 224,349
Total non-current liabilities 842,619 5,183 151,113 156,296 998,915
Total liabilities 1,694,323 5,330 181,987 187,317 1,881,640
Unit capital (j), (k) 444,136 – (22,923) (22,923) 421,213 Contributed surplus 81 – – – 81 Retained earnings – IFRS transitional adjustment (g), (h), (i), (j), (k), (l), (o), (n) – (4,192) 137,464 133,272 133,272 Accumulated deficit (h), (i), (j), (k), (m), (n), (o) (413,641) 180 (7,336) (7,156) (420,797)Accumulated other comprehensive loss (g), (h), (i), (l), (m), (n) (11,889) (1,318) (7,568) (8,886) (20,775)
Unitholders’ equity 18,687 (5,330) 99,637 94,307 112,994
Total Liabilities and Equity 1,713,010 – 281,624 281,624 1,994,634

Notes to Consolidated Financial Statements
2011 Annual Report 139
The following is a reconciliation of the REIT’s total comprehensive income reported in accordance with the previous Canadian GAAP to its total comprehensive income in accordance with IFRS for the year ended December 31, 2010.
Twelve months ended December 31, 2010
Previous Effect of Canadian IFRS IFRS transition Notes GAAP reclass adjustments to IFRS IFRS
CONTINUING OPERATIONS Total revenue (a) 2,056,557 40,859 – 40,859 2,097,416
Operating expenses (a), (n) 1,732,518 38,830 (180) 38,650 1,771,168 Administrative costs (h), (m) 72,624 (246) 252 6 72,630 Lease costs (a) 10,964 584 – 584 11,548
Total expenses 1,816,106 39,168 72 39,240 1,855,346
Earnings before depreciation, amortization, loss from asset impairment, disposals and other items 240,451 1,691 (72) 1,619 242,070 Depreciation and amortization (a), (i) 63,873 – 9,896 9,896 73,769 Loss from asset impairment, disposals and other items (b), (l) – 4,248 (1,300) 2,948 2,948
Results from operating activities 176,578 (2,557) (8,668) (11,225) 165,353
Interest expense (j) 92,102 – (3,135) (3,135) 88,967 Accretion of decommissioning provision (a), (c) 1,572 42 – 42 1,614 Other accretion (n) – – 514 514 514 Loss from asset impairment, disposals and other items (a), (b) 1,154 (1,154) – (1,154) – Distributions on Exchangeable LP Units (k) – – 2,702 2,702 2,702 Fair value adjustments (j), (k) – – 4,649 4,649 4,649
Finance costs 94,828 (1,112) 4,730 3,618 98,446
Interest revenue (a) 4,235 9 – 9 4,244 Gains on foreign exchange and financial instruments (c) 3,280 – – – 3,280
Finance income 7,515 9 – 9 7,524
Net finance costs 87,313 (1,121) 4,730 3,609 90,922
Earnings before income taxes 89,265 (1,436) (13,398) (14,834) 74,431
Income tax expense Current (a) 28,624 5,696 – 5,696 34,320 Deferred (a), (h), (i), (j), (o) 12,756 (6,189) (3,360) (9,549) 3,207
Total income tax expense 41,380 (493) (3,360) (3,853) 37,527
Earnings from continuing operations 47,885 (943) (10,038) (10,981) 36,904
DISCONTINUED OPERATIONS Earnings from discontinued operations, net of income taxes (a) 3,802 1,123 – 1,123 4,925
Net earnings 51,687 180 (10,038) (9,858) 41,829
Other comprehensive loss, net of income taxes Unrealized gain on available-for-sale securities 1,062 – – – 1,062 Reclassification of realized gain on available-for-sale securities to earnings (488) – – – (488)Defined benefit plan actuarial loss, net of tax (h) – (2,197) – (2,197) (2,197)Net change in foreign currency translation adjustment (i), (l), (m), (n) (11,439) – (7,568) (7,568) (19,007)
Other comprehensive loss, net of tax (10,865) (2,197) (7,568) (9,765) (20,630)
Total comprehensive income 40,822 (2,017) (17,606) (19,623) 21,199
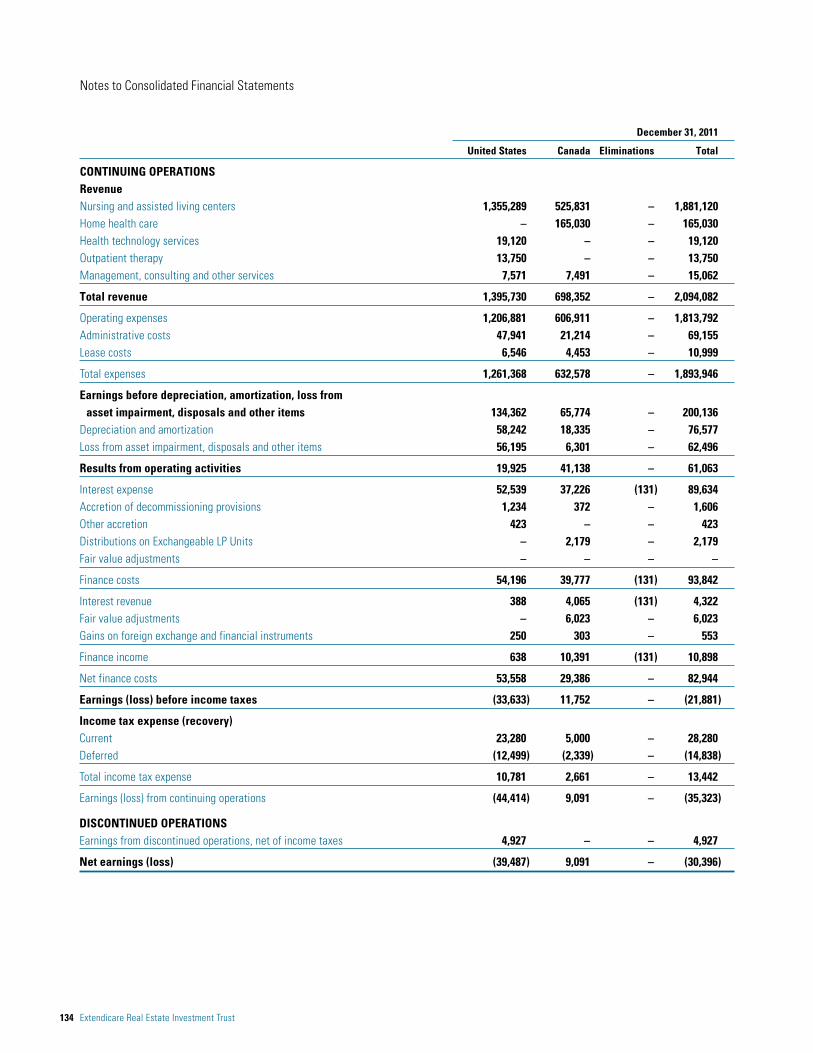
140 Extendicare Real Estate Investment Trust
Notes to Consolidated Financial Statements
Material adjustments to the statement of cash flows for 2010:
As a result of the transition to IFRS, certain items on the statement of cash flows have been impacted as follows:
• distributions to Exchangeable LP unitholders previously recognized in financing activities as “distributions paid” are now recognized as part of “net finance costs” on the statement of earnings which are included in operating activities;
• interest paid and income taxes paid have been moved into the body of the statement of cash flows, whereas they were previously disclosed as supplementary information; and
• borrowing costs capitalized in relation to qualifying assets are presented as interest paid in operating activities.
There are no other material differences between the statement of cash flows presented under IFRS and the statement of cash flows presented under the previous Canadian GAAP.
Notes to the reconciliations of previous Canadian GAAP to IFRS
IfRs ReclAssIfIcAtIons
(a) discontinued operations
Requirements under IFRS:
The definition of discontinued operations under IFRS is narrower compared to that under the previous Canadian GAAP. We defined discontinued operations to be at the individual nursing center level under previous Canadian GAAP. Under IFRS, discontinued operations are limited to a component of the entity that has been disposed of, or is classified as held for sale, and represents a separate major line of business or geographical area of operations. Consequently, results presented as discontinued operations during 2010 were reclassified as continuing operations. The discontinued operations currently presented for 2010 were identified in 2011 under the IFRS criteria.
(b) loss from Asset Impairment, disposals and other Items
Requirements under IFRS:
Under previous Canadian GAAP, items that were not expected to occur regularly during normal operations were separately disclosed outside of operations. These include asset impairment, disposals and other items of a similar nature. Under IFRS, impairment of non-financial assets and other similar items are considered to be part of operating activities.
(c) net finance costs
Requirements under IFRS:
Under previous Canadian GAAP, the accretion of the decommissioning provision (“accretion of asset retirement obligations” under previous Canadian GAAP), interest revenue and expense, as well as the “loss (gain) on foreign exchange and financial instruments” were separately disclosed on the statement of earnings. Under IFRS, all of these items are considered to be part of net finance costs. Also included in net finance costs are distributions on Exchangeable LP Units and fair value adjustments; neither of these items existed under previous Canadian GAAP.
(d) provisions
Requirements under IFRS:
IFRS requires separate disclosure of provisions on the face of the statement of financial position. This was not required under previous Canadian GAAP; therefore, all provisions were reclassified from other long-term liabilities upon transition. These provisions include the accrual for self-insured liabilities, decommissioning provision and the liabilities assumed from Crown Life.
(e) deferred Income tax Assets
Requirements under IFRS:
IFRS does not consider deferred income tax assets as a current item. As a result, it was reclassified from current to non-current under IFRS.
(f) Assets held for sale
Requirements under IFRS:
IFRS does not consider “assets held for sale” as a non-current item. As a result, it was reclassified from non-current to current under IFRS.

Notes to Consolidated Financial Statements
2011 Annual Report 141
(g) cumulative translation Adjustment
Upon transition:
As stated under the “IFRS 1 Elective Exemptions” section, we elected to apply the exemption to deem all CTA that arose prior to the Transition Date in respect of all foreign operations to be nil upon transition.
Reconciliation:
The impact arising from the change is summarized as follows:
December 31, January 1, 2010 2010
Consolidated statement of financial positionIncrease in AOCI: CTA as of January 1, 2010 879 879
Decrease in retained earnings 879 879
(h) employee benefits
Upon transition:
As stated under the “IFRS 1 Elective Exemptions” section, we elected to recognize all cumulative actuarial gains and losses that existed at the Transition Date in retained earnings.
Policy choice under IFRS:
Under previous Canadian GAAP, actuarial gains and losses that arose in calculating the present value of the defined benefit obligation and the fair value of plan assets are recognized on a systematic and consistent basis, subject to a minimum required amortization based on a “corridor” approach. The “corridor” was 10% of the greater of the accrued benefit obligation at the beginning of the year and the fair value of plan assets at the beginning of the year. This excess of 10% was amortized as a component of pension expense on a straight-line basis over the expected average service life of active participants. Actuarial gains and losses below the 10% corridor were deferred.
Under IFRS, actuarial experience gains or losses can be either recognized immediately in OCI or recognized in net earnings using either the corridor method or an alternative method that would result in accelerated recognition. We elected to recognize all actuarial experience gains or losses in OCI at the end of each period.
As a result, pension expense has been adjusted to remove the amortization of actuarial gains and losses, and the pension obligation as well as OCI have also been revised accordingly.
Requirements under IFRS:
Under previous Canadian GAAP, the measurement date of the defined benefit obligation and plan assets can be a date up to three months prior to the date of the financial statements, provided the entity adopted this practice consistently from year to year. We measured our accrued benefit obligations and the fair value of plan assets for accounting purposes at September 30th of each year. Actuarial valuations of the defined benefit pension plan were completed every three years.
IFRS requires that the present value of the defined benefit obligation and the fair value of plan assets be measured with sufficient regularity such that the amounts recognized in the financial statements do not differ materially from the amounts that would be determined at the balance sheet date. As a result, we remeasured our defined benefit obligations and plan assets as at January 1, 2010, and the measurement date has been changed to December 31st of each year. Consequently, the unamortized actuarial gains and losses recognized in net earnings under previous Canadian GAAP were reversed, and all actuarial gains and losses arising in periods subsequent to the Transition Date were recognized in OCI. Actuarial valuations of the defined benefit pension plan will continue to be completed every three years, with the next one to be conducted effective October 1, 2012.

142 Extendicare Real Estate Investment Trust
Notes to Consolidated Financial Statements
Reconciliation:
The impact arising from the change is summarized as follows:
Twelve months ended December 31, 2010
Consolidated statement of earnings (loss) Decrease in administrative costs: Pension expense 246
Increase in income before tax 246
December 31, January 1, 2010 2010
Consolidated statement of financial position Increase in liabilities: Pension obligations – current 147 146 Pension obligations – non-current 7,122 4,372 Decrease in AOCI: Actuarial losses (2,197) – Related tax effect (1,939) (1,205)
Decrease in retained earnings 3,133 3,313
IfRs AdjustMents
(i) property and equipment
Upon transition:
As stated under the “IFRS 1 Elective Exemptions” section, we elected to apply the exemption to revalue the land and building of selected nursing centers at fair value upon transition.
As of the Transition date, the REIT determined the individual fair value for each of its centers. Based upon this detailed review, certain centers were restated to reflect their fair value as of the Transition date. All nursing centers were considered for revaluation, with the exception of nursing centers where we expect their economic life to be limited or centers where we do not expect significant improvements in future cash flows. Our revaluation analysis was conducted internally using valuation methodologies commonly applied in the North American long-term care industry. A capitalized cash flow approach using current market assumptions for capitalization rates was used to determine the total real estate and business value of each nursing center. We then applied a lease coverage ratio to remove the value associated with business operations and goodwill in order to determine the fair value of the real estate component of each nursing center. In conjunction with the revaluation, IFRS requires that an impairment test be performed at the CGU level upon transition; as a result, certain assets were impaired (see further details under “impairment” under note 27(l) below). The carrying value of property and equipment net of impairment was increased by $380 million as at the Transition Date; consequently, more depreciation was recorded subsequent to the Transition Date based on the higher net deemed costs of the assets.
Below is a summary of the assumptions on capitalization rates and lease coverage ratios used in the determination of fair value:
Canada United States
Capitalization rates: Skilled nursing centers 9% 13% Assisted living n/a 9%Lease coverage: Skilled nursing centers 1.6 1.6 Assisted living n/a 1.4
For the Ontario “C” beds and certain other centers in Canada, an 11.5% discount rate was used for impairment testing purposes.

Notes to Consolidated Financial Statements
2011 Annual Report 143
Policy choice under IFRS:
Measurement of the assets subsequent to the Transition Date can be based on either the revaluation model (i.e. fair value model) or the cost model. We have elected to continue using the cost model, similar to the previous Canadian GAAP.
Reconciliation:
The impact arising from the change is summarized as follows:
Twelve months ended December 31, 2010
Consolidated statement of earnings (loss) Increase in depreciation expense 9,896 Decrease in loss from asset impairment, disposals and other items (1,300)
Decrease in income before tax 8,596
December 31, January 1, 2010 2010
Consolidated statement of financial position Increase in property and equipment 352,934 380,440 Increase in other assets 454 715 Increase in AOCI – translation adjustment 11,587 – Related tax effect (137,337) (148,306)
Increase in retained earnings 227,638 232,849
(j) convertible debentures
Requirements under IFRS:
Under previous Canadian GAAP, our convertible debentures are bifurcated with the debt host contract presented as a liability and the single compound embedded derivative as equity on the consolidated statement of financial position. Under IFRS, both of these items are presented as a financial liability. As a result, the equity portion of debentures that was previously included in unit capital was reclassified to long-term debt.
Policy choice under IFRS:
In terms of measurement and valuation, we have elected to designate the convertible debentures as a financial liability at FVTPL. Consequently, any unamortized financing costs of the convertible debentures as at the Transition Date were recognized in retained earnings, and the convertible debentures are remeasured at fair value at each reporting date.
Reconciliation:
The impact arising from the change is summarized as follows:
Twelve months ended December 31, 2010
Consolidated statement of earnings (loss) Increase (decrease) in net finance costs: Accretion of equity portion of convertible debentures (1,547) Amortization of financing costs (1,588) Fair value adjustment 6,228
Decrease in income before tax 3,093

144 Extendicare Real Estate Investment Trust
Notes to Consolidated Financial Statements
December 31, January 1, 2010 2010
Consolidated statement of financial position Increase in liability: Convertible debentures – current 1,610 1,588 Convertible debentures – non-current 16,906 13,836Decrease in unit capital: Equity portion of convertible debentures (9,964) (9,964)Related tax effect (2,166) (2,111)
Decrease in retained earnings 6,386 3,349
(k) exchangeable lp units
Requirements under IFRS:
Previous Canadian GAAP provided an exception which enabled us to present the Exchangeable LP Units as equity. Under IFRS, no such relief is extended. As a result, these units were reclassified from equity to liability. In addition, distributions paid to owners of the Exchangeable LP Units were reclassified as part of finance costs.
Policy choice under IFRS:
We have elected to designate the Exchangeable LP Units as a financial liability at FVTPL. Therefore, these units were remeasured at fair value at each reporting date.
Reconciliation:
The impact arising from the change is summarized as follows:
Twelve months ended December 31, 2010
Consolidated statement of earnings (loss) Increase (decrease) in net finance costs: Distributions on Exchangeable LP Units 2,702 Fair value adjustment (1,579)
Decrease in income before tax 1,123
December 31, January 1, 2010 2010
Consolidated statement of financial position Increase in liability 29,264 31,320 Decrease in unit capital (12,959) (13,436)
Decrease in retained earnings 16,305 17,884
(l) Impairment
Upon transition:
In accordance with IFRS, it is required to assess goodwill for impairment upon transition.
Requirements under IFRS:
Under previous Canadian GAAP, assets were tested for impairment using a two-step approach. The carrying value of the assets was first compared to the recoverable amount, defined to be the undiscounted cash flows on the assets; if this first test indicated impairment, impairment loss was then calculated to be the excess of carrying value over the discounted net future cash flows. We assessed goodwill for impairment at our segment level.

Notes to Consolidated Financial Statements
2011 Annual Report 145
Under IFRS, impairment testing is to be performed at the CGU level, which we have identified to be the individual nursing centers. IFRS requires a one-step approach for identifying and measuring impairment, whereby goodwill and corporate assets are allocated to specific CGUs for the purpose of impairment testing. An impairment loss is calculated to be the excess of the carrying value over the recoverable amount, defined to be the greater of fair value less costs to sell and value in use, which is the discounted net future cash flows.
As a result of the lower impairment threshold and the difference in the definition of recoverable amount, we recorded impairment on goodwill (refer to note 3(j) ).
Previously recorded impairment losses (except impairment losses related to goodwill) must be reversed under certain conditions.
Reconciliation:
The impact arising from the change is summarized as follows:
December 31, January 1, 2010 2010
Consolidated statement of financial position Decrease in goodwill (71,764) (75,834)Increase in AOCI – translation adjustment (4,070) –
Decrease in retained earnings (75,834) (75,834)
(m) unit Appreciation Rights
Requirements under IFRS:
Under previous Canadian GAAP, the liability relating to the UARs was determined by calculating the intrinsic value of each right, representing the amount over which the closing unit price exceeds the UAR’s strike price, including the accrued distribution payable where closing price exceeds strike price at each reporting date, factoring the time elapsed over the vesting period.
Under IFRS, UARs are to be measured at fair value.
Reconciliation:
The impact arising from the change is summarized as follows:
Twelve months ended December 31, 2010
Consolidated statement of earnings (loss) Increase in administrative costs: Unit appreciation rights 252
Decrease in income before tax 252
December 31, January 1, 2010 2010
Consolidated statement of financial position Increase in liability 249 – Increase in AOCI – translation adjustment 3 –
Decrease in retained earnings 252 –
(n) provisions
Requirements under IFRS:
Under IFRS, the amount recognized as a provision is the best estimate of the expenditure required to settle the present obligation at the end of the reporting period. Where the effect of the time value of money is material, the amount of a provision shall be the present value of the expenditures expected to be required to settle the obligation. The unwinding of the discounting is recorded as accretion included as part of finance costs. As a result, the accrual for self-insured liabilities included in provisions was discounted.

146 Extendicare Real Estate Investment Trust
Notes to Consolidated Financial Statements
Reconciliation:
The impact arising from the change is summarized as follows:
Twelve months ended December 31, 2010
Consolidated statement of earnings (loss) Decrease in operating expense: Expense on accrual for self-insured liabilities (180)Increase in net finance costs: Other accretion 514
Decrease in income before tax 334
December 31, January 1, 2010 2010
Consolidated statement of financial position Decrease in liability: Provisions – non-current 848 1,236 Decrease in equity: AOCI – translation adjustment 54 –
Increase in retained earnings 902 1,236
(o) deferred tax liability
Requirements under IFRS:
Under previous Canadian GAAP, the deferred taxes of the legal entity of the REIT were set up at the rate at which we expect the deferred taxes to reverse, which is the SIFT tax rate.
Under IFRS, to the extent that earnings have not yet been distributed to unitholders, current and deferred tax assets and liabilities are measured at the tax rate applicable to undistributed profits. In the case of the legal entity of the REIT, the tax rate applicable to undistributed profits is the highest marginal tax rate of 46.41%. The deferred taxes are then adjusted as distributions are declared.
Reconciliation:
The impact arising from the change is summarized as follows:
Twelve months ended December 31, 2010
Consolidated statement of earnings (loss) Increase in tax expense: Deferred tax 81
Decrease in net earnings 81
December 31, January 1, 2010 2010
Consolidated statement of financial position Decrease in liabiltiy: Deferred tax liability 365 446
Increase in retained earnings 365 446

Notes to Consolidated Financial Statements
2011 Annual Report 147
All of the above changes increased (decreased) deferred tax liability as follows:
December 31, January 1, Notes 2010 2010
Reclass of actuarial gains or loss in employee benefits (h) (1,939) (1,205)Revaluation of property and equipment (i) 137,337 148,306Remeasurement of convertible debentures (j) (2,166) (2,111)Application of higher tax rate to undistributed earnings (o) (365) (446)
Increase in deferred tax liability 132,867 144,544
(p) Retained earnings
Reconciliation:
The above changes increased (decreased) retained earnings (each net of related tax) as follows:
December 31, January 1, Notes 2010 2010
Reclassification of CTA (g) (879) (879)Reclassification of actuarial gains and losses (h) (3,133) (3,313)Revaluation of property and equipment (i) 227,638 232,849Reclassification of convertible debentures (j) (6,386) (3,349)Reclassification of Exchangeable LP Units (k) (16,305) (17,884)Impairment of goodwill (l) (75,834) (75,834)Remeasurement of UARs (m) (252) –Discounting of provisions (n) 902 1,236Application of higher tax rate on undistributed earnings (o) 365 446
Increase in retained earnings 126,116 133,272
28. significant subsidiariesThe following is a list of the significant subsidiaries as of December 31, 2011, all of which are 100% directly or indirectly owned by the REIT.
Jurisdiction of Incorportion
Extendicare (Canada) Inc. CanadaExtendicare Health Services, Inc. DelawareExtendicare Health Facilities, Inc. WisconsinExtendicare Homes, Inc. DelawareExtendicare Northwestern Ontario Inc. CanadaFir Lane Terrace Convalescent Center, Inc. WashingtonIndiana Health and Rehabilitation Centers Partnership DelawareLaurier Indemnity Company, Ltd. BermudaNew Orchard Lodge Limited CanadaNorthern Health Facilities, Inc. DelawareTendercare (Michigan) Inc. Michigan

148 Extendicare Real Estate Investment Trust
Corporate Governance
Extendicare REIT’s Board of Trustees and management team fully acknowledge the importance of their duty to serve the long-term interests of unitholders.
Extendicare REIT believes that good corporate governance is fundamental for the effective operation of the organization and for maintaining the confidence of investors and increasing unitholder value.
Our governance system is built on the values of trust, transparency and high standards of corporate ethics, and we are committed to the principles of disclosure and a strong, independent board. Our commitment to providing quality services, while building unitholder value, is the basis for a well-established and enduring organization.
Extendicare is dedicated to providing timely, accurate and complete disclosure of all material information to the public. Our Board of Trustees and Committee members operate under Charters that clearly define their roles and responsibilities, including: Stewardship, Independence, Effectiveness and Accountability.
Further information on the Trustees of Extendicare REIT and a description of Extendicare’s governance practices may be found in Extendicare’s Management Information and Proxy Circular as filed with SEDAR at www.sedar.com and on Extendicare’s website at www.extendicare.com.
The Board of Trustees of Extendicare REIT
Mel Rhinelander B Chairman
Timothy L. Lukenda President and Chief Executive Officer
John F. Angus A Senior Partner of PerformaCorp Inc.
Margery Cunningham A, B Vice President, Avalere Health LLC
Governor Howard B. Dean HR/GN, QC Senior Strategic Advisor and Independent Consultant, McKenna Long & Aldridge LLP, and former Governor of Vermont
Dr. Seth B. Goldsmith A, QC
Attorney and Professor Emeritus, University of Massachusetts at Amherst
Benjamin J. Hutzel A Retired Partner, Bennett Jones LLP
Michael J. L. Kirby HR/GN, QC Chair of Partners for Mental Health, a professional director and a retired member of the Senate of Canada
Alvin G. Libin HR/GN, B President and Chief Executive Officer of Balmon Investments Ltd.
J. Thomas MacQuarrie, Q.C. A Senior Partner in the Atlantic Canada law firm of Stewart McKelvey
Honorary Trustees Frederick B. Ladly Retired Chairman and Chief Executive Officer of Extendicare
George A. Fierheller President of Four Halls Inc.
A Audit Committee
B Buyback Commitee
HR/GN Human Resources, Governance and Nominating Committee
QC Quality and Compliance Committee
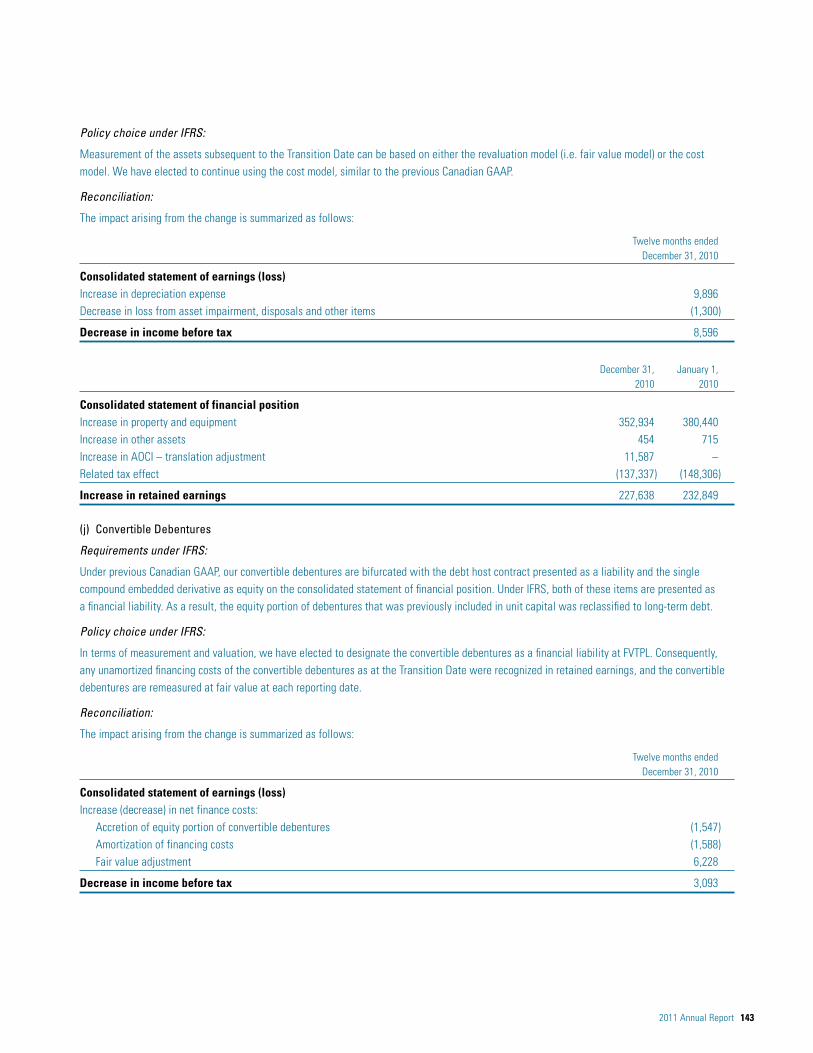
2011 Annual Report 149
Officers and Executives
Extendicare Real Estate Investment Trust
3000 Steeles Avenue East, Suite 700 Markham, Ontario, Canada L3R 9W2 Tel: (905) 470-4000 Fax: (905) 470-5588
Extendicare Health Services, Inc.
111 West Michigan Street Milwaukee, Wisconsin, U.S.A. 53203-2903 Tel: (414) 908-8000 Tel: (800) 395-5000 Fax: (414) 908-8059
Extendicare (Canada) Inc.
3000 Steeles Avenue East, Suite 700 Markham, Ontario, Canada L3R 9W2 Tel: (905) 470-4000 Fax: (905) 470-5588
Mel Rhinelander Chairman
Timothy L. Lukenda President and Chief Executive Officer
Timothy L. Lukenda Chairman and Chief Executive Officer
Richard Gurka Senior Vice President, Operations
Douglas J. Harris Senior Vice President, Chief Financial Officer and Treasurer
Jillian E. Fountain Corporate Secretary
Stephen Biondi Vice President, External Affairs
William Bryan Vice President, Design & Development
Timothy L. Lukenda Chairman and Chief Executive Officer
Paul Tuttle President
Douglas J. Harris Senior Vice President and Chief Financial Officer
Jillian E. Fountain Corporate Secretary
Deborah Bakti Vice President, Human Resources
Douglas J. Harris Senior Vice President and Chief Financial Officer
Jillian E. Fountain Secretary
Loren W. Claypool Vice President and Chief Information Officer
Timothy Detary Vice President, Human Resources
Dylan Mann Vice President and Controller
David Keating Vice President, Deputy General Counsel
LaRae L. Nelson Vice President, Reimbursement
David C. Pearce Vice President, General Counsel and Chief Compliance Officer
Judith Taubenheim Vice President, Clinical Services
Elaine E. Everson Vice President and Controller
Richard Luneburg Vice President, Western Operations
Christina L. McKey Vice President, Eastern Operations
Katharine O’Reilly Vice President, Quality and Performance Improvement
Sue Pearl-Agar Vice President, ParaMed Home Health Care

150 Extendicare Real Estate Investment Trust
Five-year Summary(1)
(unaudited) (thousands of dollars unless otherwise noted) 2011 2010 2009 2008 2007
Financial PositionProperty and equipment 1,192,913 1,206,656 863,430 970,612 837,965 Total assets 1,830,704 1,994,634 1,668,065 1,806,922 1,440,163 Long-term debt, including current portion 1,134,440 1,241,196 1,234,032 1,332,813 1,071,711 Unitholders’ equity (deficiency) 48,319 112,994 (40,903) (29,532) (23,578)Financial ResultsRevenue Nursing and assisted living centers United States 1,355,289 1,397,452 1,463,497 1,328,959 1,103,218 Canada 525,831 495,610 479,125 446,131 418,658 Home health care – Canada 165,030 157,177 155,096 148,928 141,797 Health technology services – United States 19,120 17,205 18,853 14,328 13,861 Outpatient therapy – United States 13,750 12,603 13,905 12,956 12,259 Management, consulting and other services 15,062 17,369 31,091 31,567 33,174
2,094,082 2,097,416 2,161,567 1,982,869 1,722,967
EBITDA(2) 200,136 242,070 265,670 201,827 203,074 Earnings (loss) from continuing operations before separately reported items(2) 6,986 39,378 59,165 29,345 57,667 Net earnings (loss) (30,396) 41,829 77,708 13,388 70,381 AFFO(2) 69,847 110,736 146,137 78,794 85,510 AFFO per basic unit ($) 0.84 1.36 2.00 1.09 1.22 Distributions declared per unit ($) 0.84 0.84 0.84 1.11 1.11 Distribution payout ratio (% of AFFO) 100 62 42 102 91Average U.S./Canadian dollar exchange rate 0.9891 1.0299 1.1420 1.0660 1.0748
Other InformationNumber of centers (year end) United States 179 181 176 185 191 Canada 82 85 82 81 78
261 266 258 266 269
Operational resident capacity (year end) United States 17,369 17,658 17,295 18,634 19,256 Canada 10,738 11,789 11,523 11,394 11,077
28,107 29,447 28,818 30,028 30,333
U.S. nursing center average daily census by payor source (%) Medicare 16.8 16.4 16.2 17.2 18.1 Managed Care 6.0 5.7 5.7 5.2 4.3
Skilled Mix 22.8 22.1 21.9 22.4 22.4 Private/other 9.9 10.5 10.7 11.1 10.8 Medicaid 67.3 67.4 67.4 66.5 66.8 U.S. nursing center revenue by payor source (%) Medicare 34.9 33.3 32.9 33.7 35.1 Managed Care 10.0 9.5 9.6 8.6 6.8
Skilled Mix 44.9 42.8 42.5 42.3 41.9 Private/other 8.5 9.2 9.3 9.7 9.7 Medicaid 46.6 48.0 48.2 48.0 48.4 Average U.S. nursing centers occupancy (%) 85.7 86.0 87.9 88.4 90.3 Average Canadian centers occupancy (%) 96.9 98.0 98.1 98.0 98.2 ParaMed home health care hours of service 4,634,000 4,402,000 4,554,000 4,495,000 4,571,000 Number of employees (year end) 38,100 37,700 38,000 39,100 37,700 Number of units outstanding (year end) 84,121,488 82,995,181 73,180,024 73,572,418 70,044,036
(1) The selected information for 2011 and 2010 has been prepared in accordance with IFRS. The selected information presented for 2009 and prior years was prepared under previous Canadian GAAP and has not been restated for discontinued operations identified in 2011 under IFRS.
(2) Refer to discussion of non-GAAP measures on page 71.

0.0
0.5
1.0
1.5
2.0
Year
1.221.11
07
1.09 1.11
08
2.00
0.84
09
1.36
0.84
10
0.840.84
110
$0.5
$1.0
$1.5
$2.5
$2.0
Payout ratio: 91% 102% 42% 62% 100%
0706Dec. 31 08 09 10 11
$50
$100
$150
$200
2006 2007 2008 2009 2010 2010
EXE.SV/UN $100.00 $92.71 $49.60 $89.88 92.26 $90.84
S&P/TSX Capped REIT $100.00 $94.35 $58.23 $90.41 110.85 $134.88
S&P/TSX $100.00 $109.83 $73.58 $99.38 116.87 $106.69
0
Unitholder Information
Extendicare REIT AFFO and Cash Distributions(1)
p AFFO from continuing operations ($ per basic unit) p Cash distributions ($ per unit)
Relative Unit Price Performance (assuming a $100 investment is made at December 31, 2006)
— S&P/TSX Capped REIT — S&P/TSX — EXE.UN
Extendicare Real Estate Investment Trust
3000 Steeles Avenue East, Suite 700 Markham, Ontario, Canada L3R 9W2
Tel: (905) 470-4000 Fax: (905) 470-5588
www.extendicare.com
Unitholder Inquiries/ Investor Relations
Jillian Fountain Secretary
Tel: (905) 470-5534 Fax: (905) 470-4003
email: [email protected]
Transfer Agent
Computershare Trust Company of Canada Tel: (800) 564-6253 Fax: (866) 249-7775 email: [email protected]
www.computershare.com
Annual and Special Meeting
Unitholders are invited to attend the Annual and Special Meeting of Extendicare Real Estate Investment Trust on May 8, 2012 at 2:30 p.m. at the Toronto Board of Trade, First Canadian Place, Toronto, Ontario, Canada.
Voting Rights
Unitholders receive one vote for each Extendicare Real Estate Investment Trust unit (REIT Unit) held.
Exchange Listings/ Trading Profile
Toronto Stock Exchange symbols: EXE.UN, EXE.DB and EXE.DB.A
2011 REIT Unit trading: High: $13.35; Low: $6.18 Close: $8.50; Volume: 66,531,858
Published Information
Extendicare Real Estate Investment Trust’s 2011 Annual Report is available for viewing or printing on its website at www.extendicare.com, together with news releases, quarterly reports and other filings with the securities commissions. Printed copies of the annual report are available upon request to the Secretary.
(1) The AFFO for 2010 and 2011 have been prepared in accordance with IFRS. The AFFO for 2009 and prior years were prepared under previous Canadian GAAP.

R e a l e s t a t e I n v e s t m e n t t R u s t
3000 Steeles Avenue East Suite 700Markham, Ontario, CanadaL3R 9W2
Tel: (905) 470-4000Fax: (905) 470-5588www.extendicare.com