Embed Size (px)
Citation preview

1
Strength Prediction of Adhesive Joints after Cyclic
Moisture Conditioning Using a Cohesive Zone Model
A. Mubashara, I. A. Ashcrofta,*, G. W. Critchlowb, A. D. Crocombec aWolfson School of Mechanical and Manufacturing Engineering, Loughborough University,
Loughborough, Leicestershire LE11 3TU, UK bDepartment of Materials, Loughborough University, Loughborough, Leicestershire LE11 3TU, UK
cDivision of Mechanical, Medical, and Aerospace Engineering, University of Surrey, Guildford GU2 7HX, UK
Abstract
This paper presents a methodology to predict the strength of adhesive joints under variable
moisture conditions. The moisture uptake in adhesive joints was determined using a history
dependent moisture prediction methodology where diffusion coefficients were based on
experimental cyclic moisture uptake of bulk adhesive samples. The predicted moisture
concentrations and moisture diffusion history were used in a structural analysis with a
cohesive zone model to predict damage and failure of the joints. A moisture concentration
and moisture history dependent bilinear cohesive zone law was used. The methodology was
used to determine the damage and failure in aluminium alloy – epoxy adhesive single lap
joints, conditioned at 50°C and good predictions of failure load were observed. The damage
in the adhesive joints decreased the load carrying capacity before reaching the failure load
and a non linear relationship between the load and displacement was observed. Changes in
crack initiation and crack propagation were also observed between different types of joints.
The presented methodology is generic and may be applied to different types of adhesive joint
and adhesive.
Keywords: Adhesion, Finite element method, Strength Prediction, Cyclic moisture,
* Corresponding author. Tel: +44 1509 227535; fax: +44 1509 223934
Email address: [email protected] (I.A.Ashcroft)

2
Durability
1. Introduction
The use of adhesives in structural applications is increasing [1-3] owing to a number of
advantages offered by adhesive joints over other methods of joining. These include low
weight, high stiffness and good fatigue resistance. The stresses are usually distributed over a
larger area in adhesive joints compared to mechanical fasteners and there is no heat affected
zone, as is found in welded joints. On the other hand, environmental factors such as
temperature and moisture are known to adversely affect the performance of adhesive joints
[1, 4, 5]. A number of degradation models / mechanisms have been proposed, which attempt
to explain the deleterious influence of water within adhesive joints [6-10].
Absorption of moisture in epoxy adhesives degrades the mechanical properties of the
adhesive, which may contribute to reduction in joint strength. The effect of moisture
absorption on the mechanical properties of a bulk epoxy adhesive was observed by Zanni-
Deffarges and Shanahan [11]. Moisture diffusion was carried out at 70˚C under 100% relative
humidity (RH). A 20% decrease in the elastic modulus of the bulk adhesive samples aged to
saturation as compared to the unconditioned samples was observed. Loh et al [12] also
observed a progressive decrease in the elastic modulus (E) and ultimate tensile stress (σult) of
bulk adhesive samples with increasing moisture concentration when subjected to 81.2%,
95.8% RH and immersed in water.
Recovery in strength of adhesives is observed after the absorbed moisture was dried. Lin and
Chen [13] observed that tensile strength and the elastic modulus of a DGEBA/DDA epoxy
polymer decreased by 29.5% and 29.1% respectively, after the moisture absorption. When the
samples were dried, the strength and the elastic modulus recovered to at least 90% of the
unconditioned values. Plasticisation of the adhesive was proposed as the main reason for the

3
observed degradation in the mechanical properties of the adhesive. As plasticisation is
considered potentially reversible [14], large recoveries in the elastic modulus and the tensile
strength were observed after drying the sample, however, the elastic modulus and tensile
strength did not return completely to the levels measured in the unconditioned state. This
suggested that some irreversible mechanisms were also present. Moisture can affect
adhesives in an irreversible manner via a number of potential mechanisms including;
chemical degradation, chain scission and micro-cracking [14].
Cohesive zone models (CZM) have been used increasingly in recent years to simulate crack
initiation, propagation and failure [15-19]. The cohesive zone method offers a number of
advantages over other methods for the determination of damage and failure such as; no initial
crack is required to model failure and a small number of parameters are needed to calibrate
the model when compared to most continuum damage models. A methodology for the
determination of cohesive zone model parameters and its application to different joint
configurations has been successfully implemented by Crocombe and his co-workers [5, 20-
22]. The cohesive energy of the adhesive and substrate system was determined using a mixed
mode flexure joint (MMF) in three point bend configuration. The failure loads of
unconditioned and conditioned MMF specimens were used to determine the cohesive zone
model parameters. These were then used to model the joint durability of single lap, double
lap and L-joints. Good correlation was found in the predicted and experimental strengths of
the joints.
In [23], a methodology for predicting the transient moisture distribution in adhesive joints
under cyclic moisture conditions was introduced. In this paper, the methodology is used in
combination with cohesive zone modelling to determine the progressive damage and failure
in single lap joints subjected to cyclic environmental ageing. The cohesive zone model was
calibrated using a combination of experimental and numerical methods. The calibrated model

4
was used to predict the strength of single lap joints, conditioned for different time intervals at
50°C in water.
2. Experimental Methods
The structural adhesive FM73-M, available from Cytec Engineered Materials Ltd, New
Jersey, USA was used in the manufacture of bulk adhesive samples and adhesive joints.
FM73-M is a single part, heat setting, rubber toughened epoxy, which comes in film form and
has a polyester knit carrier for support and handling. The manufacturer’s recommended
curing temperature of FM73-M is 120C.
To simulate the strength of adhesive joints under cyclic moisture conditions, the cyclic
moisture diffusion and mechanical properties of the adhesive were determined. The moisture
diffusion properties of the adhesive were determined by the gravimetric method and have
been reported in [23]. The moisture dependant mechanical properties of the adhesive were
determined by tensile testing bulk adhesive samples, which were cut from cured sheets of the
bulk adhesive according to BS EN ISO 527-2:1996 [24]. The tensile test samples were
conditioned at 50C, immersed in water, for absorption, and desorption cycles. At pre-
selected time intervals, samples were withdrawn from the conditioning environment and
tensile testing was carried out using an Instron 3366 dual column testing machine, with a
displacement rate of 1 mm/min. At least three tensile samples were tested at each selected
time interval. The strain was measured using a strain gauge based contact extensometer. The
specimens were wrapped with cling film to minimise any changes in moisture concentration
during the transportation to the test machine and tensile testing.
Single lap joints were used to determine changes in joint strength after moisture diffusion.
The single lap joint adherends were manufactured from unclad aluminium alloy 2024 in T3
heat treated (Al2024 T3) and non heat treated (Al2024 O) state to study the effect of

5
adherend stiffness on joint strength. The joints were prepared according to BS ISO 4587:2003
[25] and their configuration and geometry are shown in Figure 1. The adherends were cut
from 3.2 mm thick Al2024 T3 and O sheets and their surfaces were prepared by degreasing
followed by ACDC anodising. ACDC anodising is an environmental friendly pre-treatment
process, which is free from the hexavalent chromium found in the aerospace industry
standard chromic acid anodising (CAA).
In ACDC anodising, the adherends act as anodes in a DC phase and alternatively as anodes
and cathodes in an AC phase. The adherends are suspended in an aqueous solution of 2.5%
phosphoric plus 2.5% sulphuric acid and an alternating current (AC) applied at a voltage of
15V for 2 minutes at 35C. This process is followed by the application of direct current (DC)
with a voltage of 20V for 10 minutes at 35C. The adherends are then rinsed with water and
dried in air. The ACDC anodising process provides a high energy, porous oxide surface on
the adherends, which is ideal for adhesive bonding, with a dense, corrosion resistant layer
adjacent to the aluminium. Further details of the ACDC pretreatment may be found in [26].
The ACDC pretreatment was followed by the application of BR127 corrosion inhibiting
primer, which was air dried at room temperature for 30 minutes and then cured for one hour
at 120°C. During curing, the adhesive and the adherends were held together by clips and
bondline thickness was maintained by the carrier in the adhesive film. The adhesive was
cured at 120°C for one hour and the final bondline thickness was 0.12±0.02 mm. Fillets were
formed at the ends of the overlap due to out-flow of the adhesive and the average size of the
fillets was 1 mm.
A set of three unconditioned joints was tensile tested at room temperature using a Hounsfield
H20K-W tensometer to obtain the initial failure strength. The rest of the joints were
conditioned in water at 50°C. Sets of six joints were removed from the conditioning

6
environment at predefined intervals of 7, 14, 28, 56 and 182 days. Three joints from the
extracted set were immediately tensile tested and the remaining three joints were placed in an
oven for drying at 50°C. The drying time for the joints was the same as the absorption time
for each joint. After drying, the joints were brought to room temperature in a desiccator and
tensile testing was carried out. The joints dried after conditioning will hereafter be referred to
as “dried joints”, however, it should be noted that some residual moisture may be present in
the joints.
Plastic deformation was not observed in the Al2024 T3 adherends during tensile testing of the
adhesive joints whilst significant plastic deformation was seen in the Al2024 O adherends.
Thus, tensile testing of Al2024 O specimens was carried out to determine the elasto-plastic
material properties, which were used later in the finite element models. Three specimens of
Al2024 O were tensile tested using an Instron 3366 dual column testing machine and the
strain was measured using a contact type extensometer.
3. Experimental Results
Stress in bulk adhesive specimens as a function of strain at different moisture conditions is
plotted in Figure 2. The plots are the average from testing three specimens at each moisture
condition where stresses had a standard deviation of ±2.6 MPa. The moisture content in each
bulk adhesive specimen is given as the ratio of moisture content at any time, tM , measured
by gravimetric means, to the saturated moisture content, M , i.e. /tM M . During the
absorption cycle, an increase in strain to failure, over unconditioned specimens, was observed
for all moisture concentrations. The increased strain to failure may be due to plasticisation of
the adhesive by the absorbed moisture. In dried bulk adhesive samples, the strain to failure

7
decreased to a value less than the unconditioned samples, which indicates a combination of
reversible and irreversible effects on the absorption of moisture by the adhesive.
A representative stress-strain curve obtained from tensile testing Al2024 O tensile specimens
is given in Figure 3 and the mechanical properties of the Al2024 T3 and O adherends are
given in Table 1. The change in failure load of the single lap joints with conditioning time is
shown in Figure 4. The Al2024 T3 joints showed a decrease in the failure load with
increasing conditioning time. When Al2024 T3 joints were dried after conditioning, they
recovered between 98% and 100% of the original strength. The recovered percentage of the
original strength was similar for all moisture absorption time intervals. It can be seen in
Figure 4 that the strength of unconditioned Al2024 O joints is significantly less than that of
Al2024 T3 joints. This can be attributed to the plastic deformation of the Al2024 O adherends
during tensile testing, which occurred because of the lower yield stress of Al2024 O (75.8
MPa) compared to Al2024 T3 (345 MPa). This resulted in higher strains in adhesive fillets
causing higher peel stresses and resulting in lower joint strength. The Al2024 O joints also
showed a more rapid decrease in strength than the Al2024 T3 joints in the initial conditioning
period of 14 days. However, a strength increase was then observed after tensile testing for 28
days of conditioning. After moisture absorption for 56 days, the strength of the joint
recovered to about 86% of its original strength and remained at a similar value after
conditioning of 182 days. The Al2024 O joints were also tested after drying and the strength
recovered to 88% or more of the unconditioned joint strength.
It has been proposed that moisture affects the strength of a joint through a change in the
adhesive properties and potentially also by attacking the adhesive-adherend interface [1].
However, utilising advanced preparation methods, such as the ACDC anodisation process
used in the present research, the effect of water at the interface can be minimised, resulting in

8
durable structures. The two main types of failure observed in the joints were cohesive failure
and apparent interfacial failure. Cohesive failure in the adhesive layer was observed in the
Al2024 T3 and O single lap joints tested in the unconditioned state. In the Al2024 T3
conditioned joints, cohesive failure predominated in joints tested after 7, 14, 28 and 56 days,
whereas, a mixed failure was observed in the joints conditioned for 182 days. However,
patches of apparent interfacial failure were present to some degree on most of the failure
surfaces. A similar pattern of cohesive or mixed failure was observed in the dried joints.
In Al2024 O joints, the failure surfaces showed increasing levels of apparent interfacial
failure as the failure load of the joint decreased after 7 and 14 days of moisture absorption
when the strength of the conditioned joints started to increase after 28 days of moisture
absorption, the ratio of cohesive to interfacial failure followed a trend similar to joint
strength. In Al2024 O joints dried after conditioning, an increase in the apparent interfacial
failure was observed in joints conditioned for 7 and 14 days and then dried. As the joint
strength increased after 28 days of conditioning, increased cohesive failure was also
observed. Similar behaviour was observed after 56 and 182 days of conditioning, where
mostly cohesive failure was observed.
4. Finite Element Modelling
A cyclic moisture diffusion prediction methodology was presented in [23], which is able to
predict moisture concentration in bonded joints over multiple cycles of absorption and
desorption. The methodology was implemented using a user sub-routine in the commercially
available finite element code Abaqus, Dassault Systemes, Providence, RI, USA. The moisture
history of the adhesive was maintained by use of scalar internal state variables. In this paper,
the cyclic moisture diffusion prediction methodology is coupled with cohesive zone model

9
for the prediction of damage and failure in joints when subjected to variable environmental
conditions.
The framework for strength prediction under cyclic moisture conditions is given in Figure 5.
The moisture history dependence of mechanical properties was introduced in the model by
using field variables. The moisture history and moisture process i.e. absorption or desorption
are stored in state variables in the form of a spatially resolved field for the adhesive layer.
The moisture history, normalised concentration and moisture process definitions required for
the predictive strength model were obtained from a cyclic moisture diffusion analysis.
A built-in cohesive zone modelling capability is available in Abaqus, which was employed in
this study to predict the failure load of single lap joints in both conditioned and unconditioned
states. A bilinear constitutive cohesive zone law was selected for modelling the single lap
joints as this has been successfully used to model failure in bonded joints in the literature [15,
20, 27-29] and provides a good compromise between computational cost and the number of
elements required to represent the damage zone and failure [30]. The bilinear cohesive zone
law is shown in Figure 6 in the form of a traction-separation response where cohG is the
cohesive energy, K is the stiffness, i is the traction, c is the tripping traction, is
displacement, c is the critical displacement and f is the final displacement. A stress
criterion was used for damage initiation where the damage was assumed to initiate when the
ratio of stress at any time increment to the maximum stress reached a value of one as given
by Equation (1).
,max ,max ,max
max , , 1n s t
n s t
(1)

10
where ,maxn
is the maximum stress in the normal direction, ,maxs and
,maxt are the maximum
stresses in transverse shear directions. n , s and t are the corresponding stresses at any
time increment. “ “ is a Macaulay bracket, showing that no damage occurs under pure
compression.
The bilinear cohesive zone model may be completely defined by cohG , K , and c . Turon et
al [31] provided a relationship for determining the value of stiffness based on the properties
of the surrounding material, which for an isotropic material is given by:
E
Kt
(2)
where E is the elastic modulus, t is the thickness of material surrounding the cohesive
elements and is a parameter whose value should be much larger than 1 1 . A value
of 50 or greater was recommended for [31]. Based on Equation (2), the value of stiffness
was calculated to be 8.3 x 10⁵ N/mm3, however, convergence difficulties were observed
during modelling and a lower value of 1 x 10⁵ N/mm3 was used for the cohesive zone model.
The moisture dependent fracture energy of adhesive FM73 was determined by Liljedahl et al
[20] using a mixed mode flexure (MMF) specimen. MMF specimens were tested under dry,
80% RH and 96% RH conditions and the failure load was used to determine the fracture
energies. The experimental fracture energy as a function of moisture content is given in
Figure 7 [20]. This was used as the moisture dependent value of Gcoh in the cohesive zone
model.
A penalty based cohesive zone finite element approach, as suggested by Diehl [28, 32] was
used to determine c . A two dimensional single lap joint with Al2024 T3 adherends and
FM73 adhesive was modelled. The adhesive was modelled using elastic continuum elements
and a layer of cohesive elements was embedded in the mesh based on the experimental

11
observations of crack growth. Two dimensional, continuum four node, plane strain elements
were used for the adhesive and the adherends. The mesh, along with the boundary conditions
and loading for the two dimensional model, is shown in Figure 8. The joint was loaded by
prescribed displacement and the predicted failure load was calibrated to the experimental
failure load to determine the value of c . The force vs. displacement response of the
calibrated single lap joint model is shown in Figure 9. The finalised parameters for the
bilinear cohesive zone law are given in Table 2.
The moisture dependence in the CZM was introduced by using a moisture dependent cohG .
The moisture concentration and moisture history, which were stored in the form of state
variables in the hygroscopic model, were used as initial conditions in the CZM analysis. The
cohG was defined as:
, 1, 2coh tG C FV FV (3)
where 1FV and 2FV are field variables and tC is the normalised moisture content at any
point in the adhesive layer. The field variables (FV1, FV2) were used to relate moisture
dependent material properties to state variables containing moisture concentration and
moisture history using an Abaqus USDFLD user subroutine. USDFLD allows the definition
of field variables at a material point as a function of time or any available material point
quantity [33]. The change in the cohesive zone law based on the moisture dependent cohesive
energy is shown in Figure 10. The model incorporates mode I and mode II failure modes but
it is assumed that fracture energy and the moisture effect do not change with mode mixity,
which is consistent with previous work [22, 34].

12
5. Strength Prediction of Single Lap Joints
Single lap joints with Al2024 T3 and O adherends, conditioned in deionised water at 50°C,
were modelled using the proposed methodology. A three dimensional (3D) model of the
single lap joint was used, owing to the moisture and structural boundary condition
requirements. A quarter model, based on symmetry in the geometry and the loading was
used. Continuum, eight node, linear elements with incompatible modes (C3D8I) were used
for meshing the adhesive layer. The adherends were meshed using a combination of
continuum and continuum shell elements, as shown in Figure 11. The continuum elements
were the same type as those used in the adhesive layer, whilst the continuum shell elements
were eight node, quadrilateral, reduced integration elements (SC8R).
A layer of the cohesive zone elements, of 0.005 mm thickness, was embedded between the
continuum elements of the adhesive and the adherends on a crack path determined from
experimental observations. A finite thickness was necessary as the analysis was carried out in
two steps. In the first step, moisture diffusion analysis was carried out and the normalised
moisture concentrations were determined. During moisture diffusion analysis, continuum, 8
node, linear heat transfer elements (DC3D8) were used for meshing. Moisture diffusion was
modelled across the adhesive and CZM elements. Since the same mesh was used in second
step to predict the damage and failure based on the CZM, elements of very small thickness
were used in moisture diffusion analysis, which were later converted to cohesive zone
elements for the structural analysis. The single lap joints were loaded by prescribed
displacement. As previously described, a sequential mechanical analysis was carried out and
the results of the diffusion analysis were used as initial conditions in the structural analysis.
The experimental failure load of the single lap joints, as given in Figure 4, was used to
validate the predicted strength.

13
For the Al2024 T3 joints, an elastic material definition was used for the adherends and
moisture and moisture history dependent elastic properties were used for the adhesive (the
effect of introducing plasticity in modelling the adhesive layer is discussed in a previous
paper [35]). The prescribed load-displacement responses of the unconditioned and 182 days
conditioned T3 joints are shown in Figure 12. It can be seen that the initial load-displacement
curves for both unconditioned and 182 days conditioned T3 joints are linear. In
unconditioned T3 joints, the load-displacement response becomes nonlinear after
approximately 8.2 kN of load as represented by the dashed lines in Figure 12. At this point,
20% of the overlap and 91.7% of the fillet area was damaged, as determined by the finite
element model. In 182 days conditioned T3 joints, a nonlinear load-displacement response
was observed when 15.5% of the overlap and 65.9% of the fillet area was damaged. This
indicates that the load carrying capacity of the joints start to decrease with the onset of
significant damage appearing in the adhesive layer and fillet, at loads lower than the failure
load of the joint.
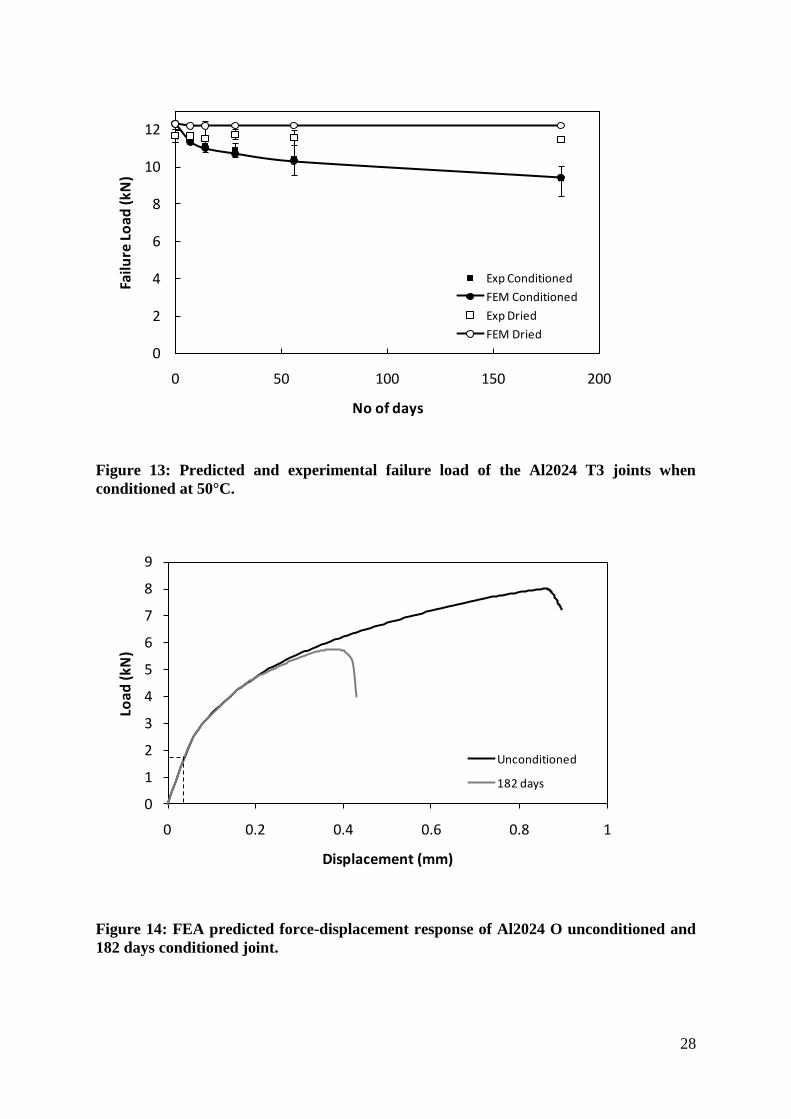
The predicted and experimental failure loads for the Al2024 T3 joints are plotted in Figure
13. The predicted unconditioned failure load was approximately 5% higher than the
experimental unconditioned failure load. For conditioned T3 joints, the predicted failure load
is in good agreement with the experimental failure load for all the conditioning time intervals.
When the T3 joints were dried after moisture conditioning, they regained most of their
unconditioned strength and similar behaviour was observed in the predictive modelling. The
predicted failure load under all dried conditions was higher than the experimental failure load
and was within 7% of the experimental results. The difference between the failure load of the
experimental and predicted unconditioned T3 joints may be attributed to the differences of
meshing, element type and element formulation between the 2D and 3D models, since the
cohesive zone model parameters for unconditioned joint were calibrated using a 2D model.

14
The adherends of the O joints were modelled using an elasto-plastic material model and
moisture history dependent elastic properties were used for the adhesive. A von-Mises yield
surface with associated flow was used along with an isotropic hardening law. The cohesive
zone model parameters used were the same as those used for the T3 joints. The predicted
force vs. displacement response of the unconditioned O joints may be seen in Figure 14
where a nonlinear relationship between force and displacement was observed after load of 1.8
kN. In this case, it can be attributed to the plastic deformation of the adherends as damage
was not visible in the adhesive at this load in either the unconditioned or 182 days
conditioned joints.
A comparison between the experimental and finite element predicted plastic deformation of
the adherends of the unconditioned O joints after loading to is shown in Figure 15. A good
correlation between the shape of the experimentally deformed adherends and the finite
element model exists. The experimental and predicted failure loads of the O joints,
conditioned for various time intervals, are shown in Figure 16. The failure load of the
unconditioned O joint was under-predicted by approximately 9% by the model. The predicted
failure loads at conditioning times of 7, 14 and 28 days were higher than the average
experimental failure loads and were within 11.5% of the average failure loads. The
experimental strength of the O joints recovered somewhat after 56 and 182 days of moisture
conditioning, however, the finite element model predicted a progressive decrease in the
failure load under these conditions. The strength of the dried O joints was under predicted at
all moisture conditions except for 7 days of moisture conditioning, however, the predicted
strength was within 6% of the average experimental results.

15
6. Crack Initiation and Propagation
Damage and crack development in the unconditioned T3 joints, as predicted by the finite
element modelling, are shown in
Figure 17. The geometry of the single lap joint used to show contour plots is developed by
cross sectioning the joint with two cutting planes shown in
Figure 17a. The contour plots show the damage, represented by a scalar damage variable
SDEG, in the adhesive layer and it can be seen that most of the overlap region was damaged
before rupture occurred. The crack initiated in the fillet region, labelled as A in
Figure 17b, and the major crack growth direction initially was towards the edges i.e in the Z
direction; as shown in
Figure 17c. Once the crack reached the edges, it propagated towards the middle of the
overlap, in the X direction as may be seen from
Figure 17e. Similar type of crack initiation was experimentally observed by Shenoy et al [36]
while testing single lap joints manufactured using FM73-M adhesive and aluminium 7075-T6
adherends. Crack growth was observed in the middle of the joint and the developed crack was
concave in shape. This agrees well with the finite element predicted crack growth shape as
shown in

16
Figure 17.
Crack initiation in the T3 joints conditioned for 182 days was in the fillet region, labelled as
B in
Figure 18a, which was similar to the unconditioned joints. However, at the time of the crack
initiation, the damage zone in the conditioned T3 joints was much smaller than in the
unconditioned T3 joints. After crack initiation, the major crack growth occurred from region
B towards edges, as given in
Figure 18b. However, in the unconditioned joints, cracks also initiated from the edges of the
adherends, as shown in
Figure 18c, the two sets of cracks eventually joining to form a cross width crack as shown in
Figure 18d. The crack then progressed towards the middle of the overlap, in the X direction,
however, in the conditioned joint the crack length is longest at the edges, whereas, it can be
seen in
Figure 17e that in the unconditioned joints the crack length is always greater in the middle of
the joint width. This is potentially significant if crack length is being measured
experimentally by observation of the joint edges.
The crack propagation rate in the unconditioned and conditioned T3 joints may be compared
by plotting the change in crack length with applied displacement. The crack lengths of the
unconditioned and 182 days conditioned T3 joints, as a function of applied displacement, are
plotted in Figure 19. After crack initiation, a region of stable crack growth exists for both
unconditioned and 182 days conditioned T3 joints. The stable crack growth is followed by a
period of rapid growth leading to failure. The stable crack growth in the unconditioned T3
joints occurred for a shorter duration than in the 182 days conditioned T3 joints. This may be

17
attributed to the more ductile response of the adhesive after moisture absorption. Once a
major portion of the adhesive layer was damaged, failure occurred virtually instantaneously
in both unconditioned and conditioned T3 joints.
Crack initiation in the O joints occurred at the outer fillet edge in region C, as can be seen in
Figure 20a, which was different from the T3 joints where crack initiated in the middle of the
fillet. This can be more clearly seen in Figure 21. After the crack initiation, major crack
growth occurred towards the edges, i.e. in ±Z directions, and once the crack reached the
edges, the crack propagated towards the middle of the overlap in the X direction. The damage
zone was smaller in the unconditioned O joints than the unconditioned T3 joints during crack
propagation. The difference in crack initiation region between O and T3 joints may be
because of the increased peel stresses in the O joints, resulting from the plastically induced
adherend rotation. In the O joints conditioned for 182 days, the crack initiation location was
similar to the 182 days conditioned T3 joints, as shown in
Figure 22. The crack propagated towards the middle of the overlap, in the X direction, after
reaching the joint edges.
There are three regions of crack propagation after crack initiation in the unconditioned O
joints, as may be seen in Figure 23. A relatively fast crack growth region is followed by a
period of slow, more stable crack growth. This is then followed by another period of rapid
crack growth, this time leading to failure of the joint. In the 182 days conditioned O joints
similar behaviour is seen, however, the region of slow crack growth is smaller than in the
unconditioned O joints. Comparison of Figure 19 and Figure 23 shows that the crack
propagation was more gradual in the O joints than the T3 joints.

18
7. Summary and Conclusions
A cohesive zone model was used to predict the damage and failure in single lap joints under
cyclic moisture conditions. The first step in the prediction of joint strength is the prediction of
moisture diffusion in the adhesive joint, which was carried out using a history dependent
moisture prediction methodology. The history dependent moisture prediction methodology
used diffusion coefficient obtained from cyclic moisture uptake of bulk adhesive samples.
The diffusion prediction methodology was coupled with a structural analysis methodology
where cohesive zone model was used to predict the damage and failure in single lap joints.
Batches of unconditioned and conditioned T3 and O single lap joints were tensile tested to
determine the effects of moisture diffusion on joint strength. The single lap joints were
conditioned by immersing in deionised water at 50°C and dried after conditioning. A
significant recovery in the joint strength was observed after drying.
The results of the finite element analysis show that the failure initiation region in an adhesive
joint may change based on the strength of the adherends and the moisture distribution in the
adhesive. The load carrying capacity of joints starts to decrease as damage appears in the
joint. This occurs at a load lower than the failure load, thus, only using failure criteria to
predict the strength of joints may over predict the failure loads. It was also observed that the
crack growth before sudden failure, in a conditioned single lap joint, is more stable than in an
unconditioned joint. The proposed variable moisture and strength prediction methodology
can successfully predict the strength of adhesive joints under variable environmental
conditions.

19
References
[1] Minford JD. Handbook of Aluminum Bonding Technology and Data. New York: Marcel
Dekker, Inc.; 1993.
[2] Grant LDR, Adams RD, da Silva LFM. Experimental and numerical analysis of single-lap
joints for the automotive industry. International Journal of Adhesion and Adhesives.
2009;29:405-13.
[3] da Silva LFM, das Neves PJC, Adams RD, Spelt JK. Analytical models of adhesively
bonded joints - Part I: Lieterature survey. Int J Adhesion and Adhesives. 2009;29:319-30.
[4] Hand HM, Arah CO, McNamara DK, Mecklenburg MF. Effects of environmental
exposure on adhesively bonded joints. Int J Adhesion and Adhesives. 1991;11:15-23.
[5] Liljedahl CDM, Crocombe AD, Wahab MA, Ashcroft IA. Modelling the Environmental
Degradation of the Interface in Adhesively Bonded Joints using a Cohesive Zone Approach.
The Journal of Adhesion. 2006;82:1061-89.
[6] Bowditch MR. The durability of adhesive joints in the presence of water. Int J Adhesion
and Adhesives. 1996;16:73-9.
[7] Apicella A, Nicolais L, Astarita G, Drioli E. Effect of thermal history on water sorption,
elastic properties and the glass transition of epoxy resins. Polymer. 1979;20:1143-8.
[8] De'Nève B, Shanahan MER. Water absorption by an epoxy resin and its effect on the
mechanical properties and infra-red spectra. Polymer. 1993;34:5099-105.
[9] Katya II, Richard AP, Affrossman S. Hygrothermal aging of rubber modified and mineral
filled dicyandiamide cured DGEBA epoxy resin. III. Dielectric spectroscopy investigation. J
Appl Polym Sci. 2002;84:1011-24.
[10] Liu J, Lai Z, Kristiansen H, Khoo C. Overview of conductive adhesive joining
technology in electronics packaging applications. Proceedings of 3rd International
Conference on Adhesive Joining and Coating Technology in Electronics Manufacturing:
IEEE; 1998. p. 1-18.
[11] Zanni-Deffarges MP, Shahnahan MER. Diffusion of water into an epoxy adhesive:
comparision between bulk behaviour and adhesive joints. Int J Adhesion and Adhesives.
1995;15:137-42.
[12] Loh WK, Crocombe AD, Wahab MA, Ashcroft IA. Modelling anomalous moisture
uptake, swelling and thermal characteristics of a rubber toughened epoxy adhesive. Int J
Adhesion and Adhesives. 2005;25:1-12.
[13] Lin YC, Chen X. Moisture sorption-desorption-resorption characteristics and its effects
on the mechanical behaviour of the epoxy system. Polymer. 2005;46:11994-2003.
[14] Shuangyan Xu, Dillard DA, Dillard JG. Environmental aging effects on the durability of
electrically conductive adhesive joints. Int J Adhesion and Adhesives. 2003;23:235-50.

20
[15] Zhang L, Wang J. A generalized cohesive zone model of the peel test for pressure-
sensitive adhesives. Int J Adhesion and Adhesives. 2009;29:217-24.
[16] Ural A, Krishnan VR, Papoulia KD. A cohesive zone model for fatigue crack growth
allowing for crack retardation. Int J Solids Struct. 2009;46:2453-62.
[17] Zavattieri PD, Hector Jr LG, Bower AF. Cohesive zone simulations of crack growth
along a rough interface between two elastic-plastic solids. Engineering Fracture Mechanics.
2008;75:4309-32.
[18] Freed Y, Banks-Sills L. A new cohesive zone model for mixed mode interface fracture
in bimaterials. Engineering Fracture Mechanics. 2008;75:4583-93.
[19] Carlberger T, Stigh U. An explicit FE model of impact fracture in an adhesive joint.
Engineering Fracture Mechanics. 2007;74:2247-62.
[20] Liljedahl CDM, Crocombe AD, Wahab MA, Ashcroft IA. Modelling the environmental
degradation of adhesively bonded aluminium and composite joints using a CZM approach.
Int J Adhesion and Adhesives. 2007;27:505-18.
[21] Liljedahl CDM, Crocombe AD, Wahab MA, Ashcroft IA. The effect of residual strains
on the progressive damage modelling of environmentally degraded adhesive joints. J
Adhesion Sci Technol. 2005;19:525-47.
[22] Crocombe AD, Hua Y, Loh WK, Wahab MA, Ashcroft IA. Predicting the residual
strength for environmentally degraded adhesive lap joints. Int J Adhesion and Adhesives.
2006;26:325-36.
[23] Mubashar A, Ashcroft IA, Critchlow GW, Crocombe AD. Modelling cyclic moisture
uptake in an epoxy adhesive. J Adhesion. 2009;85:711-35.
[24] BS EN ISO 527-2:1996 Plastics - Determination of tensile properties - Part 2: Test
conditions for moulding and extrusion plastics. British Standards Institution.
[25] BS ISO 4587:2003 Adhesives - Determination of tensile lap-shear strength of rigid-to-
rigid bonded assemblies. British Standards Institution.
[26] Critchlow GW, Ashcroft IA, Cartwright T, Bahrani D. Anodising aluminium alloy.
United Kingdom2 421 959 A, 2006.
[27] de Moura MFSF, Chousal JAG. Cohesive and continuum damage models applied to
fracture characterization of bonded joints. Int J Mech Sci. 2006;48:493-503.
[28] Diehl T. On using a penalty-based cohesive-zone finite element approach, Part II:
Inelastic peeling of an epoxy-bonded aluminum strip. International Journal of Adhesion and
Adhesives. 2008;28:256-65.
[29] Fan C, Jar PYB, Cheng JJR. Cohesive zone with continuum damage properties for
simulation of delamination development in fibre composites and failure of adhesive joints.
Engineering Fracture Mechanics. 2008;75:3866-80.

21
[30] Alfano G. On the influence of the shape of the interface law on the application of
cohesive-zone models. Composites Science and Technology. 2006;66:723-30.
[31] Turon A, Davila CG, Camanho PP, Costa J. An engineering solution for mesh size
effects in the simulation of delamination using cohesive zone models. Engineering Fracture
Mechanics. 2007;74:1665-82.
[32] Diehl T. On using a penalty-based cohesive-zone finite element approach, Part I: Elastic
solution benchmarks. International Journal of Adhesion and Adhesives. 2008;28:237-55.
[33] Abaqus User Subroutines Reference Manual. Dassault Systemes Simulia Corp.
Providence, RI, USA; 2008.
[34] Loh WK, Crocombe AD, Abdel Wahab MM, Ashcroft IA, Environmental degradation
of the interfacial fracture energy in an adhesively bonded joint, Engineering Fracture
Mechanics, 2002; 69: 2113-2128.
[35] Mubashar A, Ashcroft IA, Critchlow GW, Crocombe AD, A method of predicting the
stresses in adhesive joints after cyclic conditioninig, Journal of Adhesion, in press.
[36] Shenoy V, Ashcroft IA, Critchlow GW, Crocombe AD, Abdel Wahab MM. An
investigation into the crack initiation and propagation behaviour of bonded single-lap joints
using backface strain. Int J Adhesion and Adhesives. 2009;29:361-71.
[37] Kutz M. Handbook of Materials Selection. New York: John Wiley & Sons, Inc.; 2002.
[38] Cardarelli F. Materials Handbook - A Concise Desktop Reference. 2nd ed. London:
Springer-Verlag London Limited; 2008.

22
Figure 1: Single lap joint configuration and geometry.
Figure 2: Moisture dependant stress vs. strain curves for the adhesive at different values
of /tM M .
0
10
20
30
40
50
0 5 10 15
Stre
ss (M
Pa)
Strain %
Unconditioned 1st uptake 74%
1st uptake 23% Dried
1st uptake 55% 2nd uptake 97%
Adhesive
End tab
Adherend
100 mm
12.5 mm
3.2 mm
25 mm

23
Figure 3: Tensile stress vs strain response of Al2024 O.
Figure 4: Failure load of single lap joints after conditioning at 50C, immersed in water
and subsequent drying in air at 50C.
0
30
60
90
120
150
180
0 2 4 6 8 10 12 14 16
Stre
ss (M
Pa)
Strain (%)
0
2
4
6
8
10
12
14
0 50 100 150 200
Failu
re L
oad
(kN
)
No of days
T3 - Conditioned
O - Conditioned
T3 - Dried
O - Dried

24
Figure 5: Overall methodology for the strength prediction of cyclic conditioned
structures.
Figure 6: Bilinear cohesive zone law.
cohG
f c
K i
c
Numerical model
Moisture conditions and history
Boundary conditions
Damage and failure using CZM
Moisture history dependant mechanical properties
Results
Bulk adhesive testing
Cyclic diffusion analysis

25
Figure 7: Moisture dependent fracture energy of the adhesive.
Figure 8: Mesh and boundary conditions of two dimensional single lap joint model.
0
0.5
1
1.5
2
2.5
3
0 0.5 1 1.5 2 2.5 3 3.5
Frac
ture
En
erg
y (K
J/m
2)
Moisture (wt %)
Rotational symmetry
Load

26
Figure 9: Force vs. displacement response of the two dimensional single lap joint.
Figure 10: Change in bilinear cohesive zone law with increasing moisture concentration.
0
2
4
6
8
10
12
14
0 0.05 0.1 0.15 0.2 0.25
Forc
e (k
N)
Displacement (mm)
FEA
Experimental
cohG
f c
K i
c
Increasing moisture content

27
Figure 11: The 3D mesh used for CZM based analysis of single lap joints.
Figure 12: FEA predicted force-displacement response of Al2024 T3 unconditioned and
182 days conditioned joints.
0
2
4
6
8
10
12
0 0.05 0.1 0.15 0.2 0.25
Load
(kN
)
Displacement (mm)
Unconditioned
182 days
Unconditioned
Conditioned for 182
Continuum Shell
Elements
Continuum
Elements
Adherend
bottom
28
Figure 13: Predicted and experimental failure load of the Al2024 T3 joints when
conditioned at 50°C.
Figure 14: FEA predicted force-displacement response of Al2024 O unconditioned and
182 days conditioned joint.
0
2
4
6
8
10
12
0 50 100 150 200
Failu
re L
oad
(kN
)
No of days
Exp Conditioned
FEM Conditioned
Exp Dried
FEM Dried
0
1
2
3
4
5
6
7
8
9
0 0.2 0.4 0.6 0.8 1
Load
(kN
)
Displacement (mm)
Unconditioned
182 days

29
Figure 15: Plastic deformation in Al2024 O adherends after failure during tensile
testing (a) experimental (b) FEM.
Figure 16: Predicted and experimental failure load of the Al2024 O joints when
conditioned at 50°C.
0
2
4
6
8
10
0 50 100 150 200
Failu
re L
oad
(kN
)
No of days
Exp ConditionedFEM ConditionedExp DriedFEM Dried
(a)
(b)

30
(a)
(b) Load = 5.9 kN
(c) Load = 6.1 kN
(d) Load = 6.15 kN
(e) Load = 5.8 kN
Figure 17: Damage and crack propagation in unconditioned Al2024 T3 single lap joint.
A
X
Y
Y Z
Z
Dominant crack growth direction
Site of crack initiation
Dominant crack growth direction

31
(a) Load = 3.6 kN
(b) Load = 3.8 kN
(c) Load = 4 kN
(d) Load = 4.6 kN
Figure 18: Damage and crack propagation Al2024 T3 joints, conditioned at 50°C for
182 days.
X
Y
Y
Z
B
Dominant crack growth direction
Crack growth from edge Dominant
crack growth direction

32
Figure 19: Crack length of Al2024 T3 joints, conditioned at 50°C, as a function of
displacement.
0
1
2
3
4
5
6
7
0 0.05 0.1 0.15 0.2 0.25 0.3
Cra
ck L
en
gth
(mm
)
Displacement (mm)
Unconditioned
182 days

33
(a) Load = 3.2 kN
(b) Load = 3.6 kN
(c) Load = 3.8 kN
(d) Load = 4 kN
Figure 20: Damage and crack propagation in unconditioned Al2024 O single lap joint.
C
X
Y Z
Dominant crack growth direction
Dominant crack growth
direction

34
Figure 21: Site of crack initiation in unconditioned Al2024 T3 and O joints.
Crack initiation in O joints
Crack initiation in T3 joints

35
(a) Load = 2.2 kN
(b) Load = 2.4 kN
(c) Load = 2.6 kN
(d) Load = 2.9 kN
Figure 22: Damage and crack propagation Al2024 O single lap joint, conditioned at
50°C for 182 days.
X
Y Z
Dominant crack growth
direction
Dominant crack growth
direction

36
Figure 23: Crack length as a function of displacement in Al2024 O joints conditioned at
50°C.
0
1
2
3
4
5
0 0.2 0.4 0.6 0.8 1
Cra
ck L
en
gth
(mm
)
Displacement (mm)
Unconditioned
182 days
37
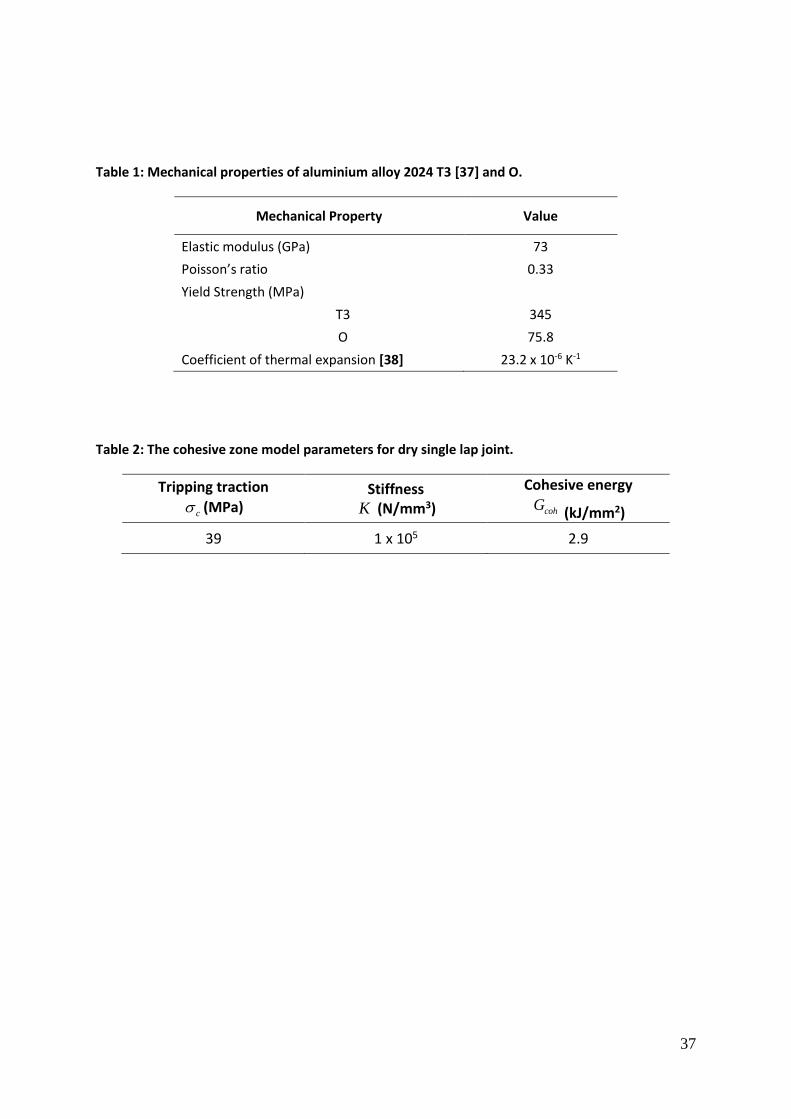
Table 1: Mechanical properties of aluminium alloy 2024 T3 [37] and O.
Mechanical Property Value
Elastic modulus (GPa) 73
Poisson’s ratio 0.33
Yield Strength (MPa)
T3 345
O 75.8
Coefficient of thermal expansion [38] 23.2 x 10⁻⁶ K-1
Table 2: The cohesive zone model parameters for dry single lap joint.
Tripping traction
c (MPa) Stiffness
K (N/mm3)
Cohesive energy
cohG (kJ/mm2)
39 1 x 10⁵ 2.9