Embed Size (px)
Citation preview

1STREAMS AND FLOODING
DEFINITIONS
Discharge (Q): The volume of water per unit time that passes a specified point on a stream. Discharge isconventionally measured in cubic feet per second (ft3/sec or cfs) or cubic meters per second (m3/sec orcms). Q = w d v where w = water width d = mean water depth v = mean water velocity
River stage or gage height: The elevation of the water surface in a stream.Rating curve (or stage-discharge curve): A graph relating stage (water height) to water discharge at a
point on the stream channel.Hydrograph: A graph showing how water discharge or stage varies with time at a point on a stream.Water year: For hydrologic purposes, we use the water year, which runs from October of one year through
September of the next. For example, water year 1990 extends from Oct. 1 1989 through Sept. 30 1990.The idea is to avoid splitting up winter storm flows between years.
Annual flood: The annual flood on a stream is the highest instantaneous peak discharge of the water year.
Flood magnitude: The size of a flood peak in discharge units (e.g., ft3/sec or m3/sec).Flood recurrence interval (or return period): The average time in years between flood events equal to or
greater than a specified magnitude.Flood-frequency curve: A graph showing the relationship between flood magnitude and their recurrence
interval for a specified site.Mean daily discharge: The average discharge of any specified calendar day (midnight to midnight). It is
calculated by taking the total volume of water discharged during that day and dividing by 86400, thenumber of second in a day
Flow-duration curve: A graph showing the percentage of time specified mean daily discharges are equalledor exceeded.
Mean annual discharge (Qav): The discharge that would have to flow constantly to equal the volume ofwater discharged by that stream over the entire period of years record. Qav is the total volume of waterdischarged by the stream during the period of record divided by the number of seconds in that period. It ismore easily calculated by averaging all the individual mean daily discharges.
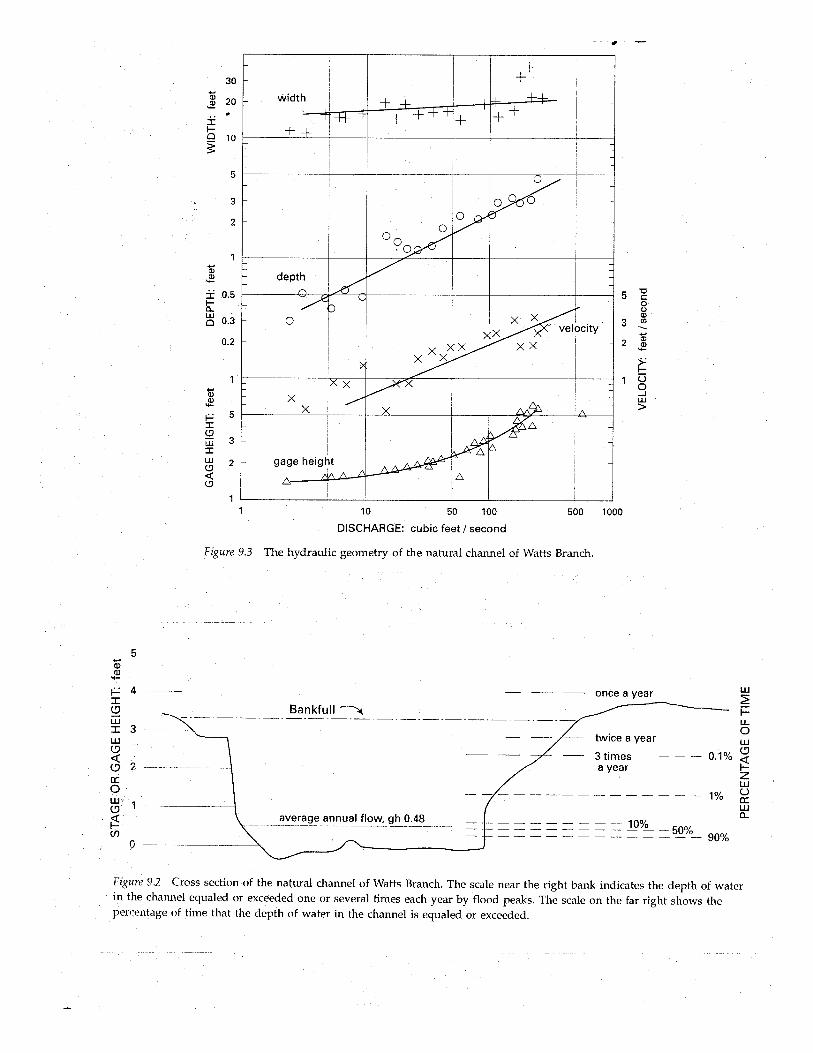
Hydraulic geometry: The hydraulic geometry of a stream is the set of relations which show how width,depth, velocity, and cross-sectional area of flow vary with increasing discharge. These relations take theform of power functions (straight lines on logarithmic graph paper).
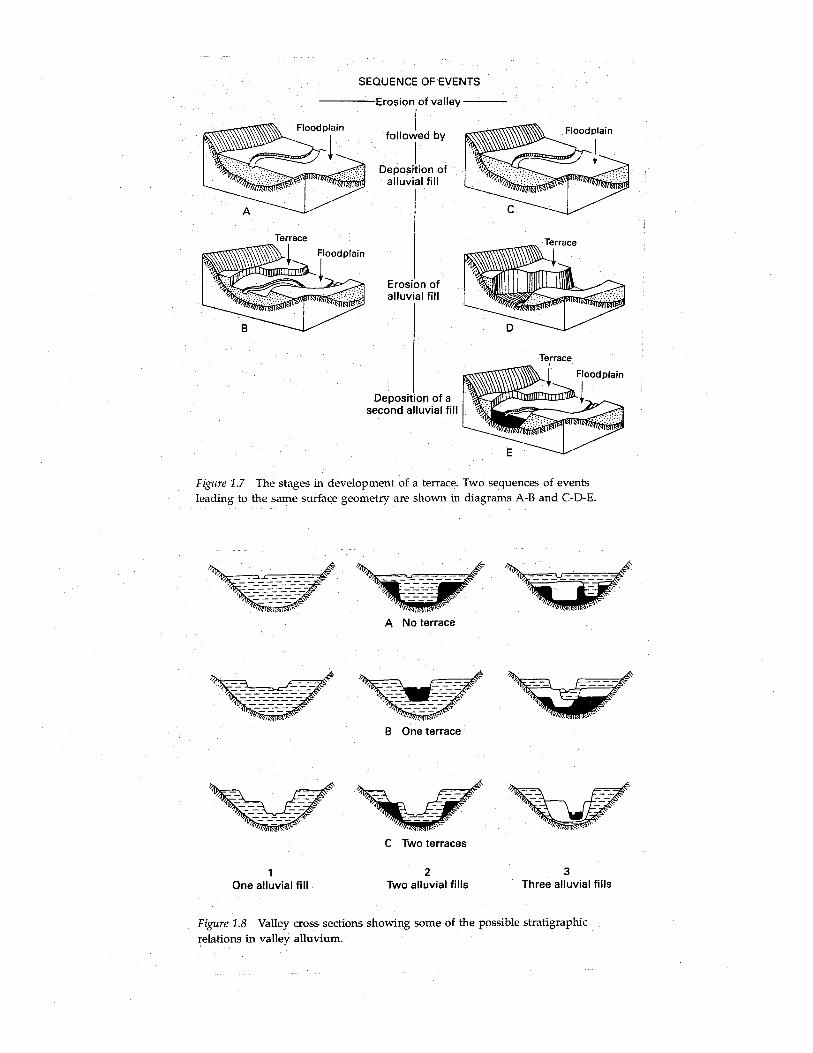
Floodplain: A level area near a river channel, constructed and maintained by the river in the present climateand overflowed during moderate flow events. The floodplain is largely built by the deposition ofsediments on the inside of bends (point bars), and erosion on the outside, together with some overbankdeposition. The floodplain is constantly reconstructed and maintained by the river. Not all streams haveobvious floodplains, especially if the stream is 1) small; 2) incided in bedrock; or 3) has recently downcut.
River terrace: An abandoned floodplain, left behind as the river downcuts. Downcutting may be caused bytectonic uplift, or by climatic change. Terraces may be occasionally inundated by floods, but they are nolonger actively maintained by the stream and are gradually consumed as the stream changes its course.Terraces that were cut across bedrock are called strath terraces.; fill terraces were formed by deposition ofsediment in the valley bottom.
Bankfull discharge: The water discharge at which the water just starts to leave the channel and spill overonto the floodplain. On many streams bankfull discharge has a recurrence interval of about 1.5 years.Bankfull discharge is very important in maintaining the channel geometry and pattern -- it is large enoughto transport appreciable sediment and to erode the banks, and it occurs frequently enough that it iseffective in shaping the channel.
Point bar: A bar built on the inside of a bend where the water is slower and the sediment transported by thestream can settle out. The top of the upstream end point bar is approximately the elevation of thefloodplain.
Riffle: A shallower, steeper part of the stream channel, typically of gravel. Riffles alternate with pools,which are deeper and have a flat water surface at low flow.
2
FLOOD-FREQUENCY COMPUTATION
INTRODUCTION
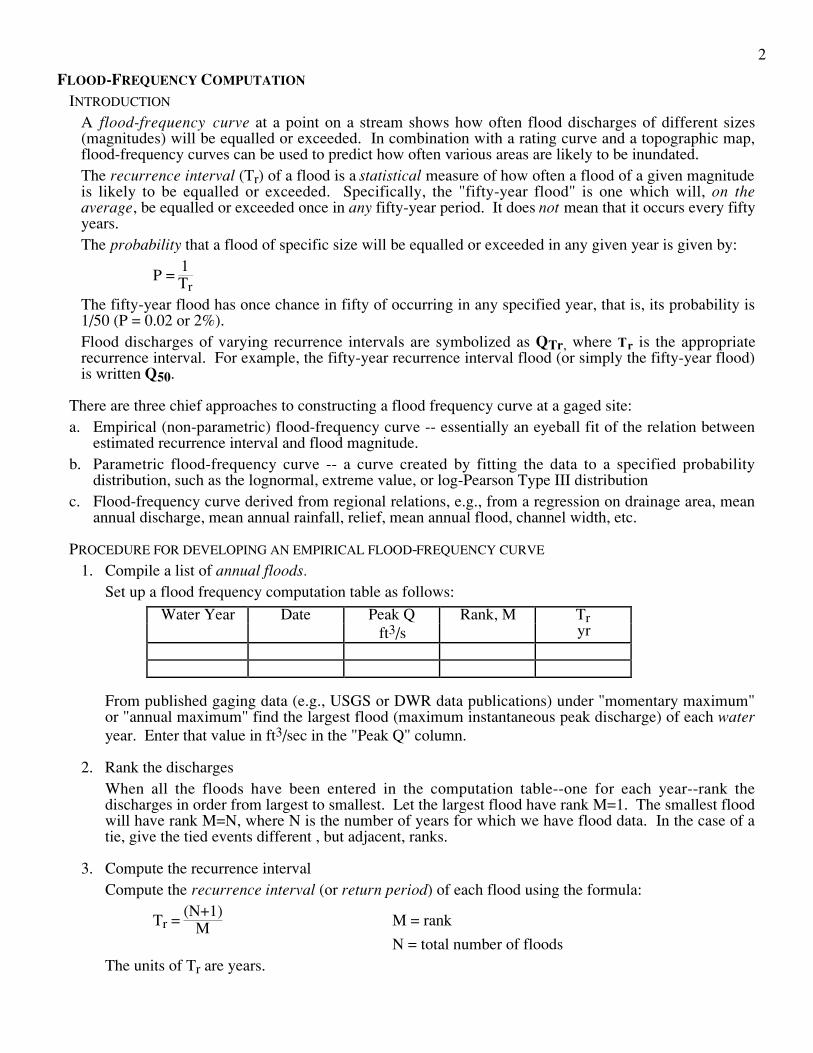
A flood-frequency curve at a point on a stream shows how often flood discharges of different sizes(magnitudes) will be equalled or exceeded. In combination with a rating curve and a topographic map,flood-frequency curves can be used to predict how often various areas are likely to be inundated.The recurrence interval (Tr) of a flood is a statistical measure of how often a flood of a given magnitudeis likely to be equalled or exceeded. Specifically, the "fifty-year flood" is one which will, on theaverage, be equalled or exceeded once in any fifty-year period. It does not mean that it occurs every fiftyyears.The probability that a flood of specific size will be equalled or exceeded in any given year is given by:
P = 1Tr
The fifty-year flood has once chance in fifty of occurring in any specified year, that is, its probability is1/50 (P = 0.02 or 2%).Flood discharges of varying recurrence intervals are symbolized as QTr, where Tr is the appropriaterecurrence interval. For example, the fifty-year recurrence interval flood (or simply the fifty-year flood)is written Q50.
There are three chief approaches to constructing a flood frequency curve at a gaged site:a. Empirical (non-parametric) flood-frequency curve -- essentially an eyeball fit of the relation between
estimated recurrence interval and flood magnitude.b. Parametric flood-frequency curve -- a curve created by fitting the data to a specified probability
distribution, such as the lognormal, extreme value, or log-Pearson Type III distributionc. Flood-frequency curve derived from regional relations, e.g., from a regression on drainage area, mean
annual discharge, mean annual rainfall, relief, mean annual flood, channel width, etc.
PROCEDURE FOR DEVELOPING AN EMPIRICAL FLOOD-FREQUENCY CURVE
1. Compile a list of annual floods.Set up a flood frequency computation table as follows:
Water Year Date Peak Q Rank, M Trft3/s yr
From published gaging data (e.g., USGS or DWR data publications) under "momentary maximum"or "annual maximum" find the largest flood (maximum instantaneous peak discharge) of each wateryear. Enter that value in ft3/sec in the "Peak Q" column.
2. Rank the dischargesWhen all the floods have been entered in the computation table--one for each year--rank thedischarges in order from largest to smallest. Let the largest flood have rank M=1. The smallest floodwill have rank M=N, where N is the number of years for which we have flood data. In the case of atie, give the tied events different , but adjacent, ranks.
3. Compute the recurrence intervalCompute the recurrence interval (or return period) of each flood using the formula:
Tr = (N+1)
M M = rank
N = total number of floodsThe units of Tr are years.

34. Plot the discharges on flood-frequency paper
Plot each flood discharge versus its Tr on either arithmetic or logarithmic extreme-value floodfrequency paper. Fit a smooth curve through the points. Note that this is a best-fit-by-eye curve, notfollow the dots. You are trying to extract a general trend from the data. Because we do not havemuch data to define the uppermost end of the curve, we should not try slavishly to fit the line throughthe uppermost points--instead, we need to look at the overall trend of the curve (c.f. Dunne &Leopold p. 305-313.) Note: In fitting the curve, don't give too much weight to the position of thelargest 2 or 3 floods if the sample size is small (n < 25). They are probably plotting to the left ofwhere they would correctly plot if we had a longer record.This graph is the flood-frequency relation for the gaging station, based on the N years of dataavailable to us. The relation would change if we had more years of data available.
5. It is often a good idea to draw confidence bands around the flood-frequency curve. A procedure fordoing this is described on p. 308-09 of Dunne & Leopold.
6. From this curve you can read off the estimated flood discharge corresponding to different recurrenceintervals (e.g. 1.5-yr, 5-yr, 10-yr, 50-yr floods). To get the floods for larger recurrence intervals(ones beyond the limits of your plotted data), you will have to cautiously extrapolate the flood-frequency curve. There will be substantial error in these estimates when the period of record is short.
USEFUL WEB LINKS
Streamflow DataReal-time water discharge at selected northern California gaging stations (USGS)http://wwwdcascr.wr.usgs.gov/Sites/h1801.htmlReal-time water discharge and rainfall at selected northern California stations (Calif Data Exchange Center)http://cdec.water.ca.gov/queryQuick.htmlCalifornia River Forecast Centerhttp://www.wrh.noaa.gov/cnrfc/
Weather ForecastsRedwood Coast Weather Forecasthttp://www.wrh.noaa.gov/cgi-
bin/wrhq/TotalForecast.csh?TotalForecast+WR+CA+001+023+MAPCOORDS^41^198Redwood Coast Forecast Discussionhttp://www.wrh.noaa.gov/cgi-bin/Eureka/getproduct.pl?SFOAFDEKA
Weather Maps & Satellite Images4km Weather Satellite Photohttp://defiant.wrh.noaa.gov/CURRENT/VIS4NW.GIF1km Weather Satellite Photohttp://defiant.wrh.noaa.gov/CURRENT/VIS1EKA.GIFWeather Radar Imagehttp://www.intellicast.com/LocalWeather/World/UnitedStates/Southwest/California/Eureka/BaseReflectivity4km Water Vapor Imagehttp://www.wrh.noaa.gov/satellite/4km/WR/WV4.GIF16km Water Vapor Imagehttp://www.wrh.noaa.gov/satellite/16km/WV16.GIFRainfall Maphttp://www.intellicast.com/LocalWeather/World/UnitedStates/Southwest/California/Eureka/Precipitation/California Precipitation Maps (CDEC)http://cdec.water.ca.gov/precip_maps/pcpmaps.html

4NOAA 24-hr Precip Maphttp://nimbo.wrh.noaa.gov/cnrfc/prods/nc_pcp24.gif
Other ResourcesEPA Surf Your Watershedhttp://www.epa.gov/surf/US Forest Service Redwood Sciences Labhttp://www.rsl.psw.fs.fed.usUS Forest Service Stream Teamhttp://www.stream.fs.fed.us/Watershed Management Councilhttp://www.watershed.org
My own extensive browser-ready set of weather, water, and earth-science bookmarks is available athttp://www.humboldt.edu/~geodept/geology700/geo700_akl_bookmarks.html