Embed Size (px)
Citation preview
Streamflow variation in Poudre River
Robert T Milhous
Abstract
The Cache la Poudre (Poudre) River has a history high streamflow variation sometimes caused bynatural factors but mostly caused by many diversions from the river and discharges to the river. Twotopics are addressed in this presentation. The first topic is to develop an understanding of the causes ofthe high variation and the second is to quantify the high variation indexes that allow comparison ofrivers, differences between locations on the same river, and changes from year to year. Thispresentation mostly deals with the second topic. The variation of streamflows at a gage at the mouth ofPoudre Canyon has been used as somewhat representative of 'natural' flows. This presentation showsthat this assumption is useful but not quite true because of storage and releases of water from reservoirsin the basin, at least one major diversions from the river, and transfer of water from adjacent basins tothe Poudre Basin. The second topic, variation indexes, is presented by using two indexes to flashiness.One is the Richards-Baker Flashiness Index – measure of the average change in discharge betweendays to the average discharge. The second index is a Flashiness Index that is a measure of the averagedaily fractional change in discharge. As an example, the Flashiness Index variation along the riverduring water year 2010 was 0.13 at the canyon mouth, downstream at Fort Collins 0.23 and furtherdownstream above Boxelder Creek 0.23. The index on a nearby river with no diversions and storagewas 0.10. The limit of the index is 0.0 (no change) and 2.0 (total loss and gain between days).
References
Baker, D.B., R.P. Richards, T.T. Loftus, and J.W. Kramer. 2004. A new flashiness index: characteristicsand applications to mid western rivers and streams. Journal of the American Water ResourcesAssociation 40 (2): 503-522.
Booth, D.B., J.R. Karr, S. Schauman, C.P. Konrad, S.A. Morley, M.G. Laron, and S.J. Burges. 2004.Reviving urban streams: land use, hydrology, biology, and human behavior. Journal of American WaterResources Association. 40(5): 1351 – 1364.
Slide 1. Title slide
There are two topics that could be address in a paper on high streamflow variation. One is to developan understanding of the causes of the high variation and the second is to quantify the high variation thatallows comparison of rivers and changes from years to year. This presentation deals mostly with thesecond topic.
Streamflow variation in Poudre River
Robert T Milhous
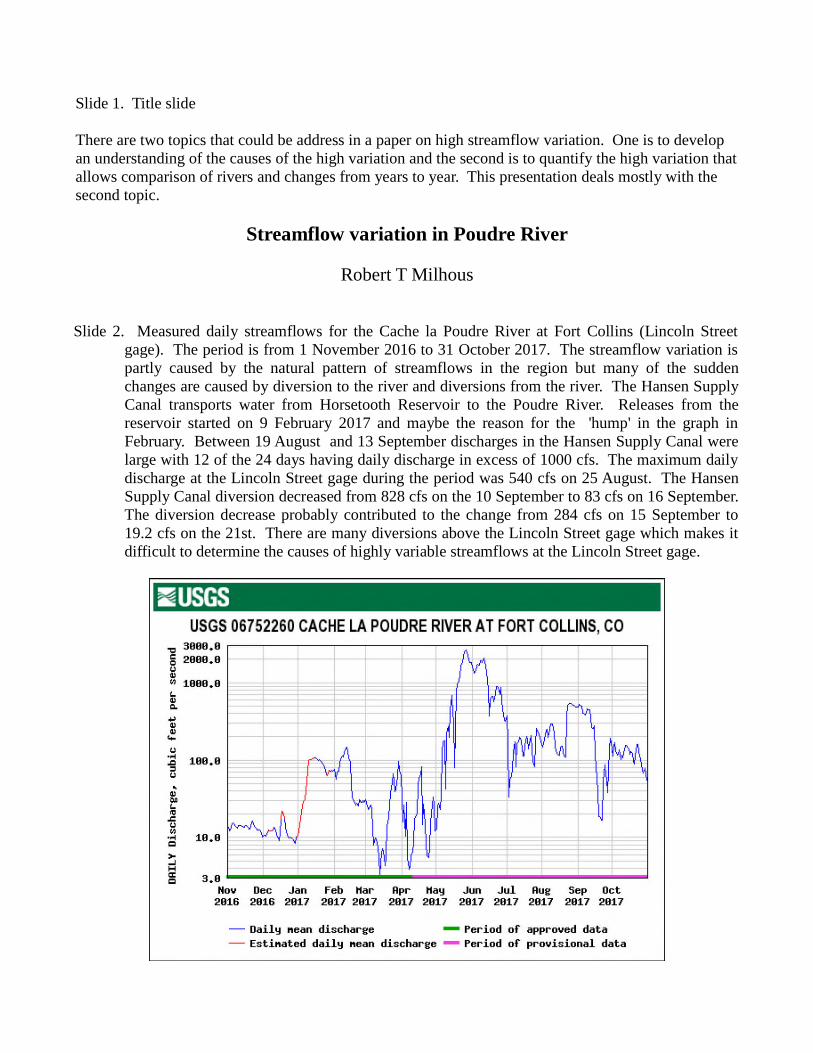
Slide 2. Measured daily streamflows for the Cache la Poudre River at Fort Collins (Lincoln Streetgage). The period is from 1 November 2016 to 31 October 2017. The streamflow variation ispartly caused by the natural pattern of streamflows in the region but many of the suddenchanges are caused by diversion to the river and diversions from the river. The Hansen SupplyCanal transports water from Horsetooth Reservoir to the Poudre River. Releases from thereservoir started on 9 February 2017 and maybe the reason for the 'hump' in the graph inFebruary. Between 19 August and 13 September discharges in the Hansen Supply Canal werelarge with 12 of the 24 days having daily discharge in excess of 1000 cfs. The maximum dailydischarge at the Lincoln Street gage during the period was 540 cfs on 25 August. The HansenSupply Canal diversion decreased from 828 cfs on the 10 September to 83 cfs on 16 September.The diversion decrease probably contributed to the change from 284 cfs on 15 September to19.2 cfs on the 21st. There are many diversions above the Lincoln Street gage which makes itdifficult to determine the causes of highly variable streamflows at the Lincoln Street gage.
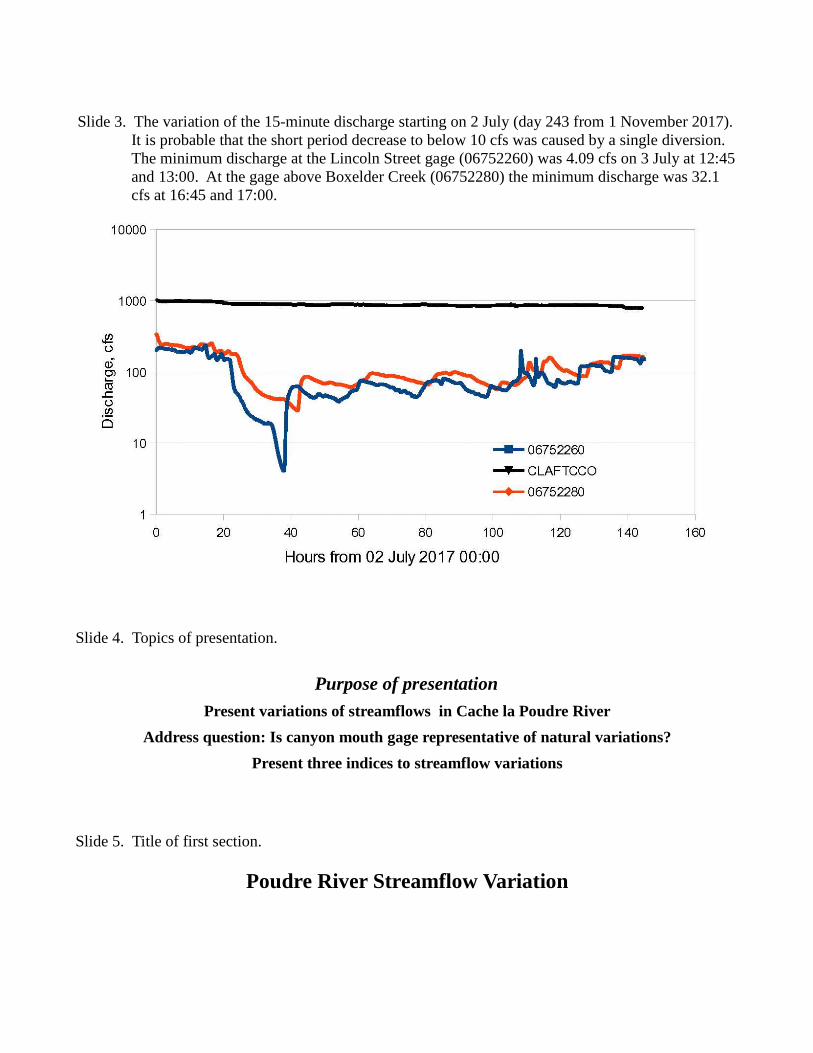
Slide 3. The variation of the 15-minute discharge starting on 2 July (day 243 from 1 November 2017).It is probable that the short period decrease to below 10 cfs was caused by a single diversion.The minimum discharge at the Lincoln Street gage (06752260) was 4.09 cfs on 3 July at 12:45and 13:00. At the gage above Boxelder Creek (06752280) the minimum discharge was 32.1cfs at 16:45 and 17:00.
Slide 4. Topics of presentation.
Purpose of presentation
Present variations of streamflows in Cache la Poudre River
Address question: Is canyon mouth gage representative of natural variations?
Present three indices to streamflow variations
Slide 5. Title of first section.
Poudre River Streamflow Variation
Slide 6. Map showing location of river near Fort Collins. The station ID's used are
HSCCLPCO Hansen Supply Canal 20' flumeCLAFTCCO Cache la Poudre River at Canyon Mouth (also 06752000)CLANSECO North Fork Cache la Poudre River below Seaman ReservoirMUNCANCO Munroe CanalLAPTUNCO Laramie Poudre Tunnel @ 10 ft Parshall FlumeLAPLODCO La Poudre Pass Creek below Long Draw ReservoirMICDCPCO Michigan Ditch at Cameron PassGRNDRDCP Grand River Ditch at La Poudre Pass06746110 Joe Wright Creek below Joe Wright Reservoirs06752260 Cache la Poudre River at Fort Collins06752280 Cache la Poudre River above Boxelder Creek402114105350101 Big Thompson River below Moraine Park
Slide 7. Diversion structure in Laporte. Picture take on 12 November 2017 @ 12:12 MST. Thediversion is for Little Cache la Poudre Ditch. (The Taylor and Gill Ditch is at nearly the samelocation- the canals are right next to each other but Taylor and Gill Ditch is much the smaller.)The diversion from the river is a 'U' and both the Little Cache la Poudre Ditch. and the Taylorand Gill Ditch divert water from the 'U'. The 'U' has flow in it even when there is no diversionby either ditch
The two pictures of low flows caused by the diversion in Laporte were taken on 9 Novemberabout 14:30 MST. On 9 November the streamflows measured at the Lincoln Street gage were13.9 cfs at 14:30 and 13.5 cfs at 18:30. The picture taken after diversion ceased was takenabout 13:30 on 14 November. On the 14th the stream flows were 72.9 cfs at 13:30 and 61.6 cfsat 17:30.
Even though there was almost now flow there were shallow pools. question relevant to therelative shot periods of low flows is how can time be included in the analysis of streamflowvariations. The same low flow will have a different impact on the fluvial depending on howlong the low flow persists.
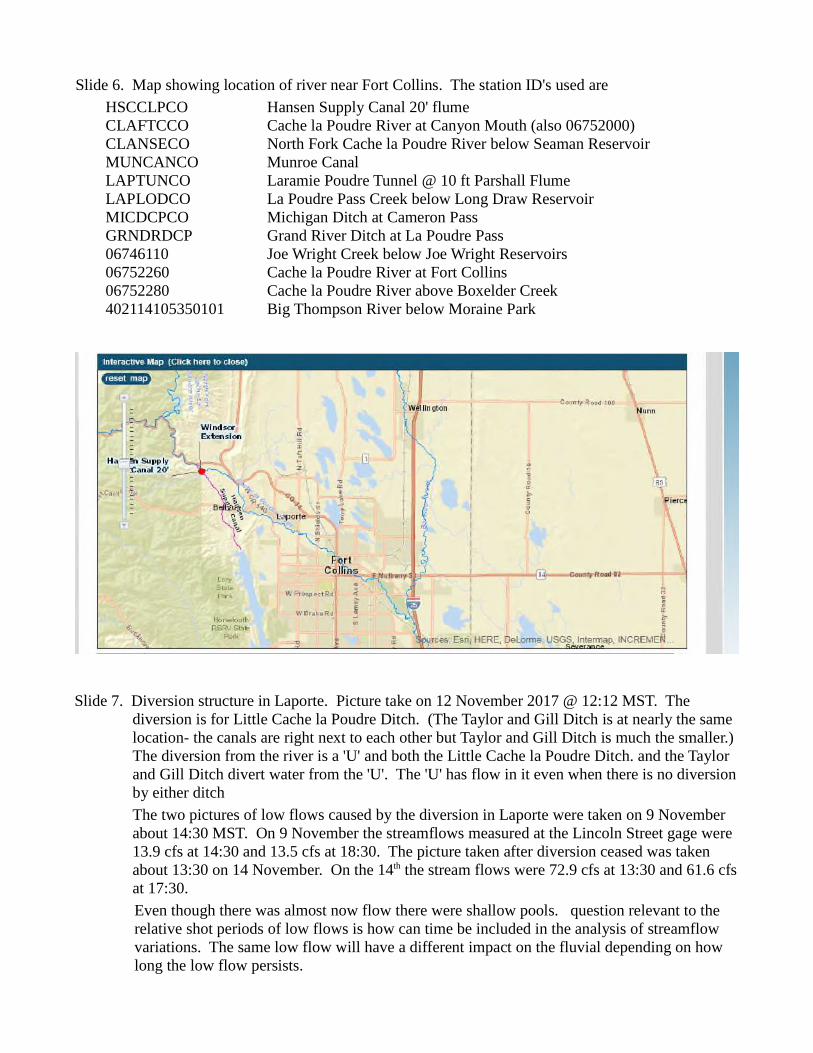
Slide 8. Right channel downstream of trail bridge. Picture taken 09 November 2017 @14:30 MST
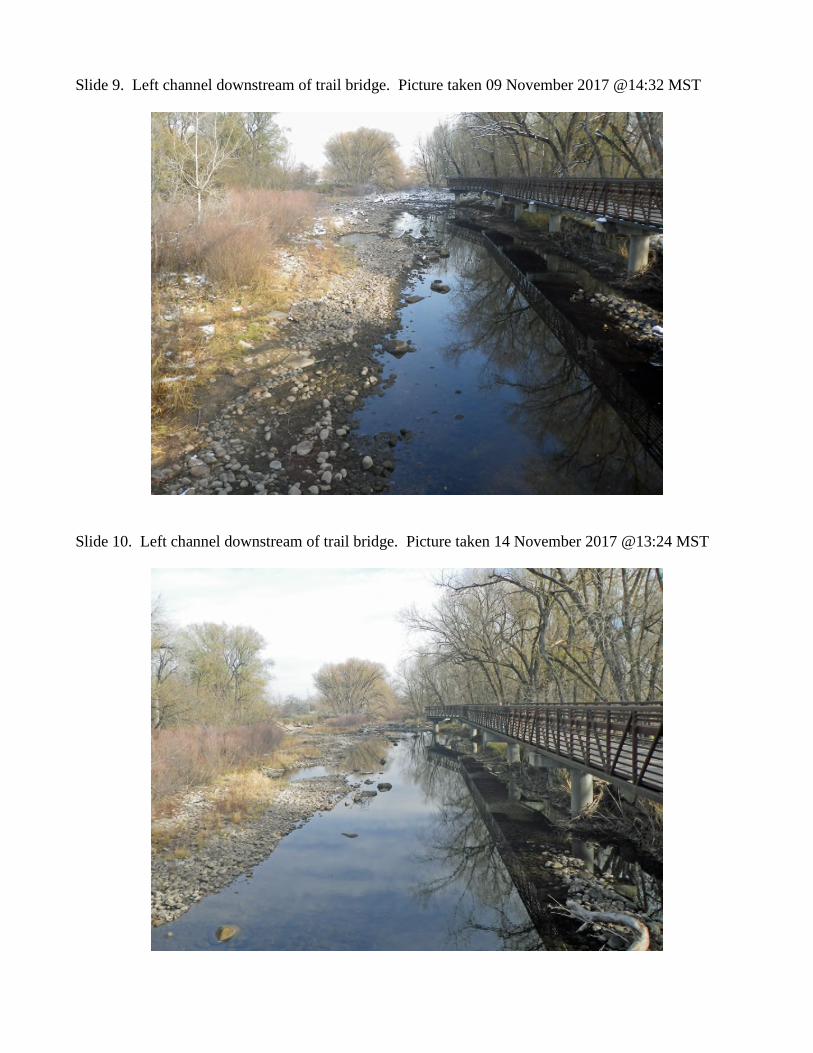
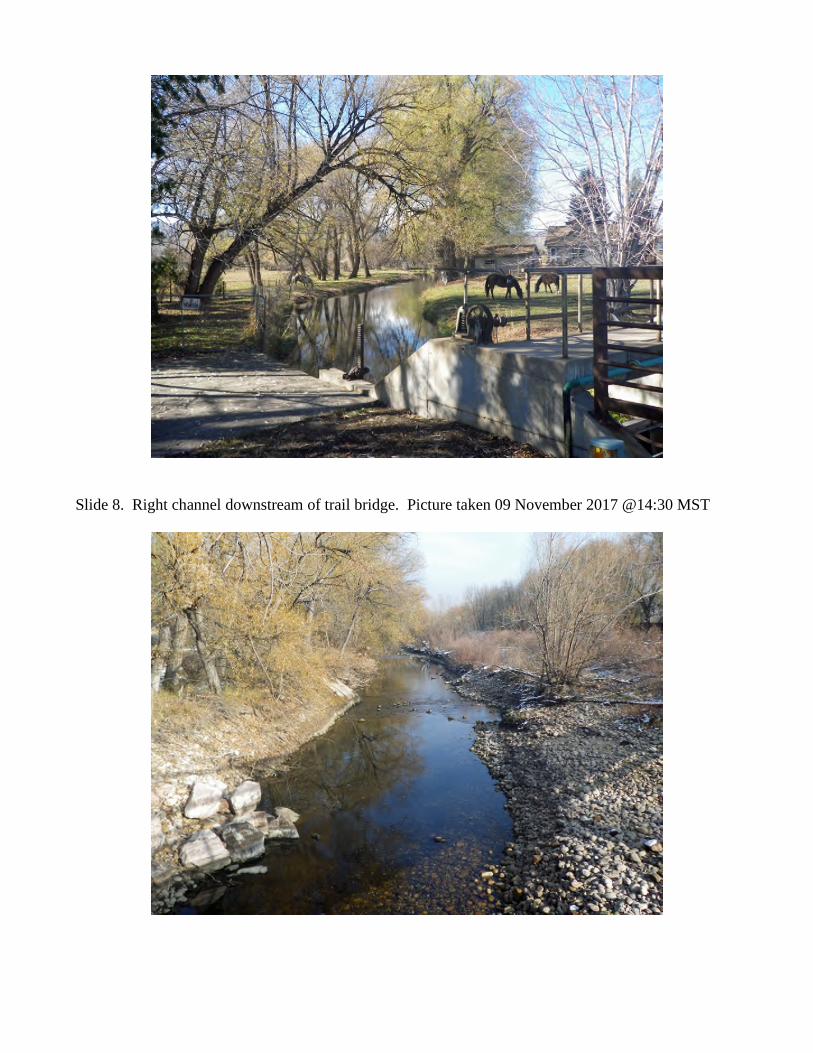
Slide 9. Left channel downstream of trail bridge. Picture taken 09 November 2017 @14:32 MST
Slide 10. Left channel downstream of trail bridge. Picture taken 14 November 2017 @13:24 MST
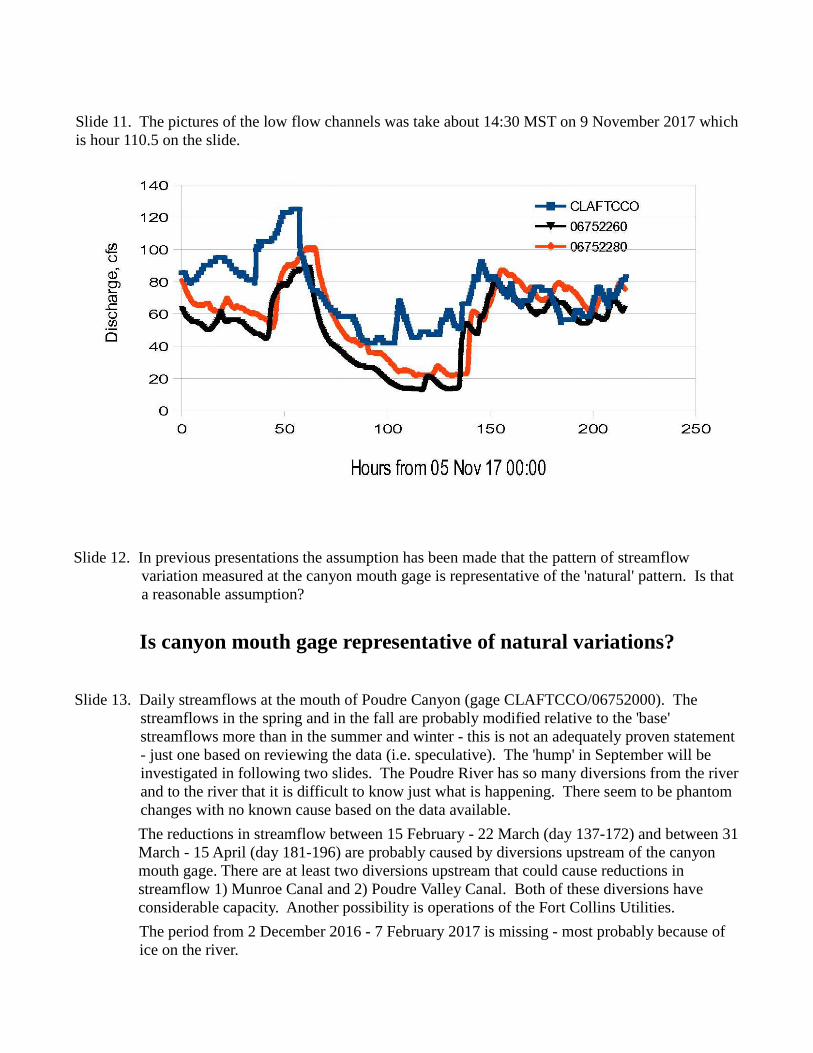
Slide 11. The pictures of the low flow channels was take about 14:30 MST on 9 November 2017 whichis hour 110.5 on the slide.
Slide 12. In previous presentations the assumption has been made that the pattern of streamflowvariation measured at the canyon mouth gage is representative of the 'natural' pattern. Is thata reasonable assumption?
Is canyon mouth gage representative of natural variations?
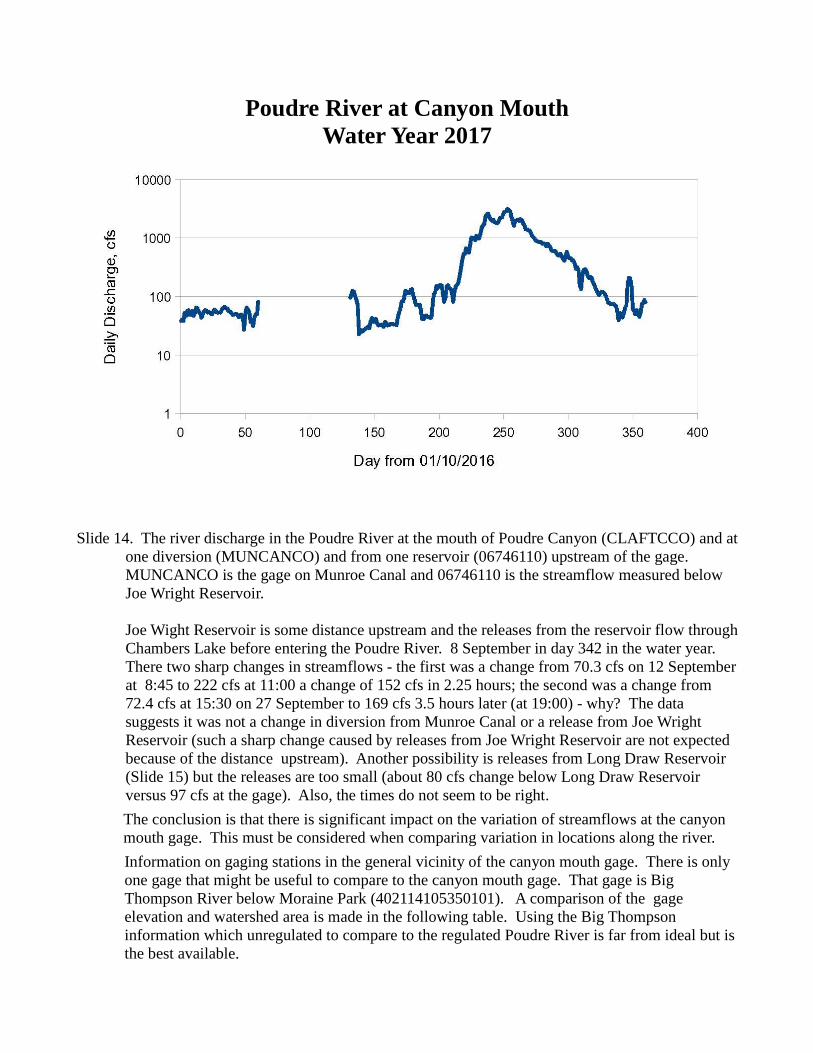
Slide 13. Daily streamflows at the mouth of Poudre Canyon (gage CLAFTCCO/06752000). Thestreamflows in the spring and in the fall are probably modified relative to the 'base'streamflows more than in the summer and winter - this is not an adequately proven statement- just one based on reviewing the data (i.e. speculative). The 'hump' in September will beinvestigated in following two slides. The Poudre River has so many diversions from the riverand to the river that it is difficult to know just what is happening. There seem to be phantomchanges with no known cause based on the data available.
The reductions in streamflow between 15 February - 22 March (day 137-172) and between 31March - 15 April (day 181-196) are probably caused by diversions upstream of the canyonmouth gage. There are at least two diversions upstream that could cause reductions instreamflow 1) Munroe Canal and 2) Poudre Valley Canal. Both of these diversions haveconsiderable capacity. Another possibility is operations of the Fort Collins Utilities.
The period from 2 December 2016 - 7 February 2017 is missing - most probably because ofice on the river.
Poudre River at Canyon MouthWater Year 2017
Slide 14. The river discharge in the Poudre River at the mouth of Poudre Canyon (CLAFTCCO) and atone diversion (MUNCANCO) and from one reservoir (06746110) upstream of the gage.MUNCANCO is the gage on Munroe Canal and 06746110 is the streamflow measured belowJoe Wright Reservoir.
Joe Wight Reservoir is some distance upstream and the releases from the reservoir flow throughChambers Lake before entering the Poudre River. 8 September in day 342 in the water year.There two sharp changes in streamflows - the first was a change from 70.3 cfs on 12 Septemberat 8:45 to 222 cfs at 11:00 a change of 152 cfs in 2.25 hours; the second was a change from72.4 cfs at 15:30 on 27 September to 169 cfs 3.5 hours later (at 19:00) - why? The datasuggests it was not a change in diversion from Munroe Canal or a release from Joe WrightReservoir (such a sharp change caused by releases from Joe Wright Reservoir are not expectedbecause of the distance upstream). Another possibility is releases from Long Draw Reservoir(Slide 15) but the releases are too small (about 80 cfs change below Long Draw Reservoirversus 97 cfs at the gage). Also, the times do not seem to be right.
The conclusion is that there is significant impact on the variation of streamflows at the canyonmouth gage. This must be considered when comparing variation in locations along the river.
Information on gaging stations in the general vicinity of the canyon mouth gage. There is onlyone gage that might be useful to compare to the canyon mouth gage. That gage is BigThompson River below Moraine Park (402114105350101). A comparison of the gageelevation and watershed area is made in the following table. Using the Big Thompsoninformation which unregulated to compare to the regulated Poudre River is far from ideal but isthe best available.
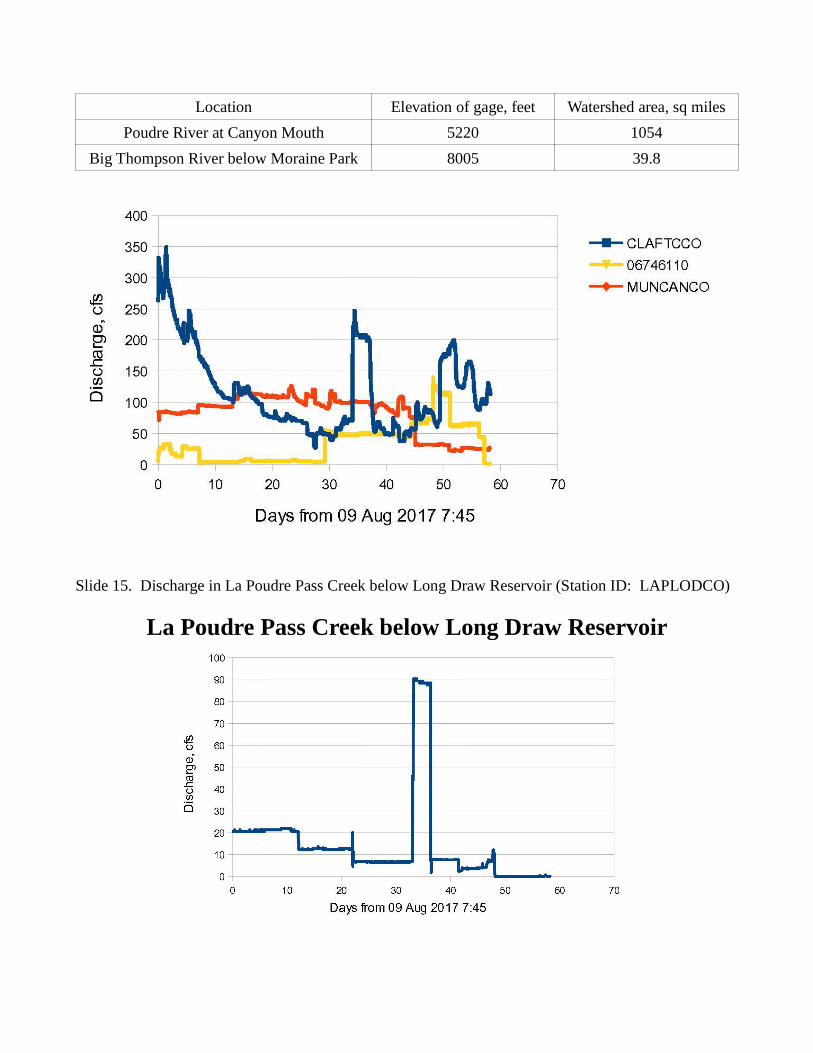
Location Elevation of gage, feet Watershed area, sq miles
Poudre River at Canyon Mouth 5220 1054
Big Thompson River below Moraine Park 8005 39.8
Slide 15. Discharge in La Poudre Pass Creek below Long Draw Reservoir (Station ID: LAPLODCO)
La Poudre Pass Creek below Long Draw Reservoir
Slide 16. Title of third section
Three indices to streamflow variations
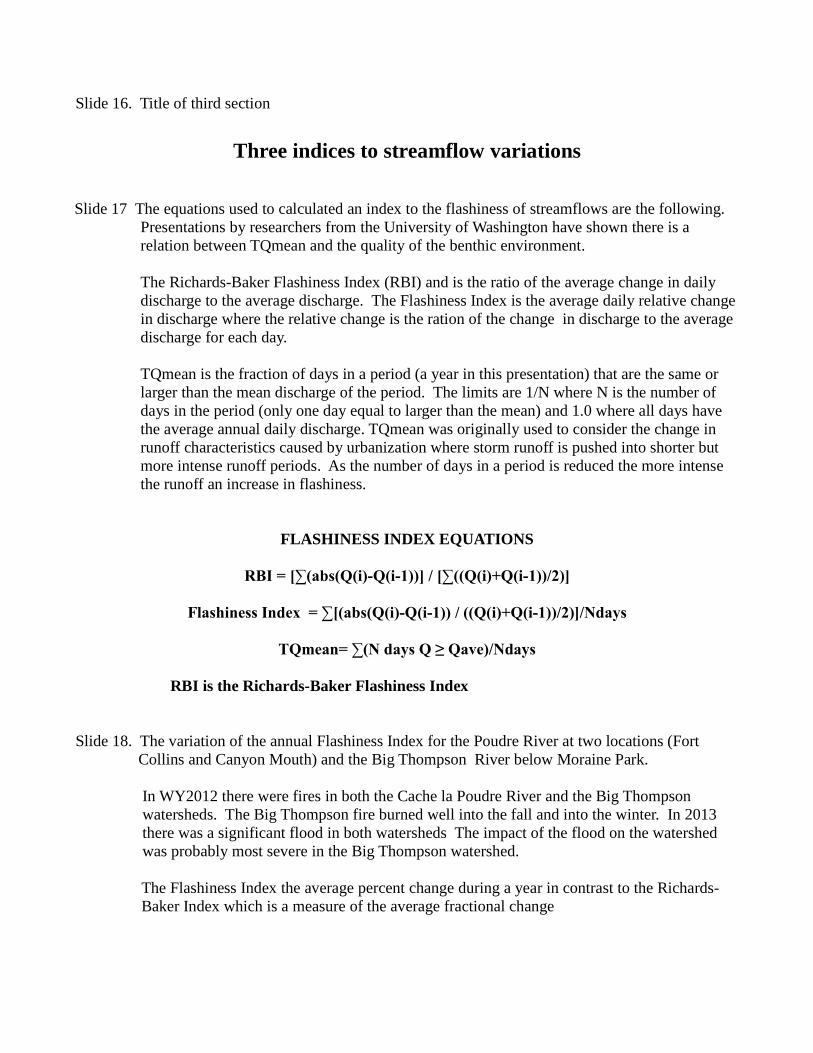
Slide 17 The equations used to calculated an index to the flashiness of streamflows are the following.Presentations by researchers from the University of Washington have shown there is arelation between TQmean and the quality of the benthic environment.
The Richards-Baker Flashiness Index (RBI) and is the ratio of the average change in dailydischarge to the average discharge. The Flashiness Index is the average daily relative changein discharge where the relative change is the ration of the change in discharge to the averagedischarge for each day.
TQmean is the fraction of days in a period (a year in this presentation) that are the same orlarger than the mean discharge of the period. The limits are 1/N where N is the number ofdays in the period (only one day equal to larger than the mean) and 1.0 where all days havethe average annual daily discharge. TQmean was originally used to consider the change inrunoff characteristics caused by urbanization where storm runoff is pushed into shorter butmore intense runoff periods. As the number of days in a period is reduced the more intensethe runoff an increase in flashiness.
FLASHINESS INDEX EQUATIONS
RBI = [∑(abs(Q(i)-Q(i-1))] / [∑((Q(i)+Q(i-1))/2)]
Flashiness Index = ∑[(abs(Q(i)-Q(i-1)) / ((Q(i)+Q(i-1))/2)]/Ndays
TQmean= ∑(N days Q ≥ Qave)/Ndays
RBI is the Richards-Baker Flashiness Index
Slide 18. The variation of the annual Flashiness Index for the Poudre River at two locations (FortCollins and Canyon Mouth) and the Big Thompson River below Moraine Park.
In WY2012 there were fires in both the Cache la Poudre River and the Big Thompsonwatersheds. The Big Thompson fire burned well into the fall and into the winter. In 2013there was a significant flood in both watersheds The impact of the flood on the watershedwas probably most severe in the Big Thompson watershed.
The Flashiness Index the average percent change during a year in contrast to the Richards-Baker Index which is a measure of the average fractional change
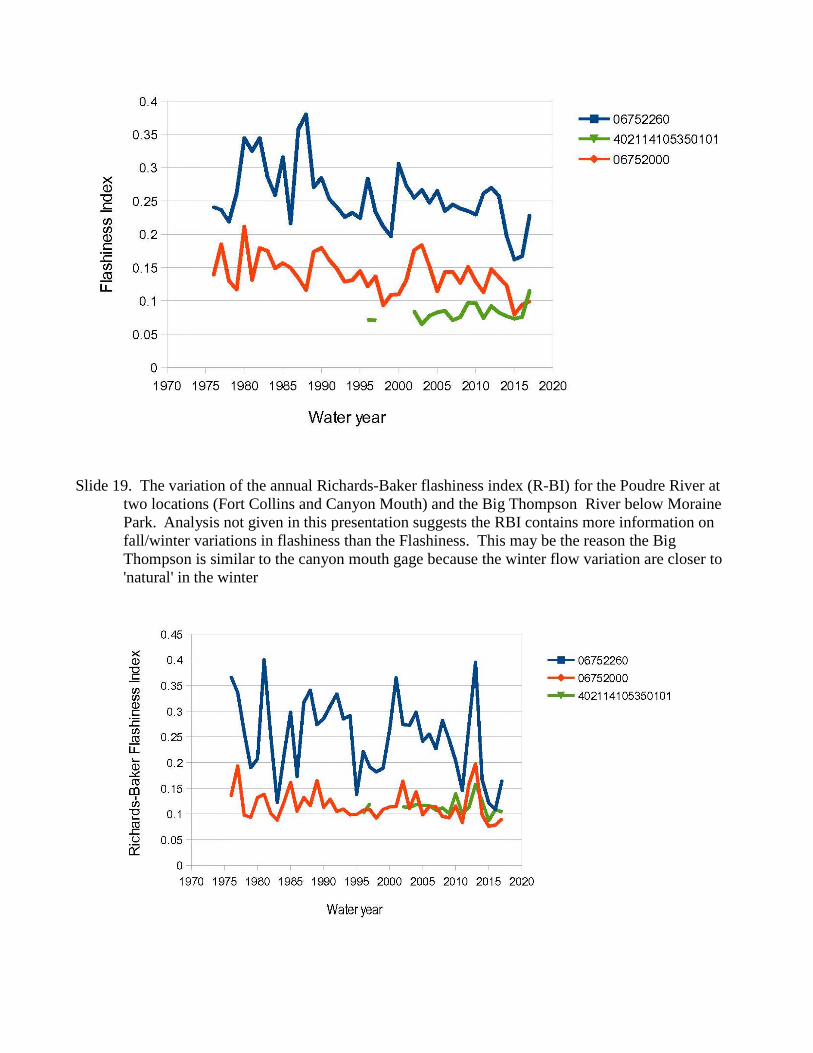
Slide 19. The variation of the annual Richards-Baker flashiness index (R-BI) for the Poudre River attwo locations (Fort Collins and Canyon Mouth) and the Big Thompson River below MorainePark. Analysis not given in this presentation suggests the RBI contains more information onfall/winter variations in flashiness than the Flashiness. This may be the reason the BigThompson is similar to the canyon mouth gage because the winter flow variation are closer to'natural' in the winter
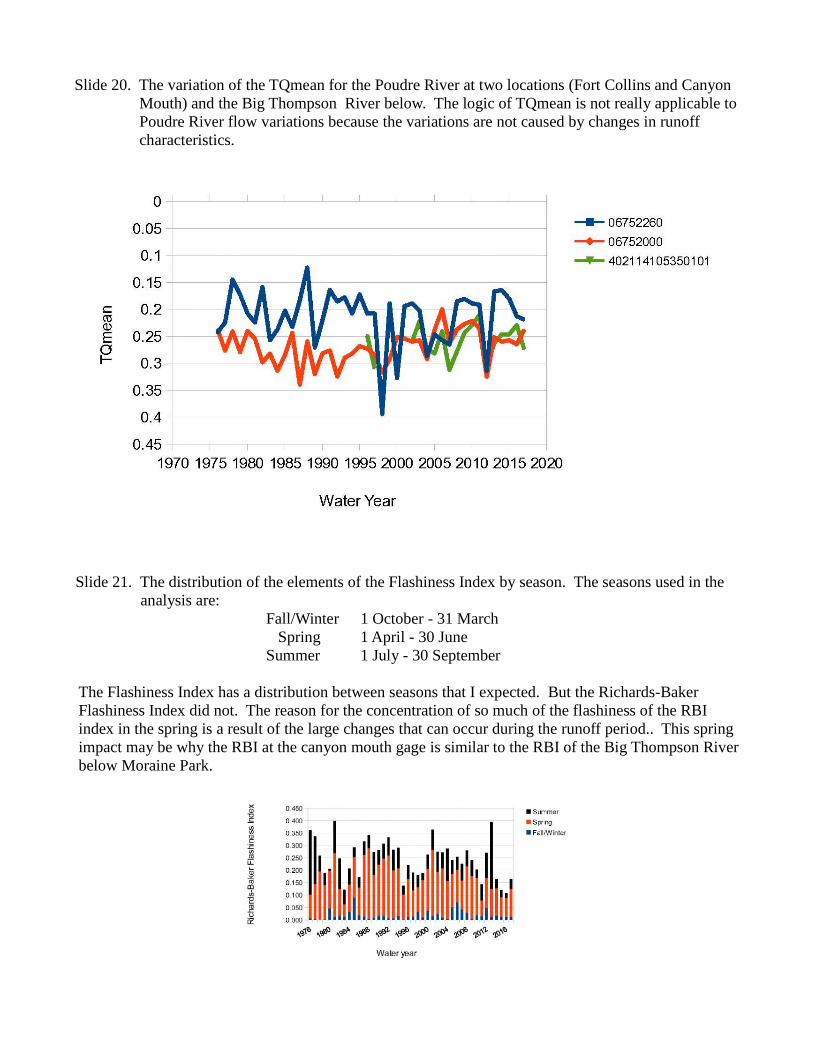
Slide 20. The variation of the TQmean for the Poudre River at two locations (Fort Collins and CanyonMouth) and the Big Thompson River below. The logic of TQmean is not really applicable toPoudre River flow variations because the variations are not caused by changes in runoffcharacteristics.
Slide 21. The distribution of the elements of the Flashiness Index by season. The seasons used in theanalysis are:
Fall/Winter 1 October - 31 MarchSpring 1 April - 30 June
Summer 1 July - 30 September
The Flashiness Index has a distribution between seasons that I expected. But the Richards-BakerFlashiness Index did not. The reason for the concentration of so much of the flashiness of the RBIindex in the spring is a result of the large changes that can occur during the runoff period.. This springimpact may be why the RBI at the canyon mouth gage is similar to the RBI of the Big Thompson Riverbelow Moraine Park.
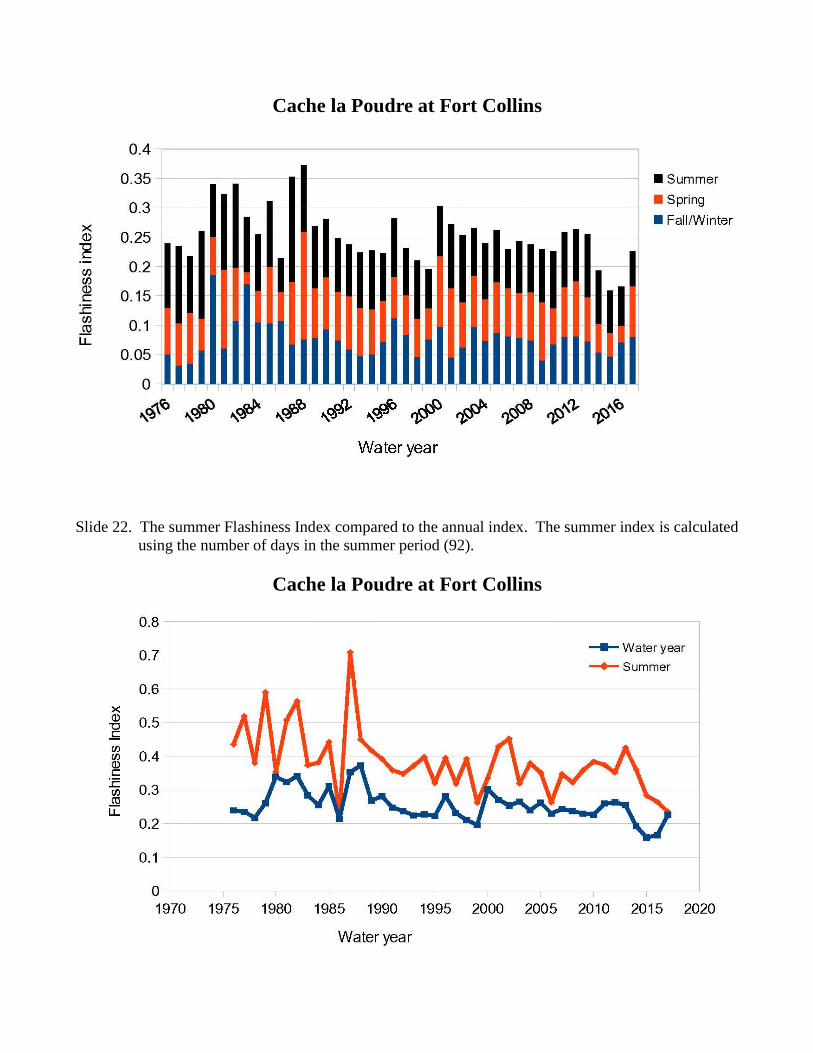
Cache la Poudre at Fort Collins
Slide 22. The summer Flashiness Index compared to the annual index. The summer index is calculatedusing the number of days in the summer period (92).
Cache la Poudre at Fort Collins
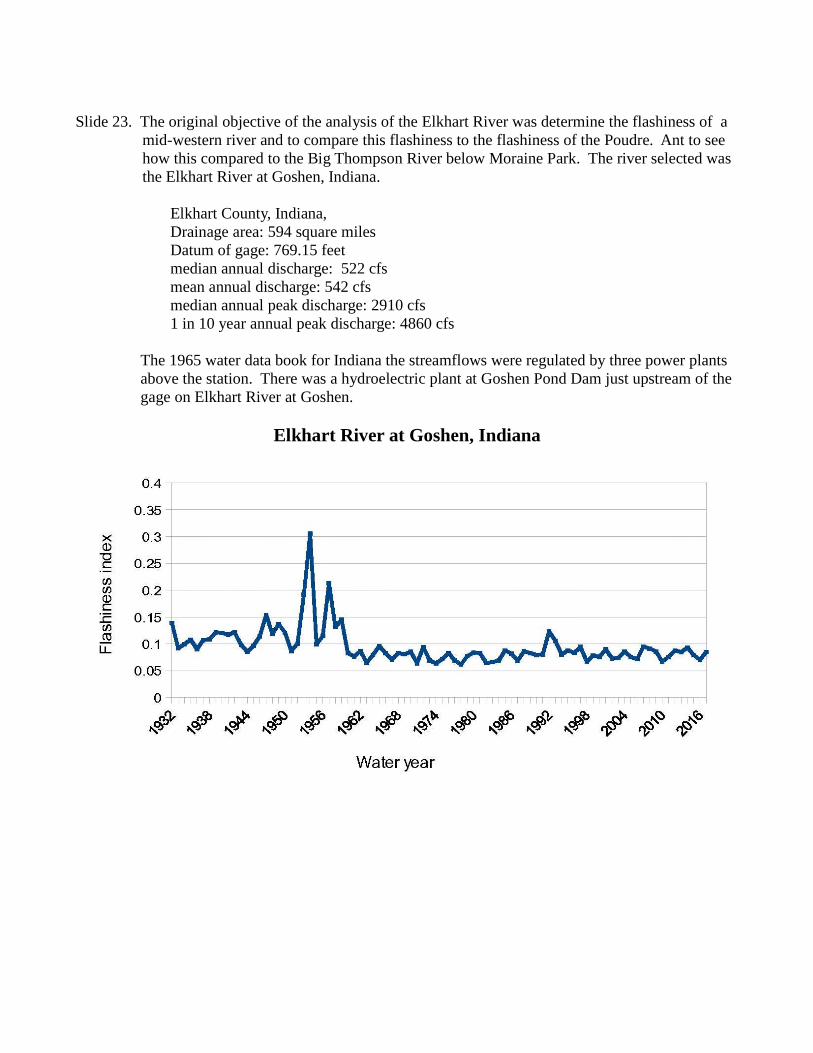
Slide 23. The original objective of the analysis of the Elkhart River was determine the flashiness of amid-western river and to compare this flashiness to the flashiness of the Poudre. Ant to seehow this compared to the Big Thompson River below Moraine Park. The river selected wasthe Elkhart River at Goshen, Indiana.
Elkhart County, Indiana,Drainage area: 594 square milesDatum of gage: 769.15 feetmedian annual discharge: 522 cfsmean annual discharge: 542 cfsmedian annual peak discharge: 2910 cfs1 in 10 year annual peak discharge: 4860 cfs
The 1965 water data book for Indiana the streamflows were regulated by three power plantsabove the station. There was a hydroelectric plant at Goshen Pond Dam just upstream of thegage on Elkhart River at Goshen.
Elkhart River at Goshen, Indiana
Slide 24 End picture. This presentation is kind-of squirrely.