Embed Size (px)
Citation preview


Streambed Adjustment and Channel Widening in Eastern Nebraska
By David L. Rus, Benjamin J. Dietsch, U.S. Geological Survey, and Andrew Simon, National Sedimentation Laboratory
U.S. GEOLOGICAL SURVEY
Water-Resources Investigations Report 03-4003
Prepared in cooperation with the NEBRASKA DEPARTMENT OF ROADS, NEBRASKA DEPARTMENT OF NATURAL RESOURCES, LOWER PLATTE SOUTH NATURAL RESOURCES DISTRICT, PAPIO-MISSOURI RIVER NATURAL RESOURCES DISTRICT, U.S. ARMY CORPS OF ENGINEERS, and the NATIONAL SEDIMENTATION LABORATORY OF THE U.S. DEPARTMENT OF AGRICULTURE
Lincoln, Nebraska2003

District Chief U.S. Geological Survey Box 25046, Mail Stop 415 Denver Federal Center Denver, CO 80225–0046
For additional information write to:
District Chief U.S. Geological Survey 406 Federal Building 100 Centennial Mall North Lincoln, NE 68508 http://www.usgs.gov/
U.S. DEPARTMENT OF THE INTERIORGALE A. NORTON, Secretary
U.S. GEOLOGICAL SURVEYCharles G. Groat, Director
The use of firm, trade, and brand names in this report is for identification purposes only and does not constitute endorsement by the U.S. Geological Survey.
Copies of this report can be purchased from:
U.S. Geological Survey Information Services Box 25286 Denver Federal Center Denver, CO 80225

CONTENTS iii
CONTENTS
Abstract.................................................................................................................................................................................. 1Introduction............................................................................................................................................................................ 1
Purpose and Scope ....................................................................................................................................................... 2Description of Study Area ........................................................................................................................................... 2Attributes Associated with Channel Adjustment in Eastern Nebraska ....................................................................... 5Acknowledgments ....................................................................................................................................................... 6
Methods ................................................................................................................................................................................. 6Site Selection ............................................................................................................................................................... 6Data Collection ............................................................................................................................................................ 6
Topographic Data............................................................................................................................................... 13First-Round Survey.................................................................................................................................. 13Second-Round Survey ............................................................................................................................. 13Reference to National Geodetic Vertical Datum of 1929 ........................................................................ 13
Streambed Particle-Size Analyses ............................................................................................................................... 14Characterization of Streambed Adjustment ................................................................................................................. 14
Streambed Elevation History ............................................................................................................................. 14Influences on the Streambed.............................................................................................................................. 17
Disturbances ............................................................................................................................................ 17Knickpoints.............................................................................................................................................. 17Grade-Control Structures......................................................................................................................... 18
Characterization of Recent Channel Widening............................................................................................................ 18Contouring First-Round Survey Data ................................................................................................................ 18Overlay of Second-Round Survey Data ............................................................................................................ 18Characterization of Individual Top-of-Bank Failures........................................................................................ 18Computation of Widening Rates........................................................................................................................ 18
Streambed Adjustment........................................................................................................................................................... 19Potential Study-Area-Wide Disturbances .................................................................................................................... 20
Changes to the Median Water-Surface Elevation of the Missouri River........................................................... 20Agricultural Development in Nebraska ............................................................................................................. 20
Missouri River Tributary Basins.................................................................................................................................. 20Documented Disturbances, Knickpoints, and Grade-Control Structures .......................................................... 20Streambed Summaries ....................................................................................................................................... 22
Papillion Creek Basin .................................................................................................................................................. 23Documented Disturbances, Knickpoints, and Grade-Control Structures .......................................................... 25
Original Straightening.............................................................................................................................. 25Urbanization ............................................................................................................................................ 26Flood-Control Channel Modifications Since the 1960s .......................................................................... 27Degradation of the Missouri River .......................................................................................................... 27
Streambed Summaries ....................................................................................................................................... 27Platte River Tributary Basins....................................................................................................................................... 29
Documented Disturbances, Knickpoints, and Grade-Control Structures .......................................................... 29Straightening in the Platte River Flood Plain .......................................................................................... 29Basinwide Straightening .......................................................................................................................... 29Straightening at PRT-3............................................................................................................................. 29
Streambed Summaries ....................................................................................................................................... 31Elkhorn River Basin .................................................................................................................................................... 32
Documented Disturbances, Knickpoints, and Grade-Control Structures .......................................................... 34Straightening of the Elkhorn River.......................................................................................................... 34Straightening of Logan Creek.................................................................................................................. 34Straightening of Maple Creek.................................................................................................................. 35Straightening of Other Elkhorn River Tributaries ................................................................................... 35
CONTENTS

iv CONTENTS
Streambed Summaries ....................................................................................................................................... 35Salt Creek Basin .......................................................................................................................................................... 37
Documented Disturbances, Knickpoints, and Grade-Control Structures .......................................................... 37Original Channelization of Salt Creek .................................................................................................... 37Individual Tributary Modifications ......................................................................................................... 39Urbanization and Flood Control Modifications in the Lincoln Area ...................................................... 40
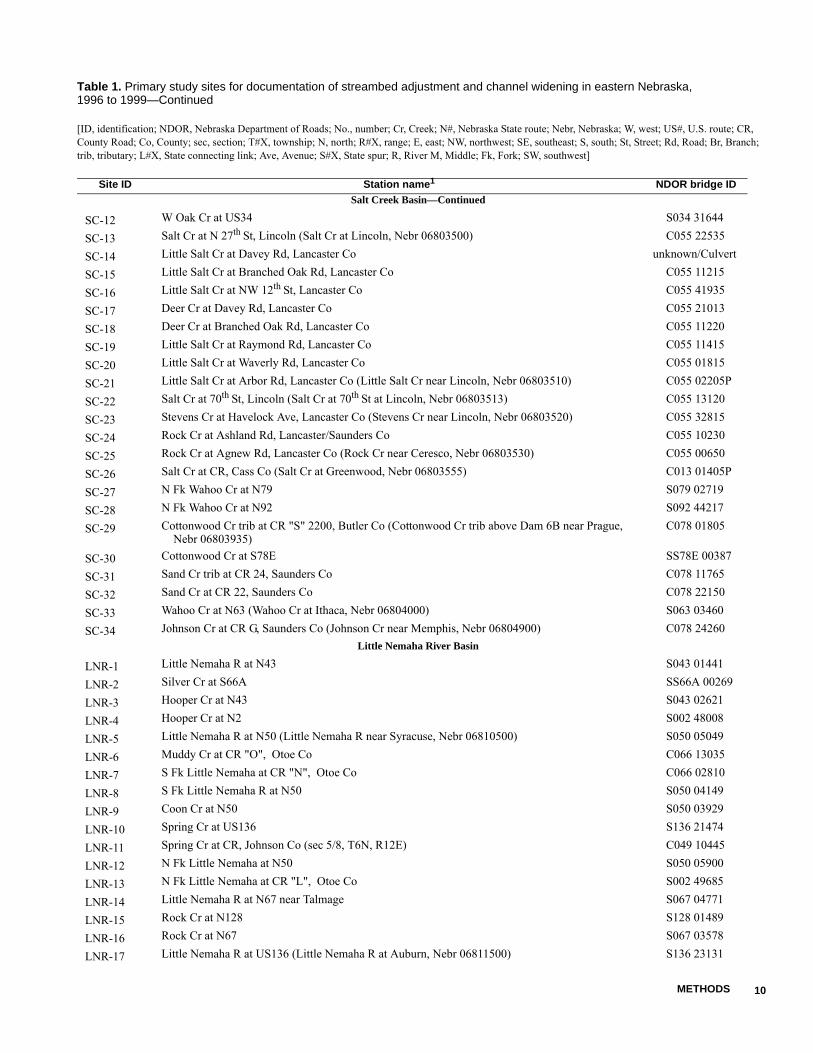
Streambed Summaries ....................................................................................................................................... 41Little Nemaha River Basin .......................................................................................................................................... 44
Documented Disturbances, Knickpoints, and Grade-Control Structures .......................................................... 44Original Straightening ............................................................................................................................. 44Channelization in the South Fork Little Nemaha River and Muddy Creek Subbasins ........................... 44
Streambed Summaries ....................................................................................................................................... 46Big Nemaha River Basin ............................................................................................................................................. 48
Documented Disturbances, Knickpoints, and Grade-Control Structures .......................................................... 48Streambed Summaries ....................................................................................................................................... 48
Big Blue River Basin................................................................................................................................................... 51Documented Disturbances, Knickpoints, and Grade-Control Structures .......................................................... 51Streambed Summaries ....................................................................................................................................... 51
Channel Widening ................................................................................................................................................................. 54Summary and Conclusions .................................................................................................................................................... 60References ............................................................................................................................................................................. 60
FIGURES
1–3. Maps showing:1. Location of study area, river basins, and sampling sites, Nebraska and Kansas .............................................. 32. Generalized classification of soil parent materials showing study area and river basins, Nebraska ................ 43. Location of loess area of Midwestern United States and thickness of loess..................................................... 5
4. Diagrams showing characterization of top-of-bank widening between first and second rounds of surveying by: (A) Identifying individual failures along the top-of-bank, and (B) characterizing the geometry of each....................................................................................................................................................... 19
5. Graph showing total area of harvested crops in Nebraska, 1866–1990.................................................................... 206. Map showing location of Missouri River Tributary Basins and associated study sites in Nebraska........................ 217. Graph showing streambed-elevation changes at Elk Creek at US20 (MRT-8)......................................................... 228. Map showing location of the Papillion Creek Basin and associated study sites in Nebraska .................................. 249. Photographs looking upstream at W Papillion Cr at US275 (PC-3)......................................................................... 26
10. Graph showing streambed-elevation changes at W Papillion Cr at 66th Street (PC-H)........................................... 2611. Graph showing streambed-elevation changes at Wehrspann Cr at N370 (PC-F) ..................................................... 2712. Photograph showing channel and levee construction, Big Papillion Creek ............................................................. 2713. Graph showing streambed-elevation changes at Big Papillion Cr at Cornhusker Rd (PC-M) ................................. 2914. Map showing location of Platte River Tributary Basins and associated study sites in Nebraska............................. 3015. Graph showing streambed-elevation changes at Skull Creek at Butler County road (PRT-5) ................................. 3116. Photograph looking downstream at grade-control structure on Skull Creek at PRT-5 ............................................. 3117. Graph showing streambed-elevation changes at Otoe Cr at US77 (PRT-7) ............................................................. 3218. Map showing eastern part of the Elkhorn River Basin and associated study sites in Nebraska............................... 3319. Photograph showing drop structure at S Logan Cr at N15 (ER-12) ......................................................................... 3520. Photograph showing knickpoint on East Fork Maple Creek located at SW1/4 sec. 26, T. 19 N., R. 4 E. ............... 3521. Graph showing streambed-elevation changes at Logan Cr at Dodge County Road 22 (ER-15).............................. 3722. Map showing location of Salt Creek Basin and associated study sites in Nebraska ................................................ 3823. Graph showing streambed-elevation changes at Salt Cr at N 27th St, Lincoln (SC-13) .......................................... 3924. Graph showing stream channel response at Middle Cr at US6 (SC-7) following 1917 straightening ..................... 3925. Photograph of knickpoint and graph showing streambed profile observed at Sand Cr Tributary at
Saunders County Road 24 (SC-31)........................................................................................................................... 4026. Photograph showing grade-control structure on Beal Slough upstream from Link 55W (SC-H)............................ 4127. Graph showing streambed-elevation changes at Little Salt Cr at Arbor Road (SC-21) ........................................... 41

CONTENTS v
28. Map showing location of the Little Nemaha River Basin and associated study sites in Nebraska .......................... 4529. Photograph showing channel incision observed in 1998 on Spring Creek about 3.5 kilometers upstream
from LNR-11 ............................................................................................................................................................ 4630. Graph showing streambed-elevation changes at S Fk Little Nemaha River at N50 (LNR-8) ................................. 4631. Map showing location of the Big Nemaha River Basin and associated study sites in Nebraska ............................. 4932. Graph showing streambed-elevation changes at N Fk Big Nemaha R at N105 (BNR-9)........................................ 5133. Map showing location of the Big Blue River Basin and associated study sites in Nebraska................................... 5234. Photograph showing grade-control structure on Big Indian Creek between Gage County Road (BBR-11)
and US77 (BBR-12) ................................................................................................................................................. 53
TABLES
1. Primary study sites for documentation of streambed adjustment and channel widening in eastern Nebraska, 1996 to 1999 .......................................................................................................................................... 7
2. Supplemental study sites for documentation of streambed adjustment in eastern Nebraska ................................. 113. Sources and types of historical streambed-elevation data ...................................................................................... 154. Methods for referencing data sets with the National Geodetic Vertical Datum of 1929 ........................................ 165. Drainage districts associated with Missouri River Tributary Basins...................................................................... 226. Streambed summaries for sites in the Missouri River Tributary Basins................................................................. 237. Drainage districts of the Papillion Creek Basin...................................................................................................... 258. Streambed summaries for sites in the Papillion Creek Basin ................................................................................. 289. Drainage districts associated with selected Platte River tributaries ....................................................................... 31
10. Streambed summaries for sites in the Platte River Tributary Basins...................................................................... 3211. Drainage districts associated with the Elkhorn River Basin................................................................................... 3412. Streambed summaries for sites in the Elkhorn River Basin ................................................................................... 3613. Streambed summaries for sites in the Salt Creek Basin ......................................................................................... 4214. Drainage districts associated with the Little Nemaha River Basin......................................................................... 4615. Streambed summaries for sites in the Little Nemaha River Basin ......................................................................... 4716. Drainage districts associated with the Big Nemaha River Basin............................................................................ 4817. Streambed summaries for sites in the Big Nemaha River Basin ............................................................................ 5018. Streambed summaries for sites in the Big Blue River Basin .................................................................................. 5319. Individual top-of-bank failure dimensions ............................................................................................................. 5420. Summary of observed channel widening................................................................................................................ 57
CD–ROM (in pocket)
Compilation of streambed elevation data for study sites related to streambed adjustment and channel widening in eastern Nebraska

vi CONTENTS
CONVERSION FACTORS AND ABBREVIATIONS
Multiply By To obtain
centimeter (cm) 0.394 inch (in) meter (m) 3.28 foot (ft)
kilometer (km) 0.622 mile (mi)meters per meter (m/m) 1 feet per foot (ft/ft)
square meter (m2) 10.8 square foot (ft2)hectare (ha) 2.47 acre (ac)
square kilometer (km2) 0.386 square mile (mi2)cubic meter (m3) 35.3 cubic foot (ft3)
meter per year (m/yr) 3.28 foot per year (ft/yr)cubic meter per second (m3/s) 35.3 cubic foot per second (ft3/s)
Elevation, as used in this report, refers to distance above the National Geodetic Vertical Datum of 1929 (NGVD29).Unless otherwise noted, photographs presented in this report were taken by employees of the U.S. Geological Survey.

Abstract 2
Streambed Adjustment and Channel Widening in Eastern NebraskaBy David L. Rus, Benjamin J. Dietsch, and Andrew Simon
Abstract
In eastern Nebraska, stream straightening and dredging efforts since the 1890s have disturbed the natural equilibrium of stream chan-nels and have led to streambed adjustment by degradation and subsequent channel widening. This report describes a study to evaluate the effect these disturbances have had on stream channels in eastern Nebraska.
Two sets of survey data were collected approximately 2 years apart during 1996–99 at 151 primary sites. Additionally, historical streambed-elevation data (dating back to the 1890s) were compiled from several sources for the primary sites and 45 supplemental sites, and relevant disturbances were identified for each of eight basin groupings. Streambed-elevation data sets were used to estimate the amount of change to the streambed at the sites over the time period of the data. Recent channel widening was docu-mented for 73 of the primary sites by comparing the two survey sets.
The majority of observed streambed- gradation responses appear to be related to the various straightening efforts and to the effects of grade-control structures in the study area. Channel responses were complicated by the pres-ence of multiple disturbances. However, in many cases, the streambed-elevation data sets provide a reliable representation of the past streambed gradation, with some sites showing 6 to 7 meters of degradation since they were straightened. Many sites that had been straightened showed considerable degradation following the distur-bance. This indicates that eastern Nebraska
stream channels can regain equilibrium mainly through the slope adjustment process of head-ward-progressing degradation.
Bank failures were documented at sites in all eight of the basin groupings analyzed, and widening rates were computed at 64 of 73 sites. Observed bank widening in the Big Blue River Basin, a relatively unstraightened basin, indicates that other disturbances besides stream-channel straightening may be causing channel responses in the basin and possibly in the entire study area.
INTRODUCTION
Many stream channels in the loess area of eastern Nebraska have been dredged and straightened since the 1890s. This engineering practice reduced flooding and increased the agricultural productivity of the flood plain at the time. However, channel gradient and the ability of the flow to erode channel sediments also increased. As a result, the long-term effect on the modified channels and adjacent tributaries of eastern Nebraska has been headward-progressing degradation, which has heightened and steepened channel banks, causing channel widening by bank failures. These channel responses affect the design and maintenance of structures crossing the channels and can have adverse effects on riparian health. In eastern Nebraska, many bridges already weakened by channel incision required closure following flooding that occurred in 1993. Streambed degradation caused by straightening also is believed to have accelerated the drainage of saline wetlands along Little Salt Creek (Farrar and Gersib, 1991) and Rock Creek (Natural Resources Conservation Service, 1996a).

INTRODUCTION 3
Purpose and Scope
To better understand the channel responses in eastern Nebraska, the U.S. Geological Survey (USGS), in cooperation with the Nebraska Department of Roads, Nebraska Natural Resources Commission (now part of the Nebraska Department of Natural Resources), Lower Platte South Natural Resources District (NRD), Papio-Missouri River NRD, U.S. Army Corps of Engineers (USACE), and the U.S. Department of Agriculture, Agricultural Research Service (ARS), National Sedimentation Laboratory (NSL), did a study from 1995 to 2000 to characterize the stability of stream channels in eastern Nebraska. As part of the study, this report documents streambed adjustment and channel responses in eastern Nebraska with compiled data sets of streambed elevation over time at 196 sites and recent channel widening at 73 of the sites.
Besides the work presented here, the study consisted of several other components. A database was created from the assessment of nearly 1,000 bridges for potential scour-critical conditions (U.S. Army Corps of Engineers, 1999). Aerial reconnaissance was used to estimate the stage of channel evolution using techniques described by Simon (1989) for most chan-nels in the study area (U.S. Army Corps of Engineers, 1995; 1998). Trends in water-surface elevation for a given discharge were examined at 145 stream-gaging stations in Nebraska (Chen and others, 1999). Channel-bank stability analyses were performed at approximately 150 sites. Channel evolution models were developed for two streams in the study area (North Branch West Papillion Creek and Little Salt Creek) to assess the effects of mitigation measures and urbanization (Langendoen and Simon, 2000).
Description of Study Area
The study area includes sites from 28 counties in eastern Nebraska and parts of three adjacent coun-ties in Kansas (fig. 1). The study area lies in the Dissected Till Plains of the Central Lowland physio-graphic province (fig. 2) (Fenneman, 1946). This part of Nebraska is a glaciated region characterized by rolling hills, covered by easily erodible soil. With the exception of the Elkhorn River Basin where coarse-grained sediments are present in the western uplands, unconsolidated sediments derived from loess deposits of Pleistocene age dominate the surficial geology in the uplands of this region (fig. 2) (Elder, 1969). Areas
of the region capped with loess contain some of the thickest loess deposits in the Midwestern United States (fig. 3). Glacial till composed of poorly sorted mate-rials lies beneath the loess mantle throughout much of the region and is exposed on lower slopes in some areas. Bedrock occurs in parts of the region, especially in southeastern Nebraska, but most streambeds lack bedrock control.
The study area (fig. 1) is included in parts of four major land-resource areas (MLRAs) (Soil Conservation Service, 1981). The Iowa and Missouri Loess Hills (MLRA 107) area has rolling to hilly topography that is highly dissected; the erosion hazard from runoff is severe on the uplands. The Loess Uplands and Till Plains (MLRA 102B) have well-defined drainages in the uplands although the till plains are level to gently rolling with less defined drainages. The Nebraska and Kansas Loess–Drift Hills (MLRA 106) have steep and strongly sloping areas generally consisting of glacial till, and the areas with flatter slopes consist of loess. The remaining part of the study area lies in the Central Loess Plains (MLRA 75). In the study area, these plains are gently rolling and mantled by loess.
All basins in the study area are part of the Missouri River Basin. Study sites were grouped according to stream basin. Six major stream basins were identified in the study area: Papillion Creek, Elkhorn River, Salt Creek, Little and Big Nemaha River, and Big Blue River Basins (fig. 1). Sites not located within one of the major stream basins were grouped into Missouri River tributary basins or Platte River tributary basins. The Missouri River tributary basins are Bow Creek, Aowa Creek, Elk Creek, Omaha Creek, Elm Creek, New York Creek, Weeping Water Creek, and Honey Creek Basins (fig. 6, later in report). The Platte River tributary basins include Shell Creek, Bone Creek, Skull Creek, Otoe Creek, Buffalo Creek, Springfield Creek, and Fourmile Creek Basins (fig. 14, later in report).
Alluvial soil types vary within the region but generally consist of silt, silt loam, and silty-clay loam (Nebraska Soil and Water Conservation Commission, 1968; Soil Conservation Service, 1975). In the Elkhorn River Basin, western streambanks are sandy materials whereas streambanks in the eastern part of the basin are silty loess (Soil Conservation Service, 1971). The alluvial stratigraphy of the fine-grained deposits found in eastern Nebraska stream valleys are similar to those found in the DeForest Formation of western Iowa (Mandel and Bettis, 1995).

INTRODUCTION 4
Figure 1. Location of study area, river basins, and sampling sites, Nebraska and Kansas.
97˚
42˚
96˚
41˚
40˚
Study sites
Surface water
Big Blue River Basin
Big Nemaha River Basin
Nebraska and Kansas counties
Study area Elkhorn River Basin
Little Nemaha River Basin
Selected Missouri River tributary basins
Selected Platte River tributary basins
Papillion Creek Basin
Salt Creek Basin
EXPLANATION
Nema Brown
Marshall
Jefferson
SalineLancaster
Johnson
PawneeRichardson
Nemaha
Otoe
Cass
Sarpy
SaundersDouglas
Washington
Burt
Cuming
Stanton
Colfax Dodge
ButlerPolk
Seward
Platte
Madison
PierceWayne
Cedar
Knox
DixonDakota
Thurston
Gage
v
a
e
h
L
m
i
ittle Na
er
R
Bi
i
g
R
Be
lu
ver
e
e
k
S
alt Cr
r
i
h
Eo
r
R
v
e
lkn
Big Nemaha River
Papillion Creek
Pl Ra tte iver
Missouri R
iver
Location map
South Dakota
NebraskaNebraska
Kansas
Iowa
MissouriColorado
Wyo
min
g
Major Land Resource Areas (MLRA) (Soil Conservation Service, 1981)
102B
107
106
Central loess plains
Loess uplands and till plains
Iowa and Missouri loess hills
Nebraskaand Kansasloess drift hills
75
0 10 20
10 30200
KILOMETERS
30 MILES
Base from U. S. Geological Survey1:100,000 digital dataAlbers Equal-Area Conic projectionStandard parallels 29˚30' and 45˚30'Central meridian -96˚00'

5S
treamb
ed A
dju
stmen
t and
Ch
ann
el Wid
enin
g in
Eastern
Neb
raska
104˚
98˚
41˚
42˚
EXPLANATION
SAND AND SILT
SAND
ALLUVIUM
LOESS
LOESS AND DRIFT
LOESS AND ALLUVIUM
SHALE
SANDSTONE
SCALE IN MILES
20 0 20 40 60
BASIN BOUNDARIES
Modified from Fenneman (1946) and Bleed and Flowerday (1990)
Plains Border
High Plains
Sand Hills areaC
entr al Low
land pr ov ince
Great Plains province
Missouri Plateau,unglaciated
PHYSIOGRAPHIC DIVISIONS
0 40 MILES20
0 20 40 KILOMETERS
Base from U.S. Geological Survey1:100,000 digital dataAlbers Equal-Area Conic projectionStandard parallels 29˚30' and 45˚30'central meridian -96˚00
Figure 2. Generalized classification of soil parent materials showing study area and river basins, Nebraska.

INTRODUCTION 6
Attributes Associated with Channel Adjustment in Eastern Nebraska
In general, stream-channel adjustment processes can be characterized by the interaction between (1) bed material load, (2) streamflow discharge, (3) channel slope, and (4) channel geometry (Mackin, 1948). A stream system where these attributes balance each other out is considered to be in equilibrium. However, changes can be imposed on the system that alter one or more of these attributes and can lead to indirect changes in the others, as the stream attempts to return to an equilibrium state through the processes of erosion and sediment transport. The imposed changes are referred to in this report as disturbances, and the indirect changes are the channel response. As used in this report, aggrading or degrading responses reflect upward or downward changes, respectively, in streambed elevation. According to this framework, stream-channel straightening in the loess areas of eastern Nebraska disturbed the equilibrium by
increasing the channel slope. The channel then responded accordingly through changes in one or more of the attributes.
The bed material load is considered unchanged for streams located over loess-derived alluvial deposits because a negligible supply of coarse-sized sediment particles is available. The bed material load consists of particles too massive to be continuously entrained by the stream, such as sand or gravel. Entrained particles with low settling velocities, such as silts and clays, require very little energy to remain suspended. Once suspended, these materials do not play a significant role in the adjustment process. The sediment supplied from alluvial loess deposits in eastern Nebraska is mainly composed of fine-textured materials such as silt, with only small amounts of coarse sediment. However, coarse sediments could still become avail-able through the cumulative effect of many years of stream-channel erosion or the result of layers of sand and gravel being exposed. Channels that cut through the loess cap and entrain the coarser sand and gravel deposits below have a supply of coarse material that increases bed material loads that are deposited in downstream reaches, causing aggradation. Severe channel incision into the thick loess cap would have to occur before these coarse materials would become available for downstream deposition.
Because streamflow discharge is independent of the other channel attributes, it could also be considered unchanged. As a result, stream channels in eastern Nebraska that have had their channel slopes increased are correcting to a new equilibrium by reducing the channel slope and increasing the width and depth of the channel. As long as no coarse sediments are present for downstream aggradation, channel-slope adjustment is limited to lateral channel migration or headward-progressing streambed degradation.
Headward-progressing streambed degradation occurs through the formation of knickpoints, which are locally steep channel reaches located in erodible streambed material (Tim Diehl, U.S. Geological Survey, written commun., 2002). Stream velocity increases as water flows over the sudden drop in streambed elevation, which cannot be sustained by cohesive streambeds such as silt and clay. As a result, knickpoints migrate upstream and will theoretically continue to do so until a drainage divide is reached or streambed material (whether natural or artificial) is encountered that can sustain the elevation drop (Schumm and others, 1984).
South Dakota
North Dakota
Nebraska
Kansas
Oklahoma
Texas
Arkansas
Louisiana
Missouri
Iowa
Alabama
Mississippi
Tennessee
Kentucky
IndianaIllinois Ohio
Georgia
Minnesota
Michigan
Wisconsin
43˚
37˚
97˚ 89˚
0 200 MILES100
0 100 200 KILOMETERS
Figure 3. Location of loess area of Midwestern United States and thickness of loess, in feet (modified from Luttenegger, 1987).

7 Streambed Adjustment and Channel Widening in Eastern Nebraska
Streambed degradation leads to increased bank heights and oversteepened bank angles. The channel geometry is adjusted through bank failures, which continue until the bank becomes stable. The cumula-tive effect of these failures is a widened channel, which can pose a threat to existing bridges that span the channel and results in the loss of land adjacent to the channel.
Acknowledgments
The findings presented in this report are the culmination of a cooperative effort among several agencies and individuals whose assistance was vital and greatly appreciated. The authors thank the land-owners for permission to collect geomorphic data on their property. The authors also thank representatives from each of the cooperating agencies, specifically Don Jisa (Nebraska Department of Roads), Randy Behm (U.S. Army Corps of Engineers), Dan Schulz (Lower Platte South Natural Resources District), Marlin Petermann (Papio-Missouri River Natural Resources District), Andrea Curini (formerly of the National Sedimentation Laboratory), and Jerry Wallin (formerly of the Nebraska Natural Resources Commis-sion) for their support and knowledge and for providing access to a wealth of historical geomorphic data. Thanks also go to colleagues and student interns within the USGS who provided assistance in collecting and analyzing geomorphic data as well as the review of this report.
METHODS
Streambed adjustment was documented at 196 sites, which included 151 primary study sites and 45 supplemental study sites. At the primary sites, field activities included at least two topographic surveying events as well as streambed particle-size sampling during 1996–99. At all 196 sites, historical channel geometry data were compiled, and temporal data sets of streambed elevation were created. Recent channel widening was characterized at 73 of the primary sites.
Site Selection
Primary study sites were distributed among the major drainage basins of the study area and were indi-vidually selected based on the availability of historical streambed-elevation data (table 1). Because the majority of historical data were associated with bridge crossings, all of the sites were located at bridges. The bridges were good landmarks for isolating streambed data from several sources into one location and for establishing reference points for future comparisons.
Scour processes, especially those associated with bridge crossings, could have introduced variance into the data sets of streambed elevation. Contraction scour typically occurs during the rising stage of runoff events, and then scour holes fill in as the stage falls if depositional materials are available (Richardson and others, 1993). Few data are available regarding the supply of depositional materials during runoff events in eastern Nebraska, but it is likely that the process is supply-limited in areas dominated by loess, and the time required for scour holes to fill in may be consid-erably longer for silt-bed channels than for sand-bed channels. The effects of local scour, which is caused by flow obstructions such as bridge piers, were minimized by compiling and collecting streambed-elevation data that were not adjacent to such obstruc-tions. Determining the magnitude of variance in streambed elevation caused by scour is dependent on flow characteristics for each bridge, which is beyond the scope of this study. Although this variance was likely present in the streambed-elevation data sets, the long-term effects of degradation or aggradation of the streambed were increasingly recognizable with more data points over longer periods of time.
In addition to the primary sites where field data collection was performed, 45 supplemental sites were used to document streambed adjustment (table 2). At these sites, only historical data were compiled and presented, with the exception of tapedown measure-ments collected at sites along Beal Slough in the Salt Creek Basin.
Data Collection
Topographic stream-channel surveys were done at the primary sites for two purposes. The surveys provided a recent (between 1996 and 1999)

METHODS 8
Table 1. Primary study sites for documentation of streambed adjustment and channel widening in eastern Nebraska, 1996 to 1999
[ID, identification; NDOR, Nebraska Department of Roads; No., number; Cr, Creek; N#, Nebraska State route; Nebr, Nebraska; W, west; US#, U.S. route; CR, County Road; Co, County; sec, section; T#X, township; N, north; R#X, range; E, east; NW, northwest; SE, southeast; S, south; St, Street; Rd, Road; Br, Branch; trib, tributary; L#X, State connecting link; Ave, Avenue; S#X, State spur; R, River M, Middle; Fk, Fork; SW, southwest]
Site ID Station name1 NDOR bridge IDMissouri River Tributary Basins
MRT-1 Bow Cr at N84 S084 04362MRT-2 Bow Cr at N12 (Bow Cr at St. James, Nebr 06478518) S012 20744MRT-3 W Bow Cr at US81 S081 20306MRT-4 Aowa Cr at CR, Dixon Co (near center sec 1, T30N, R5E) C026 22325PMRT-5 South Cr at CR, Dakota Co (NW1/4 sec 10, T29N, R5E) C026 13020MRT-6 Aowa Cr at N12 S012 23427MRT-7 Otter Cr at CR, Dixon Co (SE1/4 sec33, T29N, R6E) C026 13810PMRT-8 Elk Cr at US20 S020 42270MRT-9 S Omaha Cr at N94 (S Omaha Cr at Walthill, Nebr 06600900) S094 01301MRT-10 Omaha Cr at Main St, Homer (Omaha Cr at Homer, Nebr 06601000) C022 23015MRT-11 Elm Cr at US75 S075 14855MRT-12a New York Cr at New York Cr Rd, Washington Co (New York Cr east of Spiker, Nebr 06608900) C089 21910PMRT-12b New York Cr at CR21, Washington CoMRT-13 Weeping Water Cr at N1 S001 00266MRT-14 Weeping Water Cr at CR, Cass Co (Weeping Water Cr at Weeping Water, Nebr 06806460) C013 13710PMRT-15 S Br Weeping Water Cr at N67 S067 06587MRT-16 Weeping Water Cr at US75 (Weeping Water Cr at Union, Nebr 06806500) S075 05774MRT-17 Honey Cr at N67 S067 02402
Papillion Creek Basin
PC-1 N Br W Papillion Cr at Fort St, Douglas Co C028 21415PC-2 N Br W Papillion Cr at Blondo St, Douglas Co C028 21820PC-3 W Papillion Cr at US275 S275 17757PC-4 S Papillion Cr trib at Cornhusker Rd, Sarpy Co C077 20620PC-5 W Papillion Cr at Giles Rd, Sarpy Co C077 20435PC-6 Big Papillion Cr at 168th St, Douglas Co C028 13140PC-7 Big Papillion Cr at Fort St, Omaha C028 21420PC-8 Eagle Run at 120th St, Omaha C028 13910PC-9 Little Papillion Cr at L28K SL28K 01578
PC-10 Cole Cr at Ames Ave, Omaha C028 F1405
PC-11 Cole Cr at Blondo St, Omaha C028 31835
PC-12 Papillion Cr at Capeheart Rd, Bellevue C077 01205PPlatte River Tributary Basins
PRT-1 Shell Cr at CR, Platte Co (SW1/4 sec 14, T18N, R1E) (Shell Cr near Columbus, Nebr 06795500) C071 05705P
PRT-2 Shell Cr at US30 S030 39774
PRT-3 Bone Cr at S12B SS12B 00427
PRT-4 Bone Cr at N15 S015 09916
PRT-5 Skull Cr at CR, Butler Co (sec 22/27, T16N, R4E) C012 32035
PRT-6 Skull Cr at S12A SS12A 00554
PRT-7 Otoe Cr at US77 S077 10726
PRT-8 Otoe Cr at S78J SS78J 00074
PRT-9 Buffalo Cr trib at 192nd St, Sarpy Co C077 11310
PRT-10 Buffalo Cr at N50 S050 07970

9 Streambed Adjustment and Channel Widening in Eastern Nebraska
Platte River Tributary Basins—Continued
PRT-11 Springfield Cr at Platteview Rd, Sarpy Co C077 11640
PRT-12 Fourmile Cr at N66 S066 10234
PRT-13 Fourmile Cr at Bay Rd, Cass Co C013 00415Elkhorn River Basin
ER-1 Elkhorn R at US81 (Elkhorn R at Norfolk, Nebr 06799000) S081 15491
ER-2 Union Cr at Main St (old US81), Madison (Union Cr at Madison, Nebr 06799230) C059 H3905
ER-3 Union Cr at CR, Stanton Co (SE1/4 sec 15, T22N, R1E) C084 13205
ER-4 Plum Cr at N15 S015 15738
ER-5 Plum Cr at N51 S051 00598
ER-6 Elkhorn R at N32 (Elkhorn R at West Point, Nebr 06799350) S032 07316
ER-7 Pebble Cr at N32 S032 06215
ER-8 Pebble Cr at N91 S091 19072
ER-9 Pebble Cr at CR "G", Dodge Co (Pebble Cr at Scribner, Nebr 06799385) C027 02305P
ER-10 M Logan Cr at N57 S057 05119
ER-11 Deer Cr at N57 S057 04075
ER-12 S Logan Cr at N15 S015 16384
ER-13 Logan Cr at N35 S035 04053
ER-14 Logan Cr at N94 (Logan Cr at Pender, Nebr 06799450) S094 00025
ER-15 Logan Cr at CR 22, Dodge Co (Logan Cr near Uehling, Nebr 06799500) C027 30645
ER-16 W Fk Maple Cr at N91 S091 17273
ER-17 Dry Cr at N15 S015 11596
ER-18 E Fk Maple Cr at N91 S091 17846
ER-19 Maple Cr at N79 S079 05122
ER-20 Maple Cr at CR20, Dodge Co (Maple Cr near Nickerson, Nebr 06800000) C027 13910
ER-21 Maple Cr at US77 (former site of Maple Cr near Nickerson, Nebr 06800000) S077 12173
ER-22 Bell Cr at N32 S032 09289
ER-23 Little Bell Cr at CR P11, Washington Co C089 01130
ER-24 Bell Cr at CR 26, Washington Co C089 02610
ER-25 Elkhorn R at N64 (Elkhorn R at Waterloo, Nebr 06800500) S064 06033Salt Creek Basin
SC-1 Olive Br at SW 86th St, Lancaster Co C055 00910
SC-2 Hickman Br at S 110th St, Lancaster Co C055 03705
SC-3 Salt Cr at S55F (Salt Cr at Roca, Nebr 06803000) SS55F 00229
SC-4 Beal Slough at N2 S002 46092
SC-5 Haines Br at Midway Rd, Lancaster Co C055 04405P
SC-6 S Br Middle Cr at SW 126th St, Lancaster Co C055 60315
SC-7 Middle Cr at US6 S006 30732
SC-8 Middle Cr at SW 40th St, Lancaster Co (Middle Cr at SW 40th St at Lincoln, Nebr 06803170) C055 31520
SC-9 Oak Cr at N66 S066 05451
SC-10 N Oak Cr at N66 S066 06060
SC-11 Oak Cr at US34 S034 31754
Table 1. Primary study sites for documentation of streambed adjustment and channel widening in eastern Nebraska, 1996 to 1999—Continued
[ID, identification; NDOR, Nebraska Department of Roads; No., number; Cr, Creek; N#, Nebraska State route; Nebr, Nebraska; W, west; US#, U.S. route; CR, County Road; Co, County; sec, section; T#X, township; N, north; R#X, range; E, east; NW, northwest; SE, southeast; S, south; St, Street; Rd, Road; Br, Branch; trib, tributary; L#X, State connecting link; Ave, Avenue; S#X, State spur; R, River M, Middle; Fk, Fork; SW, southwest]
Site ID Station name1 NDOR bridge ID
METHODS 10
Salt Creek Basin—Continued
SC-12 W Oak Cr at US34 S034 31644
SC-13 Salt Cr at N 27th St, Lincoln (Salt Cr at Lincoln, Nebr 06803500) C055 22535
SC-14 Little Salt Cr at Davey Rd, Lancaster Co unknown/Culvert
SC-15 Little Salt Cr at Branched Oak Rd, Lancaster Co C055 11215
SC-16 Little Salt Cr at NW 12th St, Lancaster Co C055 41935
SC-17 Deer Cr at Davey Rd, Lancaster Co C055 21013
SC-18 Deer Cr at Branched Oak Rd, Lancaster Co C055 11220
SC-19 Little Salt Cr at Raymond Rd, Lancaster Co C055 11415
SC-20 Little Salt Cr at Waverly Rd, Lancaster Co C055 01815
SC-21 Little Salt Cr at Arbor Rd, Lancaster Co (Little Salt Cr near Lincoln, Nebr 06803510) C055 02205P
SC-22 Salt Cr at 70th St, Lincoln (Salt Cr at 70th St at Lincoln, Nebr 06803513) C055 13120
SC-23 Stevens Cr at Havelock Ave, Lancaster Co (Stevens Cr near Lincoln, Nebr 06803520) C055 32815
SC-24 Rock Cr at Ashland Rd, Lancaster/Saunders Co C055 10230
SC-25 Rock Cr at Agnew Rd, Lancaster Co (Rock Cr near Ceresco, Nebr 06803530) C055 00650
SC-26 Salt Cr at CR, Cass Co (Salt Cr at Greenwood, Nebr 06803555) C013 01405P
SC-27 N Fk Wahoo Cr at N79 S079 02719
SC-28 N Fk Wahoo Cr at N92 S092 44217
SC-29 Cottonwood Cr trib at CR "S" 2200, Butler Co (Cottonwood Cr trib above Dam 6B near Prague, Nebr 06803935)
C078 01805
SC-30 Cottonwood Cr at S78E SS78E 00387
SC-31 Sand Cr trib at CR 24, Saunders Co C078 11765
SC-32 Sand Cr at CR 22, Saunders Co C078 22150
SC-33 Wahoo Cr at N63 (Wahoo Cr at Ithaca, Nebr 06804000) S063 03460
SC-34 Johnson Cr at CR G, Saunders Co (Johnson Cr near Memphis, Nebr 06804900) C078 24260Little Nemaha River Basin
LNR-1 Little Nemaha R at N43 S043 01441
LNR-2 Silver Cr at S66A SS66A 00269
LNR-3 Hooper Cr at N43 S043 02621
LNR-4 Hooper Cr at N2 S002 48008
LNR-5 Little Nemaha R at N50 (Little Nemaha R near Syracuse, Nebr 06810500) S050 05049
LNR-6 Muddy Cr at CR "O", Otoe Co C066 13035
LNR-7 S Fk Little Nemaha at CR "N", Otoe Co C066 02810
LNR-8 S Fk Little Nemaha R at N50 S050 04149
LNR-9 Coon Cr at N50 S050 03929
LNR-10 Spring Cr at US136 S136 21474
LNR-11 Spring Cr at CR, Johnson Co (sec 5/8, T6N, R12E) C049 10445
LNR-12 N Fk Little Nemaha at N50 S050 05900
LNR-13 N Fk Little Nemaha at CR "L", Otoe Co S002 49685
LNR-14 Little Nemaha R at N67 near Talmage S067 04771
LNR-15 Rock Cr at N128 S128 01489
LNR-16 Rock Cr at N67 S067 03578
LNR-17 Little Nemaha R at US136 (Little Nemaha R at Auburn, Nebr 06811500) S136 23131
Table 1. Primary study sites for documentation of streambed adjustment and channel widening in eastern Nebraska, 1996 to 1999—Continued
[ID, identification; NDOR, Nebraska Department of Roads; No., number; Cr, Creek; N#, Nebraska State route; Nebr, Nebraska; W, west; US#, U.S. route; CR, County Road; Co, County; sec, section; T#X, township; N, north; R#X, range; E, east; NW, northwest; SE, southeast; S, south; St, Street; Rd, Road; Br, Branch; trib, tributary; L#X, State connecting link; Ave, Avenue; S#X, State spur; R, River M, Middle; Fk, Fork; SW, southwest]
Site ID Station name1 NDOR bridge ID

11 Streambed Adjustment and Channel Widening in Eastern Nebraska
Little Nemaha River Basin—Continued
LNR-18 Whiskey Run at CR, Nemaha Co (sec 12/13, T4N, R15E) C064 13060
LNR-19 Little Nemaha R at N67 near Nemaha S067 01234Big Nemaha River Basin
BNR-1 N Fk Big Nemaha R at SE 148th St, Lancaster Co C055 04305
BNR-2 M Br Big Nemaha R at S34B SS34B 00455
BNR-3 M Br Big Nemaha R at N41 S041 08540
BNR-4 Yankee Cr at CR, Johnson Co (near center of S 1/2, sec 8, T4N, R9E) C049 00305P
BNR-5 Yankee Cr at US136 S136 20392
BNR-6 N Fk Big Nemaha at US136 S136 20939
BNR-7 Long Branch Cr at N62 S062 00820
BNR-8 Kirkham Cr at CR, Richardson Co (near center sec 32, T3N, R13E) C074 00305P
BNR-9 N Fk Big Nemaha R at N105 (N Fk Big Nemaha R at Humboldt, Nebr 06814500) S105 00703
BNR-10 Turkey Cr at CR, Pawnee Co (sec 3/4, T3N, R9E) C067 00735
BNR-11 Turkey Cr at N8 S008 11290
BNR-12 Johnson Ck at CR, Pawnee Co (sec 25/30, T1N, R10/11E) C067 02505
BNR-13 S Fk Big Nemaha at N8 S008 12578
BNR-14 Big Nemaha R at US73 (Big Nemaha R at Falls City, Nebr 06815000) S073 00248
BNR-15 Muddy Cr at N105 S105 02688
BNR-16 Muddy Cr at US75 S075 01884
BNR-17 Muddy Cr at US73 S073 01612Big Blue River Basin
BBR-1 Big Blue R at CR "D", Butler Co (Big Blue R at Surprise, Nebr 06879900) C012 00705
BBR-2 N Br Big Blue R at S12E SS12E 00100
BBR-3 Kezan Cr at N15 S015 08602
BBR-4 N Br Big Blue R at CR "J", Butler Co C012 01915
BBR-5 Big Blue R at CR 2250, Saline Co (Big Blue R near Crete, Nebr 06881000) C076 14315P
BBR-6 Turkey Cr at N41 S041 05764
BBR-7 Turkey Cr at N103 S103 02465
BBR-8 Indian Cr trib at US77 S077 03378
BBR-9 Indian Cr at US77 (Indian Ck at Beatrice 06881450) S077 02364
BBR-10 Big Blue R at US77 S077 02160
BBR-11 Big Indian Cr at CR, Gage Co (sec 33/4, T2/11N, R5E) C034 06210
BBR-12 Big Indian Cr at US77 S077 00775
BBR-13 Big Blue R at N8 (Big Blue R at Barneston, Nebr 06882000) S008 086191 Naming convention for sites is as follows: Stream name; U.S. route, State route, county road, or municipal street. Where a county road or
municipal street is used, the county or municipality name follows the site name. Where the county road or municipal street name is not known, the section, township, and range location are given. Where sites are located at a USGS gaging station, the station name and number are listed in parenthesis.
Table 1. Primary study sites for documentation of streambed adjustment and channel widening in eastern Nebraska, 1996 to 1999—Continued
[ID, identification; NDOR, Nebraska Department of Roads; No., number; Cr, Creek; N#, Nebraska State route; Nebr, Nebraska; W, west; US#, U.S. route; CR, County Road; Co, County; sec, section; T#X, township; N, north; R#X, range; E, east; NW, northwest; SE, southeast; S, south; St, Street; Rd, Road; Br, Branch; trib, tributary; L#X, State connecting link; Ave, Avenue; S#X, State spur; R, River M, Middle; Fk, Fork; SW, southwest]
Site ID Station name1 NDOR bridge ID

METHODS 12
Table 2. Supplemental study sites for documentation of streambed adjustment in eastern Nebraska
[ID, identification; NDOR, Nebraska Department of Roads; S, south; Cr, Creek; trib, tributary; CR, County Road; Co, County; SW, southwest; NW, northwest; sec, section; T#X, township; N, north; R#X, range; E, east; nr, near; Nebr, Nebraska; SE, southeast; --, not available; US#, U.S. route; NE, northeast; W, West; St, street; UP, Union Pacific; RR, Railroad; N#, Nebraska State route; I-80, Interstate 80; Rd, road; BNSF, Burlington Northern Santa Fe; L#X, State connecting link; Blvd, Boulevard; Br, Branch; Ave, Avenue; Kans, Kansas]
Site ID Station name1 NDOR bridge ID
Missouri River Tributaries Basin
MRT-A S Omaha Cr trib at CR, Thurston Co (SW1/4 NW1/4 sec 35, T25N, R8E)(S Omaha Cr trib nr Walthill, Nebr 06600600)
--
MRT-B S Omaha Cr at CR, Thurston Co (SW1/4 SE1/4 sec 23, T25N, R8E)(S Omaha Cr nr Walthill, Nebr 06600700)
--
MRT-C New York Cr trib at CR, Washington Co (SW1/4 SW1/4 sec 4, T19N, R10E)(New York Cr trib nr Spiker, Nebr 06608700)
--
MRT-D New York Cr at US75(New York Cr at Herman, Nebr 06609000)
S075 12479
MRT-E Honey Cr at CR, Nemaha Co (SW1/4 NE1/4 sec32, T6N, R15E)(Honey Cr nr Peru, Nebr 06810060)
--
Papillion Creek Basin
PC-A W Papillion Cr at Dodge St, Omaha --
PC-B W Papillion Cr at UP RR, Omaha (SE1/4 NW1/4 sec 22, T15N, R11E) --
PC-C W Papillion Cr at Pacific St, Omaha --
PC-D W Papillion Cr at N50 S050 09127
PC-E S Papillion Cr at 156th St, Omaha C077 11925
PC-F Wehrspann Cr at N370 S370 00376
PC-G S Papillion Cr at 132nd St, Omaha --
PC-H W Papillion Cr at 66th St, Omaha C077 13315P
PC-I Big Papillion Cr at 156th St, Douglas Co C028 13320
PC-J Big Papillion Cr at I-80 S080 44846
PC-K Little Papillion Cr at I-80 S080 44984
PC-L Little Papillion Cr at US275 S275 18587
PC-M Big Papillion Cr at Cornhusker Rd, Sarpy Co C077 30630Platte River Tributaries Basin
No supplemental study sites used in this basinElkhorn River Basin
No supplemental study sites used in this basinSalt Creek Basin
SC-A Beal Slough at Pine Lake Rd, Lincoln --
SC-B Beal Slough at 56th St, Lincoln --
SC-C Beal Slough at BNSF RR, Lincoln (SE1/4 SE1/4 sec 8, T9N, R7E) --
SC-D Beal Slough at N2 S002 46191
SC-E Beal Slough at 48th St, Lincoln --
SC-F Beal Slough at 40th St, Lincoln --
SC-G Beal Slough at BNSF RR, Lincoln (SE 1/4 NE1/4 sec 7, T9N, R7E) --
SC-H Beal Slough at L55W SL55W 00197

13 Streambed Adjustment and Channel Widening in Eastern Nebraska
Salt Creek Basin—Continued
SC-I Beal Slough at Pioneers Blvd, Lancaster Co --
SC-J Beal Slough at UP RR, Lancaster Co (SE1/4 SW1/4 sec 2, T9N, R6E) --
SC-K Haines Br at SW 98th St, Lancaster Co --
SC-L Haines Br at Coddington Ave, Lancaster Co --
SC-M Haines Br at US77 S077 06027
SC-N Rock Cr at N 70th St, Lancaster Co --
SC-O Rock Cr at N 84th St, Lancaster Co --
SC-P Rock Cr at N 112th St, Lancaster Co --
SC-Q Rock Cr at Little Salt Rd, Lancaster Co --
SC-R Rock Cr at Rock Creek Rd, Lancaster Co --
SC-S Rock Cr at Davey Rd, Lancaster Co --
SC-T Rock Cr at Branched Oak Rd, Lancaster Co --
SC-U Rock Cr at 162nd St, Lancaster Co --
SC-V Rock Cr at Greenwood Rd, Lancaster Co --
SC-W Sand Cr at US77 S077 09410
SC-X Salt Cr at US6 (Salt Cr nr Ashland, Nebr 06805000) S006 33987Little Nemaha River Basin
LNR-A Wolf Cr at CR, Otoe Co (NE1/4 NE1/4 sec 18, T8N, R11E) (Wolf Cr nr Syracuse 06810300) --
LNR-B Muddy Cr at N50 S050 04571Big Nemaha River Basin
BNR-A Turkey Cr at CR, Nemaha Co, Kans (SW1/4 SW1/4 sec 20, T1S, R12E) (Turkey Cr nr Seneca, Kans 06814000)
--
Big Blue River Basin
No supplemental study sites used in this basin1Naming convention for sites is as follows: Stream name; U.S. route, State route, county road, or municipal street. Where a county road or
municipal street is used, the county or municipality name follows the site name. Where the county road or municipal street name is not known, the section, township, and range location are given. Where sites are located at a USGS gaging station, the station name and number are listed in parenthesis.
Table 2. Supplemental study sites for documentation of streambed adjustment in eastern Nebraska—Continued
[ID, identification; NDOR, Nebraska Department of Roads; S, south; Cr, Creek; trib, tributary; CR, County Road; Co, County; SW, southwest; NW, northwest; sec, section; T#X, township; N, north; R#X, range; E, east; nr, near; Nebr, Nebraska; SE, southeast; --, not available; US#, U.S. route; NE, northeast; W, West; St, street; UP, Union Pacific; RR, Railroad; N#, Nebraska State route; I-80, Interstate 80; Rd, road; BNSF, Burlington Northern Santa Fe; L#X, State connecting link; Blvd, Boulevard; Br, Branch; Ave, Avenue; Kans, Kansas]
Site ID Station name1 NDOR bridge ID

14 Streambed Adjustment and Channel Widening in Eastern Nebraska
streambed-elevation point for documentation of streambed-elevation adjustment. The survey data also were used to reveal recent stream-channel widening. Because they may have been potential indicators of streambed gradational status, particle-size analyses also were performed on samples taken from the streambeds of most of the primary sites.
Dendrochronological techniques as described by Simon and Hupp (1992) and Phipps (1985) were explored to document past stream-channel widening using botanical evidence. These techniques are based on the effects of mass wasting on tree growth. A general history of the channel widening at a site can be discerned by correlating the effects on trees with the geometry of the failure masses. Few sites were observed where both affected trees and failure masses were still present; therefore, these techniques were not used for this study.
Topographic Data
Topographic data were collected at each of the primary sites between 1996 and 1999 by surveying a reach of the channel. Surveys were conducted at least twice at each site so that recent channel widening could be documented. On average, 23 months elapsed between the two surveys, but all were separated by at least 15 months.
Surveys were performed using a Sokkia Set II B electronic total station. A local coordinate system of northing, easting, and elevation was referenced to horizontal and vertical control points at each site, with the zero point for the horizontal coordinates usually established on the upstream or downstream edge of the bridge structure over what was estimated to be the deepest part of the channel. This allowed each site to be surveyed later on the same coordinate system. The surveying instrument was approximately referenced to north by means of a magnetic compass with adjust-ments for declination as determined from USGS 1:100,000-scale topographic maps. Once the coordi-nate system had been set, the zero point was verified to ensure that the setup was correct. The topographic survey then was made. The zero point or other control point(s) were surveyed again at the completion of the survey to confirm that the instrument was still measuring within 1 cm of the known coordinates. All survey points were corrected for the effects of temper-ature and atmospheric pressure, and for curvature and refraction.
First-Round Survey
The initial channel-reach surveys generally consisted of a combination of channel cross sections and selected ground and channel-bed shots of specific channel features including those to define the top of the channel bank, and the thalweg, which is the deepest point in the channel. The reaches surveyed were typically three to four channel widths long, and all surveys included a cross section at either the upstream or downstream edge of the bridge or culvert structure for use in the streambed-gradation analysis of the site. Some surveys were made both upstream and downstream from the structure with as many as 20 cross sections; however, most were made on only one side of the structure with about four cross sections. Because of overall time constraints or dense tree cover at the time of surveying, some later surveys consisted only of channel cross sections. At sites with historical surveys, efforts were made to resurvey the same cross sections, but this proved to be very difficult without known horizontal control points to reference. Because this study focused on channel widening caused by streambed elevation gradation rather than by lateral channel migration, straight reaches were preferred for surveying. However, in many cases, no straight reaches were present.
Second-Round Survey
For most sites, the second round of surveys consisted primarily of shots along the top edges of failures or along cut banks at or near the top of the channel banks. This was done to identify areas where potential channel widening had occurred. Although failures in the lower parts of the channel ultimately increase the probability of top-bank widening, the documentation and comparison of every failure within a channel reach was time-prohibitive and would have been limited by the level of failure definition between the two surveys. A short reach of the thalweg also was surveyed at each site to add to the streambed-elevation data set for the site.
Reference to National Geodetic Vertical Datum of 1929
The surveys needed to be referenced to a common datum to compare streambed-elevation data to surveys from previous studies. Past survey data were generally tied to the National Geodetic Vertical Datum of 1929 (NGVD29), which also was known as

METHODS 15
the Sea Level Datum of 1929 (Nebraska Department of Natural Resources, 2003). Thus, the NGVD29 was used as the reference datum for this study. Reference points or benchmarks relating to NGVD29 already existed at most daily discharge-gaging stations. In such cases, those reference points were used in the initial surveying setup. For the remaining sites and for discontinued daily gaging stations where the old refer-ence points had been destroyed, referencing to NGVD29 was accomplished in one of two other ways: (1) By surveying the road grade at the centerline of the bridge at each abutment and referencing to the NGVD29 elevation of similar points given in the “as-built” plans for the bridge, the NGVD29 elevation of the survey could be established within an assumed vertical precision of 10 cm; (2) when elevations were not available in the bridge plans, closed transits were run to third-order accuracy or higher (providing vertical precision within 2 cm for a typical transit of 3.2 km) (Kennedy, 1990) between one of the control points at the site and the nearest available vertical control. It was assumed that the variance to streambed elevation caused by short-term adjustment processes such as scour was at least 10 cm; therefore, the preci-sion for referencing NGVD29 was acceptable for both methods. Although the closed transits were more precise, they were significantly more time consuming and were used only if other options were not available.
Streambed Particle-Size Analyses
Streambed samples were collected at 146 of the primary sites using a BMH-53 sampler (Edwards and Glysson, 1999) between 1998 and 1999. The BMH-53 is a piston-type sampler 5 cm in diameter that collects streambed material to a depth of 20 cm. Point samples were collected from the thalweg at each site. Particle-size distributions of the samples were determined by the Soil and Plant Analytical Laboratory of the University of Nebraska–Lincoln. A four-point hydrometer test was performed on all samples for particle-size analysis. Additionally, sieve analyses were done on samples dominated by coarse particles. Based on the particle-size distributions, the laboratory made a determination of soil textural classification (Schoeneberger and others, 1998) using National Soil Information System (NASIS) codes. At sites where the individual streambed particles were larger than the piston diameter on the BMH-53, samples were not
collected, although it could be assumed that the median grain size was greater than 5 cm.
Characterization of Streambed Adjustment
Streambed adjustment was determined by compiling data sets of streambed elevation over time for each site and by documenting the disturbances that may have taken place in a drainage basin. The connec-tion between disturbance and streambed gradation was presumed at some sites, especially those that had been straightened. However, at many sites, multiple distur-bances occurred that all potentially could have led to gradation, and no connection was established.
Streambed Elevation History
For each site, the change in streambed elevation over the time period of the data set provided a general measure of streambed gradation. The change was calculated by subtracting the earliest elevation point in the data set from the latest point. Each data set from which these measures were computed is included in electronic format on the compact disc provided with this report. For some data sets, distinct episodes of streambed gradation can be identified that are not revealed by the measure of total change. Additionally, the median grain-size diameter and textural class of the streambeds from the 1998–99 sampling of 146 primary sites is given.
Efforts were made to produce predictive streambed-gradation equations from the empirical data sets following the methods of Simon (1994), but the complexity of channel responses caused by the multiple disturbances that occurred in each basin limited the applicability of these methods. Instead, the magnitude of streambed change for the time period of the data set was determined for each site.
For each site, a time-series data set of thalweg elevations was compiled. Because the topographic surveys of this study provided only data from the years 1996 to 1999, historical data were compiled from several sources to expand the temporal range of the data sets. The data came from surveys, bridge plans, tapedown measurements from bridge inspections, discharge measurements, tapedown measurements from gaging-station inspections, median water-surface elevations from rating curves in gaging-station records, historical accounts, channel modification design plans, and previous studies (table 3). Historical

16 Streambed Adjustment and Channel Widening in Eastern Nebraska
data that were not already adjusted to NGVD29 were adjusted using the methods listed in table 4.
Because data were obtained from a variety of sources, several different sources of uncertainty were introduced. These uncertainties were a result of differ-ences in the methods of data collection, the correlation of the data to a common datum, and the location and date the data were collected. Although the magnitude of the uncertainties was unknown, it is realistic to assume that some variance in streambed elevation could be attributed to these uncertainties.
The compiled data were collected using several different methods: 1. Survey methods were considered the most accurate.
The main concern with surveys lies in the assumption that the survey crew identified the thalweg, which is of interest to this study. In
some cases, the surveys only went to the water surface, which made the data less useful.
2. “As-built” bridge plans often included the thalweg elevation. When data from plans were used, it was assumed that the actual disturbance to the thalweg during construction did not deviate significantly from the plans.
3. Chen and others (1999) compiled median water-surface elevations (MWSE) for selected stations in the study area. These were the water levels that corresponded to a reference low-water discharge for each of the stage-discharge relations (rating curves) ever used at the site. These relations were updated periodically whenever significant changes to the channel (degradation, aggradation, channel widening) occurred. The use of the median as the reference discharge isolated changes to the low-water channel, thereby
Table 3. Sources and types of historical streambed-elevation data
[Source: FEMA, Federal Emergency Management Agency; NRCS, Natural Resources Conservation Service; USACE, U.S. Army Corps of Engineers; USGS, U.S. Geological Survey; NDOR, Nebraska Department of Roads; NNRC, Nebraska Natural Resources Commission (now the Nebraska Depart-ment of Natural Resources); UN–L, University of Nebraska–Lincoln; NGVD29, National Geodetic Vertical Datum of 1929; MWSE, median water-surface elevation]
Source Types of data Method used to reference to NGVD29
NDOR Surveys"As built" bridge plansTapedown from bridge inspections
Data used NGVD29 datumData used NGVD 29 datumSubtracted from grade elevation
USGS SurveysDischarge measurements from
gaging stationsTapedowns from gaging-station
inspectionsMWSE
Gage height added to gage datum in NGVD29.Maximum depth subtracted from stage, then added
to gage datum in NGVD29.Subtracted from reference gage height, then added
to gage datum in NGVD29.Added to gage datum in NGVD29.
NRCS Surveys Data used NGVD29 datum.NNRC Surveys Data used NGVD29 datum.
USACE SurveysHistorical accountsChannel modification designsGaging-station records
Data used NGVD datum.Estimated from current channel geometry.Estimated from current flood-plain elevations.Added to gage datum in MSL.
FEMA Surveys of the water surface profiles, often based on aerial photogrammetry
Data used NGVD29 datum.
UN–L Previous studies detailing channel modification designs
Estimated from current flood-plain elevations.
County Engineers “As built” bridge plansTapedowns from bridge inspections
Data used NGVD29 datum.Subtracted from grade elevation.
Individual landowners Historical accounts Estimated from current channel geometry.

METHODS 17
preventing the effects of channel widening from being included. Because the MWSE data corre-sponded to the water surface, estimates of the thalweg were made from the MWSE data by setting the MWSE value for a particular date equal to a known thalweg value from a similar time frame and then shifting the rest of the MWSE values accordingly. This was done for comparison purposes, and the amount by which the data were shifted is noted in the streambed-elevation data set.
4. Chen and others (1999) also compiled records of the stage and corresponding discharge at several USACE gaging stations. By using a low refer-ence discharge, the corresponding stage could be identified for each year published. As in the previous method, changes to the stage for the same discharge were related to changes in the channel characteristics. These data were adjusted to the thalweg in the same manner as that of the MWSE.
5. When MWSE data were not available, but stream-flow measurements had been made, these measurements could be used to characterize the submerged channel with a rough approximation of the thalweg. However, their purpose was to characterize streamflow in evenly spaced inter-vals rather than to define geomorphic features.
6. Tapedown measurements often were provided with bridge and gaging-station inspections. These usually were made to the center of the stream, which was not always the thalweg. Additionally, the reference point from which the tapedown was
made (and the elevation of that point) had to be estimated. In many cases, these data were not used because of obvious inconsistencies with survey and plan data.
7. The USGS operated several sites as peak-stage indi-cator sites. As part of these operations, frequent measurements of water level, rather than stream-flow, were made during both high and low water-level conditions. It was assumed that the effects of channel widening would be minimized in the low water-level measurements; these measure-ments are included in the streambed data set and often show trends over time. It should be noted that variability introduced from fluctuation in water level is inherent in these data.
8. Historical accounts were obtained from previous studies as well as individual landowners. Typical statements were, “the channel was only X feet deep 30 years ago,” or “the channel had suffered X feet of degradation since straightening in 1915.” These accounts were subjective and often were used only as evidence of past change. However, some of the previous studies with historical accounts of degradation also had survey data corresponding to the particular study, which allowed for estimation of streambed eleva-tion prior to the onset of degradation.
9. Aerial photogrammetry was used mainly in the FEMA Flood Insurance Studies and involved estimating elevation data from aerial photo-
Table 4. Methods for referencing data sets with the National Geodetic Vertical Datum of 1929
[NGVD29, National Geodetic Vertical Datum of 1929; MWSE, median water-surface elevation]
Method for referencing to NGVD29 AssumptionsData-collection methods that referenced
NGVD29 this way
A documented benchmark was used as a known elevation.
The given benchmark elevation was accurate. Surveys from previous studies, bridge plans, discharge measurements, MWSE, and gaging-station records.
The road grade was used as a known elevation.
The grade elevation was referenced using a benchmark.
There was a negligible amount of wear (from traffic or seasonal swelling) and bridge maintenance work (like resurfacing).
Surveys from this study, tapedowns.
The flood-plain elevation or another reference channel characteristic was used as a known elevation.
A reference characteristic (like the flood-plain elevation) remained unchanged between the period of the unknown data set and that from a known data set.
Historical accounts, construction plans.

18 Streambed Adjustment and Channel Widening in Eastern Nebraska
graphs. Often, ground surveys also were done in places to “ground-truth” the data.
10. Straightening/dredging construction plans were excellent for identifying disturbances to the channel, but it was difficult to obtain actual thalweg elevations from them because the plans did not contain site-specific data, but rather generic specifications of the channel. In those cases where a designed channel depth was given, the design elevation was estimated by subtracting the depth from the elevation of the existing flood plain.The way that the data were referenced to
NGVD29 also produced uncertainty (table 4). A data point that was tied in using a benchmark was consid-ered more reliable than one that was estimated from the elevation of the surrounding flood plain. Many of the historical data were already tied in to NGVD29, although the methods by which they were referenced were generally not given. It was assumed that a docu-mented benchmark was used to tie the data in, but less precise methods may have been used.
To compare the thalweg elevation points over time and document change, each data point had to be from the same location. The bridge was used as a reference point, but some data sets were collected away from the bridge. The farther away the data were collected from the bridge, the less applicable they became for comparison purposes.
The final level of uncertainty came from the date associated with each data set. In many previous studies, the date of the survey was not given. The publication date was used instead. For other surveys and most of the bridge plans, only the year of the data collection was known.
Influences on the Streambed
In addition to the site-specific streambed-eleva-tion data sets, basin-specific characteristics affecting streambed elevation were noted. This was done to provide background information when the streambed gradational history was considered at a particular site or at the larger scale of the basin. Potential distur-bances that may have led to streambed adjustment were documented from several sources. All observed knickpoints and grade-control structures within the basin also were identified.
Disturbances
Because human-caused disturbances related to stream-channel straightening efforts were the primary motivation behind this study, the identification of disturbances was focused on documenting these projects. The existence of drainage districts in eastern Nebraska and sometimes the corresponding channel-modification plans were stated in previous studies such as Brook and others (1892), Farrar and Gersib (1991), Ferrell (1996), Kerstetter (1992), Mears (1912), Moore (1915), Nebraska Department of Roads and Irrigation (1954), and U.S. Army Corps of Engi-neers (1963). Altered stream reaches were identified using 1:100,000-scale maps, aerial photographs, and historical accounts from landowners.
In addition to disturbances related to channel modifications, other human-caused disturbances were identified, although their effects in eastern Nebraska may have been minimal. Agricultural development and urbanization were explored. Numerous small dams located in the upper regions of several of the basins (Natural Resources Conservation Service (1996b) also were documented. These indirect distur-bances could lead to changes in the streamflow and sediment load. Direct changes in these attributes were not explored because few data on sediment load in the study area are available, and an extensive assessment of streamflow change was outside the scope of the study. However, cursory examination of historical flows at several USGS streamflow-gaging stations in the study area indicates that high flows, which would be the flows that dominate streambed adjustment, have occurred at a relatively constant frequency over the period of record for those stations. It is also unlikely that sediment-load changes, if they did occur, contrib-uted to significant long-term streambed adjustment because, as stated previously, the coarse sediment load that influences the streambed may have been inconse-quential in the loess areas of eastern Nebraska.
Knickpoints
Because headward-progressing knickpoint migration was probably the primary cause of streambed degradation in eastern Nebraska, any observed knickpoints were documented. However, because only short reaches of streams could be observed from bridges, this is by no means a complete record of all knickpoints in the region.

METHODS 19
Grade-Control Structures
Grade-control structures, either natural or constructed, were identified because they would affect the continuity of headward-progressing streambed degradation. A complete record of these structures was not available, and those presented in this report were either observed during the course of the study or were documented in other studies. In most cases, these structures were the response to degradation that had occurred previously. Either a drop structure or low-head dam was constructed across the stream, or degra-dation exposed bedrock or pipelines, all of which would affect streambed adjustment and temporarily (over the duration of the structure) halt or dampen the progression of knickpoints (Simon, 1994). Although culverts could be considered grade-control structures, these were too numerous to document in full and were associated mainly with small streams in the upper parts of drainage basins.
Characterization of Recent Channel Widening
Widening over a period of about 2 years was documented by comparing the first-round and second-round survey data at primary sites to identify failures occurring at the top of the channel bank (TOB). These analyses were done on a subset of 73 of the primary sites that had extensive topographic survey data rather than only cross-sectional data. Comparing historical cross-sectional data over a longer period of time was explored as another method to document widening at the sites. However, with no horizontal control avail-able for historical cross-sectional surveys and geo-morphic variability along the stream channel, these comparisons were not made.
Contouring First-Round Survey Data
Topographic information provided by the first-round survey data identified many channel features such as TOB lines, failure surfaces, water surfaces, and thalwegs. From these data, contour lines were constructed using the contouring and surface mapping features of Surfer (Golden Software, Inc., 1995). For each reach, a surface grid was created from the survey data by using triangulation methods. Contour lines with elevation intervals of 0.5 m were developed from the grid and plotted on maps (fig. 4A). The first-round data were plotted with labels regarding each channel feature represented. When sufficient data were avail-
able, first-round data points were connected with yellow lines representing the TOB between the points.
Overlay of Second-Round Survey Data
Second-round TOB points were posted in red on top of the first-round contour plot (fig. 4A). Second-round surveys identified recent failures (indicated by vertical cut banks) along the tops of channel banks. When the second-round data plotted outside of the first round TOB line (and onto the flood plain), it was assumed that a failure had occurred there, and these TOB widening points were used in the characterization of the individual failure.
Characterization of Individual Top-of-Bank Failures
The basic geometry of each identified failure was documented. The TOB failure was defined by the second-round widening points and the adjacent second-round points that had not widened (fig. 4B). The failure was divided into segments that corre-sponded to the widening points. The observed widening of each segment, wi, was then the distance between the failure edge and the first-round TOB line. The length of each segment, li, was measured as the distance along the baseline between widening points i and i–1 (fig. 4B).
From these measurements of width and length, the area of the failure was computed. The area of an individual slice of the failure, Ai, was calculated by multiplying the respective failure widening distance, wi, by the average of the two adjacent lengths, li and li+1. Using this method, it was assumed that the measured widening distance at each second-round widening point represented the mean widening distance in a partial rectangular area (fig. 4B). The sum of the slice areas determined the area of the failure, Af, and the sum of the length segments determined the failure length, lf. The weighted failure width, wf, was calculated by dividing the failure area by its length. The dimensions of individual failures were then used to summarize widening and to compute widening rates at each site.
Computation of Widening Rates
Once all of the failures were characterized at each site, widening rates were computed for the entire site. All of the failure areas were summed into a total failed area, At. The unit widening (in failed area per unit length of TOB) for the entire site then was

20 Streambed Adjustment and Channel Widening in Eastern Nebraska
computed by dividing At by twice the length of the survey reach (because both banks were analyzed). The unit widening was divided by the time between first- and second-round surveys to compute the widening rate, expressed in meters of widening per year.
The widening rates produced by this method were computed for comparison purposes and are applicable to the 2-year period between the first- and second-round surveys only. As stated by Simon and Hupp (1992), bank failures in cohesive materials occur through discrete mass-wasting processes. Therefore, the computed widening rates are not exact measures of a continuous process, but average measures of an episodic process.
STREAMBED ADJUSTMENT
Multiple disturbances were identified in all but the Big Blue River Basin. Additionally, the effects of
grade-control structures have complicated streambed gradation responses at many of the sites studied. The majority of observed responses appear to be related to the various straightening efforts that have taken place in the study area, with streambed-elevation data sets at some sites showing 6 to 7 meters of degradation since the channel was straightened.
Straightening plans or historical accounts were available in the Papillion Creek, Elkhorn River, Salt Creek, Little Nemaha River, and Big Nemaha River Basins. At the sites in those basins that had been straightened, the original streambed elevation was esti-mated. Comparisons of the estimated original streambed elevation to the most recent data revealed the full magnitude of gradation response following the straightening. Because these espossible in a subset of the sites and only in certain basins, an unbiased comparison of gradation differences between basins is not possible.
A
B Area of detail
EXPLANATION
Second-round surveying point
w Widening observed at point i l
li+
Widening points
wi li+1
li
i
First-round surveying point
Contour lines and shading (as elevation decreases, shading gets darker blue)
First-round top-of-bank line
Second-round failure block definition
Individual slice of the failure having an area of Ai
Failure length from point i–1 to point i
Failure length from point i to point i+11
i
Figure 4. Characterization of top-of-bank (TOB) widening between first and second rounds of surveying by: (A) Identifying individual failures along the TOB, and (B) characterizing the geometry of each.

21 Streambed Adjustment and Channel Widening in Eastern Nebraska
Potential Study-Area-Wide Disturbances
Two potential disturbances were identified that transcended drainage basin boundaries and may have affected streams in some or all of the study area: (1) Chen and others (1999) determined that long-term changes to the MWSE had occurred at some sites along the Missouri River; and (2) agricultural develop-ment in Nebraska increased steadily until 1931 (fig. 5) (Nebraska Department of Agriculture and Inspection, 1957), which changed the land-use patterns in the study area and may have consequently altered streamflow and sediment-load characteristics.
Changes to the Median Water-Surface Elevation of the Missouri River
On the Missouri River, a navigation project and the construction of Gavins Point Dam in the upper end of the study area increased scouring energy in the river. Chen and others (1999) analyzed the MWSE at five sites on the Missouri River where it bordered Nebraska. They found significant downward trends at Yankton, South Dakota; Sioux City, Iowa; and Omaha, Nebraska, but insignificant trends at Nebraska City and Rulo, Nebraska (fig. 6). It was assumed that changes to the MWSE revealed streambed aggradation or degradation. Missouri River streambed degradation that occurred at the sites with downward trends could have migrated up into all of the basins studied except for the Big Blue River Basin. However, Chen and others (1999) found no significant changes in the MWSE of the Platte River, which receives the Elkhorn River and Salt Creek Basin flows, at Duncan, North Bend, or Ashland, Nebraska. A downward trend of the MWSE of the Platte River at Louisville, Nebraska, was probably caused by changes in site-specific grada-tion variables, such as stream width, streamflow discharge, or local slope (U.S. Army Corps of Engi-neers, written commun., 2000).
Agricultural Development in Nebraska
As Nebraska became settled, native areas that were predominantly prairie were converted to crop-land. There was a steady increase in the area of harvested crops until 1931, when the area of harvested crops decreased and then remained basically unchanged through 1990 (fig. 5) (Nebraska Depart-
ment of Agriculture and Inspection, 1957). Farming practices exposed soils to greater erosion and altered the rainfall infiltration capacity of the land, thereby affecting the sediment load and streamflow in the channels. However, as stated previously, changes to the streamflow have not been proven conclusively. Although few data exist on sediment load, the coarse materials that affect streambed-adjustment processes probably do not occur in appreciable amounts in the loess areas of eastern Nebraska.
1860 1880 1900 1920 1940 1960 1980 20000
2,000
4,000
6,000
8,000
TO
TA
L C
RO
P A
RE
A
HA
RV
ES
TE
D, I
N
HE
CT
AR
ES
X 1
,000
Missouri River Tributary Basins
Twenty-three sites in eight minor tributary basins to the Missouri River were studied for streambed-elevation change (fig. 6). The basins studied were the Bow Creek, Aowa Creek, Elk Creek, Omaha Creek, Elm Creek, New York Creek, Weeping Water Creek, and Honey Creek Basins.
Documented Disturbances, Knickpoints, and Grade-Control Structures
Nearly all of these basins may have been affected by the downward trend in MWSE of the Missouri River. However, the correlation between the river and its tributaries was unpredictable because of inconsistency in changes to the MWSE of the river and the long duration of the changes (1927 to 1981) as documented by Chen and others (1999). Local drainage districts (Nebraska Department of Roads and Irrigation, 1954) (table 5) straightened reaches of
Figure 5. Total area of harvested crops in Nebraska, 1866–1990.

STREAMBED ADJUSTMENT 22
EXPLANATION
Basin boundary
Missouri River Tributary straightening
Primary study site and identification
Supplemental study site and identification
Town
Knickpoints
Stream
Grade-control structures
0 5 10 MILES
0 5 10 KILOMETERS
Base from U.S. Geological Survey1:100,000 digital dataAlbers Equal-Area Conic projection Standard parallels 29˚30' and 45˚30'central meridian -96˚
PAPILLION
BELLEVUE
00'
Platte River
MRT-2 MRT-3
MRT- 1 MRT-4 MRT-6
MRT-5 MRT-8
MRT-7
MRT-10
MRT-9
MRT-B MRT-A
MRT-11
MRT-D MRT-C
MRT-12a MRT-12b
MRT-14 MRT-13 MRT-16
MRT-15
MRT-17 MRT-E
NEBRASKA CITY
RULO
SIOUX CITY, IOWA
YANKTON, SOUTH DAKOTA
OMAHA
S Omaha Creek
Elk Cre e k
Otter Creek
So
uth
Cre e k
New York Creek
Missouri R
iver
S Br Weeping Water Creek
Honey Creek
Weeping Water Creek
Omaha Creek
W. Bo w Creek
Bow
Cre
ek
Aowa Creek
Elm
Cree
k
97˚30'
42˚30'96˚30'
97˚
96˚
95˚30'
42˚
41˚30'
41˚
40˚30'
40˚
Location map
NebraskaStudy area
Study basins
MRT-13
MRT-E
Figure 6. Location of Missouri River Tributary Basins and associated study sites in Nebraska.

23 Streambed Adjustment and Channel Widening in Eastern Nebraska
some streams lying in the Missouri River flood plain (fig. 6). Although no documented drainage districts were associated with Aowa Creek, maps of the area showed straightening.
These disturbances may have led to knickpoints that migrated upstream throughout the basins (fig. 6). Knickpoints were observed in the Bow, Aowa, Elk, and Omaha Creek Basins. In the Aowa Creek Basin, knickpoints of up to 12 m in height were documented at the mouths of small tributaries in 1968 (Soil Conser-vation Service, 1968), and site MRT-8 on Elk Creek experienced degradation of almost 4 m (fig. 7).
In some cases, the progression of the degrada-tion was slowed or halted by culverts or other struc-tures that provided grade control. Structures were observed in the Omaha Creek Basin; the construction of a rock riffle in the 1950s at site MRT-10 (fig. 6) was probably in response to the large amount of degrada-tion that had already taken place there and has prob-ably prevented more degradation from migrating upstream.
Streambed Summaries
Nine of the 23 Missouri River Tributary Basins sites showed degradation responses greater than 1 m (table 6). Site MRT-8 showed the largest amount of change, with 3.7 m of degradation between 1931 and
1999, and most of the change had occurred by 1960 fig. 7). The streambed materials were coarser in the northeastern basins of Bow, Aowa, and Elk Creeks than in the rest of the basins studied (table 6).
Table 5. Drainage districts associated with Missouri River Tributary Basins
Drainage district nameStreams that may have been
straightenedDate drainage plans were approved
Burt-Washington County Drainage District No. 1 New York Creek August 2, 1915Burt-Washington County Drainage District No. 2 New York Creek February 19, 1925Dakota County Drainage District No. 2 Omaha Creek or Elk Creek April 18, 1914Homer Drainage District Omaha Creek January 10, 1919Dakota City Drainage District Elk Creek April 3, 1922Omadi Drainage District Omaha Creek December 13, 1924Dakota County Drainage District No. 5 Omaha Creek or Elk Creek July 10, 1930Peru Drainage District No. 6 Honey Creek April 19, 1927
1900331
332
333
334
335
336
337
ELE
VA
TIO
N, I
N M
ET
ER
S A
BO
VE
NG
VD
OF
192
9
1920 1940 1960 1980 2000
Figure 7. Streambed-elevation changes at Elk Creek at US20 (MRT-8).

STREAMBED ADJUSTMENT 24
Papillion Creek Basin
Extensive modifications in the Papillion Creek Basin (fig. 8) led to severe channel incision in the first half of the 20th century. Although flood control for the City of Omaha was improved by these modifications and subsequent incision, the bridges in this largely urban basin were threatened. Several grade-control structures were built, which affected the gradation
response. As the watershed became more urbanized, streamflow characteristics were altered, which may have disturbed the streambed. This urbanization also increased the potential damage from flooding, and some channels were widened and excavated beginning in the mid-1960s, which may have further disturbed the Papillion Creek Basin.
Table 6. Streambed summaries for sites in the Missouri River Tributary Basins
[ID, identification; RKM, river distance (in kilometers from the mouth); n, number of streambed elevation points used; ∆E, difference in streambed elevation between first and last streambed-elevation points, in meters; d50, median streambed grain-size diameter, in millimeters; GRV, very gravelly; S, sand; SIL, silt loam; SICL, silty clay loam; L, loam; LS, loamy sand; --, not available
Site ID RKM n∆E(m)
First year
Last year
d50(mm)
Textural class
Comments
Bow Creek Basin
MRT-1 38.0 4 –1.2 1965 1999 1.26 GRV SMRT-2 10.4 10 –0.8 1959 1998 0.44 SMRT-3 42.8 23 –0.2 1967 1999 0.74 S
Aowa Creek Basin
MRT-4 23.5 4 –1.0 1964 1998 0.04 SILMRT-5 33.2 8 –1.4 1972 1999 0.72 SMRT-6 12.7 5 0.4 1946 1998 0.72 S
Elk Creek Basin
MRT-7 31.6 4 0.6 1990 1999 0.76 SMRT-8 6.1 8 –3.7 1931 1999 0.03 SIL
Omaha Creek Basin
MRT-A 37.1 40 0.4 1951 1967 -- --MRT-B 33.9 42 –3.0 1951 1999 -- --MRT-9 29.9 21 –3.6 1940 1998 0.02 SILMRT-10 7.5 22 –0.8 1952 1996 0.02 SICL
Elm Creek Basin
MRT-11 1.3 6 –0.4 1933 1999 0.03 SILNew York Creek Basin
MRT-C 26.8 49 –1.4 1951 1965 -- --MRT-12a -- 6 –0.3 1951 1999 0.05 LMRT-12b 19.4 3 0.5 1988 1999 0.55 LSMRT-D 9.6 10 –0.1 1946 1975 -- -- A weir failed at the site in 1968.
Weeping Water Creek Basin
MRT-13 79.4 49 –0.8 1952 1999 0.03 SILMRT-14 44.7 14 –0.6 1952 1999 -- -- Cobble streambed.MRT-15 74.6 3 –1.0 1949 1997 0.47 SLMRT-16 10.1 48 –2.1 1931 1999 0.04 SIL
Honey Creek Basin
MRT-E 12.7 28 –0.9 1968 1978 -- --MRT-17 8.3 4 0.3 1971 1998 0.05 L

25 Streambed Adjustment and Channel Widening in Eastern Nebraska
6PC-
IPC-
9PC- PC-7
1PC- 10PC-
PC-8
11PC- 2PC-
APC- BPC-
CPC-
3PC-
JPC- KPC-
LPC- DPC-
EPC- 5PC-
GPC-
4PC- MPC-
PC-H FPC-
12PC-
OMAHA
PAPILLION
BELLEVUE
Eagle Run
NB
rPapillion
Creek
S Papillion Creek
Wehrspan
nC
reek
S Papillion Creektributary
WPapillion Creek
Big
Papillion
Creek
Little
PapillionCreek
Cole
Cre
ek
Papillion
Creek
96˚12'
41˚36'
96˚
41˚24'
41˚12'
Nebraska
Location Map
Study area
Studybasin
Base from U.S. Geological Survey1:100,000 digital dataAlbers Equal-Area Conic projection Standard parallels 29˚30' and 45˚30'central meridian -96˚00'
0 5 10 MILES
0 5 10 KILOMETERS
PC-2
PC-B
Little Papillion Creek straightening, 1965–68
Grade-control structures
EXPLANATION
Basin boundary
Original straightening
Primary study site and identification
Supplemental study site and identification
Town
Knickpoints
Stream
Figure 8. Location of the Papillion Creek Basin and associated study sites in Nebraska.

STREAMBED ADJUSTMENT 26
Documented Disturbances, Knickpoints, and Grade-Control Structures
Original Straightening
To protect Omaha from flooding, several drainage districts were formed between 1910 and 1928 (Soil Conservation Service, 1966), leading to exten-sive straightening of Papillion Creek and its tribu-taries. In addition to those districts documented by the Nebraska Department of Roads and Irrigation (1954) (table 7), historical accounts and records from the Nebraska State Historical Society indicate that much of Papillion Creek, Big Papillion Creek, and West Papillion Creek were straightened between 1910 and 1913. Unfortunately, no plans were available regarding this work.
This straightening led to headward-progressing degradation, which may have been the cause of a knickpoint observed in a tributary to Wehrspann Creek in 1998 (U.S. Army Corps of Engineers, 1998). Degra-dation was also documented in historical accounts by the USACE (1967b, p. 6);
Throughout the basin, stream characteris-tics have been changed radically within the past 60 years by channel straightening. The channels in the lower reaches of these streams have expe-rienced considerable scour and lateral erosion due to the increase in slope brought by the channel straightening. As would be expected, the channel erosion has caused problems over the years. The widening has required longer bridges, and degradation has necessitated measures to protect against undercutting. Lowering of the
streambed is slowly progressing upstream from the lower reaches of Papillion and Big Papillion Creeks and the West Branch, and problems are now being experienced in reaches farther upstream on these streams.
This disturbance led to the construction of several grade-control structures, generally at railroad-bridge crossings. One of these structures, just down-stream from site PC-J (table 2; fig. 8), was built in 1942 after 2.4 m of degradation had threatened the bridge (U.S. Army Corps of Engineers, 1967b).
The presence and, in some cases, alteration of grade-control structures affected the many Papillion Creek Basin streams. In 1957, at least seven structures were on West Papillion Creek, and South Papillion, Big Papillion, and Little Papillion Creeks each had one, according to survey data of the Soil Conservation Service. To prevent gully erosion in small subbasins, the Natural Resources Conservation Service constructed 27 structures (with 25 more planned) by 1996 (Natural Resources Conservation Service, 1996b). While in place, these structures prevented further degradation from migrating upstream. This was the case at sites PC-E, PC-D, PC-10, and PC-11 (fig. 8).
When structures were modified, some or all of the degradation that had been stopped was allowed to proceed upstream. On West Papillion Creek, a struc-ture was built at site PC-3 in 1948 (fig. 9) but had been removed or had failed sometime prior to 1957, according to survey data. This led to over 5 m of degradation at the site, which proceeded upstream until it reached another structure at site PC-B.
Table 7. Drainage districts of the Papillion Creek Basin
[From Nebraska Department of Roads and Irrigation, 1954]
Drainage district name Streams that may have been straightenedDate drainage plans
were approved
Little Papillion Drainage District Little Papillion Creek March 2, 1920East Omaha Drainage District Cole Creek October 8, 1921Papio Drainage Ditch No. 2 Big Papillion Creek June 5, 1926Bellevue Drainage District Papillion Creek August 4, 1921Chalco-Portal Drainage District West Papillion Creek and South Papillion Creek March 15, 1922Rudersdorf Drainage District West Papillion Creek, Papillion Creek, and Big Papillion Creek February 15, 1927Zimmerman Drainage District West Papillion Creek, Papillion Creek, and Big Papillion Creek March 16, 1929Eastern Sarpy Drainage District Papillion Creek February 28, 1951Papio Valley Drainage District Big Papillion Creek March 8, 1926

27 Streambed Adjustment and Channel Widening in Eastern Nebraska
Although this structure failed sometime before 1999 (when a knickpoint was observed just above the remnants of the structure), a comparison of data from the Federal Emergency Management Agency (1997) suggests that the structure might have failed before 1977, allowing degradation to proceed farther upstream. In 1961, the grade-control structure just downstream from site PC-J on Big Papillion Creek was lowered by 1.8 m (U.S. Army Corps of Engineers, 1967b), which allowed an equal amount of degrada-tion to proceed upstream (table 8).
Urbanization
During the last half of the 20th century, the Papillion Creek Basin changed from an agricultural watershed to a largely urban one. Before 1940, the basin was dedicated primarily to agriculture, but the end of World War II brought rapid urbanization of Omaha and its suburbs (U.S. Army Corps of Engi-neers, 1967b). A 1957 map of Omaha shows little development west of Little Papillion Creek, whereas in 1990 development was bordering West Papillion Creek (fig. 8). By 2000, Omaha had expanded west past West Papillion Creek. This urbanization also was reflected in the population of Douglas and Sarpy Counties, which doubled between 1940 and 1990 (Forstall, 1995).
Urbanization probably altered the streamflow and sediment-load characteristics of the streams, which might have disturbed their streambeds. While the land was being developed, increased erosion from construction projects would have increased the sediment supply in the streams and led to aggradation. Once development ceased, the land would have become more impermeable, leading to greater runoff and causing degradation through erosion processes. Urbanization was the likely cause of streambed-eleva-tion changes observed at site PC-H on West Papillion Creek (fig. 10), and it probably affected many of the other sites because urbanization encroached upon most of the streams in the basin.
December 6, 1952
July 6, 1998
1900295
296
297
298
299
ELE
VA
TIO
N, I
N M
ET
ER
S A
BO
VE
N
GV
D O
F 1
929
1920 1940 1960 1980 2000
Figure 9. Looking upstream at W Papillion Cr at US275 (PC-3).
Figure 10. Streambed-elevation changes at W Papillion Cr at 66th Street (PC-H).

STREAMBED ADJUSTMENT 28
Flood-Control Channel Modifications Since the 1960s
In addition to the effects on streamflow and sediment load, another consequence of urbanization in the basin was an increase in property damage caused by floods, as more development occurred in the flood plain. Only 6 percent of the monetary damages incurred by a flood in 1948 were classified as urban, whereas the urban property damages caused by a similar-sized flood in 1959 accounted for over half of the total monetary damages (U.S. Army Corps of Engineers, 1967b). Increased urban vulnerability led to more flood-control projects in the basin, consisting of channelization, channel widening, and the construc-tion of several reservoirs.
The USACE began several projects in the 1960s aimed at preventing flooding in the basin. The lower reaches of Papillion Creek, from the mouth to a point just below site PC-12, were widened and excavated in 1964. A reach of Little Papillion Creek from the mouth to approximately 3 river-kilometers (RKM) downstream from site PC-9 was realigned and enlarged between 1965 and 1968 (U.S. Army Corps of Engineers, 1989). The USACE (1968) stated that the bed was lowered, which included the lowering of the grade-control structure downstream from site PC-K. As part of these flood-control projects, the USACE made plans for a system of six reservoirs in the basin, of which five have been built. In addition to providing flood protection, these structures also have provided grade control on the streams. This occurred at PC-F (fig. 11; table 8), where degradation could have continued had it not been for the completion of one of these structures downstream in the mid-1980s, which created backwater conditions at the site and removed the erosive energy of the stream.
In addition to the work completed by the USACE, the Papio-Missouri River Natural Resources District (PMNRD) also completed flood-control channel modifications. Part of these modifications involved the widening and addition of levees to both Big Papillion Creek and West Papillion Creek (fig. 12) (Papio-Missouri River Natural Resources District, 2000). The work began in the late 1960s and continued in various segments through the year 2000 (Marlin Petermann, Papio-Missouri River Natural Resources District, oral commun., 2000). This work may not have disturbed the streambed, but it is possible that the change to the hydraulic characteristics of the channels may lead to gradation change.
Degradation of the Missouri River
Chen and others (1999) found that the MWSE of the Missouri River at Omaha dropped nearly 2 m between 1936 and 1952. This change may have affected Papillion Creek, whose confluence with the Missouri River is just downstream from the site studied by Chen and others (1999).
Streambed Summaries
Degradation of more than 1 m was observed at 14 of the 25 Papillion Creek Basin sites (table 8). Degradation since 1910 was estimated along the lower reaches of the main stem by using the 2.4 m of degra-dation that had been documented at PC-J by 1942 (U.S. Army Corps of Engineers, 1967b). It was
1900 1920 1940 1960 1980 2000329
330
331
332
333
ELE
VA
TIO
N, I
N M
ET
ER
S A
BO
VE
N
GV
D O
F 1
929
Figure 11. Streambed-elevation changes at Wehrspann Cr at N370 (PC-F).
Figure 12. Channel and levee construction, Big Papillion Creek (photograph from the Papio-Missouri River Natural Resources District).

29 Streambed Adjustment and Channel Widening in Eastern Nebraska
assumed that the same amount of degradation had occurred at the two main-stem sites (PC-M and PC-12) downstream. By this method, the 1910 bed elevations at sites PC-J, PC-M, and PC-12 were estimated (fig. 13; table 8). These streambed-elevation changes were probably the result of both the original straight-ening in the Papillion Creek Basin and the changes to the MWSE of the Missouri River. This degradation
undoubtedly migrated upstream, leading to channel incision and the subsequent construction of grade-control structures.
On the North Branch West Papillion Creek, the streambed-elevation data (table 8) did not match the channel incision observed at sites PC-1 and PC-2, but physical measurements of the cohesive strength of the streambed at multiple points led Langendoen and
Table 8. Streambed summaries for sites in the Papillion Creek Basin
[ID, identification; RKM, river distance (in kilometers from the mouth); n, number of streambed elevation points used; ∆E, difference in streambed elevation between first and last streambed-elevation points, in meters; d50, median streambed grain-size diameter, in millimeters; SICL, silty clay loam; S, sand; SL, sandy loam; L, loam; CL, clay loam; SIL, silt loam; --, not available]
Site ID RKM n∆E(m)
First year
Last year
d50(mm)
Textural class
Comments
PC-1 44.3 7 –0.2 1957 1998 0.02 SICLPC-2 39.9 7 –0.4 1957 1999 0.61 SPC-A 37.7 4 –1.4 1957 1999 -- --PC-B 37.0 4 –2.0 1957 1999 -- --PC-C 36.0 4 –2.6 1957 1999 -- --PC-3 34.1 8 –5.2 1952 1999 0.55 SL Removal/failure of grade-control structure occurred
between 1952 and 1957.PC-D 29.6 6 0.0 1957 1999 -- --PC-E 31.5 3 –0.1 1957 1992 -- -- Streambed is maintained by grade-control structure.PC-F 34.5 3 –2.4 1957 1989 -- -- Reservoir-induced backwater has occurred since the
mid-1980s.PC-G 27.8 2 –0.5 1957 1967 -- --PC-4 28.1 4 –1.9 1960 1999 0.05 LPC-5 24.6 27 –1.9 1948 1999 0.04 LPC-H 17.8 6 0.2 1956 1999 -- --PC-6 46.7 4 –0.8 1956 1986 0.03 CLPC-I 44.7 3 –1.4 1956 1990 -- --PC-7 36.5 16 –1.5 1956 1999 -- --PC-8 34.7 4 –0.7 1979 1999 0.03 LPC-J 25.0 5 –3.7 1910 1993 -- -- Most of the degradation was based on the estimate of
1910 streambed elevation.PC-9 25.0 31 –0.6 1950 1993 0.09 SLPC-10 32.9 4 –1.4 1967 1999 0.58 SL Streambed is maintained by grade-control structure.
0.02 SICL Sampled at a clay riffle 85-m downstream of culvert.PC-11 29.9 3 –0.5 1967 1997 0.88 S Streambed is maintained by grade-control structure.PC-K 24.1 5 –2.2 1956 1993 -- --PC-L 22.8 4 –0.6 1956 1993 -- --PC-M 16.2 5 –2.1 1910 1994 -- -- Most of the degradation was based on the estimate of
1910 streambed elevation.PC-12 8.9 33 –4.0 1910 1993 0.03 SIL Most of the degradation was based on the estimate of
1910 streambed elevation.

STREAMBED ADJUSTMENT 30
Simon (2000) to conclude that the resistance to degra-dation may increase with distance upstream in this area. Although the streambed particle size observed at PC-2 was sand (table 8), many hardpan clay riffles were observed at the site as well.
Platte River Tributary Basins
Seven minor tributary basins to the Platte River were studied for streambed-elevation changes: Shell Creek, Bone Creek, Skull Creek, Otoe Creek, Buffalo Creek, Springfield Creek, and Fourmile Creek Basins (fig. 14).
Documented Disturbances, Knickpoints, and Grade-Control Structures
All of the basins analyzed had local straight-ening of the individual streams in the Platte River flood plain. Three of the seven basins (Skull, Otoe, and Fourmile Creek Basins) also had basinwide straight-ening of the main stems of the streams.
Straightening in the Platte River Flood Plain
Local drainage districts and individual land-owners straightened reaches of streams lying in the Platte River flood plain (fig. 14). Although no drainage plans were available, the districts that may have straightened reaches of the Platte River tribu-taries studied here were formed between the early 1900s and the 1930s (table 9) (Nebraska Department of Roads and Irrigation, 1954). Reaches of Springfield
Creek and Fourmile Creek in the Platte River flood plain also were straightened, based on maps of the area, although the dates of these efforts are unknown.
A knickpoint was observed in the Buffalo Creek watershed in 1999, and channel incision led to the construction of 10 grade-stabilization structures throughout the basin in 1991 (Nebraska Natural Resources Commission, 1998). Another knickpoint was observed on Fourmile Creek just below PRT-12 in 1998, where rock riprap had been placed in the streambed to prevent upstream migration.
Basinwide Straightening
Three of the seven tributary basins studied have been straightened throughout most of the reaches of their main-stem streams. Frequent flooding of Skull Creek led to the channelization of nearly the entire drainage network by local interests from the early 1900s through 1946 (U.S. Army Corps of Engineers, 1965). Although the channelization of Otoe Creek and Fourmile Creek was not documented completely, it was identified by the lack of meanders in aerial photo-graphs, and approximate time frames of the work were isolated using sets of aerial photographs of various dates. Based on these photographs, Otoe Creek was straightened before 1949, and Fourmile Creek was straightened before 1941.
In response to streambed degradation on Skull Creek (fig. 15), at least five grade-control structures have been built (fig. 16). The installation date of these structures is unknown, but they appear to be recent (probably installed no earlier than 1990). Additionally, at a bridge over Skull Creek 1.6 RKM upstream from site PRT-5, a series of knickpoints (one of which had a 0.8-m vertical drop) were observed in September 1998 that had exposed the footings of the bridge piers. When the bridge was revisited in December 1998, all of the knickpoints had been inundated by construction of a structure similar to the one at site PRT-5 (fig. 16).
Straightening at PRT-3
Following a flash flood that occurred in 1963, a short reach of Bone Creek from just above PRT-3 to about 0.8 km below the site was straightened. No knickpoints were observed at the site, but because no sites are farther upstream, it is unknown if a degrada-tion response is migrating upstream.
Figure 13. Streambed-elevation changes at Big Papillion Cr at Cornhusker Rd (PC-M).
1900294
295
296
297
298E
LEV
AT
ION
, IN
ME
TE
RS
AB
OV
E
NG
VD
OF
192
9
1920 1940 1960 1980 2000

31S
treamb
ed A
dju
stmen
t and
Ch
ann
el Wid
enin
g in
Eastern
Neb
raska
PRT-1
PRT-2
PRT-6
PRT-4 PRT-7 PRT-8
PRT-5
PRT-3
PRT-9 PRT-11
PRT-10
PRT-13
PRT-12
COLUMBUS
LOUISVILLE
NORTH BEND
ASHLAND
DUNCAN
97˚30'
97˚
96˚30'
96˚
41˚
41˚30'
Nebraska
Location map
Study area
Study basins
0 5 10 MILES
0 5 10 KILOMETERS
Base from U.S. Geological Survey1:100,000 digital dataAlbers Equal-Area Conic projectionStandard parallels 29˚30' and 45˚30'central meridian -96˚00'
Straightening in the Platte River flood plain
Basinwide straightening
Grade-control structures
EXPLANATION
Basin boundary
Primary study site and identification
Town
Knickpoints
Stream
PRT-10
PlatteR
iver
Shell Creek
Bone Creek
Skull CreekOtoe Creek
Buffalo CreekSpringfield Creek
Fourmile Creek
Figure 14. Location of Platte River Tributary Basins and associated study sites in Nebraska.

32 Streambed Adjustment and Channel Widening in Eastern Nebraska
Streambed Summaries
The magnitude of degradation was greater in the three basins that had undergone basinwide straight-ening than in the other four basins that had only been straightened in the flood plain of the Platte River (table 10). In the three basins that were affected by both Platte River flood plain and basinwide straight-ening, most of the individual streambed data sets were not extensive enough to isolate changes caused by flood-plain straightening from those caused by basin-wide straightening. However, at site PRT-7, enough data exist that two episodes of degradation can be identified for the 4.1 m of degradation there (fig. 17) (table 10). The 3.2 m of degradation that occurred between 1938 and 1995 (0.06 m/yr (meters per year)) was assumed to be the result of basinwide straight-ening that occurred prior to 1949. The 0.9 m of degra-dation between 1995 and 1999 (0.23 m/yr) was probably the result of the headward progression of the disturbance caused by straightening of Otoe Creek in
the flood plain around 1930. This would mean the knickpoint took almost 60 years to migrate 9.5 RKM.
In the four basins where straightening only occurred in the Platte River flood plain, degradation probably migrated upstream, although some of the streambeds did not degrade much (table 10). For example, the channel near site PRT-4 was straightened around 1941 (based on aerial photographs and bridge plans), but the streambed had degraded 0.4 m by 1993. Chen and others (1999) found no significant change in the MWSE at site PRT-1. The data at sites PRT-9 and PRT-11 were not extensive enough to show streambed-elevation changes, but the channels at both sites and at other bridges over Buffalo and Springfield Creeks were deeply incised with no visible streambed deposi-tion and numerous vertical faces on the streambanks.
Not enough data were available at sites PRT-8 and PRT-13 to identify streambed-elevation changes. Both sites are affected by backwater from the Platte River. The change observed at PRT-3 was probably the result of localized straightening at the site in 1963.
Table 9. Drainage districts associated with selected Platte River tributaries
Drainage district nameStreams that may have been
straightenedDate drainage plans were
approved
Butler County Drainage District No. 1 Bone Creek or Skull Creek August 5, 1918Butler County Drainage District No. 2 Bone Creek or Skull Creek July 26, 1917Platte Valley Drainage District Shell Creek December 28, 1920Leshara Drainage District Otoe Creek September 18, 1930South Buffalo Creek Drainage District Buffalo Creek May 25, 1926
1900426
427
428
429
430
431
432
ELE
VA
TIO
N, I
N M
ET
ER
S A
BO
VE
N
GV
D O
F 1
929
1920 1940 1960 1980 2000
Figure 15. Streambed-elevation changes at Skull Creek at Butler County road (PRT-5).
Figure 16. Looking downstream at grade-control structure on Skull Creek at PRT-5.

33 Streambed Adjustment and Channel Widening in Eastern Nebraska
Elkhorn River Basin
Over a period of 50 years, several reaches of the Elkhorn River and some of its tributaries have been straightened by at least 15 different entities, which has led to channel instability in the Elkhorn River Basin. Because the Elkhorn River Basin extends west beyond the study area and into the Nebraska Sandhills, only streams in the eastern part of the basin were studied (fig. 18). This means that a larger supply of sand is in the Elkhorn River main stem than in other streams of the eastern part of the basin or of the remainder of the study area. As the Elkhorn River was straightened, the magnitude of the degradation response probably was reduced by the sand supply available.
Table 10. Streambed summaries for sites in the Platte River Tributary Basins
[ID, identification; RKM, river distance (in kilometers from the mouth); n, number of streambed elevation points used; ∆E, difference in streambed elevation between first and last streambed-elevation points, in meters; d50, median streambed grain-size diameter, in millimeters; SL, sandy loam; S, sand; SIL, silt loam; SICL, silty clay loam; L, loam; --, not available]
Site ID RKM n∆E(m)
First year
Last year
d50(mm)
Textural class
Comments
Shell Creek Basin
PRT-1 53.4 25 0.3 1947 1999 0.22 SL NonePRT-2 8.6 7 –0.8 1957 1998 0.47 S None
Bone Creek Basin
PRT-3 31.0 17 –1.4 1963 1999 0.03 SIL NonePRT-4 17.5 7 –0.9 1941 1998 0.03 SIL None
Skull Creek Basin
PRT-5 25.6 4 –3.1 1963 1997 0.02 SICL NonePRT-6 14.9 6 –1.0 1963 1999 0.70 SL None
Otoe Creek Basin
PRT-7 9.5 7 –4.1 1938 1999 0.02 SICL NonePRT-8 1.6 4 –0.6 1976 1999 0.05 L None
Buffalo Creek Basin
PRT-9 12.3 2 0.0 1998 1999 0.03 SIL NonePRT-10 1.8 6 –0.2 1951 1999 0.70 S None
Springfield Creek Basin
PRT-11 6.2 6 –0.6 1976 1999 0.03 SIL NoneFourmile Creek Basin
PRT-12 8.3 4 –3.0 1949 1999 0.02 SIL NonePRT-13 1.5 2 –1.4 1980 1998 -- -- None
1900 1920 1940 1960 1980 2000368
369
370
371
372
373
374
ELE
VA
TIO
N, I
N M
ET
ER
S A
BO
VE
N
GV
D O
F 1
929
Figure 17. Streambed-elevation changes at Otoe Cr at US77 (PRT-7).

STREAMBED ADJUSTMENT 34
10ER-
11ER- 13ER-
12ER-
4ER- 14ER-
1ER- 5ER-
3ER-
6ER- 2ER-ER-7
22ER-
16ER- 18 ER-
15ER- 8ER-
9ER-
19ER- 17ER- 20ER-
21ER- 23ER-
24ER-
25ER-
NORFOLK
WEST POINT
CONCORD
MADISON
S
Little Bell Creek
Hum
bugCreekElkhorn River
Elkhorn River
Uni
on
Creek
WFork
Maple
Creek
EF
orkM
a pleC
reek
Maple Creek
Rawhide Creek
Elkhorn
River
PebbleC
reek
Elkh
or n
River
PlumC
reek
Logan
Creek
Logan
Creek
Logan CreekDeer Creek
Middle Logan Creek
Dry Creek
Bell C
reek
42˚
42˚30'
97˚30'
96˚30'
41˚30'
97˚
Nebraska
Location map
Study area
Studybasin
0 5 10 MILES
0 5 10 KILOMETERS
EXPLANATION
Basin boundary
Primary study site and identification
Town
Knickpoints
Stream
Elkhorn River straightening
ER-2
Grade-control structures
Maple Creek straightening
Logan Creek straightening
Straightening on other tributaries
Base from U.S. Geological Survey1:100,000 digital dataAlbers Equal-Area Conic projectionStandard parallels 29˚30' and 45˚30'central meridian -96˚00'
Figure 18. Eastern part of the Elkhorn River Basin and associated study sites in Nebraska.

STREAMBED ADJUSTMENT 35
Documented Disturbances, Knickpoints, and Grade-Control Structures
Population growth in the Elkhorn River Basin in the late 1800s and early 1900s led to a greater need for flood protection (Kerstetter, 1992). As a result, several drainage districts were created (table 11) to straighten stream reaches. Additionally, aerial photographs show several more stream reaches that were straightened. Because so many individual straightening efforts occurred in this basin, discussions in this section of the report are grouped by stream system.
Straightening of the Elkhorn River
Three reaches of the Elkhorn River have been straightened (table 11). First, the lower 32 RKM of the Elkhorn River was straightened in 1914 (Kerstetter, 1992). Next, a short reach of the river near Norfolk was straightened in 1924. Then, between 1949 and 1952, meanders were removed from a 105 RKM-long reach of the river (fig. 18), changing the stream
gradient in that reach from 0.0026 m/m to 0.0040 m/m (Bentall, 1971).
Straightening of Logan Creek
Nearly the entire length of Logan Creek was straightened, as well as its north and south branches (table 11). Eight separate drainage districts completed the work between 1917 and 1926 (Kerstetter, 1992). In some cases, the dimensions of the channel were not uniform between districts. For example, whereas the Oakland Drainage District called for a 3.2-m-deep channel at its upstream end, the Wakefield Drainage District designed a 4.6-m-deep channel approximately 67 RKM upstream from the Oakland Drainage District. The cumulative effect of these districts on Logan Creek was a stream gradient that went from 0.0003 m/m in its natural state to 0.0006 m/m in its straightened state (Bentall, 1971).
This straightening led to streambed degradation on Logan Creek and its tributaries. At site ER-12, a
Table 11. Drainage districts associated with the Elkhorn River Basin
[NA, not available]
Drainage district name Streams that may have been straightenedDate drainage plans
were approved
Elkhorn River Drainage District1 Elkhorn River-lower 32 river kilometers1 1 1914NA Rawhide Creek1 1 Before 1911NA Logan Creek-Uehling, Nebraska area 1 1917–1926Oakland Drainage District Logan Creek-Oakland, Nebraska area 1 1917–1926Lyons Drainage District2 Logan Creek-Lyons, Nebraska area 1 1917–1926NA Logan Creek-Pender, Nebraska area 3 1918Pender Drainage District2 Logan Creek, Rattlesnake Creek-Pender, Nebraska area 2 February 28, 1951Wakefield Drainage District2 Logan Creek-Wakefield, Nebraska area 2 January 18, 1917North and South Logan Drainage District2 North Logan Creek and South Logan Creek 2 February 17, 1925Laurel Drainage District2 Middle Logan Creek 2 December 15, 1925Humbug Drainage District2 Humbug Creek 2 March 15, 1921Norfolk Drainage District2 Elkhorn River-Norfolk, Nebraska area1 2 March 18, 1924Bell Creek Drainage District2 Bell Creek 2 January 13, 1947West Maple Creek Drainage District4 Maple Creek-upstream from site ER-195 4 1960NA Elkhorn River-South border of Cuming County to Stanton,
Nebraska66 1949–1952
U.S. Army Corps of Engineers Union Creek-Madison, Nebraska area7 7 1965–19661 From Kerstetter, 1992. 2 From Nebraska Department of Roads and Irrigation, 1954. 3 From U.S. Army Corps of Engineers, 1993. 4 From Soil Conservation Service, 1971. 5 From aerial photographs on file at the Conservation and Survey Division of the University of Nebraska-Lincoln. 6 From Bentall, 1971. 7 From U.S. Army Corps of Engineers, 1980.

STREAMBED ADJUSTMENT 36
drop structure was constructed in the 1990s in response to a large knickpoint that had migrated upstream through the bridge location (fig. 19). Several more knickpoints were observed in 1998 just down-stream from that bridge. Unless it fails, this structure will halt the progress of degradation farther upstream into the South Logan Creek subbasin, thereby guarding site ER-11. Another knickpoint was observed approximately 25 RKM downstream from ER-10 on Middle Logan Creek near the town of Concord, Nebraska, in 1998 (U.S. Army Corps of Engineers, 1998).
Straightening of Maple Creek
In June 1944, the most damaging flood up to that time struck the Elkhorn River Basin. The Maple Creek Subbasin experienced the most severe flooding where the peak flow at site ER-21 exceeded the 500-year recurrence interval (Soenksen and others, 1999). To guard against future flooding, a drainage district was organized to straighten Maple Creek upstream from ER-19 (table 11). Aerial photography indicates that several other stream reaches also were straightened, including the main stem of Maple Creek downstream from site ER-19, most of East Fork Maple Creek, and some of West Fork Maple Creek (fig. 18).
This straightening probably led to a channel response in the Maple Creek Subbasin. Field observa-tions at bridges downstream from ER-18 and ER-16 show incised channels with vertical cut-banks and no deposition, including one where a knickpoint with a 0.9-m water-surface drop was present in 1999 (fig. 20). Although there is some rock riprap around it,
if this knickpoint migrates upstream, it will eventually cause degradation at site ER-18.
Straightening of Other Elkhorn River Tributaries
Other streams in the basin also were straight-ened. Drainage districts or the USACE performed channel modifications on Rawhide Creek (before 1911), Humbug Creek (in 1921), Bell Creek (in 1947), and Union Creek (in 1966) (table 11). Aerial photography revealed several other stream reaches that were straightened. Based on these photographs, Dry Creek, the lower reaches of Pebble Creek, and the upper reaches of Plum Creek were straightened some-time prior to 1938. Photographs from 1949 showed straightening in the upper reaches of Pebble Creek and its tributaries and the lower reaches of Plum Creek (fig. 18).
Streambed Summaries
Streambed-elevation changes to the Elkhorn River varied. ER-1 and ER-25 both show 1.1 to 1.4 m of degradation while ER-6 shows a small amount of aggradation (table 12). It is possible that the degrada-tion at ER-25 was in response to the straightening of the lower reaches of the river in 1914, whereas the degradation of ER-1 was caused by the straightening that took place in 1924 and 1949–52, thereby increasing the sediment load to ER-6. The streambeds at all three sites are dominated by sand (table 12).
When available, construction plans for Logan Creek were used to estimate streambed elevations following the straightening work done between 1917 and 1926. This straightening led to the degradation
Figure 19. Drop structure at S Logan Cr at N15 (ER-12). Figure 20. Knickpoint on East Fork Maple Creek located at SW1/4 sec. 26, T. 19 N., R. 4 E.

STREAMBED ADJUSTMENT 37
observed at sites ER-12, ER-13, ER-14, and ER-15 (fig. 21; table 12). Degradation at site ER-12 since 1990 is likely the result of local scour effects below the grade-control structure. This structure will guard against future degradation upstream from site ER-12, including at ER-11, which showed little gradation change from 1936 to 1997.
The Maple Creek modifications also affected its streambed (table 12). Degradation occurred between
1925 and 1960 at site ER-21, but aggradation has occurred since 1960. The data at sites ER-19 and ER-20 were not extensive enough to show streambed-elevation responses, although point bars were observed at both sites, indicating that they might also be aggrading. Although ER-16 and ER-18 showed little gradation change, the presence of incised chan-nels and knickpoints farther downstream indicate that degradation may be migrating upstream to the sites.
Table 12. Streambed summaries for sites in the Elkhorn River Basin
[ID, identification; RKM, river distance (in kilometers from the mouth); n, number of streambed-elevation points used; ∆E, difference in streambed- elevation between first and last streambed-elevation points, in meters; d50, median streambed grain-size diameter, in millimeters; S, sand; SIL, silt loam; SICL, silty clay loam; SIC, silty clay; SL, sandy loam; LS, loamy sand; --, not available]
Site ID RKM n∆E(m)
First year
Last year
d50(mm)
Textural class
Comments
ER-1 208.3 25 –1.1 1945 1997 0.32 SER-2 233.2 12 –0.9 1965 1998 0.023 SILER-3 195.4 1 -- 1998 1998 0.32 SER-4 185.9 3 –0.7 1937 1999 0.031 SILER-5 157.4 5 –2.0 1962 1999 0.017 SICLER-6 129.5 19 0.4 1953 1999 0.32 SER-7 156.5 4 –0.8 1973 1999 0.032 SILER-8 121.7 4 –0.8 1946 1999 0.016 SICER-9 104.8 11 –0.5 1978 1999 0.20 SLER-10 225.3 5 0.4 1945 1999 0.14 SLER-11 219.2 4 0.2 1936 1997 0.022 SICLER-12 198.2 4 –3.2 1967 1998 0.024 SIL Grade control structure at the site.ER-13 180.2 5 –2.3 1918 1997 0.73 S Most of the degradation was based on
the estimate of 1918 streambed elevation.
ER-14 154.2 17 –3.1 1919 1999 0.48 S Most of the degradation was based on the estimate of 1919 streambed elevation.
ER-15 94.3 29 –2.3 1917 1999 0.32 S Most of the degradation was based on the estimate of 1917 streambed elevation.
ER-16 151.9 4 0.0 1951 1999 0.030 SILER-17 136.6 5 –0.7 1957 1999 0.027 SILER-18 140.8 6 –0.7 1950 1999 0.019 SICLER-19 103.4 4 –1.0 1968 1998 0.38 SER-20 79.2 8 –1.4 1966 1999 0.46 SER-21 75.2 31 –0.5 1925 1996 0.25 SER-22 93.7 4 –1.2 1946 1999 0.016 SICLER-23 57.0 3 –0.5 1964 1999 0.027 SILER-24 56.3 3 –0.4 1947 1998 0.030 SIL The 1947 streambed elevation was
estimated.ER-25 22.3 48 –1.4 1928 1996 0.15 LS

STREAMBED ADJUSTMENT 38
Little data were available at the Pebble Creek and Plum Creek sites, although the data at all of these sites showed at least some degradation, and field reconnaissance of these streams revealed many incised channels. Modifications to Bell Creek in 1947 likely led to the degradation observed at all three sites in the Bell Creek subbasin. The sites on Union Creek did not appear to have been affected by the straightening of the creek that occurred in 1966.
Salt Creek Basin
Several disturbances to different reaches of the Salt Creek Basin have occurred that have greatly affected some streams in the basin, while leaving others relatively undisturbed. The original modifica-tions to Salt Creek and its tributaries in the Lincoln area (fig. 22) occurred in the late 1800s. The rest of Salt Creek downstream from Lincoln was straightened by cutting off meanders between 1917 and 1941 (Farrar and Gersib, 1991). In addition, individual reaches of several tributaries were straightened, although the time period and source of such work was not available. Streams in the Lincoln area also were affected by a combination of urbanization and flood-control projects in the 1960s.
Documented Disturbances, Knickpoints, and Grade-Control Structures
Original Channelization of Salt Creek
The original channelization of Salt Creek directly affected the main stem from its confluence with the Platte River upstream through the city of Lincoln. Work began in 1891, when the Lancaster County Sanitary District Number 1 was organized (Farrar and Gersib, 1991). Initial straightening and widening was completed on Salt Creek only in the area around Lincoln and parts of its tributaries, including the lower 0.8 km of Haines Branch, the lower 3.2 km of Middle Creek, the lower 6.4 km of Oak Creek (Farrar and Gersib, 1991), and the lower parts of Little Salt Creek, and Stevens Creek (U.S. Army Corps of Engineers, 1967a). Construction plans from this work in Lincoln indicated that Salt Creek would be constructed to an average channel depth of 4.9 m (the pre-modified depth at one location was 2.6 m) and an average channel width of 30.5 m (Brook and others, 1892). These plans were used to determine that about 3.5 m of degradation occurred at SC-13 following channelization (fig. 23).
A USGS flood measurement done in 1953 at SC-7 also provided historical information on the channel, which was constructed in 1917. Since construction, the channel at SC-7 has deepened by 4 m and undergone significant channel enlargement (fig. 24).
The reach of Salt Creek between Lincoln and the mouth near Ashland was straightened from 1917 to 1942, with most of the work occurring in the 1930s (Farrar and Gersib, 1991). The reach was straightened by cutting off meanders, and the overall slope of the stream increased. Although the straightening of Salt Creek extended beyond the borders of Lancaster County, the only documented drainage district in the basin was Lancaster County Sanitary District Number 1. At the lower end of the straightened work near Ashland, a bedrock outcrop served as a local grade control just downstream from SC-X until 1964, when the channel eroded around it.
Just below the confluence of Rock Creek with Salt Creek, at site SC-26, an estimated 2.0 m of degra-dation occurred from 1935 to 1983. A knickpoint from this disturbance likely migrated upstream into Rock Creek, leading to the degradation seen at site SC-V. However, the degradation exposed an outcrop of frac-
1900 1920 1940 1960 1980 2000367
368
369
370
371E
LEV
AT
ION
, IN
ME
TE
RS
AB
OV
E
NG
VD
OF
192
9
Figure 21. Streambed-elevation changes at Logan Cr at Dodge County Road 22 (ER-15).

39 Streambed Adjustment and Channel Widening in Eastern Nebraska
SC-31
32SC-
29SC-
30SC- 27SC-
WSC-
28SC-
33SC- 34SC-
9SC- 10SC-
XSC- 24SC- PSC-
OSC- NSC-
QSC-
25SC- RSC-
17SC- 14SC-
SSC-
15SC-
18SC-
TSC-
16SC-
USC- VSC-
26SC- 19SC-
20SC-
21SC- 12SC- 22SC-
11SC-
23SC- 13SC-
7SC-
6SC- 8SC-
MSC-
LSC-
JSC-
ISC- HSC-
GSC- 4SC- SC-F ESC-
DSC-
CSC- BSC-
ASC-
KSC-
5SC-
3SC-
2SC-
1SC-
ASHLAND
WAHOO
LINCOLN
Cottonwood
Creek
SandCreek
N. ForkWahoo Cre ek
Rock Creek
Little
Salt
N. O
akC
reek
OakC
reek
Deer Creek
W. Oak Creek
Creek
So. B r. Middle Cr
Middle Creek
Haines Branch
Salt Creek
Beal Slough
StevensCreek
Hickm
anBr
Olive Br
Salt
Creek
Wahoo Creek
Clear
Creek
Platte
River
JohnsonCreek
0 5 10 MILES
0 5 10 KILOMETERS
41˚15'
96˚45'
97˚
41˚
40˚45'
96˚30'
Original straightening, 1891–1942
SC-2
SC-B
Tributary straightening
Flood-control modifications, 1960s
Grade-control structures
Base from U.S. Geological Survey1:100,000 digital dataAlbers Equal-Area Conic projectionStandard parallels 29˚30' and 45˚30'central meridian -96˚00'
Location map
Nebraska
Study area
Studybasin
EXPLANATION
Basin boundary
Primary study site and identification
Supplemental study site and identification
Town
Knickpoints
Stream
Figure 22. Location of Salt Creek Basin and associated study sites in Nebraska.

STREAMBED ADJUSTMENT 40
tured Dakota sandstone between sites SC-V and SC-U that was observed in 1969 during a discharge measurement. An inadvertent grade-control structure was created on Rock Creek with the 1982 construction of a pipeline crossing 4.8 RKM upstream from the mouth, which was protected by grout pillows and armoring in 1987 (Natural Resources Conservation Service, 1996a). Additionally, two grade-control structures upstream from site SC-P and downstream from site SC-O were installed in the 1990s to prevent channel incision into the saline wetlands of the subbasin (Natural Resources Conservation Service, 1996a).
A grade-control structure has been in place on Stevens Creek near its mouth since at least 1965 (U.S. Army Corps of Engineers, 1967a), although degradation was observed at SC-23 over the same time period.
On Little Salt Creek, a knickpoint was observed at approximately RKM 52.5 (between sites SC-20 and SC-21) in 1999. Although the knickpoint could even-tually migrate upstream into the rest of the subbasin, the streambed there was protected by cobbles in 1999, which served as grade protection. The Little Salt Creek Subbasin also benefits from a low-head dam 2.2 RKM upstream from site SC-21, which may prevent future knickpoints from migrating upstream from it.
Individual Tributary Modifications
Although the original straightening of Salt Creek led to a response that could have affected the entire basin, the modifications to some Salt Creek trib-utaries created additional responses that were specific to the corresponding subbasins. In some cases, orga-nized drainage districts did this work, and in others it was probably the cumulative efforts of individual land-owners. The tributary subbasins studied that appeared to have been modified were Wahoo Creek, Rock Creek, Oak Creek, and Beal Slough. A reach of Salt Creek upstream from Lincoln (fig. 22) also was modified. Other tributaries were modified but were not analyzed for this study.
The stream-channel modifications in the Wahoo Creek Subbasin were not uniform along the tributary streams. Although the changes to Wahoo Creek and Cottonwood Creek were fairly localized, almost all of the tributary subbasins of Clear Creek and Sand Creek were straightened. The Clear Creek Drainage District straightened most of Clear Creek between 1925 and 1930 (Nebraska Department of Roads and Irrigation, 1954). Aerial photographs indicated that nearly the entire length of Sand Creek was straightened by 1955, which likely led to a response that migrated upstream through the subbasin. This work was probably the cause of the knickpoint (3.4-m drop in water surface over a 25.4-m distance) observed in 1997 at site SC-31 on a small, unnamed tributary (fig. 25). Although no historical data were available with which it could be compared, 1.1 m of degradation was observed at one point along this knickpoint between the first round of surveying in 1997 and the second round in 1999.
1900 1920 1940 1960 1980 2000339
340
341
342
343
344
345
ELE
VA
TIO
N, I
N M
ET
ER
S A
BO
VE
N
GV
D O
F 1
929
3550 10 20 30 40 50 60
357
359
361
363
365
ELE
VA
TIO
N, I
N M
ET
ER
S A
BO
VE
N
GV
D O
F 1
929
1917
1940
1953
1997
DISTANCE, IN METERS
Figure 23. Streambed-elevation changes at Salt Cr at N 27th St, Lincoln (SC-13).
Figure 24. Stream channel response at Middle Cr at US6 (SC-7) following 1917 straightening.

41 Streambed Adjustment and Channel Widening in Eastern Nebraska
Aerial photographs indicated straightening of several reaches of Rock Creek between 1940 and 1971. This work consisted mainly of meander cutoffs and occurred over an extended period of time.
Although the lower 6.4 km of Oak Creek was modified between 1909 and 1913, the straightened reach was extended upstream, to site SC-11 in the mid-1940s (Farrar and Gersib, 1991). Three weirs were installed on the lower reaches of Oak Creek (below site SC-11), which were built sometime prior to 1961 (U.S. Army Corps of Engineers, 1967a). Additionally, the USACE built a dam on Oak Creek at RKM 94 in the mid-1960s (Farrar and Gersib, 1991).
Local straightening of the lower 3.5 RKM of Beal Slough was completed prior to 1940. Although no historical data were available to verify it, pictures of the channel from 1954 at site SC-F showed a small but incised channel, indicating that the straightening probably caused some degradation in the subbasin.
Aerial photographs indicate that a short reach of Salt Creek just downstream from site SC-3 was straightened between 1949 and 1993.
Urbanization and Flood Control Modifications in the Lincoln Area
Urbanization altered the streamflow and sedi-ment load delivered to channels in the Lincoln area and increased the damage from flooding. According to U.S. census data, the population of Lancaster County, where Lincoln is located, was 155,000 persons in 1960, an increase of almost 50 percent over the 1940
population (Forstall, 1995). The Beal Slough subbasin has become particularly developed, growing from 40-percent urbanized in 1978 to 75-percent urbanized in 1997 (Lower Platte South Natural Resources District, 1999). This urbanization may have altered the amount of sediment delivered to the stream. During periods of increased development, erosion from the construction zones could have increased sediment load in the stream. Once these areas were developed, though, the sediment supply was cut off. Additionally, the streamflow would have increased in developed regions by creating impermeable areas. For example, at site SC-F on Beal Slough, a streamflow of 102 m3/s had a 50-year recurrence interval in 1986 but only a 7-year recurrence interval in 1997 (Lower Platte South Natural Resources District, 1999). The decrease in sediment supply and increase in streamflow would have caused stronger erosional forces to act on the stream channels.
Another consequence of urbanization was that further modifications were made to Salt Creek and its tributaries in the 1960s (U.S. Army Corps of Engi-neers, 1964). This work consisted mainly of channel widening and the addition of levees along the chan-nels, but a few reaches also were straightened, including the lower 0.8 RKM of Middle Creek and Salt Creek from its confluence with Haines Branch, upstream to its confluence with Beal Slough (U.S. Army Corps of Engineers, 1963).
These modifications to the channels around Lincoln led to channel responses and, in some cases,
92
93
94
95
96
97
98
ST
RE
AM
BE
D E
LEV
AT
ION
, IN
ME
TE
RS
A
BO
VE
AR
BIT
RA
RY
DA
TU
M
0 50 100 150 200 250 300 400
DISTANCE DOWNSTREAM FROM BRIDGE,IN METERS
07/17/1997
04/22/1999
A B
Figure 25. (A) Photograph of knickpoint and (B) streambed profile observed at Sand Cr Tributary at Saunders County Road 24 (SC-31).

STREAMBED ADJUSTMENT 42
subsequent installation of grade-control structures. On Haines Branch, a knickpoint that may migrate upstream was observed between sites SC-K and SC-5. In response to streambed degradation on Beal Slough, several grade-control structures have been built, including one just upstream from SC-H installed sometime after 1995 (fig. 26). Two culverts located between SC-G and SC-H also provide grade control.
Streambed Summaries
Thirty-two of the 58 sites studied in the Salt Creek Basin showed degradation greater than 1 m (table 13). The presence of bedrock outcrops and other grade-control structures added complexity to the responses. Because of the many disturbances, sites in the basin have likely undergone several episodes of streambed gradation. Though some of the site responses have been attributed to specific distur-bances, data were insufficient at many other sites to accurately characterize complex responses.
Streambed degradation caused by the original straightening of Salt Creek was computed at SC-13 (fig. 23) and SC-22 by estimating the constructed streambed elevation for a 4.9-m deep channel (table 13). Both sites show degradation that occurred before 1950. Further streambed change has occurred at the sites, but it is likely a result of another disturbance, such as that caused by urbanization and channel modi-fications of the 1960s. The streambed elevation change observed at SC-X was based on data available at the site prior to channel straightening. Since being straightened, the streambed there has aggraded.
Most of the channel response that resulted from the original channelization probably had progressed into the upper reaches of tributaries in the basin by 1999. Degradation responses were indicated in the 1960s in the lower reaches of Haines Branch, Little Salt Creek (fig. 27), Middle Creek, and Oak Creek (table 13). In the Middle Creek and Oak Creek Subba-sins, the lower sites have shown degradation whereas the upper sites have not yet been affected.
However, during the same time period, few erosion problems were reported for Stevens Creek (U.S. Army Corps of Engineers, 1967a). Salt Creek had evidently stabilized to channel depths of up to 7.6 m and widths of up to 45.7 m by 1961 (U.S. Army Corps of Engineers, 1963).
In addition to being used for these analyses, the data from these sites also were applied to a channel-evolution model to simulate long-term responses in the Little Salt Creek Subbasin. Langendoen and Simon (2000) describe the CONservational Channel Evolu-tion and Pollutant Transport System (CONCEPTS) model and results in detail. The model predicted 4.0 m of degradation at RKM 52.5 near site SC-20 and 1.5 m of degradation at site SC-19 in the next 60 years (Langendoen and Simon, 2000).
The stream channels at sites on North Fork Wahoo Creek (sites SC-27 and SC-28) and Cotton-wood Creek (sites SC-29 and SC-30) all were some-what incised with streambank-failure blocks present. However, streambed-elevation data showed no signifi-
1900 1920 1940 1960 1980 2000339
340
341
342
343
344
345
ELE
VA
TIO
N, I
N M
ET
ER
S A
BO
VE
N
GV
D O
F 1
929
Figure 26. Grade-control structure on Beal Slough upstream from Link 55W (SC-H).
Figure 27. Streambed-elevation changes at Little Salt Cr at Arbor Road (SC-21).

43 Streambed Adjustment and Channel Widening in Eastern Nebraska
Table 13. Streambed summaries for sites in the Salt Creek Basin
[ID, identification; RKM, river distance (in kilometers from the mouth); n, number of streambed-elevation points used; ∆E, difference in streambed elevation between first and last streambed-elevation points, in meters; d50, median streambed grain-size diameter, in millimeters; SIL, silt loam; SL, sandy loam; L, loam, CL, clay loam; SICL, silty clay loam; S, sand; LS, loamy sand; LSIL, loam silt loam; --, not available]
Site ID RKM n∆E(m)
First year
Last year
d50(mm)
Textural class
Comments
SC-1 122.8 10 –0.5 1956 1999 0.037 SILSC-2 106.1 15 –1.7 1939 1998 0.081 SLSC-3 87.6 23 –0.6 1951 1998 0.037 LSC-A 68.9 3 0.8 1961 2000 -- --SC-B 66.9 3 0.1 1961 2000 -- --SC-C 65.7 4 0.9 1961 2000 -- --SC-D 65.7 4 1.0 1961 2000 -- --SC-E 65.2 4 0.3 1961 2000 -- --SC-F 64.2 4 –1.5 1961 2000 -- --SC-4 64.1 7 –1.9 1961 1999 0.026 CLSC-G 64.0 4 –2.2 1961 2000 -- --SC-H 60.4 3 –2.6 1961 2000 -- --SC-I 59.3 3 –2.5 1961 2000 -- --SC-J 59.2 3 –2.8 1961 2000 -- --SC-5 78.2 5 –2.4 1939 1999 0.024 SICL A knickpoint is present at the site.SC-K 77.6 6 –2.2 1939 1999 -- --SC-L 61.3 2 –0.6 1962 1991 -- --SC-M 59.3 2 –0.3 1986 1991 -- --SC-6 79.4 6 –1.1 1940 1999 0.34 SSC-7 67.1 8 –4.2 1917 1999 0.40 SLSC-8 62.2 12 –1.2 1940 1999 0.45 LSSC-9 117.6 4 –0.1 1975 1999 0.52 SLSC-10 104.8 4 0.9 1975 1999 0.70 SSC-11 65.9 8 –3.4 1945 1999 0.58 SSC-12 68.3 7 –1.2 1940 1999 0.32 SL Rock riprap was installed on the
streambed in 1980s.SC-13 50.2 23 –4.4 1900 1996 0.65 S Most of the degradation was based on
the estimate of 1900 streambed elevation.
SC-14 64.4 2 0.2 1996 1998 0.049 LSC-15 62.0 4 –1.8 1975 1999 0.037 SILSC-16 61.1 6 –0.6 1939 1999 0.48 SLSC-17 67.5 3 –0.3 1997 1999 0.049 LSC-18 63.4 4 –0.9 1975 1999 0.038 SILSC-19 58.8 5 –0.5 1939 1998 0.13 LSC-20 54.0 4 0.1 1978 1999 0.055 LSC-21 48.4 18 –2.3 1965 1999 0.69 LS

STREAMBED ADJUSTMENT 44
SC-22 41.5 11 –4.9 1910 1999 0.75 S Most of the degradation was based on the estimate of 1910 streambed elevation.
SC-23 40.1 15 –1.0 1966 1999 0.023 LSILSC-24 55.7 9 –0.3 1943 1999 0.054 LSC-N 51.1 5 –0.7 1938 1994 -- --SC-O 48.9 5 –0.9 1943 1994 -- --SC-P 43.5 6 –1.9 1930 1994 -- --SC-Q 40.9 5 –2.7 1960 1994 -- --SC-25 38.1 29 –1.7 1967 1996 0.020 SICLSC-R 36.0 5 –2.3 1930 1994 -- --SC-S 33.8 7 –1.7 1939 1994 -- --SC-T 31.5 4 –1.5 1967 1994 -- --SC-U 28.2 5 –1.4 1960 1994 -- --SC-V 27.7 6 –2.5 1930 1994 -- --SC-26 21.0 34 –1.4 1953 1996 0.25 SLSC-27 87.6 14 –0.5 1953 1999 0.72 LSSC-28 72.3 17 0.0 1951 1998 0.050 LSC-29 89.9 3 –0.3 1996 1999 0.35 LSC-30 70.1 5 –0.2 1986 1998 0.034 LSC-31 85.2 2 –1.1 1997 1999 0.023 SICL A knickpoint is present at the site.SC-32 80.8 6 –1.7 1968 1999 0.69 SSC-W 56.8 3 –1.5 1959 1981 -- --SC-33 37.5 30 –0.5 1950 1996 0.24 SLSC-34 16.1 10 –0.3 1979 1999 0.15 SLSC-X 3.6 15 –4.3 1930 1990 -- -- Most of the degradation was an artifact
of the 1930 “pre-modified” streambed elevation.
Table 13. Streambed summaries for sites in the Salt Creek Basin—Continued
[ID, identification; RKM, river distance (in kilometers from the mouth); n, number of streambed-elevation points used; ∆E, difference in streambed elevation between first and last streambed-elevation points, in meters; d50, median streambed grain-size diameter, in millimeters; SIL, silt loam; SL, sandy loam; L, loam, CL, clay loam; SICL, silty clay loam; S, sand; LS, loamy sand; LSIL, loam silt loam; --, not available]
Site ID RKM n∆E(m)
First year
Last year
d50(mm)
Textural class
Comments
cant degradation over the period of the data (table 13) dating back to the 1950s at the North Fork Wahoo Creek sites. No significant degradation of Wahoo Creek at site SC-33 was apparent until 1967. This response may be specific to the site because no other sites in the Wahoo Creek Subbasin—upstream or downstream from SC-33—showed similar responses.
Analyses at the site in the Clear Creek Subbasin (site SC-34) did not show significant streambed-eleva-tion change (table 13), and the channel appeared to have changed little since it was altered. One possible
explanation for this lack of incision is the topography of the subbasin. Unlike the rest of the Salt Creek Basin, which drains rolling hills of glacial till (Dugan, 1984), the entire Clear Creek subbasin drains an aban-doned flood plain of the Platte River (Soil Conserva-tion Service, 1965). Less stream energy is associated with the gentle grade of the flood plain than that of rolling hills, which may be the reason that incision has not occurred.

45 Streambed Adjustment and Channel Widening in Eastern Nebraska
The Sand Creek stream channels appeared more incised than those of Cottonwood Creek and North-Fork Wahoo Creek. Streambed-elevation data further verified this difference (table 13).
Urbanization may have caused the aggradation seen at all Beal Slough sites upstream from SC-E (table 13), where development in the upper parts of the subbasin is still occurring. Streambed degradation of Beal Slough downstream from SC-F may have been caused by both urbanization (which increased stream-flow) as well as the migration of a response from the original channelization, which may have been stopped by the culvert at SC-F. Although Beal Slough is aggrading upstream from SC-F, severe head cutting between sites SC-B and SC-C was observed in 1997 when a new culvert was installed at a lower elevation than the previous culvert (Olsson Associates and Wright Water Engineers, 2000).
Little Nemaha River Basin
Documented Disturbances, Knickpoints, and Grade-Control Structures
The Little Nemaha River was dredged and straightened in the early 1900s (fig. 28). These distur-bances have been the primary cause of channel insta-bilities in the basin, although most streambed effects already have occurred. Straightening of the South Fork Little Nemaha River and Muddy Creek in the late 1940s and early 1950s caused further instability in those subbasins.
Original Straightening
In the late 1800s and early 1900s, flooding in the Little Nemaha River Basin was becoming increas-ingly frequent, even though weather records indicated no increase in precipitation in that time period (Mears, 1912). The channel had lost as much as 30 percent of its capacity from the accumulation of cut timber and sediment in the channel (Mears, 1912) and was aggrading (Moore, 1915). To rectify this situation, drainage districts were formed (table 14), and the Little Nemaha River, along with some of its tribu-taries, was straightened and cleared of vegetation from its mouth upstream to Syracuse, Nebraska (fig. 28) (Moore, 1915). In Nemaha County, the Little Nemaha River was designed to a 4.27-m depth, and the tribu-
tary streams were to be 0.9- to 3.7-m deep (Mears, 1912).
Knickpoints created by this disturbance seemed to have migrated to the upstream sites in the 1960s and likely have progressed to the upper reaches of the tributaries in the basin. In 1998, a steepened reach with an incised channel was observed on Spring Creek approximately 3.5 RKM upstream from LNR-11 (fig. 29), which may have been the result of this chan-nelization.
Culverts are common in the upper parts of the basin because the streams are smaller, and therefore, knickpoints may be prevented from migrating any farther upstream. At LNR-A, the bridge was replaced by a culvert, but not before 3.0 m of degradation had occurred. In addition to the culverts, a grade-control structure on the North Fork Little Nemaha River near Lorton, Nebraska, was installed in the late 1980s to protect the channel from a large overfall that was migrating upstream.
Channelization in the South Fork Little Nemaha River and Muddy Creek Subbasins
Channelization was extended on the South Fork Little Nemaha River and Muddy Creek between 1947 and 1953. The modifications on the South Fork Little Nemaha River appear to have been extended from the Otoe-Johnson County line to a point about 10 RKM upstream in the late 1940s (fig. 28). Aerial photo-graphs of the stream at site LNR-8 in the 1940s show an incised channel with numerous point bars, indi-cating that the South Fork Little Nemaha River already had degraded from the original modifications and probably was aggrading when the channelization was extended.
The Muddy Creek modifications were extended from about 1 RKM upstream from the confluence with the Little Nemaha River to about 10 RKM upstream from the confluence, or just upstream from site LNR-6 (fig. 28), in the late 1940s and early 1950s. Aerial photographs from 1949 of the channel upstream from where the modifications were completed show little or no incision, indicating that the disturbance caused by the original modifications had not yet migrated upstream through the subbasin before the channeliza-tion was extended. In response to the large amount of degradation at site LNR-B (6.6 m between 1946 and 1978), a grade-control structure was installed at the site in 1979 that has stabilized the streambed. A steep-ened reach that was presumably a result of the original Muddy Creek disturbance was observed approxi-

ST
RE
AM
BE
D A
DJU
ST
ME
NT
46
3LNR-
LNR-12
4LNR-
1LNR- 2LNR- 13LNR- ALNR-
5LNR-
7LNR- 15LNR-
6LNR-
BLNR- LNR-14
11LNR-
8LNR- 16LNR-
9LNR-
17LNR-
10LNR-
19LNR-
18LNR-
AUBURN
SYRACUSE
LORTON
Whi
skey
Ru
n
Little Nemaha River
Rock
Creek
N. F
orkL
ittleN
emaha
River
M
uddy Creek
S. Fork Little Nemaha River
Spr
ing
Cre
ek
Silver
Cre
ekLittle Nemaha River
Hooper Creek
Wolf C
reek
41˚15'
96˚45'
96˚
96˚15'
40˚30'
40˚45'
96˚30'
0 5 10 MILES
0 5 10 KILOMETERS
Nebraska
Location map
Study area
Studybasin
Base from U.S. Geological Survey1:100,000 digital dataAlbers Equal-Area Conic projection Standard parallels 29˚30' and 45˚30'central meridian -96˚00'
EXPLANATION
LNR-2
LNR-B
Channelization in the South Fork, Little Nemaha and Muddy Creek subbasins
Grade-control structures
Basin boundary
Original straightening
Primary study site and identification
Supplemental study sites and identification
Town
Knickpoints
Stream
Figure 28. Location of the Little Nemaha River Basin and associated study sites in Nebraska.

47 Streambed Adjustment and Channel Widening in Eastern Nebraska
mately 8 RKM upstream from site LNR-6 in 1995, where the stream gradient was approximately 0.050 m/m.
Streambed Summaries
The amount of streambed gradation that followed the original channelization was estimated at six sites by determining the original constructed streambed elevations from the planned channel dimen-sions (Mears, 1912). For the purposes of this report, it was assumed that the design depth of the main ditch at LNR-5 and LNR-14 in Otoe County was similar to that in Nemaha County. Additionally, a 3.7-m constructed tributary depth (based on Mears, 1912) was assumed for site LNR-8. The results of this study indicate that the straightened reaches of the Little Nemaha River Basin have degraded substantiallysince the original channelization was completed (table 15).
Table 14. Drainage districts associated with the Little Nemaha River Basin
Drainage district name1 Streams that may have been straightenedDate drainage
plans were approved1
Nemaha County Drainage District No. 2 Little Nemaha River 21910Nemaha County Drainage District No. 3 Little Nemaha River July 6, 1916Otoe-Johnson County Drainage District No. 1 North Fork, South Fork, and main 4stem of
Little Nemaha River, and Muddy CreekOctober 31, 1914
Otoe-Johnson County Drainage District No. 1 (Spring Creek cut-off)
Spring Creek September 15, 1932
1 From Nebraska Department of Roads and Irrigation, 1954. 2 From Mears, 1912.
Presumably, this response has migrated into the upper reaches of the basin and has caused channel incision.
Two of the three sites in the South Fork Little Nemaha River subbasin (LNR-8 and LNR-9) showed a response probably caused by the straightening in the subbasin between 1947 and 1953 (fig. 30; table 15). The third site, LNR-7, which is in the upper reaches of the subbasin, seems presently to be aggrading in response to the original channelization. This would indicate that a knickpoint created by the extension of the work may still be migrating upstream through the subbasin and is located between sites LNR-7 and LNR-8. Sites in the Muddy Creek subbasin had the most streambed degradation of any of the sites in the basin, with 6.0 m of change at LNR-B and 5.4 m of change at LNR-6 (table 15).
310
311
312
313
314
315
316
ELE
VA
TIO
N, I
N M
ET
ER
S A
BO
VE
N
GV
D O
F 1
929
1900 1920 1940 1960 1980 2000
Figure 29. Channel incision observed in 1998 on Spring Creek about 3.5 kilometers upstream from LNR-11.
Figure 30. Streambed-elevation changes at S Fk Little Nemaha River at N50 (LNR-8).
STREAMBED ADJUSTMENT 48
Table 15. Streambed summaries for sites in the Little Nemaha River Basin
[ID, identification; RKM, river distance (in kilometers from the mouth); n, number of streambed elevation points used; ∆E, difference in streambed elevation between first and last streambed-elevation points, in meters; d50, median streambed grain-size diameter, in millimeters; L, loam; SICL, silty clay loam; SIL, silt loam; S, sand; SL, sandy loam; GR, gravelly; LS, loamy sand; --, not available]
Site ID RKM n∆E(m)
First year
Last year
d50(mm)
Textural class
Comments
LNR-1 108.0 6 –0.8 1961 1999 0.039 LLNR-2 92.3 5 –1.8 1951 1999 0.018 SICLLNR-3 98.3 3 –0.3 1983 1997 0.019 SICLLNR-4 83.7 58 –2.1 1951 1999 0.027 SILLNR-A 68.9 80 –3.0 1950 2000 -- --LNR-5 61.5 24 –4.3 1914 1999 0.61 S Most of the degradation was based on the estimate
of 1914 streambed elevation.LNR-6 62.8 5 –5.4 1953 1999 0.31 SL Some of the degradation was based on the estimate
of 1953 streambed elevation.LNR-B 56.5 5 –6.0 1946 1997 -- --LNR-7 95.1 6 –2.0 1965 1999 0.66 GR SLNR-8 62.7 6 –5.4 1920 1999 0.71 S Most of the degradation was based on the estimate
of 1920 streambed elevation.LNR-9 73.4 5 –1.4 1948 1999 0.54 SLLNR-10 80.0 4 –0.2 1964 1999 0.032 SILLNR-11 57.0 5 –1.6 1962 1999 0.69 LSLNR-12 82.9 5 –1.6 1957 1999 0.050 SILLNR-13 63.1 4 0.3 1963 1999 0.031 SILLNR-14 41.7 7 –3.7 1912 1997 0.74 S Most of the degradation was based on the estimate
of 1912 streambed elevation.LNR-15 47.5 4 –0.4 1955 1999 0.044 SILLNR-16 32.3 5 –1.9 1960 1999 0.019 SICLLNR-17 16.8 22 –1.7 1912 1997 0.82 GR S Some of the degradation was based on the estimate
of 1912 streambed elevation.LNR-18 2.5 4 1.3 1912 1998 0.017 SICL The 1912 streambed elevation was estimated.LNR-19 2.0 7 1.4 1912 1998 0.026 SIL The 1912 streambed elevation was estimated.

49 Streambed Adjustment and Channel Widening in Eastern Nebraska
Big Nemaha River Basin
Documented Disturbances, Knickpoints, and Grade-Control Structures
Dredging and straightening of the main stems of streams in the Big Nemaha River Basin (fig. 31) in the early 1900s have been the primary cause of channel instabilities in the basin, although most of the effects to the streambed already have occurred.
In response to flooding in the basin, most of Muddy Creek (a separate stream from that of the Little Nemaha River Basin), the Big Nemaha River, and parts of its North and South Forks were channelized in the early 1900s (fig. 31). In addition to the work done in Nebraska by several drainage districts (table 16), reaches of the South Fork Big Nemaha River in Kansas also were channelized, probably at about the same time as the work was completed in Nebraska. Constructed channel depths were not given for most drainage districts, but Moore (1915) reported that the Richardson County Drainage District No. 2 dug a channel 6 m deep and 9 m wide in the North Fork Big Nemaha River. In addition to the original work done on Muddy Creek around 1917, a short reach near site BNR-16 was rechannelized by Richardson County Drainage District No. 6 in 1936 (fig. 31).
The channels in the basin began degrading and widening almost immediately after being channelized. Five years after it was channelized in 1909, the channel at BNR-9 had degraded considerably and had
doubled in width (U.S. Army Corps of Engineers, 1995) (fig. 32). Most of the knickpoints created by this disturbance have already migrated into the upper reaches of the basin. Two knickpoints were observed on small tributaries to Muddy Creek near BNR-17. Exposed bedrock serves as a grade-control structure in the streambeds of BNR-9, BNR-12, and BNR-14.
Streambed Summaries
The results of this study agree with those of a study done by the USACE in 1995, which indicated that although they have degraded considerably (table 17), the channelized streams in the Big Nemaha River system are no longer degrading in response to the straightening completed in the 1900s. For example, BNR-14 experienced 4.5 m of degradation between 1905 and 1982 but only 0.1 m of aggradation since 1982 (table 17). A degrading channel response to this disturbance is probably still occurring in the upper reaches of the basin. A knickpoint may have migrated through site BNR-11 on Turkey Creek sometime around 1968 but has yet to reach BNR-10 (Rus and Soenksen, 1998). The degradation occurring in the middle and upper reaches of Turkey Creek may be the cause of aggradation seen in the lower reaches (table 17) (Drees and others, 1996). The upper reaches of other tributaries were still undergoing incision as late as 1972 (Soil Conservation Service, 1972), and site BNR-1 at RKM 143.0 may have begun responding to this disturbance as late as 1980.
Table 16. Drainage districts associated with the Big Nemaha River Basin
Drainage district name1 Streams that may have been straightenedDate drainage plans
were approved1
Richardson County Drainage District No. 1 Big Nemaha River, North Fork Big Nemaha River, and South Fork Big Nemaha River
19042
Richardson County Drainage District No. 2 North Fork Big Nemaha River 19092
Richardson County Drainage District No. 3 Big Nemaha River, North Fork Big Nemaha River, South Fork Big Nemaha River, and Muddy Creek
December 24, 1921
Richardson County Drainage District No. 4 Big Nemaha River, North Fork Big Nemaha River, South Fork Big Nemaha River, and Muddy Creek
April 13, 1916
Richardson County Drainage District No. 5 Big Nemaha River, North Fork Big Nemaha River, South Fork Big Nemaha River, and Muddy Creek
May 8, 1920
Richardson County Drainage District No. 6 Muddy Creek September 18, 1930Nemaha County Drainage District No. 3 Muddy Creek July 6, 1916Pawnee County Drainage District No. 12 North Fork Big Nemaha River Around 19122
Johnson County Drainage District No. 12 North Fork Big Nemaha River Around 19142
1 Unless otherwise noted, from Nebraska Department of Roads and Irrigation, 1954. 2 From Moore, 1915.

STREAMBED ADJUSTMENT 50
ek
1BNR-
BNR-2
BNR- 3
BNR-15
6BNR-
BNR- 5
4BNR-
BNR- 7BNR-16
BNR-10
8BNR-
9BNR-
BNR-17
BNR-11
BNR-13BNR-14
BNR-12
ABNR-
TurkeyC
reek
Johnson Creek
S Fk Big Nemaha River
N Fk Big Nemaha River
Big Nemaha Rive r
Nebraska
Kansas
40˚
40˚30'
95˚30'
96˚
96˚30'
Base from U.S. Geological Survey1:100,000 digital dataAlbers Equal-Area Conic projectionStandard parallels 29˚30' and 45˚30'central meridian -96˚00'
Location map
Study area
Studybasin
0 5 10 MILES
0 5 10 KILOMETERS
EXPLANATION
Basin boundary
Original straightening, 1904–30
BNR-2
BNR-A
Primary study site and identification
Supplemental study site and identification
Town
Knickpoints
Stream
Rechannelized area, 1936
Falls City
Humbolt
Tecumseh
Rulo
Middle Br Big Tecumseh Riv erYa
nkeeCreek
LongBranch
Creek
Kirkham
Cr
Figure 31. Location of the Big Nemaha River Basin and associated study sites in Nebraska.

51 Streambed Adjustment and Channel Widening in Eastern Nebraska
Table 17. Streambed summaries for sites in the Big Nemaha River Basin
[ID, identification; RKM, river distance (in kilometers from the mouth); n, number of streambed-elevation points used; ∆E, difference in streambed elevation between first and last streambed-elevation points, in meters; d50, median streambed grain-size diameter, in millimeters; SL, sandy loam; S, sand; LS, loamy sand; SIL, silt loam; GRX, extremely gravelly; L, loam; --, not available]
Site ID RKM n∆E(m)
First year
Last year
d50(mm)
Textural class
Comments
BNR-1 143.0 4 –1.1 1980 1999 0.28 SLBNR-2 152.6 7 –1.5 1962 1999 0.093 SLBNR-3 137.6 5 –1.9 1954 1999 0.36 SLBNR-4 131.3 4 –1.8 1979 1999 0.082 SBNR-5 111.5 8 –3.7 1917 1999 0.65 LS Most of the degradation was based on the
estimate of 1917 streambed elevation.BNR-6 99.9 8 –3.9 1914 1999 0.029 SIL Most of the degradation was based on the
estimate of 1914 streambed elevation.BNR-7 82.6 5 –0.8 1957 1999 0.38 SBNR-8 65.7 3 –0.1 1968 1999 0.18 SLBNR-9 58.9 31 –7.9 1916 1999 0.61 S Most of the degradation was based on the
estimate of 1916 streambed elevation.BNR-10 180.2 4 –0.6 1968 1999 0.031 SILBNR-11 136.3 8 –3.0 1949 1999 0.44 LSBNR-12 132.7 4 0.2 1964 1999 10 GRX S Cobble streambed.BNR-A 100.5 32 0.2 1958 1994 -- --BNR-13 64.3 3 –2.3 1959 1997 0.47 SLBNR-14 22.2 34 –4.4 1905 1993 0.55 S Most of the degradation was based on the
estimate of 1905 streambed elevation.BNR-15 77.8 8 –2.9 1935 1999 0.074 LBNR-16 53.0 8 –7.7 1927 1999 0.25 SLBNR-17 35.2 17 –2.6 1921 1999 0.55 S Most of the degradation was based on the
estimate of 1921 streambed elevation.

STREAMBED ADJUSTMENT 52
Big Blue River Basin
Because of a lack of channelization and the presence of grade-control structures, most sites in the Big Blue River Basin (fig. 33) did not show stream-bed-elevation changes similar to those observed in other basins. However, local straightening was completed on a few tributary subbasins and gradation responses were observed.
Documented Disturbances, Knickpoints, and Grade-Control Structures
Local reaches of several tributaries to the Big Blue River were straightened over the years, which in some cases likely instigated responses within those tributary subbasins. The tributaries that show evidence of straightening in local reaches include the North Branch Big Blue River, Kezan Creek, Indian Creek, and Big Indian Creek (fig. 33).
Aerial photographs show that the middle and upper reaches of Kezan Creek were straightened prior to 1938. A knickpoint with a 0.25-m water surface drop over a 2.3-m distance was observed 150 m upstream from the bridge at site BBR-3 in 1997. Photographs of the site from 1985 show what appears to be a knickpoint about 50 m upstream from the bridge. If the 1985 knickpoint is the same as that observed in 1997, the knickpoint is moving approxi-mately 8 m/yr.
Flooding problems in Beatrice, Nebraska, prompted channel modifications on Indian Creek between 1944 and 1946 (U.S. Army Corps of Engi-neers, 1970). These modifications extended from the confluence with the Big Blue River upstream approxi-mately 1.8 km, and consisted of a channel with a 15-m-bottom width and 1:1.5 bank slopes (U.S. Army Corps of Engineers, 1970). Additionally, rock riprap was added to the bed in the vicinity of this site to protect it from degradation.
To reduce flooding in local areas, individual landowners straightened short reaches of Big Indian Creek, which resulted in bank erosion and channel degradation (Soil Conservation Service, 1962). A grade-control structure was in place since at least 1998 on Big Indian Creek between sites BBR-11 and BBR-12 (fig. 34). Much of the lower basin overlies Quater-nary-age deposits of shale and sandstone (Swinehart and others, 1994), which provided an erosion-resistant surface once it was exposed.
Although no large-scale straightening was performed on the Big Blue River, up to 20 overflow dams (dams just above the low-water level) provide grade control (Nebraska Soil and Water Conservation Commission, 1968). Originally built for power production, some of these dams have been in place since the 1860s. Although scour effects occurred downstream from these overflow dams, the scoured reaches were relatively short and did not lead to measured degradation except at site BBR-13, which was 1.1 km downstream from one of these struc-tures.
Streambed Summaries
Of the six sites on tributaries that have been straightened, only BBR-12 showed any streambed degradation greater than 1 meter (table 18). This may be a result of grade-control structures, but also might be the result of insufficient data at the other sites. Bedrock currently is exposed at site BBR-12, which has effectively halted any further degradation.
1900286
287
288
289
290
291
292
293
294
295
296E
LEV
AT
ION
, IN
ME
TE
RS
AB
OV
E
NG
VD
OF
192
9
1920 1940 1960 1980 2000
Figure 32. Streambed-elevation changes at N Fk Big Nemaha R at N105 (BNR-9).

53 Streambed Adjustment and Channel Widening in Eastern Nebraska
BBR-3
BBR-2
BBR-1 BBR-4
BBR-5
BBR-6
BBR-8
BBR-7
BBR-9
BBR-10
BBR-12BBR-11
BBR-13
BEATRICE
BARNESTON
Kezan Creek
Big
Blue R
iver
Big
Blu
e R
ive r
Big Blue River
N Br Big B
lue
River
Big Indian Creek
In
ndia
Cre
ek
Turkey Creek
41˚
40˚30'
40˚
39˚30'
97˚
97˚30'
98˚30'
98˚
96˚30Base from U.S. Geological Survey1:100,000 digital dataAlbers Equal-Area Conic projectionStandard parallels 29˚30' and 45˚30'central meridian -96˚00'
0 5 10 MILES
0 5 10 KILOMETERS
EXPLANATION
Channelized stream reach
BBR-2
Grade-control structures
Basin boundary
Primary study site and identification
Town
Knickpoints
Stream
Nebraska
Location map
Study area
Studybasin
Kansas
Figure 33. Location of the Big Blue River Basin and associated study sites in Nebraska.

STREAMBED ADJUSTMENT 54
Table 18. Streambed summaries for sites in the Big Blue River Basin
[ID, identification; RKM, river distance (in kilometers from the mouth); n, number of streambed elevation points used; ∆E, difference in streambed elevation between first and last streambed-elevation points, in meters; d50, median streambed grain-size diameter, in millimeters; SIL, silt loam; L, loam; S, sand; GR, gravelly; SL, sandy loam; --, not available]
Site ID RKM n∆E(m)
First year
Last year
d50(mm)
Textural class
Comments
BBR-1 265.3 9 0.0 1964 1999 0.026 SIL The site is in backwater conditions created by low-head dam downstream.
BBR-2 293.7 3 0.1 1971 1999 0.027 SILBBR-3 273.1 4 –0.3 1970 1999 -- --BBR-4 249.6 6 –0.9 1969 1999 0.029 SILBBR-5 120.6 18 0.4 1952 1996 0.056 LBBR-6 96.3 19 –0.1 1959 1999 0.61 SBBR-7 77.0 4 0.5 1956 1998 0.42 SBBR-8 69.9 5 –0.3 1932 1999 0.050 LBBR-9 44.2 18 –0.9 1968 1999 0.48 SBBR-10 39.8 23 0.2 1913 1996 0.90 GR SBBR-11 55.2 4 0.1 1994 1999 0.55 SLBBR-12 15.3 10 –1.1 1939 1997 -- -- Cobble streambed.BBR-13 0 37 0.0 1941 1992 0.085 GR L
Figure 34. Grade-control structure on Big Indian Creek between Gage County Road (BBR-11) and US77 (BBR-12).

CHANNEL WIDENING 55
CHANNEL WIDENING
Top-of-bank widening was evaluated at 73 of the primary sites, where extensive first-round surveying was done. A comparison of first- and second-round surveys showed TOB widening at 64 of those sites. Individual failures were characterized for each of these sites, and the length and width of each failure were tabulated (table 19).
The widening rates (table 20) were calculated as comparative measures rather than predictive relations,
and the rates should be used for that limited purpose. Because widening at meandering reaches could be a function of lateral channel migration as well as bank failure related to oversteepened banks, the planform characteristics of the surveyed reach are provided (table 20). The greatest amount of widening observed in meandering reaches was at site BNR-16, which had widened 6.9 m at one survey point in 25 months. At the sites with straight reaches, the most widening was
Table 19. Individual top-of-bank failure dimensions
[ID, identification; all measurements are in meters; --, not applicable]
Site IDIndividual failure Individual failure Individual failure Individual failure
Length, lf Width, wf Length, lf Width, wf Length, lf Width, wf Length, lf Width, wf
Missouri River Tributary Basins
MRT-2 16.8 0.6 -- -- -- -- -- --MRT-3 10.0 0.7 -- -- -- -- -- --MRT-4 9.0 1.3 6.7 1.0 9.9 0.9 8.7 0.4 9.9 0.6 17.3 0.2 8.3 0.6 -- --MRT-9 10.3 0.4 7.7 0.7 22.7 1.3 -- --MRT-10 22.4 1.2 11.7 2.1 17.2 1.5 6.0 1.5 14.2 1.4 17.3 1.5 -- -- -- --MRT-15 4.4 2.5 6.9 0.9 6.6 0.3 10.3 0.4MRT-16 8.8 1.4 10.7 1.1 -- -- -- --MRT-17 22.1 0.3 9.8 0.4 5.3 0.4 16.5 0.5
Papillion Creek Basin
PC-8 2.8 2.9 -- -- -- -- -- --Platte River Tributary Basins
PRT-1 12.3 0.3 14.6 0.2 -- -- -- --PRT-2 18.1 0.3 14.8 0.4 8.3 0.1 -- --PRT-5 39.7 2.7 9.5 1.0 -- -- -- --PRT-6 14.3 1.7 -- -- -- -- -- --PRT-7 13.0 0.5 26.5 2.1 17.6 2.4 36.2 0.7 17.2 1.7 -- -- -- -- -- --
Elkhorn River Basin
ER-5 18.9 0.4 10.0 0.3 17.8 0.4 -- --ER-6 67.6 1.1 -- -- -- -- -- --ER-7 19.9 0.3 19.0 1.0 -- -- -- --ER-8 8.2 0.7 9.1 0.8 5.8 0.9 18.6 0.5 32.1 0.4 11.0 0.6 -- -- -- --ER-9 14.7 0.8 16.7 1.3 71.4 1.3 -- --ER-15 8.9 0.7 4.2 0.7 -- -- -- --ER-16 6.1 0.3 14.7 0.3 8.0 1.0 3.3 0.3 7.0 1.0 5.3 0.6 8.9 1.2 20.8 0.5ER-18 9.9 0.7 4.6 0.4 9.1 0.5 -- --ER-20 6.2 0.2 5.6 0.5 17.7 0.4 13.5 0.3 12.3 0.6 9.4 0.7 16.8 0.4 -- --ER-21 9.0 0.6 -- -- -- -- -- --

CHANNEL WIDENING 56
Salt Creek Basin
SC-10 41.4 3.1 9.9 0.4 -- -- -- --SC-11 7.1 0.8 -- -- -- -- -- --SC-12 7.4 0.3 -- -- -- -- -- --SC-14 29.3 1.9 20.1 1.0 -- -- -- --SC-15 6.5 0.7 -- -- -- -- -- --SC-16 3.8 3.7 11.7 0.4 -- -- -- --SC-18 5.9 0.6 -- -- -- -- -- --SC-20 5.9 0.4 7.8 1.1 9.3 0.5 6.8 0.5 4.0 0.8 15.1 0.7 11.7 0.8 26.7 0.8 17.4 1.0 2.7 0.4 8.0 0.6 17.9 0.7SC-25 16.2 1.5 -- -- -- -- -- --SC-28 9.7 0.4 8.7 0.7 -- -- -- --SC-32 7.4 0.7 16.8 0.7 4.4 0.6 16.7 0.6SC-33 26.0 2.4 -- -- -- -- -- --
Little Nemaha River Basin
LNR-3 7.2 1.5 7.8 0.4 10.9 1.0 2.7 0.5 5.6 1.3 3.2 0.6 2.0 0.6 6.3 2.1 25.9 1.2 -- -- -- -- -- --LNR-4 22.7 0.7 -- -- -- -- -- --LNR-5 59.2 0.8 11.9 0.7 -- -- -- --LNR-6 13.5 0.7 12.6 0.5 7.6 0.3 9.9 0.2 33.7 0.3 -- -- -- -- -- --LNR-12 18.3 0.5 5.7 0.2 5.8 0.5 11.4 0.2LNR-16 8.0 0.4 10.3 0.5 7.5 0.5 13.0 0.3 6.3 0.3 11.4 0.3 11.1 2.8 -- --
Big Nemaha River Basin
BNR-1 9.7 0.2 5.1 0.4 5.4 0.1 -- --BNR-2 8.6 0.1 4.8 0.3 7.5 0.1 9.8 0.2BNR-3 12.3 0.9 -- -- -- -- -- --BNR-4 13.4 0.2 -- -- -- -- -- --BNR-5 8.6 0.8 9.6 0.4 45.1 1.9 -- --BNR-7 4.4 0.3 -- -- -- -- -- --BNR-8 5.5 0.2 8.6 0.3 -- -- -- --BNR-9 50.9 2.7 11.6 0.3 17.6 0.3 37.9 1.9 7.5 0.5 -- -- -- -- -- --BNR-10 12.5 0.5 16.8 0.4 10.8 0.4 15.0 0.3BNR-13 36.7 1.4 51.9 0.6 47.5 0.5 28.8 0.4BNR-14 21.5 2.5 17.4 0.3 3.1 0.6 83.8 0.5BNR-15 8.0 0.5 10.5 0.5 25.4 0.8 -- --BNR-16 52.3 3.7 -- -- -- -- -- --BNR-17 4.2 0.7 32.5 0.8 46.7 1.5 -- --
Table 19. Individual top-of-bank failure dimensions—Continued
[ID, identification; all measurements are in meters; --, not applicable]
Site IDIndividual failure Individual failure Individual failure Individual failure
Length, lf Width, wf Length, lf Width, wf Length, lf Width, wf Length, lf Width, wf

CHANNEL WIDENING 57
observed at site BBR-5, which at one location had widened by 6.4 m in 26 months.
All eight sites in the Big Blue River Basin showed widening, including the site with the most widening in a straight reach. Only a small number of tributaries in the basin were disturbed through chan-nelization. Streambed-elevation data sets for Big Blue River Basin sites generally show little change. Because failures were observed at the sites, it was assumed that the measured widening was accurate. Considering the lack of major straightening in the Big Blue River Basin, the widening observed may indicate
that other disturbances are occurring in the basin that are not caused by streambed degradation, which could include changes in land use as the basin has been converted to a primarily agricultural watershed. However, it may also indicate that the variability in the streambed-elevation data sets may have been too large to accurately identify streambed responses.
Big Blue River
BBR-1 10.0 0.8 -- -- -- -- -- --BBR-2 3.1 0.3 5.2 0.8 4.6 0.5 5.4 0.5 5.1 0.2 4.8 0.3 1.0 0.4 2.6 1.1 1.4 0.5 1.6 0.4 1.8 1.4 1.3 0.3 4.2 0.4 2.5 0.6 6.6 0.5 5.6 0.2 1.9 1.6 2.1 0.4 -- -- -- --BBR-3 6.5 0.5 12.6 0.5 3.7 0.4 6.6 0.3 14.9 0.3 21.0 1.5 -- -- -- --BBR-5 4.4 1.9 33 0.9 20.0 1.3 51.5 3.1 25.6 1.2 -- -- -- -- -- --BBR-10 16.4 1.1 10.2 0.7 -- -- -- --BBR-11 16.7 0.3 10.9 0.4 10.9 2.5 10.0 0.2 5.4 3.2 -- -- -- -- -- --BBR-12 4.0 0.3 7.5 0.4 17.2 1.1 16.6 0.5 12.4 1.4 20.8 0.2 -- -- -- --BBR-13 7.9 0.9 23.1 2.4 6.2 0.7 23.3 1.0 48.0 1.0 8.3 1.5 5.3 2.2 27.2 0.8 21.7 0.9 7.2 0.6 -- -- -- --
Table 19. Individual top-of-bank failure dimensions—Continued
[ID, identification; all measurements are in meters; --, not applicable]
Site IDIndividual failure Individual failure Individual failure Individual failure
Length, lf Width, wf Length, lf Width, wf Length, lf Width, wf Length, lf Width, wf

CH
AN
NE
L W
IDE
NIN
G58
Table 20. Summary of observed channel widening
[ID, identification; m, meter; m2, square meter; m/yr, meters per year; --, no widening was observed at the site between first- and second-round surveys]
Site IDPhysical
characteristic
First-round survey
date
Second-round survey
date
Length of
survey reach
(m)
Number of indi-vidual
failures
Mean MaximumWidening
rate (m/yr)
Failure length, lf
(m)
Weighted failure
width, wf (m)
Failure area, Af
(m2)
Failure area, Af
(m2)
Widening point, wi
(m)
Missouri River Tributary Basins
MRT-2 straight 6/24/97 10/3/98 175 1 16.8 0.6 10.3 10.3 0.9 0.02MRT-3 straight 6/24/97 7/15/99 191 1 10.0 0.7 6.9 6.9 1.3 0.01MRT-4 straight 6/25/97 10/2/98 77 7 10.0 0.7 6.6 12.0 1.6 0.23MRT-9 straight 12/10/96 10/23/98 210 3 13.5 0.8 12.7 28.6 2.0 0.05MRT-15 straight 7/15/97 5/4/99 81 4 7.0 1.0 5.8 10.8 4.9 0.08MRT-17 straight 7/24/97 11/30/98 145 4 13.4 0.4 5.7 8.9 4.2 0.06MRT-10 meander 12/9/96 10/23/98 250 6 14.8 1.6 22.2 27.3 1.1 0.14MRT-16 meander 12/4/96 2/26/99 364 2 9.8 1.3 12.2 12.3 2.8 0.01
Papillion Creek Basin
PC-8 straight 8/18/97 4/15/99 156 1 2.8 2.9 8.0 8.0 3.7 0.02Platte River Tributary Basins
PRT-1 meander 6/2/97 3/31/99 137 2 13.5 0.3 3.3 3.4 0.4 0.01PRT-2 meander 8/21/97 12/3/98 114 3 13.7 0.3 4.2 6.1 1.1 0.04PRT-5 meander 7/30/97 7/1/99 128 2 24.6 1.9 59.2 109.0 5.0 0.24PRT-6 meander 7/21/97 4/20/99 115 1 14.3 1.7 24.1 24.1 2.4 0.06PRT-7 meander 6/17/97 7/9/99 164 5 22.1 1.5 31.6 55.4 3.5 0.23
Elkhorn River Basin
ER-18 straight 6/26/97 7/15/99 177 3 7.8 0.5 4.3 6.6 1.1 0.02ER-20 straight 4/24/97 4/2/99 92 7 11.6 0.5 5.3 7.6 1.2 0.10ER-21 straight 12/12/96 11/24/98 153 1 9.0 0.6 5.3 5.3 0.8 0.01ER-5 meander 8/20/97 4/20/99 125 3 15.5 0.4 5.7 8.0 1.0 0.04ER-6 meander 2/12/98 6/30/99 367 1 67.6 1.1 75.4 75.4 1.7 0.07ER-7 meander 7/29/97 4/13/99 73 2 19.5 0.7 12.7 18.8 1.7 0.10ER-8 meander 8/5/97 4/13/99 129 6 14.1 0.7 7.8 12.9 2.3 0.11ER-9 meander 6/5/97 4/2/99 114 3 34.3 1.2 42.2 92.0 2.4 0.30ER-15 meander 6/18/97 7/14/99 130 2 6.5 0.7 4.7 6.4 1.5 0.02ER-16 meander 8/20/97 4/13/99 104 8 9.3 0.7 5.9 10.7 1.8 0.14ER-25 meander 2/13/98 6/25/99 522 0 -- -- -- -- -- --

59S
treamb
ed A
dju
stmen
t and
Ch
ann
el Wid
enin
g in
Eastern
Neb
raska
Salt Creek Basin
SC-11 straight 8/15/97 4/7/99 127 1 7.1 0.8 5.6 5.6 1.3 0.01SC-13 straight 10/21/96 5/18/99 639 0 -- -- -- -- -- --SC-16 straight 5/6/97 11/19/98 69 2 7.7 2.0 9.2 14.1 4.3 0.09SC-32 straight 6/17/97 6/30/99 167 4 11.3 0.7 7.5 11.2 1.2 0.04SC-34 straight 5/9/97 3/29/99 33 0 -- -- -- -- -- --SC-10 meander 8/27/97 4/6/99 113 2 25.6 1.7 65.4 126.7 4.5 0.36SC-12 meander 8/14/97 4/7/99 77 1 7.4 0.3 2.2 2.2 0.5 0.01SC-14 meander 3/12/96 11/1/98 65 2 24.7 1.4 37.6 55.2 3.6 0.22SC-15 meander 5/1/97 11/16/98 106 1 6.5 0.7 4.5 4.5 0.9 0.01SC-17 meander 3/19/97 1/29/99 33 0 -- -- -- -- -- --SC-18 meander 4/26/96 3/5/99 97 1 5.9 0.6 3.4 3.4 0.9 0.01SC-20 meander 5/14/96 3/5/99 438 12 11.1 0.7 8.3 22.6 2.2 0.04SC-22 meander 10/25/96 2/17/99 235 0 -- -- -- -- -- --SC-23 meander 10/30/96 2/10/99 167 0 -- -- -- -- -- --SC-25 meander 11/18/96 11/9/98 495 1 16.2 1.5 24.9 24.9 3.0 0.01SC-28 meander 5/8/97 12/16/98 127 2 9.2 0.6 5.1 6.1 1.2 0.02SC-33 meander 11/21/96 6/2/99 384 1 26.0 2.4 61.1 61.1 4.0 0.03
Little Nemaha River Basin
LNR-3 straight 3/6/97 2/3/99 121 9 7.9 1.0 9.0 31.5 4.1 0.17LNR-4 straight 6/5/97 3/30/99 171 1 22.7 0.7 15.9 15.9 1.1 0.03LNR-5 straight 7/14/97 6/17/99 124 2 35.5 0.8 27.8 47.4 2.2 0.12LNR-6 straight 5/29/97 3/3/99 90 5 15.5 0.4 6.3 11.6 1.1 0.10LNR-13 straight 5/1/97 3/30/99 120 0 -- -- -- -- -- --LNR-16 straight 3/21/97 2/8/99 126 7 9.6 0.7 7.3 31.3 5.5 0.11LNR-2 meander 3/7/97 2/5/99 109 0 -- -- -- -- -- --LNR-7 meander 5/16/97 3/1/99 104 0 -- -- -- -- -- --LNR-12 meander 3/11/97 2/8/99 130 4 10.3 0.4 3.8 8.6 0.9 0.03
Table 20. Summary of observed channel widening—Continued
[ID, identification; m, meter; m2, square meter; m/yr, meters per year; --, no widening was observed at the site between first- and second-round surveys]
Site IDPhysical
characteristic
First-round survey
date
Second-round survey
date
Length of
survey reach
(m)
Number of indi-vidual
failures
Mean MaximumWidening
rate (m/yr)
Failure length, lf
(m)
Weighted failure
width, wf (m)
Failure area, Af
(m2)
Failure area, Af
(m2)
Widening point, wi
(m)

CH
AN
NE
L W
IDE
NIN
G60
Big Nemaha River Basin
BNR-3 straight 5/20/97 3/3/99 94 1 12.3 1.0 11.7 11.7 1.6 0.03BNR-4 straight 5/30/97 3/26/99 43 1 13.4 0.2 2.7 2.7 0.5 0.02BNR-7 straight 6/20/97 6/13/99 58 1 4.4 0.3 1.4 1.4 0.5 0.01BNR-9 straight 11/26/96 7/13/99 432 5 25.1 1.2 45.0 138.9 5.3 0.10BNR-10 straight 7/23/97 1/28/99 174 4 13.8 0.4 5.3 6.0 1.0 0.04BNR-13 straight 7/23/97 1/28/99 227 4 41.3 0.7 29.6 52.5 3.8 0.17BNR-14 straight 11/27/96 1/21/99 318 4 31.5 1.0 25.5 53.0 5.3 0.07BNR-17 straight 12/5/96 1/19/99 213 3 27.8 1.0 32.1 68.9 5.6 0.11BNR-1 meander 5/22/97 3/1/99 43 3 6.7 0.2 1.5 2.2 0.7 0.03BNR-2 meander 5/14/97 3/3/99 57 4 7.7 0.2 1.3 2.4 0.7 0.03BNR-5 meander 7/22/97 4/12/99 112 3 21.1 1.0 31.4 83.5 4.4 0.24BNR-8 meander 6/20/97 7/13/99 104 2 7.0 0.3 2.1 3.0 0.6 0.01BNR-15 meander 5/28/97 2/3/99 78 3 14.6 0.6 9.8 20.3 1.4 0.11BNR-16 meander 6/19/97 7/20/99 117 1 52.3 3.7 194.6 194.6 6.9 0.40
Big Blue River Basin
BBR-3 straight 7/31/97 4/9/99 171 6 10.9 0.6 8.1 31.4 3.7 0.08BBR-5 straight 12/3/96 2/19/99 342 5 26.9 1.7 51.1 161.3 6.4 0.17BBR-13 straight 11/27/96 1/26/99 282 10 17.8 1.2 20.8 55.2 3.9 0.17BBR-1 meander 12/11/96 3/31/99 171 1 10.0 0.8 8.3 8.3 1.6 0.01BBR-2 meander 8/7/97 4/9/99 104 18 3.4 0.6 1.7 4.1 2.1 0.09BBR-10 meander 11/7/96 2/2/99 245 2 13.3 0.9 12.2 17.2 1.5 0.02BBR-11 meander 8/6/97 1/26/99 73 5 10.8 1.3 10.9 26.7 3.7 0.25BBR-12 meander 8/4/97 1/26/99 104 6 13.1 0.6 8.6 18.8 2.8 0.17
Table 20. Summary of observed channel widening—Continued
[ID, identification; m, meter; m2, square meter; m/yr, meters per year; --, no widening was observed at the site between first- and second-round surveys]
Site IDPhysical
characteristic
First-round survey
date
Second-round survey
date
Length of
survey reach
(m)
Number of indi-vidual
failures
Mean MaximumWidening
rate (m/yr)
Failure length, lf
(m)
Weighted failure
width, wf (m)
Failure area, Af
(m2)
Failure area, Af
(m2)
Widening point, wi
(m)

SUMMARY AND CONCLUSIONS 61
SUMMARY AND CONCLUSIONS
In eastern Nebraska, stream straightening and dredging efforts since the 1890s have been the primary disturbances to the natural equilibrium of stream chan-nels in the area. The resulting streambed degradation and subsequent channel widening from bank failures have damaged road structures, pipelines, fiber-optic lines, and land adjacent to the stream channels. This report describes a study by the U.S. Geological Survey (USGS), in cooperation with the Nebraska Department of Roads, Nebraska Natural Resources Commission (now part of the Nebraska Department of Natural Resources), Lower Platte South Natural Resources District, (NRD), Papio-Missouri River NRD, U.S. Army Corps of Engineers (USACE), and the U.S. Department of Agriculture, Agricultural Research Service (ARS), National Sedimentation Laboratory (NSL), of the effect these disturbances have had on streambed adjustment and channel widening in eastern Nebraska. Channel responses were characterized by estimating the amount of streambed-elevation change and documenting recent widening at several sites in eastern Nebraska.
Topographic and streambed grain-size data were collected at 151 primary sites in the study area. Two sets of survey data were collected approximately 2 years apart. Generally, the first set of survey data was used to define the channel geometry, including the streambed elevation. The second set of survey data was used to document bank-widening and streambed gradation. Additionally, historical streambed-elevation data (dating back to the 1890s) were compiled from several sources for the 151 primary sites and 45 supplemental sites, and relevant disturbances were identified for each basin. Streambed-elevation data sets were used to estimate the amount of change to the streambed at the sites over the time period of the data. Streambed degradation caused channel banks to become oversteepened, leading to channel widening. This widening was assessed by comparing first- and second-round survey data to document top-of-bank failures between the two surveys.
The majority of observed streambed-gradation responses appear to be related to the various straight-ening efforts that have taken place in the study area. The effects of grade-control structures have compli-cated responses at many of the sites studied. Because there were so many potential disturbances affecting the basins, the responses were complex and beyond
the application of a streambed-elevation adjustment model. In many cases, the streambed-elevation data sets provide a reliable representation of past streambed gradation, with some sites showing 6 to 7 meters of degradation since they were straightened.
Because straightening plans or historical accounts that provided estimates of the original streambed elevation were only available in the Papillion Creek, Elkhorn River, Salt Creek, Little Nemaha River, and Big Nemaha River Basins, the full magnitude of gradation response following straight-ening could only be characterized at select sites in those basins. As a result, an unbiased comparison of gradation differences between basins was not possible.
Many sites where the original constructed streambed elevation could be estimated from straight-ening plans showed considerable degradation following the disturbance. This indicates that in eastern Nebraska, the coarse sediment supply is not sufficient to offset the effects of steepened stream slopes created by channelization. Instead, eastern Nebraska stream channels can regain equilibrium mainly through the slope adjustment process of head-ward-progressing degradation.
Failures were documented at sites in all eight of the basin groupings analyzed, widening rates were computed at 64 of 73 sites. The documented channel widening indicates that other disturbances besides stream-channel straightening have probably caused channel responses in the Big Blue River Basin. Similar responses may be occurring in the other basins of the study area, although widening caused by straight-ening-induced streambed degradation cannot be isolated from that caused by other disturbances.
The data sets and results compiled in this report provide measures of past change to stream channels in eastern Nebraska. Channel responses have been complicated by the multiple disturbances that have occurred in the study area. Sites that may be showing little response now may still respond in the future, whether from the headward progression of existing knickpoints or through new disturbances.
REFERENCES
Bentall, Ray, 1971, Water supplies and the land—The Elkhorn River Basin of Nebraska: University of Nebraska–Lincoln, Institute of Agriculture and Natural Resources, Conservation and Survey Division, 51 p.

62 Streambed Adjustment and Channel Widening in Eastern Nebraska
Bleed, Ann, and Flowerday, Charles, 1990, An atlas of the Sand Hills: University of Nebraska–Lincoln, Institute of Agriculture and Natural Resources, Conservation and Survey Division, 265 p.
Brook, W.E., Porterfield, J.C., and Yates, B.C., 1892, The Salt Creek rectification scheme: University of Nebraska-Lincoln, thesis, 32 p.
Chen, A.H., Rus, D.L., and Stanton, C.P., 1999, Trends in channel gradation in Nebraska streams: U.S. Geolog-ical Survey Water-Resources Investigations Report 99–4103, 29 p., 15 apps., 1 pl.
Drees, R.H., Engelhard, Craig, and Kichler, Larry, 1996, Turkey Creek Watershed—Nebraska and Kansas riparian corridor report: Natural Resources Conserva-tion Service, U.S. Department of Agriculture, 25 p.
Dugan, J.T., 1984, Hydrologic characteristics of Nebraska soils: U.S. Geological Survey Water-Supply Paper 2222, 19 p., 12 pls.
Edwards, T.K., and Glysson, G.D., 1999, Field methods for measurement of fluvial sediment: U.S. Geological Survey Techniques of Water-Resources Investigations book 3, chap. C2, 89 p.
Elder, J.A., 1969, Soils of Nebraska: University of Nebraska-Lincoln, Institute of Agriculture and Natural Resources, Conservation and Survey Division, Resource Report No. 2, 60 p.
Farrar, Jon, and Gersib, Richard, 1991, Salt marshes—Last of the least: Lincoln, Nebr., Nebraska Game and Parks Commission, 23 p.
Federal Emergency Management Agency, 1997, Flood insurance study, City of Omaha, Douglas County: Washington D.C., Federal Emergency Management Agency, 48 p., 36 pls.
Fenneman, N.M., 1946, Physical divisions of the United States: Washington, D.C., U.S. Geological Survey, 1 sheet.
Ferrell, John, 1996, Soundings—100 Years of the Missouri River navigation project: Kansas City, Mo., U.S. Army Corps of Engineers, 171 p.
Forstall, R.L., 1995, Population of counties by decennial census—1900 to 1990: Washington D.C., U.S. Bureau of the Census, accessed October 31, 2000 at URL http://www.census.gov/population/cencounts/ ne190090.txt
Golden Software, Inc., 1995, Surfer® for windows— Version 6, user’s guide: Golden, Colo., Golden Soft-ware, Inc., 480 p.
Kennedy, E.J., 1990, Levels at streamflow gaging stations: U.S. Geological Survey Techniques of Water-Resources Investigations book 3, chap. A19, 27 p.
Kerstetter, T.M., 1992, Up the river—Flooding and the human response in Nebraska’s Elkhorn River Basin,
through the floods of 1944: Lincoln, University of Nebraska, Master’s thesis, 139 p.
Langendoen, E.J., and Simon, Andrew, 2000, Stream channel evolution of Little Salt Creek and North Branch West Papillion Creek, eastern Nebraska: Oxford, Miss., National Sedimentation Laboratory, prepared for Lower Platte South and Papio-Missouri River Natural Resources Districts, 55 p., 2 apps.
Lower Platte South Natural Resources District, 1999, Beal Slough Basin model and plan: Lower Platte South Natural Resources District, accessed October 31, 2000, at URL http://www.lpsnrd.org/docs/beal.pdf
Lutenegger, A.J., 1987, In situ shear strength of friable loess, in Pécsi, Marton, ed., Loess and environment: Catena Supplement No. 9, p. 27–34.
Mackin, J.H., 1948, Concept of a graded river: Geological Society of America Bulletin, v. 59, p. 463–511.
Mandel, R.D., Bettis III, E.A., 1995, Late Quaternary land-scape evolution and stratigraphy in eastern Nebraska, in Flowerday, C.A. (ed.), Geological field trips in Nebraska and adjacent parts of Kansas and South Dakota: 29th Annual Meeting of North-Central and South-Central Sections, Geological Society of America, Guidebook No. 10, University of Nebraska–Lincoln, Institute of Agriculture and Natural Resources, Conservation and Survey Division, p. 77–99.
Mears, L.W., 1912, Some geographical influences in the development of southeastern Nebraska, Nemaha County in particular: Lincoln, University of Nebraska, Master’s thesis, 49 p.
Moore, C.T., 1915, Drainage districts of southeastern Nebraska, in Barbour, E.H., An account of the Nebraska Geological Survey to 1912: Nebraska Geological Survey Miscellaneous Papers, v. 7, p. 125–164.
Natural Resources Conservation Service, 1996a, Rock Creek saline wetland cooperative river basin study: Lincoln, Nebr., U.S. Department of Agriculture, Natural Resources Conservation Service, 85 p.
———May 1996b, Map of the status of resource projects and river basins, Nebraska (revised May 1996): Lincoln, Nebr., U.S. Department of Agriculture, Natural Resources Conservation Service.
Nebraska Department of Agriculture and Inspection, 1957, Nebraska agricultural statistics, historical record 1866–1954: Lincoln, Nebr., State-Federal Division of Agricultural Statistics, 176 p.
———1962, Nebraska agricultural statistics, Annual report 1960, Preliminary report 1961: Lincoln, Nebr., State-Federal Division of Agricultural Statistics, 136 p.

REFERENCES 63
Nebraska Department of Agriculture, 1972, Nebraska agri-cultural statistics, Annual report 1970, Preliminary report 1971: Lincoln, Nebr., State-Federal Division of Agricultural Statistics, 160 p.
Nebraska Department of Agriculture, 1982, Nebraska agri-cultural statistics, Annual report 1980, Preliminary report 1981: Lincoln, Nebr., Nebraska Crop and Live-stock Reporting Service, 164 p.
———1991, 1990–1991 Nebraska agricultural statistics: Lincoln, Nebr., Nebraska Agricultural Statistics Service, 148 p.
Nebraska Department of Natural Resources, 2003, Chapter 6, Geodetic reference standards, accessed February 21, 2003 at URL http://www.dnr.state.ne.us/databank/ metadata/geod_doc.txt
Nebraska Department of Roads and Irrigation, 1954, Thir-tieth biennial report of the Department of Roads and Irrigation, 1953–1954, volume II: Lincoln, Nebr., Department of Roads and Irrigation, v. 2, 801 p.
Nebraska Natural Resources Commission, 1998, Biennial report on the Nebraska resources development fund: Lincoln, Nebr., Nebraska Natural Resources Commis-sion, 22 p.
Nebraska Soil and Water Conservation Commission, 1968, Big Blue River Basin: Lincoln, Nebr., State Water Plan Publication Number 201, 103 p.
Olsson Associates and Wright Water Engineers, 2000, Beal Slough Basin stormwater master plan: Lincoln, Nebr., Olsson Associates, 74 p.
Papio-Missouri River Natural Resources District, 2000, Other flood-control measures: Papio-Missouri River Natural Resources District, accessed November 8, 2000 at URL http://www.papionrd.org/programs/flodctrl.htm
Phipps, R.L., 1985, Collecting, preparing, cross-dating, and measuring tree increment cores: U.S. Geological Survey Water-Resources Investigations Report 85–4148, 48 p.
Richardson, E.V., Harrison, L.J., Richardson, J.R., and Davis, S.R., 1993, Evaluating scour at bridges: U.S. Federal Highway Administration, FHWA–IP–90–017 HEC–18.
Rus, D.L., and Soenksen, P.J., 1998, Channel stability of Turkey Creek, Nebraska, in Abt, S.R., Young-Pezeshk, Jayne, and Watson, C.C., eds., Water Resources Engi-neering 98—International Water Resources Engi-neering Conference, August 3–7, 1998, Memphis, Tennessee, Proceedings: Reston, Va., American Society of Civil Engineers, v. 1, p. 423–428.
Schoeneberger, P.J., Wysocki, D.A., Benham, E.C., and Broderson, W.D., 1998, Field book for describing and sampling soils: U.S. Department of Agriculture, version 1.1.
Schumm, S.A., Harvey, M.D., and Watson, C.C., 1984, Incised channels—Morphology, dynamics, and control: Littleton, Colo., Water Resources Publica-tions, 200 p.
Simon, Andrew, 1989, A model of channel response in disturbed alluvial channels: Earth Surface Processes and Landforms, v. 14, p. 11–26.
———1994, Gradation processes and channel evolution in modified west Tennessee streams—Process, response, and form: U.S. Geological Survey Professional Paper 1470, 84 p.
Simon, Andrew, and Hupp, C.R., 1992, Geomorphic and vegetative recovery processes along modified stream channels of West Tennessee: U.S. Geological Survey Open-File Report 91–502, 142 p.
Soenksen, P.J., Miller, L.D., Sharpe, J.B., and Watton, J.R., 1999, Peak-flow frequency relations and evaluation of the peak-flow gaging network in Nebraska: U.S. Geological Survey Water-Resources Investigations Report 99–4032, 47 p., 3 apps.
Soil Conservation Service, 1962, Watershed work plan—Big Indian Creek Watershed Conservancy District: Lincoln, Nebr., U.S. Department of Agricul-ture, Soil Conservation Service.
———1965, Soil survey—Saunders County, Nebraska: Lincoln, Nebr., U.S. Department of Agriculture, Soil Conservation Service, 81 p., 68 pl.
———1966, Watershed work plan—Papillion Creek Watershed: Lincoln, Nebr., U.S. Department of Agri-culture, Soil Conservation Service, 41 p.
———1968, Watershed work plan—Aowa Creek Water-shed: Lincoln, Nebr., U.S. Department of Agriculture, Soil Conservation Service, 52 p.
———1971, Elkhorn River Basin, Nebraska—Water and related land resources: Lincoln, Nebr., U.S. Depart-ment of Agriculture, Soil Conservation Service.
———1972, Watershed work plan—South Fork Water-shed: Lincoln, Nebr., U.S. Department of Agriculture, Soil Conservation Service, 45 p.
———1975, Nemaha River Basin, Nebraska—Water and related land resources: Lincoln, Nebr., U.S. Depart-ment of Agriculture, Soil Conservation Service.
———1981, Land resource regions and major land resource areas of the United States: Washington, D.C., U.S. Department of Agriculture, Soil Conservation Service Agricultural Handbook 296, revision of 1965 edition, 156 p., 1 pl.
Swinehart, J.B., Dreeszen, V.H., Richmond, G.M., Tipton, M.J., Bretz, Richard, Steece, F.V., Hallberg, G.R., and Goebel, J.E., 1994, Quaternary geologic map of the Platte River 4o x 6o quadrangle: U.S. Geological Survey Investigations Map I–1420 (NK-14), scale 1:1,000,000.

64 Streambed Adjustment and Channel Widening in Eastern Nebraska
U.S. Army Corps of Engineers, 1963, Design memorandum No. MSC–11—Channel improvement and levees thru Lincoln: Omaha, Nebr., U.S. Army Corps of Engi-neers, 26 p., 26 pl.
U.S. Army Corps of Engineers,1964, Flood plain informa-tion, metropolitan region, Lincoln, Nebraska, volume I—Salt Creek, Haines Branch, and Beal Slough: Omaha, Nebr., U.S. Army Corps of Engineers, 36 p., 5 pl.
———1965, Review report—Platte River and tribu-taries—Interim report—Skull Creek Basin, Nebraska: Omaha, Nebr., U.S. Army Corps of Engineers, 31 p., 8 app.
———1967a, Flood plain information, metropolitan region, Lincoln, Nebraska, volume III—technical appendix—Little Salt, Oak, Salt, and Stevens Creeks: Omaha, Nebr., U.S. Army Corps of Engineers, 5 app.
———1967b, Flood plain information— Papillion, Big Papillion, and West Papillion Creeks—volume I—Omaha metropolitan region, Nebraska: Omaha, Nebr., U.S. Army Corps of Engineers, 48 p., 20 pl.
———1968, Flood plain information— Little Papillion Creek and South Branch—volume II—Omaha metro-politan region, Nebraska: Omaha, Nebr., U.S. Army Corps of Engineers, 44 p., 11 pl.
———1970, Flood plain information, Big Blue River and Indian Creek, Beatrice, Nebraska: Omaha, Nebr., U.S. Army Corps of Engineers, 34 p., 11 pl.
———1980, Project maps, Omaha district, Status of river and harbor and flood control projects: Omaha, Nebr., U.S. Army Corps of Engineers, 121 p., 162 pl.
———1989, Nebraska water resources development: Omaha, Nebr., U.S. Army Corps of Engineers, 43 p.
———1993, Logan Creek—Pender, Nebraska—Recon-naissance report: Omaha, Nebr., U.S. Army Corps of Engineers [Section 205 reconnaissance study].
———1995, Southeast Nebraska streambank erosion and streambed degradation study: Omaha, Nebr., U.S. Army Corps of Engineers [Section 22 study], 67 p., 5 apps., 4 pl.
———1998, Eastern Nebraska channel instability study—Stream classification: Omaha, Nebr., U.S. Army Corps of Engineers [Section 22 study], prepared for the Nebraska Department of Roads, 23 p., 1 pl.
———1999, Eastern Nebraska channel instability study—evaluation of bridge and culvert structures: Omaha, Nebr., U.S. Army Corps of Engineers [Section 22 study], 7 p., 9 apps.