Embed Size (px)
Citation preview

Stream Stability at Highway Structures HEC-20 February 1991
Welcometo HEC-20StreamStabilityatHighwayStructures
Table of Contents
Tech Doc
DISCLAIMER: During the editing of this manual for conversion to an electronicformat, the intent has been to keep the document text as close to the original aspossible. In the process of scanning and converting, some changes may havebeen made inadvertently.
Archive
d

Table of Contents for HEC 20-Stream Stability at Highway Structures
List of Figures List of Tables List of Equations
Cover Page : HEC 20-Stream Stability at Highway Structures
1.0 Introduction 1.1 Purpose 1.2 Background 1.3 Factors That Affect Stream Stability 1.4 Countermeasures 1.5 Manual Organization
2.0 Geomorphic Factors and Principles 2.1 Introduction 2.2 Geomorphic Factors Affecting Stream Stability 2.2.1 Stream Size
2.2.2 Flow Habit
2.2.3 Bed Material
2.2.4 Valley Setting
2.2.5 Floodplains
2.2.6 Natural Levees
2.2.7 Apparent Incision
2.2.8 Channel Boundaries and Vegetation
2.2.9 Sinuosity
2.2.10 Braided Streams
2.2.11 Anabranched Streams
2.2.12 Variability of Width and Development of Bars
2.3 Lane Relation and Other Geomorphic Concepts 2.4 Aggradation/Degradation and the Sediment Continuity Concept 2.4.1 Aggradation/Degradation
2.4.2 Overview of the Sediment Continuity Concept
2.4.3 Factors Initiating Gradation Changes
2.4.4 Stream System Response
3.0 Hydraulic Factors and Principles 3.1 Introduction 3.2 Hydraulic Factors Affecting Stream Stability 3.2.1 Magnitude and Frequency of Floods
3.2.2 Bed Configurations in Sand Bed Streams
3.2.3 Resistance to Flow
Archive
d

3.2.4 Water Surface Profiles
3.3 Geometry and Location of Highway Stream Crossings 3.3.1 Problems at Bends
3.3.2 Problems at Confluences
3.3.3 Backwater Effects of Alignment and Location
3.3.4 Effects of Highway Profile
3.4 Bridge Design 3.4.1 Scour at Bridges
3.4.2 Abutments
3.4.3 Piers
3.4.4 Bridge Foundations
3.4.5 Superstructures
4.0 Analysis Procedure 4.1 Problem Statement 4.2 General Solution Procedure 4.3 Data Needs 4.3.1 Level 1: Geomorphic and Other Qualitative Analyses
4.3.2 Level 2: Basic Engineering Analyses
4.3.3 Level 3: Mathematical and Physical Model Studies
4.4 Data Sources 4.5 Level 1: Qualitative and Other Geomorphic Analyses 4.5.1 Step 1. Define Stream Characteristics
4.5.2 Step 2. Evaluate Land Use Changes
4.5.3 Step 3. Assess Overall Stream Stability
4.5.4 Step 4. Evaluate Lateral Stability
4.5.5 Step 5. Evaluate Vertical Stability
4.5.6 Step 6. Evaluate Channel Response to Change
4.6 Level 2: Basic Engineering Analyses 4.6.1 Step 1. Evaluate Flood History and Rainfall-Runoff Relations
4.6.2 Step 2. Evaluate Hydraulic Conditions
4.6.3 Step 3. Bed and Bank Material Analysis
4.6.4 Step 4. Evaluate Watershed Sediment Yield
4.6.5 Step 5. Incipient Motion Analysis
4.6.6 Step 6. Evaluate Armoring Potential
4.6.7 Step 7. Evaluation of Rating Curve Shifts
4.6.8 Step 8. Evaluate Scour Conditions
4.7 Level 3: Mathematical and Physical Model Studies 4.8 Illustrative Examples
Archive
d

5.0 Selection of Countermeasures for Stream Instability 5.1 Introduction 5.2 Criteria for the Selection of Countermeasures 5.2.1 Erosion Mechanism
5.2.2 Stream Characteristics
5.2.3 Construction and Maintenance Requirements
5.2.4 Vandalism
5.2.5 Costs
5.3 Countermeasures for Meander Migration 5.4 Countermeasures for Scour at Bridges 5.4.1 Contraction Scour
5.4.2 Local Scour
5.4.3 Temporary Countermeasures
5.5 Countermeasures for Channel Braiding and Anabranching 5.6 Countermeasures for Degradation and Aggradation 5.6.1 Countermeasures to Control Degradation
5.6.2 Countermeasures to Control Aggradation
5.7 Case Histories 5.7.1 Flexible Revetment
5.7.2 Rigid Revetments
5.7.3 Bulkheads
5.7.4 Spurs
5.7.5 Retardance Structures
5.7.6 Dikes
5.7.7 Guide Banks
5.7.8 Check Dams
5.7.9 Jack or Tetrahedron Fields
5.7.10 Special Devices for Protection of Piers
5.7.11 Investment in Countermeasures
6.0 Countermeasure Design 6.1 Introduction 6.2 General Design Guidelines 6.3 Spurs 6.3.1 Design Considerations
6.3.2 Design Example of Spur Installation
6.4 Guide Banks 6.4.1 Design Considerations
6.4.2 Design Example of Guide Bank Installation
6.5 Check Dams
Archive
d

6.5.1 Bed Scour For Vertical Drop Structures
6.5.2 Design Example
6.5.3 Lateral Scour Downstream of Check Dams
6.6 Other Countermeasures 6.6.1 Revetments
6.6.2 Hardpoints
6.6.3 Retarder Structures
6.6.4 Longitudinal Dikes
6.6.5 Vane Dikes
6.6.6 Bulkheads
6.6.7 Channel Relocation
6.6.8 Scour at Bridges
7.0 References
Appendix A : HEC-20 Illustrative Example - Level 1 and Level 2 Analyses Introduction Level 1 Analysis Level 1 - Step 1: Stream Characteristics
Level 1 - Step 2: Land Use Changes
Level 1 - Step 3: Overall Stability
Level 1 - Step 4: Lateral Stability
Level 1 - Step 5: Vertical Stability
Level 1 - Step 6: Stream Response
Level 2 Analysis Level 2 - Step 1: Flood History
Level 2 - Step 2: Hydraulic Conditions
Level 2 - Step 3: Bed and Bank Material
Level 2 - Step 4: Watershed Sediment
Level 2 - Step 5: Incipient Motion and Step 6: Armoring Potential
Level 2 - Step 7: Rating Curves
Level 2 - Step 8: Scour Analysis
Conclusions
Glossary
Symbols
Archive
d

List of Figures for HEC 20-Stream Stability at Highway Structures
Back to Table of Contents
Figure 1. Geomorphic factors that affect stream stability.
Figure 2. Diverse morphology of alluvial fans.
Figure 3. Active bank erosion illustrated by vertical cut banks, slump blocks, and falling vegetation.
Figure 4. Typical bank failure surfaces.
Figure 5. Plan view and cross section of a meandering stream.
Figure 6. Modes of meander loop development.
Figure 7. Sinuosity vs. slope with constant discharge.
Figure 8. Slope-discharge relationship for braiding or meandering in sand bed streams.
Figure 9. Definition sketch of sediment continuity concept applied to a given channel reach over a giventime period.
Figure 10. Changes in channel slope in response to a decrease in sediment supply at point C.
Figures 11a and b. Use of geomorphic relationships of Figures 7 and 8 in a qualitative analysis.
Figure 12. Hydraulic and location factors that affect stream stability.
Figure 13(a). Forms of bed roughness in sand channels.
Figure 13(b). Relation between water surface and bed configuration.
Figure 14. Relative resistance to flow in sand bed channels.
Figure 15. Types of water surface profiles through bridge openings.
Figure 16. Superelevation of water surface in a bend.
Figure 17. Backwater effect associated with three types of stream crossings
Figure 18. Various highway profiles.
Figure 19. Flow chart for Level 1: Qualitative Analyses.
Figure 20. Channel classification and relative stability as hydraulic factors are varied.
Figure 21. Hydraulic problems at bridges attributed to erosion at a bend or to lateral migration of thechannel.
Figure 22. Flow chart for Level 2: Basic Engineering Analyses.
Figure 23. Local scour and contraction scour related hydraulic problems at bridges.
Figure 24. Countermeasure costs per foot of bank protected.
Figure 25. Comparison of channel bend cross sections.
Archive
d

Figure 26. Meander migration.
Figure 27. Typical guide bank layout and section.
Figure 28. Extent of protection required at a channel bend.
Figure 29. Definition sketch for spur angle.
Figure 30. Recommended prediction curves for scour at the end of spurs with permeability up to about 35percent.
Figure 31. Scour adjustment for spur orientation.
Figure 32. Flow components in the vicinity of spurs when the crest is submerged.
Figure 33. Plot of spur permeability and orientation vs. relative scour depth at the spur tip.
Figure 34. Spur permeability and spur orientation vs. expansion angle.
Figure 35. Launching of stone toe protection on a riprap spur.
Figure 36. Gabion spur illustrating flexible mat tip protection
Figure 37. Permeable wood-slat fence spur showing launching of stone toe material.
Figure 38. Henson spurs.
Figure 39. Relationship between spur length and expansion angle for several spur permeabilities.
Figure 40. Spur spacing in a meander bend.
Figure 41. Typical straight, round nose spur.
Figure 42. Example of spur design.
Figure 43. Typical guide bank.
Figure 44. Nomograph to determine guide bank length.
Figure 45. Example guide bank design.
Figure 46. Schematic of a vertical drop caused by a check dam.
Figure 47. Design example of scour downstream of a drop structure.
Figure 48. Rock-fill trench.
Figure 49. Windrow revetment, definition sketch.
Figure 50. Used tire mattress.
Figure 51. Typical soil-cement bank protection.
Figure 52. Typical sand-cement bag revetment.
Figure 53. Perspective view of hardpoint installation with section detail.
Figure 54. Typical tetrahedron design.
Figure 55. Typical jack unit.
Archive
d

Figure 56. Retarder field schematic.
Figure 57. Timber pile bent retarder structure.
Figure 58. Typical wood fence retarder structure.
Figure 59. Light double row wire fence retarder structure.
Figure 60. Heavy timber-pile and wire fence retarder structures.
Figure 61. Typical longitudinal rock toe-dike geometries.
Figure 62. Longitudinal rock toe-dike tiebacks.
Figure 63. Timber pile, wire mesh crib dike with tiebacks.
Figure 64. Layout of Iowa Vane system in East Nishnabota River bend.
Figure 65. Perspective of an Iowa Vane layout.
Figure 66. Anchorage schemes for a sheetpile bulkhead.
Figure 67. Encroachments on meandering streams.
Figure 68. Definition sketch for meanders.
Figure 69. Rillito system vicinity map.
Figure 70. Sketch of Craycroft Road Bridge crossing.
Figure 71. Sabino Canyon Road crossing site.
Figure 72. Flood event at Rillito River near Tucson, Arizona.
Figure 73. Log-normal frequency analysis for Rillito River near Tucson.
Figure 74. December 1965 flood in Rillito River and Tanque Verde Creek.
Figure 75. 100-year flood design hydrographs.
Figure 76. Rillito-Pantano-Tanque Verde bed sediment distribution.
Figure 77. Stage-discharge plot for Rillito River near Tucson.
Back to Table of Contents Archive
d

2.0 Geomorphic Factors and Principles
Go to Chapter 3
2.1 Introduction
Most streams that highways cross or encroach upon are alluvial; that is, the streams are formed in materials that have been and canbe transported by the stream. In alluvial stream systems, it is the rule rather than the exception that banks will erode; sediments will bedeposited; and floodplains, islands and side channels will undergo modification with time. Alluvial channels continually change positionand shape as a consequence of hydraulic forces exerted on the bed and banks. These changes may be gradual or rapid and may bethe result of natural causes or man's activities.
Many streams are not alluvial. The bed and bank material is very coarse, and except at extreme flood events, does not erode. Thesestreams are classified as sediment supply deficient, i.e., the transport capacity of the stream flow is greater than the availability of bedmaterial for transport. The bed and bank material of these streams may consist of cobbles, boulders or even bed rock. In general,these streams are stable but should be carefully analyzed for stability at large flows.
A study of the plan and profile of a stream is very useful in understanding stream morphology. Plan view appearances of streams arevaried and result from many interacting variables. Small changes in a variable can change the plan view and profile of a stream,adversely affecting a highway crossing or encroachment. This is particularly true for alluvial streams. Conversely, a highway crossingor encroachment can inadvertently change a variable, adversely affecting the stream.
Each of the geomorphic properties listed in the left column of Figure 1 could be used as the basis of a valid stream classification. Thestream classification presented here is based on stream properties observed on aerial photographs and in the field. Its major purposeis to facilitate the assessment of streams for engineering purposes, particularly regarding lateral stability of a stream. Each propertyhas limited usefulness when considered alone, however, classification based on combinations of more than a few properties andcategories of each become unwieldy. Since the most common stream types represent a characteristic association of properties, thesecommon types will be described and their engineering significance discussed. Data and observations are derived from a study of casehistories of 224 bridge sites in the United States and Canada [1,2]. The following section is organized according to Figure 1. Noparticular significance is assigned to the order of the figure, and association of characteristics should not be inferred with descriptionsabove or below in the figure. Arch
ived

Figure 1. Geomorphic factors that affect stream stability (Adapted from [1]).
Archive
d

2.2 Geomorphic Factors Affecting Stream Stability
2.2.1 Stream Size
Stream depth tends to increase with size, and potential for scour increases with depth. Thus, potential depth of scourincreases with increasing stream size.
The potential for lateral erosion also increases with stream size. This fact may be less fully appreciated than the increasedpotential for deep scour. Brice et al., cite as examples the lower Mississippi River, with a width of about 5,000 feet, whichmay shift laterally 100 feet or more in a single major flood; the Sacramento River, where the width is about 1,000 feet, isunlikely to shift more than 25 feet in a single flood; and streams whose width is about 100 feet are unlikely to shift morethan 10 feet in a single flood [1]. Except for the fact that the potential for lateral migration increases with stream size, nogeneralization is possible regarding migration rates.
The size of a stream can be indicated by discharge, drainage area, or some measure of channel dimensions, such as widthor cross-sectional area. No single measure of size is satisfactory because of the diversity of stream types. For purposes ofstream classification (Figure 1), bank-to-bank channel width is chosen as the most generally useful measure of size, andstreams are arbitrarily divided into three size categories on the basis of width. The width of the stream does not include thewidth of the floodplain, but floodplain width is an important factor in bridge design if significant overbank flow occurs.
Bank-to-bank width is sometimes difficult to define for purposes of measurement when one of the banks is indefinite. Thisis particularly true at bends, where the outside bank is likely to be vertical and sharply defined but the inside bank slopesgradually up to floodplain level. The position of the line of permanent vegetation on the inside bank is the best availableindicator of the bank line, and it tends to be rather sharply defined along many rivers in humid regions. The width of astream is measured along a perpendicular drawn between its opposing banks, which are defined either by their form or asthe riverward edge of a line of permanent vegetation. For sinuous or meandering streams, width is measured at straightreaches or at the inflections between bends, where it tends to be most consistent. For multiple channel streams, width isthe sum of the widths of individual, unvegetated channels.
The Topographic Division of the U.S. Geological Survey uses, insofar as possible, the so-called "normal" stage or thestage prevailing during the greater part of the year for representing streams on topographic maps. It finds that the "normal"stage for a perennial river usually corresponds to the water level filling the channel to the line of permanent vegetationalong its banks. Normal stage is also adopted here to define channel width.
Archive
d

2.2.2 Flow Habit
The flow habit of a stream may be ephemeral, perennial but flashy, or perennial. An ephemeral stream flows briefly indirect response to precipitation, and as used here, includes intermittent streams. A perennial stream flows all or most of theyear, and a perennial but flashy stream responds to precipitation by rapid changes in stage and discharge. Perennialstreams may be relatively stable or unstable, depending on other factors such as channel boundaries and bed material.
In arid regions, ephemeral streams may be relatively large and unstable. They may pose problems in determining thestage-discharge relationship and in estimating the depth of scour. A thalweg that shifts with stage and channel degradationby headcutting may also cause problems. In humid regions, ephemeral streams are likely to be small and pose fewproblems of instability.
2.2.3 Bed Material
Streams are classified, according to the dominant size of the sediment on their beds, as silt-clay bed, sand bed, gravel bed,and cobble or boulder bed. Accurate determination of the particle size distribution of bed material requires careful samplingand analysis, particularly for coarse bed material, but for most of the bed material designations, rough approximations canbe derived from visual observation.
No relation has been found between bed material size and the incidence of scour problems at piers, abutments, orembankments [1]. It has been shown that particle size has only a small effect on the depth of scour produced by vortex andwake action around piers. The greatest depths of scour are usually found on streams having sand or sand-silt beds. Thegeneral conclusion is that scour problems are as common on streams having coarse bed material as on streams havingfine bed material. However, very deep scour is more probable in fine bed material.
2.2.4 Valley Setting
Valley relief is used as a means of indicating whether the surrounding terrain is generally flat, hilly, or mountainous. For aparticular site, relief is measured (usually on a topographic map) from the valley bottom to the top of the highest adjacentdivide. Relief greater than 1,000 feet is regarded as mountainous, and relief in the range of 100 to 1,000 feet as hilly.Streams in mountainous regions are likely to have steep slopes, coarse bed materials, narrow floodplains and benon-alluvial, i.e., supply-limited sediment transport rates. In many regions, channel slope increases as the steepness ofvalley side slopes increases. Brice et al., reported no specific hydraulic problems at bridges at 23 study sites inmountainous terrain, at which all have beds of gravel or cobble-boulder [2]. Streams in regions of lower relief are usuallyalluvial and exhibit more problems because of lateral erosion in the channels.
Streams on alluvial fans or on piedmont slopes in arid regions pose special problems. A piedmont slope is a broad slopealong a mountain front, and streams issuing from the mountain front may have shifting courses and poorly defined
Archive
d

channels, as on an alluvial fan. Alluvial fans are among the few naturally occurring cases of aggradation problems attransverse highway crossing. They occur wherever there is a change from a steep to a flat gradient. As the bed materialand water reaches the flatter section of the stream, the coarser bed materials are deposited because of the suddenreduction in both slope and velocity. Consequently, a cone or fan builds out as the material is dropped with the steep sideof the fan facing the floodplain. Although typically viewed as a depositional zone, alluvial fans are also characterized byunstable channel geometries and rapid lateral movement. Deposition tends to be episodic, being interrupted by periods offan trenching and sediment reworking.
The occurrence of deposition versus fan trenching on an alluvial fan surface are important factors in the assessment ofstream stability at bridge crossings (Figure 2). On an untrenched fan, the sediment depositional zone will be nearer themountain front, possibly creating more channel instability on the upper fan surface than on the lower fan surface. Incontrast, a fan that is trenched will promote sediment movement across the fan and move the depositional zone closer tothe toe of the fan, suggesting that the upper fan surface will be more stable than the lower fan surface. However, thegeneral instability of fan channels and their tendency for rapid changes during large floods, and the possible channelavulsion created by deposition near the fan head, suggest that any location of an alluvial fan surface is, or could easilybecome, an area where channel stability is a serious concern to bridge safety.
Figure 2. Diverse morphology of alluvial fans:(a) area of deposition at fan head, (b) fan-head trench with deposition at fan toe
(after [3]).
There is considerable similarity between deltas and alluvial fans. Both result from reductions in slope and velocity, havesteep slopes at their outer edges and tend to reduce upstream slopes. Deposits very similar to a delta develop where asteep tributary enters a larger stream. The steep channel tends to drop part of its sediment load in the main channelbuilding out into the main stream. In some instances, drastic changes can occur in the main stream channel as a result ofdeposition from the tributary stream.
Archive
d
2.2.5 Floodplains
Floodplains are described as the nearly flat alluvial lowlands bordering a stream that are subject to inundation by floods.Many geomorphologists prefer to define a floodplain as the surface presently under construction by the stream, which isflooded with a frequency of about 1.5 years. According to this definition, surfaces flooded less frequently are terraces,abandoned floodplains, or flood-prone areas. However, flood prone areas are considered herein as part of the floodplain.Vegetative cover, land use, and flow depth on the floodplain are also significant factors in stream channel stability. InFigure 1, floodplains are categorized according to width relative to channel width.
Over time, the highlands of an area are worn down, streams erode their banks, and the material that is eroded is utilizedfarther downstream to build banks and bars. Streams move laterally, pushing the highlands back. Low, flat valley land andfloodplains are formed. As streams transport sediment to areas of flatter slopes and, in particular, to bodies of water wherethe velocity and turbulence are too small to sustain transport of the material, the material is deposited forming deltas. Asdeltas build outward, the upstream portion of the channel is elevated through deposition and becomes part of thefloodplain. Also, the stream channel is lengthened and the slope is further reduced. The upstream streambed is filled in andaverage flood elevations are increased. As the stream works across the stream valley, deposition causes the totalfloodplain to raise in elevation. Hence, even old streams are far from static. Old rivers meander, and they are affected bychanges in sea level, influenced by movements of the earth's crust, changed by delta formations or glaciation, and subjectto modifications due to climatological changes and as a consequence of man's development.
2.2.6 Natural Levees
Natural levees form during floods as the stream stage exceeds bankfull conditions. Sediment is then deposited on thefloodplain due to the reduced velocity and transporting capacity of the flood in these overbank areas. The natural leveesformed near the stream are rather steep because coarse material drops out quickly as the overbank velocity is smaller thanthe stream velocity. Farther from the stream, the gradients are flatter and finer materials drop out. Swamp areas are foundbeyond the levees.
Classification based on natural levees is illustrated in Figure 1. Streams with well-developed natural levees tend to be ofconstant width and have low rates of lateral migration. Well-developed levees usually occur along the lower courses ofstreams or where the floodplain is submerged for several weeks or months a year. If the levee is breached, the streamcourse may change through the breach. Areas between natural levees and the valley sides may drain, but slowly. Streamstributary to streams with well-developed natural levees may flow approximately parallel with the larger stream for longdistances before entering the larger stream.
Archive
d

2.2.7 Apparent Incision
The apparent incision of a stream channel is judged from the height of its banks at normal stage relative to its width. For astream whose width is about 100 feet, bank heights in the range of 6 to 10 feet are about average, and higher banksindicate probable incision. For a stream whose width is about 1,000 feet, bank heights in the range of 10 to 15 feet areabout average, and higher banks indicate probable incision. Incised streams tend to be fixed in position and are not likelyto bypass a bridge or to shift in alignment at a bridge. Lateral erosion rates are likely to be slow, except for western arroyoswith high, vertical, and clearly unstable banks.
2.2.8 Channel Boundaries and Vegetation
Although no precise definitions can be given for alluvial, semi-alluvial, or non-alluvial streams, some distinction with regardto the erosional resistance of the earth material in channel boundaries is needed. In geology, bedrock is distinguished fromalluvium and other surficial materials mainly on the basis of age, rather than on resistance to erosion. A compact alluvialclay is likely to be more resistant than a weakly cemented sandstone that is much older. Nevertheless, the term "bedrock"does carry a connotation of greater resistance to erosion, and it is used here in that sense. An alluvial channel is inalluvium, a non-alluvial channel is in bedrock or in very large material (cobbles and boulders) that do not move except atvery large flows, and a semi-alluvial channel has both bedrock and alluvium in its boundaries. The bedrock of non-alluvialchannels may be wholly or partly covered with sediment at low stages, but is likely to be exposed by scour during floods.
Most highway stream crossings are over alluvial streams which are susceptible to more hydraulic problems thannon-alluvial streams. However, the security of foundations in bedrock depends on the quality of the bedrock and the carewith which foundations are set. Serious problems and failures have developed at bridges with foundations on shale,sandstone, limestone, glacial till, and other erodible rock. The New York State Thruway Schoharie Creek bridge failure is arecent catastrophic example of such a failure. Bed material at the bridge site was highly cemented glacial till.
Changes in channel geometry with time are particularly significant during periods when alluvial channels are subjected tohigh flows, and few changes occur during relatively dry periods. Erosive forces during high-flow periods may have acapacity as much as 100 times greater than those forces acting during periods of intermediate and low flow rates. Whenconsidering the stability of alluvial streams, in most instances it can be shown that approximately 90 percent of all changesoccur during that small percentage of the time when the discharge exceeds dominant discharge. A discussion of dominantdischarge may be found in reference [4], but the bank full flow condition is recommended for use where a detailed analysisof dominant discharge is not feasible.
The most significant property of materials of which channel boundaries are comprised is particle size. It is the most readilymeasured property, and, in general, represents a sufficiently complete description of the sediment particle for manypractical purposes. Other properties such as shape and fall velocity tend to vary with size in a roughly predictable manner.
In general, sediments have been classified into boulders, cobbles, gravel, sands, silts, and clays on the basis of theirnominal or sieve diameters. The size range in each general class is given in Table 1. Noncohesive material generallyconsists of silt (0.004-0.062 mm), sand (0.062-2.0 mm), gravel (2.0-64 mm), or cobbles (64-250 mm).
Archive
d

The appearance of the streambank is a good indication of relative stability. A field inspection of a channel will help toidentify characteristics which are associated with erosion rates:
Unstable banks with moderate to high erosion rates usually have slopes which exceed 30 percent, and acover of woody vegetation is rarely present. At a bend, the point bar opposite an unstable cut bank islikely to be bare at normal stage, but it may be covered with annual vegetation and low woody vegetation,especially willows. Where very rapid erosion is occurring, the bank may have irregular indentations.Fissures, which represent the boundaries of actual or potential slump blocks along the bank line indicatethe potential for very rapid bank erosion.
●
Unstable banks with slow to moderate erosion rates may be partly reshaped to a stable slope. Thedegree of instability is difficult to assess, and reliance is placed mainly on vegetation. The reshaping of abank typically begins with the accumulation of slumped material at the base such that a slope is formed,and progresses by smoothing of the slope and the establishment of vegetation.
●
Stable banks with very slow erosion rates tend to be graded to a smooth slope of less than about 30percent. Mature trees on a graded bank slope are convincing evidence of bank stability. In most regionsof the United States, the upper parts of stable banks are vegetated, but the lower part may be bare atnormal stage, depending on bank height and flow regime of the stream. Where banks are low, densevegetation may extend to the water's edge at normal stage. Where banks are high, occasional slumpsmay occur on even the most stable graded banks. Shallow mountain streams that transport coarse bedsediment tend to have stable banks.
●
Table 1. Sediment grade scale.
Size Approximate Sieve MeshOpenings per Inch Class
Millimeters Microns Inches Tyler U.S.Standard
4000-20002000-10001000-500500-250250-130130-64
__________________
__________________
160-8080-4040-2020-1010-55-2.5
__________________
__________________
Very large bouldersLarge bouldersMedium bouldersSmall bouldersLarge cobblesSmall cobbles
64-3232-1616-88-44-2
_______________
_______________
2.5-1.31.3-0.60.6-0.30.3-0.160.16-0.08
______
2-1/259
_________5
10
Very coarse gravelCoarse gravelMedium gravelFine gravelVery fine gravel
Archive
d

2-11-1/2
1/2-1/41/4-1/81/8-1/16
2.00-1.001.00-0.500.50-0.250.25-0.1250.125-0.062
2000-10001000-500500-250250-125125-62
_______________
163260115250
183560
120230
Very course sandCourse sandMedium sandFine sandVery fine sand
1/16-1/321/32-1/641/64-1/1281/128-1/256
0.062-0.0310.031-0.0160.016-0.0080.008-0.004
62-3131-1616-88-4
____________
Coarse slitMedium siltFine siltVery fine silt
1/256-1/5121/512-1/10241/1024-1/20481/2048-1/4096
0.004-0.00200.0020-0.00100.0010-0.00050.0005-0.0002
4-22-1
1-0.50.5-0.24
____________
Course clayMedium clayFine clayVery fine clay
Active bank erosion can be recognized by falling or fallen vegetation along the bank line, cracks along the bank surface,slump blocks, deflected flow patterns adjacent to the bank line, live vegetation in the flow, increased turbidity, fresh verticalfaces, newly formed bars immediately downstream of the eroding area, and, in some locations, a deep scour pool adjacentto the toe of the bank. These indications of active bank erosion can be noted in the field and on stereoscopic pairs of aerialphotographs. Color infrared photography is particularly useful in detecting most of the indicators listed above, especiallydifferences in turbidity. Figure 3 illustrates some of the features which indicate that a bank line is actively eroding.
Figure 3. Active bank erosion illustrated by vertical cut banks, slump blocks, and
Archive
d

falling vegetation (After [5]).
Bank Materials. Resistance of a streambank to erosion is closely related to several characteristics of the bank material.Bank material deposited in the stream can be broadly classified as cohesive, noncohesive, and composite. Typical bankfailure surfaces of various materials are shown in Figure 4 and described as follows [6]:
Noncohesive bank material tends to be removed grain by grain from the bank. The rate of particleremoval, and particle movement, and hence the rate of bank erosion, is affected by factors such asparticle size, bank slope, the direction and magnitude of the velocity adjacent to the bank, turbulentvelocity fluctuations, the magnitude of and fluctuations in the shear stress exerted on the banks, seepageforce, piping, and wave forces. Figure 4(a) illustrates failure of banks of noncohesive material from flowslides resulting from a loss of shear strength because of saturation, and failure from sloughing resultingfrom the removal of materials in the lower portion of the bank.
●
Cohesive material is more resistant to surface erosion and has low permeability, which reduces theeffects of seepage, piping, frost heaving, and subsurface flow on the stability of the banks. However,when undercut and/or saturated, such banks are more likely to fail due to mass wasting processes.Failure mechanisms for cohesive banks are illustrated in Figure 4(b).
●
Composite or stratified banks consist of layers of materials of various sizes, permeability, and cohesion.The layers of noncohesive material are subject to surface erosion, but may be partly protected byadjacent layers of cohesive material. This type of bank is also vulnerable to erosion and sliding as aconsequence of subsurface flows and piping. Typical failure modes are illustrated in Figure 4(c).
●
Piping. Piping is a phenomenon common to alluvial streambanks. With stratified banks, flow is induced in more permeablelayers by changes in stream stage and by waves. If flow through the permeable lenses is capable of dislodging andtransporting particles, the material is slowly removed, undermining portions of the bank. Without this foundation material tosupport the overlying layers, a block of bank material drops down and results in the development of tension cracks assketched in Figure 4(c). These cracks allow surface flows to enter, further reducing the stability of the affected block ofbank material. Bank erosion may continue on a grain-by-grain basis or the block of bank material may ultimately slidedownward and outward into the channel, with bank failure resulting from a combination of seepage forces, piping, andmass wasting.
Archive
d

Figure 4. Typical bank failure surfaces: (a) noncohesive, (b) cohesive, and (c) composite (After [6]).
Mass Wasting. Local mass wasting is another form of bank failure. If a bank becomes saturated and possibly undercut byflowing water, blocks of the bank may slump or slide into the channel. Mass wasting may be caused or aggravated by the
Archive
d

construction of homes on river banks, operation of equipment adjacent to the banks, added gravitational force resultingfrom tree growth, location of roads that cause unfavorable drainage conditions, agricultural uses on adjacent floodplain,saturation of banks by leach fields from septic tanks, and increased infiltration of water into the floodplain as a result ofchanging land-use practices.
Various forces are involved in mass wasting. Landslides, the downslope movement of earth and organic materials, resultfrom an imbalance of forces. These forces are associated with the downslope gravity component of the slope mass.Resisting these downslope forces are the shear strength of the materials and any contribution from vegetation via rootstrength or man's slope reinforcement activities. When the toe of a slope is removed, as by a stream, the slope materialsmay move downward into the void in order to establish a new equilibrium. Oftentimes, this equilibrium is a slopeconfiguration with less than original surface gradient. The toe of the failed mass then provides a new buttress againstfurther movements. Erosion of the toe of the slope then begins the process over again.
2.2.9 Sinuosity
Sinuosity is the ratio of the length of a stream reach measured along its centerline, to the length measured along the valleycenterline or along a straight line connecting the ends of the reach. The valley centerline is preferable when the valley itselfis curved. Sometimes, sinuosity is defined as the ratio of stream slope to valley slope. Straight stream reaches have asinuosity of one, and the maximum value of sinuosity for natural streams is about four. Inasmuch as the sinuosity of astream is rarely constant from one reach to the next, no very refined measurement of sinuosity is warranted. The fourclasses of sinuosity in Figure 1 are arbitrary.
A straight stream, or one that directly follows the valley centerline, sometimes has the same slope as the valley. As thesinuosity of the stream increases, its slope decreases in direct proportion. Similarly, if a sinuous channel is straightened,the slope increases in direct proportion to the change in length.
The size, form, and regularity of meander loops are aspects of sinuosity. Symmetrical meander loops are not verycommon, and a sequence of two or three identical symmetrical loops is even less common. In addition, meander loops arerarely of uniform size. The largest is commonly about twice the diameter of the smallest. Statistically, the size-frequencydistribution of loop radii tends to have a normal distribution.
There is little relation between degree of sinuosity and lateral stream stability. A highly meandering stream may have alower rate of lateral migration than a sinuous stream of similar size (Figure 1). Stability is largely dependent on otherproperties, especially bar development and the variability of channel width.
Streams are broadly classified as straight, meandering or braided. Any change imposed on a stream system may changeits planform geometry.
Straight Streams. A straight stream has small sinuosity at bank full stage. At low stage, the channel develops alternatesandbars, and the thalweg meanders around the sandbars in a sinuous fashion. Straight streams are considered atransitional stage to meandering, since straight channels are relatively stable only where sediment size and load are small,
Archive
d

gradient, velocities, and flow variability are low, and the channel width-depth ratio is relatively low. Straight channel reachesof more than 10 channel widths are not common in nature.
Meandering Streams. Alluvial channels of all types deviate from a straight alignment. The thalweg oscillates transverselyand initiates the formation of bends. In a straight stream, alternate bars and the thalweg are continually changing; thus, thecurrent is not uniformly distributed through the cross section, but is deflected toward one bank and then the other.Sloughing of the banks, nonuniform deposition of bed load, debris such as trees, and the Coriolis force due to the earth'srotation have been cited as causes for the meandering of streams. When the current is directed toward a bank, the bank iseroded in the area of impingement, and the current is deflected and impinges on the opposite bank farther downstream.The angle of deflection of the current is affected by the curvature formed in the eroding bank and the lateral depth oferosion. Figure 5 shows bars, pools, and crossings typical of a meandering channel and the effects on water surfaceprofiles.
Sinuous, meandering, and highly meandering streams have more or less regular inflections that are sinuous in plan,consisting of a series of bends connected by crossings. In the bends, deep pools are carved adjacent to the concave bankby the relatively high velocities. Because velocities are lower on the inside of bends, sediments are deposited in this region,forming point bars. Also, the centrifugal force in the bend causes a transverse water surface slope and helicoidal flow witha bottom velocity away from the outer bank toward the point bar. These transverse velocities enhance point bar building bysweeping the heavier concentrations of bed load toward the convex bank where they are deposited to form the point bar.Some transverse currents have a magnitude of about 15 percent of the average channel velocity. The bends areconnected by crossings (short straight reaches) which are quite shallow compared to the pools in the bendways. At lowflow, large sandbars form in the crossings if the channel is not well confined. Scour in the bend causes the bend to migratedownstream and sometimes laterally. Lateral movements as large as 2,500 feet per year have been observed in largealluvial rivers. Much of the sediment eroded from the outside bank is deposited in the crossing and on the point bar in thenext bend downstream. The variability of bank materials and the fact that the stream encounters and produces suchfeatures as clay plugs causes a wide variety of river forms. The meander belt formed is often fifteen to twenty times thechannel width.
Archive
d

Figure 5. Plan view and cross section of a meandering stream (After [4]).
On a laterally unstable channel, or at actively migrating bends on an otherwise stable channel, point bars are usually wideand unvegetated and the opposite bank is cut and often scalloped by erosion. The crescent-shaped scars of slumping maybe visible from place to place along the bank line. The presence of a cut bank opposite a point bar is evidence of instability.Sand or gravel on the bar appears as a light tone on aerial photographs. The unvegetated condition of the point bar isattributed to a rate of outbuilding that is too rapid for vegetation to become established. However, the establishment ofvegetation on a point bar is dependent on factors other than the rate of growth of the point bar, such as climate and thetiming of floods. Therefore, the presence of vegetation on a point bar is not conclusive evidence of stability. If the width ofan unvegetated point bar is considered as part of the channel width, the channel tends to be wider at bends.
As a meandering stream system moves laterally and longitudinally, meander loops move at unequal rates because ofunequal erodibility of the banks. This causes the channel to appear as a slowly developing bulb-form. Channel geometrydepends upon the local slope, bank material, and the geometry of adjacent bends. Years may be required before aconfiguration characteristic of average conditions in the stream is attained.
If the proposed highway or highway stream crossing is located near a meander loop, it is useful to have some insight intothe probable way in which the loop will migrate or develop, as well as its rate of growth. No two meanders will behave inexactly the same way, but the meanders on a particular stream reach tend to conform to one of the several modes ofbehavior illustrated in Figure 6, which is based on a study of about 200 sinuous or meandering stream reaches [1].
Archive
d

Mode a (Figure 6) represents the typical development of a loop of low amplitude, which decreases in radius as it extendsslightly in a downstream direction. Mode b rarely occurs unless meanders are confined by artificial levees or by valley sideson a narrow floodplain. Well developed meanders on streams that have moderately unstable banks are likely to followMode c. Mode d applies mainly to larger loops on meandering or highly meandering streams. The meander has becometoo large in relation to stream size and flow, and secondary meanders develop, converting it to a compound loop. Mode ealso applies to meandering or highly meandering streams, usually of the equiwidth, point-bar type. The banks have beensufficiently stable for an elongated loop to form without being cut off, but the neck of the loop is gradually being closed andcutoff will eventually occur at the neck. Modes f and g apply mainly to locally braided, sinuous, or meandering streamshaving unstable banks. Loops are cut off by chutes that break diagonally or directly across the neck.
Oxbow lakes are formed by the cutoff of meander loops, which occurs either by gradual closure of the neck (neck cutoffs)or by a chute that cuts across the neck (chute cutoffs). Neck cutoffs are associated with relatively stable channels, andchute cutoffs with relatively unstable channels. Recently formed oxbow lakes along a channel are evidence of recent lateralmigration. Commonly, a new meander loop soon forms at the point of cutoff and grows in the same direction as theprevious meander. Cutoffs tend to induce rapid bank erosion at adjacent meander loops. The presence of abundant oxbowlakes on a floodplain does not necessarily indicate a rapid channel migration rate because an oxbow lake may persist forhundreds of years.
Usually the upstream end of the oxbow lake fills quickly to bank height. Overflow during floods and overland flow enteringthe oxbow lake carry fine materials into the oxbow lake area. The lower end of the oxbow remains open and drainageentering the system can flow out from the lower end. The oxbow gradually fills with fine silts and clays which are plastic andcohesive. As the stream channel meanders, old bendways filled with cohesive materials (referred to as clay plugs) aresufficiently resistant to erosion to serve as semipermanent geologic controls which can drastically affect planformgeometry.
The local increase in channel slope due to cutoff usually results in an increase in the growth rate of adjoining meanders,and an increase in channel width at the point of cutoff. On a typical wide-bend point-bar stream, the effects of cutoff do notextend very far upstream or downstream. The consequences of cutoffs are an abruptly steeper stream gradient at the pointof the cutoff, scour at the cutoff, and a propagation of the scour in an upstream direction. Downstream of a cutoff, thegradient of the channel is not changed and, therefore, the increased sediment load caused by upstream scour will usuallybe deposited at the site of the cutoff or below it, forming a large bar.
In summary, there is little relation between degree of sinuosity, as considered apart from other properties, and lateralstream stability [1]. A highly meandering stream may have a lower rate of lateral migration than a sinuous stream of similarsize. Assessment of stability is based mainly on additional properties, especially on bar development and the variability ofchannel width. However, many hydraulic problems are associated with the location of highway crossings at a meander orbend. These include the shift of flow direction at flood stage, shift of thalweg toward piers or abutments, development ofpoint bars in the bridge reach, and lateral channel erosion at piers, abutments, or approaches.
Archive
d

Figure 6. Modes of meander loop development: (a) extension; (b) translation; (c) rotation; (d) conversion to acompound loop; (e) neck cutoff by closure; (f) diagonal cutoff by chute; and (g) neck cutoff by chute (After [1]).
Since random factors seem to be involved in the migration of meanders, the exact rate or place of erosion is probably notpredictable. However, the most rapid bank erosion is generally at the outside of meanders, downstream from the apex ofthe loop.
The cutoff of a meander, whether done artificially or naturally, causes a local increase in channel slope and a more rapidgrowth rate of adjoining meanders. Adjustment of the channel to increase in slope seems to be largely accomplished byincrease in channel width (wetted perimeter) at and near the point of cutoff.
Some generalizations can be made, from general knowledge of stream behavior, about the probable consequences ofcontrolling or halting the development of a meander loop by the use of countermeasures. The most probableconsequences relate to change in flow alignment (or lack of change, if the position of a naturally eroding bank is heldconstant). The development of a meander is affected by the alignment of the flow that enters it. Any artificial influence onflow alignment is likely to affect meander form. Downstream bank erosion rates are not likely to be increased, but the pointsat which bank erosion occurs are likely to be changed. In the case where flow is deflected directly at a bank, an increase inerosion rates would be expected. The recent failure of a major bridge on the Hatchie River near Covington, Tennessee hasbeen attributed, in part, to lateral migration of the channel in the bridge reach.
2.2.10 Braided Streams
A braided stream is one that consists of multiple and interlacing channels (Figure 1). In general, a braided channel has alarge slope, a large bed-material load in comparison with its suspended load, and relatively small amounts of silts and claysin the bed and banks. The magnitude of the bed load is more important than its size. If the flow is overloaded withsediment, deposition occurs, the bed aggrades, and the slope of the channel increases in an effort to obtain a graded state.
Archive
d

As the channel steepens, velocity increases, and multiple channels develop. Multiple channels are generally formed asbars of sediment and deposited within the main channel, causing the overall channel system to widen. However, braidedstreams may occur with a graded state that is neither aggrading nor degrading.
The formation of multiple, mid channel islands and bars is characteristic of streams that transport large bed loads. Thepresence of bars obstructs flow and scour occurs, either lateral erosion of banks on both sides of the bar, scour of thechannels surrounding the bar, or both. This erosion will enlarge the channel and, with reduced water levels, an island mayform at the site of a gravel or sand bar. The worst case will be where major bar or island forms at a bridge site. This canproduce erosion of both banks of the stream and bed scour along both sides of the island. Reduction in the flow capacitybeneath the bridge can result as a vegetated island forms under the bridge. An island or bar that forms upstream ordownstream of a bridge can change flow alignment and create bank erosion or scour problems at the bridge site.
Island shift is easily identified because active erosion at one location and active deposition at another on the edge of anisland can be recognized in the field. Also, the development or abandonment of flood channels and the joining together ofislands can be detected by observing vegetational differences and patterns of erosion and deposition.
The degree of channel braiding is indicated by the percent of reach length that is divided by bars and islands, as shown inFigure 1. Braided streams tend to be common in arid and semiarid parts of the western United States and regions havingactive glaciers.
Braided streams may present difficulties for highway construction because they are unstable, change alignment rapidly,carry large quantities of sediment, are very wide and shallow even at flood flow and are, in general, unpredictable. Deepscour holes can develop downstream of a gravel bar or island where the flow from two channels comes together.
Braided streams generally require long bridges if the full channel width is crossed or effective flow-control measures if thechannel is constricted. The banks are likely to be easily erodible, and unusual care must be taken to prevent lateral erosionat or near abutments. The position of braids is likely to shift during floods, resulting in unexpected velocities, angle ofattack, and depths of flow at individual piers. Lateral migration of braided streams takes place by lateral shift of a braidagainst the bank, but available information indicates that lateral migration rates are generally less than for meanderingstreams. Along braided streams, however, migration is not confined to the outside of bends but can take place at any pointby the lateral shift of individual braids.
2.2.11 Anabranched Streams
An anabranched stream differs from a braided stream in that the flow is divided by islands rather than bars, and the islandsare large relative to channel width. The anabranches, or individual channels, are more widely and distinctly separated andmore fixed in position than the braids of a braided stream. An anabranch does not necessarily transmit flow at normalstage, but it is an active and well-defined channel, not blocked by vegetation. The degree of anabranching is arbitrarilycategorized in Figure 1 in the same way as the degree of braiding was described.
Although the distinction between braiding and anabranching may seem academic, it has real significance for engineering
Archive
d

purposes. Inasmuch as anabranches are relatively permanent channels that may convey substantial flow, diversion andconfinement of an anabranched stream is likely to be more difficult than for a braided stream. Problems associated withcrossings on anabranched streams can be avoided if a site where the channel is not anabranched can be chosen. If not,the designer may be faced with a choice of either building more than one bridge, building a long bridge, or divertinganabranches into a single channel. Problems with flow alignment may occur if a bridge is built at or near the junction ofanabranches. Where anabranches are crossed by separate bridges, the design discharge for the bridges may be difficult toestimate. If one anabranch should become partly blocked, as by floating debris or ice, an unexpected amount of flow maybe diverted to the other.
2.2.12 Variability of Width and Development of Bars
The variability of unvegetated channel width is a useful indication of the lateral stability of a channel. The visual impressionof unvegetated channel width on aerial photographs depends on the relatively dark tones of vegetation as contrasted withthe lighter tones of sediment or water. A channel is considered to be of uniform width (equiwidth) if the unvegetated widthat bends is not more than 1.5 times the average width at the narrowest places.
The relationship between width variability and lateral stability is based on the rate of development of point bars andalternate bars. If the concave bank at a bend is eroding slowly, the point bar will grow slowly and vegetation will becomeestablished on it. The unvegetated part of the bar will appear as a narrow crescent. If the bank is eroding rapidly, theunvegetated part of the rapidly growing point bar will be wide and conspicuous. A point bar with an unvegetated widthgreater than the width of flowing water at the bend is considered to be wider than average. Lateral erosion rates areprobably high in stream reaches where bare point bars tend to exceed average width. In areas where vegetation is quicklyestablished, as in rainy southern climates, cut banks at bends may be a more reliable indication of instability than theunvegetated width of point bars.
Three categories of width variability are distinguished in Figure 1, but the relative lateral stability of these must be assessedin connection with bar development and other properties. In general, equiwidth streams having narrow point bars are themost stable laterally, and random-width streams having wide, irregular point bars are the least stable. Vertical stability, orthe tendency to scour, cannot be assessed from these properties. Scour may occur in any alluvial channel. In fact, thegreatest potential for deep scour might be expected in laterally stable equiwidth channels, which tend to have relativelydeep and narrow cross sections and bed material in the size range of silt and sand.
2.3 Lane Relation and Other Geomorphic Concepts
The major complicating factors in river mechanics are: (1) the large number of interrelated variables that can simultaneously respondto natural or imposed changes in a stream system, and (2) the continual evolution of stream channel patterns, channel geometry, barsand forms of bed roughness with changing water and sediment discharge. In order to understand the responses of a stream to theactions of man and nature, a few simple geomorphic concepts are presented here.
Archive
d

The dependence of stream form on slope, which may be imposed independent of other stream characteristics, is illustratedschematically in Figure 7. Any natural or artificial change which alters channel slope can result in modifications to the existing streampattern. For example, a cutoff of a meander loop increases channel slope. Referring to Figure 7, this shift in the plotting position to theright could result in a shift from a relatively tranquil, meandering pattern toward a braided pattern that varies rapidly with time, has highvelocities, is subdivided by sandbars, and carries relatively large quantities of sediment. Conversely, it is possible that a slightdecrease in slope could change an unstable braided stream into a meandering one.
Figure 7. Sinuosity vs. slope with constant discharge (After [4]).
The significantly different channel dimensions, shapes, and patterns associated with different quantities of discharge and amounts ofsediment load indicate that as these independent variables change, major adjustments of channel morphology can be anticipated.Further, a change in hydrology may cause changes in stream sinuosity, meander wave length, and channel width and depth. A longperiod of channel instability with considerable bank erosion and lateral shifting of the channel may be required for the stream tocompensate for the hydrologic change. The reaction of a channel to changes in discharge and sediment load may result in channeldimension changes contrary to those indicated by many regime equations. For example, it is conceivable that a decrease in dischargetogether with an increase in sediment load could cause a decrease in depth and an increase in width.
Figure 8 illustrates the dependence of sand bed stream form on channel slope and discharge. According to Lane, a sand bed channelmeanders where [7]:
(1)
Archive
d

Similarly, a sand bed channel is braided where:
(2)
where: S = channel bed slope, ft/ftQ = mean discharge, ft3/sec
The zone between the lines defining braided streams and meandering streams in Figure 8 is the transitional range, i.e., the range inwhich a stream can change readily from one stream form to the other.
Many U.S. rivers, classified as intermediate sand bed streams, plot in this zone between the limiting curves defining meandering andbraided stream. If a stream is meandering but its discharge and slope borders on the transitional zone, a relatively small increase inchannel slope may cause it to change, with time, to a transitional or braided stream.
Leopold and Wolman plotted slope and discharge for a variety of natural streams [8]. They observed that a line could separatemeandering from braided streams. The equation of this line is:
(3)
Streams classified as meandering by Leopold and Wolman are those whose sinuosity is greater than 1.5. Braided streams are thosewhich have relatively stable alluvial islands and, therefore, two or more channels. They note that sediment size is related to slope andchannel pattern but do not try to account for the effect of sediment size on the morphology of streams. They further note that braidedand meandering streams can be differentiated based on combinations of slope, discharge, and width/depth ratio, but regard width as avariable dependent mainly on discharge.
Archive
d

Figure 8. Slope-discharge relationship for braiding or meandering insand bed streams (After [7]).
Long reaches of many streams have achieved a state of equilibrium, for practical engineering purposes. These stable reaches arecalled "graded" streams by geologists and "poised" streams by engineers. However, this condition does not preclude significantchanges over a short period of time or over a period of years. Conversely, many streams contain long reaches that are activelyaggrading or degrading. These aggrading and degrading channels pose definite hazards to highway crossings and encroachments, ascompared with poised streams.
Regardless of the degree of channel stability, man's activities may produce major changes in stream characteristics locally andthroughout an entire reach. All too frequently, the net result of a stream "improvement" is a greater departure from equilibrium thanexisted prior to "improvement." Designers of stream channel modifications should invariably seek to enhance the natural tendency ofthe stream toward equilibrium and a stable condition. This requires an understanding of the direction and magnitude of change inchannel characteristics which will result from the actions of man and nature. This understanding can be obtained by: (1) studying thestream in a natural condition, (2) having knowledge of the sediment and water discharge, (3) being able to predict the effects andmagnitude of man's future activities, and (4) applying to these a knowledge of geology, soils, hydrology, and hydraulics of alluvialrivers.
Predicting the response to channel modifications is a very complex task. There are large numbers of variables involved in the analysisthat are interrelated and can respond to changes in a stream system in the continual evolution of stream form. The channel geometry,bars, and forms of bed roughness all change with changing water and sediment discharges. Because such a prediction is necessary,
Archive
d

useful methods have been developed to qualitatively and quantitatively predict the response of channel systems to changes.
Quantitative prediction of response can be made if all of the required data are known with sufficient accuracy. However, available dataare usually not sufficient for quantitative estimates, and only qualitative estimates are possible. Examples of studies that have beenundertaken by various investigators for qualitative estimates follow. Lane studied the changes in stream morphology caused bymodifications of water and sediment discharges [9]. Similar but more comprehensive treatments of channel response to changingconditions in streams have been presented by Leopold and Maddock [10], Schumm [11], and Santos-Cayado [12]. All research resultssupport the relationship originally proposed by Lane:
(4)
where: Q = dischargeS = energy slopeQs = sediment dischargeD50 = median sediment size
Equation 4 is very useful to predict qualitatively channel response to climatological changes, stream modifications, or both. Thegeomorphic relation expressed is only an initial step in analyzing long-term channel response problems. However, this initial step isuseful because it warns of possible future difficulties related to channel modifications. Examples of its use are given in reference [4].
2.4 Aggradation/Degradation and the Sediment Continuity Concept
2.4.1 Aggradation/Degradation
Aggradation and degradation are the vertical raising and lowering, respectively, of the streambed over relatively longdistances and time frames. Such changes, which are sometimes referred to as gradation changes, can be the result ofboth natural and man-induced changes in the watershed. The sediment continuity concept is the primary principle appliedin both qualitative and quantitative analysis of bed elevation changes. After an introduction to the concept of sedimentcontinuity, some of factors causing gradation change are reviewed.
2.4.2 Overview of the Sediment Continuity Concept
The amount of material transported, eroded, or deposited in an alluvial channel is a function of sediment supply andchannel transport capacity. Sediment supply is provided from the tributary watershed and from any erosion occurring in theupstream channel. Sediment transport capacity is a function of the size of sediment, the discharge of the stream, and the
Archive
d

geometric and hydraulic properties of the channel. When the transport capacity equals sediment supply, a state ofequilibrium exists.
Application of the sediment continuity concept to a single channel reach illustrates the relationship between sedimentsupply and transport capacity. Technically, the sediment continuity concept states that the sediment inflow minus thesediment outflow equals the time rate of change of sediment volume in a given reach. More simply stated, during a giventime period the amount of sediment coming into the reach minus the amount leaving the downstream end of the reachequals the change in the amount of sediment stored in that reach (see Figure 9). The sediment inflow to a given reach isdefined by the sediment supply from the watershed (upstream of the study reach plus any significant lateral input directly tothe study reach). The transport capacity of the channel within the given reach defines the sediment outflow. Changes in thesediment volume within the reach occur when the total input to the reach (sediment supply) is not equal to the downstreamoutput (sediment transport capacity). When the sediment supply is less than the transport capacity, erosion (degradation)will occur in the reach so that the transport capacity at the outlet is satisfied, unless controls exist that limit erosion.Conversely, when the sediment supply is greater than the transport capacity, deposition (aggradation) will occur in thereach.
Controls that limit erosion may either be man made or natural. Man made controls included bank protection works, gradecontrol structures, and stabilized bridge crossings. Natural controls can be geologic, such as outcroppings, or the presenceof significant coarse sediment material in the channel. The presence of coarse material can result in the formation of asurface armor layer of larger sediments that are not transported by average flow conditions.
Figure 9. Definition sketch of sediment continuity concept applied to a givenchannel reach over a given time period.
Archive
d

2.4.3 Factors Initiating Gradation Changes
Man-induced Changes. Man's activities are the major cause of streambed gradation changes. Very few gradation changesare due to natural causes, although some may be the result of both natural and man-induced causes. The most commonactivities which result in gradation changes caused by man are channel alterations, streambed mining, dams andreservoirs, and land-use changes. Highway construction, including the construction of bridges and channel alterations oflimited extent, usually affect stream vertical stability only locally.
Channel Alterations. Dredging, channelization, straightening, the construction of cutoffs to shorten the flow path of astream, and clearing and snagging to increase channel capacity are the major causes of streambed elevation changes. Anincrease in slope resulting from a shorter flow path, or an increase in flow capacity results in increased velocities and acorresponding increase in sediment transport capacity. If the stream was previously in equilibrium (supply equal totransport capacity) the channel may adjust, either by increasing its length or by reducing its slope by degradation, in orderto reestablish equilibrium. The most frequent response is a degrading streambed followed by bank erosion and a newmeander pattern.
Constrictions in a stream channel, as in river control projects to maintain a navigation channel or highway crossings, alsoincrease velocities and the sediment transport capacity in the constricted reach. The resulting degradation can beconsidered local, but it may extend through a considerable reach of stream, depending on the extent of the river controlproject. Constrictions may also cause local aggradation problems downstream.
The response to an increased sediment load in a stream that was near equilibrium conditions (i.e., supply now greater thantransport capacity) is normally deposition in the channel downstream of the alteration. The result is an increase in floodstages and overbank flooding in downstream reaches. In time, the aggradation will progress both upstream anddownstream of the end of the altered channel, and the stream reach may become locally braided as it seeks a new balancebetween sediment supply and sediment transport capacity.
Streambed Mining. Streambed mining for sand or gravel can be beneficial or detrimental, depending on the balancebetween sediment supply and transport capacity. Where the sediment supply exceeds the stream's transport capacitybecause of man's activities in the watershed or from natural causes, controlled removal of gravel bars and limited miningmay enhance both lateral and vertical stability of the stream.
The usual result of streambed mining is an imbalance between sediment supply and transport capacity. Upstream of theoperation, the water surface slope is increased and bank erosion and headcutting or a nick point may result. The extent ofthe damage that can result is a function of the volume and depth of the sand and gravel pit relative to the size of thestream, bed material size, flood hydrographs, upstream sediment transport, and the location of the pit. If the size of theborrow pit is sufficiently large, a substantial quantity of the sediment inflow will be trapped in the pit and degradation willoccur downstream. If bank erosion and headcutting upstream of the pit produce a sediment supply greater than the trapcapacity of the pit and the transport capacity downstream, aggradation could occur. However, this circumstance is unlikelyand streambed mining generally causes degradation upstream and downstream of the pit.
Dams and Reservoirs. Storage and flood control reservoirs produce a stream response both upstream and downstream ofthe reservoir. A stream flowing into a reservoir forms a delta as the sediment load is deposited in the ponded water. This
Archive
d

deposition reduces the stream gradient upstream of the reservoir and causes aggradation in the channel. Aggradation canextend many miles upstream.
Downstream of reservoirs, stream channel stability is affected because of the changed flow characteristics and becauseflow releases are relatively sediment-free. Clear water releases pick up a new sediment load and degradation can result.The stream channel and stream gradient that existed prior to the construction of the dam was the cumulative result of pastfloods of various sizes and subject to change with each flood. Post-construction flows are usually of lesser magnitude andlonger duration and the stream will establish a new balance in time consistent with the new flow characteristics.
It is possible for aggradation to occur downstream of a reservoir if flow releases are insufficient to transport the size orvolume of sediment brought in by tributary streams. Stream flow regulation, which is an objective in dam construction andreservoir operation, is sometimes overlooked in assessing stream system response to this activity by man. The reduction inflood magnitude and stage downstream of dams as a result of reservoir operation can result in greatly increased hydraulicgradients and degradation in tributaries downstream of the dam. A notorious bridge failure on the Big Sioux River was, inpart, attributable to such a condition.
Land Use Changes. Agricultural activities, urbanization, commercial development, and construction activities alsocontribute to bed elevation problems in streams. Clear cutting of forests, and the destruction of grasslands by overgrazing,burning and cultivation can accelerate erosion, causing streams draining these areas to become overloaded with sediment(i.e., excess sediment supply). As the overload persists, the stream system aggrades and increases its slope to increase itssediment transport capacity.
Construction and developing urban and commercial areas can affect stream gradient stability. Fully developed urban areasare low sediment producers because of impervious areas and lawns, but tend to increase the magnitude of runoff eventsand reduce their duration. The response of a small stream system to these changes is degradation, changes in planform(e.g., increased sinuosity), and channel widening downstream of the urbanized area. However, if the urbanized area issmall relative to the basin of the stream in which it is located, the net effect will probably be small.
Natural Changes. Natural causes of stream gradient instability are primarily natural channel alterations, earthquake,tectonic and volcanic activities, climatic change, fire, and channel bed and bank material erodibility.
Cutoffs and chute development associated with channel straightening are the most common natural channel alterations.This results in a shorter flow path, a steeper channel gradient, and an increase in sediment transport capacity. Significantbank erosion and degradation progressing to an upstream control can result. Downstream of the cutoff, aggradation willoccur.
Severe landslides, mud flows, uplifts and lateral shifts in terrain, and liquefaction of otherwise semi-stable materials areassociated with earthquakes and tectonic activities. The response to these activities include channel changes, scour ordeposition locally or system-wide, headcutting and bank instability.
Alluvial fans, discussed under Valley Setting, are among the few naturally occurring cases of channel aggradation.
Archive
d

2.4.4 Stream System Response
Streambed aggradation or degradation affects not only the stream in which the gradation change is initiated, but alsotributaries to the stream and the stream to which it is tributary. Thus, the stream system is in an imbalanced sedimentsupply-sediment transport capacity condition, and it will seek a new state of equilibrium. A few examples are cited toillustrate the system-wide response to gradation changes. These examples also illustrate the use of several geomorphicconcepts introduced in Section 2.3 and the discussion of Section 2.4.3.
Example 1. A degrading principal stream channel will cause tributaries to the stream to degrade, thus contributingadditional sediment load to the degrading stream. This larger sediment load will slow the rate of degradation in the principalstream channel and may halt or reverse it for a period of time if the contribution is large enough or if a tributary transportsmaterial which armors the bed of the degrading stream.
Using Equation 4, the basic response of the principal stream can be expressed as:
Here, it is assumed that water discharge (Q) and sediment size (D50) remain unchanged. (Note: When neither + or -appears as a superscript in the Lane relationship, conditions remain unchanged). Thus, the increase in sediment discharge
derived from the tributary stream must result in an increase in slope (S+) on the master stream if the geomorphicbalance expressed by the Lane relationship is to hold. This increase in slope on the principal stream then slows or reversesthe original degradation of the principal stream which initiated the stream system response.
Example 2. The sediment supply available for transport by a reach of stream may be reduced by changes in the watershedwhich reduce erosion, mining of sand and gravel from the streambed upstream of the reach, or the construction of a dam toimpound water upstream of the reach. In general, for the two latter cases, sediment transported by the stream is trapped inthe mined areas or reservoir and mostly clear water is released downstream. Figure 10 illustrates the principle by use ofthe example of a dam. Referring to Equation 4, a decrease in sediment discharge Qs will cause a decrease in slope S, ifthe discharge Q and median sediment size D50 remain constant, or:
The original equilibrium channel gradient (Figure 10) is represented by the line C A. A new equilibrium grade representedby C' A will result from a decrease in sediment supply. The dam is a control in the channel which prevents the effects fromextending upstream. Except for the channel control formed by the dam, similar effects are experienced at any locationwhich undergoes a reduction in sediment supply.
Archive
d

Figure 10. Changes in channel slope in response to a decrease in sedimentsupply at point C.
Referring to Figure 7, for a low sinuosity braided stream, this decrease in slope below the dam could result in an increasein sinuosity and a change in planform toward a combination meandering/braided stream. If the stream below the dam wereinitially a meandering stream at near maximum sinuosity for the original slope, the decrease in slope below the dam couldshift the planform of the stream toward a reduced sinuosity, meandering thalweg channel. These changes in plottingposition are illustrated as (1) and (2), respectively, on Figure 11a.
A similar result can be derived from Figure 8. For an initially braided channel pattern below the dam [(1) on Figure 11b], adecrease in slope below the dam could indicate a tendency to shift the stream's plotting position downward, possibly intothe intermediate stream range (i.e., a combination of meandering and braided as on Figure 11a). For an initiallymeandering stream [(2) on Figure 11b], the decrease in slope below the dam could indicate a tendency toward a lessmeandering channel (as on Figure 11a). It should be noted that both of these cases have assumed a constant discharge(Q).
As discussed in Section 2.4.3, the effects downstream of a dam are more complex than a simple reduction in sedimentsupply. If the reservoir is relatively small and water flow rates downstream are little affected, degradation may occurdownstream initially and aggradation may then occur after the reservoir fills with sediments. Except for local scourdownstream of the dam, the new equilibrium grade may approach line C A (Figure 10) over the long term. This could applyto a diversion dam or other small dam in a stream.
Archive
d

Figures 11a and b. Use of geomorphic relationships of Figures 7 and 8in a qualitative analysis.
Dams constructed to impound water for flood control or water supply usually have provisions for sediment storage. Overthe economic life of the project, essentially clear water is released downstream. For practical purposes, the sedimentsupply to downstream reaches is permanently reduced. Reservoirs developed for these purposes, however, also reducethe water flow rates downstream. Referring to Equation 4, a reduction in discharge Q- may have a moderating effect on thereduction in slope S and, consequently, on degradation at the dam CC' in Figure 10. If sediment discharge or sediment sizeremain constant below the dam (e.g., a tributary downstream continues to bring in a large sediment discharge), this wouldbe expressed as:
Considering the more likely scenario of stream response to a dam, both water discharge (Q) and sediment discharge (Qs)would decrease. It is also possible that sediment size (D50) in the reach below the dam would increase due to armoring ortributary sediment inflow. Using Equation 4, this complex result could be expressed as:
Here, the resulting response in slope (S±) would depend on the relative magnitude of changes in the other variables in the
Archive
d

relationship.
Go to Chapter 3
Archive
d
3.0 Hydraulic Factors and Principles
Go to Chapter 4
3.1 Introduction
The design of highway stream crossings and countermeasures to prevent damage from streamflowrequires assessment of factors that characterize stream flow and channel conditions at the bridgesite. The importance of hydraulic or flow factors in the crossing design process is influenced by theimportance of the bridge and by land use on the floodplain, among other things. Each of thehydraulic factors listed in the left column of Figure 12 has an effect on stream stability at a bridgecrossing. Since the geometry and location of the bridge crossing can also affect stream stability, themost significant factors related to bends, confluences, alignment, and highway profile aresummarized in Figure 12. Hydraulic factors are discussed in the following section. This is followed bya discussion of the geometry and location of the highway stream crossings, and some generalconcepts related to the hydraulic design of bridges.
3.2 Hydraulic Factors Affecting Stream Stability
3.2.1 Magnitude and Frequency of Floods
The hydrologic analysis for a stream crossing consists of establishing peakflow-frequency relationships and such flow-duration hydrographs as may be necessary.Flood-frequency relationships are generally defined on the basis of a regional analysis offlood records, a gaging station analysis, or both. Regional analyses have been completedfor all states by the U.S. Geological Survey, and the results are generally applicable towatersheds which are unchanged by man. Flood-frequency relationships at gaged sitescan be established from station records which are of sufficient length to be representativeof the total population of flood events on that particular stream. The Pearson Type IIIdistribution with log transformation of flood data is recommended by the WaterResources Council (1981) for station flood data analysis [13]. Where flood estimates byregional analysis vary from estimates by station analysis, factors such as gaging stationrecord length and the applicability of the regional analysis to that specific site should beconsidered, as well as high water information, flood data, and information of floods atexisting bridges on the stream.
The term "design flood" is purposely avoided in the above discussion because of theimplication that a stream crossing can be designed for a unique flood event. In reality, arange of events should be examined to determine which design condition is mostadvantageous, insofar as costs and risks are concerned. If a design flood is designatedfor purposes of stream stability analysis, it probably should be that event which causesthe greatest stress to the highway stream crossing system, that is, the flood magnitude
Archive
d

and stage which is at incipient overtopping of the highway.
Hydrologic analysis establishes the probability of occurrence of a flood of givenmagnitude in any one year period. It also is the first step in establishing the probability ofoccurrence of the flood event which will pass through bridge waterways in thehighway-stream crossing system without overtopping the highway. The FHWA HEC-19document (Hydrology) [14] should be referred to for more detailed information andguidelines on hydrologic analysis. The second step is the determination of thestage-discharge relationship, flow and velocity distributions, backwater, scour, etc., (i.e.,the hydraulics of the crossing system, as discussed in the remainder of this section).
Archive
d

Figure 12. Hydraulic and location factors that affect stream stability.
3.2.2 Bed Configurations in Sand Bed Streams
In sand bed streams, sand material is easily eroded and is continually being moved andshaped by the flow. The interaction between the flow of the water-sediment mixture andthe sand bed creates different bed configurations which change the resistance to flow,velocity, water surface elevation and sediment transport. Consequently, anunderstanding of the different types of bed forms that may occur and a knowledge of theresistance to flow and sediment transport associated with each bed form can help inanalyzing flow in an alluvial channel. More specific to this discussion, it is necessary tounderstand what bed forms will be present so that the resistance to flow can beestimated and flood stages and water surface profiles can be computed.
Flow Regime. Flow in alluvial channels is divided into two regimes separated by atransition zone [4]. Forms of bed roughness in sand channels are shown in Figure 13a,while Figure 13b shows the relationships between water surface and bed configuration.The flow regimes are:
The lower flow regime, where resistance to flow is large and sedimenttransport is small. The bed form is either ripples or dunes or somecombination of the two. Water-surface undulations are out of phase withthe bed surface, and there is a relatively large separation zonedownstream from the crest of each ripple or dune. The velocity of thedownstream movement of the ripples or dunes depends on their heightand the velocity of the grains moving up their backs.
●
The transition zone, where the bed configuration may range from thattypical of the lower flow regime to that typical of the upper flow regime,depending mainly on antecedent conditions. If the antecedent bedconfiguration is dunes, the depth or slope can be increased to valuesmore consistent with those of the upper flow regime without changingthe bed form; or, conversely, if the antecedent bed is plane, depth andslope can be decreased to values more consistent with those of the
●
Archive
d

lower flow regime without changing the bed form.Resistance to flow and sediment transport also have the samevariability as the bed configuration in the transition. This phenomenoncan be explained by the changes in resistance to flow and,consequently, the changes in depth and slope as the bed formchanges.
●
The upper flow regime, in which resistance to flow is small andsediment transport is large. The usual bed forms are plane bed orantidunes. The water surface is in phase with the bed surface exceptwhen an antidune breaks, and normally the fluid does not separate fromthe boundary.
●
Effects of Bed Forms at Stream Crossings. At high flows, most sand bed streamchannels shift from a dune bed to a transition or a plane bed configuration. Theresistance to flow is then decreased to one-half to one-third of that preceding the shift inbed form. The increase in velocity and corresponding decrease in depth may increasescour around bridge piers, abutments, spur dikes or banks and may increase therequired size of riprap. However, maximum scour depth with a plane bed can be lessthan with dunes because of the absence of dune troughs. On the other hand, thedecrease in stage resulting from planing out of the bed will decrease the requiredelevation of the bridge, the height of embankments across the floodplain, the height ofany dikes, and the height of any channel control works that may be needed. Theconverse is also true.
Another effect of bed form on a highway crossing is that with dunes on the bed, there is afluctuating pattern of scour on the bed and around piers. The average height of dunes isapproximately one third to one half of the average depth of flow, and the maximum heightof a dune may approach the average depth of flow. If the average depth of flow is 10 feet,maximum dune height may be on the order of 10 feet, half of which would be below themean elevation of the bed. With the passage of a dune through a bridge opening, anincrease in local scour would be anticipated when the trough of the dune arrives at thebridge. It has been determined experimentally that local scour increases by 30 percent ormore over equilibrium scour depth with the passage of a dune trough.
Archive
d

Figure 13(a). Forms of bed roughness in sand channels (After [4]).
Figure 13(b). Relation between water surface and bed configuration (After [4]).
A very important effect of bed forms and bars is the change of flow direction in channels.
Archive
d

At low flow, the bars can be residual and cause high velocity flow along or at a pier orother structures in the streambed, causing deeper than anticipated scour.
Care must be used in analyzing crossings of sand bed streams in order to anticipatechanges that may occur in bed forms and the impact of these changes on the resistanceto flow, sediment transport, and the stability of the reach and highway structures. Asdescribed in Section 3.2.3, with a dune bed, the Manning n could be as large as 0.040.Whereas, with a plane bed, the n value could be as low as 0.012. A change from a dunebed to a plane bed, or the reverse, can have an appreciable effect on depth and velocity.In the design of a bridge or a stream stability or scour countermeasure, it is goodengineering practice to assume a dune bed (large n value) when establishing the watersurface elevations, and a plane bed (low n value) for calculations involving velocity.
3.2.3 Resistance to Flow
Use of the Manning's equation to compute flow in open channels and floodplainsassumes one-dimensional flow. Procedures for summing the results of computations forsubsections to obtain results for the total cross section involve use of the followingassumptions: (1) mean velocity in each subsection is the same, (2) the total forceresisting flow is equal to the sum of forces in the subsections, and (3) total flow in thecross section is equal to the sum of the flows in the subsections. This implies that theslope of the energy grade line is the same for each subsection. Assumption (3) is thebasis for computing total conveyance for a cross section by adding conveyances ofsubsections.
Resistance to Flow in Channels. The general approach for estimating the resistance toflow in a stream channel is to select a base n value for materials in the channelboundaries assuming a straight, uniform channel, and then to make corrections to thebase value to account for channel irregularities, sinuosity, and other factors which affectthe resistance to flow [4,15]. Equation 5 is used to compute the equivalent materialroughness coefficient "n" for a channel:
where: nb = Base value for straight, uniform channel,n1 = Value for surface irregularities in the cross section,n2 = Value for variations in shape and size of the channel,n3 = Value for obstructions,n4 = Value for vegetation and flow conditions, andm = Correction factor for sinuosity of the channel
Table 2 provides base n values for stable channels and sand channels, while Table 3provides adjustment factors for use in Equation 5. Reference [4,16] provides moredetailed descriptions of conditions that affect the selection of appropriate values.
Table 2. Base values of Manning's n(nb).
Archive
d

Channel or floodplaintype
Sand channels (Only forupper regime flow wheregrain roughness ispredominant.)
Median size, bed material Base n value
Millimeters
(mm)
Inches
(in)Benson andDalrymple Chow
0.2 C 0.012 C
0.3 C 0.017 C
0.4 C 0.020 C
0.5 C 0.022 C
0.6 C 0.023 C
0.8 C 0.025 C
1.0 C 0.026 C
Stable channels and floodplains
Concrete C C 0.012n0.018 0.011
Rock cut C C C 0.025
Firm soil C C 0.025n0.032 0.020
Coarse sand 1n2 C 0.026n0.035 C
Fine gravel C C C 0.024
Gravel 2n64 0.08n2.5 0.028n0.035 C
Coarse gravel C C C 0.026
Cobble 64n256 2.5n10.1 0.030n0.050 C
Boulder < 256 < 10.1 0.040n0.070 C
Resistance to Flow in Sand Bed Channels. The value of n varies greatly in sand bedchannels because of the varying bed forms that occur with lower and upper flow regimes.Figure 14 shows the relative resistance to flow in channels in lower regime, transition,and upper regime flow and the bed forms which exit in each for regime.
Table 3. Adjustment factors for the determination of n values for channels.
Conditions n Value Remarks
Archive
d

n1 Smooth 0 Smoothest channel
Minor 0.001n0.005 Slightly eroded side slopes
Moderate 0.006n0.010 Moderately rough bed and banks
Severe 0.011n0.020 Badly sloughed and scalloped banks
n2 Gradual 0 Gradual changes
Alternating Occasionally 0.001n0.005 Occasional shifts from large to small sections
Alternating Frequently 0.010n0.015 Frequent changes in cross-sectional shape
n3 Negligible 0n0.004 Obstructions < 5% of cross-section area
Minor 0.005n0.015 Obstruction < 15% of cross-section area
Appreciable 0.020n0.030 Obstruction 15n50% of cross-section area
Severe 0.040n0.060 Obstruction > 50% of cross-section area
n4 Small 0.002n0.010 Flow depth > 2 x vegetation height
Medium 0.010n0.025 Flow depth > vegetation height
Large 0.025n0.050 Flow depth < vegetation height
Very Large 0.050n0.100 Flow depth < 0.5 vegetation height
m Minor 1.00 Sinuosity < 1.2
Applicable 1.15 1.2 Sinuosity < 1.5
Severe 1.30 Sinuosity > 1.5Archive
d

Figure 14. Relative resistance to flow in sand bed channels (After [16]).
Sand bed channels with bed materials having a median diameter from 0.14 mm to 0.4mm usually plane out during high flows. Manning's n-values change from as large as0.040 at low flows to as small as 0.012 at high flow. Table 4 provides typical ranges ofn-values for sand bed channels.
Table 4. Manning's roughness coefficients for alluvial sand bed channels (no vegetation1).
Subcritical Flow, FR < 1
Plane bed 0.014n0.020
Ripples 0.018n0.030
Dunes 0.020n0.040
Washed out dunes or transition 0.014n0.025
Plane bed 0.010n0.013
Supercritical flow, FR > 1 0.010n0.015
Standing waves 0.012n0.020
Antidunes 0.012n0.0201Data are limited to sand channels with D50 < 1.0 mm.
Resistance to Flow in Coarse Material Channels. A coarse-material channel may rangefrom a gravel bed channel up to the cobble/boulder channels typical of mountainousregions. The latter type channels may have bed material that is only partly submergedmaking it difficult to determine the channel roughness. However, for gravel and smallcobble/boulder bed channels analysis of data from many rivers, canals and flumes showsthat channel roughness can be predicted by the equation [17]:
(6)
Archive
d

where: D50 is measured in inches.
Alternately, Limerinos developed Equation 7 from samples on streams having bedmaterials ranging in size from small gravel to medium size boulders [18].
where: R = Hydraulic radiusD84 = 84th percentile size of bed material
All dimensions are in feet. Flow depth, Yo, may be substituted for the hydraulic radius, R,in wide channels (W/Yo > 10). Note that Equation 7 also applies to sand bed channels inupper regime flow [16].
The alternative to use of Equation 6 or Equation 7 for gravel bed streams is to select avalue of n from Table 2. Because of the range of values in the table, it would beadvisable to verify the selected value by use of one of the above equations if flow depthor velocities will significantly affect a design. Reference [4] also gives equations for thiscase.
Resistance to Flow on Floodplains. Arcement and Schneider modified Equation 5 forchannels to make it applicable for the estimation of n-values for floodplains [16]. Thecorrection factor for sinuosity, m, becomes 1.0 for floodplains, and the value for variationsin size and shape, n2, is assumed equal to zero. Equation 5, adapted for use onfloodplains, becomes:
where: nb = Base value of n for a bare soil surfacen1 = Value to correct for surface irregularitiesn3 = Value for obstructionsn4 = Value for vegetation
Selection of the base value for floodplains is the same as for channels. Reference [16] isrecommended for a detailed discussion of factors which affect flow resistance infloodplains.
3.2.4 Water Surface Profiles
The water surface profile in a stream or river is a combination of gradually varied flowover long distances, and rapidly varied flow over short distances. Due to variousobstructions in the flow, such as bridges, the actual flow depth over longer reaches iseither larger or smaller than the normal depth defined by Manning's uniform flowequation. In the immediate vicinity of the obstruction, the flow can be rapidly varied.
Archive
d

Gradually Varied Flow. In gradually varied flow, changes in depth and velocity take placeslowly over a large distance, resistance to flow dominates and acceleration forces areneglected. The calculation of a gradually varied flow profile is well defined by analyticalprocedures (e.g., see [4]), which can be implemented manually or more commonly bycomputer programs such as the FHWA WSPRO program, or the Corps of EngineersHEC-2 program. A qualitative analysis of the general characteristics of the backwatercurve is often useful prior to quantitative evaluation. Such an analysis requires locatingcontrol points, determining the type of profile upstream and downstream of the controlpoints, and then sketching the backwater curves. For example, Figure 12 illustratesseveral typical profiles that would result from a control represented by a change in bedslope. Reference [4] provides a detailed discussion of water surface profiles for graduallyvaried flow.
Rapidly Varied Flow. In rapidly varied flow, changes in depth and velocity take place overshort distances, acceleration forces dominate and resistance to flow may be neglected.The calculation of certain types of rapidly varied flow are well defined by analyticalprocedures, such as the analysis of hydraulic jumps, but analysis of other types of rapidlyvaried flow, such as flow through bridge openings (see Figure 15) are a combination ofanalytical and empirical relationships. The FHWA document Hydraulics of BridgeWaterways ([19]), provides a procedure for manual calculation of the backwater createdby certain types of flow conditions at bridge openings. Gradually varied flow computerprograms, such as WSPRO and HEC-2 include analysis of bridge backwater, but do notcalculate undular jump conditions or the flow through the bridge when flow accelerationsare large, that is, large change in velocity either in magnitude or direction.
Superelevation of Water Surface at Bends. Because of the change in flow direction whichresults in centrifugal forces, there is a superelevation of the water surface in bends. Thewater surface is higher at the concave bank than at the convex bank (Figure 16). Theresulting transverse slope can be evaluated quantitatively. By assuming velocity equal toaverage velocity, the following equation was derived for superelevation for subcritical flow[20]:
where:g = Acceleration of gravity, ft/s2;ro = Radius of the outside bank at the bend, ft;ri = Radius of the inside bank, ft;rc = Radius of the center of the stream, ft;∆Z = Difference in water surface elevation between the concaveand convex banks, ft; andV = Average velocity, ft/s
Other equations for superelevation are given in [4].
Archive
d

Figure 15. Types of water surface profiles through bridge openings (After [19]).Archive
d

Figure 16. Superelevation of water surface in a bend.
3.3 Geometry and Location of Highway Stream Crossings
3.3.1 Problems at Bends
The highway stream crossing location is important because of the inherent instability ofstreams at some locations (See for example Chapter 2.0) and because the crossingsystem can contribute to instability. In general, a crossing on a straight reach is preferredbecause stability problems are usually minor. Low flow and high flow paths (thalwegs)are generally similar for a straight reach, reducing the risk of problems related toalignment and orientation of bridge piers and superstructures (see Figure 12).
For a relatively stable meandering stream, a bridge crossing at the inflection pointbetween bends generally reduces the risk of instability problems. Here, the low-flow andhigh-flow paths are comparable (as shown in Figure 12) and the crossing is in a zonewhere deposition and erosion are usually moderate. However, countermeasures againstmeander migration may still be required.
More hydraulic problems occur at alluvial stream crossings at or near bends than at allother locations because bends are naturally unstable. In addition, ice and floating debristend to be greater problems in bends than in straight reaches. Other problems at bendsinclude the shifting thalweg which can result in unanticipated scour at piers because ofchanges in flow direction and velocities, and nonuniform velocity distribution whichcauses scour of the bed and bank at the outside of the bend and deposition in the insideof the bend (see Figure 12). The high velocities at the outside of the bend or downstreamof the bend can substantially contribute to local scour on abutments and piers.
3.3.2 Problems at Confluences
Hydraulic problems may also be experienced at crossings near stream confluences.Crossings of tributary streams are affected by the stage of the main stream (See Chapter2). Aggradation of the channel of the tributary may occur if the stage of the main stream
Archive
d

is high during a flood on the tributary, and scour in the tributary may occur if the stage inthe main stream is low. Similarly, problems at a crossing of the larger stream can resultfrom varying flow distribution and flow direction at various stages in the stream and itstributary, and from sediment deposited in the stream by the tributary (see Figure 12).Tributaries entering the main channel upstream of a main channel bridge can also causevarying flow distribution and direction at various stages (flows) in the main channel andthe tributary.
3.3.3 Backwater Effects of Alignment and Location
As flow passes through a channel constriction, most of the energy losses occur asexpansion losses downstream of the contraction. This loss of energy is reflected by a risein the water surface and the energy line upstream from the constriction. Upstream ofbridges, the rise in water level above the normal water surface (that which would existwithout the bridge) is referred to as the bridge backwater (see Figure 15). However, manybridges do not cause backwater even at high flows even though they constrict the flows[4]. Hydraulic engineers are concerned with backwater with respect to flooding upstreamof the bridge; backwater elevation with respect to the highway profile; and the effects onsediment deposition upstream, scour around embankments, contraction scour due to theconstriction, and local scour at piers.
The effects of highway-stream crossing alignments on backwater conditions shown inFigure 17 are based on:
Backwater resulting from a long skewed or curved roadwayembankment (Figure 17a) may be quite large for wide floodplains. Ineffect, the bridge opening is located up-valley from one end of theembankment and the water level at the downstream extreme of theapproach roadway, as at point A in Figure 17a, can be significantlyhigher than at the bridge.
●
Backwater in an incised stream channel without substantial overbankflow (Figure 17b) is seldom large, but contraction and local scour maybe severe. Backwater results from encroachment in the channel byapproach embankments and from piers located in the channel.
●
Backwater resulting from a normal crossing of the valley where roadapproach fills block overbank flow (Figure 17c) may be significantlygreater than in an incised channel. General and local scour may besevere if a significant quantity of flow is diverted from the floodplain tothe bridge waterway.
● Archive
d

Figure 17. Backwater effect associated with threetypes of stream crossings: (a) a skewed alignment
across a floodplain, (b) constriction of channelflow, and (c) constriction of overbank flow
(After [21]).
3.3.4 Effects of Highway Profile
A highway stream crossing is a system consisting of the stream and its floodplain, thebridge(s), provided to pass floods, and the approach roadways on the floodplain. Allfloods which occur during the life of the crossing system will pass either through thebridge waterways provided or through the waterways and over the highway. The highway
Archive
d
profile and alignment control the quantity of flow which must pass through waterwayopenings. Flood frequency should be considered in the design of bridge components andmay influence highway profile and alignment. Consideration of the flood magnitude andfrequency which must pass through bridge openings does not preclude acceptance oracknowledgement of possible damage during an extreme event.
The stage-discharge relationship for the stream and backwater associated with acrossing design are the hydraulic considerations for establishing the highway profile.Profile alternatives are dependent on site topography and other site constraints, such asland use, traffic requirements, and flood damage potential. Figures 18a, b, and c illustrateprofile alternatives, namely, a sag vertical curve, a crest vertical curve on the bridge or arolling profile, and a level profile. A distinctive aspect of the sag vertical curve, asdepicted in Figure 18a, is the certainty that the bridge structure will be submerged beforeoverflow of the roadway will occur. Therefore, the magnitude and probability ofoccurrence of such a flood event should be considered in the design of the waterwayopening and bridge components. A variation of the sag vertical curve where the low pointof the curve is located on a floodplain rather than on the bridge affords relief to the bridgewaterway. Bridges on level profiles and sag vertical curves are susceptible to debrisaccumulation on the superstructure, impact forces, buoyant forces, and accentuatedcontraction and local scour.
The crest vertical profile illustrated in Figure 18b provides protection to the bridge in thatflood events exceeding the stage of the low point in the sag vertical curve will, in part,flow over the roadway. This relieves the bridge and the bridge waterway of stresses towhich bridges on sag vertical curves and level profiles are subjected.
When this superstructure is submerged (pressure flow through the bridge), pier scour isincreased. In some cases the local scour with pressure flow will be two times deeper thanfor free flow.
Archive
d
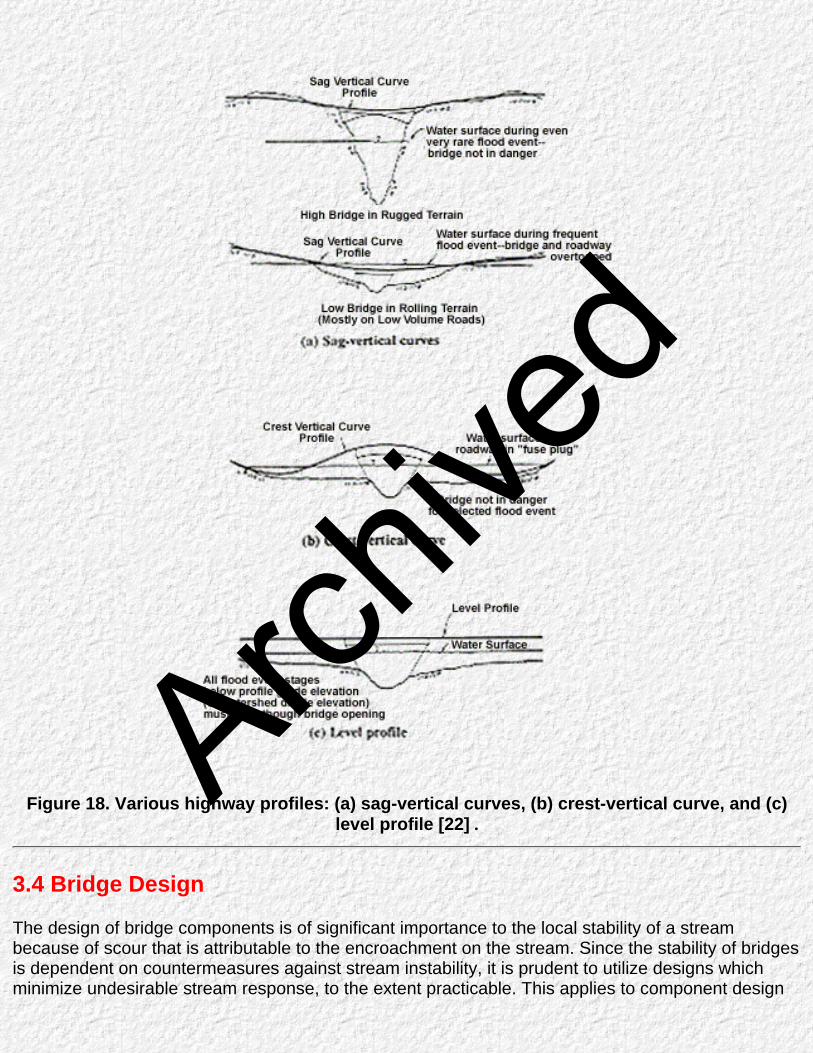
Figure 18. Various highway profiles: (a) sag-vertical curves, (b) crest-vertical curve, and (c)level profile [22] .
3.4 Bridge Design
The design of bridge components is of significant importance to the local stability of a streambecause of scour that is attributable to the encroachment on the stream. Since the stability of bridgesis dependent on countermeasures against stream instability, it is prudent to utilize designs whichminimize undesirable stream response, to the extent practicable. This applies to component design
Archive
d
as well as to the design of the total crossing system. The term countermeasure, as used here, is notnecessarily an appurtenance to the highway stream crossing, but may be an integral part of thehighway or bridge.
For example, the location and size of waterway openings influence stream stability. Encroachment inthe stream channel at abutments and by piers reduces the channel section and may causesignificant contraction scour. Severe constriction of floodplain flow may cause bank failures andexaggerated contraction scour in the bridge waterway. Auxiliary (relief) openings should be carefullydesigned to avoid excessive diversion of floodplain flow to main channel bridge openings on widefloodplains and at skewed crossings of floodplains.
3.4.1 Scour at Bridges
Scour at bridges consists of three components: (1) long-term aggradation or degradationof the stream channel (natural or man-induced), (2) contraction scour due to constrictionor the location of the bridge, and (3) local scour. In general, the three components areadditive.
Scour can be related to the following factors: (1) channel slope and alignment; (2)channel shifting; (3) bed sediment size distribution; (4) antecedent floods and surgingphenomena; (5) accumulation of debris, logs, or ice; (6) flow contraction, flow alignment,and flow depth; (7) pier geometry and location; (8) type of foundation; (9) natural orman-induced modification of the stream; and (10) failure of a nearby structure.
The rate of scour depends on the erosive forces exerted on the channel boundary andthe resistance of the material to erosion. Resistance to erosion in fine cohesive materialresults from chemical bonding. Cohesionless materials do not exhibit such propertiesand resistance to erosion depends primarily on bed sediment size distribution anddensity.
Under steady flow conditions, scour situations gradually reach an equilibrium condition. Bridge crossings are generally subjected to unsteady flow conditions, and a series ofevents are often required to reach equilibrium or maximum scour depth. During a typicalflood hydrograph, experiments indicated that scour tends to lag behind discharge andmaximum scour depth occurs after the flood peak. Deposition often occurs during therecession of the hydrograph, and the maximum scour depth measured after the flood isgenerally less than the maximum depth of scour reached during the flood event. Whereerodible bed material is stratified, more resistant layers can cover more easily erodedmaterial and special protective measures may be taken to prevent scour of the resistantlayer. While armoring of the bed by the coarser material size fraction can temporarilyreduce the rate of degradation and stabilize the stream system, armoring cannot becounted on as a long-term solution. Flows exceeding a given design event could disruptthe armor layer, resulting in degradation (see Section 4.6.6).
Gravel mining in the streambed can cause severe stream instability. Therefore, it isessential to monitor sand and gravel mining so that countermeasures can be installed tostabilize the stream in the vicinity of a highway facility, and, where possible, miningshould be managed so that instabilities in the stream system will be minimized. In mostcases, removal of sand and gravel has caused deepening and widening of the channel.
Archive
d

These wider, deeper reaches act as sinks for the sediment loads and may trap the finerclays, altering the environment. (See additional discussion in Section 2.4.3).
Methods and equations for determining scour at piers and abutments are given in HECNo. 18CEvaluating Scour at Bridges [23], [4], and [24].
3.4.2 Abutments
Bridge abutments are classified as spillthrough or verticals. Both types of abutment aresusceptible to damage by scour dependant of flow distribution, foundation materials,velocities and other factors. However, scour at spillthrough abutments is about 50percent smaller than at vertical wall abutments subjected to the same scouring actions.
In addition to the effects of abutment shape, scour at abutments is affected by the skewof approach flow at the abutment, soils materials subjected to the scouring action,encroachment on the floodplain and in the channel, and the amount of overbank flowdiverted to the bridge waterway by approach fills to the bridge. Equations and methodsfor computing abutment scour and coutermeasures for scour are provided in [23] and [4].
3.4.3 Piers
The number of piers in any stream channel should be limited to a practical minimum andpiers should not be located in the channel of small streams, if it is possible to avoid suchlocation. Piers properly oriented with the flow do not contribute significantly to bridgebackwater, but they can contribute to contraction scour. In some locations, severe scourhas developed immediately downstream of bridges because of eddy currents andbecause piers occupy a significant area in the channel. Lateral instability as well asvertical scour may occur.
Piers should be aligned with flow direction at flood stage in order to minimize theopportunity for drift to be caught, to reduce the contraction effect of piers in the waterway,to minimize ice forces and the possibility of ice dams forming at the bridge, and tominimize backwater and local scour. Pier orientation is difficult where flow directionchanges with stage or time. Cylindrical piers or some variation thereof, are probably thebest alternative if orientation at other than flood stage is critical. Raudkivi reported that arow of cylindrical columns will produce shallower scour than a solid pier when the angleof attack is greater than 5 to 10 degrees [25]. He also found that cylindrical piers with fivediameter spacing is produced about 1.2 times the local scour depth at a single column ofequal diameter. Pier shape is also a factor in local scour. A solid pier will not collect asmuch debris as a pile bent or a multiple-column bent. Rounding or streamlining theleading edges of piers helps to decrease the accumulation of debris and reduces localscour at the pier and contraction scour occasioned by the increased constriction.. Recentstudies [26] have provided additional data on the effects of footings and the behavior orpile groups.
Piers located on a bank or in the stream channel near the bank are likely to cause lateralerosion of the bank. Piers located near the streambank in the floodplain are vulnerablebecause they can cause bank scour. They are also vulnerable to failure fromundermining by meander migration and bank caving. Piers which must be placed in
Archive
d

locations where they will be especially vulnerable to scour damage should be founded atelevations safe from undermining or otherwise protected.
3.4.4 Bridge Foundations
The foundation is the bridge component which is most vulnerable to attack by floods. Examination of boring logs and plots of the profiles of various subsurface materials isimportant to the prediction of potential scour depths as well as to estimation of thebearing capacity of the materials. Refer to [23,24] for a complete discussion of scourmechanics.
The types of foundations used for bridges include spread footings, footings on piles ordrilled shafts, drilled shafts, and caissons. Spread footings are used where sound rock isrelatively shallow. Failures have occurred where spread footings were set in erodiblerock and where armoring in the streambed was inadequate to prevent scour.
Piling usually are dependent on the surrounding material for skin friction and lateralstability. In some locations, they can be carried to bedrock or other dense materials forbearing capacity. Tip elevation for piling should be based on estimates of potential scourdepths as well as bearing in order to avoid losing lateral support and load carryingcapacity after scour. Pile bearing capacity derived from driving records has little validity ifthe material through which the piles were driven is scoured away during a flood.
Caissons are used in large rivers and are usually sunk to dense material by excavationinside the caisson. Founding depths are such that scour is not usually a problem afterconstruction is completed. Severe contraction scour has developed at some bridges,however, because of contraction of flow from the large piers.
Attention should be given to potential scour and the possibility of channel shifts indesigning foundations on floodplains. Also, the thalweg in channels should not beconsidered to be in a fixed location. Consideration should be given, therefore, toduplicating the foundation elevations of the main channel piers on adjacent floodplainpiers. The history of stream channel activity can be very useful in establishing foundationelevations (see Chapter 2.0).
3.4.5 Superstructures
Hydraulic forces that should be considered in the design of a bridge superstructureinclude buoyancy, drag, and impact from ice and floating debris. The configuration of thesuperstructure should be influenced by the highway profile, the probability ofsubmergence, expected problems with ice and debris, and flow velocities, as well as theusual economic, structural and geometric considerations. Superstructures should bemade a structurally integral part of the piers and abutments to provide structuralredundancy, that is, alternate load paths in case of failure of one bridge element.
Buoyancy. The weight of a submerged or partially submerged bridge superstructure isthe weight of the superstructure less the weight of the volume of water displaced. Thevolume of water displaced may be much greater than the volume of the superstructurecomponents if air is trapped between girders. Also, solid parapet rails and curbs on the
Archive
d

bridge deck can increase the volume of water displaced and increase buoyant forces.The volume of air trapped under the superstructure can be reduced by providing holes(vents) through the deck between structural members. Superstructures should beanchored to piers to counter buoyant forces and to resist drag forces. Continuous spandesigns are also less susceptible to failure from buoyancy than simple span designs.
Drag Forces. Drag forces on a submerged or partially submerged superstructure can becalculated by Equation 10:
where: Fd = Drag force per unit of length, lbs/ftCd = Coefficient of dragD = Density of water, slugs/ft3H = Depth of submergence, ftV = Velocity of flow, ft/sec
The coefficient of drag can be taken as 2.0 to 2.2 based on usual Reynolds numbers innatural streams and the usual shape of bridge superstructures. The density of freshwater is usually taken as 1.94 slugs/ft3.
Floating Debris and Ice. Where bridges are destroyed by debris and ice, it usually is dueto accumulations against bridge components. Waterways may be partially or totallyblocked, creating hydraulic conditions that cause or increase scour at pier foundationsand bridge abutments, structural damage from impact and uplift, and overtopping ofroadways and bridges. Floating debris is a hydraulic problem at highway streamcrossings nation-wide, but the greatest problems are in the Pacaific Northwest and in theupper and lower Mississippi River Valley. Many debris problems exist in forested areaswith active logging operations. Debris hazards occur more frequently in unstable streamswhere bank erosion is active and in streams with mild to moderate slopes, as contrastedwith headwater streams. Debris hazards are often associated with large floods, and mostdebris is derived locally along the streambanks upstream from the bridge. After beingmobilized, debris typically moves as individual logs which tend to concentrate in thethalweg of the stream. It is usually possible to evaluate the abundance of debrisupstream of a bridge crossing and then to implement mitigation measures, such asremoval and or containment, to minimize potential problems during a major flood.
Ice Forces. Superstructures may be subjected to impact forces from floating ice, staticpressure from thermal movements or ice jams, or uplift from adhering ice in water offluctuating levels. The latter is usually associated with relatively large bodies of water andsuperstructures in these locations should normally be high enough to be unaffected.Research is needed to define the static and dynamic loads that can be expected from iceunder various conditions of ice strength and stream flow.
In addition to forces imposed on bridge superstructures by ice loads, ice jams at bridgescan cause exaggerated backwater and a sluicing action under the ice. There arenumerous examples of foundation failures from this orifice flow under ice as well as
Archive
d

superstructure damage and failure from ice forces. Accumulations of ice or drift maysubstantially increase local pier and abutment scour especially if they are allowed toextend down to near the channel bed.
Ice also has serious effects on bank stability. For example, ice may form in bankstabilization materials, and large quantities of rock and other material embedded in theice may be floated downstream and dumped randomly when the ice breaks up. Ice jamsalso threaten the stability of bridges because of the gradual increase in stage followed bythe sudden release of a surge of water and ice blocks after the breakup. Banks aresubjected to piping forces during the drawdown of water surface elevation after thebreakup.
Debris Forces. Information regarding methods for computing forces imposed on bridgesuperstructures by floating debris is also lacking despite the fact that debris causes orcontributes to many failures. Floating debris may consist of logs, trees, house trailers,automobiles, storage tanks, lumber, houses, and many other items representative offloodplain usage. This complicates the task of computing impact forces since the massand the resistance to crushing of the debris contribute to the impact force.
The equation for computing impact forces is:
where: F = Impact imparted by the debris, lbs/ftM = Mass of the debris, lb-sec2/ftS = Stopping distance, ftV = Velocity of the floating debris prior to impact, ft/sec
In addition to impact forces, a buildup of debris increases the effective depth of thesuperstructure and the drag coefficient may also be increased. Perhaps the mosthazardous result of debris buildup is partial or total clogging of the waterway. This canresult in a sluicing action of flow under the debris which can result in scour andfoundation failure or a shift in the channel location from under the bridge.
Go to Chapter 4 Archive
d

4.0 Analysis Procedure
Go to Chapter 5
4.1 Problem Statement
A stable channel does not change in size, form, or position with time; however, all alluvial channels changeto some extent and are somewhat unstable. For highway engineering purposes, a stream channel can beconsidered unstable if the rate or magnitude of change is great enough that the planning, location, design,or maintenance considerations for a highway encroachment are significantly affected. The kinds ofchanges that are of concern are: (1) lateral bank erosion, including the erosion that occurs from meandermigration; (2) aggradation or degradation of the streambed that progresses with time; and (3) short-termfluctuations in streambed elevation that are usually associated with the passage of a flood (scour and fill).These changes are associated with instability in a stream system or in an extensive reach of stream.
Local instability caused by the construction of a highway crossing or encroachment on a stream is also ofconcern. This includes general scour caused by contraction of the flow, and local scour due to thedisturbance of streamlines at an object in the flow, such as at a pier or an abutment. The purpose of thisSection is to outline the analysis procedures that may be utilized to evaluate stream instability.
4.2 General Solution Procedure
The analysis of any complex problem should begin with an overview or general evaluation, including aqualitative assessment of the problem and its solution. This fundamental initial step should be directedtowards providing insight and understanding of significant physical processes, without being too concernedwith the specifics of any given component of the problem. The understanding generated from suchanalyses assures that subsequent detailed analyses are properly designed.
The progression to more detailed analyses should begin with application of basic principles, followed asrequired, with more complex solution techniques. This solution approach, beginning with qualitativeanalysis, proceeding through basic quantitative principles and then utilizing, as required, more complex orstate-of-the-art solution procedures assures that accurate and reasonable results are obtained whileminimizing the expenditure of time and effort.
The inherent complexities of a stream stability analysis, further complicated by highway stream crossings,require such a solution procedure. The evaluation and design of a highway stream crossing orencroachment should begin with a qualitative assessment of stream stability. This involves application ofgeomorphic concepts to identify potential problems and alternative solutions. This analysis should befollowed with quantitative analysis using basic hydrologic, hydraulic and sediment transport engineeringconcepts. Such analyses could include evaluation of flood history, channel hydraulic conditions (up to andincluding, for example, water surface profile analysis) and basic sediment transport analyses such asevaluation of watershed sediment yield, incipient motion analysis and scour calculations. This analysis canbe considered adequate for many locations if the problems are resolved and the relationships betweendifferent factors affecting stability are adequately explained. If not, a more complex quantitative analysisbased on detailed mathematical modeling and/or physical hydraulic models should be considered.
In summary, the general solution procedure for analyzing stream stability could involve the following threelevels of analysis:
Archive
d

Level 1: Application of Simple Geomorphic Concepts and other Qualitative AnalysesLevel 2: Application of Basic Hydrologic, Hydraulic and Sediment Transport EngineeringConceptsLevel 3: Application of Mathematical or Physical Modeling Studies
4.3 Data Needs
The types and detail of data required to analyze a highway crossing or encroachment on a stream arehighly dependent on the relative instability of the stream and the depth of study required to obtainadequate resolution of potential problems. More detailed data are needed where quantitative analyses arenecessary, and data from an extensive reach of stream may be required to resolve problems in complexand high risk situations.
4.3.1 Level 1: Geomorphic and Other Qualitative Analyses
The data required for preliminary stability analyses include maps, aerial photographs, notesand photographs from field inspections, historic channel profile data, information on man'sactivities, and changes in stream hydrology and hydraulics over time.
The National Bridge Inspection Standards (NBIS) Program involves inspections on a 2-yearcycle of the 577,000 bridges on the National Bridge Inventory. The FHWA December 1988publication "The Recording and Coding Guide for the Structure Inventory and Appraisal of theNation's Bridges" specifies the bridge and channel hydraulics and scour data that areevaluated and reported within the NBIS. Item 61, Channel and Channel Protection, Item 71,Waterway Adequacy, and Item 113, Scour Critical Bridges, are included. Typically, a crosssection of the bridge waterway at the time of each inspection will provide a chronologicalpicture of the bridge waterway.
Area maps, vicinity maps, site maps, geologic maps, soils maps, and land use maps eachprovide essential information. Unstable stream systems upstream or downstream of theencroachment site can cause instability at the site. Area maps are needed to locate unstablereaches of streams relative to the site. Vicinity maps help to identify more localized problems.They should include a sufficient reach of stream to permit identification of stream classification,and to locate bars, braids, and channel controls. Site maps are needed to determine factorsthat influence local stability and flow alignment, such as bars and tributaries. Geologic mapsprovide information on deposits and rock formations and outcrops that control stream stability.Soils and land use maps provide information on soil types, vegetative cover, and land usewhich affect the character and availability of sediment supply.
Aerial photographs record much more ground detail than maps and are frequently available at5-year intervals. This permits measurement of the rate of progress of bend migration and otherstream changes that cannot be measured from maps made less frequently. A highwayauthority should periodically obtain aerial photographs of actively unstable streams thatthreaten highway facilities, including immediately after major floods. However, aerialphotographs taken after the passage of an ice jam or immediately after a major flood must beinterpreted with care and may provide misleading information regarding the rate of change.
Notes and photographs from field inspections are important to gaining an understanding ofstream stability problems, particularly local stability. Field inspections should be made duringhigh flow and low flow periods to record the location of bank cutting or slumping and depositionin the channel. Flow directions should be sketched, signs of aggradation or degradation noted,
Archive
d

properties of bed and bank materials estimated or measured, and the locations andimplications of impacting activities recorded.
If historic stream profile data is available, it will provide information on channel stability. Stagetrends at stream gaging stations and comparisons of streambed elevations with elevationsbefore construction at structures will provide information on changes in stream profile. As-builtbridge data and cross sections are frequently useful. Structure-induced scour should be takeninto consideration where such comparisons are made.
Man's activities in a watershed are frequently the cause of stream instability. Information onurbanization, land clearing, snagging in stream channels, channelization, bend cutoffs,streambed mining, dam construction, reservoir operations, navigation projects, and otheractivities, either existing or planned, are necessary to evaluate the impact on stream stability.
Data on changes in morphology is important because change in a stream is rarely at aconstant rate. Stream instability can often be associated with an event, such as an extremeflood or a particular activity in the watershed or stream channel. If association is possible, therate of change can be more accurately assessed.
Similarly, information on changes in hydrology or hydraulics can sometimes be associated withactivities that caused the change. Where changes in stream hydraulics are associated with anactivity, changes in stream morphology are also likely to have occurred.
4.3.2 Level 2: Basic Engineering Analyses
Data requirements for basic hydrologic, hydraulic and sediment transport engineering analysisare dependent on the types of analysis that must be completed. Hydrologic data needs includedominant discharge (or bank full flow), flow duration curves, and flow frequency curves.Discussion of hydrologic methods is beyond the scope of this manual; however, informationcan be obtained from [14] and State Highway Agency manuals. Hydraulic data needs includecross sections, channel and bank roughness estimates, channel alignment, and other data forcomputing channel hydraulics, up to and including water surface profiles calculations. Analysisof basic sediment transport conditions requires information on land use, soils, and geologicconditions, sediment sizes in the watershed and channel, and available measured sedimenttransport rates (e.g., from U.S. Geological Survey gaging stations).
More detailed quantitative analyses require data on the properties of bed and bank materialsand, at times, field data on bed load and suspended load transport rates. Properties of bed andbank materials that are important to a study of sediment transport include size, shape, fallvelocity, cohesion, density, and angle of repose.
4.3.3 Level 3: Mathematical and Physical Model Studies
Application of mathematical and physical model studies requires the same basic data as aLevel 2 analysis, but typically in much greater detail. For example, water and sediment routingby mathematical models (e.g., BRI-STARS or HEC-6), and construction of a physical model,would both require detailed channel cross section data. The more extensive data requirementsfor either mathematical or physical model studies, combined with the additional level of effortneeded to complete such studies, results in a relatively large scope of work.
Archive
d

4.4 Data Sources
Preliminary stability data may be available from government agencies such as the U.S. Army Corps ofEngineers, Soil Conservation Service, local river basin commissions, and local watershed districts. Theseagencies may have information on historic streambed profiles, stage-discharge relationships, andsediment load characteristics. They may also have information on past and planned activities that affectstream stability. Table 5 provides a list of sources for the various data needed to assess stream stability ata site.
4.5 Level 1: Qualitative and Other Geomorphic Analyses
A flow chart of the typical steps in qualitative and other geomorphic analyses is provided in Figure 19. Thesix identified steps are generally applicable to most stream stability problems. These steps are discussedin more detail in the following paragraphs. As shown on Figure 19, the qualitative evaluation leads to aconclusion regarding the need for more detailed (Level 2) analysis or a decision to proceed directly toselection and design of countermeasures based only on the qualitative and other geomorphic analyses.Selection and design of countermeasures are discussed in Chapter 5.0 and 6.0, respectively.
Table 5. List of data sources (After [24]).
Topographic Maps:
(1) Quadrangle mapsCU.S. Department of the Interior, Geological Survey, Topographic Division; and U.S.Department of the Army, Army Map Service.
(2) River plans and profilesCU.S. Department of the Interior, Geological Survey, Conservation Division.
(3) National parks and monumentsCU.S. Department of the Interior, National Park Service.
(4) Federal reclamation project mapsCU.S. Department of the Interior, Bureau of Reclamation.
(5) Local areasCcommercial aerial mapping firms.
(6) American Society of Photogrammetry.
Planimetric Maps: Archive
d

(1) Plats of public land surveysCU.S. Department of the Interior, Bureau of Land Management
(2) National forest mapsCU.S. Department of Agriculture, Forest Service.
(3) County mapsCState Highway Agency.
(4) City platsCcity or county recorder.
(5) Federal reclamation project mapsCU.S. Department of the Interior, Bureau of Reclamation.
(6) American Society of Photogrammetry.
(7) ASCE JournalCSurveying and Mapping Division.
Aerial Photographs:
(1) The following agencies have aerial photographs of portions of the United States: U.S. Department ofthe Interior, Geological Survey, Topographic Division; U.S. Department of Agriculture, CommodityStabilization Service, Soil Conservation Service and Forest Service; U.S. Air Force; various state agencies;commercial aerial survey; National Oceanic and Atmospheric Administration; and mapping firms.
(2) American Society of Photogrammetry.
(3) Photogrammetric Engineering.
(4) Earth Resources Observation System (EROS)CPhotographs from Gemini, Apollo, Earth ResourcesTechnology Satellite (ERTS) and Skylab.
Transportation Maps:
(1) State Highway Agency.
Triangulation and Benchmarks:
(1) State Engineer.
(2) State Highway Agency.
Geologic Maps:
(1) U.S. Department of the Interior, Geological Survey, Geologic Division; and state geological surveys ordepartments. (Note: some regular quadrangle maps show geological data also).
Archive
d

Soils Data:
(1) County soil survey reportsCU.S. Department of Agriculture, Soil Conservation Service.
(2) Land use capability surveysCU.S. Department of Agriculture, Soil Conservation Service.
(3) Land classification reportsCU.S. Department of the Interior, Bureau of Reclamation.
(4) Hydraulic laboratory reportsCU.S. Department of the Interior, Bureau of Reclamation.
Climatological Data:
(1) National Weather Service Data Center.
(2) Hydrologic bulletinCU.S. Department of Commerce, National Oceanic and AtmosphericAdministration.
(3) Technical papersCU.S. Department of Commerce, National Oceanic and Atmospheric Administration.
(4) Hydrometeorological reportsCU.S. Department of Commerce, National Oceanic and AtmosphericAdministration; and U.S. Department of the Army, Corps of Engineers.
(5) Cooperative study reportsCU.S. Department of Commerce, National Oceanic and AtmosphericAdministration; and U.S. Department of the Interior, Bureau of Reclamation.
Stream Flow Data:
(1) Water supply papersCU.S. Department of the Interior; Geological Survey, Water Resources Division.
(2) Reports of state engineers.
(3) Annual reportsCInternational Boundary and Water Commission, United States and Mexico.
(4) Annual reportsCvarious interstate compact commissions.
(5) Hydraulic laboratory reportsCU.S. Department of the Interior, Bureau of Reclamation.
(6) Bureau of Reclamation.
(7) U.S. Army Corps of Engineers, Flood control studies.
Sedimentation Data:
Archive
d

(1) Water supply papersCU.S. Department of the Interior, Geological Survey, Quality of Water Branch.
(2) ReportsCU.S. Department of the Interior, Bureau of Reclamation; and U.S. Department of Agriculture,Soil Conservation Service.
(3) Geological Survey CircularsCU.S. Department of the Interior, Geological Survey.
Quality of Water Reports:
(1) Water supply papersCU.S. Department of the Interior, Geological Survey, Quality of Water Branch.
(2) ReportsCU.S. Department of Health, Education, and Welfare, Public Health Service.
(3) ReportsCstate public health departments
(4) Water resources publicationsCU.S. Department of the Interior, Bureau of Reclamation.
(5) Environmental Protection Agency, regional offices.
(6) State water quality agency.
Irrigation and Drainage Data:
(1) Agriculture census reportsCU.S. Department of Commerce, Bureau of the Census.
(2) Agricultural statisticsCU.S. Department of Agriculture, Agricultural Marketing Service.
(3) Federal reclamation projectsCU.S. Department of the Interior, Bureau of Reclamation.
(4) Reports and progress reportsCU.S. Department of the Interior, Bureau of Reclamation.
Power Data:
(1) Directory of Electric UtilitiesCMcGraw Hill Publishing Co.
(2) Directory of Electric and Gas Utilities in the United StatesCFederal Power Commission.
(3) ReportsCvarious power companies, public utilities, state power commissions, etc.
Basin and Project Reports and Special Reports:
Archive
d

(1) U.S. Department of the Army, Corps of Engineers.
(2) U.S. Department of the Interior, Bureau of Land Management, Bureau of Mines, Bureau ofReclamation, Fish and Wildlife Service, and National Park Service.
Figure 19. Flow chart for Level 1: Qualitative Analyses.
4.5.1 Step 1. Define Stream Characteristics
The first step in stability analysis is to identify stream characteristics according to the factorsdiscussed in Chapter 2, Geomorphic Factors and Principles. Defining the various
Archive
d

characteristics of the stream according to this scheme provides insight into stream behaviorand response, and information on impacting activities in the watershed.
4.5.2 Step 2. Evaluate Land Use Changes
Water and sediment yield from a watershed is a function of land-use practices. Thus,knowledge of the land use and historical changes in land use is essential to understandingconditions of stream stability and potential stream response to natural and man-inducedchanges.
The presence or absence of vegetative growth can have a significant influence on the runoffand erosional response of a fluvial system. Large scale changes in vegetation resulting fromfire, logging, land conversion and urbanization can either increase or decrease the total waterand sediment yield from a watershed. For example, fire and logging tend to increase water andsediment yield, while urbanization promotes increased water yield and peak flows, butdecreased sediment yield from the watershed. Urbanization may increase sediment yield fromthe channel.
Information on land use history and trends can be found in Federal, State and Localgovernment documents and reports (i.e., census information, zoning maps, future developmentplans, etc.). Additionally, analysis of historical aerial photographs can provide significant insighton land use changes. Land use change due to urbanization can be classified based onestimated changes in pervious and impervious cover. Changes in vegetative cover can beclassified as simply as no change, vegetation increasing, vegetation damaged and vegetationdestroyed. The relationship or correlation between changes in channel stability and land usechanges can contribute to a qualitative understanding of system response mechanisms.
4.5.3 Step 3. Assess Overall Stream Stability
Table 6 summarizes possible channel stability interpretations according to streamcharacteristics discussed in Chapter 2.0 (Figure 1), as well as additional factors that commonlyinfluence stream stability. Figure 20 is also useful in making a qualitative assessment of streamstability based on stream characteristics. It shows that straight channels are relatively stableonly where flow velocities and sediment load are low. As these variables increase, flowmeanders in the channel causing the formation of alternate bars and the initiation of ameandering channel pattern. Similarly, meandering channels are progressively less stable withincreasing velocity and bed load. At high values of these variables, the channel becomesbraided. The presence and size of point bars and middle bars are indications of the relativelateral stability of a stream channel.
Table 6. Interpretation of observed data (After [27]).
Observed ConditionChannel Response
Stable Unstable Degrading Aggrading
Alluvial Fan1
Upstream X X
Downstream X X
Archive
d

Dam and Reservoir
Upstream X X
Downstream X X
River Form
Meandering X X Unknown Unknown
Straight X Unknown Unknown
Braided X Unknown Unknown
Bank Erosion X Unknown Unknown
Vegetated Banks X Unknown Unknown
Head Cuts X X
Diversion
Clear water diversion X X
Overloaded w/sediment X X
Channel Straightened X X
Deforest Watershed X X
Drought Period X X
Wet Period X X
Bed Material Size
Increase X X
Decrease X Unknown X
1The observed condition refers to location of the bridge on the alluvial fan, i.e., on the upstream ordownstream portion of the fan.
Bed material transport is directly related to stream power, and relative stability decreases asstream power increases as shown by Figure 20. Stream power is the product of shear stress atthe bed and the average velocity in the channel section. Shear stress can be determined fromthe gross shear stress equation (γ RS) where γ is the specific weight of water, R is thehydraulic radius, and S is the slope of the energy grade line.
Archive
d

Figure 20. Channel classification and relative stability as hydraulic factors are varied. (After [5]).
4.5.4 Step 4. Evaluate Lateral Stability
The effects of lateral instability of a stream at a bridge are dependent on the extent of the bankerosion and the design of the bridge. Bank erosion can undermine piers and abutments locatedoutside the channel and erode abutment spill slopes or breach approach fills. Where bankfailure is by a rotational slip, lateral pressures on piers located within the slip zone may causecracks in piers or piling or displacement of pier foundations. Migration of a bend through abridge opening changes the direction of flow through the opening so that a pier designed andconstructed with a round-nose acts as a blunt-nosed, enlarged obstruction in the flow, thusaccentuating local and general scour. Also, the development of a point bar on the inside of themigrating bend can increase contraction at the bridge if the outside bank is constrained fromeroding. Figure 21 illustrates some of the problems of lateral erosion at bridges.
A field inspection is a critical component of a qualitative assessment of lateral stability. Acomparison of observed field conditions with the descriptions of stable and unstable channelbanks presented in Section 2.2.8 helps qualify bank stability. Similarly, field observations ofbank material, composition and existing failure modes can provide insight on bank stability,based on the descriptions of cohesive, non-cohesive and composite banks given in Section2.2.8. An evaluation of lateral stability in conjunction with the design of a bridge should take theperformance of existing nearby bridges into account. The experience of such structures whichhave been subjected to the impacts of the stream can provide insight into response at a nearbystructure.
Archive
d

Lateral stability assessment can also be completed from records of the position of a bend attwo or more different times; aerial photographs or maps are usually the only records available.Surveyed cross sections are extremely useful although rarely available. Some progress isbeing made on the numerical prediction of loop deformation and bend migration (Level 3 typeanalyses). At present, however, the best available estimates are based on past rates of lateralmigration at a particular reach. In using the estimates, it should be recognized that erosionrates may fluctuate substantially from one period of years to the next.
Measurements of bank erosion on two time-sequential aerial photographs (or maps) requirethe identification of reference points which are common to both. Useful reference points includeroads, buildings, irrigation canals, bridges and fence corners. This analysis of lateral stability isgreatly facilitated by a drawing of changes in bank line position with time. To prepare such adrawing, aerial photographs are matched in scale and the photographs are superimposedholding the reference points fixed.
A site of potential avulsion (channel shifting to new flow path) in the vicinity of a highwaystream crossing should be identified so that steps can be taken to mitigate the effects ofavulsion when it occurs. A careful study of aerial photographs will show where overbankflooding has been taking place consistently and where a channel exists that can capture theflow in the existing channel. In addition, topographic maps and special surveys may show thatthe channel is indeed perched above the surrounding alluvial surface, with the inevitability ofavulsion. Generally, avulsion, as the term is used here, will only be a hazard on alluvial fans,alluvial plains, deltas, and wide alluvial valleys. In a progressively aggrading situation, as on analluvial fan, the stream will build itself out of its channel and be very susceptible to avulsion. Inother words, in a cross profile on an alluvial fan or plain, it may be found that the river is flowingbetween natural levees at a level somewhat higher than the surrounding area. In this case,avulsion is inevitable.
Figure 21. Hydraulic problems at bridges attributed to erosion at abend or to lateral migration of the channel (After [1,2]).
Archive
d

4.5.5 Step 5. Evaluate Vertical Stability
The typical effects associated with gradation (bed elevation) changes at highway bridges areerosion at abutments and the exposure and undermining of foundations with degradation, anda reduction in flow area under bridges resulting in more frequent flow over the highway withaggradation. Bank caving associated with degradation poses the same problems at bridges aslateral erosion from bend migration, but the problems may be more severe because of thelower elevation of the streambed. Aggrading stream channels also tend to become wider asaggradation progresses, eroding floodplain areas and highway embankments on the floodplain.The location of the bridge crossing upstream, downstream, or on tributaries may cause bedelevation problems.
Brown et al., reported that their study indicated that there are serious problems at about threedegradation sites for every aggradation site [28]. This is a reflection of the fact that degradationis more common than aggradation, and also the fact that aggradation does not endanger thebridge foundation. It is not an indication that aggradation is not a serious problem in someareas of the United States.
Problems other than those most commonly associated with degrading channels include theundermining of cutoff walls, other flow-control structures, and bank protection. Bank sloughingbecause of degradation often greatly increases the amount of debris carried by the stream andincreases the hazard of clogged waterway openings and increased scour at bridges. Thehazard of local scour becomes greater in a degrading stream because of the lower streambedelevation.
Aggradation in a stream channel increases the frequency of backwater that can causedamage. Bridge decks and approach roadways become inundated more frequently, disruptingtraffic, subjecting the superstructure of the bridge to hydraulic forces that can cause failure, andsubjecting approach roadways to overflow that can erode and cause failure of theembankment. Where lateral erosion or increased flood stages accompanying aggradationincreases the debris load in a stream, the hazards of clogged bridge waterways and hydraulicforces on bridge superstructures are increased.
Data records for at least several years are usually needed to detect gradation problems. This isdue to the fact that the channel bottom often is not visible and changes in flow depth mayindicate changes in the rate of flow rather than gradation changes. Gradation changes developover long periods of time even though rapid change can occur during an extreme flood event.The data needed to assess gradation changes include historic streambed profiles, andlong-term trends in stage-discharge relationships. Occasionally, information on bed elevationchanges can be gained from a series of maps prepared at different times. Bed elevations atrailroad, highway and pipeline crossings monitored over time may also be useful. On manylarge streams, the long-term trends have been analyzed and documented by agencies such asthe U.S. Geological Survey and the U.S. Army Corps of Engineers.
4.5.6 Step 6. Evaluate Channel Response to Change
The knowledge and insight developed from evaluation of present and historical channel andwatershed conditions, as developed above through Steps 1n5, provides an understanding ofpotential channel response to previous impacts and/or proposed changes, such as constructionof a bridge. Additionally, the application of simple, predictive geomorphic relationships, such as
Archive
d

the Lane relationship (see Section 2.3) can assist in evaluating channel response mechanisms.Section 2.4.4 illustrated the evaluation of stream response based on geomorphic and otherqualitative considerations. Additional applications of Level 1 analyses techniques to bridgerelated stream stability problems can be found in Chapter 8 of reference [4].
4.6 Level 2: Basic Engineering Analyses
A flow chart of the typical steps in basic engineering analyses is provided in Figure 22. The flow chartillustrates the typical steps to be followed if a Level 1 qualitative analysis resulted in a decision that Level 2analyses were required (Figure 19). The eight basic engineering steps are generally applicable to moststream stability problems and are discussed in more detail in the paragraphs which follow. The basicengineering analysis steps lead to a conclusion regarding the need for more detailed (Level 3) analysis ora decision to proceed to selection and design of countermeasures without more complex studies. Selectionand design of countermeasures are discussed in Chapter 5.0 and 6.0, respectively.
4.6.1 Step 1. Evaluate Flood History and Rainfall-Runoff Relations
Detailed discussion of hydrologic analysis techniques, in particular the analysis of floodmagnitude and frequency, is presented in HEC-19 [14] and will not be repeated here. However,several hydrologic concepts of particular significance to evaluation of stream stability aresummarized.
Consideration of flood history is an integral step in attempting to characterize watershedresponse and morphologic evolution. Analysis of flood history is of particular importance tounderstanding arid region stream characteristics. Many dryland streams flow only during thespring and immediately after major storms. For example, Leopold, et al. [29] found that arroyosnear Santa Fe, New Mexico, flow only about three times a year. As a consequence, drylandstream response can be considered to be more hydrologically dependent than streams locatedin a humid environment. Whereas the simple passage of time may be sufficient to causechange in a stream located in a humid environment, time alone, at least in the short term, maynot necessarily cause change in a dryland system due to the infrequency of hydrologicallysignificant events. Thus, the absence of significant morphological changes in a dryland streamor river, even over a period of years, should not necessarily be construed as an indication ofsystem stability.
Although the occurrence of single large storms can often be directly related to system changein any region of the country, this is not always the case. In particular, the succession ofmorphologic change may be linked to the concept of geomorphic thresholds as proposed bySchumm [3]. Under this concept, although a single major storm may trigger an erosional eventin a system, the occurrence of such an event may be the result of a cumulative process leadingto an unstable geomorphic condition.
Archive
d

Figure 22. Flow chart for Level 2: Basic Engineering Analyses.
Where available, the study of flood records and corresponding system responses, as indicatedby time-sequenced aerial photography or other physical information, may help determine therelationship between morphological change and flood magnitude and frequency. Evaluation ofwet-dry cycles can also be beneficial to an understanding of historical system response.Observable historical change may be found to be better correlated with the occurrence of asequence of events during a period of above average rainfall and runoff than with the singlelarge event. The study of historical wet-dry trends may explain certain aspects of systemresponse. For example, a large storm preceded by a period of above-average precipitationmay result in less erosion, due to better vegetative cover, than a comparable storm occurringunder dry antecedent conditions; however, runoff volumes might be greater due to saturatedsoil conditions.
A good method to evaluate wet-dry cycles is to plot annual rainfall amounts, runoff volumes
Archive
d

and maximum annual mean daily discharge for the period of record. A comparison of thesegraphs will provide insight to wet-dry cycles and flood occurrences. Additionally, a plot of theratio of rainfall to runoff is a good indicator of watershed characteristics and historical changesin watershed condition.
4.6.2 Step 2. Evaluate Hydraulic Conditions
Knowledge of basic hydraulic conditions, such as velocity, flow depth and top width, etc., forgiven flood events is essential for completion of Level 2 stream stability analysis. Incipientmotion analysis, scour analysis, assessment of sediment transport capacity, etc. all requirebasic hydraulic information. Hydraulic information is sometimes required for both the mainchannel and overbank areas, such as in the analysis of contraction scour.
Evaluation of hydraulic conditions is based on the factors and principles reviewed in Chapter3.0. For many river systems, particularly near urban areas, hydraulic information may bereadily available from previous studies, such as flood insurance studies, channel improvementprojects, etc., and complete re-analysis may not be necessary. However, in other areas,hydraulic analysis based on appropriate analytical techniques will be required prior tocompleting other quantitative analyses in a Level 2 stream stability assessment. The mostcommon computer models for analysis of water surface profiles and hydraulic conditions arethe Corps of Engineers HEC-2 and the Federal Highway Administration WSPRO. For theanalysis and design of bridge crossings, WSPRO is generally considered a better model. Thecomputational procedure in WSPRO for evaluating bridge loss is superior to that utilized inother models, and the input structure of the model has been specifically developed to facilitatebridge design.
4.6.3 Step 3. Bed and Bank Material Analysis
Bed material is the sediment mixture of which the streambed is composed. Bed materialranges in size from huge boulders to fine clay particles. The erodibility or stability of a channellargely depends on the size of the particles in the bed. Additionally, knowledge of bed sedimentis necessary for most sediment transport analyses, including evaluation of incipient motion,armoring potential, sediment transport capacity and scour calculations. Many of these analysesrequire knowledge of particle size gradation, and not just the median (D50) sediment size.
Bank material usually consists of particles the same size as, or smaller than, bed particles.Thus, banks are often more easily eroded than the bed, unless protected by vegetation,cohesion, or some type of man-made protection.
Of the various sediment properties, size has the greatest significance to the hydraulic engineer,not only because size is the most readily measured property, but also because otherproperties, such as shape and fall velocity, tend to vary with particle size. A comprehensivediscussion of sediment characteristics, including sediment size and its measurement, isprovided in reference [4]. The following information briefly discusses sediment samplingconsiderations.
Important factors to consider in determining where and how many bed and bank materialsamples to collect include: 1) size and complexity of the study area, 2) number, lengths anddrainage areas of tributaries, 3) evidence of or potential for armoring, 4) structural features thatcan impact or be significantly impacted by sediment transport, 5) bank failure areas, 6) highbank areas, and 7) areas exhibiting significant sediment movement or deposition (i.e., bars in
Archive
d

channel). Tributary sediment characteristics can be very important to channel stability, since asingle major tributary or tributary source area could be the predominant supplier of sediment toa system.
The depth of bed material sampling depends on the homogeneity of surface and subsurfacematerials. Where possible it is desirable to dig down some distance to establish bed-materialcharacteristics. For example, in sand/gravel bed systems the potential existence of a thinsurface layer of coarser sediments (armor layer) on top of relatively undisturbed subsurfacematerial must be considered in any sediment sampling. Samples containing material from bothlayers would contain materials from two populations in unknown proportions, and thus it istypically more appropriate to sample each layer separately. If the purpose of the sampling is toevaluate hydraulic friction or initiation of bed movement, then the surface sample will be ofmost interest. Conversely, if bed-material transport during a large flood (i.e., large enough todisturb the surface layer) is important, then the underlying layer may be more significant.Methods of analysis are given in reference [4].
4.6.4 Step 4. Evaluate Watershed Sediment Yield
Evaluation of watershed sediment yield, and in particular, the relative increase in yield as aresult of some disturbance, can be an important factor in stream stability assessment.Sediment eroded from the land surface can cause silting problems in stream channels resultingin increased flood stage and damage. Conversely, a reduction in sediment supply can alsocause adverse impacts to river systems by reducing the supply of incoming sediment, thuspromoting channel degradation and headcutting. A radical change in sediment yield as a resultof some disturbance, such as a recent fire or long term land use changes, would suggest thatstream instability conditions either already exist, or might readily develop.
Assessment of watershed sediment yield first requires understanding the sediment sources inthe watershed and the types of erosion that are most prevalent. The physical processescausing erosion can be classified as sheet erosion, rilling, gullying and stream channel erosion.Other types of erosional processes are classified under the category of mass movement, e.g.,soil creep, mudflows, landslides, etc. Data from publications and maps produced by the SoilConservation Service and the Geological Survey can be used along with field observations toevaluate the area of interest.
Actual quantification of sediment yield is at best an imprecise science. The most usefulinformation is typically obtained not from analysis of absolute magnitude of sediment yield, butrather the relative changes in yield as a result of a given disturbance. One useful approach toevaluating sediment yield from a watershed was developed by the Pacific SouthwestInteragency Committee [30]. This method, which was designed as an aid for broad planningpurposes only, consists of a numerical rating of nine factors affecting sediment production in awatershed, which then defines ranges of annual sediment yield in acre feet per square mile.The nine factors are surficial geology, soil climate, runoff, topography, ground cover, land use,upland erosion, and channel erosion and transport.
Other approaches to quantifying sediment yield are based on regression equations, as typifiedby the Universal Soil Loss Equation (USLE). The USLE is an empirical formula for predictingannual soil loss due to sheet and rill erosion, and is perhaps the most widely recognizedmethod for predicting soil erosion. Wischmeier and Smith [31] provide detailed descriptions ofthis equation and its terms.
Archive
d

4.6.5 Step 5. Incipient Motion Analysis
An evaluation of relative channel stability can be made by evaluating incipient motionparameters. The definition of incipient motion is based on the critical or threshold conditionswhere hydrodynamic forces acting on one grain of sediment have reached a value that, ifincreased even slightly, will move the grain. Under critical conditions, or at the point of incipientmotion, the hydrodynamic forces acting on the grain are just balanced by the resisting forces ofthe particle.
The Shields diagram may be used to evaluate the particle size at incipient motion for a givendischarge (see [4]). For most river flow conditions the following equation, derived from theShields diagram, is appropriate for evaluation of incipient motion:
where:Dc = Diameter of the sediment particle at incipient motion conditionsτ = Boundary shear stress (see [4] for equations defining the boundary shear stress)γs and γ = Specific weights of sediment and water, respectively0.047 = Dimensionless coefficient often referred to as the Shields parameter.
As originally proposed the Shields parameter was 0.06 for flow conditions in the turbulentrange. The value of 0.047 was suggested by Meyer-Peter and Muller[32], and furthersupported by Gessler [33]. Recent research has indicated that this coefficient is not constant(values range from 0.02 to 0.10), and equations have been derived as a function of surface andsubsurface particle size. However, as a first estimate the use of 0.047 should providereasonable results in most situations.
Evaluation of the incipient motion size for various discharge conditions provides insight onchannel stability and what flood might potentially disrupt channel stability. The results of suchan analysis are generally more useful for analysis of gravel or cobble-bed systems. Whenapplied to a sand bed channel, incipient motion results usually indicate that all particles in thebed material are capable of being moved for even very small discharges, a physically realisticresult.
4.6.6 Step 6. Evaluate Armoring Potential
The armoring process begins as the non-moving coarser particles segregate from the finermaterial in transport. The coarser particles are gradually worked down into the bed, where theyaccumulate in a sublayer. Fine bed material is leached up through this coarse sublayer toaugment the material in transport. As sediment movement continues and degradationprogresses, an increasing number of non-moving particles accumulate in the sublayer.Eventually, enough coarse particles can accumulate to shield, or "armor" the entire bedsurface.
An armor layer sufficient to protect the bed against moderate discharges can be disruptedduring high flow, but may be restored as flows diminish. Therefore, as in any hydraulic design,the analysis must be based on a certain design event. If the armor layer is stable for thatdesign event, it is reasonable to conclude that no degradation will occur under designconditions. However, flows exceeding the design event may disrupt the armor layer, resulting indegradation.
Archive
d

Potential for development of an armor layer can be assessed using incipient motion analysisand a representative bed-material composition. In this case the representative bed-materialcomposition is that which is typical of the depth of anticipated degradation. For given hydraulicconditions the incipient motion particle size can be computed as given above in Step 5. If nosediment of the computed size or larger is present in significant quantities in the bed, armoringwill not occur.
The D90 or D95 size of the representative bed material is frequently found to be the size"paving the channel" when degradation is arrested. Within practical limits of planning anddesign, the D95 size is considered to be about the maximum size for pavement formation [33].Therefore, armoring is probable when the computed incipient motion size is equal to or smallerthan the D95 size in the bed material.
By observing the percentage of the bed material equal to or larger than the armor particle size(Dc) the depth of scour necessary to establish an armor layer can be calculated [35]:
where: ya = Thickness of the armoring layerPc = Decimal fraction of material coarser than the armoring size
The thickness of the armoring layer (ya) ranges from one to three times the armor particle size(Dc), depending on the value of Dc. Field observations suggest that a relatively stable armoringcondition requires a minimum of two layers of armoring particles.
4.6.7 Step 7. Evaluation of Rating Curve Shifts
When stream gage data are available, such as that collected by the U.S. Geological Survey, ananalysis of the stage-discharge rating curve over time can provide insight on stream stability.For example, a rating curve that was very stable for many years, but suddenly shifts mightindicate a change in watershed conditions causing increased channel erosion orsedimentation, or a some other change related to channel stability. Similarly, a rating curve thatshifts continually would be a good indicator that channel instability exists. However, it isimportant to note that not all rating curve shifts are the result of channel instability. Otherfactors promoting a shift in a rating curve include changes in channel vegetation, iceconditions, beaver activity, etc.
The most common cause of rating curve shifts in natural channel control sections is generallyscour and fill [36]. A positive shift in the rating curve results from scour, and the depth, andhence, the discharge are increased for a given stage. Conversely, a negative shift results fromfill, and the depth and discharge will be less for a given stage.
Shifts may also be the result of changes in channel width. Channel width may increase due tobank-cutting, or decrease due to undercutting of steep streambanks. In meandering streams,changes in channel width can occur as point bars are created or destroyed.
Analysis of rating curve shifts is typically available from the agency responsible for the streamgage. If such information is not available, field inspection combined with the methods described
Archive
d

by the [36] can be utilized to analyze observed rating curve shifts. If the shifts can be traced toscour, fill or channel width changes, such information will be a reliable indicator of potentialchannel instability.
Gaging stations at which continuous sediment data are collected may also provide clues to theexistence of gradation problems. Any changes in the long-term sediment load may indicatelateral movement of the channel, gradation changes, or a change in sediment supply from thewatershed.
4.6.8 Step 8. Evaluate Scour Conditions
Section 3.4.1 provided an overview of scour at bridge crossings and reference [23] providesdetailed computational procedures. Figure 23 illustrates common scour related problems atbridges. These problems are attributable to the effects of obstructions to the flow (local scour)and contraction of the flow or channel deepening at the outside of a bend. Calculation of thethree components of scour, local scour, contraction scour and aggradation/degradation,quantifies the potential instability at a bridge crossing. Scour susceptible bridges are those thatshow potentially large amounts of any one of the scour components, and/or their cumulativeamount is large. Such bridges should be carefully monitored and/or countermeasures installed.
4.7 Level 3: Mathematical and Physical Model Studies
Detailed evaluation and assessment of stream stability can be accomplished using either mathematical orphysical model studies. A mathematical model is simply a quantitative expression of the relevant physicalprocesses involved in stream channel stability. Various types of mathematical models are available forevaluation of sediment transport, depending on the application (watershed or channel analysis) and thelevel of analysis required. The use of such models can provide detailed information on erosion andsedimentation throughout a study reach, and allows evaluation of a variety of "what-if" questions.
Similarly, physical model studies completed in a hydraulics laboratory can provide detailed information onflow conditions and to some extent, sediment transport conditions, at a bridge crossing. The hydraulic lawsand principles involved in scaling physical model studies are well defined and understood, allowingaccurate extrapolation of model results to prototype conditions. Physical model studies can often providebetter information on complex flow conditions than what is readily available from mathematical models,due to the complexity of the process and the limitations of 2- and 3-dimensional mathematical models.Often the use of both physical and mathematical models can provide complementary information.Arch
ived

Figure 23. Local scour and contraction scour related hydraulic problems at bridges related to: (a)obstructions to the flow or (b) contraction of the flow or channel deepening at the outside of a bend
[1,2].
However, the need for detailed information and accuracy available from either mathematical or physicalmodel studies must be balanced by the time and money available. As the analysis becomes morecomplicated, accounting for more factors, the level of effort necessary becomes proportionally larger. Thedecision to proceed with a Level 3 type analysis has historically been made only for high risk locations,extraordinarily complex problems, and for forensic analysis where losses and liability costs are high;however, considering the importance of stream stability to the safety and integrity of all bridges suggeststhat Level 3 type analyses should be completed routinely. The widespread use of personal computers andthe continued development of more sophisticated software have greatly facilitated completion of Level 3type investigations and have reduced the level of effort and cost required.
4.8 Illustrative Examples
The FHWA manual, "Highways in the River Environment," [4] provides a discussion of "DesignConsiderations for Highway Encroachment and River Crossings" in Chapter 7. This discussion includesprincipal factors for design, procedures for evaluation and design, and conceptual examples. Theprocedures for evaluation and design of river crossings and encroachments parallel the three-levelapproach of this chapter. A series of short conceptual discussions in Chapter 7 of HIRE (pp. VII-13 toVII-32) illustrate the application of qualitative (Level 1) techniques, and a series of short case studies (pp.
Archive
d

VII -33 to VII -60) provide various applications. Finally, Chapter 7 of HIRE presents five "OverviewExamples" which illustrate various steps in the three-level approach.
To illustrate the application of Level 1 and Level 2 analysis techniques as presented in this chapter, one ofthe overview examples from HIRE [4] has been edited to correspond to the specific steps as outlined inFigures 19 and 22. This illustrative example is given in Appendix A.
Go to Chapter 5
Archive
d

5.0 Selection of Countermeasures for StreamInstability
Go to Chapter 6
5.1 Introduction
A countermeasure is defined as a measure incorporated into a highway-stream crossingsystem to monitor, control, inhibit, change, delay, or minimize stream and bridge stabilityproblems or action plan for monitoring structures during and/or after flood events. This wouldinclude river stabilizing works over a reach of the river up and downstream of the crossing.Countermeasures may be installed at the time of highway construction or retrofitted to resolvestability problems at existing crossings. Retrofitting is good economics and good engineeringpractice in many locations because the magnitude, location, and nature of potential stabilityproblems are not always discernible at the design stage, and indeed, may take a period ofseveral years to develop. Also, a countermeasure does not need to be a separate structure, butmay be an integral part of the highway. For example, relief bridges on floodplains arecountermeasures which alleviate general scour from flow contraction at the bridge over thestream channel. Some features that are integral to the highway design serve ascountermeasures to minimize stream stability problems. Abutments and piers oriented with flowdirection serve to achieve the most efficient utilization of available waterway to convey flow andalso serve to reduce local scour and scour due to contraction.
Countermeasures which are not integral to the highway may serve one function at one locationand a different function at another. For examples, bank revetment may be installed to controlbank erosion from meander migration, or it may be used to stabilize stream banks in thecontracted area at a bridge. Other countermeasures are useful for one function only. Thiscategory of countermeasures includes spurs constructed in the stream channel to controlmeander migration.
In selecting a countermeasure it is necessary to evaluate how the stream might respond, andalso how the stream may respond as the result of the activities of other parties.
A countermeasure for scour critical bridges and unknown foundations could also be monitoringa bridge during and/or after a flood event. If monitoring is selected and if the risk of scour failureis high, interim protection such as riprap or instrumentation should be provided. At this time thesizing of riprap to resist scour is not fail-safe. Therefore, even if riprap is placed around piers orabutments, the high risk bridge should be monitored during and inspected after floods. Ifmonitoring is selected, an action plan should be implemented which includes a notificationprocess, flood watch procedures, a highway closure process, documentation of availabledetours, inspection procedures, assessment procedures, and a repair notification process.
This chapter provides some general criteria for the selection of countermeasures for streaminstability. Then, the selection of countermeasures for specific stream instability problems is
Archive
d

discussed. Finally, case histories of hydraulic problems at bridge sites are summarized toprovide information on the relative success of various countermeasures for stream stabilization.
5.2 Criteria for the Selection of Countermeasures
The selection of an appropriate countermeasure for a specific bank erosion problem isdependent on factors such as the erosion mechanism, stream characteristics, construction andmaintenance requirements, potential for vandalism, and costs. Perhaps more important,however, is the effectiveness of the measure selected in performing the required function.
Protection of an existing bank line may be accomplished with revetments, spurs, retardancestructures, longitudinal dikes, or bulkheads. Spurs, longitudinal dikes, and area retardancestructures can be used to establish a new flow path and channel alignment, or to constrict flowin a channel. Bulkheads may be used for any of the functions, but because of their high cost,are appropriate for use only where space is at a premium. Channel relocation may be usedseparately or in conjunction with other countermeasures to change the flow path and floworientation.
5.2.1 Erosion Mechanism
Bank erosion mechanisms are surface erosion and/or mass wasting. Surfaceerosion is the removal of soil particles by the velocity and turbulence of the flowingwater. Mass wasting is by slides, rotational slip, piping and block failure. In generalslides, rotational slip and block failure result from the bank being under cut by theflow. Also, seepage force of the pore water in the bank is another factor that cancause surface erosion or mass wasting. The type of mechanism is determined bythe magnitude of the erosive forces of the water, type of bed and bank material,vegetation, and gradation stability of the stream. These mechanisms are describedin [4].
5.2.2 Stream Characteristics
Stream characteristics that influence the selection of countermeasures include:channel width; bank height, configuration, and material; vegetative cover; channelbed; sediment transport condition; bend radii; channel velocities and flow depth; iceand debris; and floodplains.
Channel Width. Channel width influences only the use of spur-typecountermeasures. On smaller streams (<250 feet wide), flow constriction resultingfrom the use of spurs may cause erosion of the opposite bank. However, spurs canbe used on small channels where the purpose is to shift the location of the channel.
Archive
d

Bank Height. Low banks (<10 feet) may be protected by any of thecountermeasures, including bulkheads. Medium height banks (from 10 to 20 feet)may be protected by revetment, retardance structures, spurs, and longitudinaldikes. High banks (>20 feet) generally require revetments used alone or inconjunction with other measures.
Channel Configuration. Spurs and jack fields have been successfully used as acountermeasure to control the location of the channel in meandering and braidedstreams. Also, bulkheads, revetments, and riprap have been used to control bankerosion resulting from stream migration. On anabranching streams, revetments,riprap, and spurs have been used to control bank erosion and channel shifting.Also, channels that do not carry large flows can and have been closed off. In onecase, [4] reports that a large channel was closed off and revetment and riprap usedto control erosion in the other channel .
Channel Material. Spurs, revetments, riprap, jack fields, or check dams can be usedin any type of channel material if they are designed correctly. However, jack fieldsshould only be placed on streams that carry appreciable debris and sediment inorder for the jacks to cause deposition and eventually be covered up.
Bank Vegetation. Vegetation such as willows can enhance the performance ofstructural countermeasures and may, in some cases, reduce the level of structuralprotection needed. Meander migration and other bank erosion mechanisms areaccelerated on many streams in reaches where vegetation has been cleared.
Sediment Transport. The sediment transport conditions can be described asregime, threshold, or rigid. Regime channel beds are those which are in motionunder most flow conditions, generally in sand or silt-size noncohesive materials.Threshold channel beds have no bed material transport at normal flows andbecome mobile at higher flows. They may be cut through cohesive or noncohesivematerials, and an armor layer of coarse-grained material can develop on thechannel bed. Rigid channel beds are cut through rock or boulders and rarely ornever become mobile. In general, permeable structures will cause deposition of bedmaterial in transport and are better suited for use in regime and some thresholdchannels than in rigid channel conditions. Impermeable structures are moreeffective than permeable structures in channels with little or no bed load, butimpermeable structures can also be very effective in mobile bed conditions.Revetments can be effectively used with mobile or immobile channel beds.
Bend Radii. Bend radii affect the design of countermeasures. Thus, the cost perfoot of bank protection provided by a specific countermeasure may differconsiderably on short-radius and longer radius bends.
Channel Velocities and Flow Depth. Channel hydraulics affect countermeasureselection because structural stability and induced scour must be considered. Someof the permeable flow retardance measures may not be structurally stable andcountermeasures which utilize piles may be susceptible to scour failure in high
Archive
d

velocity environments.
Ice and Debris. Ice and debris can damage or destroy countermeasures and shouldalways be considered during the selection process. On the other hand, theperformance of some permeable spurs and area retardance structures is enhancedby debris where debris accumulation causes increased sediment deposition.
Floodplains. In selecting countermeasures for stream stability and scour, theamount of flow on the floodplain is an important factor. For example, if there isappreciable overbank flow, then guide banks to protect abutments should beconsidered. Also, spurs perpendicular to the approach embankment may beneeded to control erosion.
5.2.3 Construction and Maintenance Requirements
Standard requirements regarding construction or maintenance such as theavailability of materials, construction equipment requirements, site accessibility,time of construction, contractor familiarity with construction methods, and a programof regular maintenance, inspection, and repair are applicable to the selection ofappropriate countermeasures. Additional considerations for countermeasures whichare located in stream channels include considerations of constructing andmaintaining a structure which may be partially under water at all times, the extent ofbank disturbance which may be necessary, and the desirability of preservingstreambank vegetative cover to the extent practicable.
5.2.4 Vandalism
Vandalism is always a maintenance concern since effective countermeasures canbe made ineffective by vandals. Documented vandalism includes dismantling ofdevices, burning, and cutting or chopping with knives, wire cutters, and axes.Countermeasure selection or material selection for construction may be affected byconcern for vandalism. For example, rock-filled baskets (gabions) may not beappropriate in some urban environments.
5.2.5 Costs
Cost comparisons should be used to study alternative countermeasures with anunderstanding that the measures were installed under widely varying streamconditions, that the conservatism (or lack thereof) of the designer is not accounted
Archive
d

for, that the relative effectiveness of the measures cannot be quantitativelyevaluated, and that some measures included in the cost data may not have beenfully tested by floods.
Figure 24 provides some insight regarding the relative costs of majorcountermeasure types. Although the study was done in 1985 and costs haveincreased, the relative cost probably has not changed. The bars represent the costrange for each countermeasure included in the comparison and the darkenedportion of each bar represents the dominant range of costs. Numbers following thecountermeasure type are the number of sites included in the cost analysis. Thefigure shows that rock spurs, horizontal wood slat spurs, rock windrow revetments,vegetation, jack retardance structures, wood-fence retardance structures, and rocktoe dikes are usually the least expensive. Henson-type (vertical wood slat) spurs,cellular block revetments, and concrete-filled mats are generally the mostexpensive. Rock riprap revetment costs per foot of bank protection vary widely, butthe dominant range of costs are not out of line with costs for othercountermeasures.
Figure 24. Countermeasure costs per foot of bank protected (After [37]).
Archive
d

5.3 Countermeasures for Meander Migration
The best countermeasure against meander migration is to locate the bridge crossing on arelatively straight reach of stream between bends. At many such locations, countermeasuresmay not be required for several years because of the time required for the bend to move to alocation where it becomes threatening to the highway facility. However, bend migration rates onother streams may be at such a rate that countermeasures will be required after a few years ora few flood events and, therefore, should be installed during initial construction.
Stabilizing channel banks at a highway stream crossing can cause a change in the channelcross section and an increase in stream sinuosity upstream of the stabilized banks. Figure25(a) illustrates a natural channel section in a bend with the deeper section at the outside of thebend and a gentle slope toward the inside bank resulting from deposition in the remainder ofthe section. Figure 25(b) illustrates the scour which results from stabilizing the outside bank ofthe channel and the steeper slope of the point bar on the inside of the bend. This effect must beconsidered in the design of the countermeasure and the bridge. It should also be recognizedthat the thalweg location and flow direction can change as sinuosity upstream increases.
Figure 25. Comparison of channel bend cross sections for(a) natural conditions, and (b) stabilized bend (After [37]).
Figure 26(a) illustrates meander migration in a natural stream and Figure 26(b), the effects ofbend stabilization on upstream sinuosity. As sinuosity increases, meander amplitude mayincrease, meander radii will become smaller, deposition may occur because of reduced slopes,and the channel width-depth ratio may increase as a result of bank erosion and deposition, asat the bridge location shown in Figure 26(b). Ultimately, cutoffs can occur. These changes canalso result in changing hydraulic problems downstream of the stabilized bend.
Archive
d

Figure 26. Meander migration in a(a) natural channel, and a (b)
channel with stabilized bend (After[37]).
Countermeasures for meander migration include those that:protect an existing bank line,●
establish a new flow line or alignment, and●
control and constrict channel flow●
The classes of countermeasures identified for bank stabilization and bend control are bankrevetments, spurs, retardance structures, longitudinal dikes, vane dikes, bulkheads, andchannel relocations. Also, a carefully planned cutoff may be an effective way to counterproblems created by meander migration. These measures may be used individually or incombination to combat meander migration at a site. Some of these countermeasures are alsoapplicable to bank erosion from causes other than bend migration. Descriptions and designrecommendations are included in Chapter 6.0CCountermeasure Design.
5.4 Countermeasures for Scour at Bridges
Scour is the result of the erosive action of running water, excavating and carrying away materialfrom the bed and banks of streams. Different materials scour at different rates. Loose granularsoils are rapidly eroded under water action while cohesive or cemented soils are more scour
Archive
d

resistant. However, ultimate scour in cohesive or cemented soils can be as deep as scour insandbed streams. Scour will reach its maximum depth in sand and gravel bed materials inhours; cohesive bed materials in days; glacial tills, poorly cemented sand stones and shales inmonths; hard, dense and cemented sandstone or shales and limestones in years; and densegranites in centuries. Massive rock formations with few discontinuities can be highly resistant toscour and erosion during the lifetime of a typical bridge.
Designers and inspectors need to carefully study site specific subsurface information inevaluating scour potential at bridges, giving particular attention to foundations on rock.
Total Scour. Total scour at a highway crossing is comprised of three components. Thesecomponents are:
Aggradation and Degradation. These are long-term stream bed elevationchanges due to natural or man induced causes within the reach of the river onwhich the bridge is located.
●
Contraction Scour. This type of scour involves the removal of material fromthe bed and banks across all or most of the width of a channel. This scour canresult from a contraction of the flow by the approach embankments to thebridge encroaching onto the floodplain and/or into the main channel, a changein downstream control of the water surface elevation, or the location of thebridge in relation to a bend. In each case, the scour is caused by an increasein transport of the bed material in the bridge cross section.
●
Local Scour. This scour occurs around piers, abutments, spurs, andembankments and is caused by the acceleration of the flow and thedevelopment of vortex systems induced by these obstructions to the flow.
●
In addition to the types of scour mentioned above, lateral migration of the stream may alsoerode the approach roadway to the bridge or change the total scour by changing the angle ofthe flow in the waterway at the bridge crossing. Factors that affect lateral migration and thestability of a bridge are the geomorphology of the stream, location of the crossing on thestream, flood characteristics, and the characteristics of the bed and bank materials.
Scour estimating procedures and countermeasure selection are presentd in detail in [23,24].
There are two ways by which bridges can be made fail-safe against scour, but neither is aviable alternative at many alluvial stream crossing sites. Nevertheless, where the alternative isavailable and practicable, consideration can be given to making the crossing or bridge fail-safe.The first fail-safe design alternative is a one-span structure which spans streamflow at floodstage. This includes a superstructure that will not be submerged or partially submerged at floodstage. Obviously, this alternative may only be practicable for small, relatively stable, incisedstreams.
The second fail-safe bridge design alternative is a foundation in sound rock and asuperstructure above the elevation of flood flow. Other countermeasures may be necessary toinhibit scour of streambanks, abutment spill slopes and approach fills, but the bridge will befail-safe if adequately anchored in sound rock.
Archive
d

A third design alternative which is necessary for all bridges over alluvial streams is to locate thebridge foundation, pile tips or drilled shafts, at an elevation at which sufficient support will beretained after scour occurs [23]. Where pile bearing capacity is based on skin friction, drivingthe piles to refusal may be inadequate. Pile tip elevation should be applied as a secondcriterion, and tip elevation should be based on bearing capacity after scour.
The FHWA September 1988 Technical Advisory, subject "Scour at Brides" [24] states thefollowing with regard to new and existing bridges:
Interdisciplinary Team. Scour evaluations of new and existing bridges should beconducted by an interdisciplinary team comprised of structural, hydraulic, andgeotechnical engineers. (. . .)
.
New Bridges. Bridges over tidal and non-tidal waterways with scourable beds shouldwithstand the effects of scour from a superflood (a flood exceeding the 100-year flood)without failing, i.e., experiencing foundation movement of a magnitude that requirescorrective action.
Hydraulic studies should be prepared for bridges over waterways in accordancewith Article 1.3.2 of the standard Specifications for Highway Bridges of theAmerican Association of State Highway and Transportation Officials (AASHTO) andthe floodplain regulation of the FHWA as set forth in 23 CFR 650, Subpart A.
1.
Hydraulic studies should include estimates of scour at bridge piers and abutments.Bridge foundations should be designed to withstand the effects of scour withoutfailing for the worst conditions resulting from floods equal to or less than the100-year flood in accordance with the interim procedures in Chapters 3 and 4 of theAttachment. Bridge foundations should be checked to ensure that they will not faildue to scour resulting from the occurrence of a superflood on the order ofmagnitude of a 500-year flood. (. . .)
2.
The geotechnical analysis of bridge foundations should be performed on the basisthat all stream bed material in the scour prism above the total scour line for thedesign flood (for scour) has been removed and is not available for bearing or lateralsupport. In addition, the ratio of ultimate to applied loads should be greater than 1.0for conditions of scour for the superflood. (. . .)
3.
Data on scour at bridge piers and abutments should be collected and analyzed inorder to improve existing procedures for estimating scour. (. . .)
4.
b.
Existing Bridges. All existing bridges over tidal and non-tidal waterways with scourablebeds should be evaluated for the risk of failure from scour during the occurrence of asuperflood on the order of magnitude of a 500-year flood. (. . .)
c.
An initial screening process should be developed to identify bridges mostlikely to be susceptible to scour damage and to establish a priority list forevaluation. (. . .)
1.
Bridge scour evaluations should be conducted for each bridge to determinewhether it is scour critical. A scour critical bridge is one with abutment or pierfoundations which are rated as unstable due to:
2.
observed scour at the bridge site or.
Archive
d

a scour potential as determined from scour evaluation study. (. . .)b.
Scour Critical Existing Bridges. A plan of action should be developed for each existingbridge determined to be scour critical. (. . .)
d.
The plan of action should include instructions regarding the typeand frequency of inspections to be made at the bridge, particularlyin regard to monitoring the performance and closing of the bridge,if necessary, during and after flood events.
1.
The plan of action should include a schedule for the timely designand construction of scour countermeasures determeined to beneeded for the protection of the bridge. (. . .)
2.
As a practical matter, fail-safe bridge designs are usually not feasible, but strategies againstscour are available. Design alternatives, in addition to the three discussed above, are integralto the highway facility. Countermeasures are appurtenances to the highway-stream crossingsystem. Design alternatives and countermeasures are both discussed in the following sectionsin regard to contraction scour and local scour problems.
5.4.1 Contraction Scour
Severe contraction of flow at highway stream crossings has resulted in numerousbridge failures at abutments, approach fills, and piers from contraction scour.Lessening contraction scour can be accomplished by reducing the amount of flowcontraction and by reducing the effects of flow contraction. Design alternatives tolessen contraction scour include longer bridges, relief bridges on the floodplain,superstructures at elevations above flood stages of extreme events, and a rollingprofile on approach roadways to provide for overtopping during floods exceedingthe design flood event. These design alternatives are integral features of thehighway facility which reduce the contraction at bridges and, therefore, reduce themagnitude of contraction scour. Further discussion of the elevation ofsuperstructures and the roadway profile is warranted since the impact of thesefeatures on the magnitude of scour is less obvious than the effects of other featuresof the design.
The elevation of bridge superstructures is recognized as important to the integrity ofthe bridge because of hydraulic forces that may damage the superstructure. Theseinclude buoyancy and impact forces from ice and other floating debris. Contractionscour is another consideration in setting the superstructure elevation. When thesuperstructure of a bridge becomes submerged or when ice or debris lodged on thesuperstructure causes the flow to contract, flow is accelerated and more severescour can occur. For this reason, where contraction scour is of concern, bridgesuperstructures should be located with clearance for debris, and, if practicable,above the stage of floods larger than the design flood.
Where streamflow at flood stages includes overbank flow, maximum flow through
Archive
d

bridge waterways occurs at incipient overtopping of the roadway. As the flood stageincreases, backwater and flow through bridge openings decrease, at leasttemporarily. Therefore, highway profiles are significant to the contraction of flow andcontraction scour at stream crossings.
Another design feature which should be considered relative to contraction scour isthe effective depth of the superstructure. Present day superstructures often includebridge railings which are solid parapets. These increase the effective depth of thesuperstructure and the importance of locating the bridge superstructure above highwater with clearance for debris passage. It also increases the importance ofalternate provisions for the passage of flood waters in the event of debris blockageof the waterway or superstructure submergence. Possible alternate provisionsinclude relief bridges on the floodplain and a highway profile which provides forovertopping before the bridge superstructure begins to become submerged.
Similarly, pier design, span length, and pier location become more importantcontributors to contraction scour where debris can lodge on the piers and furthercontract flow in the waterway. In streams which carry heavy loads of debris, longer,higher spans and solid piers will help to reduce the collection of debris. Wherepracticable, piers should be located out of the main current in the stream, i.e.,outside the thalweg at high flow. There are numerous locations where piers occupya significant area in the stream channel and contribute to contraction scour,especially where devices to protect piers from ship traffic are provided.
The stream channel cross section under bridges is sometimes designed to increasethe waterway area and thereby decrease backwater upstream of the bridge andcontraction scour in the waterway. In streams which carry large sediment loads,deposition may occur in the enlarged section of channel during smaller floods andon the recession of larger floods, thus rendering the channel excavation ineffective.However, for streams which do not carry a significant sediment load and onfloodplains, excavation within the bridge waterway area will compensate for some ofthe lateral contraction of flow and reduce contraction scour. The option ofsubstituting excavation for scour is site-specific and may be undesirable on somefloodplains because of high water tables and standing water.
Countermeasures used to reduce flow contraction include measures which retardflow along highway embankments on floodplains. Flow along highway fills usuallyintersects with flow within bridge openings at large angles. This causes additionalcontraction of the flow, vortices, and turbulence which produce local scour. Thecontraction of flow can be reduced by using spurs on the upstream side of thehighway embankment to retard flow parallel with the highway [19].
Guide banks (also referred to as spur dikes) at bridge ends serve a similar purposein addition to the purpose of aligning flow in the bridge opening [19]. They reducecontraction scour because they increase the efficiency of the bridge opening andhence reduce flow contraction. The primary purpose of these guide banks,however, is to reduce local scour at abutments.
Archive
d

The principal countermeasure used for reducing the effects of contraction isrevetment on channel banks and fill slopes at bridge abutments. However, guidebanks may be used to reduce the effects of contraction by moving the site of localscour caused by the turbulence of intersecting flows and contraction away from thebridge end.
The potential for undesired effects from stabilizing all or any portion of the channelperimeter at a contraction should be considered. Stabilization of the banks may onlyresult in exaggerated scour in the streambed near the banks or, in a relativelynarrow channel, across the entire channel. Stabilization of the streambed may alsoresult in exaggerated lateral scour in any size stream. Stabilization of the entirestream perimeter may result in downstream scour or failure of some portion of thecountermeasures used on either the stream bed or banks.
5.4.2 Local Scour
Local scour occurs in bridge openings at piers and abutments. In general, designalternatives against structural failure from local scour consist of measures whichreduce scour depth, such as pier shape and orientation, and measures which retaintheir structural integrity after scour reaches its maximum depth, such as placingfoundations in sound rock and using deep piling. Countermeasures which preventscour from occurring include riprap.
Abutments. Countermeasures for local scour at abutments consist of measureswhich improve flow orientation at the bridge end and move local scour away fromthe abutment, as well as revetments and riprap placed on spill slopes to resisterosion.
Guide banks (spur dikes) are earth or rock embankments placed at abutments.They are sometimes called spur dikes but this nomenclature can lead to confusionwith spurs which have a different configuration and are used to retard flow velocitiesand/or divert flow away from stream banks. Flow disturbances, such as eddies andcross-flow, will be eliminated where a properly designed and constructed guidebank is placed at a bridge abutment. Guide banks also protect the highwayembankment, reduce local scour at the abutment and adjacent piers, and movelocal scour to the end of the guide bank.
Local scour also occurs at abutments as a result of expanding flow downstream ofthe bridge. This is especially true of bridges on wide, wooded floodplains cleared forconstruction of the highway. Short guide banks extending to the tree line will movethis scour away from the abutment, and the trees will retard velocities so that flowredistribution can occur with minimal scour.
The effectiveness of guide banks is a function of stream geometry, the quantity offlow on the floodplain, and the size of bridge opening. A typical guide bank at a
Archive
d

bridge opening is shown in Figure 27.
Revetments may be pervious rock or rigid concrete. Rock riprap revetment providesan effective countermeasure against erosion on spill slopes [38]. Rigid revetmentshave been more successful where abutments are on the floodplain rather than instream channels because hydrostatic pressure behind the revetments is not usuallya problem. Precautions against undermining of the toe and upstream terminus of allrevetments are always required.
Where guide banks are used, local scour is located away from the abutment spillslope and revetment on the spill slope may not be necessary.
Other countermeasures have been successfully used to inhibit scour at abutmentswhere the abutment is located at the streambank or within the stream channel.These measures include dikes to constrict the width of braided streams and retardsto reduce velocities near the stream bank.
Figure 27. Typical guide bank layout and section (After [19]).
Piers. Three basic methods may be used to prevent damage from local scour atpiers. The first method is to place the foundation of the structure at such a depththat the structural stability will not be at risk with maximum scour. This must bedone on all new or replacement bridges [23]. The second is to provide protection ator below the stream bed to inhibit the development of a scour hole. The thirdmeasure is to prevent erosive vortices from forming or to reduce their strength andintensity. The first method is often expensive and there are uncertainties involved inestimating total scour at a pier, but it is the only measure that can be recommendedwithout reservation in the absence of other measures. It should be noted thatarmored stream beds, cemented material and shales will erode in time. Scourdepths in streams with these bed materials can be greater than in streams which
Archive
d

transport significant sediment loads. It should also bed noted that the thalweg ofalluvial channels shifts with time, sometimes moving from one side of the channel tothe other during a flood.
Streamlined pier noses decrease flow separation at the face of the pier, reducingthe strength of the horseshoe vortices which form at piers. Practical application ofthis principle involves the use of rounded or circular shapes at the upstream anddownstream faces of piers in order to reduce the flow separation. However, flowdirection can and does change with time and with stage on some streams. Piersoriented with flow direction at one stage or at one point in time may be skewed withflow direction at another. Also, flow direction changes with the passage of bedforms. In general, piers should be aligned with the main flow direction and skewangles greater than 5 degrees should be avoided. Where this is not possible, asingle cylindrical pier or a row of cylindrical columns will produce a lesser depth oflocal scour. For example, columns at a spacing of five diameters produce localscour about 1.2 times as deep as the local scour at a single column of equaldiameter.[25]. The tendency of a row of columns to collect debris should beconsidered in selecting this alternative. Debris can greatly increase scour depths.Webwalls have been used between columns to add to structural strength and toreduce the tendency to collect debris. These should be constructed at the elevationof stream flood stages which carry floating debris; otherwise, the row of columns willact as a solid pier if webwalls are extended to the elevation of the streambed.
Riprap is commonly used to inhibit local scour at piers at existing bridges. Thispractice is not recommended as an adequate substitute for foundations or pilinglocated below expected scour depths for new or replacement bridges. It isrecommended as a retrofit or interim measure where scour threatens the integrity ofa pier. The practice of heaping stones around a pier is not recommended except asan interim measure because experience has shown that continual replacement isusually required. Success rates have been better with alluvial bed materials wherethe top of the riprap was placed at or below the elevation of the streambed.
Piles (sheet, H beams or concrete) have been successfully used as a retrofitmeasure to lower the effective foundation elevation of structures where footings orpile caps have been exposed by scour. The piling is placed around the pile footingsand anchored to the pile cap or seal to retain or restore the bearing capacity of thefoundation. This will produce greater depth of scour, however.
Where sheet pile cofferdams are used during construction, the sheet piling shouldbe removed or cut off below the level of expected contraction scour in order to avoidcontributing to local scour. Cofferdams should not be much wider than the pier itselfsince the effect may be to greatly increase local scour depth. Leaving or removingcofferdams must be carefully evaluated because leaving a cofferdam that is higherthan the contraction scour elevation may increase local scour depth. Recent workby Jones [26] gives a method to evaluate the expected scour depths for cofferdams.
Archive
d

5.4.3 Temporary Countermeasures
Monitoring or closing a bridge during high flows and inspection after the flood maybe an effective temporary countermeasure. However, monitoring of bridges duringhigh flow may not determine that they are about to collapse from scour. It also maynot be practical to close the bridge during high flow because of traffic volume, no (orpoor) alternate routes, the need for emergency vehicles to use the bridge, etc.Under these circumstances, temporary scour countermeasures such as riprap couldbe installed. A temporary countermeasure installed at a bridge along withmonitoring during and inspection after high flows could provide for the security ofthe public without closing the bridge.
5.5 Countermeasures for Channel Braiding and Anabranching
Channel braiding occurs in streams with an overload of sediment, causing deposition andaggradation. As aggradation occurs, the slope of the channel increases, velocities increase,and multiple, interlaced channels develop. The overall channel system becomes wider andmultiple channels are formed as bars of sediment are deposited in the main channel. Braidingcan also occur where banks are easily eroded and there is a large range in discharge. Thechannel becomes wider at high flows, and low flow forms multiple interlaced channels. In ananabranched stream, flow is divided by islands rather than bars, and the anabranches are morepermanent than braided channels and generally convey more flow.
Meandering streams may change to a braided stream if slope is increased by channelstraightening or the dominant discharge is increased. Lane's [7] relation, Figure 8, may be usedto determine if there can be a shift from a meandering channel to a braided one. If, after achange in discharge or slope the stream still plots in the meandering zone, then it will remain ameandering stream. However, if it moves closer to or into the braided zone, then the streammay become braided.
Braided channels change alignment rapidly, and are very wide and shallow even at flood flow.They present problems at bridge sites because of the high cost of bridging the completechannel system, unpredictable channel locations and flow directions, and difficulties witheroding channel banks and in maintaining bridge openings unobstructed by bars and islands.
Countermeasures used on braided and anabranched streams are usually intended to confinethe multiple channels to one channel. This tends to increase sediment transport capacity in theprincipal channel and encourage deposition in secondary channels. These measures usuallyconsist of dikes constructed from the limits of the multiple channels to the channel over whichthe bridge is constructed. Guide banks at bridge ends used in combination with revetment onhighway fill slopes, riprap on highway fill slopes only, and spurs arranged in the streamchannels to constrict flow to one channel have also been used successfully.
Since anabranches are permanent channels that may convey substantial flow, diversion andconfinement of an anabranched stream is likely to be more difficult than for a braided stream.The designer may be faced with a choice of either building more than one bridge, building a
Archive
d

long bridge, or diverting anabranches into a single channel.
5.6 Countermeasures for Degradation and Aggradation
Gradation problems are common on alluvial streams. Degradation in streams can cause theloss of bridge piers in stream channels and can contribute to the loss of piers and abutmentslocated on caving banks. Aggradation causes the loss of waterway opening in bridges and,where channels become wider because of aggrading streambeds, overbank piers andabutments can be undermined. At its worst, aggradation may cause streams to abandon theiroriginal channels and establish new flow paths which may sever highways from the existingbridge.
5.6.1 Countermeasures to Control Degradation
Countermeasures used to control degradation include check dams and channellinings. Check-dams and structures which perform functions similar to check-damsinclude drop structures, cutoff walls, and drop flumes. A check-dam is a low dam orweir constructed across a channel to prevent degradation.
Channel linings of concrete and riprap have proved unsuccessful at stoppingdegradation. To protect the lining, a check-dam may have to be placed at thedownstream end to key it to the channel bed. Such a scheme would provide nomore protection than would a check dam alone, in which case the channel liningwould be redundant.
Bank erosion is a common hydraulic hazard in degrading streams. As the channelbed degrades, bank slopes become steeper and bank caving failures occur. TheU.S. Army Corps of Engineers found that longitudinal stone dikes, or rock toe-dikes,provided the most effective toe protection of all bank stabilization measures studiedfor very dynamic and/or actively degrading channels [39].
The following is a condensed list of recommendations and guidelines for theapplication of countermeasures at bridge crossings experiencing degradation:
Check-dams or drop structures are the most successful techniquefor halting degradation on small to medium streams.
●
Channel lining alone may not be a successful countermeasureagainst degradation problems.
●
Combinations of bulkheads and riprap revetment have beensuccessfully used to protect abutments where steep streambanksthreaten abutment fill slopes.
●
Riprap on channel banks and spill slopes will fail if unanticipatedchannel degradation occurs.
●
Archive
d

Successful pier protection involves providing deeper foundationsat piers and pile bents.
●
Jacketing piers with steel casings or sheet piles has also provedsuccessful where expected degradation extends only to the top ofthe original foundation.
●
The most economical solution to degradation problems at newcrossing sites on small to medium size streams is to minimize thenumber of piers in the flow channel and provide adequatefoundation depths. Adequate setback of abutments from slumpingbanks is also necessary.
●
Rock-and-wire mattresses are recommended for use only onsmall (<100 foot) channels experiencing lateral instability and littleor no vertical instability.
●
Longitudinal stone dikes placed at the toe of channel banks areeffective countermeasures for bank caving in degrading streams.Precautions to prevent outflanking, such as tiebacks to the banks,may be necessary where installations are limited to the vicinity ofthe highway stream crossing.
●
5.6.2 Countermeasures to Control Aggradation
Currently, measures used in attempts to alleviate aggradation problems athighways include channelization, debris basins, bridge modification, and/orcontinued maintenance, or combinations of these. Channelization may includeexcavating and clearing channels, constructing small dams to form debris basins,constructing cutoffs to increase the local slope, constructing flow control structuresto reduce and control the local channel width, and constructing relief channels toimprove flow capacity at the crossing. Except for debris basins and relief channels,these measures are intended to increase the sediment transport capacity of thechannel, thus reducing or eliminating problems with aggradation. Cutoffs must bedesigned with considerable study as they can cause erosion upstream anddeposition downstream. These studies would involve the use of sediment transportrelations given in [4] or the use of sediment transport models such as BRISTARS.The most common bridge modifications are increasing the bridge length by addingspans and increasing the effective flow area beneath the structure by raising thebridge deck.
A program of continuing maintenance has been successfully used to controlproblems at bridges on aggrading streams. In such a program, a monitoring systemis set up to survey the affected crossing at regular intervals. When somepreestablished deposition depth is reached, the bridge opening is dredged orcleared of the deposited material. In some cases, this requires opening a clearingafter every major flood. This solution requires surveillance and dedication to thecontinued maintenance of an adequate waterway under the bridge. Otherwise, it is
Archive
d

only a temporary solution. A debris basin or a deeper channel upstream of thebridge may be easier to maintain. Continuing maintenance is not recommended ifanalysis shows that other countermeasures are practicable.
Over the short term, maintenance programs prove to be very cost effective whencompared with the high cost of channelization, bridge alterations, or relocations.When costs over the entire life of the structure are considered, however,maintenance programs may cost more than some of the initially more expensivemeasures. Also, the reliability of maintenance programs is generally low becausethe programs are often abandoned for budgetary or priority reasons. However, aprogram of regular maintenance could prove to be the most cost efficient solution ifanalysis of the transport characteristics and sediment supply in a stream systemreveals that the aggradation problem is only temporary (perhaps the excesssediment supply is coming from a construction site) or will have only minor effectsover a relatively long period of time.
An alternative similar to a maintenance program which could be used on streamswith persistent aggradation problems, such as those on alluvial fans, is the use ofcontrolled sand and gravel mining from a debris basin constructed upstream of thebridge site. Use of this alternative would require careful analysis to ensure that thegravel mining did not upset the balance of sediment and water dischargesdownstream of the debris basin. Excessive mining could produce a degradationprofile downstream, potentially impacting the bridge or other structures.
Following is a list of guidelines regarding aggradation countermeasures:Extensive channelization projects have generally provenunsuccessful in alleviating general aggradation problems,although some successful cases have been documented. Asufficient increase in the sediment carrying capacity of the channelis usually not achieved to significantly reduce or eliminate theproblem. Channelization should be considered only if analysisshows that the desired results will be achieved.
●
Alteration or replacement of a bridge is often required toaccommodate maximum aggradation depths.
●
Maintenance programs have proved unreliable, but they providethe most cost-effective solution where aggradation is from atemporary source or on small channels where the problem islimited in magnitude.
●
At aggrading sites on wide, shallow streams, spurs or dikes withflexible revetment have been successful in several cases inconfining the flow to narrower, deeper sections.
●
A debris basin and controlled sand and gravel mining might be thebest solution at alluvial fans and other crossings with severeproblems.
●
Archive
d

5.7 Case Histories
Case histories of hydraulic problems at bridge sites are used in this section to provideinformation on the relative success of the various countermeasures used to stabilize streams.All case histories are taken from Brice et al. [2,40], and Brown et al.[28]. Site data are fromReport No. FHWA-RD-78-163 [2]. This compilation of case histories at 224 bridge sites isrecommended reference material for those responsible for selecting countermeasures forstream instability. Additional case histories are given in reference [4].
5.7.1 Flexible Revetment
Rock Riprap. Dumped rock riprap is the most widely used revetment in the UnitedStates. Its effectiveness has been well established where it is of adequate size, ofsuitable size gradation, and properly installed. Brice et al. documented the use ofrock riprap at 110 sites (Volume 1, Table 2) [1]. They rated the performance at 58sites and found satisfactory performance at 34 sites, partially satisfactoryperformance at 12 sites, and failure to perform satisfactorily at 12 sites. Keeleyconcluded that riprap used in Oklahoma performed without significant failure andprovides basic and efficient bank control on the meandering streams in Oklahoma[41].
A review of the causes of failure at the sites studied by Brice et al. is instructive(Volume 1, Table 3) [1]. They found the absence of a filter blanket clearly the causeof the failure at a site subject to tides and wave action. The riprap was placed on afill of sand and fine gravel which eroded through the interstices of the riprap.
Internal slope failure was the cause of failure of riprap at the abutment of bridges attwo sites. At one site, failure was attributed to saturation of a high fill by impoundedwater in a reservoir. Wave action also probably contributed to the failure. The othersite is difficult to include as a riprap failure because the rock was not placed asriprap revetment. Thirty-three freight car loads of rock were dumped as anemergency measure to stop erosion at a bridge abutment during high flow releasesfrom a reservoir. The rock was displaced, and the high streambanks and highwayfill are still susceptible to slumps. At both sites, riprap failed to prevent slumps inhigh fills.
Inadequate rock size and size gradation was given as the cause of failure at eightsites. All of these sites are complex, and it is difficult to assign failure to one cause,but rock size was definitely a factor.
Channel degradation accounted for failure at three sites in Mississippi. Channeldegradation at these sites is due to channel straightening and clearing by the SoilConservation Service and U.S. Army Corps of Engineers. Riprap installations onthe streambanks, at bridge abutments and in the stream bed have failed to stop
Archive
d

lateral erosion. At one site, riprap placed on the banks and bed of the streamresulted in severe bed scour and bank erosion downstream of the riprap.
Failure of riprap at one site was attributed to the steep slope on which the riprapwas placed. At this site, rock riprap failed to stop slumping of the steep banksdownstream of a check dam in a degrading stream.
Successful rock riprap installations at bends were found at five sites. Bank erosionwas controlled at these sites by rock riprap alone. Installations rated as failing weredamaged at the toe and upstream end, indicating inadequate design and/orconstruction, and damage to an installation of rounded boulders, indicatinginadequate attention to riprap specifications. Other successful rock riprap studysites were sites where bank revetment was used in conjunction with othercountermeasures, such as spurs or retards. The success of these installations wasattributed more to the spurs or retards, but the contribution of the bank revetmentwas not discounted.
Broken Concrete. Broken concrete is commonly used in emergencies and whererock is unavailable or very expensive. No specifications were found for its use.Performance was found to be more or less unsatisfactory at three sites.
Rock-and-Wire Mattress and Gabions. The distinction made between rock-and-wiremattress and gabions is in the dimensions of the devices. Rock-and-wire mattressis usually one foot or less in thickness and a gabion is thicker and nearlyequidimensional. The economic use of rock-and-wire mattress is favored by an aridclimate, availability of stones of cobble size, and unavailability of rock for dumpedrock riprap. Corrosion of wire mesh is slow in arid climates, and ephemeral streamsdo not subject the wire to continuous abrasion. Where large rock is not available,the use of rock-and-wire mattress may be advantageous in spite of eventualcorrosion or abrasion of the wire.
Rock-and-wire mattress performance was found to be generally satisfactoryalthough local failure of the wire mesh and spilling out of the rock was notuncommon. Mattresses are held in place against the bank by railroad rails at sitesin New Mexico and Arizona where good performance was documented. This isknown locally as "railbank protection." The steel rail supported rock-and-wiremattress stays in place better than dumped rock riprap on the unstable verticalbanks found on the ephemeral streams of this area. Mattress held in place bystakes has been found to be effective in Wyoming.
The use of rock-and-wire mattress has diminished in California because of thequestionable service of wire mesh, the high cost of labor for installation, and theefficiency of modern methods of excavating for dumped riprap toe protection. TheLos Angeles Flood Control District, however, has had installations in-place for 15years or more with no evidence of wire corrosion. On the other hand, Montana andMaryland reported abrasion damage of wire. These experiences illustrate thateconomic use of countermeasures is dependent on the availability of materials,costs, and the stream environment in which the measure is placed.
Archive
d

Several sites were identified where gabions were installed, but thecountermeasures had been tested by floods at only one site where gabions placedon the downstream slope of a roadway overflow section performed satisfactorily.
Other Flexible Revetment. Favorable performance of precast-concrete blocks atbridges was reported in Louisiana. Vegetation is reported to grow between blocksand contribute to appearance and stability. Vegetation apparently is seldom usedalone at bridges. Iowa relies on sod protection of spur dikes, but Arkansas reportedfailure of sod as bank protection.
5.7.2 Rigid Revetments
Failure of rigid revetment tends to be progressive; therefore, special precautions toprevent undermining at the toe and termini and failure from unstable soils orhydrostatic pressure are warranted.
Concrete Pavement. Well-designed concrete paving is satisfactory as fill sloperevetment, as revetment on streams having low gradients, and in othercircumstances where it is well protected against undermining at the toe and ends.The case histories include at least one location where riprap launching aprons weresuccessful in preventing undermining at the toe from damaging the concretepavement revetment [1,2]. Weep holes for relief of hydrostatic pressure are requiredfor many situations.
Documented causes of failure in the case histories are undermining at the toe (sixsites), erosion at termini (five sites), eddy action at downstream end (two sites),channel degradation (two sites), high water velocities (two sites), overtopping (twosites), and hydrostatic pressure (one site). Good success is reported with concreteslope paving in Florida, Illinois, and Texas.
Sacked Concrete. No highway agency reported a general use of sacked concreteas revetment. California was reported to regard this as an expensive revetmentalmost never used unless satisfactory riprap was not available. Sacked concreterevetment failures were reported from undermining of the toe (two sites), erosion attermini (one site), channel degradation (two sites), and wave action (one site).
Concrete-Grouted Riprap. Concrete-grouted riprap permits the use of smaller rock,a lesser thickness, and more latitude in gradation of rock than in dumped rockriprap. No failures of grouted riprap were documented in the case histories, but it issubject to the same types of failures as other rigid revetments.
Concrete-Filled Fabric Mat. Concrete-filled fabric mat is a patented product(Fabriform) consisting of porous, pre-assembled nylon fabric forms which areplaced on the surface to be protected and then filled with high-strength mortar byinjection. Variations of Fabriform and Fabricast consist of nylon bags similarly filled.
Archive
d
Successful installations were reported by the manufacturer of Fabriform in Iowa,and North Dakota reported successful installations.
Soil Cement. In areas where any type of riprap is scarce, use of in-place soilcombined with cement provides a practical alternative. The resulting mixture, soilcement, has been successfully used as bank protection in many areas of theSouthwest. Unlike other types of bank revetment, where milder side slopes aredesirable, soil cement in a stairstep construction can be used on steeper slopes(i.e., typically one to one), which reduces channel excavation costs. For manyapplications, soil cement is generally more aesthetically pleasing than other types ofrevetment.
5.7.3 Bulkheads
A bulkhead is a steep or vertical wall used to support a slope and/or protect it fromerosion. Bulkheads usually project above ground, although the distinction betweenbulkheads and cutoff walls is not always sharp. Most bulkhead applications werefound at abutments. They were found to be most useful at the following locations:(1) on braided streams with erodible sandy banks, (2) where banks or abutment fillslopes have failed by slumping, and (3) where stream alignment with the bridgeopening was poor, to provide a transition between streambanks and the bridgeopening. It was not clear what caused failures at five sites summarized in [1,2], butin each case, the probable cause was undermining .
5.7.4 Spurs
Spurs are permeable or impermeable structures which project from the bank intothe channel. Spurs may be used to alter flow direction, induce deposition, or reduceflow velocity. A combination of these purposes is generally served. Where spursproject from embankments to decrease flow along the embankment, they are calledembankment spurs. These may project into the floodplain rather than the channel,and thus function as spurs only during overbank flow. According to a summaryprepared by Richardson and Simons[42], spurs may protect a stream bank at lesscost than riprap revetment, and by deflecting current away from the bank andcausing deposition, they may more effectively protect banks from erosion thanrevetment . Uses other than bank protection include the constriction of long reachesof wide, braided streams to establish a stable channel, constriction of short reachesto establish a desired flow path and to increase sediment transport capacity, andcontrol of flow at a bend. Where used to constrict a braided stream to a narrow flowchannel, the structure may be more correctly referred to as a dike or a retard insome locations.
Archive
d

Several factors enter into the performance of spurs, such as permeability,orientation, spacing, height, shape, length, construction materials, and the streamenvironment in which the spur is placed.
Impermeable Spurs. The case histories show good success with well-designedimpermeable spurs at bends and at crossings of braided stream channels (eightsites). At one site, hardpoints barely projecting into the stream and spaced at about100 to 150 feet failed to stop bank erosion at a severe bend. At another site, spursprojecting 40 feet into the channel, spaced at 100 feet, and constructed of rock witha maximum diameter of 1.5 feet experienced erosion between spurs and erosion ofthe spurs. At a third site, spurs constructed of timber piling filled with rock weredestroyed. Failure was attributed to the inability to get enough penetration in thesand bed channel with timber piles and the unstable wide channel in which thethalweg wanders unpredictably. Spurs (or other countermeasures) are not likely tobe effective over the long term in such an unstable channel unless well-designed,well-built, and deployed over a substantial reach of stream. Although no failuresfrom ice damage were cited for impermeable spurs, North Dakota uses steel sheetpile enclosed earth fill spurs because of the potential for ice damage. At one site,such a spur sustained only minor damage from 2.5 feet of ice.
Permeable Spurs. A wide variety of permeable spur designs were also shown tosuccessfully control bank erosion by the case histories. Failures were experiencedat a site which is highly unstable with rapid lateral migration, abundant debris, andextreme scour depths. Bank revetments of riprap and car bodies and debrisdeflectors at bridge piers, as well as bridges, have also failed at this site. At anothersite, steel H-pile spurs with wire mesh have partially failed on a degrading stream.
5.7.5 Retardance Structures
A retardance structure (retard) is a permeable or impermeable linear structure in achannel, parallel with and usually at the toe of the bank. The purposes ofretardance structures are to reduce flow velocity, induce deposition, or to maintainan existing flow alignment. They may be constructed of earth, rock, timber pile,sheet pile, or steel pile, and steel jacks or tetrahedrons are also used.
Most retardance structures are permeable and most have good performancerecords. They have proved to be useful in the following situations: (1) for alignmentproblems very near a bridge or roadway embankment, particularly those involvingrather sharp channel bends and direct impingement of flow against a bank (tensites), and (2) for other bank erosion problems that occur very near a bridge,particularly on streams that have a wandering thalweg or very unstable banks(seven sites).
The case histories [1,2] include a site where a rock retardance structure similar to arock toe dike was successful in protecting a bank on a highly unstable channel
Archive
d

where spurs had failed. There were, however, deficiencies in the design andconstruction of the spur installation. At another site, a rock retardance structuresimilar to a rock toe-dike has reversed bank erosion at a bend in a degradingstream. The U.S. Army Corps of Engineers reported that longitudinal rock toe dikeswere the most effective bank stabilization measure studied for channels having verydynamic and/or actively degrading beds [39].
5.7.6 Dikes
Dikes are impermeable linear structures for the control or containment of overbankflow. Most are in floodplains, but they may be within channels, as in braidedstreams or on alluvial fans. Dikes at study sites were used to prevent flood waterfrom bypassing a bridge at four sites, or to confine channel width and maintainchannel alignment at two sites. Performance of dikes at study sites was judgedgenerally satisfactory.
5.7.7 Guide Banks
The major use of guide banks (formerly referred to as spur dikes) in the UnitedStates is to prevent erosion by eddy action at bridge abutments or piers whereconcentrated flood flow travelling along the upstream side of an approachembankment enters the main flow at the bridge. By establishing smooth parallelstreamlines in the approaching flow, guide banks improve flow conditions in thebridge waterway. Scour, if it occurs, is near the upstream end of the dike away fromthe bridge. A guide bank differs from dikes described above in that a dike isintended to contain overbank flow while a guide bank only seeks to align overbankflow with flow through the bridge opening. An extension of the usual concept of thepurpose for guide banks, but not in conflict with that concept, is the use of guidebanks and highway fill to constrict braided channels to one channel. At three sitesstudied [1,2], guide banks only or guide banks plus revetment on the highway fillwere used to constrict wide braided channels rather severely, and the installationshave performed well.
Guide bank performance was found to be generally satisfactory at all study sites.Performance is theoretically affected by construction materials, shape, orientation,and length.
Most guide banks are constructed of earth with revetment to inhibit erosion of thedike. At two sites, guide banks of concrete rubble masonry performed well.Revetment of riprap is most common, but concrete revetment with rock riprap toeprotection, rock-and-wire mattress, gabions, and grass sod have also performedsatisfactorily. Since partial failure of a guide bank during a flood usually will not
Archive
d

endanger the bridge, wider consideration should be given to the use of vegetativecover for protection. Partial failure of any countermeasure is usually of littlesignificance so long as the purpose of protecting the highway stream crossing isaccomplished.
Guide banks of elliptical shape, straight, and straight with curved ends performedsatisfactorily at study sites, although there is evidence at one site that flow does notfollow the nose of the straight guide bank. Clear evidence of the effect of guidebank orientation was not found at study sites although the conclusion by Colsonand Wilson that guide banks should be oriented with valley flow for skewedcrossings of wooded floodplains was cited [43]. There was evidence at one site thata guide bank may be severely tested where a large flow is diverted along theroadway embankment, as at a skewed crossing or on a wide floodplain which isseverely constricted by the bridge. At these locations, embankment spurs may beadvisable to protect the embankment from erosion and to reduce the potential forfailure of the guide bank.
Guide banks at study sites tended to be longer than recommended by Bradley [19]at most sites, except at five sites where they ranged from 15 to 75 feet. All guidebanks appeared to perform satisfactorily. Not enough short guide banks wereincluded in the study to reach conclusions regarding length [1,2].
5.7.8 Check Dams
A check dam is a low weir or dam across a channel for the control of water stage orvelocity, or to stop degradation from progressing upstream. They may beconstructed of concrete, rock, sheet pile, rock-and-wire mattress, gabions, orconcrete-filled fabric mat. They are usually used to stop degradation in the channelin order to protect the substructure foundation of bridges. At one site, however, acheck dam was apparently used to inhibit contraction scour in a bridge waterway.The problem with vertical scour was resolved, but lateral scour became a problemand riprap revetment on the streambanks failed [1,2].
Scour downstream of check dams was found to be a problem at two sites,especially lateral erosion of the channel banks. Riprap placed on the streambanksat the scour holes also failed, at least in part because of the steep slopes on whichthe riprap was placed. At the time of the study, lateral erosion threatened damageto bridge abutments and highway fills. At another site, a check dam placed at themouth of a tributary stream failed to stop degradation in the tributary and thedelivery of damaging volumes of sediment to the main stream just upstream of abridge.
No structural failure of check dams was documented. Failures are known to haveoccurred, however, and the absence of documented failures should not be givenundue weight. Failure can occur by bank erosion around the ends of the structure
Archive
d
resulting in outflanking; by seepage or piping under or around the structure resultingin undermining and structural or functional failure; by overturning, especially afterdegradation of the channel downstream of the structure; by bending of sheet pile;by erosion and abrasion of wire fabric in gabions or rock-and-wire mattress; or byany number of structural causes for failure.
5.7.9 Jack or Tetrahedron Fields
Jacks and tetrahedrons function as flow control measures by reducing the watervelocity along a bank, which in turn results in an accumulation of sediment and theestablishment of vegetation. Steel jacks, or Kellner jacks which consist of sixmutually perpendicular arms rigidly fixed at the midpoints and strung with wire arethe most commonly used. Tetrahedrons apparently are not currently used byhighway agencies. Jacks are usually deployed in fields consisting of rows of jackstied together with cables.
Four sites where steel jack fields were used are included in the case histories [1,2].At two sites, the jack fields performed satisfactorily. Jacks were buried in thestreambed and rendered ineffective at one site, and jacks were damaged by ice atone site, but apparently continued to perform satisfactorily. From Keeley'sobservations [41] of the performance of jack fields used in Oklahoma and findingsof the study of countermeasures by Brice et al. [1], the following conclusions werereached regarding performance:
The probability of satisfactory performance of jack fields is greatlyenhanced if the stream transports small floating debris andsediment load in sufficient quantity to form accumulations duringthe first few years after construction.
●
Jack fields may serve to protect an existing bank line, or to alterthe course of a stream if the stream course is realigned and theformer channel backfilled before the jack field is installed.
●
On wide shallow channels, which are commonly braided, jackfields may serve to shift the bank line channelward if jacks of largedimensions are used.
●
5.7.10 Special Devices for Protection of Piers
Countermeasures at piers have been used to combat abrasion of piers, to deflectdebris, to reduce local scour, and to restore structural integrity threatened by scour.Retrofit countermeasures installed after problems develop are common. The usualcountermeasure against abrasion consists of steel armor on the upstream face of apier in the area affected by bed load. At one site, a pointed, sloping nose on amassive pier, called a special "cutwater" design, and a concrete fender debris
Archive
d
deflector has functioned to prevent debris accumulation at the pier. At another site,a steel rail debris deflector worked until channel degradation caused allcountermeasures to fail.
Countermeasures for local scour at piers are discussed above, except for ameasure installed on a bridge over an estuary in Florida where about 37 feet ofscour had occurred. This measure consists of flat plates installed around piers todeflect plunging currents. The plates are 8 feet in diameter and are installed around20 feet diameter piles. It was recommended that the plates be installed at or slightlybelow the elevation of the stream bed, but strong tidal currents preventedunderwater installation at uniform locations. Two years after installation, somedeposition had occurred but performance could not be judged.
Countermeasures used to restore structural integrity of bridge foundations includedin the case histories include underpinning, sheet pile driven around the pier, andgrout curtain around pier foundation.
5.7.11 Investment in Countermeasures
While it is often possible to predict that bank erosion will occur at or near a givenlocation in an alluvial stream, one can frequently be in error about the location ormagnitude of potential erosion. At some locations, unexpected lateral erosionoccurs because of a large flood, a shifting thalweg, or from other actions of thestream or activities of man. Therefore, where the investment in a highway crossingis not in imminent danger of being lost, it is often prudent to delay the installation ofcountermeasures until the magnitude and location of the problem becomes obvious.In many, if not most, of the case histories collected by Brice et al., highwayagencies invested in countermeasures after a problem developed rather than inanticipation of a problem [1,2,40].
Go to Chapter 6 Archive
d

6.0 Countermeasure Design
Go to Appendix A
6.1 Introduction
Chapters 2.0 through 4.0 of this manual discuss factors influencing stream stability and response. For stream stability problems whichadversely impact highway crossings, specific countermeasure recommendations were made in Chapter 5.0. In this chapter, thedesign of these specific countermeasures is discussed with references to appropriate design documents.
This chapter discusses in detail the design of three basic countermeasures: 1) Spurs; 2) Guide Banks (often referred to as SpurDikes); and 3) Check Dams. Respectively, these three countermeasures are used to: 1) protect banks and redirect flow in the vicinityof the highway crossing; 2) channelize and direct flows through the bridge opening; and 3) control degradation (either long-term orcontraction scour) and maintain the bed elevation at the bridge opening. With these countermeasures, most adverse impacts onhighway crossings can be controlled.
In some cases other countermeasures may be required. Therefore, a separate section for the conceptual design of othercountermeasures is also presented. Details of the design of these other countermeasures are not given, but a schematic andreferences are provided, where available.
6.2 General Design Guidelines
The objective of highway agencies at crossings of streams is to protect highway users and the investment in the highway facility, andto avoid causing damage to other properties, to the extent practicable. Countermeasures should be designed and installed to stabilizeonly a limited reach of stream and to ensure the structural integrity of highway components in an unstable stream environment.Countermeasures are often damaged or destroyed by the stream, and stream banks and beds often erode at locations where nocountermeasure was installed, but so long as the primary objectives are achieved in the short-term as a result of countermeasureinstallation, the countermeasure installation can be deemed a success. Therefore, the highway agency's interest in stream stabilityoften entails long-term protection of costly structures by committing to maintenance, reconstruction, and construction of additionalcountermeasures as the response of streams and rivers to natural and man-induced changes are identified.
The design of any countermeasure for the protection of highway crossings requires the designer to be cognizant of the factors whichaffect stream stability and the morphology of the stream. In most cases, the installation of any countermeasure will cause the bed andbanks to respond to the change in hydraulic conditions imposed by the countermeasure. Thus, the analysis procedures outlined andillustrated in Chapter 4.0 are a necessary prerequisite to the detailed design of specific countermeasures provided in this chapter. Thegoal in any countermeasure design is to achieve a response which is beneficial to the protection of the highway crossing and tominimize adverse effects either upstream or downstream of the crossing.
Archive
d

In many cases, a combination of two or more countermeasures are required due to site-specific problems or as a result of changingconditions after the initial installation. The great number of possible countermeasure combinations makes it impractical to suggestdesign procedures for combined countermeasures. However, combined countermeasures should complement each other. That is tosay that the design of one countermeasure must not adversely impact on another or the overall protection of the highway crossing.The principles of river mechanics, as discussed in [4] and in Chapters 2.0 through 4.0 of this text, coupled with sound engineeringjudgment should be used to design countermeasure strategies involving two or more countermeasures.
6.3 Spurs
A spur is a pervious or impervious structure projecting from the streambank into the channel. Spurs are used to deflect flowing wateraway from, or to reduce flow velocities in critical zones near the stream bank, to prevent erosion of the bank, and to establish a moredesirable channel alignment or width. The main function of spurs is to reduce flow velocities near the bank, which in turn, encouragessediment deposition due to these reduced velocities. Increased protection of banks can be achieved over time, as more sediment isdeposited behind the spurs. Because of this, spurs may protect a streambank more effectively and at less cost than revetments.Furthermore, by moving the location of any scour away from the bank, partial failure of the spur can often be repaired before damageis done to structures along and across the stream.
Spurs are generally used to halt meander migration at a bend. They are also used to channelize wide, poorly defined streams intowell-defined channels. The use of spurs to establish and maintain a well-defined channel location, cross section, and alignment inbraided streams can decrease the required bridge lengths, thus decreasing the cost of bridge construction and maintenance.
Spur types are classified based upon their permeability as retarder spurs, retarder/deflector spurs, and deflector spurs. Thepermeability of spurs is defined simply as the percentage of the spur surface area facing the stream flow that is open. Deflector spursare impermeable spurs which function by diverting the primary flow currents away from the bank. Retarder/deflector spurs arepermeable and function by retarding flow velocities at the bank and diverting flow away from the bank. Retarder spurs are morepermeable and function by retarding flow velocities near the bank.
Table 7 can be used as an aid in the selection of an appropriate spur type for a given situation [6]. The primary factors influencing theselection of a specific spur type are listed across the top, and primary spur types are evaluated in terms of those selection criteria. Ascale from 1 to 5 is used to indicate the applicability of a specific spur for a given condition. A value of 1 indicates a disadvantage inusing that spur type for a given condition, and a value of 5 indicates a definite advantage. The table can be used by summing valueshorizontally for given site conditions to select the best spur type for the specific site. It should be recognized however, that adherenceto the results of such a procedure assigns equal weight to each of the factors listed across the top of the table and places unduereliance on the accuracy and relative merit of values given in the rating table. It is possible that assigned values of 1 should havebeen negative and assigned values of 5 should not be assigned quantitative significance. It is recommended that values given in thetable be used only for a qualitative evaluation of expected performance. Spur type selection should be based on the results of thisevaluation as well as estimated costs, availability of materials, construction and maintenance requirements, and experience with thestream in which the spur installation is to be placed.
Table 7. Spur type performance (After [6]).
Archive
d

Spur Type Function ErosionMechanism
SedimentEnvironment Flow Environment Bend
RadiusIce/Debris
Environment
Velocity Stage
RetarderFence TypeJack/Tetrahedron
3 2 23 3 1
3 3* 1 13 3 1 1
4 3 24 3 1
3 3 23 2 1
3 2 13 2 1
3 2 13 2 1
3 3 22 4 1
Retarder/DeflectorLight FenceHeavy Diverter
3 3 33 4 4
3 3 2 23 3 4 3
3 3 22 3 3
3 3 23 3 2
3 3 23 4 4
3 3 23 3 2
3 4 23 4 3
DeflectorHardpointTransverse Dike
3 4 43 4 4
3 3 3 43 3 3 4
2 3 42 3 4
3 3 43 3 4
3 3 23 3 2
3 4 43 4 3
3 3 53 3 5
*Henson spur jetties are rated a 4 for this condition
1. Definite disadvantage to the use of this type structure.2. Some disadvantage to the use of this type structure.3. Adequate for condition.4. Some advantage to the use of this type structure.5. Significant advantage to the use of this type structure.
6.3.1 Design Considerations
Spur design includes setting the limits of bank protection required; selection of the spur type to be used; and design of thespur installation including spur length, orientation, permeability, height, profile, and spacing.
Longitudinal Extent of Spur Field. The longitudinal extent of channel bank requiring protection is discussed in [38]. Figure28 was developed from U.S.Army Corps of Engineers studies of the extent of protection required at meander bends [39].The minimum extent of bank protection determined from Figure 28 should be adjusted according to field inspections todetermine the limits of active scour, channel surveys at low flow, and aerial photography and field investigations at high
Archive
d

flow. Investigators of field installations of bank protection have found that protection commonly extends farther upstreamthan necessary and not far enough downstream. However, such protection may have been necessary at the time ofinstallation. The lack of a sufficient length of protection downstream is generally more serious, and the downstreammovement of meander bends should be considered in establishing the downstream extent of protection.
Figure 28. Extent of protection required at a channel bend (After [39]).
Spur Length. Spur length is taken here as the projected length of spur normal to the main flow direction or from the bank.Where the bank is irregular, spur lengths must be adjusted to provide for an even curvature of the thalweg. The length ofboth permeable and impermeable spurs relative to channel width affects local scour depth at the spur tip and the length ofbank protected. Laboratory tests indicate that diminishing returns are realized from spur lengths greater than 20 percent ofchannel width. The length of bank protected measured in terms of projected spur length (LBP/PL) is essentially constantup to spur lengths of 20 percent of channel width for permeable and impermeable spurs. Field installations of spurs havebeen successful with lengths from 3 to 30 percent of channel width. Impermeable spurs are usually installed with lengthsof less than 15 percent while permeable spurs have been successful with lengths up to 25 percent of channel width.However, only the most permeable spurs were effective at greater lengths.
The above discussion assumes that stabilization of the bend is the only objective when spur lengths are selected. It alsoassumes that the opposite bank will not erode. Where flow constriction or changing the flow path is also an objective, spurlengths will depend on the degree of constriction required or the length of spur required to achieve the desired change inflow path. At some locations, channel excavation on the inside of the bend may be required where spurs would constrict
Archive
d

the flow excessively. However, it may be acceptable to allow the stream to do its own excavation if it is located inuniformly graded sand.
Spur Orientation. Spur orientation refers to spur orientation with respect to the direction of the main flow current in achannel. Figure 29 defines the spur angle such that an acute spur angle means that the spur is angled in an upstreamdirection and an angle greater than 90 degrees indicates that the spur is oriented in a downstream direction.
Figure 29. Definition sketch for spur angle (After [44]).
Permeable retarder spurs are usually designed to provide flow retardance near the stream bank, and they perform thisfunction equally as well without respect to the spur angle. Since spurs oriented normal to the bank and projecting a givenlength into the channel are shorter than those at any other orientation, all retarder spurs should be constructed at 90degrees with the bank for reasons of economy.
No consensus exists regarding the orientation of permeable retarder/deflector spurs and impermeable deflector spurs.There is some agreement that spurs oriented in an upstream direction do not protect as great a length of channel bankdownstream of the spur tip, result in greater scour depth at the tip, and have a greater tendency to accumulate debris andice. There is also some agreement that the first spur in an array should be at a spur angle of approximately 150 degreesin order to provide more gradual flow transition through the bend [44].
Spur orientation affects spur spacing, the degree of flow control achieved by the spur, and scour depth at the tip of thespur. Scour depth at the tip of impermeable spurs and retarder/deflector spurs with permeability of 35 percent or lessoriented normal to the channel bank can be estimated by use of Figure 30. This graph, which extends to a limiting value ofa/Y1 < 25 is based on laboratory studies and represents the equilibrium depth of scour for spurs oriented normal to thewall of the flume. Maximum scour depth can be as much as 30 percent greater than equilibrium scour depth. The curve
Archive
d

representing values of a/Y1 > 25 was taken from data collected at rock spurs in the Mississippi River and is believed torepresent the limit in scale for scour depths. For the equations on this figure, Ys is the equilibrium scour depth measuredfrom the mean stream bed elevation, Y1 is the flow depth upstream, Fr1 is the upstream Froude number, and, a is the spurlength measured normal to the wall of the flume. It should be noted that available information on the depth of scour atspurs is based on sand bed streams. In gravel bed streams, armoring of the scour hole by selective transport of materialforming the stream bed will reduce the depth of scour.
Spur orientation at approximately 90 degrees has the effect of forcing the main flow current (thalweg) farther from theconcave bank than spurs oriented in an upstream or downstream direction. Therefore, more positive flow control isachieved with spurs oriented approximately normal to the channel bank. Spurs oriented in an upstream direction causegreater scour than if oriented normal to the bank, and spurs oriented in a downstream direction cause less scour.
It is recommended that the spur furthest upstream be angled downstream to provide a smoother transition of the flow linesnear the bank and to minimize scour at the nose of the leading spur. Subsequent spurs downstream should all be setnormal to the bank line to minimize construction costs.
Figure 30. Recommended prediction curves for scour at the end of spurs withpermeability up to about 35 percent (After [4]).
Figure 31 can be used to adjust scour depth for orientation. It should be noted that permeability also affects scour depth.A method to adjust scour depth for permeability is presented in the following section.
The lateral extent of scour is nearly always determinable from the depth of scour and the natural angle of repose of thebed material.
Archive
d

The expansion angle downstream of a spur, i.e., the angle of flow expansion downstream of the contraction at the spur isabout 17 degrees for impermeable spurs for all spur angles. The implication is that spur orientation affects the length ofbank protected only because of the projected length of the spur along the channel bank.
Figure 31. Scour adjustment for spur orientation (Modified from [4]).
Spur Permeability. The permeability of the spur depends on stream characteristics, the degree of flow retardance andvelocity reduction required, and the severity of the channel bend. Impermeable spurs can be used on sharp bends todivert flow away from the outer bank. Where bends are mild and only small reductions in velocity are necessary, highlypermeable retarder spurs can be used successfully. However, highly permeable spurs can also provide required bankprotection under more severe conditions where vegetation and debris will reduce the permeability of the spur withoutdestroying the spur. This is acceptable provided the bed load transport is high.
Scour along the stream bank and at the spur tip are also influenced by the permeability of the spur. Impermeable spurs, inparticular, can create erosion of the streambank at the spur root. This can occur if the crest of impermeable spurs arelower than the height of the bank. Under submerged conditions, flow passes over the crest of the spur generallyperpendicular to the spur as illustrated in Figure 32. Laboratory studies of spurs with permeability greater than about 70percent were observed to cause very little bank erosion, while spurs with permeability of 35 percent or less caused bankerosion similar to the effect of impermeable spurs [44].
Figure 33 illustrates the effect of spur permeability on relative scour depth at various spur orientations with the channelbank. Spur angles are measured from the bank upstream of the spur to the centerline of the spur. This graph was derivedfrom laboratory studies which relate spur permeability to scour depth relative to depths for an impermeable spur setperpendicular to the bank.
Archive
d

Figure 32. Flow components in the vicinity of spurs when the crest is submerged (After [44]).
Tests were conducted with projected spur lengths equal to 20 percent of the channel width. If the permeability of spurs isless than 35 percent, Figures 30 and 31, from the previous section should be used to evaluate the scour depth. If thepermeability of the spurs being designed is greater than 35 percent, Figure 33 should be used to adjust scour depthsobtained from Figure 30 presented in the previous section.
Permeability up to about 35 percent does not affect the length of channel bank protected by the spur. Above apermeability of 35 percent, the length of bank protected decreases with increasing permeability. Figure 34 shows theresults of laboratory tests of the effects of permeability and orientation on the expansion angle of flow downstream ofspurs. For this figure, spur lengths were 20 percent of the channel width projected normal to the bank [44].
Archive
d

Figure 33. Plot of spur permeability and orientation vs. relative scour depth atthe spur tip (After [44]).
From the above discussion, it is apparent that spurs of varying permeability will provide protection against meandermigration. Impermeable spurs provide more positive flow control but cause more scour at the toe of the spur and, whensubmerged, cause erosion of the streambank. High permeability spurs are suitable for use where only small reductions inflow velocities are necessary as on mild bends, but can be used for more positive flow control where it can be assumedthat clogging with small debris will occur and bed load transport is large. Spurs with permeability up to about 35 percentcan be used in severe conditions but permeable spurs may be susceptible to damage from large debris and ice.
Archive
d

Figure 34. Spur permeability and spur orientation vs. expansion angle (After [44]).
Spur Height and Crest Profile. Impermeable spurs are generally designed not to exceed the bank height because erosionat the end of the spur in the overbank area could increase the probability of outflanking at high stream stages. Wherestream stages are greater than or equal to the bank height, impermeable spurs should be equal to the bank height. If floodstages are lower than the bank height, impermeable spurs should be designed so that overtopping will not occur at thebank. Bank erosion is more severe if the spur is oriented in the downstream direction.
The crest of impermeable spurs should slope downward away from the bank line, because it is difficult to construct andmaintain a level spur of rock or gabions. Use of a sloping crest will avoid the possibility of overtopping at a low point in thespur profile, which could cause damage by particle erosion or damage to the streambank.
Permeable spurs, and in particular those constructed of light wire fence, should be designed to a height that will allowheavy debris to pass over the top. However, highly permeable spurs consisting of jacks or tetrahedrons are dependent onlight debris collecting on the spur to make them less permeable. The crest profile of permeable spurs is generally levelexcept where bank height requires the use of a sloping profile.
Bed and Bank Contact. The most common causes of spur failure are undermining and outflanking by the stream. Theseproblems occur primarily in highly alluvial streams that experience wide fluctuations in the channel bed. Impermeable rockriprap spurs and gabion spurs can be designed to counter erosion at the toe by providing excess material on the streambed as illustrated in Figures 35 and 36. As scour occurs, excess material is launched into the scour hole, thus protectingthe end of the spur. Gabion spurs are not as flexible as riprap spurs and may fail in very dynamic alluvial streams.
Archive
d

Permeable spurs can be similarly protected as illustrated in Figure 37. The necessity for using riprap on the full length ofthe spur or any riprap at all is dependent on the erodibility of the stream bed, the distance between the slats and thestream bed, and the depth to which the piling are driven. The measure illustrated would also be appropriate as a retrofitmeasure at a spur that has been severely undermined, and as a design for locations at which severe erosion of the toe ofthe stream bank is occurring.
Piles supporting permeable structures can also be protected against undermining by driving piling to depths below theestimated scour. Round piling are recommended because they minimize scour at their base.
Extending the facing material of permeable spurs below the streambed also significantly reduces scour. If the retarderspur or retarder/deflector spur performs as designed, retardance and diversion of the flow within the length of the structureshould make it unnecessary to extend the facing material the full depth of anticipated scour except at the toe.
A patented Henson spur, as illustrated in Figure 38, and marketed by Hold That River, Inc. of Houston, Texas maintainscontact with the stream bed by vertical wood slats mounted on pipes which are driven to depths secure from scour. Theunits slide down the pipes where undermining occurs. Additional units can be added on top as necessary.
Archive
d

Figure 35. Launching of stone toe protection on a riprap spur: (a) before launching at low flow, (b)during launching at high flow, and (c) after scour subsides (After [44]).Arch
ived

Figure 36. Gabion spur illustrating flexible mat tip protection: (a) before launching at low flow, (b)during launching at high flow, and (c) after scour subsides (After [44]).Arch
ived

Figure 37. Permeable wood-slat fence spur showing launching of stone toe material (After [44]).
Figure 38. Henson spurs (a) resting on original channel bed, and (b) after drop in channelbed level (After [44]).
Spur Spacing. Spur spacing is a function of spur length, spur angle, permeability, and the degree of curvature of the bend.The flow expansion angle, or the angle at which flow expands toward the bank downstream of a spur, is a function of spurpermeability and the ratio of spur length to channel width. This ratio is susceptible to alteration by excavation on the insideof the bend or by scour caused by the spur installation. Figure 39 indicates that the expansion angle for impermeablespurs is an almost constant 17 degrees. Spurs with 35 percent permeability have almost the same expansion angleexcept where the spur length is greater than about 18 percent of the channel width.
As permeability increases, the expansion angle increases, and as the length of spurs relative to channel width increases,the expansion angle increases exponentially. The expansion angle varies with the spur angle, but not significantly.Arch
ived

Figure 39. Relationship between spur length and expansion angle for several spurpermeabilities (After [48]).
Spur spacing in a bend can be established by first drawing an arc representing the desired flow alignment (see Figure 40).This arc will represent the desired extreme location of the thalweg nearest the outside bank in the bend. The desired flowalignment may differ from existing conditions or represent no change in conditions, depending on whether there is a needto arrest erosion of the concave bank or reverse erosion that has already occurred. If the need is to arrest erosion,permeable retarder spurs or retarder structures may be appropriate. If the flow alignment must be altered in order toreverse erosion of the bank or to alter the flow alignment significantly, deflector spurs or retarder/deflector spurs areappropriate. The arc representing the desired flow alignment may be a compound circular curve or any curve which formsa smooth transition in flow directions.
The second step is to draw an arc representing the desired bank line. This may approximately describe the existingconcave bank or a new theoretical bank line which protects the existing bank from further erosion. Also, draw an arcconnecting the toe of spurs in the installation. The distance from this arc to the arc describing the desired bank line, alongwith the expansion angle, fixes the spacing between spurs. The arc describing the ends of spurs projecting into thechannel will be essentially concentric with the arc describing the desired flow alignment.
The third step consists of establishing the location of the spur to be located at the downstream end of the installation. Thiscan be done by first multiplying the distance between the arcs established in steps two and three by the cotangent of theexpansion angle. This is the distance that the toe of the first spur will be located upstream of the point on the bank whichdoes not required protection. This can also be done graphically on a scale drawing.
The fourth step is to establish the spacing between each of the remaining spurs in the installation (see Figure 40). Thedistance vetween the spur located in step four and the next spur upstream is the length of the first spur between the arc
Archive
d

describing the desired bank line and the toe of the spur multiplied by the cotangent of the flow expansion angle. This isthe distance between the toe of spurs measured along a chord of the arc describing the spur toes. Remaining spurs inthe installation will be at the same spacing if the arcs are concentric. The procedure is illustrated by Figure 40 andexpressed in Equation 14.
At less than bank full flow rates, flow currents may approach the concave bank at angles greater than those estimatedfrom Figure 39. Therefore, spurs should be well-anchored into the existing bank, especially the spur at the upstream endof the installation, to prevent outflanking.
The above procedure is expressed in Equation 14:
(14)
where:S = Spacing between spurs at the toe, feetL = Effective length of spur, or the distance between arcsdescribing the toe of spurs and the desired bank line, feet, andθ = Expansion angle downstream of spur tips, degrees
Archive
d

Figure 40. Spur spacing in a meander bend (After [44]).
Shape and Size of Spurs. In general, straight spurs should be used for most bank protection. Straight spurs are moreeasily installed and maintained and require less material. For permeable spurs, the width depends on the type ofpermeable spur being used. Less permeable retarder/deflector spurs which consist of a soil or sand embankment shouldbe straight with a round nose as shown in Figure 41.
The top width of embankment spurs should be a minimum of 3 feet. However, in many cases the top width will be dictatedby the width of any earth moving equipment used to construct the spur. In general a top width equal to the width of adump truck can be used. The side slopes of the spur should be 2:1 or flatter.
Figure 41. Typical straight, round nose spur.
Riprap. Rock riprap should be placed on the upstream and downstream faces as well as on the nose of the spur to inhibiterosion of the spur. Depending on the embankment material being used, a gravel, sand, or fabric filter may be required.The designer is referred to Highways in the River Environment [4] for design procedures for sizing riprap at spurs.
It is recommended that riprap be extended below the bed elevation to a minimum depth of five feet. Riprap should alsoextend to the crest of the spur, in cases where the spur would be submerged at design flow, or to two feet above thedesign flow, if the spur crest is higher than the design flow depth. Additional riprap should be placed around the nose ofthe spur, so that spur will be protected from scour.
6.3.2 Design Example of Spur Installation
Figure 42 illustrates a location at which a migrating bend threatens an existing bridge (existing conditions are shown witha solid line). Ultimately, based upon the following design example, seven spurs will be required. Although the number ofspurs is not known a-priori, the spurs (and other design steps) are shown as dashed lines on Figure 42 as they will bespecified after completing the following design example.
Archive
d

For this example, it is desirable to establish a different flow alignment and to reverse erosion of the concave (outside)bank. The spur installation has two objectives: (1) to stop migration of the meander before it damages the highway streamcrossing, and (2) to reduce scour at the bridge abutment and piers by aligning flow in the channel with the bridge opening.
Permeable retarder/deflector spurs or impermeable deflector spurs are suitable to accomplish the objectives and thestream regime is favorable for the use of these types of countermeasure. The expansion angle for either of these spurtypes is approximately 17 degrees for a spur length of about 20% of the desired channel width, as indicated in Figure 39.
Figure 42. Example of spur design.
Step 1. Sketch Desired Thalweg
The first step is to sketch the desired thalweg location with a smooth transition from the upstream flow direction throughthe curve to an approach straight through the bridge waterway (see Figure 42). For an actual location, it would benecessary to examine a greater length of stream to establish the most desirable flow alignment.
Step 2. Sketch Alignment of Spur Tips
The second step is to sketch a smooth curve through the toe locations of the spurs, concentric with the desired flowalignment. The theoretical or desired left bank line is established as a continuation of the bridge abutment and left bank
Archive
d

downstream through the curve, smoothly joining the left bank at the upstream extremity of eroded bank.
Step 3. Locate First Spur
Step number three is to locate spur number 1 so that flow expansion from the toe of the spur will intersect the streambank downstream of the abutment. This is accomplished by projecting an angle of 17 degrees from the abutmentalignment to an intersection with the arc describing the toe of spurs in the installation or by use of Equation 14. Spurs areset at 90 degrees to a tangent with the arc for economy of construction. Alternatively, the first spur could be considered tobe either the upstream end of the abutment or guide bank.
It may be desirable to place riprap on the stream bank at the abutment. Furthermore, the lateral size of the scour hole atthe spur directly upstream of the bridge should be estimated using the procedures described in Figures 30, 31, and 33. Ifthe extent of scour at this spur overlaps local scour at the pier, total scour depth at the pier may be increased. This can bedetermined by extending the maximum scour depth at the spur tip, up to the existing bed elevation at the pier at the angleof repose.
Step 4. Locate Remaining Spurs
Spurs upstream of spur number 1 are then located by use of Equation 14, using dimensions as illustrated in Figure 40.Using this spur spacing, deposition will be encouraged between the desired bank line and the existing eroded bank.
The seventh and last spur upstream is shown oriented in a downstream direction to provide a smooth transition of the flowapproaching the spur field. This spur could have been oriented normal to the existing bank, and been shorter and moreeconomical, but might have created excessive scour. Angling the furthest upstream spur in the downstream directionprovides a smoother transition into the spur field, and decreases scour at the nose of the spur. Subsequent spursdownstream can be oriented normal to the intended bank line for economy.
Note that spur number 7 is somewhat downstream of the beginning of the eroded bank. This area could be protected inone of two ways. The first would be to orient spur number seven perpendicular to the planned bank and install an eighthspur, angled downstream which begins upstream of the eroded bank. The second method would be to install a hard pointwhere the bank is beginning to erode. Hard points are discussed in the section entitled, "Other Countermeasures." In thiscase the hard point can be considered as a very short spur which is located at the intersection of the actual and plannedbank lines. In either case, spurs or hard points should be anchored well into the bank to prevent outflanking.
Spur lengths of less than 20 percent of channel width protect a greater length of channel bank relative to the projectedlength of spur. In the above example, spur lengths are obviously greater than 20 percent of the total channel width.However, if projected spur lengths are measured from the desired bank line, the guidance developed from laboratory testsis followed. In instances where excessive constriction of the channel would result from spur installation, excavation on theinside of the channel bends may be advisable.
Archive
d

6.4 Guide Banks
6.4.1 Design Considerations
When embankments encroach on wide flood plains, the flows from these areas must flow parallel to the approachembankment to the bridge opening. These flows can erode the approach embankment. At the abutment severe flowcontraction at the abutment can reduce the effective bridge opening, possibly increasing the severity of abutment and pierscour.
Guide banks (also referred to as spur dikes) can be used in these cases to prevent erosion of the approach embankmentsby cutting off the flow adjacent to the embankment, guiding stream flow through a bridge opening, and transferring scouraway from abutments to prevent damage caused by abutment scour. The two major enhancements guide banks bring tobridge design are (1) reduce the separation of flow at the upstream abutment face and thereby maximize the use of thetotal bridge waterway area and (2) reduce the abutment scour due to lessening turbulence at the abutment face. Guidebanks can be used on both sand and gravel bed streams.
Principal factors to be considered when designing guide banks are their orientation to the bridge opening, plan shape,upstream and downstream length, cross-sectional shape, and crest elevation. Reference [19] is used as the principaldesign reference for this section.
Figure 43 presents a typical guide bank plan view. It is apparent from the figure that without this guide bank overbankflows would return to the channel at the bridge opening, which can increase the severity of contraction and scour at theabutment. Note, that with installation of guide banks the scour holes which normally would occur at the abutments of thebridge are moved upstream away from the abutments. Guide banks may be designed at each abutment, as shown, orsingly, depending on the amount of overbank or floodplain flow directed to the bridge by each approach embankment.
The goal in the design of guide banks is to provide a smooth transition and contraction of the stream flow through thebridge opening. Ideally, the flow lines through the bridge opening should be straight and parallel. As in the case with othercountermeasures, the designer should consider the principles of river hydraulics and morphology, and exercise soundengineering judgment. Arch
ived

Figure 43. Typical guide bank (Modified from [19]).
Orientation
Guide banks should start at and be set parallel to the abutment and extend upstream from the bridge opening. Thedistance between the guide banks at the bridge opening should be equal to the distance between bridge abutments. Bestresults are obtained by using guide banks with a plan form shape in the form of a quarter of an ellipse, with the ratio of themajor axis (length Ls) to the minor axis (offset) of 2.5:1. This allows for a gradual constriction of the flow. Thus, if fordesign purposes the length of the guide bank, measured perpendicularly from the approach embankment to the upstreamnose of the guide bank is denoted as Ls, the amount of expansion of each guide bank (offset), measured from theabutment parallel to the approach roadway, should be 0.4 Ls.
The plan view orientation can be determined using Equation 15, which is the equation of an ellipse with origin at the noseof the guide bank. For this equation, X is the distance measured perpendicularly from the bridge approach and Y is theoffset measured parallel to the approach embankment, as shown in Figure 43.
(15)
It is important that the face of the guide bank match the abutment so that the flow is not disturbed where the guide bankmeets the abutment. For new bridge construction, abutments can be sloped to the channel bed at the same angle as theguide bank. For retrofitting existing bridges modification of the abutments or wing walls may be necessary.
Length
Archive
d

For design of guide banks, the length of the guide bank, Ls, must first be determined. This can be easily determined usinga nomograph which was developed from laboratory tests performed at Colorado State University [45 and 46] and fromfield data compiled by the U.S. Geological Survey [47]. For design purposes the utilization of the nomograph involves thefollowing parameters:
Q = Total discharge of the stream (cfs)Qf = Lateral or floodplain discharge of either flood plain (cfs)Q100 = Discharge in 100 feet of stream adjacent to the abutment (cfs)b = Length of the bridge opening (ft)An2 = Cross-sectional flow area at the bridge opening at normal stage (ft2)
Vn2 = = Average velocity through the bridge opening, (cfs)
= Guide bank discharge ratio
Ls = Projected length of guide bank
A nomograph is presented in Figure 44 to determine the projected length of guide banks. This nomograph should be usedto determine the guide bank length for designs greater than 50 feet and less than 250 feet. If the nomograph indicates thelength required to be greater than 250 feet the design should be set at 250 feet. It is recommended that the minimumlength of guide banks be 50 feet. An example of how to use this nomograph is presented in the next section.
FHWA practice has shown that many guide banks have performed well using a standardized length of 150 feet. Based onthis experience, guide banks of 150 feet in length should perform very well in most locations. Even shorter guide bankshave been successful if the guide bank intersects the tree line.
Archive
d

Figure 44. Nomograph to determine guide bank length (After [19]).
Crest Height
As with deflection spurs, guide banks should be designed so that they will not be overtopped at the design discharge. Ifthis were allowed to occur, unpredictable cross flows and eddies might be generated, which could scour and undermineabutments and piers. In general, a minimum of 2 feet of freeboard above the design water surface elevation should bemaintained.
Shape and Size
The cross-sectional shape and size of guide banks should be similar to deflector, or deflector/retarder spurs discussedpreviously. Generally, the top width is 10 to 12 feet, but the minimum width is 3 feet when construction is by drag line. Theupstream end of the guide bank should be round nosed. Sideslopes should be 2:1 or less.
Archive
d

Downstream Extent
In some states, highway departments extend guide banks downstream of the abutments to minimize scour due to rapidexpansion of the flow at the downstream end of the abutments. These downstream guide banks are sometimes called"heels." If the expansion of the flow is too abrupt, a shorter guide bank, which usually is less than 50 feet long, can beused downstream. Downstream guide banks should also start at and start parallel to the abutment and the distancebetween them should enlarge as the distance from the abutment of the bridge increases.
In general, downstream guide banks are a shorter version of the upstream guide banks. Riprap protection, crest heightand width should be designed in the same manner as for upstream guide banks.
Riprap
Guide banks are constructed by forming an embankment of soil or sand extending upstream from the abutment of thebridge. To inhibit erosion of the embankment materials, guide banks must be adequately protected with riprap or stonefacing.
Rock riprap should be placed on the stream side face as well as around the end of the guide bank. It is not necessary toriprap the side of the guide bank adjacent to the highway approach embankment. As in the case of spurs, a gravel, sand,or fabric filter may be required to protect the underlying embankment material. The designer is referred to Highways in theRiver Environment [4] for design procedures for sizing riprap. Riprap should be extended below the bed elevation to aminimum depth of five feet and extend up the face of the guide bank to two feet above the design flow. Additional riprapshould be placed around the upstream end of the guide bank to protect the embankment from scour.
As in the case of spurs, it is important to adequately tie guide banks into the approach embankment.
Guide Banks on Non-Symmetrical Highway Crossings
Hydraulics of Bridge Waterways [19] states:
"From meager testing done to date, there is not sufficient evidence to warrant using longer dikes (guide banks)at either abutment on skewed bridges. Lengths obtained from [the nomograph] should be adequate for eithernormal or skewed crossings. "
Therefore, for skewed crossings, the length of guide banks should be set using the nomograph for the side of the bridgecrossing which yields the largest guide bank length.
Other Design Concerns
In some cases, where the cost of stone riprap facing is prohibitive, the guide bank can be covered with sod or otherminimal protection. If this approach is selected, the design should allow for and stipulate the repair or replacement of theguide bank after each high water occurrence [19]. Other measures which will minimize damage to approachembankments and guide banks during high water are:
Keep trees as close to the toe of guide bank embankments as construction will permit. Trees willincrease the resistance to flow near and around the toe of the embankment, thus reducing velocities and
●
Archive
d

scour potential.Do not allow the cutting of channels or the digging of borrow pits along the upstream side of approachembankments and near guide banks. Such practices encourage flow concentration and increasesvelocities and erosion rates of the embankments.
●
In some cases, the area behind the guide bank may be too low to drain properly after a period offlooding. This can be a problem, especially when the guide bank is relatively impervious. Small drainpipes can be installed in the guide bank to drain this ponded water.
●
In some cases, only one approach will cut off the overbank flow. This is common when one of the banksis high and well defined. In these cases, only one guide bank may be necessary.
●
6.4.2 Design Example of Guide Bank Installation
For the example design of a guide bank, Figure 45 will be used. This figure shows the cross-section of the channel andfloodplain before the bridge is constructed and the plan view of the approach, guide banks, and embankments after thedesign steps outlined below are completed.
Archive
d

Figure 45. Example guide bank design.
Step 1. Hydraulic Design Parameters
The first step in the design of guide banks requires the computation of the depth and velocity of the design flood in themain channel and in the adjacent overbank areas. These studies are performed by using step backwater computationsupstream and through the bridge opening. The computer programs WSPRO or HEC-2 are suitable for thesecomputations. Using these programs or by using conveyance curves developed from actual data, the discharges anddepths in the channel and overbank areas can be determined.
To use the conveyance curve approach, the designer is referred to example problem number 4 (page 71) in Hydraulics of
Archive
d

Bridge Waterways [19] for methods to determine these discharges and areas. That publication also contains anotherexample of the design of a guide bank.
For this example, the total, overbank, and channel discharges, as well as the flow area are given. We also assume that abridge will span a channel with a bottom width of 400 feet and that the abutments will be set back 100 feet from each bankof the main channel. The abutments of this bridge are spill-through with a side slope of 2:1. The design discharge is28,160 cfs, which after backwater computations, results in a mean depth of 20 feet in the main channel and a meanchannel velocity of 2.98 fps.
Step 2. Determine Qf in the left and right overbank
The depth in both overbank areas is four feet and the width of the left and right overbank areas are 480 and 230 feet,respectively. Velocity in the overbank areas (assuming no highway approach embankment) is 1.5 fps. Therefore, bynoting that the discharge is the product of the velocity and the cross-sectional area in the overbank areas, Qf will be equalto 2,880 cfs for the left overbank and 1,380 cfs for the right overbank.
Step 3. Determine Q100 and Qf/Q100 for the left and right overbank
The overbank discharge in the first 100 feet of stream adjacent to the left and right abutments needs to be determinednext. Since for this case the flow is of uniform depth (4 feet) and velocity (1.5 fps) over the entire width of the floodplain,and the abutments are set back more than 100 feet from the main channel banks, the value of Q100 will be 600 cfs forboth sides.
For the left and right overbanks the reference values of Qf/Q100 can be determined by simple division of the dischargesdetermined in previous steps. For this example, these values are 4.8 and 2.3 for the left and right overbank, respectively.For design purposes, the largest value will result in the more conservative determination of the length of the guide banks.Therefore, for this example, a value of Qf/Q100 equal to 4.8 will be used.
Step 4. Determine the length of the guide bank, Ls
The average channel velocity through the bridge opening can be determined by dividing the total discharge of the streamQ by the cross-sectional flow area at the bridge opening An2, which in this case includes the main channel (8000 ft2) plus100 feet of the left and right overbank areas adjacent to the abutments at the bridge opening (800 ft2). Thus, the averagechannel velocity Vn2 is 3.2 fps. For Qf/Q100 equal to 4.8 and an average channel velocity of 3.2 fps, the length of the guidebank is determined using the nomograph presented in Figure 44. For this example the length, Ls determined from thenomograph is approximately 150 feet. The offset of the guide bank is determined by multiplying Ls by 0.4. Thesedimensions locate the end of the guide bank. The shape of the guide bank from this location to the abutment is simply anellipse as described by Equation 15.
Step 5. Miscellaneous Specifications
Archive
d

The crest of the guide bank must be a minimum of 2 feet above the water surface. Therefore, the crest elevation for thisexample should be greater than or equal to 526 feet. The crest width should be at least 3 feet. For this example, a crestwidth of 10 feet will be specified so that the guide bank can be easily constructed with dump trucks.
Stone or rock riprap should be placed in the locations shown on Figure 45. This riprap should extend a minimum of twofeet above the design water surface (Elevation 526 feet) and at least four feet below the intersection of the toe of theguide bank and the existing ground surface.
6.5 Check Dams
Check dams or channel drop structures are used downstream of highway crossings to arrest head cutting and maintain a stablestreambed elevation in the vicinity of the bridge. Check dams are usually built of rock riprap, concrete, sheet piles, gabions, or treatedtimber piles. The material used to construct the structure depends on the availability of materials, the height of drop required, and thewidth of the channel. Rock riprap and timber pile construction have been most successful on channels having small drops and widthsless than 100 feet. Sheet piles, gabions, and concrete structures are generally used for larger drops on channels with widths rangingup to 300 feet.
Check dams can initiate erosion of banks and the channel bed downstream of the structure as a result of energy dissipation andturbulence at the drop. This local scour can undermine the check dam and cause failure. The use of energy dissipators downstreamof check dams can reduce the energy available to erode the channel bed and banks. In some cases it may be better to constructseveral consecutive drops of shorter height to minimize extensive erosion.
Lateral erosion of channel banks just downstream of drop structures is another adverse result of check dams and is caused byturbulence produced by energy dissipation at the drop, bank slumping from local channel bed erosion, or eddy action at the banks.Bank erosion downstream of check dams can lead to erosion of bridge approach embankments and abutment foundations if lateralbank erosion causes the formation of flow channels around the ends of check dams. The usual solution to these problems is to placeriprap revetments on the streambank. Riprap of the bank downstream of the check dam will be needed. The design of riprap is givenin references [4], [38], and [39].
Erosion of the stream bed can also be reduced by placing rock riprap in a preformed scour hole downstream of the drop structure. Arow of sheet piling with top set at or below streambed elevation can keep the riprap from moving downstream. Because of theproblems associated with check dams, the design of these countermeasures requires designing the check dams to resist scour byproviding for dissipation of excess energy and protection of areas in the bed and the bank which are susceptible to erosive forces.
6.5.1 Bed Scour For Vertical Drop Structures
The most conservative estimate of scour downstream of channel drop structures is for vertical drops with unsubmergedflow conditions. For the purposes of design the maximum expected scour will be assumed to be equal to the scour for avertical, unsubmerged drop, regardless of whether the drop is actually sloped or is submerged.
A typical vertical drop structure is diagramed in Figure 46. The Veronese equation [48] is recommended to estimate thedepth of scour downstream of a vertical drop:
Archive
d

where:ds = Local scour depth for a free overfall, measuredfrom the stream bed downstream of the drop, ft
q = Discharge per unit width, cfs per foot of widthHt = Total drop in head, measured from the
upstream to the downstream energy grade line, ftdm = Tail water depth, ftK = 1.32
It should be noted that Ht is the difference in the total head from upstream to downstream. This can be computed usingBernoulli's equation for steady uniform flow:
where: Y = Depth, ftV = Velocity, ft/sZ = Bed elevation referenced to a common datum, ftg = Acceleration due to gravity 32.2 ft/s2
The subscripts u and d refer to upstream and downstream of the channel drop, respectively.
The depth of scour as estimated by the above equation is independent of the grain size of the bed material. This conceptacknowledges that the bed will scour regardless of the type of material composing the bed, but the rate of scour dependson the composition of the bed. In some cases, with large or resistant material, it may take years or decades to develop themaximum scour hole. In these cases, the design life of the bridge may need to be considered when designing the checkdam. Arch
ived

Figure 46. Schematic of a vertical drop caused by a check dam.
The drop structure must be designed structurally to withstand the forces of water and soil assuming that the scour hole isas deep as estimated using the equation above. Therefore, the designer should consult soils and structural engineers sothat the drop structure will be stable under the full scour condition. In some cases, a series of drops may be employed tominimize drop height and construction costs of foundations, or riprap or energy dissipation could be provided to limit depthof scour (see, for example [49]).
Archive
d

6.5.2 Design Example
The following design example is based upon a comparison of scour equations presented by the USBR [48]. For thisexample, as illustrated by Figure 47, the following hydraulic parameters are used:
Design Discharge Q = 110,000 ft3/sChannel Width B = 990 ftTail Water Depth dm, Yd = 12.4 ftUnit Discharge q = 111 ft3/s/ftMean Velocity V = 8.95 ft/sDrop Height h = 5 ft
For this example Ht = 5 ft if the drop height is 5 feet and the depth and velocity upstream and downstream of the drop arethe same. Using the recommended equation the estimated depth of scour below the bed level downstream will be:
If, for structural reasons, the scour depth was to be limited to a maximum of 7 feet, for example, then either riprap to limitthe depth of scour [49] or a series of check dams could be constructed. For this case three drops of 1.7 feet would berequired. Using the recommended equation, this drop height would result in an estimated depth of scour of 6.4 feet perdrop. It should be noted that if a series of drops are required, adequate distance between each drop must be maintained.Arch
ived
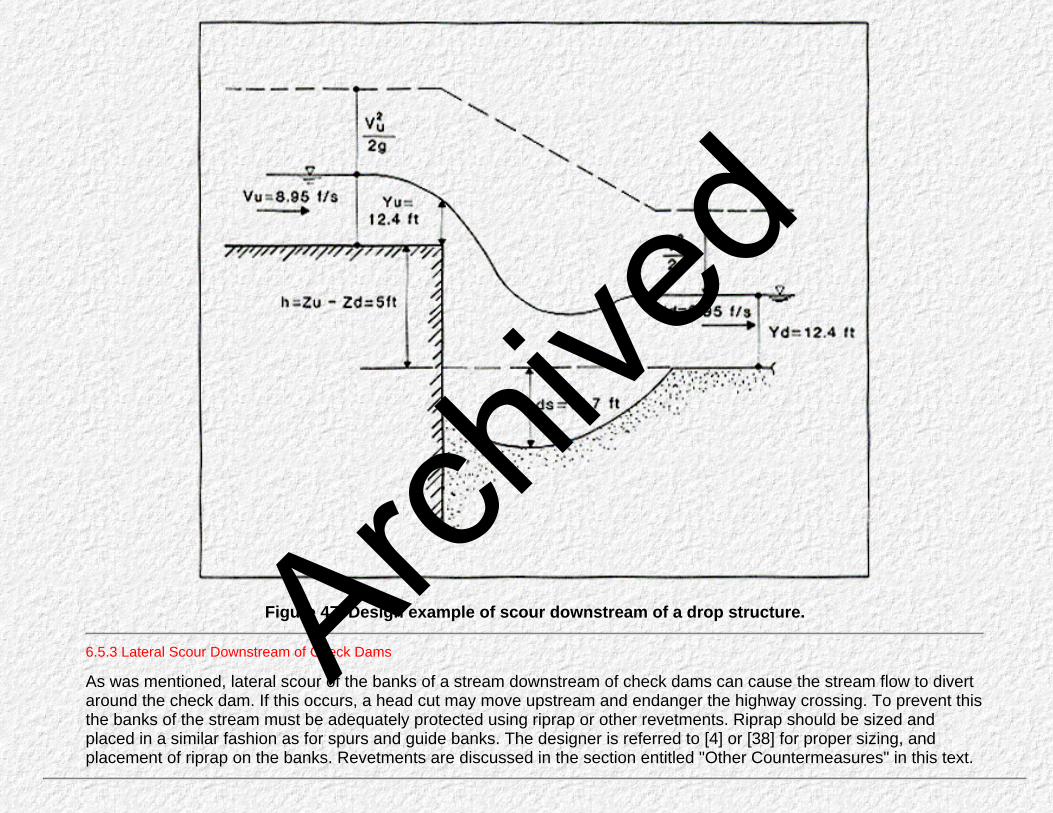
Figure 47. Design example of scour downstream of a drop structure.
6.5.3 Lateral Scour Downstream of Check Dams
As was mentioned, lateral scour of the banks of a stream downstream of check dams can cause the stream flow to divertaround the check dam. If this occurs, a head cut may move upstream and endanger the highway crossing. To prevent thisthe banks of the stream must be adequately protected using riprap or other revetments. Riprap should be sized andplaced in a similar fashion as for spurs and guide banks. The designer is referred to [4] or [38] for proper sizing, andplacement of riprap on the banks. Revetments are discussed in the section entitled "Other Countermeasures" in this text.
Archive
d

6.6 Other Countermeasures
6.6.1 Revetments
Revetments may be flexible or rigid and can be used to counter all erosion mechanisms. They may be used to provideprotection for embankments, streambanks, and streambeds. They do not significantly constrict channels or alter flowpatterns. Revetments have been unsuccessful in resisting slumps in saturated streambanks and embankments andrelatively unsuccessful in stabilizing streambanks and streambeds in degrading streams. Special precautions must beobserved in the design of revetments for degrading channels.
Flexible Revetments. Flexible revetments include rock riprap, rock-and-wire mattresses, gabions, precast concrete blocks,rock-fill trenches, windrow revetments, used tire revetments, and vegetation. Rock riprap adjusts to distortions and localdisplacement of materials without complete failure of the revetment installation. However, flexible rock-and-wire mattressand gabions may sometimes span the displacement of underlying materials, but usually can adjust to most localdistortions. Used tire mattress and precast concrete block mattresses are generally stiffer than rock riprap and gabions,and therefore, do not adjust to local displacement of underlying materials as well. References for design guidelines offlexible revetments depend on the type of flexible revetment being used and are discussed separately in the followingsections.
Rock Riprap, Rock-and-Wire Mattress, Gabions, and Precast Concrete Blocks. Design guidelines, design procedures,and suggested specifications for rock riprap, wire enclosed rock, stacked block gabions, and precast concrete blocks areincluded in HEC No. 11, "Use of riprap for Bank Protection" [38].
Rock-Fill Trenches and Windrow Revetment. Rock-fill trenches are structures used to protect banks from caving causedby erosion at the toe. A trench is excavated along the toe of the bank and filled with rocks as shown in Figure 48. The sizeof trench to hold the rock fill depends on expected depths of scour.
As the streambed adjacent to the toe is eroded, the toe trench is undermined and the rock fill slides downward to pave thebank. It is advantageous to grade the banks before placing riprap on the slope and in the toe trench. The slope should beat such an angle that the saturated bank is stable while the stream stage is falling.
An alternative to a rock-fill trench at the toe of the bank is to excavate a trench above the water line along the top of thebank and fill the trench with rocks. As the bank erodes, stone material in the trench is added on an as-needed basis untilequilibrium is established. This method is applicable in areas of rapidly eroding banks of medium to large size streams.Arch
ived

Figure 48. Rock-fill trench (After [4]).
Windrow revetment (Figure 49) consists of a supply of rock deposited along an existing bank line at a location beyondwhich additional erosion is to be prevented. When bank erosion reaches and undercuts the supply of rock, it falls onto theeroding area, thus giving protection against further undercutting. The resulting bank line remains in a near natural statewith an irregular appearance due to intermittent lateral erosion in the windrow location. The treatment particularly lendsitself to the protection of adjacent wooded areas, or placement along stretches of presently eroding, irregular bank line.
The effect of windrow revetment on the interchange of flow between the channel and overbank areas and flood flowdistribution in the flood plain should be carefully evaluated. Windrow installations will perform as guide banks or leveesand may adversely affect flow distribution at bridges or cause local scour. Tying the windrow to the highway embankmentat an abutment would be contrary to the purpose of the windrow since the rock is intended to fall into the channel as thebank erodes. The abutment is not intended to fall into the channel.
The following observations and conclusions from model investigations of windrow revetments and rock-fill trenches maybe used as design guidance. More definitive guidance is not presently available [39].
The application rate of stone is a function of channel depth, bank height, material size, and estimatedbed scour.
●
A triangular windrow is the least desirable shape, a trapezoidal shape provides a uniform blanket of rockon an eroding bank, and a rectangular shape provides the best coverage. A rectangular shape is mosteasily placed in an excavated trench.
●
Bank height does not significantly affect the final revetment; however, high banks tend to produce anonuniform revetment alignment. Large segments of bank tend to break loose and rotate slightly on highbanks, whereas low banks simply "melt" or slough into the stream.
●
Stone size influences the thickness of the final revetment, and a smaller gradation of stone forms a moredense, closely chinked protective layer. Stones must be large enough to resist being transported by thestream, and a well-graded stone should be used to ensure that the revetment does not fail from leachingof the underlying bank material. Large stone sizes require more material than smaller stone sizes to
●
Archive
d

produce the same relative thickness of revetment. In general, the greater the stream velocity, thesteeper the side slope of the final revetment. The final revetment slope will be about 15 percent flatterthan the initial bank slope.A windrow segment should be extended landward from the upstream end to reduce the possibility ofoutflanking of the windrow.
●
Archive
d

Figure 49. Windrow revetment, definition sketch (After [39]).
Used Tire Revetments. Used tire revetments have been successfully used for velocities up to 10 feet per second on mildbends. They will accommodate a limited amount of bank subsidence, but usually will be damaged where substantialsubsidence occurs. They are not well-suited for use where scour at the toe of the installation would undermine therevetment, but a riprap launching apron or toe trench will alleviate this problem to some extent. Used tire revetments aresomewhat unsightly and vandalism has proved to be more of a problem than for other schemes of bank protection.Construction is labor-intensive and is therefore expensive.
The following precautions should be followed to ensure that the mattress will stay in place on an eroding bank:The tires must be banded together; alternatively, cable running the length and width of the mattress canbe woven through the tires.
●
The top, toe and the upstream and downstream ends of the mattress must be tied to the bank (Figure50). Riprap should be placed at the toe of the mattress for protection against scour.
●
While the above precautions are essential to a stable mattress, other measures can also help to ensure stability. Theyare:
Cut, drill or burn holes in the tire sidewalls to prevent flotation.●
Sort the tires by size to help in fitting them together.●
Fasten the mattress to the bank at intervals with earth screw anchors (or some other type of anchor).●
Pack the tires with stone or rubble.●
Plant willows or other fast growing, thick brush inside the tires. Once established, the root system willstrengthen the bank and the willows will obscure the somewhat unsightly mattress and decrease flowvelocities near the bank. If willows are not readily available, other species should be planted. Possiblespecies for use are discussed under vegetation.
●
Archive
d

Figure 50. Used tire mattress (After [50]).
If the mattress effectively controls the streambank erosion and remains intact, sediment may gradually cover therevetment. If willows have not been planted, volunteer vegetation may become established.
Vegetation. Vegetation is the most natural method for protecting streambanks because it is relatively easy to establishand maintain and is visually attractive. However, vegetation should not be seriously considered as a countermeasureagainst severe bank erosion where a highway facility is at risk. At such locations, vegetation can best serve to supplementother countermeasures.
Vegetation can effectively protect a bank below the water line in two ways. First, the root system helps to hold the soiltogether and increases overall bank stability by forming a binding network. Second, the exposed stalks, stems, branchesand foliage provide resistance to flow, causing the flow to lose energy by deforming the plants rather than by removingsoil particles. Above the water line, vegetation prevents surface erosion by absorbing the impact of falling raindrops andreducing the velocity of overbank flow and rainfall runoff. Further, vegetation provides additional capacity for infiltration bytaking water from the soil, and may improve bank stability by water withdrawal.
Vegetation is generally divided into two broad categories: grasses and woody plants (trees and shrubs). A major factoraffecting species selection is the length of time required for the plant to become established on the slope. Grasses areless costly to plant on an eroding bank and require a shorter period of time to become established. Woody plants offergreater protection against erosion because of more extensive root systems; however, under some conditions the weight ofthe plant will offset the advantage of the root system. On high banks, tree root systems may not penetrate to the toe of thebank. If the toe becomes eroded, the weight of the tree and its root mass may cause a bank failure.
Water-tolerant grasses such as canarygrass (Phalaris), reedgrass (Calamagrostis), cordgrass (Spartina), and fescue(Festuca) are effective in preventing erosion on upper banks which are inundated from time to time and are subject to
Archive
d

erosion due primarily to rainfall, overland flow, and minor wave action. Along the lower bank, where erosive forces arehigh, vegetation is generally not effective as a protective measure; however, cattails (Typha), bulrushes (Scripus), reeds(Phragmites), knotweed and smartweed (Polygonum), rushes (Juncus), and mannagrass (Glyceria) are helpful in inducingdeposition and reducing velocities in shallow water or wet areas at the bank toe and in protecting the bank in somelocations. Willows (Salix) are among the most effective woody plants in protecting low banks because they are resilient,are sufficiently dense to promote deposition of sediment, can withstand inundation, and easily become established.
Rigid Revetments. Rigid revetments include portland-cement paving, concrete filled mats, sand and cement bags, groutedriprap, and soil cement. Rigid revetments are generally smoother than flexible revetments and thus improve hydraulicefficiency and are generally highly resistant to erosion and impact damage. They are susceptible to damage from theremoval of foundation support by subsidence, undermining, hydrostatic pressures, slides, and erosion at the perimeter.They are also among the most expensive streambank protection countermeasures.
Concrete Pavement. Concrete paving should be used only where the toe can be adequately protected from underminingand where hydrostatic pressures behind the paving will not cause failure. This might include impermeable bank materialsand portions of banks which are continuously under water. Sections intermittently above water should be provided withweep holes. Refer to HEC 11 [38] for design of concrete pavement revetment.
Soil Cement. In areas where riprap is scarce, use of in-place soil combined with cement can sometimes provide apractical alternative. Figure 51 shows a detail of typical soil-cement construction for bank protection. For use in soilcement, soils should be easily pulverized and contain at least 5 percent, but not more than 35 percent, silt and clay(material passing the No. 200 sieve). Finer textured soils usually are difficult to pulverize and require more cement than do100 percent granular soils which have no material passing the No. 200 sieve. Soil cement can be placed and compactedon slopes as steep as two horizontal to one vertical. Best results have been achieved on slopes no steeper than 3:1.However, in the arid Southwest a 1:1 slope is generally used for stair-stepped soil cement. Where velocities exceed 6 to 8feet per second and the flow carries sufficient bed load to be abrasive, aggregates should contain at least 30 percentgravel particles retained on a No. 4 (4.75 mm) sieve.
Figure 51. Typical soil-cement bank protection (After [4]).
A stair-step construction is recommended on channel banks with relatively steep slopes. Placement of small quantities of
Archive
d

soil-cement for each layer (six-inch layers) can progress more rapidly than a large quantity of fill material. Special careshould be exercised to prevent raw soil seams between successive layers of soil cement. A sheepsfoot roller should beused on the last layer at the end of a day to provide an interlock for the next layer. The completed soil-cement installationmust be protected from drying out for a seven-day hydration period. After completion, the material has sufficient strengthto serve as a roadway along the embankment. Procedures for constructing soil-cement slope protection by the stair stepmethod can be found in [51] and [52].
A soil-cement blanket with 8 to 15 percent cement may be an economical and effective streambank protection method foruse in areas where vegetation is difficult to establish and the bank material is predominantly sand. The sand can be mixedwith cement by hand or mechanically to a depth of at least four inches. The mixture should then be wet down and allowedto set up. This method has the advantage of low cost. However, a soil-cement blanket has three major deficiencies:impermeability, low strength, and susceptibility to temperature variations. If the bank behind the blanket becomessaturated and cannot drain, failure may occur. Also, because a sand-cement blanket is relatively brittle, very little if anyvehicular, pedestrian, or livestock traffic can be sustained without cracking the thin protective veneer. In northern climatesthe blanket can break up during freeze-thaw cycles.
Precautions must be taken to prevent undermining at the toe and ends. Protection at the toe can be provided byextending the installation below estimated scour depth, by a riprap launching apron, or by a concrete or sheet pilecutoff-wall extending to bedrock or well below the anticipated scour elevation. Weep holes for relief of hydrostaticpressure are required for many situations.
Sacks. Burlap sacks filled with soil or sand-cement mixtures have long been used for emergency work along levees andstreambanks during floods (Figure 52). Commercially manufactured sacks (burlap, paper, plastics, etc.) have been usedto protect streambanks in areas where riprap of suitable size and quality is not available at a reasonable cost. Sacks filledwith sand-cement mixtures can provide long-term protection if the mixture has set up properly, even though most types ofsacks are easily damaged and will eventually deteriorate. Sand-cement sack revetment construction is not economicallycompetitive in areas where good stone is available. However, where quality riprap must be transported over longdistances, sack revetment can often be placed at a lesser cost than riprap.
Archive
d

Figure 52. Typical sand-cement bag revetment. (Modified from California Department ofPublic Works, 1970; After [37]).
If a permanent revetment is to be constructed, the sacks should be filled with a mixture of 15 percent cement (minimum)and 85 percent dry sand (by weight). The filled sacks should be placed in horizontal rows like common house brickbeginning at an elevation below any toe scour (alternatively, riprap can be placed at the toe to prevent undermining of thebank slope). The successive rows should be stepped back approximately 1/2-bag width to a height on the bank abovewhich no protection is needed. The slope of the completed revetment should not be steeper than 1:1. After the sacks havebeen placed on the bank, they can be wetted down for a quick set or the sand-cement mixture can be allowed to set upnaturally through rainfall, seepage or condensation. If cement leaches through the sack material, a bond will form betweenthe sacks and prevent free drainage. For this reason, weepholes should be included in the revetment design. Theinstallation of weepholes will allow drainage of groundwater from behind the revetment thus helping to prevent pressurebuildup that could cause revetment failure. This revetment requires the same types of toe protection as other types of rigidrevetment.
Grouted Riprap. Grouted riprap consists of rock slope protection with voids filled with concrete grout to form a monolithicarmor. It is generally used where rock of sufficient size, gradation, or quantity is not economically available to install ripraprevetment. Grouted riprap is rigid but not extremely strong; therefore, support by the streambank is essential. Precautionsagainst failure from hydrostatic pressure behind the riprap are appropriate, as well as provisions to prevent undermining atthe toe of the bank and at the termini of the installation. Refer to HEC No. 11 for design guidance [38].
Concrete-Filled Mats. Concrete filled mats consist of fabric envelopes pumped full with sand and cement grout. Thisproduct is marketed under the names "Fabriform," "Fabricast," and "Enkamat" and are protected under various U.S. andforeign patents or patents pending.
Concrete-filled mats have not performed well in high-velocity environments. More experience with the use of thesemeasures is advisable before they are used at high-risk locations.
6.6.2 Hardpoints
Hardpoints consist of stone fills spaced along an eroding bank line, protruding only short distances into the channel. Aroot section extends landward to preclude flanking. The crown elevation of hardpoints used by the U.S. Army Corps ofEngineers at demonstration sites on the Missouri River was generally at the normal water surface elevation at the toe,sloping up at a rate of about 1 foot in 10 feet toward the bank. Hardpoints are most effective along straight or relatively flatconvex banks where the streamlines are parallel to the bank lines and velocities are not greater than 10 ft/s within 50 feetof the bank line. Hardpoints may be appropriate for use in long, straight reaches where bank erosion occurs mainly from awandering thalweg at lower flow rates. They would not be effective in halting or reversing bank erosion in a meander bendunless they were closely spaced, in which case spurs, retarder structures, or bank revetment would probably cost less.Figure 53 is a perspective of a hardpoint installation.
Archive
d

Figure 53. Perspective view of hardpoint installation with section detail (After [37]).
6.6.3 Retarder Structures
Retarder structures are permeable devices generally placed parallel to streambanks to reduce velocities and causedeposition near the bank. They are best suited for protecting low banks or the lower portions of streambanks. Retarderstructures can be used to protect an existing bank line or to establish a different flow path or alignment. Retards do notrequire grading of the streambank, and they create an environment which is favorable to the establishment of vegetation.
Jacks and Tetrahedrons. Jacks most commonly consist of three linear members fixed together at their midpoints so thateach member is perpendicular to the other two. Wires are strung on the members to resist distortion and to collect debris.Cables are used to tie individual jacks together and for anchoring key units to deadmen. Tetrahedrons consist of sixmembers of equal length fixed together so as to form three faces, each of which is an equilateral triangle, i.e, atetrahedron. The tetrahedron unit may be braced as shown in Figure 54 and wire mesh added to enhance flowretardance. Tetrahedrons are not as widely used as are jacks.
Jacks and tetrahedrons are effective in protecting banks from erosion only if light debris collects on the structures therebyenhancing their performance in retarding flow. However, heavy debris and ice can damage the structures severely. Theyare most effective on mild bends and in wide, shallow streams which carry a large sediment load.
Archive
d

Figure 54. Typical tetrahedron design (After [37]).
Where jacks are used to stabilize meandering streams, both lateral and longitudinal rows are often installed to form anarea retarder structure rather than a linear structure. Lateral rows of jacks are usually oriented in a downstream directionfrom 45 to 70 degrees. Spacing of the lateral rows of jacks may be 50 to 250 feet depending on the debris and sedimentload carried by the stream. A typical jack unit is shown in Figure 55 and a typical area installation is shown in Figure 56.
Figure 55. Typical jack unit (After [37]).Archive
d

Figure 56. Retarder field schematic (After [4]).
Outflanking of jack installations is a common problem. Adequate transitions should be provided between the upstream bank and thestructure, and the jack field should be extended to the overbank area to retard flow velocities and provide additional anchorage. Jacksare not recommended for use in corrosive environments or at locations where they would constitute a hazard to recreational use ofthe stream.
Fence Retarder Structures. Fence retarder structures provide protection to the lower portions of banks of relatively small streams.Posts may be of wood, steel, or concrete and fencing may be composed of wood planks or wire.
Scour and the development of flow channels behind linear structures are common causes of failure of longitudinal fences. Scour atthe supporting members of the structure can be reduced by placing rock along the fence or the effects of scour can be overcome bydriving supporting members to depths below expected scour. Tiebacks can be used to retard velocities between the linear structureand the streambank, thus reducing the ability of the stream to develop flow channels behind the structure.
Timber Pile. Timber pile retarder structures may be of a single, double, or triple row of piles with the outside of the upstream rowfaced with wire mesh or other fencing material. They have been found to be effective at sharp bends in the channel and where flowsare directly attacking a bank. They are effective in streams which carry heavy debris and ice loads and where barges or othershipping vessels could damage other countermeasures or a bridge. As with other retarder structures, protection against scour failureis essential. Figure 57 illustrates a design.
Wood Fence. Wood fence retarder structures have been found to provide a more positive action in maintaining an existing flowalignment and to be more effective in preventing lateral erosion at sharp bends than other retarder structures. Figure 58 is an endview of a typical wood fence design with rock provided to protect against scour.
Wire fence retarder structures may be of linear or area configuration, and linear configurations may be of single or multiple fencerows. Double-row fence retards are sometimes filled with brush to increase the flow retardance. Figures 59 and 60 illustrate two typesof wire fence retarder structures.
Archive
d

Figure 57. Timber pile bent retarder structure. (Modified from California Department ofPublic Works, 1970; After [37]).
Archive
d

Figure 58. Typical wood fence retarder structure. (Modified from U.S. ArmyCorps of Engineers, 1981; After [37]).
Figure 59. Light double row wire fence retarder structure (After [37]). Archive
d

Figure 60. Heavy timber-pile and wire fence retarder structures. (Modified from U.S. ArmyCorps of Engineers 1981, After [37]).
6.6.4 Longitudinal Dikes
Longitudinal dikes are essentially impermeable linear structures constructed parallel with the streambank or along thedesired flow path. They protect the streambank in a bend by moving the flow current away from the bank. Longitudinaldikes may be classified as earth or rock embankment dikes, crib dikes, or rock toe-dikes.
Archive
d
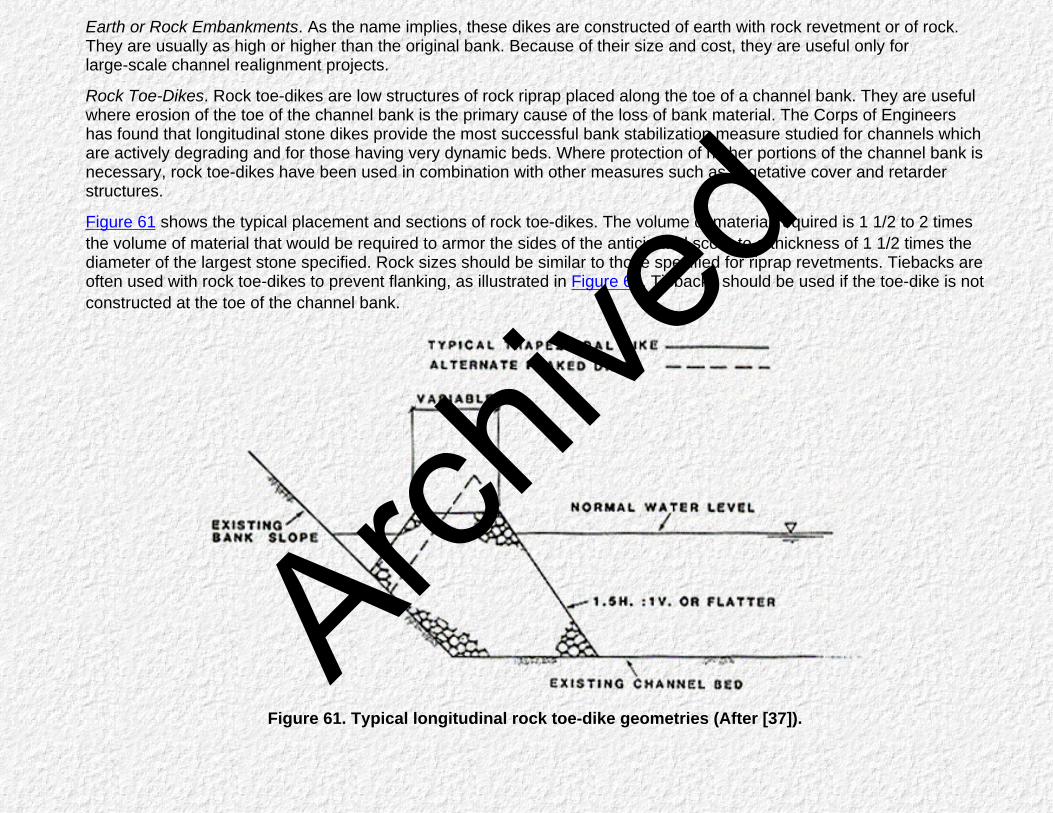
Earth or Rock Embankments. As the name implies, these dikes are constructed of earth with rock revetment or of rock.They are usually as high or higher than the original bank. Because of their size and cost, they are useful only forlarge-scale channel realignment projects.
Rock Toe-Dikes. Rock toe-dikes are low structures of rock riprap placed along the toe of a channel bank. They are usefulwhere erosion of the toe of the channel bank is the primary cause of the loss of bank material. The Corps of Engineershas found that longitudinal stone dikes provide the most successful bank stabilization measure studied for channels whichare actively degrading and for those having very dynamic beds. Where protection of higher portions of the channel bank isnecessary, rock toe-dikes have been used in combination with other measures such as vegetative cover and retarderstructures.
Figure 61 shows the typical placement and sections of rock toe-dikes. The volume of material required is 1 1/2 to 2 timesthe volume of material that would be required to armor the sides of the anticipated scour to a thickness of 1 1/2 times thediameter of the largest stone specified. Rock sizes should be similar to those specified for riprap revetments. Tiebacks areoften used with rock toe-dikes to prevent flanking, as illustrated in Figure 62. Tiebacks should be used if the toe-dike is notconstructed at the toe of the channel bank.
Figure 61. Typical longitudinal rock toe-dike geometries (After [37]).
Archive
d

Figure 62. Longitudinal rock toe-dike tiebacks (After [37]).
Rock toe-dikes are useful on channels where it is necessary to maintain as wide a conveyance channel as possible.Where this is not important, spurs could be more economical since scour is a problem only at the end projected into thechannel. However, spurs may not be a viable alternative in actively degrading streams.
Crib Dikes. Longitudinal crib dikes consist of a linear crib structure filled with rock, straw, brush, automobile tires or othermaterials. They are usually used to protect low banks or the lower portions of high banks. At sharp bends, high bankswould need additional protection against erosion and outflanking of the crib dike. Tiebacks can be used to counteroutflanking.
Crib dikes are susceptible to undermining, causing loss of material inside the crib, thereby reducing the effectiveness ofthe dike in retarding flow. Figure 63 illustrates a crib dike with tiebacks and a rock toe on the stream side to preventundermining. Arch
ived

Figure 63. Timber pile, wire mesh crib dike with tiebacks (Modified from U.S. Army Corps ofEngineers 1981, After [37]).
6.6.5 Vane Dikes
Vane dikes are a series of low elevation structures designed to guide flow away from an eroding bank line. The structurescan be constructed of rock or other erosion resistant material. The crests are below the design water elevation and flowcan pass over or around the structures, with the main thread of flow directed away from the eroding bank.
Figure 64 is a layout of an "Iowa Vane" system installed at a bend in the East Nishnabota River at U.S. Highway 34 inIowa. The system functions by eliminating or reducing secondary currents which dive at the concave bank and causebank erosion. Prior to installation of the vane system, the river bend was moving toward U.S. 34 at a rate 20 to 30 feet peryear. Developers of the system who design the prototype installation are confident that the system would halt the bendmigration with relatively minor modifications, although the bank did recede about four feet during a four month period inwhich a moderately large flood occurred [50]. According to the above report, the effectiveness of the system was reduced,to some extent, by changing stream conditions. This needs further study since conditions continually change in alluvialstreams. Figure 65 presents a perspective view of a typical vane dike layout.
Archive
d

Figure 64. Layout of Iowa Vane system in East Nishnabota River bend (After [53]).
Archive
d

Figure 65. Perspective of an Iowa Vane layout [54].
6.6.6 Bulkheads
Bulkheads are used for purposes of supporting the channel bank and protecting it from erosion. They are generally usedas protection for the lower bank and toe, often in combination with other countermeasures that provide protection forhigher portions of the bank. Bulkheads are most frequently used at bridge abutments as protection against slumping andundermining at locations where there is insufficient space for the use of other types of bank stabilization measures, andwhere saturated fill slopes or channel banks cannot otherwise be stabilized.
Bulkheads are classified on the basis of construction methods and materials. They may be constructed of concrete,masonry, cribs, sheet metal, piling, reinforced earth, used tires, gabions, or other materials. They must be protectedagainst scour or supported at elevations below anticipated scour, and where sections of the installation are intermittentlyabove water, provisions must be made for seepage through the wall. Some bulkhead types, such as crib walls andgabions, should be provided with safeguards against leaching of materials from behind the wall.
Bulkheads must be designed to resist the forces of overturning, bending and sliding, either by their mass or by structuraldesign. Figure 66 illustrates anchorage schemes for a sheetpile bulkhead. Because of costs, they should be used ascountermeasures against meander migration only where space is not available to construct other types of measures.
Figure 66. Anchorage schemes for a sheetpile bulkhead (After [37]).
Archive
d

6.6.7 Channel Relocation
At some locations, it may be advantageous to realign a stream channel, either in combination with the use of othercountermeasures against meander migration or in lieu of other countermeasures.
Figure 67 illustrates hypothetical highway locations fixed by considerations other than stream stability. To create betterflow alignment with the bridge, consideration could be given to channel realignment as shown in this figure (parts a andb). Similarly, consideration for realignment of the channel would also be advisable for a hypothetical lateral encroachmentof a highway as depicted in part c of the figure. In either case, criteria are needed to establish the cross-sectionaldimensions.
Prior to realigning a stream channel, the stability of the existing channel must be examined. The stream classification,recent and older aerial photographs, and field surveys are necessary. The realigned channel may be made straightwithout curves, or may include one or more curves. If curves are included, decisions regarding the radius of curvature, thenumber of bends, the limits of realignment (hence the length and slope of the channel) and the cross-sectional area haveto be made. Different streams have different historical backgrounds and characteristics with regard to bend migration,discharge, stage, geometry, and sediment transport, and an understanding and appreciation of river hydraulics andmorphology is important to decision making. It is difficult to state generalized criteria for channel relocation applicable toall streams. Knowledge about stream systems has not yet advanced to such a state as to make this possible.Nevertheless, some principles and guidelines can be provided (See Chapters 2.0 through 4.0).
Figure 67. Encroachments on meandering streams (After [4]).
As the general rule, bend radii in realigned channels should be made about equal to the mean radius of bends, rc, inextended reaches of the stream. Where the angle defined in Figure 68 exceeds about 40 degrees, there is a sufficient
Archive
d

crossing length for the thalweg to shift from one side of the channel to the other. Generally, it may be necessary tostabilize the outside banks of curves in order to hold the new alignment and, depending upon crossing length, somemaintenance may be necessary to remove sandbars after large floods so that the channel does not develop new meanderpatterns.
Sinuosity and channel bed slope are related in that the total drop in bed elevation for the old channel and the relocatedchannel are the same. Thus, the mean slope of the channel bed after relocation (subscript 2) is greater than the meanslope of the original channel bed (subscript 1), (S2 > S1). If the larger slope, S2, will not satisfy the equation, (SQ1/4 ≤0.0010), the possibility of the stream changing to a braided channel because of the steeper slope should be carefullyevaluated (see Section 2.3). With the steeper slope, there could be an increase in sediment transport which could causedegradation, and the effect would be extended both upstream and downstream of the relocated reach. Also, meanderpatterns could change. Considerable bank protection might be necessary to contain lateral migration which ischaracteristic of a braided channel, and if the slope is sufficiently steep, head cuts could develop which migrate upstreamwith attendant effects on the plan geometry of the channel. Even where changes in slope are not very large, a short-termadjustment of the average stream slope occurs beyond the upstream and downstream limits of channel realignment,consistent with the sediment transport rate, flow velocities and roughness.
Figure 68. Definition sketch for meanders (After [4]).
Based on a study of the stability of relocated channels, Brice presented the following recommendations and conclusions
Archive
d

regarding specific aspects of planning and construction of channel realignment [55]:Channel Stability Prior to Realignment. Assessment of the stability of a channel prior to realignment is needed toassess the risk of instability. An unstable channel is likely to respond unfavorably. Bank stability is assessed by fieldstudy and by stereoscopic examination of aerial photographs. The most useful indicators of bank instability are cutor slumped banks, fallen trees along the bank line, and exposed wide point bars. Bank recession rates aremeasured by comparison of time-sequential aerial photographs. Vertical instability is equally important but moredifficult to determine. It is indicated by changes in channel elevation at bridges and gaging stations. Seriousdegradation is usually accompanied by generally cut or slumped banks along a channel and by increased debristransport.
●
Erosional Resistance of Channel Boundary Materials. The stability of a channel, whether natural or relocated, ispartly determined by the erosional resistance of materials that form the wetted perimeter of the channel. Resistantbedrock outcrops in the channel bottom or that lie at shallow depths will provide protection against degradation, butnot all bedrock is resistant. Erosion of shale, or of other sedimentary rock types interbedded with shale, has beenobserved. Degradation is not a problem at most sites where bed sediment is of cobble and boulder size. However,degradation may result from the relocation of any alluvial channel, whatever the size of bed material, but theincidence of serious degradation of channels relocated by highway agencies is small in number. The erosionalresistance of channel beds tends to increase with clay content. Banks of weakly cohesive sand or silt are clearlysubject to rapid erosion, unless protected with vegetation. No consistent relation has been found between channelstability and the cohesion of bank materials, probably because of the effects of vegetation.
●
Length of Realignment. The length of realignment contributes significantly to channel instability at sites where itsvalue exceeds 250 channel widths. When the value is below 100 channel widths, the effects of length of relocationare dominated by other factors. The probability of local bank erosion at some point along a channel increases withthe length of the channel. The importance of vegetation, both in appearance and in erosion control, would seem tojustify a serious and possibly sustained effort to establish it as soon as possible on graded banks.
●
Bank Revetment. Revetment makes a critical contribution to stability at many sites where it is placed at bends andalong roadway embankments. Rock riprap is by far the most commonly used and effective revetment. Concreteslope paving is prone to failure. Articulated concrete block is effective where vegetation can establish in theinterstices between blocks.
●
Check Dams (drop structures). In general, check dams are effective in preventing channel degradation. Thepotential for erosion at a check dam depends on its design and construction, its height and the use of revetment onadjoining banks. A series of low check dams, less than about 1.5 feet in height, is probably preferable to a singlehigher structure, because the potential for erosion and failure is reduced (see Section 6.5). By simulating rapids, lowcheck dams may add visual interest to the flow in a channel. One critical problem arising with check dams relates toimproper design for large flows. Higher flows have worked around the ends of many installations to produce failure.
●
Maintenance. Problems which could be resolved by routine maintenance were observed along relocated channels.●
Archive
d

These were problems with the growth of annual vegetation, reduction of channel conveyance by overhanging trees,local bank cutting, and bank slumping. The expense of routine maintenance or inspection of relocated channelsbeyond the highway right-of-way may be prohibitive; however, most of the serious problems could be detected byperiodic inspection, perhaps by aerial photography, during the first 5 to 10 years after construction. Hydraulicengineers responsible for the design of relocated stream channels should monitor their performance to gainexperience and expertise.
6.6.8 Scour at Bridges
For a discussion of selection of countermeasures for scour at bridges, see Section 5.4. For information oncountermeasures for stream instability because of scour at bridges, see [23, 24, 26].
Go to Appendix A
Archive
d

Appendix A : HEC-20Illustrative Example - Level 1 and Level 2 Analyses
Go to Table of Contents
Introduction
This example is taken from HIRE [4] and was chosen to be incorporated into this text to illustrate the three level approach to riverstability problems. The example has been edited to correspond with the format of this text.
The Rillito River System in Tucson, Arizona provides an example of the problems encountered in bridge crossing design. Theobjective of this example is to illustrate to the designer the methodologies used in a stream stability analysis in support of bridgecrossing design.
Two bridge sites are considered which provide insight into several problems characteristic of the Rillito system. These are the SabinoCanyon Road site with an existing bridge crossing (constructed 1936) and the Craycroft Road site with a dip crossing (where theroadway is at the same elevation as the channel bed). Design improvements are being considered in the Sabino Canyon bridge, andit is proposed that the Craycroft dip crossing be replaced with a bridge. The study reach of Rillito River included approximately 11.5miles of channel extending from Dodge Boulevard to Agua Caliente Wash (see Figure 69). This included two miles on the RillitoRiver, six and one-half miles upstream of Craycroft Road on the Tanque Verde Creek, two miles upstream of Craycroft Road onPantano Wash, and one mile on Sabino Creek upstream of the confluence with Tanque Verde Creek.
Level 1 Analysis
Level 1 - Step 1: Stream Characteristics
The history of flood events and the recent geomorphology of the Rillito system has shown that it is very dynamic andillustrates the characteristics of a braided river. The channel is steep, dropping at the rate of 21 feet per mile. The bedmaterial is predominantly in the medium to coarse sand sizes. The natural sinuosity of the river is low. Additionally, theriver is generally unstable, changes alignment rapidly, carries large quantities of sediment, and is difficult to predict.
Level 1 - Step 2: Land Use Changes
A large portion of the river system is in the metropolitan area of Tucson where man's activities in, and adjacent to, theriver environment have induced a number of changes in the system. Primary Impacts on the system have occurred due toencroachment by urban development and channelization of segments of the river. Uncontrolled sand and gravelextraction has also led to even more rapid and significant changes in the river system. A secondary effect of urbanizationis a reduction in sediment supply and an increase in water runoff from tributaries draining urban areas. Undeveloped landin the study area generally has little protective cover and supplies large quantities of sediment to the river system.
Archive
d

However, extensive erosion control measures established for urban development and the creation of impermeable areasin these tributaries has reduced the sediment supply to the river system and increased runoff. As urbanization continuesthere will be a long-term decrease in sediment supply and an increase in runoff that will have a significant influence on thegeomorphology of the river system.
Figure 69. Rillito system vicinity map.
Level 1 - Step 3: Overall Stability
Much of the system has been significantly disturbed by human activities. Observed activities include channelization, sandand gravel mining, construction of bridges, construction of grade controls, road crossings, and encroachment byurbanization. Much of the system's shape and form, then, is dictated by man's activities rather than natural processes.This is especially true for the portions of the Rillito River and Pantano Wash within the study area. The Rillito River hasbeen subjected to major channelization upstream and downstream of Swan Road. There is also a large instream gravelpit below Swan Road. The Pantano Wash system has a large instream gravel pit below, and bank stabilization works inthe vicinity of Tanque Verde Boulevard. The results of these activities have been to change these systems from theirnatural braided forms to defined channels. Pantano Wash still possesses a stretch of over 3,000 feet which is braided.Tanque Verde Creek, however, has experienced less impact from man's activities than the other two systems. Theislands, bends, and natural channel alignment observed in the 1941 aerial photographs of Tanque Verde Wash are stillintact.
Archive
d

Level 1 - Step 4: Lateral Stability
In order to understand the lateral migration processes more thoroughly, 13 miles of Tanque Verde Wash above theconfluence with Pantano Wash were studied closely to determine the range of channel plan geometry. Meanderamplitudes, wave lengths, and radii of curvature were measured.
Meander wave length, channel width and radius of curvature (L, B. and rc) pairs were plotted for each meander loop.These points were plotted on logarithmic scales and on linear scales. Straight lines were fitted and the following equationswere obtained and adopted for the lower 13 miles of the Tanque Verde Creek:
These relationships are used to determine appropriate channel widths and bend shapes at the Sabino Canyon RoadBridge site.
Sabino Canyon Road Bridge is currently located on a bend with a curvature that creates several problems. At low flows,scour occurs at the outside of the bend (south side) because of high velocity and secondary currents. This phenomena isevident in the present channel cross section under the bridge. At flood flows, the problem is nearly the opposite. The northside of the bridge is attacked because of the tendency of the thalweg to straighten out the bend. The amplitude of themeander bend is 300 feet. Therefore, the lateral migration tendency is on the order of 300 feet.
These facts point to the necessity for engineering control measures to be taken at Sabino Canyon Road Bridge in order toprevent future failure of the structure from lateral migration.
Level 1 - Step 5: Vertical Stability
Four bridge sites exist in the study area at Dodge Boulevard, Swan Road, Sabino Canyon Road, and Tanque VerdeRoad. Measures have been taken at Craycroft Crossing to stabilize the crossing during the low flows and as a result thecrossing is acting as a grade control on the Pantano Wash. Stabilization measures have not been successful on the northside of Craycroft and no grade control has formed. Complex hydraulic conditions exist at the confluence of Tanque VerdeCreek and Pantano Wash during the 100-year flood. Divided flow occurs with flood water spilling laterally into PantanoWash from Tanque Verde Creek during a flood from that watershed, or flood water spills to Tanque Verde Creek fromPantano Wash during a flood from the Pantano watershed.
The bridges across the Rillito River and Tanque Verde Creek span a variety of channel conditions. The sedimentation anderosion processes due to the proposed bridges will depend on the extent to which the bridge influences the hydraulicconditions in the river (primarily the velocity and depth). Conversely, the changing form of the channel due to lateralmigration or long-term changes in the channel profile can alter the hydraulic conditions at the bridge. The DodgeBoulevard bridge is assumed to be the downstream control for the study reach.
Archive
d

This assumption is valid because the bridge crosses a channelized section of the Rillito River which has little influence onthe water surface elevation in the channel for the 100-year flood. The downstream boundary hydraulic condition isassumed to be uniform flow.
Level 1 - Step 6: Stream Response
A braided river can be identified by the equation
in which S is the average bed slope and Q is the dominant discharge (cfs). The mean annual flood of 5,000 cfs isassumed to represent dominant conditions in the system. The average slope of 13.1 miles of the Tanque Verde Creekand Rillito River is 0.0044. This slope and discharge give a value of 0.037, which is well within the braided range (seeChapter 2.0, Figure 8). Pantano Wash has a slightly steeper grade, which would place it even further into the braidedrange. Even though much of the river has been channelized, it should be recognized that the river is in the braided rangeand, hence, is very dynamic.
Often, the general response of a river system to a flood event can be qualitatively assessed by studying its profile andplan view. This is especially true of a system which has been altered by man. This type of analysis is based on estimatingthe relative velocity along the system. In locations where a channel is constricted or the profile steepens, the velocitywould be expected to increase. Since velocity is the dominant factor in determining sediment transport rate (when thesediment size does not change greatly), areas with large increases in velocity should degrade; areas where velocities areslowed considerably should experience aggradation. This is expressed in Lane's relationship, which can be written
In this relationship, Q s is the sediment transport rate, D50 is the median sediment size, Q is the flow rate of water and S isthe slope of the bed (see Section 2.3).
For example, the instream gravel pit below Swan Road will trap sediment and reduce sediment supply to the downstreamreach. This can be expressed using the Lane relationship as:
From this, one would expect an overall response of possible degradation in the reach of the Rillito River below the gravelpit to Dodge Boulevard. A similar application of the Lane relationship to various reaches in the study area indicates thatover half of the channel reaches are well balanced for sediment transport. None of the reaches has a great potential for
Archive
d

either aggradation or degradation. In all, the system should not experience large bed elevation changes except for thoserelated to increased development by man and localized flow conditions.
Potential Local Problems at the Proposed Craycroft Road Bridge
Each badge site has possible problems associated with local erosion and sedimentation processes. These problems areidentified below.
Location of the bridge at the confluence of Tanque Verde and Pantano Wash (Figure 70) can cause several problems.First, the confluence of two sand-bed rivers is usually very dynamic and can shift upstream or downstream and laterallyquite quickly. This is especially true when an abnormal sequence of events results in a shift in the relative balance of flowsbetween the two rivers. To compound this problem, the grade control structure has created a situation in which PantanoWash has a bed elevation several feet higher than Tanque Verde Creek at the same location. This provides an additionaltendency for flows from Pantano Wash to migrate toward Tanque Verde Creek creating a situation in which the flow couldattack the bridge piers and abutments at angles other than designed. As a result, local scour around piers and abutmentscould be significantly increased.
Neither Pantano Wash nor Tanque Verde Creek can contain a 100-year flood within its own channel. Since the twousually do not reach peak flows at the same time, the flow spills out of the flooding channel across the floodplain areabetween the two channels and into the opposite channel. In the process, the overflow deposits most of its sediment in thefloodplain and the clear water entering the opposite channel causes degradation. There is also the problem of poor flowalignment past piers and abutments.
Potential Local Problems of the Sabino Canyon Road Bridge Site
The Sabino Canyon Road Bridge site (see Figure 71) has several potential erosion and sedimentation problems thatshould be considered in the bridge design. The present bridge has already experienced several such problems. The flowarea of the bridge appears to be inadequate for the 100-year flood event. Over four feet of scour has occurred around thebridge piers and abutments. In addition, the channel is located on a reach that is migrating to the left (lookingdownstream). This is causing the left abutment to be attacked. The migration tendency of Tanque Verde Creek is largelydue to its braided nature and its lack of confinement by bank stabilization or channelization works.
Considerable scour is occurring on the left side of the channel under the bridge since it is located on the outside of theslight bend. This is the usual case with a river bend because high-velocity flow and secondary currents scour sedimentfrom the outside of the slight bend.
The final consideration is the gravel mining from the river. Currently, there is a mine approximately 3,000 feet upstream ofthe bridge. The pit could act as a sediment trap and cause scour downstream of the pit near the bridge site as the waterremoves sediment from the bed to regain an equilibrium sediment transport rate. Because of the distance, the threat is notlarge from the present activity, considering the passage of the 100-year flood; however, gravel mining operations locatedcloser to the bridge site could cause problems if not properly managed. In addition, over a long period of time theoverextraction of sand and gravel can cause significant degradation for the entire reach downstream of the operating site,and possible headcuts upstream of the mining.
Archive
d

Figure 70. Sketch of Craycroft Road Bridge crossing.Arch
ived

Figure 71. Sabino Canyon Road crossing site.
Archive
d

Level 2 Analysis
Level 2 - Step 1: Flood History
The Rillito River is formed by the confluence of Pantano Wash and Tanque Verde Creek (see Figure 69) northeast ofTucson and flows west-northwest about 12 miles to its confluence with the Santa Cruz River.
Precipitation in the Rillito River watershed is produced by three types of storms: general winter storms, general summerstorms, and local thunderstorms. The general winter storms usually last for several days and result in widespreadprecipitation. General summer storms are often accompanied by relatively heavy precipitation over large areas for periodsof up to 24 hours. Local thunderstorms can occur at any time of the year; however they cover comparatively small areasand cause high-intensity precipitation for a few hours.
The flow in the Rillito River is intermittent; the creek is almost always dry, other than during or immediately after rain. TheUSGS gaging station on the Rillito River near Tucson kept daily discharge records from October, 1908 to September,1975, after which it was converted to a crest-stage partial-record station.
Utilizing the USGS records at Rillito Station, all of the extreme events since 1915 are plotted in Figure 72. Based on theseflood data the flood frequency curves are plotted on log-normal paper (Figure 73). The USGS log-Pearson Type IIIanalysis is shown in Table 8. By reviewing historical floods which occurred in the Rillito River system, and judging fromthe physical characteristics of Tanque Verde Creek watershed and Pantano watershed, one may conclude that the floodpeaks in Tanque Verde Creek are almost independent of those from Pantano Wash. The chance of simultaneousoccurrence of both peaks is very small.
The hydrograph of the 1965 flood observed at the Rillito River gage near Tucson (Figure 74) was used to establish the100-year flood hydrographs for Tanque Verde Creek and Pantano Wash. The design hydrographs for the 100-year floodfor Tanque Verde Creek, Sabino Creek, Pantano Wash, Ventana Wash, and Alamo Wash are given in Figure 75.
Level 2 - Step 2: Hydraulic Conditions
During the December 1965 flood, the Rillito River was in upper regime, having antidunes with breaking waves (seeChapter 3, Figure 13a). The bed forms of the channels in the study system will be antidunes or standing waves duringfloods. Resistance to flow associated with antidunes depends on how often the antidunes form, the area of the reach theyoccupy, and the violence and frequency of their breaking. If many antidunes break, resistance to flow can be largebecause breaking waves dissipate a considerable amount of energy. With breaking waves, Manning's coefficient n couldrange from about 0.019 to 0.038 for the flow depths being considered.
The existing channels will not contain all of the 100-year flood flows. Some overbank flow will occur. Sparse vegetation,brush, trees and houses are in the floodplain. These elements increase the resistance to flow. For a conservative erosionand sedimentation analysis (high channel velocity), a Manning's roughness of 0.025 for the main channels was assumedfor this study. For overbank flows, a higher Manning's n value of 0.05 was used from Dodge Boulevard to Sabino Creekand an n value of 0.06 was used from Sabino Creek to Agua Caliente Wash.
Archive
d

Table 8. Rillito river near Tucson, Arizona,log-Pearson type III frequency analysis By USGS.
Exceedance Probability Return Period (year) Expected Discharge (cfs)95% Confidence Limit
(One-Sided Test)Lower (cfs) Upper (cfs)
0.50000.20000.10000.04000.02000.01000.00500.0020
25
102550
100200500
5,0009,300
12,50017,20021,10025,20029,80035,700
4,2407,67010,10013,30015,80018,40020,90024,400
5,80011,10015,60022,00027,30033,00039,20047,800
Water surface profile calculation from Dodge Boulevard to Agua Caliente Wash was conducted using the Corps ofEngineers HEC-2 program. The main channel roughness was reduced to near the lower limit of the river flow regimeexpected during the 100-year flood. The hydraulic conditions are predominantly subcritical up to Sabino Creek. The reachfrom Sabino Creek to Agua Caliente Wash increases its gradient and a mix of subcritical and supercritical hydraulicconditions is possible.
Figure 72. Flood event at Rillito River near Tucson, Arizona (drainage area 915 square miles).
Archive
d

Figure 73. Log-normal frequency analysis for Rillito River near Tucson.Archive
d

Figure 74. December 1965 flood in Rillito River and Tanque Verde Creek.
Archive
d

Figure 75. 100-year flood design hydrographs.
Level 2 - Step 3: Bed and Bank Material
Sediment size is one of the most important parameters used in evaluating sediment transport. A thorough sedimentsampling survey was conducted on the river system, consisting of 41 bed material samples. Variation of the sizedistribution within these segments of the river did not follow an identifiable trend, and therefore an average sizedistribution was used and the variation from the average size distribution was assumed to be sampling error. Three sizedistributions were used to cover the river segments from Dodge Boulevard to Pantano Wash (including Pantano Wash),Pantano Wash to Sabino Creek, and Sabino Creek to Agua Caliente Wash. Figure 76 shows the size distribution used fordesign on various segments of the river system. The size distribution of Pantano Wash is included to illustrate its similarityto the Rillito River size distribution.
Subsurface bed material samples and bank material samples were also taken. The subsurface bed material is slightlycoarser in most cases, but still lacked sizes in the nontransporting range (see Level 2CStep 5). Bed material samples hadmore fine material and these distributions varied substantially from one location to the next.
Figure 76. Rillito-Pantano-Tanque Verde bed sediment distribution.
Level 2 - Step 4: Watershed Sediment
Archive
d

In arid region sand bed channels with significant undeveloped watersheds, it is generally reasonable to assume thatequilibrium conditions exist. That is, the watershed sediment supply/yield is equal to the sediment transport capacity of thechannel.
An indirect check of the sediment supply/sediment transport rate determinations was available on Tanque Verde Creek.This area has undergone the least change in river form of all the locations in the study area. The 1941 and present aerialphotographs show this portion of the system to have remained nearly unchanged. Therefore, it is expected that thesereaches must have sediment transporting capacities near equilibrium.
Another factor that helped provide a reliable determination of sediment supply was the grade control structure on PantanoWash at the Craycroft Road Bridge site. A channel will quickly come to equilibrium behind such a structure since theresults of an excess or imbalance in sediment transport rate to the structure are corrected by removal or storage ofmaterial behind the structure. This process allows the channel to quickly reach equilibrium behind the structure byproducing a channel bed slope that will result in a sediment transport rate equal to the incoming supply.
Level 2 - Step 5: Incipient Motion and Step 6: Armoring Potential
A large percentage of sediment in the study reach falls in the coarse sand and fine gravel range with less than 10 percentclassified as medium gravel. Very coarse gravels are not present. From an analysts based on Shields' criteria (seeChapter 4.0, Equation 12), all sizes present can be easily transported by the mean annual storm. Formation of anarmoring layer on the bed is unlikely since coarse, nontransportable particle sizes are missing from the distribution.
Level 2 - Step 7: Rating Curves
The stage-discharge plot for the USGS gaging station on Rillito River near Tucson is shown in Figure 77. In this plot, thegage height values from the flood observations have been converted to equivalent stages at the present sites, based onthe gage datum information given below. The shifting of the stage-discharge relationships from early years to 1970 is alsoindicated in this plot. For a given discharge the water surface elevation drops about three feet from the 1956n1965 curveto the 1966 curve and drops another two feet to the 1974n1978 curve. The decrease of the water surface elevation at thisstation is a result of the channel degradation since 1956.
Level 2 - Step 8: Scour Analysis
Each of the bridges has its own unique problems that must be considered in the formulation of alternative designs.Analysis of the design alternative is broken into three areas: (1) low chord criteria, (2) total scour criteria, and (3) otheradditional considerations.
When designing a bridge foundation, proper consideration of scour must be made to determine the required safe depth ofpiles or other supports. A design which gives adequate support for the structure when the channel bed is at its initialelevation may be inadequate after scour occurs and lowers the channel bed. The physical processes that must beconsidered are long-term changes in bed elevation, local scour, contraction scour, and passage of sand waves. The totalscour is the sum of these, and must be subtracted from the initial design elevation to establish the design depth for allsupports. The supports must have a depth of burial below this elevation sufficient to support the structure (see HEC-18
Archive
d

[23]).
Figure 77. Stage-discharge plot for Rillito River near Tucson.
ConclusionsThe results of Level 1 and 2 analyses of the Rillito River system have demonstrated that scour will be a significant factor in bridgedesign. Due to the complexity of channel response in this region, a Level 3 analysis was undertaken. For details of that analysis andthe resulting bridge design alternatives, the reader is referred to HIRE [4] (pp. VII-112 to VII-122).
Go to Table of Contents Archive
d

List of Tables for HEC 20-Stream Stability at Highway Structures
Back to Table of Contents
Table 1. Sediment grade scale
Table 2. Base values of Manning's n(nb).
Table 3. Adjustment factors for the determination of n values for channels.
Table 4. Manning's roughness coefficients for alluvial sand bed channels (no vegetation).
Table 5. List of data sources.
Table 6. Interpretation of observed data.
Table 7. Spur type performance.
Table 8. Rillito river near Tucson, Arizona, log-Pearson type III frequency analysis By USGS.
Back to Table of Contents
Archive
d

List of Equations for HEC 20-Stream Stability at Highway Structures
Back to Table of Contents
Equation 1
Equation 2
Equation 3
Equation 4
Equation 5
Equation 6
Equation 7
Equation 8
Equation 9
Equation 10
Equation 11
Equation 12
Equation 13
Equation 14
Equation 15
Equation 16
Equation 17
Back to Table of Contents Archive
d

Go to Table of Contents
1.Report No.
FHWA-IP-90-014HEC-20
2.Government Accession No. 3.Recipient's CatalogNo.
4.Title and Subtitle
Stream Stability at Highway Structures
5.Report Date
February 19916.PerformingOrganization Code
7.Author(s)
P.F. Lagasse, J.D. Schall, F. Johnson, E.V. Richardson, J.R.Richardson, F. Chang
8.PerformingOrganization Report No.
9.Performing Organization Name and Address
Resource Consultants, Inc.402 West Mountain AvenueP.O. Box QFort Collins, Colorado10.Work Unit No.(TRAIS)
3D9C004311.Contract or Grant No.
DTFH61-89-C-0000312.Sponsoring Agency Name and Address
Office of Technology Applications, HTA-22Federal Highway Administration400 Seventh Street,S.W.Washington D.C.20509
13.Type of Report andPeriod Covered
Final ReportJanuary 1987nJuly199014.Sponsoring AgencyCode
15.Supplementary Notes
Project Manager: Thomas KrylowskiTechnical Assistants: Philip L. Thompson, Lawrence J. Harrison, Roy Trent
Archive
d
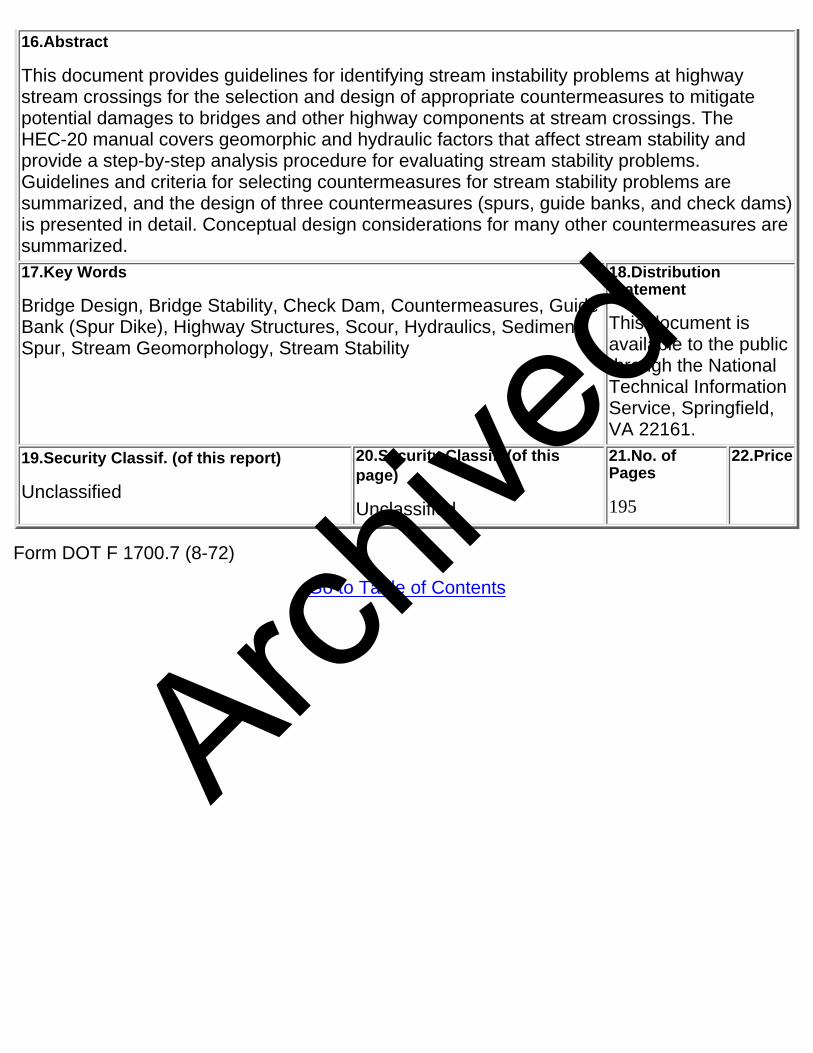
16.Abstract
This document provides guidelines for identifying stream instability problems at highwaystream crossings for the selection and design of appropriate countermeasures to mitigatepotential damages to bridges and other highway components at stream crossings. TheHEC-20 manual covers geomorphic and hydraulic factors that affect stream stability andprovide a step-by-step analysis procedure for evaluating stream stability problems.Guidelines and criteria for selecting countermeasures for stream stability problems aresummarized, and the design of three countermeasures (spurs, guide banks, and check dams)is presented in detail. Conceptual design considerations for many other countermeasures aresummarized.17.Key Words
Bridge Design, Bridge Stability, Check Dam, Countermeasures, GuideBank (Spur Dike), Highway Structures, Scour, Hydraulics, Sediment,Spur, Stream Geomorphology, Stream Stability
18.DistributionStatement
This document isavailable to the publicthrough the NationalTechnical InformationService, Springfield,VA 22161.
19.Security Classif. (of this report)
Unclassified
20.Security Classif. (of thispage)
Unclassified
21.No. ofPages
195
22.Price
Form DOT F 1700.7 (8-72)
Go to Table of Contents
Archive
d

1.0 Introduction
Go to Chapter 2
1.1 PurposeThe purpose of this document is to provide guidelines for identifying stream instability problemsat highway-stream crossings and for the selection and design of appropriate countermeasuresto mitigate potential flood damages to bridges and other highway components at streamcrossings.
1.2 BackgroundApproximately 86 percent of the 577,000 bridges in the National Bridge Inventory (NBI) are builtover streams. A large proportion of these bridges span alluvial streams that are continuallyadjusting their beds and banks. Many, especially those on more active streams, will experienceproblems with scour and bank erosion during their useful life. The magnitude of these problemsis demonstrated by the average annual flood damage repair costs of approximately $50 millionfor highways on the Federal-aid system. The Federal-aid system contains less than half of allbridges in the NBI.
1.3 Factors That Affect Stream Stability
Factors which affect stream stability and, potentially, bridge stability at highway streamcrossings can be classified as geomorphic factors and hydraulic factors. Rapid and unexpectedchanges can occur in streams in response to man's activities in the watershed and/or naturaldisturbances of the fluvial system, making it important to anticipate changes in channelgeomorphology, location and behavior. Geomorphic characteristics of particular interest to thehighway engineer are the alignment, geometry, and form of the stream channel. The behaviorof a stream at a highway crossing depends not only on the apparent stability of the stream atthe bridge, but also on the behavior of the stream system of which it is a part. Upstream anddownstream changes may affect future stability at the site. Natural disturbances such as floods,drought, earthquakes, landslides, forest fires, etc., may result in large changes in sediment loadin a stream and major changes in the stream channel. These changes can be reflected inaggradation, degradation, or lateral migration of the stream channel.
The bed material of a stream can be a cohesive material, sand, gravel, cobbles, boulders, orbedrock. Bank material is also composed of these materials and may be dissimilar from the bedmaterial. Obviously, the stability and the rate of change in a stream is dependent on thematerial in the bed and banks.
Man-made changes in the drainage basin and the stream channel, such as alteration of
Archive
d

vegetative cover and changes in pervious (or impervious) area can alter the hydrology of astream, sediment yield and channel geometry. Channelization, stream channel straightening,streamside levees and dikes, bridges and culverts, reservoirs, gravel mining, and changes inland use can have major effects on stream flow, sediment transport, and channel geometry andlocation. Geomorphic factors are discussed in Chapter 2.0.
Hydraulic factors which affect stream channel and bridge stability are numerous and includebed forms and their effects on sediment transport, resistance to flow, flow velocities and flowdepths; the magnitude and frequency of floods; characteristics of floods, (i.e., duration, time topeak, and time of recession); and flow classification (e.g., unsteady, nonuniform, turbulent,supercritical or subcritical); ice and other floating debris in the flow; flow constrictions; bridgelength, location, orientation, span lengths, pier location and design; superstructure elevationand design; the location and design of countermeasures; and the effects of natural andman-made changes which affect the hydrology and hydraulic flow conditions of the stream. Inthe bridge reach, bridge design and orientation can induce contraction scour and local scour atpiers and abutments. Hydraulic factors are discussed in Chapter 3.0.
1.4 Countermeasures
Numerous measures are available to counteract the actions of man and nature whichcontribute to the instability of alluvial streams. These include measures installed in or near thestream to protect highways and bridges by stabilizing a local reach of the stream, andmeasures which can be incorporated into the highway design to ensure the structural integrityof the highway in an unstable stream environment. The selection, location, and design ofcountermeasures are dependent on hydraulic and geomorphic factors that contribute toinstability, as well as costs and construction and maintenance considerations.
1.5 Manual Organization
This manual is organized to: (1) familiarize the user with the important geomorphic andhydraulic factors which are indicators of and contributors to potential and existing stream andbridge stability problems (Chapter 2.0 and Chapter 3.0), (2) provide a procedure for theanalysis of potential and existing stability problems (Chapter 4.0), and (3) provide guidance forselecting and designing appropriate countermeasures to mitigate instability problems (Chapter5.0 and Chapter 6.0, respectively). Finally, Chapter 7.0 contains selected references, andAppendix A is an illustrative example of Stream Stability Analysis.
Go to Chapter 2
Archive
d

7.0 References
1. Brice, J.C., and J.C. Blodgett, "Countermeasures for Hydraulic Problems atBridges, Vol. 1, Analysis and Assessment," FHWA/RD-78-162, Federal HighwayAdministration, Washington, D.C.1978. Available from the National TechnicalInformation Service, 5285 Port Royal Road, Springfield, Virginia 22161 (NTIS).
2. Brice, J.C., and J.C. Blodgett, "Countermeasures for Hydraulic Problems atBridges," Vol 2., Case Histories for Sites 1n283," FHWA/RD-78-163, FederalHighway Administration, Washington, D.C. 1978. Available from the NTIS.
3. Schumm, S.A., "The Fluvial System", Wiley and Sons, 1977.
4. Richardson, E.V., D.B. Simons, and P.Y. Julien, "Highways in the RiverEnvironment," prepared for the Federal Highway Administration, Washington, D.C.by the Department of Civil Engineering, Colorado State University, Fort Collins,Colorado, June, 1990.
5. Shen, H.W., S.A. Schumm, J.D. Nelson, D.O. Doehring, and M.M. Skinner, "Methods for Assessment of Stream-Related Hazards to Highways and Bridges,"FHWA/RD-80/160, Federal Highway Administration, Washington, D.C., 1981. Available from the NTIS.
6. Brown, S.A., "Streambank Stabilization Measures for Highway StreamCrossingsCExecutive Summary," FHWA/RD-84/099, Federal HighwayAdministration, Washington, D.C. 1985. Available from the NTIS.
7. Lane, E.W., "A Study of the Shape of Channels Formed by Natural StreamsFlowing in Erodible Material," M.R.D. Sediment Series No. 9, U.S. Army EngineersDivision, Missouri River, Corps of Engineers, Omaha, Nebraska, 1957.
8. Leopold, L.B., and M.G. Wolman, "River Meanders," Geological Society Am.Bulletin Vol. 71,1960.
9. Lane, E.W., 1955, "The Importance of Fluvial Geomorphology in HydraulicEngineering," ASCE Proceeding, Vol. 81, No. 745, pp. 1n17.
10. Leopold, L.G., and T. Maddock, Jr., "The Hydraulic Geometry of StreamChannels and Some Physiographic Implications," Professional Paper 252, U.S.Geological Survey, 1953.
11. Schumm, S.A., "Fluvial Geomorphology: Channel Adjustment and RiverMetamorphosis," In River Mechanics, Vol. 1, H.W. Shen (ed), pp. 5.1n5.22, 1971.
Archive
d

12. Santos-Cayado, J., "State Determination for High Discharges," Ph.D.Dissertation, Department of Civil Engineering, Colorado State University, FortCollins, Colorado, 1972.
13. Water Resources Council, Hydrology Committee, "Guidelines for DeterminingFlood Frequency," Bulletin 17B, U.S. Water Resources Council, Washington, D.C.1981.
14. U.S. Department of Transportation, FHWA, , "Hydrology," Hydraulic EngineeringCircular No. 19, Turner-Fairbank Research Center, McLean, Virginia,FHWA-IP-84-15, October 1984.
15. Cowan, W.L., "Estimating Hydraulic Roughness Coefficients," AgriculturalEngineering, Vol. 37, pp. 473n475, 1956.
16. Arcement, G.K., and V.R. Schneider, "Guide for Selecting Manning'sRoughness Coefficients for Natural Channels and Flood Plains," U.S. GeologicalSurvey Water Supply Paper 2339, 1984.
17. Anderson, A.G., A.S. Paintal, and J.T. Davenport, "Tentative DesignProcedure for Riprap-Lined Channels," Highway Research Board, NCHRPREPORT NUMBER 108, 1970.
18. Limerinos, J.T., "Determination of the Manning's Coefficient for Measured BedRoughness in Natural Channels," Water Supply Paper 1891-B, U.S. GeologicalSurvey, 1970.
19. Bradley, J.N., 1978, "Hydraulics of Bridge Waterways," Hydraulic Design SeriesNo. 1, U.S. Department of Transportation, FHWA.
20. Woodward, S.M., "Hydraulics of the Miami Flood Control Project," TechnicalReports, Pt. VII, Miami Conservancy District, Dayton, Ohio, 1920.
21. Neill, C.R., editor, "Guide to Bridge Hydraulics," prepared by Project Committeeon Bridge Hydraulics, Roads and Transportation Association of Canada, Universityof Toronto Press, 1972.
22. AASHTO Task Force on Hydrology and Hydraulics, Highway Subcommittee onDesign, "Hydraulic Analyses for the Location and Design of Bridges," Volume VII,Highway Drainage Guidelines, American Association of State Highway andTransportation Officials, 444 North Capitol Street, N. W., Suite 225, Washington,D.C. 20001, 1982.
23. U.S. Department of Transportation, FHWA, 1990, "Evaluating Scour at Bridges,"Hydraulic Engineering Circular No. 18, Office of Engineering, Bridge Division(Draft), Washington, D.C.
24. U.S. Department of Transportation, FHWA, Technical Advisory, 1988, "Scour atBridges" and "Interim Procedures for Evaluating Scour at Bridges," Office ofEngineering, Bridge Division, Washington, D.C.
Archive
d

25. Raudkivi, A.J., "Functional Trends of Scour at Bridge Piers," Journal ofHydraulic Engineering, Vol. 112, No. 1, American Society of Civil Engineers, UnitedEngineering Center, New York, New York 10017, January 1986.
26. Jones, J.S., 1989, "Laboratory Studies of the Effect of Footings and Pile Groupson Bridge Pier Scour," Proceeding of 1989 Bridge Scour Symposium, FHWA,Washington, D.C.
27. Keefer, T.N., R.S. McQuivey, and D.B. Simons, 1980, "Interim ReportCStreamChannel Degradation and Aggradation: Causes and Consequences to Highways,"FHWA/RD-80/038, Federal Highway Administration, Washington, D.C.
28. Brown, S.A., R.S. McQuivey, and T.N. Keefer, 1980, "Stream ChannelDegradation and Aggradation: Analysis of Impacts to Highway Crossings,"FHWA/RD-80-159, Federal Highway Administration, Washington, D.C.
29. Leopold, L.B., W.W. Emmett, and R.M. Myrick, 1966, "Channel and HillslopeProcesses in a Semiarid Area, New Mexico," U.S. Geological Survey ProfessionalPaper 352-G, U.S. Geological Survey, Washington, D.C.
30. Pacific Southwest Interagency Committee (PSIACS), 1968, Report on FactorsAffecting Sediment Yield in the Pacific Southwest Areas, Water ManagementSubcommittee Sediment Task Force.
31. Wischmeier, W.H. and D.D. Smith, 1978, "Predicting Rainfall Erosion Losses,"Agricultural Handbook 537, Science and Education Administration, USDA.
32. Meyer-Peter, E. and R. Muller, 1948, "Formulas for Bed Load Transport, Proc.,"3rd Meeting of IAHR, Stockholm, pp. 39n64.
33. Gessler, J., 1971, "Beginning and Ceasing of Sediment Motion," RiverMechanics, Chapter 7, edited by H. W. Shen, Fort Collins, Colorado, 22 pp.
34. Soil Conservation Service, 1977, "Design of Open Channels," TechnicalRelease No. 25, October.
35. U.S. Bureau of Reclamation, 1984, "Computing Degradation and Local Scour,"Technical Guideline for Bureau of Reclamation, prepared by E.L. Pemberton andJ.M. Lara, January.
36. Rantz, S.E. et al., 1982, "Measurement and Computation of Streamflow:Volume 2." Computation of Discharge, Geological Survey Water Supply Paper2175, Government Printing Office, Washington, D.C.
37. Brown, S.A., 1985, "Streambank Stabilization Measures for HighwayEngineers," FHWA/RD-84.100, Federal Highway Administration, McLean, Virginia.
38. Brown, S.A., and E.S. Clyde, "Design of Riprap Revetment," HydraulicEngineering Circular No. 11, FHWA-IP-89-016. Prepared for the Federal Highway
Archive
d

Administration, Washington, D.C. 1989.
39. U.S. Army Corps of Engineers, "The Streambank Erosion Control Evaluationand Demonstration Act of 1974," Final Report to Congress, Executive Summaryand Conclusions, 1981.
40. Brice, J.C., "Assessment of Channel Stability at Bridge Sites," TransportationResearch Record, Vol. 2, No. 950, 1984. Transportation Research Board, 2101Constitution Avenue, Washington, D.C. 20418.
41. Keeley, J.W., "Bank Protection and River Control in Oklahoma," FederalHighway Administration, Washington, D.C. 1971.
42. Richardson, E.V., and D.B. Simons, "Use of Spurs and Guidebanks forHighway Crossings," Transportation Research Board, Vol. 950, No. 2,Transportation Board, Washington, D.C.,1984, pp. 184n193.
43. Colson, B.E. and K.V. Wilson, "Hydraulic Performance of BridgesCEfficiency ofEarthen Spur Dikes in Mississippi," MSHD-RD-73-15-SD, Mississippi StateHighway Department, Jackson, Mississippi, in cooperation with the FederalHighway Administration, 1973.
44. Brown, S.A., "Design of Spur-Type Streambank Stabilization Structures, FinalReport," FHWA/RD-84-101, Federal Highway Administration, Washington, D.C.1985. Avavilable from the NTIS.
45. Karaki, S.S., "Hydraulic Model Study of Spur Dikes for Highway BridgeOpenings," Colorado State University, Civil Engineering Section, ReportCER59SSK36, September, 1959, 47 pp.
46. Karaki, S.S., "Laboratory Study of Spur Dikes for Highway Bridge Protection,"Highway Research Board Bulletin 286, Washington, D.C., 1961, p. 31.
47. Neeley, B.L., Jr., "Hydraulic Performance of Bridges in the State of Mississippi,"U.S. Geological Survey, Jackson, Mississippi, June 30, 1966. (Unpublished report).
48. Pemberton, E.L., and J.M. Lara, "Computing Degradation and Local Scour,"Technical Guidelines for Bureau of Reclamation, Engineering Research Center,Denver, Colorado, January 1984.
49. Peterka, A.J., "Hydraulic Design of Stilling Basins and Energy Dissipators,"Engineering Monograph No. 25, Bureau of Reclamation, Division of Research,Denver, Colorado, 1964.
50. Keown, M.P., "Streambank Protection Guidelines for Landowners and LocalGovernments," U.S. Army Corps of Engineers, Waterways Experiment Station,Vicksburg, Mississippi, 1983.
51. Portland Cement Association, 1984, "Soil-Cement for Facing Slopes and Lining
Archive
d

Channels, Reservoirs, and Lagoons," PCA Publication IS126.05W, Skokie, Illinois.
52. Portland Cement Association, 1984, "Soil-Cement Slope Protection forEmbankments: Planning and Design," PCA Publication IS173.02W, Skokie, Illinois.
53. Odgaard, A. J., and C. E. Mosconi, "Streambank Protection by SubmergedVanes," Journal of Hydraulic Engineering, Vol. 113, No. 4, American Society of CivilEngineers, United Engineering Center, New York, New York 10017, April 1987, pp.520n536.
54. Odgaard, A. J., and Y. Wang, "Sediment Control in Bridge Waterways," inProceedings of the Bridge Scour Symposium, FHWA, McLean, Virginia, October17n19, 1989.
55. Brice, J.C., "Stability of Relocated Stream Channels," FHWA/RD-80/158,Federal Highway Administration, Washington, D.C., March 1981. Available fromthe NTIS.
ADDITIONAL REFERENCES
1. Chang, Howard H., Fluvial Processes in River Engineering, San Diego StateUniversity, San Diego, California. A Wiley-Interscience Publication, John Wiley &Sons, New York, 1988.
2. Gregory, K.J., River Channel Changes, University of Southampton, aWiley-Interscience Publication, John Wiley & Sons, New York, 1977.
3. Hey, R.D., J.C. Bathurst, and C.R. Thorne, Gravel-Bed Rivers, FluvialProcesses, Engineering and Management. A Wiley-Interscience Publication, JohnWiley & Sons, New York, 1982.
4. Leopold, Luna B., M. Gordon Wolman, and John P. Miller, "Fluvial Processes inGeomorphology," W.H. Freeman and Company, San Francisco, 1964.
5. Schumm, Stanley A., "River Morphology," Benchmark Papers in Geology,Colorado State University, Fort Collins, Colorado, Dowden, Hutchinson & Ross, Inc.1972.
6. Schumm, Stanley A., The Fluvial System, Department of Earth Resources,Colorado State University, Fort Collins, Colorado. A Wiley-Interscience Publication,John Wiley & Sons, New York, 1977.
7. Vanoni, Vito A., Sedimentation Engineering, ASCE Manuals and Reports onEngineering PracticeCNo. 54, prepared by the ASCE Task Committee for thePreparation of the Manual on Sedimentation of the Sedimentation Committee of theHydraulics Division, 1975.
Archive
d

Glossary : Hec 20
abrasion: Removal of streambank material due toentrained sediment, ice, or debris rubbingagainst the bank.
afflux: Backwater, the increase in water surfaceelevation upstream of a bridge relative to theelevation occurring under natural conditions.
aggradation: General and progressive buildup of thelongitudinal profile of a channel bed due tosediment deposition.
alluvial channel: Channel wholly in alluvium; no bedrock isexposed in channel at low flow or likely to beexposed by erosion.
alluvial fan: A fan-shaped deposit of material at the placewhere a stream issues from a narrow valley ofhigh slope onto a plain or broad valley of lowslope. An alluvial cone is made up of the finermaterials suspended in flow while a debriscone is a mixture of all sizes and kinds ofmaterials.
alluvial stream: A stream which has formed its channel incohesive or noncohesive materials that havebeen and can be transported by the stream.
alluvium: Unconsolidated material deposited by water.alternating bars: Elongated deposits found alternately near the
right and left banks of a channel.anabranch: Individual channel of an anabranched stream.anabranched stream: A stream whose flow is divided at normal and
lower stages by large islands or, more rarely,by large bars; individual islands or bars arewider than about three times water width;channels are more widely and distinctlyseparated than in a braided stream.
apron: Protective material placed on a streambed toresist scour.
apron, launching: An apron designed to settle and protect theside slopes of a scour hole after settlement.
Archive
d

armor: Surfacing of channel bed, banks, orembankment slope to resist erosion and scour.
armoring: (a) Natural process whereby anerosion-resistant layer of relatively largeparticles is formed on a streambed due to theremoval of finer particles by streamflow; (b)placement of a covering to resist erosion.
articulated concrete mass: Rigid concrete slabs which can move withoutseparating as scour occurs; usually hingedtogether with corrosion-resistant wire fasteners;primarily placed for lower bank protection.
average velocity: Velocity at a given cross section determined bydividing discharge by cross-sectional area.
avulsion: A sudden change in the channel course thatusually occurs when a stream breaks throughits banks; usually associated with a flood or acatastrophic event.
backwater: The increase in water surface elevation relativeto the elevation occurring under naturalchannel and floodplain conditions. It is inducedby a bridge or other structure that obstructs orconstricts the free flow of water in a channel.
backwater area: The low-lying lands adjacent to a stream thatmay become flooded due to backwater.
bank: The side slopes of a channel between whichthe flow is normally confined.
bank, left (right): The side of a channel as viewed in adownstream direction.
bank full discharge: Discharge that, on the average, fills a channelto the point of overflowing.
bank protection: Engineering works for the purpose of protectingstreambanks from erosion.
bank revetment: Erosion-resistant materials placed directly on astreambank to protect the bank from erosion.
bar: An elongated deposit of alluvium within achannel, not permanently vegetated.
base floodplain: The floodplain associated with the flood with a100-year recurrence interval.
bed: The bottom of a channel bounded by banks.
Archive
d
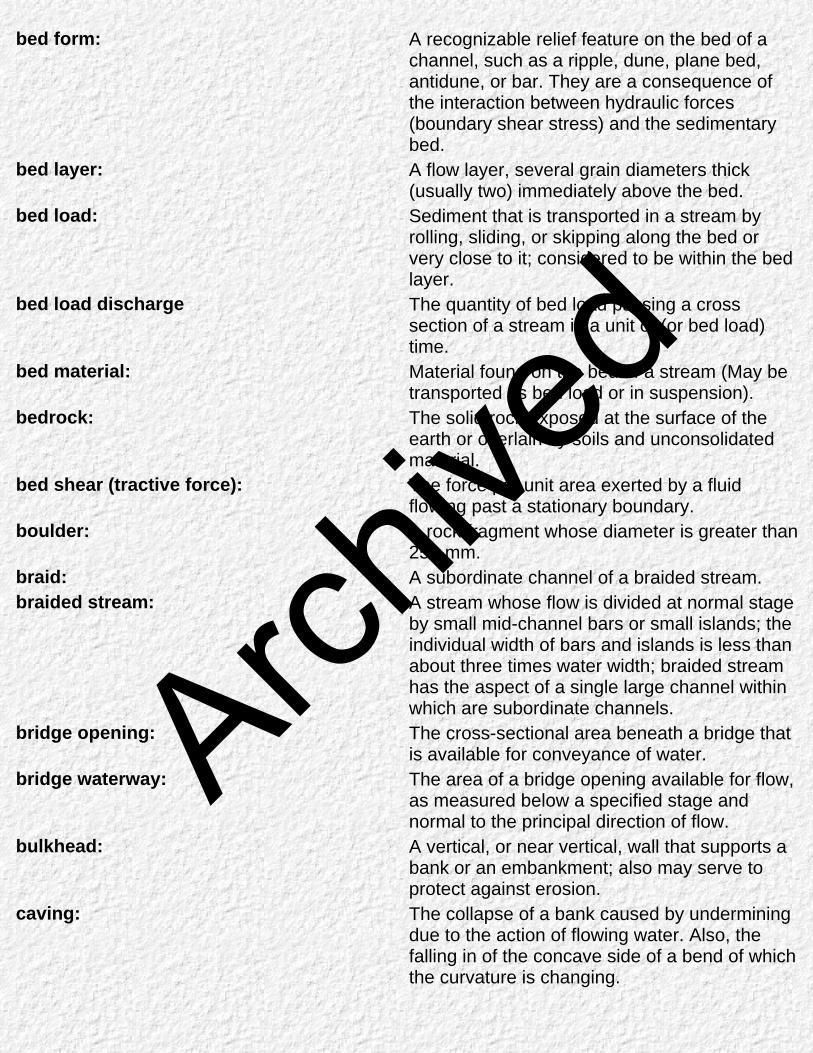
bed form: A recognizable relief feature on the bed of achannel, such as a ripple, dune, plane bed,antidune, or bar. They are a consequence ofthe interaction between hydraulic forces(boundary shear stress) and the sedimentarybed.
bed layer: A flow layer, several grain diameters thick(usually two) immediately above the bed.
bed load: Sediment that is transported in a stream byrolling, sliding, or skipping along the bed orvery close to it; considered to be within the bedlayer.
bed load discharge The quantity of bed load passing a crosssection of a stream in a unit of (or bed load)time.
bed material: Material found on the bed of a stream (May betransported as bed load or in suspension).
bedrock: The solid rock exposed at the surface of theearth or overlain by soils and unconsolidatedmaterial.
bed shear (tractive force): The force per unit area exerted by a fluidflowing past a stationary boundary.
boulder: A rock fragment whose diameter is greater than250 mm.
braid: A subordinate channel of a braided stream.braided stream: A stream whose flow is divided at normal stage
by small mid-channel bars or small islands; theindividual width of bars and islands is less thanabout three times water width; braided streamhas the aspect of a single large channel withinwhich are subordinate channels.
bridge opening: The cross-sectional area beneath a bridge thatis available for conveyance of water.
bridge waterway: The area of a bridge opening available for flow,as measured below a specified stage andnormal to the principal direction of flow.
bulkhead: A vertical, or near vertical, wall that supports abank or an embankment; also may serve toprotect against erosion.
caving: The collapse of a bank caused by underminingdue to the action of flowing water. Also, thefalling in of the concave side of a bend of whichthe curvature is changing.
Archive
d

channel: The bed and banks that confine the surfaceflow of a stream.
channelization: Straightening or deepening of a natural channelby artificial cutoffs, grading, flow-controlmeasures, or diversion of flow into a man-madechannel.
cellular-block mattress: Regularly cavitated interconnected concreteblocks with regular cavities placed directly on astreambank or filter to resist erosion. Thecavities can permit bank drainage and thegrowth of vegetation where synthetic filterfabric is not used between the mattress andbank.
channel diversion: The removal of flows by natural or artificialmeans from a natural length of channel.
channel pattern: The aspect of a stream channel in plan view,with particular reference to the degree ofsinuosity, braiding, anabranching.
channel process: Behavior of a channel with respect to shifting,erosion and sedimentation.
check dam: A low dam or weir across a channel used tocontrol stage or degradation.
choking (of flow): Excessive constriction of flow which may causesevere backwater effect.
clay: A particle whose diameter is in the range of0.00024 to 0.004 mm.
clay plug: A cutoff meander bend filled with fine grainedcohesive sediments.
cobble: A fragment of rock whose diameter is in therange of 64 to 250 mm.
concrete revetment: Plain or reinforced concrete slabs placed onthe channel bed to protect it from erosion.
confluence: The junction of two or more streams.constriction: A natural or artificial control section, such as a
bridge crossing, channel reach or dam, withlimited flow capacity in which the upstreamwater surface elevation is related to discharge.
contact load: Sediment particles that roll or slide along inalmost continuous contact with the streambed.
contraction: The effect of channel constriction on flowstreamlines.
Archive
d

countermeasure: A measure intended to prevent, delay orreduce the severity of hydraulic problems.
contraction scour: Scour in a channel or on a floodplain that is notlocalized at a pier, abutment, or otherobstruction to flow. In a channel, contractionscour results from the contraction ofstreamlines and usually affects all or most ofthe channel width.
Coriolis force: The inertial force caused by the Earth's rotationthat deflects a moving body to the right in theNorthern Hemisphere.
crib: A frame structure filled with earth or stoneballast, designed to reduce energy and todeflect streamflow away from a bank orembankment.
critical shear stress: The minimum amount of shear stress requiredto initiate soil particle motion.
crossing: The relatively short and shallow reach of astream between bends; also crossover.
cross section: A section normal to the trend of a channel.current: Water flowing through a channel.cut bank: The concave wall of a meandering stream.cutoff: (a) A direct channel, either natural or artificial,
connecting two points on a stream, therebyshortening the original length of the channeland increasing its slope; (b) A natural orartificial channel which develops across theneck of a meander loop.
cutoff wall: A wall, usually of sheet piling or concrete, thatextends down to scour-resistant material orbelow the expected scour depth.
daily discharge: Discharge averaged over one day.debris: Floating or submerged material, such as logs
or trash, transported by a stream.deflector: Alternative term of "spur."degradation (bed): A general and progressive lowering of the
channel bed due to erosion.density of water-sediment mixture: Bulk density (mass per unit volume), including
both water and sediment.
depth of scour: The vertical distance a streambed is loweredby scour below a reference elevation.
Archive
d

dike: An impermeable linear structure for the controlor containment of overbank flow. Adike-trending parallel with a streambank differsfrom a levee in that it extends for a muchshorter distance along the bank, and it may besurrounded by water during floods.
dike (groin, spur, jetty): A structure extending from a bank into achannel that is designed to: (a) reduce thestream velocity as the current passes throughthe dike, thus encouraging sediment depositionalong the bank (permeable dike); or (b) deflecterosive current away from the streambank(impermeable dike).
dominant discharge: (a) The discharge which is of sufficientmagnitude and frequency to have a dominatingeffect in determining the characteristics andsize of the stream course, channel, and bed;(b) That discharge which determines theprincipal dimensions and characteristics of anatural channel. The dominant formativedischarge depends on the maximum and meandischarge, duration of flow, and floodfrequency. For hydraulic geometryrelationships, it is taken to be the bankfulldischarge which has a return period ofapproximately 1.5 years in many naturalchannels.
drift: Alternative term for "debris."eddy current: A vortex-type motion of a fluid flowing contrary
to the main current, such as the circular watermovement that occurs when the main flowbecomes separated from the bank.
entrenched stream: Stream cut into bedrock or consolidateddeposits.
ephemeral stream: A stream or reach of stream that does not flowfor parts of the year. As used here, the termincludes intermittent streams with flow lessthan perennial.
erosion: Displacement of soil particles on the landsurface due to water or wind action.
erosion control matting: Fibrous matting (e.g., jute, paper, etc.) placedor sprayed on a streambank for the purpose ofresisting erosion or providing temporarystabilization until vegetation is established.
Archive
d

estuary: Tidal reach at the mouth of a stream.fabric mattress: Grout-filled mattress used for streambank
protection.fetch: The area in which waves are generated by
wind having a rather constant direction andspeed; sometimes used synonymously withfetch length.
fetch length: The horizontal distance (in the direction of thewind) over which wind generates waves andwind setup.
fill slope: Side or end slope of an earth fill embankment.filter: Layer of fabric, sand, gravel, or graded rock
placed between bank revetment and soil for thefollowing purposes: (1) to prevent the soil frommoving through the revetment by piping,extrusion, or erosion; (2) to prevent therevetment from sinking into the soil; and (3) topermit natural seepage from the streambank,thus preventing the buildup of excessivehydrostatic pressure.
filter blanket: A layer of graded sand and gravel laid betweenfine-grained material and riprap to serve as afilter.
filter cloth: Geosynthetic fabric that serves the samepurpose as a granular filter blanket.
fine sediment load (wash load): That part of the total sediment load that iscomposed of particle sizes finer than thoserepresented in the bed. Normally, thefine-sediment load is finer than 0.062 mm forsand-bed channel. Silts, clays and sand couldbe considered wash load in coarse gravel andcobble-bed channels.
flanking: Erosion resulting from streamflow between thebank and the landward end of acountermeasure for stream stabilization.
flashy stream: Stream characterized by rapidly rising andfalling stages, as indicated by a sharply peakedhydrograph. Most flashy streams areephemeral, but some are perennial.
floodplain: A nearly flat, alluvial lowland bordering astream, that is subject to inundation by floods.
flow-control structure: A structure either within or outside a channelthat acts as a countermeasure by controllingthe direction, depth, or velocity of flowing water.
Archive
d

flow hazard: Flow characteristics (discharge, stage, velocity, orduration) that are associated with a hydraulicproblem or that can reasonably be sonsidered ofsufficient magnitude to cause a hydraulic problemor to test the effectiveness of a countermeasure.
flow slide: Saturated soil materials which behave morelike a liquid than a solid. A flow slide on achannel bank can result in a bank failure.
Froude Number: A dimensionless number that represents theratio of inertial to gravitational forces. HighFroude Numbers can be indicative of high flowvelocity and the potential for scour.
gabion: A basket or compartmentalized rectangularcontainer made of wire mesh, filled withcobbles or other rock of suitable size. Gabionsare flexible and permeable blocks with whichflow- and erosion-control structures can bebuilt.
geomorphology/morphology: That science that deals with the form of theEarth, the general configuration of its surface,and the changes that take place due to erosionof the primary elements and in the buildup oferosional debris.
grade-control (sill, check dam): Structure placed bank to bank across a streamchannel (usually with its central axisperpendicular to flow) for the purpose ofcontrolling bed slope and preventing scour orheadcutting.
graded stream: A geomorphic term used for streams that haveapparently achieved a state of equilibriumbetween the rate of sediment transport and therate of sediment supply throughout longreaches. Any change which alters the state ofequilibrium can lead to action by the stream toreestablish equilibrium.
groin: A structure built from the bank of a stream in adirection transverse to the current. Manynames are given to this structure, the mostcommon being "spur," "spur dike," "transversedike," "jetty," etc. Groins may be permeable,semi-permeable, or impermeable.
guide bank: Preferred term for spur dike.
Archive
d

hardpoint: A streambank protection structure whereby"soft" or erodible materials are removed from abank and replaced by stone or compacted clay.Some hard points protrude a short distance intothe channel to direct erosive currents awayfrom the bank. Hard points also occur naturallyalong streambanks as passing currents removeerodible materials leaving nonerodiblematerials exposed.
headcutting: Channel degradation associated with abruptchanges in the bed elevation (headcut) thatgenerally migrates in an upstream direction.
helical flow: Three-dimensional movement of water particlesalong a spiral path in the general direction offlow. These secondary-type currents are ofmost significance as flow passes through abend; their net effect is to remove soil particlesfrom the cut bank and deposit this material onthe point bar.
hydraulic radius: The cross-sectional area of a stream divided byits wetted perimeter.
hydraulic problem: An effect of streamflow, tidal flow, or waveaction such that the integrity of the highwayfacility is destroyed, damaged, or endangered.
incised reach: A stretch of stream with an incised channel thatonly rarely overflows its banks.
incised stream: A stream which has cut its channel through thebed of the valley floor, as opposed to oneflowing on a floodplain.
island: A permanently vegetated area, emergent atnormal stage, that divides the flow of a stream.Islands originate by establishment of vegetationon a bar, by channel avulsion, or at the junctionof minor tributary with a larger stream.
jack: A device for flow control and protection ofbanks against lateral erosion consisting ofthree mutually perpendicular arms rigidly fixedat the center. Kellner jacks are made of steelstruts strung with wire, and concrete jacks aremade of reinforced concrete beams.
Archive
d

jack field: Rows of jacks tied together with cables, somerows generally parallel with the banks andsome perpendicular thereto or at an angle.Jack fields may be placed outside or within achannel.
jetty: (a) An obstruction built of piles, rock, or othermaterial extending from a bank into a stream,so placed as to induce scouring or bankbuilding, or to protect against erosion; (b) Asimilar obstruction to influence stream, lake, ortidal currents, or to protect a harbor.
lateral erosion: Erosion in which the removal of material isextended in a lateral direction, as contrastedwith degradation and scour in a verticaldirection.
launching: Release of undercut material (stone riprap,rubble, slag, etc.) downslope or into a scouredarea.
levee: An embankment, generally landward of topbank, that confines flow during high-waterperiods, thus preventing overflow into lowlands.
littoral drift: The transport of material along a shoreline.local scour: Scour in a channel or on a floodplain that is
localized at a pier, abutment, or otherobstruction to flow.
lower bank: That portion of a streambank having anelevation less than the mean water level of thestream.
mattress: A blanket or revetment materials interwoven orotherwise lashed together and placed to coveran area subject to scour.
meander or full meander: A meander in a river consists of twoconsecutive loops, one flowing clockwise andthe other counter-clockwise.
meander belt: The distance between lines drawn tangent tothe extreme limits of successive fully developedmeanders.
meander length: The distance along a stream betweencorresponding points at the extreme limits ofsuccessive fully developed meanders.
meander loop: An individual loop of a meandering or sinuousstream lying between inflection points withadjoining loops.
Archive
d

meander ratio: The ratio of meander width to meander length.meander width: The amplitude of swing of a fully developed
meander measured from midstream tomidstream.
meandering channel: A channel exhibiting a characteristic process ofbank erosion and point bar depositionassociated with systematically shiftingmeanders.
meander scrolls: Low, concentric ridges and swales on afloodplain, marking the successive positions offormer meander loops.
meandering stream: A stream having a sinuosity greater than somearbitrary value. The term also implies amoderate degree of pattern symmetry,imparted by regularity of size and repetition ofmeander loops.
median diameter: The particle diameter of the 50th percentilepoint on a size distribution curve such that halfof the particles (by weight, number, or volume)are larger and half are smaller.
mid-channel bar: A bar lacking permanent vegetal cover thatdivides the flow in a channel at normal stage.
middle bank: The portion of a streambank having anelevation approximately the same as that of themean water level of the stream.
migration: Change in position of a channel by lateralerosion of one bank and simultaneousaccretion of the opposite bank.
natural levee: A low ridge formed along streambanks duringfloods by deposition that slopes gently awayfrom the channel banks.
nominal sediment diameter: Equivalent spherical diameter of a hypotheticalsphere of the same volume as a given stone.
nonalluvial channel: A channel whose boundary is completely inbedrock.
normal stage: The water stage prevailing during the greaterpart of the year.
overbank flow: Water movement overtop bank either due tostream stage or to inland surface water runoff.
Archive
d

oxbow: The abandoned bow-shaped orhorseshoe-shaped reach of a former meanderloop that remains after a stream cuts a new,shorter channel across the narrow neckbetween closely approaching bends of ameander.
perennial stream: A stream or reach of a stream that flowscontinuously for all or most of the year.
phreatic line: The upper boundary of the seepage watersurface landward of a streambank.
pile dike: A type of permeable structure for the protectionof banks against caving; consists of a cluster ofpiles driven into the stream, braced and lashedtogether.
piping: Removal of soil material through subsurfaceflow of seepage water that develops channelsor "pipes" within the soil bank
point bar: An alluvial deposit of sand or gravel lackingpermanent vegetal cover occurring in a channelat the inside of a meander loop, usuallysomewhat downstream from the apex of theloop.
poised stream (stable stream): A stream which, as a whole, maintains itsslopes, depths, and channel dimensionswithout any noticeable raising or lowering of itsbed. Such condition may be temporary from ageological point of view, but for practicalengineering purposes, the stream may beconsidered stable.
quarry-run stone: Stone as received from a quarry without regardto gradation requirements.
railbank protection: A type of countermeasure composed ofrock-filled wire fabric supported by steel rails orposts driven into streambed.
rapid drawdown: Lowering the water against a bank morequickly than the bank can drain withoutbecoming unstable.
reach: A segment of stream length that is arbitrarilybounded for purposes of study.
regime: The condition of a stream or its channel asregards stability. A stream is in regime if itschannel has reached a stable form as a resultof its flow characteristics.
Archive
d

regime channel: Alluvial channel that has attained, more or less,a state of equilibrium with respect to erosionand deposition.
regime change: A change in channel characteristics resultingfrom such things as changes in imposed flows,sediment loads or slope.
regime formula: A formula relating stable alluvial channeldimensions or slope to discharge and sedimentcharacteristics.
reinforced-earth bulkhead: A retaining structure consisting of verticalpanels and attached to reinforcing elementsembedded in compacted backfill for supportinga streambank.
reinforced revetment: A streambank protection method consisting ofa continuous stone toe-fill along the base of abank slope with intermittent fillets of stoneplaced perpendicular to the toe and extendingback into the natural bank.
retard (retarder structure): A permeable or impermeable linear structure ina channel parallel with the bank and usually atthe toe of the bank, intended to reduce flowvelocity, induce deposition, or deflect flow fromthe bank.
revetment: Rigid or flexible armor placed to inhibit scourand lateral erosion. (See bank revetment).
riffle: A natural, shallow flow area extending across astreambed in which the surface of flowing wateris broken by waves or ripples. Typically, rifflesalternate with pools along the length of astream channel.
riparian: Pertaining to anything connected with oradjacent to the banks of a stream.
riprap: In the restricted sense, layer or facing ofbroken rock or concrete dumped or placed toprotect a structure or embankment fromerosion; also the broken rock or concretesuitable for such use. Riprap has also beenapplied to almost all kinds of armor, includingwire-enclosed riprap, grouted riprap, sackedconcrete, and concrete slabs.
Archive
d

river training: Engineering works with or without theconstruction of embankment, built along astream or reach of stream to direct or to leadthe flow into a prescribed channel. Also, anystructure configuration constructed in a streamor placed on, adjacent to, or in the vicinity of astreambank that is intended to deflect currents,induce sediment deposition, induce scour, or insome other way alter the flow and sedimentregimes of the stream.
rock-and-wire mattress: A flat or cylindrical wire cage or basket filledwith stone or other suitable material and placedas protection against erosion.
roughness coefficient: Numerical measure of the frictional resistanceto flow in a channel, as in the Manning's orChezy's formulas.
rubble: Rough, irregular fragments of materials ofrandom size used to retard erosion. Thefragments may consist of broken concreteslabs, masonry, or other suitable refuse.
sack revetment: Sacks (e.g., burlap, paper, or nylon) filled withmortar, concrete, sand, stone or other availablematerial used as protection against erosion.
saltation load: Sediment bounced along the streambed byenergy, turbulence of flow, and by other movingparticles.
scour: Erosion due to flowing water; usuallyconsidered as being localized as opposed togeneral bed degradation.
scoured depth: Total depth of the water from water surface to ascoured bed level (compare with "depth ofscour").
sediment or fluvial sediment: Fragmental material transported, suspended,or deposited by water.
sediment concentration: Weight or volume of sediment relative toquantity of transporting or suspending fluid orfluid-sediment mixture.
sediment discharge: The quantity of sediment that is carried pastany cross section of a stream in a unit of time.Discharge may be limited to certain sizes ofsediment or to a specific part of the crosssection.
sediment load: Amount of sediment being moved by a stream.
Archive
d

sediment yield: The total sediment outflow from a watershed ora drainage area at a point of reference and in aspecified time period. This outflow is equal tothe sediment discharge from the drainage area.
seepage: The slow movement of water through smallcracks and pores of the bank material.
seiche: Long-period oscillation of a lake or similar bodyof water.
set-up: Raising of water level due to wind action.shallow water (for waves): Water of such a depth that waves are
noticeably affected by bottom conditions;customarily, water shallower than half thewavelength.
shoal: A submerged sand bank. A shoal results fromnatural deposition on a streambed which hasresisted all erosion; thus, the water is ofnecessity compelled to pass over it.
sill: (a) A structure built under water, across thedeep pools of a stream with the aim ofchanging the depth of the stream; (b) A lowstructure built across an effluent stream,diversion channel or outlet to reduce flow orprevent flow until the main stream stagereaches the crest of the structure.
sinuosity: The ratio between the thalweg length and thevalley length of a sinuous stream.
slope (of channel or stream): Fall per unit length along the channelcenterline.
slope protection: Any measure such as riprap, paving,vegetation, revetment, brush or other materialintended to protect a slope from erosion,slipping or caving, or to withstand externalhydraulic pressure.
sloughing: Sliding of overlying material; same ultimateeffect as caving, but usually occurs when abank or an underlying stratum is saturated.
slope-area method: A method of estimating unmeasured flooddischarges in a uniform channel reach usingobserved high-water levels.
slump: A sudden slip or collapse of a bank, generallyin the vertical direction and confined to a shortdistance, probably due to the substratum beingwashed out or having become unable to bearthe weight above it.
Archive
d

soil-cement: A designed mixture of soil and Portland cementcompacted at a proper water content to form ablanket or structure that can resist erosion.
sorting: Progressive reduction of size (or weight) ofparticles of the load carried down a stream.
spatial concentration: The dry weight of sediment per unit volume ofwater-sediment mixture in place or the ratio ofdry weight of sediment or total weight ofwater-sediment mixture in a sample or unitvolume of the mixture.
spill-through abutment: A bridge abutment having a fill slope on thestreamward side.
spur: A permeable or impermeable linear structurethat projects into a channel from the bank toalter flow direction, induce deposition, orreduce flow velocity along the bank.
spur dike/guide bank: A dike extending upstream from the approachembankment at either or both sides of thebridge opening. Guide banks may also extenddownstream from the bridge.
stability: A condition of a channel when, though it maychange slightly at different times of the year asthe result of varying conditions of flow andsediment charge, there is no appreciablechange from year to year; that is, accretionbalances erosion over the years.
stable channel: A condition that exists when a stream has abed slope and cross section which allows itschannel to transport the water and sedimentdelivered from the upstream watershed withoutaggradation, degradation, or bank erosion (agraded stream).
stage: Water-surface elevation of a stream withrespect to a reference elevation.
stone riprap: Natural cobbles, boulders, or rock dumped orplaced as protection against erosion.
stream: A body of water that may range in size from alarge river to a small rill flowing in a channel. Byextension, the term is sometimes applied to anatural channel or drainage course formed byflowing water whether it is occupied by water ornot.
Archive
d

streambank erosion: Removal of soil particles or a mass of particlesfrom a bank surface due primarily to wateraction. Other factors such as weathering, iceand debris abrasion, chemical reactions, andland use changes may also directly or indirectlylead to bank erosion.
streambank failure: Sudden collapse of a bank due to an unstablecondition such as due to removal of material atthe toe of the bank by scour.
streambank protection: Any technique used to prevent erosion orfailure of a streambank.
suspended sediment discharge (suspendedload):
The quantity of sediment passing through astream cross section in a unit of timesuspended by the turbulence of flow.
sub-bed material: Material underlying that portion of thestreambed which is subject to direct action ofthe flow.
submeander: A small meander contained within the banks ofa perennial stream channel. These are causedby relatively low discharges after the flood hassubsided.
subcritical, supercritical flow: Open channel flow conditions with FroudeNumber less than and greater than unity,respectively.
tetrahedron: Component of river-training works made of sixsteel or concrete struts fabricated in the shapeof a pyramid.
tetrapod: Bank protection component of precast concreteconsisting of four legs joined at a central joint,with each leg making an angle of 109.5° withthe other three.
thalweg: The line extending down a channel that followsthe lowest elevation of the bed.
tieback: Structure placed between revetment and bankto prevent flanking.
timber or brush mattress: A revetment made of brush, poles, logs, orlumber interwoven or otherwise lashedtogether. The completed mattress is thenplaced on the bank of a stream and weightedwith ballast.
toe of bank: That portion of a stream cross section wherethe lower bank terminates and the channelbottom or the opposite lower bank begins.
Archive
d

toe protection: Loose stones laid or dumped at the toe of anembankment, groin, etc., or masonry orconcrete wall built at the junction of the bankand the bed in channels or at extremities ofhydraulic structures to counteract erosion.
total sediment load (or total load): The sum of suspended load and bed load orthe sum of bed material load and wash load ofa stream.
trench-fill revetment: Stone, concrete, or masonry material placed ina trench dug behind and parallel to an erodingstreambank. When the erosive action of thestream reaches the trench, the material placedin the trench armors the bank and thus retardsfurther erosion.
turbulence: Motion of fluids in which local velocities andpressures fluctuate irregularly in a randommanner as opposed to laminar flow where allparticles of the fluid move in distinct andseparate lines.
uniform flow: Flow of constant cross section and velocitythrough a reach of channel at a given instant.Both the energy slope and the water slope areequal to the bed slope under conditions ofuniform flow.
unit discharge: Discharge per unit width (may be average overa cross section, or local at a point).
unit shear force (shear stress): The force or drag developed at the channel bedby flowing water. For uniform flow, this force isequal to a component of the gravity force actingin a direction parallel to the channel bed on aunit wetted area. Usually in units of stress,lb/ft2.
unsteady flow: Flow of variable cross section and velocity withrespect to time.
upper bank: The portion of a streambank having anelevation greater than the average water levelof the stream.
velocity: The rate of motion in a fluid on a stream or ofthe objects or particles transported therein,usually expressed in ft/s.
velocity-weighted sediment concentration: The dry weight of sediment discharged througha cross section during unit time.
Archive
d

wandering channel: A channel exhibiting a more or lessnon-systematic process of channel shifting,erosion and deposition, with no definitemeanders or braided pattern.
wandering thalweg: A thalweg whose position in the channel shiftsduring floods and typically serves as an insetchannel that conveys all or most of the streamflow at normal or lower stages.
wash load: Suspended material of very small size(generally clays and colloids) originatingprimarily from erosion on the land slopes of thedrainage area and present to a negligibledegree in the bed itself.
waterway opening width (area): Width (area) of bridge opening at (below) aspecified stage, measured normal to theprincipal direction of flow.
weephole: A hole in an impermeable wall or revetment torelieve the neutral stress or pore pressure inthe soil.
windrow revetment: A row of stone placed landward of the top of aneroding streambank. As the windrow isundercut, the stone is launched downslope,thus armoring the bank.
wire mesh: Wire woven to form a mesh; where used as anintegral part of a countermeasure, openings areof suitable size and shape to enclose rock orbroken concrete or to function on fence-likespurs and retards.
Archive
d
Symbols
A , B , C , D , E , G, H , K , L , M , N , P , Q , R , S, V , W , Y , Z , MISC.
To jump to a specific part of the alphabet, click on the above HotLinks!Click the Back button to return to the top of this page.(If the letter you are looking for does not appear in the HotLink list below, then there are no glossary entries for that letter!)
AAn2 = Cross-sectional flow area at bridge opening at normal stage (ft2)
B
b = Length of the bridge opening (ft)
C
Cd = Coefficient of drag
D
Dc = Diameter of sediment particle at incipient motion conditions (ft)
Di = The ith percentile size of bed material
Z = The difference in water surface elevation between the concave and convex banks (ft)
D50 = Median sediment size
dm = Tailwater depth (ft)
ds = Local scour depth for free overfall (ft)
E
F = Impact imparted by debris (lbs/ft)
Fd = Drag force per unit of bridge length (lbs/ft)G
g = Acceleration of gravity (ft/s2)
H
H = Depth of submergence (ft)
Ht = Total drop in head, measured from the upstream to the downstream energy grade line (ft)
K
K = Constant
L
L = The effective length of spur, or the distance between arcs describing the toe of spurs and the desired bank line(ft)
Ls = Projected length of guide bank (ft)
M
M = Mass of the debris (lb/sec2/ft)
Archive
d

m = Roughness correction factor for sinuosity of the channel
N
n = Manning's roughness coefficient
nb = Base value for straight, uniform channel
n1 = Value for surface irregularities in the cross section
n2 = Value for variations in shape and size of the channel
n3 = Value for obstructions
n4 = Value for vegetation and flow conditions
P
Pc = Decimal fraction of material coarser than the armoring size
Q
Q = Discharge, total discharge (ft3/s)
Qf = Lateral or floodplain discharge (cfs)
= Guide bank discharge ratio
Qs = The sediment discharge (ft3/sec)
Q100 = Discharge in 100 feet of stream adjacent to the abutment (cfs)
q = Discharge per unit width (cfs/foot)
R = Hydraulic radius (ft)
R
rc = Radius of the center of the stream (ft)
ri = Radius of the inside bank (ft)
ro = Radius of the outside bank at the bend (ft)
S
S = Stopping distance (ft)
S = The energy slope or channel slope (ft/ft)
S = The spacing between spurs at the toe (ft)
VV = Velocity or average velocity of flow (ft/sec)
Vn2 = Average velocity through the bridge opening (cfs)
Y
Y = Depth (ft)
ya = Thickness of the armoring layer
Z
Z = Bed elevation referenced to a common datum (ft)
Archive
d

MISC.
= Specific weight of water (lb/ft3)
s = Specific weight of sediment (lb/ft3)
= Density of water (slugs/ft3)
= Boundary shear stress (lb/ft2)
= The expansion angle downstream of spur tips (degrees)
Archive
d