Embed Size (px)
Citation preview

1 9 5 7
Stream Resource Utilization of Sympatric and Allopatric Juvenile Brown (Sa/mo trutta) and
Steelhead Trout (Sa/mo gairdneri)
Robin Lynn Ziegler
Fisheries Research Report No. 1957
November 7, 1988

MICHIGAN DEPARTMENT OF NATURAL RESOURCES FISHERIES DIVISION
Fisheries Research Report No. 1957
November 7, 1988
STREAM RESOURCE UTILIZATION OF SYMPATRIC AND
ALLOPATRIC JUVENILE BROWN (SALMO TRUTTA) AND
STEELHEAD TROUT (SALMO GAIRDNERI) 1
Robin Lynn Ziegler
1 This is a reprint of a thesis submitted in partial fulfillment of the requirements for the degree of Master of Science in the Department of Fisheries and Wildlife, Michigan State University, 1988.

STREAM RESOURCE UTLIZATION OF SYMPATRIC AND
ALLOPATRIC JUVENILE BROWN (Salmo trutta) AND
STEELHEAD TROUT (Salmo gairdneri)
By
Robin Lynn Ziegler
A THESIS
Submitted to
Michigan State University
in partial fulfillment of requirements for the degree of
MASTER OF SCIENCE
Department of Fisheries and Wildlife
1988
1

ACKNOWLEDGEMENTS
This research was sponsored by the Sports Fishery
Research Foundation, Michigan State University Agricultural
Experiment Station and the Michigan Department of Natural
Resources, Fisheries Division. I would like to express my
appreciation for their interest and financial support of
this project. Additional support was received from the
Paul Young, Kalamazoo Valley and Western Michigan chapters
of Trout Unlimited. Memorial scholarships in recognition
of outstanding coldwater fisheries research were awarded to
this project in memory of George Disborough (Kalamazoo
Valley chapter) and Cornelius Schremms (Western Michigan
chapter). I am honored and feel it has been a priviledge
to be associated with these outstanding fishing
organizations.
I would like to thank my advisor, Dr. William Taylor,
who provided both critical advice and valued friendship
throughout the study. Thanks are also due to the other
members of my thesis guidance committee, Drs. Carl Latta,
Thomas Burton, and Howard Tanner for the constructive
criticism and advice they have provided concerning my
research.
My fellow graduate students deserve special
acknowledgement for the many large and small ways they
ii

helped make my stay at MSU successful and rewarding.
Particularly helpful were the work and advice of Andy
Loftus and William Gala. Thanks are also due to Kathy
Brewer and Ron Englund for providing much needed assistance
in the field and laboratory.
Throughout the course of this research I have had the
support of several agencies and individuals which I greatly
appreciate. However, the effort and time Rich Grost and
Steve Marod dedicated to this project was invaluable. I
want to thank them for helping me reach the goals of my
graduate work.
Finally, I would like to thank my family for their
unfailing support, both moral and financial, throughout my
educational career. Their faith in my abilities and
encouragement of my career choice is greatly appreciated.
iii

List
List
of
of
Tables.
Figures.
TABLE OF CONTENTS
Page
.vi
.viii
INTRODUCTION •••••••••••••••••••••••••••••••••••••••••••••• 1
MATERIAL AND METHODS •••••••••••••••••••••••••••••••••••••• 4
site Selection .......................................... 4
Mapping Available Habitat ............................... 5
Underwater Observation .................................. 8
Electofishing Procedure ................................ 10
Diet Analysis •...•........••........................... 10
Statistical Analysis ................................... 11
RESULTS ••••••••••••••••••••••••••••••••••••••••••••••••.• 14
Study Site Selection ................................... 14
Population Parameters .................................. 14
Available Habitat ...................................... 18
Underwater Observations ....•........................... 18
Logistic Regression .................................... 2 o
Food Habits. • •••••••••••••••••••••••••••••••• 2 7
Monthly Diet Analysis .................................. 38
DISCUSSION ••••••••••••••••••••••••••••••••••••••••••••••• 4 5
Habitat Utilization .•..•............................... 45
Diet Analysis. . . . . . . . ................................ 51
Conclusions and Future Research ........................ 56
iv

S umm.ary . . . . . . . . . . . . . . . . . . . . . . . . . . . . . . . . . . . . . . . . . . . . . . . . 5 7
Literature Cited ....................................... 59
V

LIST OF TABLES
Page Table 1. Stream habitat numeric codes and descriptions
of cover types at study sites ••..•.•............ 6
Table 2. Substrate numeric codes and descriptions of substrate types at study sites •.•••.•••••....... 7
Table 3. Relative abundance of brown and steelhead trout in nine Lake Michigan tributaries surveyed as potential study streams, 1985 ...... 15
Table 4. Estimates of relative abundance and mean length of trout species from shocking runs ..... 17
Table 5. Area of habitat types (m2) measured in all three study sections ..••••.•..•.•.............. 19
Table 6. Chi-square analysis for habitat utilization versus habitat availability ••.•.•...•.......... 21
Table 7. Mean, range, and standard error of the most significant variables from logistic regression procedure for the South Branch of the Boardman River ............. 22
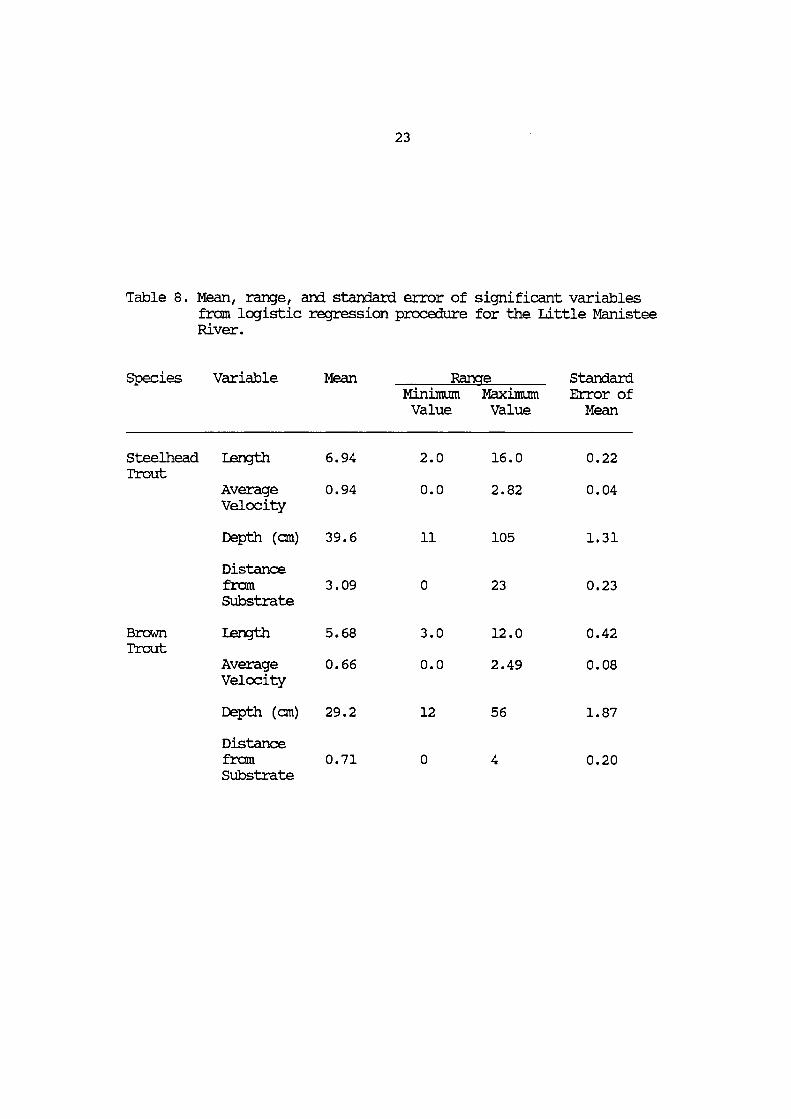
Table 8. Mean, range, and standard error of the most significant variables from logistic regression procedure for the Little Manistee River .•.•..•..•.•.•..•....•.... 23
Table 9. Mean, range, and standard error of the most significant variables from logistic regression procedure for the L~ttle South Branch of the Pere Marquette River . ......................................... 2 5
Table 10. Stomach contents of young of the year brown trout collected in the Little Manistee River, 1986 ................... .................. 28
Table 11. stomach contents for young of the year brown trout collected in the South Branch of the Boardman River, 1986 .......••.................. 29
Table 12. Diet data for each site and species over the entire sampling season ..........•.............. 31
vi
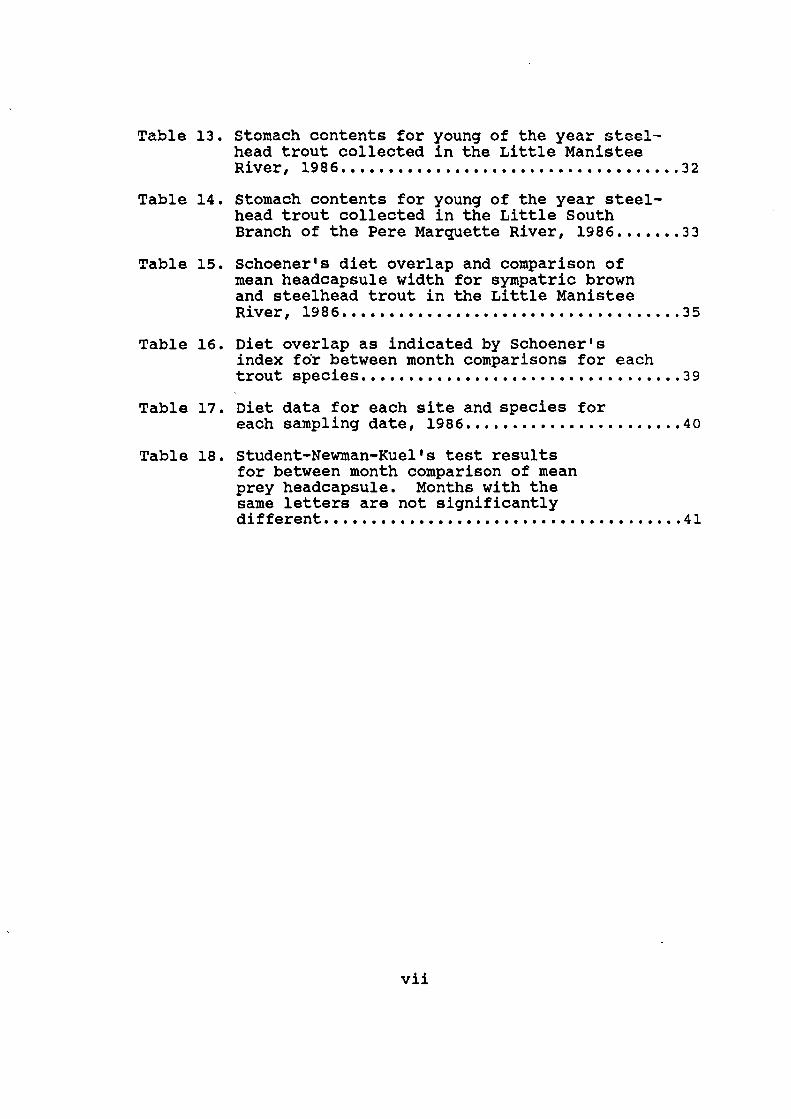
Table 13. Stomach contents for young of the year steelhead trout collected in the Little Manistee River, 19 8 6 ••...••.•.•••••..•.•.•.•...••....... 3 2
Table 14. stomach contents for young of the year steelhead trout collected in the Little South Branch of the Pere Marquette River, 1986 ••••••• 33
Table 15. Schoener•s diet overlap and comparison of mean headcapsule width for sympatric brown and steelhead trout in the Little Manistee River, 1986 •.•.•....••..••........••..••. ...... 35
Table 16. Diet overlap as indicated by Schoener's index for between month comparisons for each trout species •••••••••••••••••••••••••••••••••• 3 9
Table 17. Diet data for each site and species for each sampling date, 1986 ••••••••••••••••••••••• 40
Table 18. Student-Newman-Kuel's test results for between month comparison of mean prey headcapsule. Months with the same letters are not significantly different ...................................... 41
vii

LIST OF FIGURES
Figure 1. Percent composition of diet by prey size for Little Manistee River brown trout
Page
collected on each sampling date ••.•........... 36
Figure 2. Percent composition of diet by prey size for Little Manistee River steelhead trout collected on each sampling date .•.•.......•... 37
Figure 3. Percent composition of diet by prey size for Boardman River brown trout collected on each sampling date .......••..•.......•..... 4 2
Figure 4. Percent composition of diet by prey size for Pere Marquette River steelhead trout collected on each sampling date .••••••........ 46
viii

ABSTRACT
STREAM RESOURCE UTILIZATION OF SYMPATRIC AND
ALLOPATRIC JUVENILE BROWN {Salmo trutta) AND
STEELHEAD TROUT {Salmo gairdneri)
By
Robin Lynn Ziegler
The dietary and habitat preferences of sympatric and
allopatric juvenile brown {Salmo trutta) and steelhead
trout {Salmo gairdneri) were measured in order to assess
potential areas of interaction between the two species.
Juvenile brown and steelhead trout in the Little
Manistee, Pere Marquette, and Boardman Rivers were found to
utilize the same food and space resources. Both species
ate primarily chironomid and simuliid larvae of
approximately the same size.
Analysis of habitat utilization indicated that both
brown and steelhead trout are commonly associated with
instream structure, particularly down timber. No major
differences in utilization were observed for sympatic
versus allopatric populations of these trout. However,
differences in physical parameters such as depth and
velocity did allow distinction to be made between trout
populations from different rivers.
ix

INTRODUCTION
The introduction of anadromous steelhead (rainbow) trout
and salmon into the Great Lakes has provided midwest
sportsmen a magnificent fishery. Annual stocking of these
anadromous species into tributaries of Lakes Michigan,
Huron, and Superior has led to the utilization of many
quality trout streams for spawning and nursery purposes by
these fish (Latta 1974). As a result, there has been
mounting concern regarding the impact of salmon and
steelhead trout on the resident stream brook (Salvelinus
fontinalis) and brown trout (Salmo trutta) populations
(Taube 1975, Stauffer 1977, cunjak and Green 1983, and
Fausch 1986). Many anglers feel that salmon and steelhead
trout seriously impact the trout resources in coastal Great
Lakes streams and are the cause of the perceived decline
in the resident stream trout populations. Both anadromous
and resident salmonid species are popular, highly prized
game fish for Michigan sportsmen. Therefore, angler
interest in these fisheries necessitates further research
to determine proper management practices.
Salmonid species are usually territorial in stream
environments, maintaining relatively fixed positions within
their territories and feeding primarily on drifting benthic
invertebrates (Kalleberg 1958, Chapman 1966). In addition
to similarities in behavior, previous research has also
1

2
indicated a similarity in the utilization of food and space
resources by sympatric populations of salmonids (Fausch
1981, Bowlby and Roff 1986). Therefore, development of
interspecific competitive relationships between these
fishes is a likely possibility.
Researchers have examined competitive interactions
between coho salmon (Oncorhynchus kisutch) and brown trout
(Taube 1975, Stauffer 1977, Fausch 1986), coho salmon and
rainbow trout (Salmo gairdneri) (Hartman 1965), steelhead
trout and chinook salmon (~ tshawytscha) (Everst and
Chapman 1972), rainbow and brook trout (Cunjak and Green
1983), and brook and brown trout (Nyman 1970, Fausch and
White 1981, Cunjak and Power 1986). However, with the
exception of diet studies (Wagner 1975, Johnson 1981,
Bolwby and Roff 1986), no studies have dealt specifically
with the interactions of juvenile steelhead and brown trout
in the stream environment.
A study conducted on the fishery of the Pere Marquette
River has indicated a significant decline in the brown
trout population over the past fifteen years whereas the
numbers of juvenile steelhead trout have increased (Kruger
1985). In addition, brown trout in this river system
exhibit growth rates below the Michigan state average for
fish measuring less than ten inches. The mechanisms
responsible for this decline in abundance and growth have
not been determined. However, the marked increase in

3
steelhead trout abundance and the fact that growth of brown
trout is above the state average after ten inches in length
(the time at which steelhead trout smelt) suggests there
may be some association between these two species.
Interaction between ecologically similar stream fishes
has been shown to cause displacement and/or declines of
individuals from one of the interacting fish populations
(Burton and Odum 1945, Gibson 1981, Hearn and Kynard 1986).
Displacement of subordinate species to marginal habitats
may negatively effect the fitness and subsequently the
growth of these displaced individuals (Werner and Hall
1976, Itzkowitz 1979). In order to determine if the
observations made on the Pere Marquette fishery are the
product of interactive mechanisms between brown and
steelhead trout, the degree of similarity for stream
resource utilization needs to be established for both
species.
The goal of this research was to observe the resource
preferences of juvenile brown and steelhead trout in the
stream environment to determine if interaction between
these species may act as a population regulating mechanism.
When closely related species occur in the same environment
certain aspects of their behavior or resource requirements
must differ sufficiently to allow their coexistence.
Observing niche shifts on allopatric versus sympatric
populations of closely related species may provide insight

4
into the mechanisms which operate to permit their
coexistence. Therefore, in order to assess potential areas
of interaction the specific objectives of this study were
1) to determine the dietary preferences in terms of taxon
and size for both sympatric and allopatric juvenile
steelhead and brown trout 2) to determine the habitat
preferences for these same populations and 3) to determine
the amount of overlap between these preferences with an
emphasis on its implications for management practices.
MATERIALS AND METHODS
Site Selection
Stream survey data provided by Michigan Department of
Natural Resources, Fisheries Division was reviewed in order
to evaluate long term trends in brown and steelhead trout
abundance in Lake Michigan tributaries and to collect
information on the current status of several designated
trout steams. The purpose of this review was to locate
tributaries containing reproducing populations of brown and
steelhead trout. With this accomplished, we began walking
stretches of streams in order to locate study areas that
could be electrofished effectively with backpack or stream
shocking units, were easily accessible and contained
similar substrate and cover to facilitate between stream
comparisons. At the conclusion of the walking surveys,
nine Lake Michigan tributaries were selected for

5
assessment of their current trout populations. The size
distribution and relative abundance of brown and steelhead
trout were evaluated by electroshocking a 100 meter section
on each tributary. All trout collected were placed in a
holding tank, measured to the nearest millimeter, weighed
on an Ohaus portable balance (D-500), and released.
Mapping Available Habitat
Following Instream Flow Methodology guidelines (Bovee
1982) depth, velocity, substrate, and cover were measured
to define available habitat in the 100 meter study sections
on each tributary. In order to standardize measurements,
codes and criteria to define cover (Table 1) and substrate
(Table 2) were established prior to collecting data in the
field. A metric wading rod and a Marsh-McBirney model 201D
microflow meter were utilized to measure depth and
velocity. Mapping of aquatic habitat was accomplished by
running bank to bank transects every three meters from the
downstream to the upstream boundaries of the study section.
Measurements were made at one meter intervals along each
transect. Depth, velocity, and codes for substrate and
cover were recorded at each location. In addition,
macrohabitat measurements (length and width) of all
riparian and instream structure were recorded.
The stream channel was mapped utilizing a modified
Deflection-Angle Traverse Method (Orth, 1983). Station one

6
Table 1. Stream habitat numeric codes and descriptions of cover types at study sites.
Cover Code Description
1 No cover
2 Undercut bank< 30 cm
3 Undercut bank> 30 cm
4 overhanging vegetation> 30 cm above surface
5 Overhanging vegetation< 30 cm above surface
6 Emergent or submergent aquatic vegetation
7 Down timber
8 Half-log improvement structure
9 Large rock or boulder

7
Table 2. Substrate numeric codes and descriptions of substrate types at study sites.
substrate Code
1
2
3
4
5
6
7
8
9
Description
Rooted aquatic vegetation
Fines (sand, silt)
Pebble (up to 3 cm)
Gravel (3 to 8 cm)
Cobble (8 to 30 cm)
Boulder (greater than 30 cm)
Bedrock
Detritus
Down timber embedded in substrate

8
was located at the downstream boundary of the study
section. Consecutive stations were located at three meter
intervals until the upstream boundary of the study section
was reached. At each station, a transect was run across
the stream channel to the opposite bank, a metric measuring
tape was used to determine the width of the channel at the
transects location. A stand pole compass was utilized to
measure the deflection angle from the present station to
the following station and the traverse angle from the
station to the point across the stream that the transect
had been located.
Utilizing the channel morphology and habitat
measurements collected in the field, scale drawings of the
stream study sections were constructed. The abundance of
each habitat type and total area of the stream study
section was measured utilizing a digitizing program which
calculates the area of irregular polygons (Arnold and Van
Nort 1987, Eves 1975).
Underwater Observation
The utilization of available habitat by juvenile brown
and steelhead trout was observed by diving with mask and
snorkel. Samples were collected at monthly intervals from
June through November on each tributary except during
occasional times of poor visibility. As visibility was
essential for proper identification and length estimation

9
of juvenile trout, diving was usually done between 1000
and 1400 hours when direct sunlight hit the stream surface
and light intensity was the greatest.
The study sections were divided lengthwise into right
and left sides. Two divers, each working a side of the
channel, crawled upstream from the downstream boundary
investigating the main channel and all structures that
might have contained trout. Due to the rheotaxic nature of
trout, divers approached from the downstream direction
reducing the chances of disturbing the trout and allowing
observations of their natural positions to be made.
Upon visual location of a trout its behavior was
observed to determine if it had been disturbed. Actions
such as darting from one spot to another or digging into
the substrate were assumed to be a reaction to the divers
presence and no data were collected from these fish. If a
fish did not appear to be disturbed, divers identified the
species, estimated its total length and distance from the
substrate with a centimeter scale, marked its position with
a numbered lead weight, and recorded this information on an
underwater slate.
At the conclusion of the dive, the lead weights were
collected and measurements of depth, velocity, substrate,
and cover were made at each location. A Marsh-McBirney
model 201D microflow meter and metric wading rod were used
to measure depth and velocity. The same codes and criteria

10
established for cover and substrate in the mapping
procedure were used to evaluate cover and substrate at each
fish position (Tables 1 and 2).
Electrofishing Procedure
The relative abundance of trout in each study section
was estimated monthly from June through November 1986 using
electrofishing. The electrofishing unit consisted of a
small wooden barge carrying a 250-v, 1.75-KW DC generator.
The electrofishing crew proceeded from the downstream to
the upstream boundary of the study section. A single pass
was made up each bank and another up the center of the
stream.
All trout collected were placed in a holding tank,
measured to the nearest millimeter and weighed on a Ohaus
portable balance (D-500). Scale samples were taken from
all size classes of trout for age and growth determination.
The trout were then released at the downstream boundary of
the section to allow olfactory orientation to their
previous positions in the stream.
Diet Analysis
A backpack and/or stream electrofishing unit was
utilized to collect trout for stomach content analysis
monthly from June through November. Trout were collected
from areas adjacent (above and below) to the study section
to avoid removing fish from the section. It was assumed

11
that prey availability above and below the study section
would be comparable to that available within the section.
All trout captured were measured to the nearest millimeter
and weighed on a Ohaus portable balance (D-500). A
subsample of up to 5 trout from each 10 mm size class
collected were preserved in a buffered 10% formalin
solution and analyzed for stomach contents. Food items
were identified to family and counted in the laboratory.
In addition, head capsules of all insects were measured for
size analysis of the diet.
stomach contents were evaluated for intra- and
interspecific similarities in terms of prey size and taxon.
Intraspecific diet comparisons were made between species
from different river systems and for each trout species
within a river system between sampling dates.
Interspecific diet comparisons were made between species
within a river system.
Statistical Analysis
All statistical procedures and comparisons in this
study were performed using Statistical Analysis system (SAS
Institute Inc. 1985) on the Michigan State University
Computer Network. Statements of statistical significance
indicate p-values less than or equal to 0.05 unless stated
otherwise.
Habitat utilization was evaluated in terms of

12
availability and for species or population specific
preferences. Utilization of instream structures as cover
was compared to structure availability using a Chi-square
test (Steel and Torrie 1980). Structure availability was
measured in terms of the percent of the total study site
area each type of structure comprised.
A logistic regression procedure was run to determine
the physical and biological attributes of brown and
steelhead trout that were helpful in classifying fish into
a specific population or species. The logistic regression
model is formulated mathematically by relating the
probability of some event, E, occurring conditional on a
vector of explanatory variables (Press and Wilson 1978).
In this case, E, is the probability that a fish belongs to
a particular species or population and the explanatory
variables are the physical and biological measurements made
in the field. The variables measured were total fish
length, distance from the substrate, depth and velocity at
the fish's position, and the type of structure and
substrate with which the fish was associated.
Diet preferences were evaluated both qualitatively and
quantitatively. Qualitative analysis was based on size and
taxon of prey items. Similarities in prey taxon were
evaluated through calculation of Schoener's (1970) index:
Overlap= 1 - 0.5 IPXi -PYil

13
where:
Pxi= proportion of food i in the diet of species X
Pyi= proportion of food i in the diet of species Y
Overlap values of 0.6 or greater are considered significant
(Smith 1985).
Differences in mean headcapsule width of prey items
for each trout species between river systems and within
river systems were tested using F-test and t-test
comparisons (Steel and Torrie 1980). Differences in mean
headcapsule width of prey items for each trout species
within a river system between sampling dates was tested
using a two-way analysis of variance and Student-Newman
Kuels' multiple comparison test (Steel and Torrie 1980).
A quantitative description of diet was developed by
calculating percent occurrence, mean number per stomach,
and number of stomachs containing an item for each insect
taxon found in the stomach contents. These data were
utilized to determine the predominate prey items for all
trout species found in each river system throughout the
sampling season.
Growth was evaluated by calculating the average daily
increase in length for each trout population. A z
statistic was calculated for each paired comparison using
the following formula: (Kendall and Stuart 1977)
z = meanl - mean2 / variance 1 + variance 2
In addition, the length and weight of each individual fish

14
captured in the electrofishing surveys were plotted to
graphically depict the length-weight relationship for brown
and steelhead trout in the river systems examined.
RESULTS
study site Selection
Preliminary electrofishing surveys conducted on nine Lake
Michigan tributaries (Table 3) indicated that several of
the streams supported populations of brown and steelhead
trout. Utilizing this information, three streams, the
Little South Branch of the Pere Marquette River, the Little
Manistee River, and the South Branch of the Boardman River,
were selected for research purposes. This selection was
based upon physical properties, the abundance of young of
the year trout captured within the survey section, and the
ratio of brown to steelhead trout. The Pere Marquette
contained primarily steelhead trout, the Boardman
exclusively brown trout, and the Little Manistee a mixed
population of both species. Therefore, these streams could
be used to evaluate changes in resource utilization by both
species of trout in sympatry versus allopatry.
Population Parameters
Relative abundance and growth data were collected from
each river in order to make comparisons between study
sections. Trout populations in the Little Manistee River

15
Table 3. Relative abundance of brown and steelhead trout in nine Lake Michigan tributaries surveyed as potential study streams, 1985.
Stream
Williamsburgh Creek
Boardman (S. Branch)
Bear Creek
L. Manistee
Platte
Pere Marquette (Little S. Branch)
Pine Creek
White River
Filer Creek
Brown Trout
29
124
1
3
6
7
14
2
0
Abundance
Steelhead Trout
0
0
5
13
40
80
22
0
0
Total
29
124
6
16
46
87
36
2
0

16
were the most abundant with an average of 118 fish in the
100 meter study section (Table 4). The Boardman and Pere
Marquette Rivers had an average of 56 and 50 fish in their
study sections respectively. The ratio of brown to
steelhead trout in the Little Manistee River was
approximately 1:2. On all sampling dates brown trout had a
larger mean length than steelhead trout (Table 4).
However, this difference in length between species
diminished across the sampling season. For example,
steelhead collected in July were 28 mm shorter than brown
trout but in September they were only 17 mm shorter than
the brown trout collected on the same date.
Growth was compared between all three rivers for both
species of trout. Brown trout from the Little Manistee and
Boardman Rivers had an average daily increase in length of
0.32 mm and 0.34 mm respectively. These values were not
statistically different from one another (z-test).
Steelhead trout from the Little Manistee and Pere Marquette
Rivers had a daily average increase in length of 0.56 mm
and 0.58 mm respectively. These values were also not
significantly different from one another (z-test).
Comparison of brown trout growth to steelhead growth
indicated that the average daily increase of these species
were significantly different from one another. All species
regardless of the river system in which they were found
exhibited similar length-weight relationships. In other

17
Table 4. Estimates of relative abundance and mean length of trout species from shocking runs.
River
Boardman (S. Branch)
Pere Marquette (Little s. Branch)
Little Manistee
Date
Jun 25, 1986
Aug 23, 1986
Jul 31, 1986
Aug 27, 1986
Jul 24, 1986
Aug 11, 1986
Sep 9, 1986
Jul 24, 1986
Aug 11, 1986
Sep 9, 1986
Species
Brown
Steel-head
Brown
Steelhead
Length + Standard
Error (mm)
61.6 + 2.7
81.7 + 1.7
56.1 + 2.1
72.3 + 2.3
75.0 ± 1. 6
83.1 + 1.8
90.5 + 2.1
46.5 + 0.9
59.6 ± 1.6
73.4 + 2.0
Number of
Fish
69
43
44
56
47
38
30
118
58
63

18
words, the weight of a fish at a particular length was the
same for both brown and steelhead trout.
Available Habitat
The quality and quantity of available habitat was
found to be very similar in each river's study section
(Table 5). Open areas with no structures comprised the
majority of the total study area for all three rivers. The
second most abundant habitat type available in the sections
was a combination of down timber and overhanging vegetation
such as tag alder or cedar. However, each section did
contain structures that were unique to their river's
system. The Little Manistee river has had man-made habitat
improvement structures constructed in its waters and the
Pere Marquette river contains many large boulders and rock
structures that were not found in the other sections.
Despite these and other inherent differences that occur
between river systems, I assumed that the study sections
were similar enough to allow between stream comparisons to
be made. This assumption was based on the fact that all
three sections contained the same predominate instream
structures and were capable of supporting trout
populations.
Underwater Observations
Brown and steelhead trout appear to be selective for

Table 5. Area of habitat types (m2) measured in all three study sections.
Habitat
None
Overhanging Vegetation-Timber Complex
Down Timber
overhanging Vegetation
Boulder
Habitat Improvement Structure
Aquatic Vegetation
Island
Root Wad
Other
Boardman South Branch
Area %
529.4 59.3
208.2 23.3
109.8 12.3
14.4 1.6
o.o o.o
o.o o.o
o.o o.o
20.7 2.3
o.o o.o
10.0 1.1
River
Pere Marquette Littles. Branch
Area %
547.8 59.1
221.1 23.9
69.2 7.5
23.5 2.5
35.7 3.9
o.o o.o
11.1 1.2
o.o o.o
9.9 1.1
8.3 0.9
Little Manistee
Area %
731.8 64.3
156.9 13.8
39.3 5.8
130.7 11.5
0.0 o.o
65.6 5.8
0.0 0.0
o.o o.o
o.o o.o
14.4 1.3
I-' \0

20
particular types of structure regardless of their
availability. Utilization of habitat was significantly
different from that expected based on habitat availability
(Table 6). Both species whether allopatric or sympatric
with one another, were most frequently found under logs or
holding positions in close proximity (within a meter) to
down timber, even though other types of structure were more
abundant.
Logistic Regression
Brown Trout
Difference in total body length was found to be the
most significant (X2= 23.92) variable in classifying brown
trout from the Boardman and Little Manistee Rivers. Brown
trout observed in the Boardman river were on the average
8.57 centimeters long which was significantly larger (p <
0.0623) than the 5.68 centimeter average length of brown
trout observed in the Little Manistee River (Table 7 and
8). The linear model developed by the logistic regression
procedure contained several cover and substrate variables
which pertained to microhabitat measurements taken at the
fish's position. The significance of these variables is
difficult to evaluate because their chi-square values are
minimal and differences in availability of microhabitat
between river systems is unknown.
The model correctly classified brown trout in the
Boardman River 99.4% of the time. This indicates that

Table 6. Chi-square analysis for habitat utilization versus habitat availability.
Site Species Date Calculated Critical Chi-square Chi-square
Boardman Brown June- 158.01* 7.82 River Trout Nov. (South Branch)
L. Manistee Brown June- 19.24* 7.82 River Trout Nov.
L. Manistee Steelhead June 18 135.77* 9.49 River Trout July 21 438.63* 11.07
Aug. 18 82.93* 9.49 Sept. 9 147.77* 11. 07 Nov. 7 95.50* 9.49
Pere Marquette Steelhead July 7 188.64* 11.07 River (Little Trout July 29 73.22* 11.07 s. Branch) Aug. 29 361. 21* 11.07
Oct. 30 341.94* 11.07 Nov. 22 61.38* 11.07
* Significant values which indicate that habitat is not used in proportion to availability.
"" .....

22
Table 7. Mean, range, am stan1ard error of significant variables from logistic regression procedure for the South Branch of the Boardman River.
Species Variable Mean Range Stamard Min.iJnum MaxilTlum Error of Value Value Mean
Brown Length 8.57 2.0 16.0 0.18 Trout
Average 0.94 o.o 3.08 0.03 Velocity
Depth (cm) 48.4 14 100 0.96
Distance from 2.61 0 30 0.15 SUbstrate
23
Table 8. Mean, range, and standard error of significant variables from logistic regression procedure for the Little Manistee River.
Species Variable Mean Range Standard Minimum Maximum Error of Value Value Mean
Steelhead I.ength 6.94 2.0 16.0 0.22 Trout
Average 0.94 o.o 2.82 0.04 Velocity
Depth (cm) 39.6 11 105 1.31
Distance from 3.09 0 23 0.23 SUbstrate
Brown I.ength 5.68 3.0 12.0 0.42 Trout
Average 0.66 o.o 2.49 0.08 Velocity
Depth (cm) 29.2 12 56 1.87
Distance from 0.71 0 4 0.20 SUbstrate

24
trout in this river have extremely consistent values for
the length, cover, and substrate variables found in the
model. Brown trout observed in the Little Manistee River
were more variable in length and utilization of
microhabitat than brown trout in the Boardman River.
Therefore, they were more difficult to classify and the
model was only correct 65.6% of the time.
Steelhead Trout
Steelhead trout in the Pere Marquette and Little
Manistee Rivers utilized different water velocities and
depths depending on the river system in which they were
located. Steelhead trout in the Little Manistee utilized a
wider range of water depths (11 to 105 cm) but on the
average were found in shallower waters than Pere Marquette
rainbow trout (Table 8 and 9). However, the mean depths
utilized by both trout populations were not statistically
different based on at-test analysis. The range of
velocities utilized by both trout populations were very
similar. Pere Marquette River steelhead trout were found
in velocities ranging from 0.06 to 2.38 meters per second
and Little Manistee River steelhead trout were found in
velocities ranging from o.o to 2.82 meters per second. A
t-test comparison of mean velocity values for these
populations determined that steelhead trout in the Little
Manistee River utilize significantly faster velocities than
Pere Marquette River steelhead trout. Trout from both

25
Table 9. Mean, range, am standard error of significant variables from lcX]istic regression procedure for the Little South Branch of the Pere Marquette River.
Species Variable Mean Range Standard Minintum MaxiJllum Error of Value Value Mean
Steelhead Length 8.69 2.0 16.0 0.23 Trout
Average 0.85 0.06 2.38 0.03 Velocity
Depth (an) 53.0 14 100 1.25
Distance from 3.88 0 30 0.20 SUbstrate

26
river systems were found most frequently in water
velocities less than 1.5 meters per second. Little
Manistee River steelhead trout were equally distributed in
velocities ranging from o to 1.5 meters per second whereas
steelhead trout in the Pere Marquette River were found
concentrated in 0.5 meters per second and 1.3 to 1.4 meters
per second water velocities.
The linear model developed by the logistic regression
procedure found water depth and velocity to be the most
significant variables in classifying steelhead trout in the
Little Manistee and Pere Marquette Rivers. As with the
logistic regression model developed to classify brown trout
populations, the steelhead trout model also contains
several cover and substrate variables whose chi-square
values are insignificant. The model had a correct
classification rate of 76.3% for steelhead trout observed
in the Pere Marquette River and 84.9% for those in the
Little Manistee River. Therefore, it appears that both
populations vary to some extent in their utilization of
cover and substrate as well as water depth and velocity.
Sympatric Brown and Steelhead Trout
Brown and steelhead trout in the Little Manistee River
were found to differ most significantly in the distance
above the substrate that they held positions. Brown trout
were more closely associated with the substrate than
steelhead trout. They held positions that were on the

27
average 0.71 cm above the stream bottom and were never
found in positions greater than 4 cm from the substrate.
Rainbow trout positions ranged from Oto 23 cm above the
substrate and had a mean value of 3.09 cm. The mean
values for distance from the substrate (Table 8) were found
to be statistically different between species by at-test
comparison.
The logistic regression procedure developed a model
that contained several cover and substrate variables as
well as distance from the substrate measurements. However,
the chi-square values for the cover and substrate variables
were insignificant. The model correctly classified
steelhead trout 95.6% of the time. This high percentage
suggests relatively consistent values for the variables
contained in the model. Brown trout, on the other hand,
appeared to be extremely inconsistent in their utilization
of these variables and were only classified correctly 38.8%
of the time.
Food Habits
Brown Trout
Brown trout in the Boardman and Little Manistee rivers
did not exhibit major differences in preference of prey
items. Larval insects belonging to the families
Chironomidae and Simuliidae were the most commonly
occurring food items in the stomach contents of both brown
trout populations (Tables 10 and 11). Diets were also

28
Table 10. Stomach contents of young of the year brown trout collected in the Little Manistee River, 1986.
Number Mean Frequency Food Item Stomachs Number of
Containing Per Occurrence Item stomach
TRICHOPTERA 10 1. 6 0.20 Hydropsychidae 15 1.8 0.31 Glossomatidae 21 2.7 0.43 Limnephilidae 3 2.0 0.06 Brachycentridae 4 1. 0 0.08
DIPTERA 2 2.0 0.04 Tipulidae 6 3.0 0.12 Ceratopogonidae 6 2.2 0.12 Simuliidae 28 6.1 0.57 Chironomidae 30 6.3 0.61 Pupae 4 3.5 0.08
EPHEMEROPTERA 11 1.8 0.22 Baetidae 14 3.2 0.29 Ephemerellidae 8 2.5 0.16
PLECOPTERA Perlodidae 3 1. 7 0.06
TERRESTRIAL INSECTS 8 3.5 0.16
GASTROPODA 14 1. 6 0.29
ISOPODA 7 1. 3 0.14
COLEOPTERA 4 2.5 0.08
OTHER 19 1.1 0.39

29
Table 11. Stomach contents for young of the year brown trout collected in the south Branch of the Boardman River, 1986.
Food Item Number Stomachs Containing
Item
TRICHOPTERA 8 Hydropsychidae 5 Glossomatidae 9 Limnephilidae 9 Brachycentridae 17
DIPTERA Tipulidae 4 Ceratopogonidae 7 Simuliidae 31 Chironmidae 42 Pupae 7
EPHEMEROPTERA 17 Siphlonuridae 6 Baetidae 27 Heptageniidae 5 Ephemerellidae 10 Tricorythidae 3
TERRESTRIAL INSECT 7
GASTROPODA 10
COLEOPTERA 4
ISOPODA 3
OTHER 13
Mean Number
Per Stomach
1. 6 1. 0 1. 3 4.6 3.5
1. 3 4.4 4.0 4.4 2.3
1.4 1.2 3.7 1. 0 1.8 1. 3
1.9
1. 7
1. 0
2.0
2.0
Frequency of
Occurrence
0.10 0.06 0.11 0.11 0.21
0.05 0.09 0.39 0.53 0.09
0.21 0.00 0.34 0.06 0.13 0.04
0.09
0.13
0.05
0.04
0.16

30
compared by calculating the overlap value for the stomach
contents. The calculated Schoener's index had a value of
0.758 which indicated that brown trout in the Little
Manistee and Boardman Rivers overlap significantly in terms
of prey taxon present in the diet.
Size analysis of the diet produced results similar to
that of prey taxon. The mean headcapsule width of prey was
calculated for the entire season (Table 12). The average
headcapsule width for brown trout in both the Boardman and
Little Manistee Rivers was 0.588 mm. Therefore, despite
the probable differences in prey availability between river
systems brown trout appear to eat the same taxon and size
class of prey regardless of their geographic location.
Steelhead Trout
Steelhead trout in the Pere Marquette and Little
Manistee rivers exhibited a preference for the same prey
taxa. Larval Chironomidae and Simuliidae were the
predominate prey of both populations (Tables 13 and 14).
Overlap of prey taxon in the diet was found to be
significant between these populations with a calculated
Schoener's index of 0.647.
Size analysis of the diet produced results which
indicated that despite the similarity in preference of prey
taxon steelhead trout in the Pere Marquette and Little
Manistee Rivers eat different size classes of prey. Mean

31
Table 12. Diet data for each site and species over the entire sampling season.
Site Species Number Number Mean Fish Of Head
Examined Prey Capsule Items (mm)
Boardman Brown 80 721 0.588 River Trout (South Branch)
Little Brown 49 701 0.588 Manistee Trout River
Little Steelhead 92 2275 0.653 Manistee Trout River
Pere Steelhead 14 313 0.485 Marquette Trout River (Little s. Branch)
Standard Error
0.014
0.015
0.031
0.016

32
Table 13. Stomach contents for young of the year steelhead trout collected in the Little Manistee River, 1986.
Food Item
TRICHOPTERA Hydropsychidae Glossomatidae Limnephilidae Brachycentridae
DIPTERA Tipulidae Ceratopogonidae Simuliidae Chironomidae Pupae Adult
EPHEMEROPTERA Siphlonuridae Baetidae Ephemerellidae Tricorythidae
PLECOPTERA Perlodidae
TERRESTRIAL INSECT
ISOPODA
OTHER
Number Stomachs
Containing Item
15 25 20
5 7
5 8
21 53 73 32 12
24 11 26
8 6
9
20
12
59
Mean Frequency Number of
Per Occurrence Stomach
1. 6 0.16 2.2 0.27 2.8 0.22 1. 4 0.05 3.1 0.08
3.2 0.05 2.1 0.09 2.7 0.23 8.1 0.58
12.1 0.79 10.1 0.35
2.8 0.13
2.1 0.26 1. 6 0.12 2.7 0.28 1.8 0.09 4.0 0.07
2.1 0.10
4.7 0.22
1.4 0.13
1. 6 0.64

33
Table 14. Stomach contents for young of the year steelhead trout collected in the Little South Branch of the Pere Marquette River, 1986.
Food Item
TRICHOPTERA Hydropsychidae Glossomatidae
DIPTERA Tipulidae Simuliidae Chironomidae Pupae Adult
EPHEMEROPTERA Baetidae Tricorythidae
OTHER
Number Stomachs
Containing Item
6 5 3
4 10 11
4 1
2 4 6
10
Mean Number
Per Stomach
1.5 2.8 1. 0
2.0 2.3
17.6 2.8 8.0
4.5 2.5 1.5
1.4
Frequency of
Occurrence
0.43 0.36 0.21
0.29 0.71 0.79 0.29 0.07
0.14 0.29 0.43
0.71

34
headcapsule widths of prey items found in the Little
Manistee River steelhead trout was 0.653 mm and 0.485 mm
for Pere Marquette River steelhead trout (Table 12). These
mean values were found to be significantly different based
on at-test analysis. Therefore, steelhead trout in both
river systems eat the same taxon of prey but appear to
choose different size classes of prey.
Sympatric Brown and Steelhead Trout
Brown and steelhead trout in the Little Manistee
River exhibit very little difference in food habits in
terms of both size and taxon of prey. Both species ate
predominately Chironomidae and Simuliidae larvae (Tables 10
and 13) and overlap of all prey taxon in the diet was
significant for the entire season with an index value of
0.705. Date-by-date comparisons indicated that overlap was
significant on all sampling dates except November (Table
15) •
Size analysis of the diet produced the same results.
Seasonal mean headcapsule width of prey for brown trout was
0.588 mm and 0.653 mm for steelhead trout. These values
were not found to be significantly different based on at
test analysis. Date-by-date mean headcapsule widths were
also not significantly different between species (Table
15). Prey with headcapsules less than 1.0 mm were ingested
more frequently than other size classes (Figures 1 and 2).

35
Table 15. Schoener•s diet overlap and comparison of mean headcapsule width for sympatric brown and steelhead trout in the Little Manistee River, 1986.
Date
July
Aug.
Sept.
Nov.
Interacting Species
Brown-Steehead Trout
Brown-Steelhead Trout
Brown-Steelhead Trout
Brown-Steelhead Trout
Overlap
0.764
0.704
0.652
0.447
T-Test Comparison of Mean
Head Capsule
NS
NS
NS
NS

-C m u L. m
C.
36
3
2
4
1 ~8~----~----~--------~~----__:::::::::::-J_u_n_e--~ mean fish length
-._____ 58.4+2.7 [mm]
July mean fish length
72.2+2.9 [mm)
50 40 30 20 10 s8-'-~~~~~~~~__:======----~~-~8 30
rB
August mean fish length
82.3+3.7 [mm)
.,,,,,- "'-.. mean fish length 2~1~~~---~~....i::;;. ~~-~~-~~~~...:::=:::S=e-p-te_m_b-er--
~ 94+4.5 (mm)
3241~000~--~=--~----r--------~~~====;:::==No=v=e~m-b_e_r~ ~ mean fish length
"" I 02.8+2.9 · (mm)
o-.'2s .2s.:.so .s 1.: 1.0 1.0 i -1.s 1.s 1-2.0 z'.o+ Prey Size [mm)
Figure 1, Percent composition of diet by prey size for Little Manistee River brown trout collected on each sampling date.

-C: m U. 1-· m
Q.
37
~ygg0 ~---~----------~---J-u_n_e __ mean fish Ieng th
~ 44+2.6 [mm]
50 40 30 20 10
July mean fish length
4 2.6 + 2.2 [mml sB-1-~~~~~~~~----~~~~
40 August ao mean fish length 20 56.6+3.3 [mm) 10 59----~~~~~~~--~~~
40 September 30 mean fish length 20 S7.7+3.3 [mm}
'8-1...-------------::======----50 40 November 30 mean fish length 20 93.5+3.5 [mm] 10
0 ~---.----,---....,.....--~--------~---0-25 26~ .50 .51-1.0 1.0 l -1.5 1.51-2.D 2.0+
Prey Size (mm]
Figure 2. Percent composition of diet by prey size for Little Manistee River steelhead trout collected on each sampling date.

38
Therefore, it appears that both brown and steelhead trout
eat the same taxon and size class of prey in the Little
Manistee River where they co-occur.
Monthly Diet Analysis
Within each river system diet overlap and mean
headcapsule width of prey items for each trout species were
compared between sampling dates to observe changes that may
occur from June to November.
Boardman River Brown Trout
Brown trout in the Boardman River did not exhibit the
same food habits across the sampling season. Date to date
comparisons indicated that overlap of prey taxon was not
significant from June through November (Table 16). Prey
size also changed between sampling dates. Mean headcapsule
width of prey items (Table 17) were found to be
significantly different for different dates based on a 1-
way analysis of variance. A student-Newman-Kuels' multiple
comparison test found the mean headcapsule width of prey
items from each of the sampling dates to be significantly
different from one another except for the months of June
and November (Table 18). Prey with headcapsules ranging
from 0.51 to 1.0 mm were eaten most frequently in all
months except June (Figure 3). Therefore, prey in the
diets of brown trout in the Boardman River appears to be
dependent on the time of season when samples were

39
Table 16. Diet overlap as indicated by Schoener's index for between month comparisons for each trout species.
Site Species Interacting Index Months
Boardman Brown June-July 0.435 River Trout (South July-Aug. 0.492 Branch)
Aug.-Nov. 0.228
Pere Steel head July-Aug. 0.628* Marquette Trout (Little s. Branch)
Little Brown July-Aug. 0.686* Manistee Trout River Aug.-Sept. 0.561
Sept.-Nov. 0.217
Little Steelhead June-July 0.304 Manistee Trout River July-Aug. 0.693*
Aug.-Sept. 0.680*
Sept.-Nov. 0.201
* indicates significant values

40
Table 17. Diet data for each site and species for each sampling date, 1986.
River Species Month No. No. Mean Standard Fish Prey Head Error
Capsule (mm)
Boardman Brown June 30 116 0.788 0.043 River Trout July 14 109 0.639 0.034 (South Aug. 20 433 0.474 0.048 Branch) Nov. 16 63 0.785 0.051
Little Brown June 1 5 0.213 0.031 Manistee Trout July 17 256 0.532 0.015 River Aug. 13 147 0.575 0.039
Sept. 5 249 0.583 0.027 Nov. 13 44 0.985 0.105
Little steel- June 18 163 0.512 0.028 Manistee head July 21 193 1. 052 0.720 River Trout Aug. 13 318 0.457 0.014
Sept. 3 1580 0.581 0.058 Nov. 10 21 1. 739 0.957
Pere steel- July 12 151 0.512 0.026 Marquette head Aug. 2 162 0.458 0.019 River Trout (Little s. Branch)

41
Table 18. Student-Newman-Kuel's test results for between month comparison of mean prey headcapsule. Months with the same letters are not significantly different.
Site Species June July Aug. Sept. Nov.
Boardman Brown River Trout A B C A (South Branch)
L. Manistee Brown River Trout B B B B A
L. Manistee Steelhead River Trout B B B B A
Pere Marquete Steelhead River Trout A A (Little s. Branch)

42
,n June
C mean fish length
~ 54.1 +az 1mm1
60 50 July 40 maan fish length so 67.5+4.Z [mm) ZD - 10
C a m u 50 '-m 40 August a..
so mean fish length zo 78.1 +4.Z [mm) 10 a
60 50 November 40 mean fish length so I 03.9+6.3 lmmJ 20 10 a
.26-.50 .51-1.0 20+
Prei., Size lmml
Figure 3. Percent composition of diet by prey size for Boardman River brown trout collected on each sampling date.

43
collected.
Little Manistee River Brown Trout
Brown trout in the Little Manistee River exhibited
relatively consistent food habits across the season. Prey
taxon overlapped significantly between the July-August and
August-September sampling dates (Table 16). Prey size was
found to differ from June to November based on a 1-way
analysis of variance procedure. Mean headcapsule width was
calculated for each date sampled (Table 17). A Student
Newman-Kuels' multiple comparison test found the mean
headcapsule width of prey from the July, August, and
September sampling dates to not be significantly different
from one another (Table 18). However, headcapsule width of
prey from the July sampling date were significantly
different from samples collected on the other dates. The
majority of prey in the diets had headcapsules less than
1.0 mm in width (Figure 1). There did not appear to be a
preference for a particular size class of prey except for
during the month of August when prey with headcapsules
ranging from 0.51 to 1.0 mm were eaten approximately 60% of
the time. Therefore, brown trout in the Little Manistee
River eat different taxa of prey items but eat the same
size class of prey from July to September.
Little Manistee River Steelhead Trout
Steelhead trout in the Little Manistee River ate a wide

44
variety of taxon and size classes of prey from June to
November. overlap values for comparison of prey taxa from
trout collected in June-July and September-November were
not significant (Table 16). However, prey taxa did overlap
significantly from July to September.
A 1-way analysis of variance on stomach contents
indicted that prey size differed across the sampling
season. Mean headcapsule widths were calculated for each
sampling date (Table 17) and compared with a student
Newman-Kuels' multiple comparison test. The results of
this test found the mean headcapsule width of prey items
from the November sampling date to be significantly
different from the June, July, August, and September
sampling dates (Table 18). The majority of prey found in
the diets had headcapsules less than 1.0 mm in width with
no particular size class preferentially selected
Therefore, steelhead trout in the Little Manistee
River exhibit some consistency in food habits between
sampling dates but do not preferentially eat particular
taxa and size classes of prey.
Pere Marquette River steelhead Trout
Food habits of steelhead trout were based on a limited
sample size (n=l4). The size and taxa of prey were
consistent between the two dates sampled. Overlap of prey
taxa had a value of 0,628 (Table 16) which is significant.

45
Mean headcapsule widths calculated for each month (Table
17) were not statistically different based on a 1-way
analysis of variance procedure. Prey with headcapsules
less than 1.0 mm in width were eaten most frequently
(Figure 4). Samples from other points in the season may
have allowed a more complete analysis of food habits for
these trout.
DISCUSSION
Although juvenile brown and steelhead trout commonly
co-habit coastal Lake Michigan tributaries little work has
been done to measure relations between these species in
terms of food, space and growth. Results from this study
have been presented in an attempt to describe some aspects
of interactions between juvenile brown and steelhead trout
in the stream environment.
Habitat Utilization
Brown and steelhead trout have been shown to prefer
the same types of stream positions with similar depths,
water velocity, and cover (Jenkins 1969, Slaney and
Northcote 1974, Shirvell and Dungey 1983). The habitat
preferences of juvenile brown and steelhead trout in my
study appeared to support this premise. Both species
whether allopatric or sympatric were most often found
holding positions associated with instream cover,

50
40
30
20
10 - a C: m 80 u '- 70 m
C.
so 50 40
30 20
10 a
46
July mean fish length
57.4+9.0 lmml
August mean fish length
80.5+0.S Cmml
o-.zs .2s-.5o .51-1.0 1.01-1.s 1.51-2.0 2.0+
Prey Size (mml
Figure 4. Percent composition of diet by prey size for Pere Marquette River steelhead trout collected on each sampling date.

47
particularly down timber.
Previous studies investigating habitat use of brown
and steelhead trout have produced the same results. Fausch
and White (1981) found brown trout associated with cover
more often than in open positions of the Au Sable River.
Their results indicated a particular preference for
undercut banks, natural log jams, and half log habitat
improvement structures. Similarly, Hartman (1965) found
densities of young steelhead trout to be highest in the
upstream reaches of the Salmon River where much of the
shoreline was overgrown and covered with fallen trees. Of
the instream cover available in these stretches, large log
jams were found to have the largest number of steelhead
trout associated with them.
Instream cover is of particular importance to trout
because it conceals them from predators and shelters them
from current (Devore and White 1978, Hartzler 1983).
Mortensen (1977) further demonstrated the importance of
cover when he found the natural mortality of age o brown
trout to be higher in streams where cover was removed than
in control streams which were not manipulated. In
addition, the association with cover has been shown to
become more pronounced when the amount of available cover
is limited (Cunjak and Power 1986).
Both brown and steelhead trout have been shown in this
and previous studies to have similar habitat preferences.

48
This similarity has created the potential for interaction
and competitive relationships to develop between these two
species. If the amount of available habitat is limited
changes may occur in habitat utilization when brown and
steelhead trout are allopatric versus sympatric with one
another. This possibility was investigated by
statistically comparing the data collected on stream
positions of the trout populations in all three study
sections.
The results from the logistic regression were used to
evaluate the effect of instream cover and other physical
parameters on the spatial distribution of brown and
steelhead trout when allopatric and sympatric with one
another. Intraspecific comparisons of brown trout from the
Little Manistee and Boardman Rivers and steelhead trout
from the Little Manistee and Pere Marquette Rivers
demonstrated that utilization of instream cover and other
physical parameters did not differ significantly between
river systems for the majority of variables included in the
logistic model. Many times the utilization of a particular
type of cover or substrate was so infrequent that its
significance is difficult to evaluate. Cover and substrate
types included in the model very seldom had r2 values of
0.25 or greater. Therefore, their contribution to the
overall explanation of variance was minimal.
Water depth and velocity were important factors in

49
differentiating steelhead trout population habitat
preferences in the study sections. Field observations
showed that Little Manistee steelhead trout utilized a
wider range of depths but were on the average observed in
shallower water locations than steelhead trout in the Pere
Marquette River. Stream positions held by individual trout
from both populations were found to have significantly
different average velocity values when the two river
systems were compared. Little Manistee steelhead trout
were found in faster water than steelhead trout in the Pere
Marquette River. However, it is unlikely that depth or
velocity alone are the major limiting factors in habitat
choice for salmonid species. Kennedy and Strange (1982)
found differences in water depth and stream gradient
preferences by sympatric Atlantic salmon and brown trout
but concluded that neither depth or gradient by themselves
could account for the habitat choices exhibited by these
species. It is more likely that the combination of depth
and velocity effects stream position choice. The
differences in depth and velocity measured at the fish's
position in this study may have been a function of
availability which was different between river systems.
The Little Manistee had a higher percentage of open areas
which did not provide shelter from the current and a
steeper gradient than the Pere Marquette study section.
Brown trout in the Boardman and Little Manistee Rivers

50
did not exhibit habitat preferences which could be utilized
to differentiate between their populations. The most
important distinguishing factor for these fish was total
body length of the individuals. Juvenile brown trout in
the Boardman River were significantly larger than those in
the Little Manistee River. Werner and Hall (1977) have
shown that when two ecologically similar species, bluegill
sunfish (Lepomis macrochirus) and green sunfish (Lepomis
cyanellus), occur in sympatry, bluegill sunfish growth rate
is depressed compared to its growth in allopatry. Brown
trout are sympatric with steelhead trout in the Little
Manistee River. Due to the similarity in ecological
requirements of these two salmonids, the presence of
steelhead trout may be the cause of the smaller body size
observed in the Little Manistee River brown trout.
However, analysis of growth did not show a significant
difference between river systems. Brown trout in the
Little Manistee and Boardman Rivers exhibited average
daily growth rates that were not statistically different
form one another. Therefore, the observed differences in
total body length for these populations is probably due to
the time of fry emergence or some other system specific
parameter rather than interaction between brown and
steelhead trout.
Interspecific comparisons of sympatric brown and
steelhead trout in the Little Manistee River demonstrated

51
that utilization of available habitat and other physical
attributes of the trout did not differ significantly
between species for all variables included in the logistic
model, except for distance from the substrate. Brown trout
were only identified correctly 38.8% of the time which
indicates that the variables measured in this study have
the same values for both brown and steelhead trout. In
other words, they appear to have the same habitat
preferences when they co-occur in a river system.
Distance from the substrate was the only environmental
factor that appeared to be helpful in differentiating
between trout species. Steelhead trout occupied positions
with a wider range and higher mean value for distance from
the substrate than brown trout. However, it is unlikely
that this factor alone is essential in determining habitat
choice between these species. This is evident by the fact
that even when utilizing distance from the substrate in the
logistic model brown trout were only correctly classified
approximately 38.8% of the time.
Diet Analysis
Brown and steelhead (rainbow) trout exhibit many
similar dietary habits. Both species feed on drifting and
epibenthic invertebrates and appear to be selective for
particular size classes and taxa of prey (Bryan and Larkin
1972, Tippets and Moyle 1977, Ringler 1979, Nilsson and

52
Northcote 1981). The food habits of juvenile brown and
steelhead trout in my study were similar. Larval aquatic
insects belonging to the taxonomic families of Chironomidae
and Simuliidae were the most abundant items ingested by
juvenile trout in the Pere Marquette, Little Manistee, and
Boardman River systems. Both sympatric and allopatric
brown and steelhead trout selected and ate the same
taxonomic groups of insects.
Similarities in dietary taxon have been reported
previously for brown and steelhead trout by Wagner (1975).
He found significant correlations between diets of yearling
rainbow (steelhead) and brown trout in the Platte River of
Michigan. Idyll (1942) also presented results which
indicated that for brown and steelhead fry and fingerlings
(up to 100 mm) there was no difference in food items found
in the stomach contents of both species. In contrast,
Johnson (1981) showed that dietary overlap between
coexisting yearling brown and rainbow (steelhead) trout was
not significant for prey taxon in the stomach contents of
these fishes. These results, as well as the results of my
study, suggest that similarity in dietary behavior does
occur between brown and steelhead trout but it may only be
evident at particular life stages or size classes of these
species.
Size analysis of diet indicated that mean headcapsule
width of prey were not significantly different for brown

53
and steelhead trout in the Little Manistee and Boardman
Rivers. However, prey ingested by steelhead trout in the
Pere Marquette River were on the average smaller than prey
ingested by trout in the other study streams. The
mechanism behind this difference is unknown as the size
range of available prey was not established through forage
base sampling in the study sections.
Previous studies investigating size selective
predation by brown and steelhead trout have indicated that
the preferences of both species are similar. Bisson (1978)
found that body size was the most important factor
affecting vulnerability of prey to predation by both small
(3 g) and large (45 g) hatchery reared rainbow trout.
Larger individuals within the prey taxa were found to
constitute a greater proportion of the diet than their
proportion in the drift. Invertebrates less than 2 mm in
size were rarely consumed despite the fact that these
smaller size classes constituted the majority of the total
drift. Ware (1972) reported similar results in a
laboratory study where the density and size of prey were
controlled. Four rainbow trout ranging from 134 mm to 170
mm in length were obtained from Marion Lake, B.C. and
observed for feeding behavior in his study. The trout
selected large prey items over small prey items regardless
of the density of each size class in the drift. In
addition, his results demonstrated that rainbow trout were

54
capable of locating large prey from greater distances than
small prey. Ware suggested that visual location of prey
was the controlling factor determining the dietary
preferences of these fish.
size selective predation by brown trout has been
investigated by Ringler (1979). He designed a laboratory
study to determine the effect of prey size, density, and
distribution on the feeding behavior of wild brown trout.
His results indicated that selective predation by brown
trout was most directly related to prey size. Large food
items were preferentially ingested over small prey items
regardless of the abundance or distribution of the smaller
items. Therefore, body size appears to be the most
important factor in determining the vulnerability of prey
to predation by both brown and steelhead (rainbow) trout.
It is evident from data presented in this study and
previous studies that juvenile brown and steelhead trout
utilize the same size and taxon of prey resources. This
similarity has created the potential for interaction and
competitive relationships to develop between these two
species. One species may limit the amount or type of prey
available to another species and subsequently cause changes
in the resource utilization of the subordinate species.
Shifts in resource use by species when similar forms are
present provide evidence for the action of competition in
structuring communities.

55
Data in this study did not indicate changes in food
habits when brown and steelhead trout were allopatric
versus sympatric. Therefore, interaction or competition
for food resources does not appear to occur.
Temporal segregation of food utilization was
investigated by observing seasonal variation in dietary
habits. This was accomplished by comparing gut contents of
individuals collected from the same populations between
sampling dates. Taxonomic dietary overlap was not found to
be significant for the majority of between sample
comparisons for both allopatric and sympatric brown and
steelhead trout (Table 16). However, mean headcapsule
width of ingested prey items were not found to be
significantly different between sampling dates for all
trout populations except Boardman River brown trout. This
suggests that size, rather than taxonomy, is the more
important factor in the food selection of both brown and
steelhead trout in this study. Differences in taxon
utilization between sampling dates may be a mechanism which
allows coexistence of brown and steelhead trout. However,
it is more likely the result of differences in prey
availability due to emergence of various aquatic and
terrestrial insects. Changes in taxon utilization would
only need to occur when these species are sympatric for it
to act as mechanism for coexistence. In this study, taxon
utilization changed from date to date for both allopatric

56
and sympatric brown and steelhead trout which indicates
these changes were probably due to prey availability.
Conclusions and Future Research
The potential of interaction or competition for stream
resources between juvenile brown and steelhead trout
exists. Both species ingest the same types and sizes of
prey and have similar space requirements. This overlap of
resource utilization did not appear to substantially effect
the growth and survival of the young-of-the-year trout
examined. However, in aquatic systems where resources are
limited it is likely that interaction between brown and
steelhead trout may affect the population dynamics of one
another.
Evidence of a population level response to interaction
between brown and steelhead trout was not documented in
this study. However, there was a difference in population
size structure observed between brown trout in the Boardman
and Little Manistee Rivers. Trout measuring 203 mm
to 254 mm in length were much more abundant in the Boardman
River than in the Little Manistee River. Previous
researchers have also observed the same distribution of
sizes in the Little Manistee River during the course of
their studies (Paul Seelbach, Mich. Dept. Nat. Res.).
Further research needs to be conducted to investigate
the possible mechanisms that influence size structure of

57
trout populations. The results of this study do not
indicate a specific population controlling mechanism which
influences juvenile trout during their first summer of
life. However, interaction between brown and steelhead
trout may affect over-winter survival or have more
pronounced affects on these species at later points in
their life history. Future research should be designed to
investigate population controlling mechanisms of brown and
steelhead trout and to determine the results of interaction
between these ecologically similar species throughout their
life history.
Summary
Juvenile brown and steelhead trout in the Little
Manistee, Pere Marquette, and Boardman Rivers were found to
utilize the same food and space resources. Both species
ate primarily chironomid and simulid larvae which were
approximately the same size. Steelhead trout in the Pere
Marquette River did ingest smaller prey compared to the
other trout populations. However, these data were based on
a limited sample size.
Analysis of habitat utilization indicated that both
brown and steelhead trout are commonly associated with
cover, particularly down timber. No major differences in
utilization were observed for sympatric versus allopatric
populations of these trout. However, differences in

58
physical parameters such as depth and velocity did allow
distinction to be made between trout populations from
different rivers. Sympatric brown and steelhead trout were
difficult to classify into species categories through the
measurement of physical and biological variables as there
was little difference in the values of these variables
between species.
In general, sympatric populations of brown and
steelhead trout did not appear to exhibit niche shifts from
those observed for allopatric populations. Growth of both
species was the same regardless of their distribution
(allopatric or sympatric). The only indication that
interaction between these species may have a negative
effect is in relative abundance. The abundance of
sympatric brown trout diminished across the season and was
on the average lower than that of the allopatric
population. This observation may be the result of inherent
variability in between river comparisons but interaction
with steelhead trout may also play a role in the regulation
of brown trout populations. In order to evaluate this
possibility, it is necessary to manipulate the density of
steelhead trout and observe the responses of the sympatric
brown trout population.

LIST OF REFERENCES

LIST OF REFERENCES
Allen, K.R. 1969. Limitations on production in salmonid popualtions in streams. Pages 3-18 in T.G. Northcote, ed. Symposium on Salmon and Trout in Streams. H.R. MacMillam Lectures in Fisheries, Univ. Brit. Col., Vancouver.
Arnold, L.C. and S.D. Van Nert. 1987. Area of irregular polygons. Lotus, Vol. 2, 4: 100.
Bisson, P.A. 1978. Diel food selection by two sizes of rainbow trout (Salmo gairdneri) in an experimental stream. J. Fish. Res. Board Can. 35: 971-975.
Bovee, K.D. 1982. A guide to stream habitat analysis using the Instream Flow Incremental Methodology. Instream Flow Information Paper 12. U.S.D.I. Fish and Wildlife Service, Office of Biological Services. FWS/OBS-82/26. 248pp.
Bowlby, J.N. and J.C. Roff. 1986. Trout biomass and habitat relationships in southern Ontario streams. Trans. Amer. Fish. Soc. 115: 503-514.
Bryan, J.E. and P.A. Larkin. 1972. Food specialization by individual trout. J. Fish. Res. Board Can. 29: 1615-1624.
Burton, G.W. and E.P. Odum. 1945. The distribution of stream fish in the vicinity of Montain Lake, Virginia. Ecology 26: 182-194.
Chapman, D.W. 1966. Food and Space as regulators of salmonid populations in streams. Amer. Nat. 100: 345-357.
Cunjak, R.A. and J.M. Green. 1983. Habitat utilization by brook char (Salvelinus fontinalis) and rainbow trout
(Salmo gairdneri) in Newfoundland streams. Can. J. Zool. 61: 1214-1219.
cunjak, R.A. and G. Power. utilization by stream fontinalis) and brown Fish. Aquat. Sci. 43:
1986. Winter habitat resident brook trout (Salvelinus trout (Salmo trutta). Can. J. 1970-1981.
59

60
Everest, F.H. and D.W. Chapman. 1972. Habitat selection and spatial interaction by juvenile chinook salmon and steelhead trout in two Idaho streams. J. Fish. Res. Board Can. 29: 91-100.
Devore, P.W. and R.J. White, 1978. Daytime responses of brown trout (Salmo trutta) to cover stimuli in stream channels. Trans. Amer. Fish. Soc. 107:763-777.
Eves, H. 1975. Analytical geometry. pp. 368-385 in Standard Mathematical Tables. Selby, editor. CRC Press Inc., Cleveland, Ohio.
Fausch, K.D. 1981. Competition among juveniles of coho salmon, brook trout, and brown trout for resources in streams. PhD. dissertation. Michigan State University, East Lansing, Mi.
Fausch, K.D. 1986. Competition among juveniles of coho salmon, brook trout, and brown trout in a laboratory stream, and implications for Great Lakes tributaries. Trans. Amer. Fish. Soc. 115: 363-381.
Fausch, K.D. and R.J. White. 1981. Competition between brook trout (Salvelinus fontinalis) and brown trout (Salmo trutta) for positions in a Michigan stream. Can. J. Fish. Aquat. Sci. 38: 1220-1227.
Gibson, R.J. 1981. Behavioral interactions between coho salmon (Oncorhynchus kisutch), Atlantic salmon (Salmo salar), brook trout (Salvelinus fontinalis), and steelhead trout (Salmo gairdneri) at the juvenile fluviatile stages. Can. Tech. Rep. Fish. Aquat. Sci. 1029: 116p.
Glova, G.J. 1986. Interaction for food and space between experimental populations of juvenile coho salmon (Oncorhynchus kisutch) and coastal cutthroat trout (Salmo clarki) in a laboratory stream. Hydrobiologia 131(2), 155-168.
Hartman, G.F. 1965. The role of behavior in the ecology and interaction of underyearling coho salmon (Oncorhynchus kisutch) and steelhead trout (Salmo gairdneri). J. Fish. Res. Board can. 22: 1035-1081.
Hartzler, J.R. 1983. The effect of half-log covers on angler harvest and standing crop of brown torut in McMicheals Creek, Pennsylvania. N. A. Jour. Fish. Man. 3:228-238.

61
Hearn, W.E. and B.E. Kynard. 1986. Habitat utilization and behavioral interaction of juvenile Atlantic salmon (Salmo salar) and rainbow trout (~ gairdneri) in tributaries of the White River of Vermont. Can. J. Fish. Aquat. Sci. 43: 1988-1998.
Idyll, c. 1942. Food of rainbow, cutthroat, and brown trout in the Cowichan River system, B.C. J. Fish. Res. Board Can. 5: 448-457.
Itzkowitz, M. quality.
1979. Territorial tactics and habitat Am. Nat. Vol 114, pp. 585-614.
Jenkins, T.M. 1969. Social structure, position choice and microdistribution of two trout species (Salmo trutta and salmo gairdneri) resident in mountain streams. An. Beh. Mono. 2: 56-123.
Johnson, J.H. 1981. Food interrelationships of coexisting brook trout, brown trout and yearling rainbow trout in tributaries of the Salmon River, New York. New York Fish and Game Journal, Vol. 28, No. 1. pp. 88-99.
Kalleberg, H. 1958. Observations in a small tank of territoriality and competition in juvenile salmon and trout (Salmo salar and Salmo trutta). Rept. Inst. Freshwater Res. Drottningholm 39: 55-98.
Kendall, M. and A. Stuart. 1977. The advanced theory of statistics. Vol.l MacMillan Publishing Company, Inc. New York, New York.
Kennedy, G.J.A. and C.D. Strange. 1982. The distribution of salmonids in upland streams in relation to depth and gradient. J. Fish. Biol. 20:579~591
Kruger, K.M. 1985. Pere Marquette River angler survey and brown trout evaluation. M.S. thesis. Michigan State University, East Lansing, MI
Latta, w.c. 1974. A history of the introduction of fishes into Michigan. pp. 83-96 in Michigan Fisheries Centennial Rept. 1873-1973. Mich. Dept. Nat. Resour. Fish Manage. Rept. No. 6.
Mortensen, E. 1977. Denisty-dependnet mortality of trout fry (Salmo trutta) and its relationship to management of small streams. J. Fish. Biol. 11:613-617.

62
Nilsson, N.A. and T.G. Northcote. 1981. Rainbow trout (Salmo gairdneri) and cutthroat trout (Salmo clarki) interactions in coastal British Columbia lakes. Can, J. Fish. Aquat. Sci. 38: 1228-1246.
Nyman, O.L. 1970. Ecological interaction of brown trout and brook trout in a stream. Can. Field-Nat. 84: 343-350.
Orth, D.J. 1983. Aquatic habitat measurements. pp. 61-84 in Fisheries Techniques, Nielsen and Johnson, eds. Southern Printing Company, Inc., Virginia.
Ringler, N.H. 1979. Prey selection by drift-feeding brown trout (Salmo trutta). J. Fish. Res. Board Can. 36: 392-403.
Schoener, T.W. 1970. Non-synchronous spatial overlap of lizards in patchy habitats. Ecology 51: 408-418.
Scott, W.B. and E.J. Crossman. 1979. Freshwater fishes of Canada. Bulletin 184. Fish. Res. Board, Can. 966 pp.
Shirvell, c.s. and R.G. Dungey. 1983. Microhabitats chosen by brown trout for feeding and spawning in rivers. Trans. Amer. Fish. Soc. 112: 355-367.
Slaney, P.A. and T.G. Northcote. 1974. Effects of prey abundance on density and territorial behavior of young rainbow trout (Salmo gairdneri) in laboratory stream channels. J. Fish. Res. Board can. 31: 1201-1209.
Smedely, H.H. 1938. Trout of Michigan. Muskegon. 49 pp.
Smith, E.P. 1985. Estimating the reliability of diet overlap measures. In Environmental Biology of Fishes Vol. 13, No. 2, pp 125-138. Dr. w. Junk Publishers, Dordrecht.
Stauffer, T.M. 1977. Numbers of juvenile salmonids produced in five Lake Superior tributaries and the effect of juvenile coho salmon on their numbers, 1967-1974. Mich. Dept. Nat. Res. Fish. Res. Rept. No. 1846. 29 p.
Steel R.G.D. and J.H. Torrie. 1980. Principles and Procedures of Statistics: a Biometrical Approach. 633 p.

63
Taube, C.M. 1975. Abundance, growth, biomass, and interrelationship of trout and coho salmon in the Platte River. Mich. Dept. Nat. Res. Fish. Res. Rept. No. 1830. 82 p.
Tippets, W.E. and P.B. Moyle. 1978. Epibenthic feeding by rainbow trout (Salmo gairdneri) in the Mccloud River, California. J. Animal Ecol. 47: 5459-559.
Wagner, w.c. 1975. Food habits of coexisting juvenile coho salmon, brown trout, and rainbow trout in the Platte River, 1967 and 1972. Mich. Dept. Nat. Resour., Fish. Res. Rept. No. 1831. 14 p.
Ware, D.M. 1972. Predation by rainbow trout (Salmo gairdneri): the influence of hunger, prey density, and prey size. J. Fish. Res. Board Can. 29: 1193-1201.
Werner, E.E. and D.J. Hall. 1976. Niche shifts in sunfishes: experimental evidence and significnce. Science 191: 404-406.
Werner, E.E. and D.J. Hall. 1977. Competition and habitat shift in two sunfishes (Centrarchidae). Ecology 58:869-876.


![V. SPECIATION A. Allopatric Speciation B. Parapatric Speciation (aka Local or Progenitor - Derivative) C. Adaptive Radiation D. Sympatric Speciation [Polyploidy]](https://img.dokumen.tips/doc/110x75/56649d3f5503460f94a186e2/v-speciation-a-allopatric-speciation-b-parapatric-speciation-aka-local.jpg)