Embed Size (px)
Citation preview

STRATEGY UPDATE Adapting to changing market dynamics
Rodolphe Belmer, Chief Executive Officer
Monday 27th June 2016

Agenda
2
1
2
4
3
Adapting to changing market dynamics
Step 1 - GROW CASH FLOW:
Maximize free-cash-flow generation of core businesses
Revised outlook and financial objectives
Step 2 - GROW TOPLINE: Build on our core Video business to accelerate growth;
capture longer term potential in Connectivity

Changing dynamics in our core businesses
3
► Sustained growth in
emerging markets
• Robust channel growth
• Increasing HD penetration
• MENA and SSA leading
growth
• Prices well-oriented
► Broad stability in Europe
• Broadly stable channel
count
• HD and UHD ramp-up
• Improving encoding
and compression
VIDEO: MODEST DEMAND GROWTH
IN NEXT FIVE YEARS
DATA SERVICES:STRUCTURALLY
CHALLENGED
► Global demand driven
by increasing
connectivity needs
► Large HTS systems
adding to existing
overcapacity
► Ongoing severe
pricing pressure
► More stickiness
in certain segments
► US DoD demand
stabilizing, albeit
at lower prices
► Slower migration to HTS
than Data Services
► Opportunities in Europe,
Asia and MENA
and in non-military
GOVERNMENT SERVICES:
POCKETS OF OPPORTUNITY
Low single
digit growth
Low single
digit decline
Broad
stability

Longer-term potential in Video and Connectivity
4
► Satellite and IPTV set
to dominate global video distribution
in the longer term
► Opportunity to enhance satellite
value proposition by offering
IP-like viewer experience
► Outsourcing of services
by broadcasters will create
additional sources of demand
VIDEO FIXED AND MOBILE CONNECTIVITY
► Nascent markets
with huge potential
► Massive growth in bandwidth
usage per consumer
► Medium-term potential in Aero
► Long-term potential in land mobility
► VHTS and VVHTS satellites
are pre-requisites in terms
of volume and pricing
for mass-market adoption

Adapting strategy to new market conditions
5
GROW CASH-FLOW
STEP 1 STEP 2
GROW TOPLINE
2017-19 2019-2025+
Maximize
free-cash-flow generation
of existing businesses
Build on our core
video business
to accelerate growth
Capture longer
term potential
in Connectivity

Agenda
6
1
2
4
3
Adapting to changing market dynamics
Step 1 - GROW CASH FLOW:
Maximize free-cash-flow generation of core businesses
Revised outlook and financial objectives
Step 2 - GROW TOPLINE: Build on our core Video business to accelerate growth; capture
longer term potential in Connectivity

7
Step 1: maximize free-cash-flow generation
of core businesses
2.2
Financial and operational measures
Optimizing revenues in each core business
2.1
2

Capex reduction
8
► Implement ‘design to cost’ approach
► Ground capex under strict control
► Capture hosted payload opportunities
► Focus on partnership and “condosats”
► Capitalize on industry-wide efficiency
improvements
Average annual
cash Capex
for FY 17-19
€420m
► Commitment to current deployment plan including replacing satellites at EOL
► Selective in-orbit investments in growth opportunities

Committed capex represents 60% of cash capex outlook
9
Programme FY 16-17 FY 17-18 FY 18-19 TOTAL %
ETL 172 B $$$
ETL Quantum $$$ $$ $
ETL 7C $$$ $$$ $$
African Broadband Sat. $$ $$$
Financial leases and ECA $$$ $$$ $$$
SUB-TOTAL COMMITTED C. €750M 60%
Uncommitted Satellite 1 $$$ $$$ $$
Uncommitted Satellite 2 $$$ $$
Uncommitted Satellite 3 $$$ $$
On-Ground Capex $$$ $$$ $$$ C. €200M 15%
SUB-TOTAL UNCOMMITTED C. €510M 40%
Total Cash Capex C. €1,260M

Optimization of cost of debt
10
► June 2016: €500m bond issue
at 1.125% coupon
• Refinancing of €850m March 2017 Bond
(4.125% coupon)
• c.€30m p.a. reduction in interest costs
► Swap-lock ahead of 2019 €800m bond
(5.0% coupon)
• Locked at c. 145 bps, (-90 bps)
► ETL Communication term loan extended
for 12 months to 2021
Annual savings
of c.€50m from 2019,
(c.€30m from
March 2017)

Other measures
11
► OPEX under review
• Optimization of procurement
• SG&A savings
► Objective: maintain EBITDA margin
above 75%
PROTECTING EBITDA STRICT FOCUS ON WCR
► Reinforcing cash collection
procedures to reduce DSO
► Prepayments when possible
► Seeking partnerships for broadband
projects • ViaSat in Europe
• Inframed in Africa
► Divesting non-core assets • Alterna’TV in April 2016
• Other assets under consideration
► Organization realigned along
5 business lines • Core businesses: Video,
Data and Government Services
• Connectivity: Fixed Broadband
and Mobile Connectivity
► Metrics for key personnel aligned with
cash-flow generation
OPTIMIZING THE ASSET PORTFOLIO STREAMLING THE ORGANIZATION
12
Step 1: maximize free-cash-flow generation
of core businesses to optimize shareholder returns
2.2
Financial and operational measures
Optimizing revenues in each core business
2.1
2

Optimizing revenues in each core business
13 The share of each application as a percentage of total revenues is calculated excluding “Other revenues” and “Non-recurring
revenues”
Video
Data Services
Government Services
63%
16%
14%

Enhancing the commercial model
14
► Increase direct customer access
by integrating distribution
• Starting with the HOTBIRD position
► Stimulate HD and UHD take-up
► Develop segmented pricing
strategy to extract more value
from key hotspots
MATURE MARKETS EMERGING MARKETS
► Reap benefits of recent
investments
• EUTELSAT 8 WB in MENA
• EUTELSAT 36C in SSA
► Invest selectively to capture growth
• EUTELSAT 7C to add capacity in SSA
► Favour pricing flexibility
over contract length

Sound fundamentals at HOTBIRD
15 1per 36 Mhz equivalent transponder
Channel
count
LIMITED DECLINE IN CHANNEL COUNT HD PENETRATION: 20%
1,080 1,074 1,036
May 2014 May 2015 May 2016
167 172 198
May 2014 May 2015 May 2016
379
468
May 2014 May 2015 May 2016
N/A
3.8 3.9 3.9
FY 2013-14 FY 2014-15 March 16 YTD
MPEG4 PENETRATION: 45% STABLE PRICING
MPEG 4
channels
HD
channels
Average price
per TPE1
(€m / year)
Less than half in simulcast

HOTBIRD: Extend control over network
by taking back empty capacity from distributors
16
C30% OF HB TRANSPONDERS
LEASED TO DISTRIBUTORS
SOME HAVE UNSOLD CAPACITY
ON THEIR HANDS
► Equivalent to
4/5 transponders
► Potential pricing
disruption on the
market
► Limits scope
to promote
HD ramp-up for
their end-customers
TWO DRAWBACKS
► Selling predominantly
to FTA channels
with low (c.5%)
HD penetration
We have opted to manage this situation
by offering early termination of certain contracts in order to:
► Preserving the premium value of the HB hotspot
► Stimulate HD and UHD take-up
► Ability to streamline distribution by using fewer and more specialized distributors

HOTBIRD Action Plan
17
► Enhance distribution model
• Extend control over network by taking back empty capacity from distributors
• Increase share of direct sales, especially to Free-to-Air channels
• Develop segmented pricing strategy
► Improve value proposition
• Stimulate transition to HD and ultra-HD:
o Objective of circa 50% HD penetration in 5 years
o > 20 UHD channels expected in 5 years
• Attract premium channels in different language pools
• Develop services (Smart LNB, IP Multiscreen)
► Address new geographies
FY 2019
Stable revenues at HOTBIRD

Emerging markets
18 Source: Eutelsat analysis – 2015-2020 CAGR for Latam + MENA + SSA + SEA
► CAGR in demand within Eutelsat
footprint1 at c.4% over next 5 years
► Ability to raise prices
by leveraging Hotspot value
► Favoring pricing flexibility
over contract length
EXAMPLE: SUB SAHARAN AFRICA DYNAMICS
► 2015-20 market drivers:
• 6% CAGR in channel count
• HD penetration from 5% to 11%
► Selective investment at key hotspots:
• 36° East: carry-forward effect
of capacity sold to MCA on ETL 36C
• 7° East: EUTELSAT 7C in 2019
to increase resources in SSA
• 16° East: additional capacity under
consideration
1 36 Mhz equivalent transponders
EXAMPLE Anchor MENA Customer renewing
5-TPE1 Video contract in 2014
with c.30% average price increase

Optimizing revenues in each core business
19 The share of each application as a percentage of total revenues is calculated excluding “Other revenues” and “Non-recurring
revenues”
Video
Data Services
Government Services
63%
16%
14%

Data Services: significant pressure on pricing
20 1Based on Fixed Data estimated revenues for FY 16, representing c.85% of total Data Services revenues
BREAKDOWN OF EUTELSAT FIXED DATA REVENUES1
BY VERTICAL
BY GEOGRAPHY
Backhaul, Trunking
Corporate netwoks
64% 36%
20%
17%
19%
36%
7% 1%
SSA
Europe
MENA
Americas
APAC
Other
► Historic price pressure
due to overcapacity in certain
geographies
► Compounded by arrival
of significant additional capacity
in the form of HTS systems
► All data applications
potentially affected
• Corporate Networks more sticky
than point-to-point
Prices expected to decline
by up to 50% in 5 years

Impact of lower pricing mitigated by higher volumes
and resistance measures
21
► Decline in Data revenues contained
to c. 3% cagr in 5 years (15-20% decline)
► Offset by growing revenues in other
applications
► Data to shrink to 10% of total revenues
medium-term
Resist:
► High share of revenues already
in the Backlog
• >60% of FY 17 revs and >40% of FY 18
► Focus on less price-sensitive customers,
untapped verticals and differentiated offer
Compensate with higher volume:
► Favouring fill rate over price
► Significant available capacity
No further investments in regular data capacity
Today Price
impact
Volume and
yield impact
Medium
term
EVOLUTION OF EUTELSAT DATA* REVENUES
AS % OF TOTAL REVENUES
-15%

Americas focus
22
► Significant new available capacity
(ETL 115 WB, ETL 65 WA, ETL 117WB)
• Favour fill-rate and contract length over pricing
► Focus on markets with lower competitive intensity
• North America
• Alaska
• Mexico
► Focus commercial effort
on less price-sensitive customers
• Complex ground networks
• Untapped verticals: Infrastructure, Agriculture, IOT
• PPP opportunities
► Grow contribution from Video Applications
• Still some new DTH platforms opportunities
• Grow existing business (Tigo Star, Star TV)
Slight growth in FY 2016-19

Optimizing revenues in each core business
23 The share of each application as a percentage of total revenues is calculated excluding “Other revenues” and “Non-recurring
revenues”
Video
Data Services
Government Services
63%
16%
14%

Adjusting strategy in Government Services
24
► US DoD demand stabilizing
at lower pricing levels
► Latest 5-year task order cycle
completed in Fall 2016
► Enhance our distribution model
• Develop new sub-segments
of customers
• Develop differentiated value proposition,
with a focus on Quantum
US GOVERNMENT BOTTOMING OUT ALTERNATIVE GROWTH OPPORTUNITIES
► In other geographies
• Europe
• Middle East North Africa
• Asia-Pacific
► In non-military
• Programs aiming at reducing
the digital divide: schools,
administrations
• PPP opportunities

Opportunity in Non-US Governments
25 Based on an estimate of $1.77bn for total World military spending
Source: SIPRI, Eutelsat analysis
► Priority areas
(Europe, MENA, APAC)
represent c70% of non-US
military spending
► Key non-US COMSATCOM markets
to grow at mid-single digit CAGR
to 2019
► Eutelsat competitive advantages
• ‘Best in-class’ operator
• Flexibility (Quantum)
and coverage (global fleet)
• Long-term relationships
with key distributors
BREAKDOWN OF MILITARY SPENDING
BY REGION IN 2014
34%
17% 12%
13%
5%
12%
7%
USA Europe
MENA Other APAC
Russia China
Others

Agenda
26
1
2
4
3
Adapting to changing market dynamics
Step 1 - GROW CASH FLOW:
Maximize free-cash-flow generation of core businesses
Revised outlook and financial objectives
Step 2 - GROW TOPLINE: Build on our core Video business to accelerate growth; capture
longer term potential in Connectivity

Build on our core Video business to accelerate growth;
capture longer term potential in Connectivity
27
► Optimize existing assets
within a limited current
addressable market
► Progress on prerequisites
for scalability
► Decide on scale and
location of investments
from 2018/19
► Use existing assets
to anchor foothold
in the market
► Selectively invest
in capacity to improve
coverage
► Pave the way
for Mass market
► Growth potential of Video
► Opportunity for further
value creation
► Harnessing technology
VIDEO FIXED
BROADBAND
MOBILE
CONNECTIVITY
MEDIUM TERM (FROM FY 2019)
LONG TERM (FROM FY 2021)
Build on our core business
to accelerate growth
Prepare
for scalability
From niche
to mass market

Video: Build on our core business to accelerate growth
28
► Video via satellite
will continue to grow
► Distribution will be split
between satellite and
IPTV longer term
► Outsourcing of services
by broadcasters
will create additional
sources of demand
GROWTH POTENTIAL OF VIDEO OPPORTUNITY FOR FURTHER
VALUE CREATION
► Greater integration
within the
IP ecosystem
► Enhance viewer
experience
► Add new services
for broadcasters,
advertisers
and consumers
► Develop connected
terminals
► Improve efficiency • Compression
• Encription
• Security
► Increase revenue • Metadata management
• Targeted advertising
• Payment
► Enhance loyalty • Multiscreen
• Smart EPG
• TV everywhere
HARNESSING EXISTING
TECHNOLOGY
Enhance end-viewer experience to reinforce customer loyalty
and generate additional revenue opportunities

Fixed Broadband: preparing for mass market adoption
29
BRIDGE DIGITAL DIVIDE
IN-MARKET PROPOSITION INDUSTRIAL TRANSLATION TIMING
Use the time to VHTS to prepare for mass market: optimize existing or committed assets
(KA-SAT, Russian and African Broaband) and validate go-to-market models
► Deliver fiber-like capacity
(30 Mbps)
► Reach fiber-like pricing
(€40 / month)
► Lower barrers to adoption
► Assess adressable
market
► Develop appropriate
distribution
► VHTS satellites
€1m / Gbps
► Terminals < $200
► Refine assessment
of fiber deployment
► Test and validate
business models
► 2020-21
► C.2019
► 2018 onwards
► 2016/18

Mobile Connectivity: market foothold with existing assets
30
BRING FIBER-LIKE CONNECTIVITY IN MOBILITY
IN-MARKET PROPOSITION INDUSTRIAL TRANSLATION TIMING
Pave the way by leveraging our existing assets in Aero (172° East, 10° East, 117° East, KA-SAT),
selectively invest to improve coverage, and seek partnership deals with stakeholders for each vertical
► Deliver streaming-like
experience for IFEC
► 1 Mbps / passenger
for 50% of passengers
► Deliver on-the-move
fiber-like Connectivity
for ground transportation
► VHTS satellites
1 Terabyte satellite
► VVHTS
► Flat terminals
► 2020-21
► 2025-2035+

Agenda
31
1
2
4
3
Adapting to changing market dynamics
Step 1 - GROW CASH FLOW:
Maximize free-cash-flow generation of core businesses
Revised outlook and financial objectives
Step 2 - GROW TOPLINE: Build on our core Video business to accelerate growth; capture
longer term potential in Connectivity
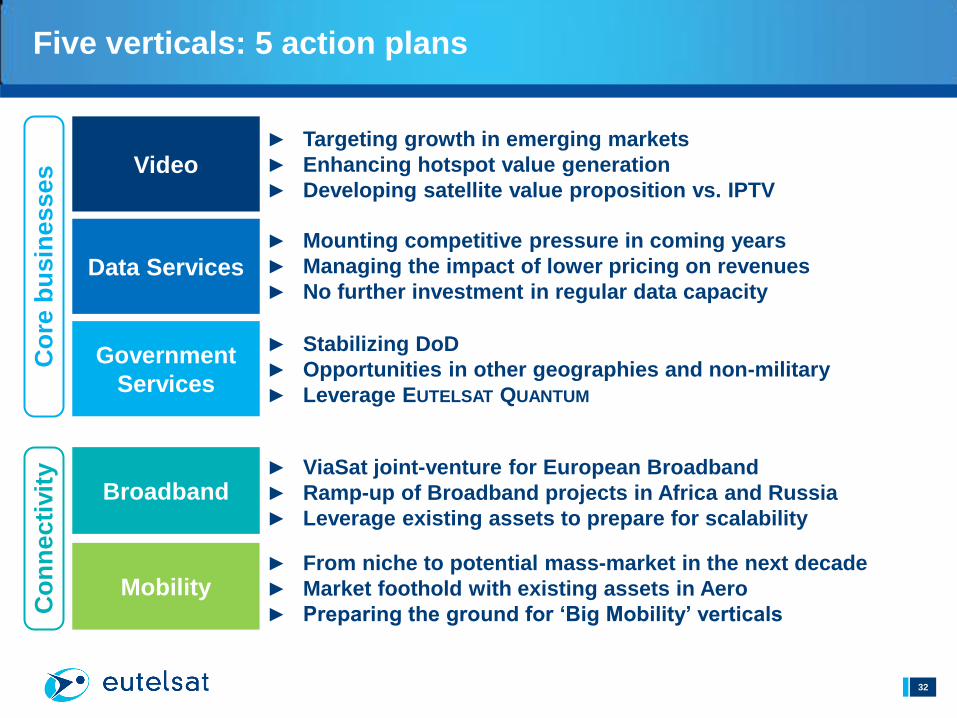
Five verticals: 5 action plans
32
► Targeting growth in emerging markets
► Enhancing hotspot value generation
► Developing satellite value proposition vs. IPTV
Co
re b
usin
esse
s
Data Services
Broadband
Mobility
Government
Services
Video
► Mounting competitive pressure in coming years
► Managing the impact of lower pricing on revenues
► No further investment in regular data capacity
► Stabilizing DoD
► Opportunities in other geographies and non-military
► Leverage EUTELSAT QUANTUM
► ViaSat joint-venture for European Broadband
► Ramp-up of Broadband projects in Africa and Russia
► Leverage existing assets to prepare for scalability
► From niche to potential mass-market in the next decade
► Market foothold with existing assets in Aero
► Preparing the ground for ‘Big Mobility’ verticals Co
nn
ecti
vit
y

Financial outlook
33
1 Inc. cash outflows related to ECA loan repayments and capital lease payments
2 Net cash-flow from operating activities less Cash Capex less Interest and Other fees paid net of interest received.
Three year CAGR calculated on the period FY 2015-16 to FY 2018-19.
REVENUES (At constant currency, and perimeter
excl. non recurring revenues)
EBITDA MARGIN
CAPEX
LEVERAGE
► FY 2015-16: Broadly flat
► FY 2016-17: Between -3% and -1%
► FY 2017-18: Broadly stable
► FY 2018-19: Slight growth
► FY 2015-16: Around 76%
► FY 2016-17 to FY 2018-19: above 75%
► FY 2016-17 to FY 2018-19:
Average of €420m1 per year’
► Investment grade rating
► Target net debt / EBITDA: below 3.3x
DISTRIBUTION ► From FY 2015-16: Stable to progressing dividend
FREE CASH FLOW ► FY 2015-16 to FY 2018-19:
Discretionary free cash flow2 CAGR >10%

To Sum Up:
34
Stabilization of revenues in FY18, with return to growth in FY19
EBITDA margin maintained above 75%
Steadily growing cash flow thanks to Capex reduction,
Opex containment and balance sheet optimization
…to fund ongoing deleveraging in line with commitment to Investment
Grade rating and targeted investments in future growth…
…and deliver stable to progressing dividend

QUESTIONS & ANSWERS

Disclaimer
This presentation does not constitute or form part of and should not be construed as any offer for sale of or
solicitation of any offer to buy any securities of Eutelsat Communications, nor should it, or any part of it, form the
basis of or be relied on in connection with any contract or commitment whatsoever concerning Eutelsat
Communications’ assets, activities or shares.
All statements other than historical facts included in this presentation, including without limitations, those regarding
Eutelsat Communications’ position, business strategy, plans and objectives are forward-looking statements.
The forward-looking statements included herein are for illustrative purposes only and are based on management’s
current views and assumptions. Such forward-looking statements involve known and unknown risks. For illustrative
purposes only, such risks include but are not limited to: postponement of any ground or in-orbit investments and
launches including but not limited to delays of future launches of satellites; impact of financial crisis on customers
and suppliers; trends in Fixed Satellite Services markets; development of Digital Terrestrial Television and High
Definition television; development of satellite broadband services; Eutelsat Communications’ ability to develop and
market value-added services and meet market demand; the effects of competing technologies developed and
expected intense competition generally in its main markets; profitability of its expansion strategy; partial or total loss
of a satellite at launch or in-orbit; supply conditions of satellites and launch systems; satellite or third-party launch
failures affecting launch schedules of future satellites; litigation; ability to establish and maintain strategic
relationships in its major businesses; and the effect of future acquisitions and investments.
Eutelsat Communications expressly disclaims any obligation or undertaking to update or revise any projections,
forecasts or estimates contained in this presentation to reflect any change in events, conditions, assumptions or
circumstances on which any such statements are based, unless so required by applicable law. These materials are
supplied to you solely for your information and may not be copied or distributed to any other person (whether in or
outside your organization) or published, in whole or in part, for any purpose.
36