Embed Size (px)
Citation preview

STRATEGY IMPLEMENTATION, CAPITAL
STRUCTURE, MACRO ENVIRONMENT AND
PERFORMANCE OF ENERGY SECTOR
INSTITUTIONS IN KENYA
ODHIAMBO JOHN MUDANY
A THESIS SUBMITTED TO THE SCHOOL OF
MANAGEMENT AND LEADERSHIP IN PARTIAL
FULFILMENT OF THE REQUIREMENTS FOR THE AWARD
OF THE DEGREE OF DOCTOR OF PHILOSOPHY IN
MANAGEMENT AND LEADERSHIP OF THE
MANAGEMENT UNIVERSITY OF AFRICA
NOVEMBER 2020

ii
DECLARATION
I declare that this thesis is my original work and has not been previously in its
entirely or in part been presented for a degree or other academic work.
John Mudany Odhiambo
DML/3/00038/1/2016
Signature………………...…………… Date …………………………….……….
This thesis has been submitted for examination with our approval as university
supervisors.
Dr. Nicholas Kibiwott Letting PhD
Chief Executive Officer
Kenya Accountants and Secretaries National Examinations Board
Signature………………...…………… Date …………………………….……….
Prof. Gituro Wainaina PhD
Department of Management Science
School of Business, University of Nairobi
Signature………………...…………… Date …………………………….……….

iii
DEDICATION
I lovingly dedicate this study thesis to my wife, Dr. Mildred Mudany, as a show of
immense gratitude for her relentless unconditional love and support over the years.
Much affection also goes to my lovely children Nick (deceased), Marion, Lorraine
and Gloria.

iv
ACKNOWLEDGEMENTS
My heart most gratitude to the Almighty God for his grace, provisions and blessings
which made it possible for me to take and complete this thesis. I also wish to express
my deep appreciation to all those who supported me and contributed to the
successful completion of this thesis. Foremost, I wish to take this singular
opportunity to thank my supervisors, Dr. Nicholas K. Letting, Prof. Gituro
Wainaina and the Management University of Africa fraternity for the guidance and
tremendous scholarly contribution and wealth of knowledge that helped shape this
thesis.
This work would not have been possible without the support of my family. I am
deeply indebted to my beloved wife Dr. Mildred Anyango Mudany for support and
scholarly advice. I also wish to acknowledge the contribution of my children Nick,
Marion, Loraine and Gloria for their encouragement, understanding, sacrifice and
support during the long hours. I am grateful to my daughter Marion who supported
with some of the typing and presentations. You have been a gem. I also want to
acknowledge Grace Kariuki my personal assistant who supported with the typing
and logistics when required.
I am also grateful to my parents, the late Jaduong Peter Odhiambo Juma and Mama
Roselida Waudi Nyar Wagwau Akedi who invested in my education and sacrificed
immensely to help me reach this level. Finally, I am also indebted to my brothers,
sisters, colleague’s, classmates and many friends who encouraged me and gave all
the support I needed.

v
TABLE OF CONTENTS
DECLARATION................................................................................................... ii DEDICATION...................................................................................................... iii ACKNOWLEDGEMENTS ................................................................................ iv
LIST OF TABLES ............................................................................................. viii LIST OF FIGURES ............................................................................................. ix OPERATIONAL DEFINITION OF TERMS .....................................................x ACRONYMS AND ABBREVIATIONS ............................................................ xi ABSTRACT ......................................................................................................... xii
CHAPTER ONE: INTRODUCTION ..................................................................1 1.1 Background of the Study .............................................................................1
1.1.1 Strategy Implementation ........................................................................ 2
1.1.2 Capital Structure ..................................................................................... 3
1.1.3 Macro Environment ................................................................................ 4
1.1.4 Organizational Performance ................................................................... 4
1.1.5 Energy Sector Institutions in Kenya ....................................................... 5
1.2 Statement of the Problem .............................................................................6
1.3 Objectives of the Study ................................................................................8
1.4 Justification of the Study .............................................................................9
1.5 Scope of the Study .....................................................................................11
1.6 Limitation of the Study ..............................................................................11
1.7 Delimitation of the Study ...........................................................................12
CHAPTER TWO: LITERATURE REVIEW ...................................................13 2.1 Introduction ................................................................................................13
2.2 Theoretical Review ....................................................................................13
2.3 Empirical Review.......................................................................................18
2.4 Research and Knowledge Gaps .................................................................62
2.5 Operationalization of the Study Variables .................................................65
2.6 Hypotheses of the Study ............................................................................66
2.7 Conceptual Framework ..............................................................................66
2.8 Summary ....................................................................................................67
CHAPTER THREE: RESEARCH METHODOLOGY ..................................68
3.1 Introduction ................................................................................................68
3.2 Research Philosophy ..................................................................................68

vi
3.3 Research Design.........................................................................................69
3.4 Population of the Study ..............................................................................71
3.5 Data Collection and Instruments ................................................................72
3.6 Data Collection Procedure .........................................................................74
3.7 Pilot Study ..................................................................................................76
3.8 Data Processing and Analysis ....................................................................80
3.9 Diagnostic Tests .........................................................................................81
3.10 Hypotheses Testing ....................................................................................85
3.11 Analytical Models ......................................................................................88
3.12 Ethical Considerations ...............................................................................89
3.13 Chapter Summary ......................................................................................90
CHAPTER FOUR: FINDINGS AND DATA ANALYSIS ..............................91 4.1 Introduction ................................................................................................91
4.2 Response Rate ............................................................................................91
4.3 Reliability and Validity Tests ....................................................................92
4.4 Factor Analysis ..........................................................................................95
4.5 Tests for Normality, Multicollinearity, Homoscedasticity and Linearity ..96
4.6 Employee Demographic Profile ...............................................................105
4.7 Institutional Demographic Profile............................................................107
4.8 Effects of Strategy Implementation on Performance of Energy Sector
Institutions in Kenya ..............................................................................109
4.9 Intervening Effect of Capital Structure on the Relationship Between
Strategy Implementation and Performance of Energy Sector Institutions in
Kenya ......................................................................................................120
4.10 Moderating Effect of Macro Environment on the Relationship Between
Strategy Implementation and Performance of Energy Sector Institutions in
Kenya ......................................................................................................130
4.11 Moderating Effect of Macro Environment on the Intervening Effect of
Capital Structure and Performance of Energy Sector Institutions in Kenya
................................................................................................................140
CHAPTER FIVE: DISCUSSION OF THE FINDINGS ................................143 5.1 Introduction ..............................................................................................143
5.2 Strategy Implementation and Performance ..............................................143
5.3 Strategy Implementation, Capital Structure and Performance ................149

vii
5.4 Strategy Implementation, Macro Environment and Performance ...........152
5.5 Moderating Effect of Macro Environment on the Intervening Effect of
Capital Structure .....................................................................................157
CHAPTER SIX: SUMMARY AND CONCLUSION .....................................163
6.1 Introduction ..............................................................................................163
6.2 Summary of Findings ...............................................................................163
6.3 Conclusion ...............................................................................................164
CHAPTER SEVEN: RECOMMENDATIONS ..............................................169 7.1 Introduction ..............................................................................................169
7.2 Implications of the Study .........................................................................169
7.3 Limitation of the Study ............................................................................172
7.4 Suggestions for Further Research ............................................................173
REFERENCES ...................................................................................................175 APPENDICES ....................................................................................................208
Appendix I: Letter of Introduction ...................................................................208 Appendix II: Questionnaires..............................................................................209
Appendix III: Research Permit ...........................................................................215 Appendix IV: Medium Term Plan I Installed Power Generation Capacity
for Kenya .....................................................................................216
Appendix V: Organogram of the Kenya’s Energy Sector .................................217 Appendix VI: Krejcie and Morgan Table ...........................................................218
Appendix VII: Electric Power Generation Licenses and Permits .......................219

viii
LIST OF TABLES
Table 2.1: Summary of Research Gaps ................................................................ 63
Table 2.2: Measurement of Study Variables ........................................................ 65
Table 3.3: Population Distribution ....................................................................... 72
Table 3.4: Objectives, Hypothesis Testing, Analysis and Model Estimation ...... 88
Table 4.5: Response Rate of Study Population .................................................... 92
Table 4.6: Response Rate ..................................................................................... 92
Table 4.7: Cronbach’s Alpha Reliability Coefficients ......................................... 94
Table 4.8: Summary of Kaiser-Meyer-Olkin and Bartlett’s Test ........................ 95
Table 4.9: Shapiro-Wilk Test of Normality ......................................................... 97
Table 4.10: Test for Multicollinearity ................................................................ 102
Table 4.11: Test of Homogeneity of Variances ................................................. 103
Table 4.12: Respondents’ Demographic Profiles .............................................. 106
Table 4.13: Institutional Demographic Profile .................................................. 107
Table 4.14: Strategy Implementation Dimensions ............................................. 109
Table 4.15: Regression Test of the Effect of Strategy Implementation ............. 116
Table 4.16: Performance Attributes ................................................................... 117
Table 4.17: Capital Structure Dimensions ......................................................... 120
Table 4.18: Regression Test of the Effect of Strategy Implementation ............. 125
Table 4.19: Regression Test of the Intervening influence of Capital Structure . 126
Table 4.20: Regression Test of the Effect of Capital Structure on Performance 127
Table 4.21: Regression Test of the Intervening Effect of Capital Structure ...... 128
Table 4.22: Macro Environment Dimensions .................................................... 131
Table 4.23: Regression Test of the Moderation Effect of Macro Environment 138
Table 4.24: Moderated Mediation of Capital Structure ..................................... 140
Table 4.25: Summary of the Objectives, Hypotheses, Analytical Models ........ 160

ix
LIST OF FIGURES
Figure 2.1: Conceptual Model ............................................................................. 67
Figure 4.2: Normal Quantile-Quantile Plot of Data on Strategy Implementation 98
Figure 4.3: Normal Quantile-Quantile Plot of Data on Macro Environment ...... 99
Figure 4.4: Normal Quantile-Quantile Plot of Data on Capital Structure ......... 100
Figure 4.5: Normal Quantile-Quantile Plot of Data on Performance ................ 101
Figure 4.6: Test for Linearity for Strategy Implementation .............................. 104
Figure 4.7: Test for Linearity for Macro Environment ...................................... 104
Figure 4.8: Test for Linearity for Capital Structure ........................................... 105

x
OPERATIONAL DEFINITION OF TERMS
Capital structure: is the way Energy sector institutions finances their
business through the combination of equity, debt or
hybrid securities
Installed capacity: termed peak installed capacity or rated capacity,
describes the maximum capacity that a system is
designed to run at
Macro Environment: aggregate of factors external to Energy sector
institutions that influence and impact its operation of
performance. These include; economic, sociocultural,
political, legal, technical, and ecological
considerations
Medium Term Plans: five-year horizon plans through which Kenya Vision
2030 is to be implemented, with the first plan covering
the period 2008 to 2012, second plan covering 2013 to
2017 and third plan from 2018 to 2022
Organizational Performance: actual output or results of Energy sector institutions as
measured against its intended outputs.
Strategy Implementation: process that converts plans to action thus ensuring
projects are delivered in a way that meets the strategic
plan’s stated objectives
Sustainable energy: energy that is consumed at insignificant rates
compared to its supply and with manageable collateral
effects, especially environmental effects
Transmission: operation, management or control of facilities,
consisting of high voltage electric supply lines for
movement of electrical energy in bulk between
generating plants and transmission substations for the
purposes of enabling supply to customers

xi
ACRONYMS AND ABBREVIATIONS
CEEC Centre for Energy Efficiency and Conservation
ERC Energy Regulatory Commission
GDC Geothermal Development Company
GoK Government of Kenya
GW Gigawatt
GWh Gigawatt hour
HVDC High Voltage Direct Current
IPPs Independent Power Producers
KAM Kenya Association of Manufacturers
KenGen Kenya Electricity Generating Company Limited
KETRACO Kenya Electricity Transmission Company
KNBS Kenya National Bureau of Statistics
KP Kenya Power
KPLC Kenya Power and Lighting Company Limited
KWh Kilowatt hour
LCPDP Least Cost Power Development Plan
LTD Long-Term Debt
MTP Medium Term Plan
MW Megawatt
PPPs Public-Private Partnerships
REA Rural Electrification Authority
REN21 Renewable Energy Policy Network for the 21st Century
SDGs Sustainable Development Goals
STD Short-Term Debt
UN United Nations

xii
ABSTRACT Strategy implementation has direct influence on corporate performance of organizations.
An indicator of successful strategy implementation is whether actual organization
performance matches or exceeds the targets spelled out in the strategic plan. Poor
performance can be attributed to weak strategy, weak implementation or both. The main
objective of the study was to establish the influence of capital structure and macro
environment on the relationship between strategy implementation and performance of
energy sector institutions in Kenya. The specific objectives were to: Establish the effects
of strategy implementation on performance of energy sector institutions in Kenya;
Determine the intervening effect of capital structure on the relationship between strategy
implementation and performance of energy sector institutions in Kenya; Determine the
moderating effect of macro environment on the relationship between strategy
implementation and performance of energy sector institutions in Kenya; and Determine
moderating effect of macro environment on the intervening effect of capital structure and
performance of energy sector institutions in Kenya. The study was anchored on the
institutional theory, open systems theory, pecking order theory and resource-based view
theory. This study employed a cross-sectional survey design. The study population
consisted of 68 institutions under the energy sector. These 68 institutions formed the target
population for the study. The study used primary data sources, which was collected through
structured questionnaire. Validity was tested through content validity. Cronbach’s alpha
coefficient was used to test the reliability of the measurement scales. The study used ‘split-
halves’ and ‘internal consistency’ method to measure reliability of the research tools. The
findings showed that there was a significant relationship between strategy implementation
and performance. The introduction of either capital structure as a mediator or macro
environment as a moderator was equally found to have a statistically significant influence
on the relationship between strategy implementation and organizational performance. The
study established that there was a statistically significant moderating effect of macro
environment on the intervening effect of capital structure. The study also showed
significant moderating effect of macro environment on the relationship between strategy
implementation and performance. From the findings of this study, it was concluded that
the attributes of strategy implementation had a great influence on performance. The study
further concluded that the indicators of capital structure had significant effect on the
relationship between strategy implementation and performance and that appropriate capital
structure is a critical decision for any business organization. The study further concluded
that macro environment had significant impact on the relationship between strategy
implementation and performance. The study recommended that firms should exhaust their
internal cash flows in order to cut on the financing cost and must constantly interact with
the ever-changing macro environment. The study also recommended that employees
should be enlightened on the strategies that the organization aim to adopt to eradicate the
possibility of opposition to its implementation and other challenges faced in the process of
changes. The study further recommended that studies could be done on other sectors other
than energy and compare the similarities and differences that will be established in these
sectors. The main limitation was that the study only considered primary data which is prone
to system error and manipulations. Future studies could consider employing both primary
and secondary data.

1
CHAPTER ONE: INTRODUCTION
This chapter seeks to cover the linkage between capital structure, macro environment,
strategy implementation and performance of Energy sector institutions in Kenya. The study
evaluates the performance of Kenya’s energy sector institutions based on goals in the
Kenya Government (GoK) least cost power development plan 2013 to 2033. This chapter
discussed conceptual issues from global, regional and local Kenyan perspective focusing
on how strategy implementation, capital structure, and macro environment affect
performance of Energy sector institutions.
1.1 Background of the Study
Strategy implementation is the process of bringing plans into practice, including the
preparation and execution of services, the improvement of operational quality and
effectiveness, and the creation of organizational structures, assessment processes and
cultures needed to adapt to the new strategy (Hill, Jones & Schilling, 2014). The obstacles
and barriers faced in implementing strategies and the attributes of successful
implementation of the strategy have been extensively reviewed (Elbanna et al., 2015). In
the face of the growing complexity and dynamic economic and political circumstances that
characterize the world today, the idea of policy implementation has put into play the
concept of strategically adopting policies to improve capability and performance levels in
the government (Ferlie & Ongaro, 2015). Strategy involves matching the resources
available, skills of the organization, the risks involved, and the environmental opportunities
with the goals and purposes of the organization (Thompson, 2013)
Strategy implementation ensures that projects are delivered in a way that meets the strategic
plan’s stated objectives (Kotler & Keller, 2012), whereas functional strategies direct on
how implementation needs to be done and operational strategies combine all the functions
of the organizations. When a strategy does not deliver means that it was not well executed
because successes of organizations depend on strategy implementation (Lefort, McMurray
& Tesvic, 2015). The effect of strategy implementation on performance can be intervened
by variables such as capital structure and moderated by macro environment which act as

2
catalysts (Kengatharan & Lingesiya, 2014). The relationship between strategy
implementation and organization performance is anchored on institutional theory
(DiMaggio & Powell, 1991). This theory focuses on establishment of leadership, culture,
structure, strategic plan, responsibility and accountability as the indicators of strategy
implementation.
Capital structure is anchored on pecking order theory (Myers & Majluf, 1984), which
postulates that the level of debt, the gearing-ratio, does not influence the value of the firm
and hence performance because investors can create and remove leverage by accessing the
same financial markets. Macro environment is anchored on open systems theory (Burnes,
2000). Open systems theory avers that organizations are strongly influenced by their
environment for change and survival. This theory explains how strategy helps an
organization to achieve sustainable competitive advantage (Machuki & Aosa, 2011). In
this study, open system theory explained how strategy implementation fits into the macro
environment in which it is operating to achieve better performance. Performance was
anchored on resource-based view theory which posits that for an organization to have
competitive advantage over its competitors, it needs to prioritize the acquisition of unique
resources and capabilities (Barney, 2002).
1.1.1 Strategy Implementation
Strategy implementation refers to activities through which an organization defines action
it will undertake to navigate and compete (Murgor, 2014). It converts the plans to meet the
set objectives and deliverables (Odundo, 2012). Strategy implementation has been
established through extensive research that it affects performance of organizations.
Strategy implementation, which is anchored on institutional theory, focuses on what, who,
when, where and how to achieve desired goals and objectives (Njoroge et al., 2015).
Success of any organization depends on how strategy employed is implemented (Lefort,
McMurray & Tesvic, 2015).
The indicators used to measure strategy implementation include; strategic planning,
management, action plans, processes, systems, and timelines, among others. Over the

3
years, MoE has rolled out several strategic plans to achieve its energy goals and the most
ambitious of them being its long term 20-year rolling Least Cost Power Development Plan
(LCPDP). While the sub-sector has made some meaningful gains in the recent past, it still
has to pursue greater, more focused strategy implementation action in order to achieve its
mission and reduce the cost of power. The indicators that were used by the current study
to measure strategy implementation include; leadership, structure, culture, strategic plan,
responsibility and accountability.
1.1.2 Capital Structure
Capital structure is the combination of debt and equity used to finance firm’s assets,
operations and growth. A firm can be financed by the shareholders or debt holders or hybrid
(Umar, Tanveer, Aslam & Sajid, 2012). The capital structure is also a framework which
depicts how equity and debt are employed for financing the firm’s operations to yield
optimum returns for the stakeholders to maximise firms returns given a level of risk (Dada
& Ghazali, 2016). Capital structure involves different sources of long-term capital through
which an enterprise finances its assets (Kirmi, 2017). Capital structure influences both
shareholders’ return and the ability of a firm to survive economic depression (Joshua,
2017). Mohammad and Jaafer (2012) states that firms can use either equity or debt to
finance their assets. But where the interest was tax deductible, firms would maximize the
value accruable by using more debt.
Source of capital refer to the place or platform where financial resources can be acquired.
A firm can source for fund; either internally or externally or both, which constitute the
firm’s structure of capital (Zunckel & Nyide, 2019). Structure of capital refers to the blend
of firm’s financial liability (Uremadu & Onyekachi, 2019). It could be seen as the debt and
equity mixture that the firm has employed to finance business operation (Aziz & Abbas,
2019). Structure of capital is the sum of debt and equity quantum or preference shares,
common stock and other debt obligations. The problem of capital structure, therefore,
arises from determining the quantum of each source of finance that will yield optimum
return with little risks (Akintoye, 2016; Dada & Ghazali, 2016).

4
1.1.3 Macro Environment
The macro-environment, also referred to as the remote environment, comprises of factors
that originate beyond and usually irrespective of any firms operating situation (Hitt,
Ireland, & Hoskinson, 2011). They include political, economic, social, technological,
ecological and legal factors (Pearce et al., 2012). Organization theorists emphasize that
organizations must adapt to their environments if they have to remain viable (Ogollah et
al., 2011). This environment presents firms with opportunities, threats and constraints but
rarely does a single firm exert any meaningful reciprocal influence. However, choice of
strategy alone cannot guarantee performance without considering the role of macro
environment in that relationship.
The decisions of the managers of the Institutions are affected by the macro environment
factors. These factors include political, economic, social, regulatory and policy-related
issues that do not prioritize power generation; high fuel cost levies owing to volatile oil
prices; weather conditions and over-reliance on hydro power; high investment; risk of
failure; foreign exchange volatility; community demands; land availability constraints;
wayleave restrictions; electricity theft; vandalism of electric power infrastructure; and
deficiency of needed skills and knowledge. The environment is important and energy sector
institutions have to respond to its dynamism, heterogeneity, instability and uncertainty. To
be successful overtime, energy sector institutions must be in tune with its macro
environment and respond to challenges posted by such actions.
1.1.4 Organizational Performance
Performance is important to all organizations including public corporations, private
companies, government ministries and even nonprofit organizations (Mkalama, 2014).
Researchers, scholars and practitioners have researched to understand why some
organizations achieve higher level of performance compared to others (Ogollah, Bolo &
Ogutu, 2011) with the result that “no one single variable can effectively affect an

5
organization’s performance” (Ogollah et al., 2011). Organizations are in business or
undertake various ventures in order to achieve certain purposes, intentions and goals and
those organizations must succeed. Performance is, therefore, crucial for any organization
and is at the heart of any strategic management (Ongeti, 2014).
The performance of Kenya’s energy sector institutions needs to be strengthened, sustained
and fast tracked in order for it to make significant impact in transforming the national
power landscape and meet its strategic goals. More specifically, performance of the energy
sector institutions must increase supply, reliability, safety of electricity, attain universal
electricity access by 2020; exploit new technology; reduce tariffs and high system losses
and exploit innovative financing instruments; and finally spur economic growth,
employment, investments and social development in tandem with the objectives of MoE
strategic plan 2013 to 2017 and Kenya Vision 2030.
1.1.5 Energy Sector Institutions in Kenya
Energy in Kenya is a key enabler in achieving the Vision 2030 dream. Energy is vital to
key sectors of the economy namely commerce, transportation and agriculture. Almost
every product or service that is consumed has some energy in it and hence is considered a
major source of inflation. The energy consumption within the country consists of 68
percent from wood fuel and biomass, 22 percent from petroleum and 9 percent from
electricity (Energy in Kenya, 2013). The electricity demand in 2018 stood at 1,802 MW
and the country’s installed capacity stood at 2,351 MW (Kenya Power, 2018).
The increasing demand for electricity is attributed to the economic growth being
experienced. The cost of energy determines the competitiveness of goods manufactured
domestically to those of imports. High energy costs impede domestic wealth creation,
creation of employment and balance of trade. In Kenya economic activity is crippled by
shortages in energy supply alongside the inherent disruptions. Tax policies have been used
“to encourage investment in geothermal exploitation, development of hydroelectric power”
coupled with renewable energy forms including wind, biomass and solar (National Energy

6
and Petroleum Policy, 2014). In 2014 the energy and petroleum sector was allocated KShs
43.6 billion to grow energy production and decrease the cost of energy (KPMG, 2014).
Kenya’s electricity sector is currently governed by two regulators, MoE is responsible for
overall policy coordination and development in the energy sector institutions and sets the
strategic direction for the growth of the sector and provides long-term visions for all players
in the sector (MoE, 2016). The second regulator ERC, established during the reform under
the Electric Power Act in 2006, which is an autonomous, independent sub-sector regulator.
It sets, reviews and adjusts consumer tariffs, approves power purchase agreements,
promotes competition in the energy sector institutions where feasible, resolves consumer
complaints and enforces environmental, health, and safety regulations (Electricity
Regulatory Commission, 2016).
Electricity is generated by Kenya Electricity Generating Company (KenGen) and an
increasing number of Independent Power Producers (IPPs). Kenya Power and Lighting
Company (KP&LC), the wholesale buyer and sole distributor of electricity in Kenya,
purchases electricity from all generators through negotiated Power Purchase Agreements
(PPAs) approved by ERC. Electricity is then conveyed over transmission systems owned
by KP&LC or Kenya Electricity Transmission Company (KETRACO). Finally, KP&LC
carries out distribution and retail supply of the electrical energy to customers in accordance
with licenses and permits issued by ERC.
1.2 Statement of the Problem
The linkage of strategy implementation and organization performance has been of great
interest to scholars globally. The success of a strategy depends upon the efficacy of
implementation and therefore top priority of strategy implementation is building a capable
organization (Sorooshian, Norzima, Yosuf, & Rosnah, 2010; Njoroge et al., 2015; Favaro,
2015). Performance of energy sector institutions in Kenya is crucial for the economic
development and more significantly, Kenya has identified manufacturing as one of the big
four agenda for economic growth and energy has been identified as a critical enabler if the
goals are to be achieved. Electricity is a major concern for business enterprises and is
considered as one of the key problems to enterprises (Blimpo et al., 2018). Despite its

7
integral national role, Kenya’s energy sector institutions continue to have challenges of
performance failures against its own stated goals and objectives. The MoE launched in
2013 the ambitious 5,000 + MW road map projecting to increase installed power generation
capacity from 1,765 MW to 6,700 MW by December 2016 (MoE, 2013-2016). Actual
installed capacity as at June 2018 was 2,351 MW (Kenya Power, 2018) – a performance
target shortfall of 4,349 MW. The electricity peak demand stood at 1,802 MW as per
KP&LC 2017/2018 report, while the country’s installed capacity was 2,351 MW. This
short fall of demand behind electricity supply means high cost of power to the customer
who has to shoulder the burden of surplus capacity. Cost and quality of electricity is one
of the constraints to manufacturing in Kenya. Cost of electricity in Kenya is high at US$
0.15/Kilowatt hour (KWh) compared to China US$ 0.086/KWh, USA 0.129/KWh, Mexico
US$ 0.08/KWh, Egypt US$ 0.018/KWh Taiwan US$ 0.094, Cameroon US$ 0.09, Ghana
US$ 0.065/KWh, Uganda US$ 0.173/KWh, Tanzania US$ 0.1/KWh, and Zambia US$
0.048/KWh. This increases cost of production making manufactured products from Kenya
uncompetitive.
Several studies have found positive and negative correlation between strategy
implementation dimensions and organizational performance making the relationship
inconclusive. The inconsistence in empirical results may point to the possibility, that
important intervening or moderating variables such as capital structure and macro
environment may have been over-looked in carrying the studies. However, there exists
knowledge gaps that this study sought to address along theoretical, conceptual, contextual
and methodological spheres. However, there exists knowledge gaps that this study sought
to address along theoretical, conceptual, contextual and methodological spheres.
Methodologically, some studies revealed knowledge gaps. Ongeti (2014), Mkalama
(2014), Ongombe and Mungai (2018), Hasan, Ahsan, Rahaman, and Alam (2014) used
secondary data on performance of these organizations. The study by Zaidi, Zawawi, Nordin
and Ahnuar (2018) was a critical theoretical review on the strategy implementation process
and performance of construction companies. Conceptually, while strategy implementation
has been found to positively impact on performance, empirical evidence on the moderating

8
role of macro environment on the relationship between the two variables is lacking.
Additionally, capital structure has been conceptualized as an independent variable in some
studies Hasan, Ahsan, Rahaman, and Alam (2014); Mohamed and InunJariya (2015);
Ahmad (2018). Nevertheless, its mediating role on the relationship between strategy
implementation and performance is yet to be established empirically. Contextually, the
current study did not come across any study that was carried out on strategy
implementation in energy sector institutions and the empirical evidence in Kenyan context
is scanty. Further, the intervening effect of capital structure and moderating role of macro
environment on the relationship between strategy implementation and performance is yet
to receive empirical attention. Finally, there is a gap in literature on the moderating role of
macro environment on the intervening effect of capital structure. This study was an attempt
to address the gaps demonstrated along theoretical, conceptual, contextual and
methodological fronts.
This study filled the gap in literature on how strategy implementation has influenced
performance of energy sector institutions in Kenya and also provide strategies and policies
for Vision 2030 and the big four agenda with regard to strategy implementation and
performance of energy sector institutions in Kenya. In addition, there is a gap on empirical
evidence on the intervening effect of capital structure and moderating influence of the
macro environment on the relationship between strategy implementation and performance
of energy sector institutions in Kenya. The main research question that guided this study
was therefore what is the influence of strategy implementation, capital structure and macro
environment on the performance of energy sector institutions in Kenya?
1.3 Objectives of the Study
The broad objective was to investigate the influence of strategy implementation, capital
structure and macro environment on the performance of energy sector institutions in
Kenya. The specific objectives were to:
i. Establish the effects of strategy implementation on performance of energy sector
institutions in Kenya;

9
ii. Determine the intervening effect of capital structure on the relationship between
strategy implementation and performance of energy sector institutions in Kenya;
iii. Determine the moderating effect of macro environment on the relationship between
strategy implementation and performance of energy sector institutions in Kenya;
and
iv. Determine moderating effect of macro environment on the intervening effect of
capital structure and performance of energy sector institutions in Kenya
1.4 Justification of the Study
Energy is a key driver of economic development and Sustainable Development Goals
(SDGs) seven on affordable and clean energy adopted in 2015 has modern energy
accessibility, affordability, reliability and sustainability to all as a key blueprint (UNEP,
2015). Global electrification reached 85.3 percent in 2014, with Europe, North America
and Central Asia having attained universal access. Both Asia-Pacific and the Arab region
access rates were around 90 percent in 2014 (World Bank, 2017). Sixteen percent of the
global population live in Africa, however Africa has only 2.8 percent of the world’s power
generation capacity with 25 Sub-Saharan countries facing energy crisis and majority of the
population, approximately 600 million people still live without electricity. Only 37 percent
of the population had access to electricity in 2014 (Blimpo, McRae, & Steinbuks, 2018).
The weakness of the Africa’s energy sector institutions has constrained economic growth
and development with electricity declared as second biggest problem to organizations in
the region after finance (Blimpo et al., 2018). Many African cities are characterized by
rural to urban migration phenomenon. This is driven by the quest for increased
participation in economic activities. Increase in the population within cities results in the
straining of energy production sources which leads to the adoption of a rationing system
of energy among localities (UNEP, 2015). Tackling energy poverty in the country is a
major challenge and electrification has been the focus of extensive research of the past few
years (Zeyringer et al., 2015). During 2013 to 2017, Ministry of Energy (MoE) launched
the ambitious 5000+MW road map projecting to increase installed electricity generation

10
capacity from 1,765 Megawatts (MWs) by 30 June 2013 to 6,700 MW by December 2016
(MoE, Investment Prospectus 2013-2016).
Within the same period of 2013 to 2016, the system losses were 19.4 percent, customer
satisfaction index was 68.4 percent. Cost of energy in Kenya remained high compared to
other countries, power outage stood at 33 percent (Energy in Kenya, 2015) and high cost
of power, shortages in energy supply, and inherent disruptions impedes socio-economic
development. Cost and quality of electricity is one of the constraints to manufacturing. A
survey done in 2012 indicated that, 67 percent of the respondents were unanimous that cost
of electricity is very expensive. In addition, provision of electricity is erratic, eight to 12
times per month which results in loss of production time, leading to low productivity by
up to 7 percent of sales and damage to equipment. This led to 44 percent of the
manufacturers being forced to invest in generators and electricity connection costs (Kenya
Association of Manufacturers, 2012).
Successful strategy implementation remains a major and most challenging task in any
organization. Transforming and implementing strategies into actions is far more complex,
difficult and often challenging. Strategy implementation may take a form of developing
new processes of doing things, improving on the existing process and capacity building
among staff and customers to enable them work comfortably with new systems
implemented in an organization (Thompson & Strickland, 1993). Organizations right
practices and ability to integrate these components in the strategy implementation ensures
that its successfulness.
Through strategy implementation, organizations are able to align their day to day
operations to the changing operational environment for competitive advantage (Johnson,
& Scholes, 2008). The organization’s ability to adapt to its operating environment ensures
its competitiveness. It is difficult for any management team to formulate a consistent
strategy and it’s even more difficult to implement the strategy in the whole organization
several factors can affect the process of turning strategies into organizational action (Noble,
1999).

11
Strategy implementation in organizations in the energy sector institutions has in general
not received much attention and hence significant gaps exist in our knowledge. Increased
research in this area to unveil problems associated with implementation of organizational
strategies, capital structure and macro environment is important. Hence the study is
designed to fill this gap by establishing the influence of strategy implementation, capital
structure and macro environment on the performance of energy sector institutions in
Kenya.
1.5 Scope of the Study
The study aimed at determining the relationship between strategy implementation, capital
structure and macro environment on the performance of energy sector institutions in
Kenya. The study only targeted energy sector institutions. According to the Republic of
Kenya, Energy and Petroleum Regulation Authority 2019 there are 68 institutions engaged
in energy sector institutions in Kenya with about 17,640 employees. The respondents
included the staff from all institutions. The research majorly focused on how the elements
of strategic implementation, capital structure and macro environment influence
performance energy sector institutions. The data was collected between October 27th to
November 28th 2019.
1.6 Limitation of the Study
Some respondents were reluctant to give some of the information due to their sensitive
nature and for fear of victimization. This was mitigated by the researcher assuring the
respondents of total anonymity to encourage the respondents to share the needed
information. The researcher also reaffirmed them the information so obtained was purely
for research purpose. Due to the busy schedules of most of the respondents, the researcher
may have a lower respondent’s rate. This challenge was overcome by arranging visits to
the institutions accompanied with the introduction and authority letter from the university.

12
The study only focused on energy sector institutions in Kenya. The study was only limited
to primary data since it only depended on questionnaires for data collection. The study was
also constrained by lack of previous studies in the specific research area since very little
has been done on the contemporary and evolving research problem on the relationship
between strategy implementation, capital structure, macro environment and performance
1.7 Delimitation of the Study
The study aimed at establishing the effects of strategy implementation, capital structure
and macro environment on the performance of energy sector institutions in Kenya. The
study employed a cross sectional survey design. The population of interest of the study was
the 68 institutions engaged in energy sector institutions listed in Energy and Petroleum
Regulation Authority February 2019. The study used data from primary and secondary
sources. Structured questionnaires were used to collect primary data. The study was only
limited to the study variables namely; strategy implementation, capital structure, macro
environment and performance.

13
CHAPTER TWO: LITERATURE REVIEW
2.1 Introduction
This chapter reviews the literature advanced in the area of strategy implementation, capital
structure, macro environment and performance of organizations. The chapter starts by
reviewing various theories relevant to this study. The theories include the institutional
theory, open systems theory, pecking order theory and Resource based view theory which
form the basis of the concept of strategy implementation. A conceptual framework is also
presented based on the study’s objectives. To assist in identification of existing gaps in the
literature, empirical review is done in this chapter.
2.2 Theoretical Review
Scholars have developed various contemporary theories that link strategy implementation,
capital structure, macro environment and performance. This section reviews several
important theories namely; the institutional theory, open systems theory, pecking order
theory and Resource based view theory.
2.2.1 Institutional Theory
The initial wave of institutional theory was developed by DiMaggio and Powell (1991)
among others. This theory was built on the argument that the institutionalized “rules and
norms of society intrude on the internal structure of organizations” (Beggs, 1995). The core
idea of institutional theory is that organizations are deeply embedded in an expansive
environment and consequently become influenced by the pressures and constraints of this
environment. From previous theoretical work, Scott (1995) identified three major factors
of institutionalization in the literature cognitive elements that include meaning systems and
cultural foundations of the society, the authority of which rests on a consensus of shared
conceptions of social reality; normative elements that stipulate expectations for the
appropriate behaviour, which are learned and internalized through socialization or
education; and enforcement processes which involve surveillance, assessment, and the
application of sanctions by formal regulatory structures.

14
This theory asserts that organizations are social structures, which have achieved high
degree of resilience (Njoroge et al., 2015). It postulates that where the businesses are
situated has a great effects on the firm (Kinuu, 2014). This is because it dictates whether
the business will actually survive (Njoroge et al., 2015). The link of strategy
implementation, external environment and organizational performance can be explained
by institutional theory. Institutionalization leads to successful strategy implementation,
which leads to organization performance and finally contributes to sustainable competitive
advantage (Kinuu, 2014). In the institutional theory, organizations are influenced by
normative reassurance arising from external forces such as the state and sometimes arising
from forces within the Energy sectors institutions. This was the anchor theory of the study.
2.2.2 Open Systems Theory
Open systems theory was developed by Burnes (2000). The theory suggests that
organizations operate in open systems where there is interaction between the internal and
macro environment. The proponents of open systems theory suggest that as enterprises
perform their trades, they will be subjected to events and changes in their macro
environments. This is so since enterprises are environment serving and reliant (Ansoff &
McDonell, 1990). Organizations are open schemes that need careful management to
gratify and stabilize internal needs and adapt to external circumstances (Burnes, 2000).
Open systems theory argues that organizations are strongly influenced by their
environment for change and survival. This theory explains how strategy helps an
organization to achieve sustainable competitive advantage. Thus, survival of organizations
relies on its affiliation with the environment. Organizational performance is vastly
associated to the vibrant evolutionary nature of the fit between the environment and the
organization (Machuki & Aosa, 2011). For any organization to thrive, they must constantly
interact with the ever-changing macro environment. Organizations exist in open systems.
Organizational external environment consists of the micro and macro environments. In this
regard it is prudent for organizations’ management to be keen on current and trending
issues, emerging technologies, new legal regulations, inflation, customer behavior,
competition, supplier challenges, sponsor demands, political shifts among other issues that

15
may affect their organizational performance. Failure to be on the lookout for
environmental shifts, adaptation and response may lead to loss of market share, losses and
at times extinction. Energy sector institutions operate in open systems where they transact
with the environment. They are thus affected by environmental changes in the micro and
macro environments. This theory is crucial in this study as it explains the effects of macro
environment on the relationship between strategy implementation and performance. This
explains the relevance of this theory in this study.
2.2.3 The Pecking Order Theory
The Pecking Order Theory (POT) was developed by Myers and Majluf in 1984 (Salminen,
2013). According to POT, organization’s finances are gotten from the internal funds, debt
and new equity. The POT suggests that firms will initially rely on internally generated
funds, and then they will turn to debt if additional funds are needed. Finally, they will issue
equity to cover any remaining requirement (Ahmad, Abdullah & Roslan, 2012). This
theory argues that firms follow a certain hierarchical fashion in financing their operations
in the sense that they initially use internally generated funds in the form of retained
earnings, followed by debt, and finally external funding (Mateev, Poutziouris & Ivanov
2013). The pecking order theory predicts a negative relationship between debt ratio and
profitability, because firms utilize the available internal funds as first financing source and
debt as a last resort (Brendea, 2012).
According to the pecking order hypothesis, firms that are profitable and therefore generate
high earnings are expected to use less debt capital than those who do not generate high
earnings (Ahmad et al., 2012). This is because funds used from profits do not dilute
ownership. Besides, the funds obtained from debt attract interest which is an extra burden
to the firm. According to the Pecking Order theory, there is no optimal debt-equity mix
because there are two kinds of equity, retained earnings at the top of the pecking order and
the issue of new shares at the bottom (Myers, 1984). The Pecking order Theory further
stipulates that optimal capital structure is reached when tax advantage to borrowing (tax
shield) is balanced, at the margin, by cost of financial distress (Maina & Muturi, 2013).

16
Myers (1984) summarizes the theory by stating that there is no optimal debt-equity mix
because there are two kinds of equity, retained earnings at the top of the pecking order and
the issue of new shares at the bottom. Myers (1984) claims that asymmetric information
and transaction costs overwhelm the forces that determine optimal leverage in the trade-
off models. For this reason, therefore, to work first with internal cash flows. Only if there’s
residual financing need will firms use external capital. So, contrary to the trade-off theory,
the pecking order theory predicts no long run target capital structure (Maina & Kondongo,
2013).
The theory holds that organizations tend to use their internal excess liquid assets or retained
earnings first before considering debts. If it is necessary to turn to external finance firms
use debt with little or no risk, which usually corresponds to short term debt and in the last
place, firms will select external equity (Njagi, Kimani & Kariuki, 2017). According to
Njeru (2013) internal finances are preferred to firms because they are cheaper and easy to
get at a short notice. In any case that internal financing isn't adequate to finance investment
ventures, outside funding might be sourced and in the event that they do, so as to limit
costs, the managers need to pick obligation before utilizing value. This theory sees that
organizations follow a progressive system of financing and lean toward internal financing
first; organizations prefer debt over equity as is brings in new ownership from outside.
The Pecking order theory shows the lifeline of an organization. This means if the company
finances itself internally it means it is a strong company and if the company has external
financing then this shows high level of confident that the company has high chance of
satisfying its obligations (Wahome, Memba & Muturi, 2015). This theory is also relevant
to this study because it assisted in determining whether an institution exhaust internally
generated funds before turning to debt financing. The theory implied that institution could
opt to use internal financing (profits, sale of assets and savings from reduced capital) as a
means of financing and will only result to debt finance after exhausting internal finances.
This is because internal sources of finance are perceived to be cheaper compared to debt
as means of financing. This theory has been found to be of help to previous studies on
capital structure, for instance, Maina and Kondongo (2013), Daskalakis, Jarvis and Schizas

17
(2013). The critique of Pecking order theory is that it does not explain the influence of
taxes and financial distress. The theory can be critiqued to be having a downside of
assuming that there is capital structure target in firms.
2.2.4 Resource Based View Theory
Resource Based View was first advanced by Penrose (1959) who argued that a firm’s
superior performance is achieved when the resources are controlled by the firm. The
resource-based theory (RBT) anchors propositions of organizational resources and
contends that firm behaviors depend on resources (Barney, 1991). Resource based view
theory states that, firm’s performance is mainly driven by a unique set of resources that are
valuable, rare and difficult to imitate (Singh & Mahmood, 2014). The chosen business
strategy supports organisation to best and fully exploit its core competences given the
available opportunities in organizations’ external environment (Griffin, 2013). The theory
emphases internally on assets, organizational processes, capabilities, knowledge,
information, and other capacities controlled by an organisation that permits the
development and implementation of effective strategies (Okioga, 2012). Organizations
may also be seen as bundles of human, physical and capabilities which creates sustainable
competitive advantage in such a way they are rare, valuable, non-substitutable and
inimitable (Ferlie & Ongaro, 2015). Moreover, firm resources are the basis for the
sustainable realization of competitive advantage (Singh & Mahmood, 2014; Gebhardt &
Eagles, 2014). The resources must have the capacity to exploit opportunities and reduce
threats in its external environment, while offering something rare, which cannot be easily
imitated, or substituted by rivals within the same industry (Okioga, 2012).
The theory submits that for an organization to have competitive advantage over its
competitors, it needs to prioritize the acquisition of unique resources and capabilities
(Barney, 2002). The resource-based view (RBV) theory explains that valuable and rare
organization resources can be difficult to replicate, and thus leading to sustained
advantages in organizational performance (Alavi, Wahab, Muhamad, & Shirani, 2014).
The RBV emphasizes the organization’s resources as the fundamental determinant of
competitive advantage. Two of RBV’s assumptions are that firms within an industry or in

18
a strategic group could be heterogeneous with respect to the kind of resources that they
control. Secondly, it assumes that resource heterogeneity is long lasting and are difficult to
accumulate and imitate. Theoretically, RBV addresses the fundamental question of why
firms are different and how they achieve and sustain competitive advantage. The RBV
literature suggests that firm’s sustainability of competitive advantage come from building
on the resource endowment and core competencies of the organization (Kostopoulos,
2003). Conceptually and empirically, resources are the foundation for attaining and
sustaining competitive advantage and eventually high performance for the organization
(Ismail, Raduan, Uli, & Abdullah 2011). The resource-based view is considered relevant
to competitive advantage. RBV contributes to the understanding of competitiveness of an
organization.
The RBV model assumes that an organization is a blend of organizational capabilities and
the available resources. RBV also assumes that firms acquire different resources and
develop unique capabilities based on how they combine and use the resources; that
resources and capabilities are not mobile across organizations and that the differences in
resources and capabilities are the basis of competitive advantage (Hitt, 2013). Bridoux,
(2004) argued that RBV has focused on internal resources at the expense of external factors
that does influence firm performance. He opines that strategic managers, should have
resources as the basis of competitive strategy. Other critics (Foss, Foss, Klein, & Klein,
2007b), argue that the practical assessment and evaluation of resources involves
subjectivism, knowledge creation and entrepreneurial judgement. The RBV’s critics
notwithstanding, this study still finds the RBV theory applicable in the current research
context.
2.3 Empirical Review
The section covers empirical studies on strategy implementation, capital structure, macro
environment and performance. The section also provides the relationships between the
study variables.

19
2.3.1 Strategy Implementation and Performance
Strategy implementation is a key challenge for today’s organizations and most strategies
stagger at the implementation stage (Coulson-Thomas, 2013). Effective strategy
implementation is facilitated through action planning, coordination and institutional
alignment. According to Hinton (2012), action planning includes formulating of activity
timelines, estimating the resources required, allocating responsibilities and defining
expected output. All these activities have to be coordinated efficiently. Institutional
alignment in terms of culture and structure is also critical for successful strategy
implementation. In order for organizations and business entities to reach the ambitions set
out for their strategies, they need to give thought to how they go about implementing the
organization’s strategy (Getz & Lee, 2011).
Challenges faced by managers in implementing organizations’ strategies is an issue that
has been subject to investigation by Gebczynska (2016) and Radomska (2014). Manager
characteristics play a critical role in determining the outcome of decisions made and the
level of success in implementing strategies (Jespersen & Bysted, 2016). Successful
managers spend valuable time in ensuring that strategies are implemented flawlessly given
that an organization’s output suffers when insufficient time and effort are expended on
strategy execution or inappropriate execution actions thereof (Jiang & Carpenter, 2013). In
addition, only about half of the ideas described in strategic plans ended up being
implemented (Burlton, 2015). Managing undertakings internal to the firm is only part of
the modern executive’s tasks (Pearce & Robinson, 2013). Managers anticipate, monitor,
assess and incorporate executive decision making to challenges posed by the firm’s
environment. Rajasekar (2014) linked strategy implementation to an organization’s
success. Rajasekar (2014) avers that successful strategy implementation is key for any
organization’s survival. Kibicho (2015) posited that manager characteristics needed greater
attention as they were key to an organization’s implementation of its strategies among
insurance companies. Managers’ characteristics therefore play a key role in influencing
organization’s outcomes, but the question of how organizations can build and benefit from
a diverse composition of managers remains unanswered (Georgakakis, 2014).

20
Njoroge et al. (2015) studied the effect of strategy implementation on performance of
Kenyan State Corporations. The study used the 108 State corporations as the unit of
analysis. Data collection was done using the questionnaires. The study used regression
analysis. The study findings indicated a statistically significant influence of strategy
implementation on performance. The study finding also revealed that external environment
had a positive and statistically significant relationship of between the strategy
implementation and performance. The current study seeks to incorporate different
constructs of strategy implementation namely; strategic plan, management, processes,
responsibility and accountability and also establish whether the intervening and moderating
variables have influence on the performance.
Njagi and Kombo (2014) study on the effect of strategy implementation on performance
of commercial banks found that there is a moderately strong association between strategy
implementation and organizational performance and that institutions that want to thrive
and compete effectively must implement strategy effectively. They however noted that,
only 44.8 percent difference in performance is explained by strategy implementation. The
current study therefore sought to evaluate other factors other than strategy implementation,
that affect performance. Organizations need to systematically evaluate their strategic
management styles to determine strengths and weakness in strategy implementation.
Additionally, Abass, Munga and Were (2017) study revealed a statistically significant
relation between strategy implementation and performance. The study looked at the
conducted on the relationship between strategy implementation and performance in county
governments of Kenya. A mixed research design was used for the study. The study findings
showed that organizational structure influences implementation of the strategic plan. The
study revealed organizational structure affects implementation of the strategic plan. The
current study introduced the moderating and intervening variables and measured their
effect on the relationship between strategy implementation and performance of Energy
sector institutions in Kenya.
Kariithi and Ragui (2018) looked at the relationship between Strategy implementation
Practices on Performance. The aim of this study was to determine strategy implementation

21
practices on the performance of Huduma (Service) Centres in Kenya. The study adopted
descriptive research design to determine the influence of strategy implementation practices
on the performance of Huduma (Service) Centres in Nairobi County, Kenya. The study
adopted a census approach during data collection where information was collected from all
(130) employees working in 5 Huduma Centres operating in Nairobi City County, Kenya
which included; GPO Huduma Centre, Makadara Huduma Centre, Kibera Huduma Centre,
Eastleigh Huduma Centre and City Square Huduma Centre. Primary data was collected
using questionnaires. The questionnaires were used to collect the data. The data collected
was analysed using Statistical Package of Social Sciences (SPSS Version 21). Descriptive
statistics such as means, standard deviations and percentages and inferential statistics such
as correlation and regression analysis method were used to find out the statistical
relationship between variables of the study. Regression analysis was used in the analysis.
Before conducting regression analysis diagnostic tests which include normality, linearity,
homogeneity and multicollinearity were conducted. The analysed and presented in the form
of tables. The study results revealed that there was a significant positive relationship
between employee training, leadership and communication and performance of Huduma
Centres.
Ibrahim, Sulaiman, Kahtani and Abu-Jarad, (2012) investigated the relationship between
strategy implementation and performance of manufacturing firms in Indonesia. Jakarta
Stock Exchange formed the population of the study. With a sample size of 112 out of 164
respondents, their study findings indicated that there was a significant relationship between
strategy implementation and performance of the manufacturing firms. Strategy
implementation was operationalized into a program of budget and control of resources and
performance of the manufacturing firms measured by return on equity. Ibrahim et al. (2012)
in their study found six silent killers of strategy implementation, identified as top-down or
laissez-fair senior management style, unclear strategy and conflicting priorities, an
ineffective senior management team, poor communication, poor coordination across
functions, inadequate down-the-line leadership skills and development, (Kiliç & Aktuna,
2015). In a nutshell the role of leadership and if the organization leadership is able to

22
control and eliminate the six killers, the firm becomes capable organization, hence building
on organizational capacity.
Zaidi, Zawawi, Nordin and Ahnuar (2018) study resolved a strong positive relationship
between strategy implementation process and construction companies' performance. The
study looked at the relationship between strategy implementation process and performance
of construction companies. The study used questionnaires to collect data. Quantitative data
was used in the study. Correlation analysis was used to analyse the relationship between
the study variables. Čater and Pučko (2010). The study examined the factors of effective
strategy implementation in Slovenian companies. Multiple regression analysis was used
in the study. The study findings also indicate that only the company size influences the way
most strategy implementation activities are practiced, whereas the influence of sector,
ownership and sales market is almost non-existent. Finally, the results reveal negative but
significant relationship between inadequate leadership skills and employees’ reluctance
and performance. The results further indicate that adapting the organisational structure has
a positive influence on performance.
Alharthy, Rashid, Pagliari and Khan (2017) revealed that leaders and the management
should devote more attention and effort to strategy implementation owing to the fact it
faces high chances of failure. Alharthy et al. (2017) also found out that many institutions
could not sustain their competitive edge despite having a streamlined strategy. This was
attributed to lack of achievement in the strategy implementation stage.
Mailu, Ntale, and Ngui (2018) study revealed that the success of strategy implementation
was influenced by operational process factors, namely, resource availability,
communication, operational planning in addition to control and feedback. Strategy
implementation was found to have significant effect on organizational performance. The
study found out that performance was influenced by the organizational structure, resources
and culture have a significant effect on the performance. The study looked at the
relationship between strategy implementation and organizational performance. The used
questionnaire to collect data from pharmaceutical companies.

23
Obeidat, Al-Hadidi, Tarhini and Masa’deh (2017) study showed that the strategy
implementation was influence by resource availability, communication, operational
planning in addition to control and feedback. The study reviewed factors affecting strategy
implementation in pharmaceutical companies. The study employed questionnaires to
collect data. Kibicho (2015) studied the determinants of strategy implementation in the
insurance industry in Kenya. Data collection was collected and analyzed through mixed
methods. Questionnaires were used to collect data. The relationship between the study
variables was measured using multiple regression. Mann-Whitney test was used to test the
hypothesis. Maika (2020) study found out that organization culture had a significant
relationship effect on strategy implementation. The study looked at the effects of
organisational culture on strategy implementation in water boards in Kenya. The study
used regression analysis to analyze the relationship between the study variables. The data
was presented in frequencies, percentage mean, standard deviation, chi-square results and
tables and charts. Abok (2014) study revealed that management styles, organization
culture, stakeholders and organization resources had a statistically significant relationship
with the strategic plan implementation. The study reviewed the factors affecting effective
implementation of strategic plans in non-governmental organizations in Kenya. The study
used descriptive survey. Both tests of significance using ordinary least squares regression
and correlation analysis indicated a strong significance amongst the variables as well as
when combined against the dependent variable.
Chiuri (2015) reviewed the challenges of strategy implementation in higher education
institutions in Kenya. The study results revealed that strategy implementation was
influence by the organizational culture. The study also realized that organizational structure
and external environment had a significant effect on strategy implementation. Descriptive
survey design was used by the study. Both stratified sampling and simple random sampling
were employed in getting sample size. Isaboke (2015) studied the influence of organization
culture on strategy implementation. The study used a descriptive survey design. The
proportionate stratified sampling method was used to get the sample size. The study results
indicated that organization culture had a significant relationship between strategy
implementation.

24
2.3.2 Strategy Implementation, Capital Structure and Performance
A firm needs to finance its operations and in so doing, there is need to choose debt and
equity combination which will form its capital structure. Debt keeps the leaders in check;
if the firm is not committed to some fixed payments like paying for principal debt and
related interest, they can misuse the free cash flow (Jensen, 2013). Countries like Kenya
have a challenge attracting private capital due to volatile returns, concerns by long term
investors about transparency and reliability of policies and regulations, particularly policy
makers short term political priorities. Investment involves availing funds for projected
assets (Jensen, 2013).
Fosu (2013) incorporated the reverse causation between performance and capital structure
in econometric modelling and to the best of the author's knowledge, only a few studies
stand out as they directly test this theoretical relationship (Margaritis & Psillaki, 2010;
Berger & Bonaccorsi Di Patti, 2006). Berger and Bonaccorsi Di Patti (2006) tested the
efficiency-risk and franchise value hypotheses on the banking industry in the U.S. On the
other hand, Margaritis and Psillaki (2010) tested the same hypotheses on firms in New
Zealand and France respectively. Berger and Bonaccorsi Di Patti (2006) found that
significant effect of efficiency on leverage. This is consistent with findings from New
Zealand firms which also revealed that both the efficiency-risk and franchise value
hypotheses operate (Margaritis & Psillaki, 2010). Abdul (2015) posited that in other to
decide the debt-equity combination of financing, the capital market is important and plays
a prominent role because companies that seek for long-term funding to finance their
business activities will approach the capital market. The relationship between capital
structure decisions and the Nigerian capital market lies on how often companies place
offers on NSE and on the number of equities listed and traded on NSE. The Nigerian
corporate sector is characterized by many firms operating in a largely diversified,
competitive and deregulated environment.

25
Traditionally, a lot of investment in energy sector was made by the government. However,
there is an increasing role being played by private sector and therefore, in order to close
the investment gap, there is need to mobilize private investment and finance (Younger,
2011). Anwar (2011) took a sample of 199 firms (149 from textile, 23 from cement and 27
from energy sector) and set out to investigate cross industry determinants of capital
structure with data collected between 2005 and 2009. According to the study, debt to equity
ratio accounted for a very small percentage of financial performance of companies in
Kenya. However, there exist a knowledge gap as previous studies failed to look at the
intervening effect of capital structure on the relationship between strategy implementation
and performance. The current study introduced the intervening variables and measured
their effect on the relationship between strategy implementation and performance of
Energy sector institutions in Kenya.
Additionally, the results from the study conducted by Fatoki (2018) study revealed mixed
results. The study examined the effect of financial performance on capital structure of non-
financial firms in the Nigerian Stock Exchange (NSE). The study examined the effect of
financial performance on capital structure of non-financial firms. The study employed the
causal research design approach. The study used panel data extracted from the annual
reports and financial statements of the firms under the study. The study results revealed
that all the performance variables conclude a significantly positive relationship effect on
capital structure except Return on Assets (ROA) and Return on Capital Employed (ROCE)
when regressed against total leverage and debt equity which exhibits negativity. At the
level of long-term debt only ROCE exhibited a negative relationship when moderated
Olokoyo (2013) examined the impact of leverage on firm’s performance in Nigeria using
fixed-effect estimation, random-effect estimation and a pooled regression model. The study
looked at the relationship between corporate performance and capital structure. The study
findings revealed that all the leverage measures have a positive and highly significant
relationship with the market performance measure (Tobin's Q). The study used secondary
study. The equity capital was found to be the source of financing for the firms.

26
Ongombe and Mungai (2018) demonstrated a mixed study finding. The study looked at the
effects of effects of capital structure decisions on financial performance of sugar
manufacturing firms in Kisumu County. The sugar manufacturing firms formed the
population of the study. The study revealed a positive significant relationship between
capital structure and the financial performance of the sugar firms. The study looked at the
relationship between the choice of capital structure decision and financial performance of
sugar milling firms in Kisumu County. The study findings showed negative and non-
significant statistical relationship between debt-ratio on financial performance. The study
is similar to the current study in that they both used census survey. The study used
correlation analysis. The study however used only the secondary data. The current study
sought to employ both the primary and secondary data in determining the relationship
between the study variables.
Hasan, Ahsan, Rahaman, and Alam (2014) investigated the influence of capital structure
on firm’s performance in Bangladesh during the period 2007-2012. The study findings
showed that earnings per share (EPS) had a significant positive correlation with short-term
debt while significant negative correlation with the long-term debt. The findings also
revealed a significant negative correlation between ROA and capital structure. On the other
hand, the study findings indicated no statistically significant correlation between capital
structure and firm's performance. The study was based in Bangladesh. The current study
was conducted among energy sector institution in Kenya. Javed, Younas and Imiran (2014)
explored the impact of capital structure on firm performance in Pakistani firms. The looked
at non-financial firms registered on Karachi Stock Exchange. The study findings recorded
mixed results on the relationships between capital structure and firm performance. The
study results revealed that capital structure has a significant impact on firm performance.
Hossain and Nguyen (2016) examined the effect of financial leverage on firm performance
in Canadian oil and gas companies from 2004 to 2013. The study results indicated a strong
negative but significant association between financial leverage and performance. The study
used regression analysis to assess the relationship between the study variables.
Muhammad, Shar and Islam, (2014) investigated the impact of capital structure on the

27
performance of cement manufacturing companies in Karachi stock exchange during the
period 2009-2013. Pearson correlation and multiple regressions models were used to
analyze data. The study revealed a negative but a significant relationship between capital
structure and firm performance. The result showed a strong negative relationship between
debt to asset and firm performance. The study findings further showed that capital structure
variables significantly impact firm performance. The study did not consider the constructs
of capital structure entirely. The study finding was also limited to stock exchange. The
current study looked at energy sector institutions.
There is extant literature on capital structure and ROA but their conclusions are mixed.
While some researchers concluded its positive (Mujahid & Akhtar, 2014), some authors
(Ebaid, 2009; Khan, 2012; Črnigoj & Mramor, 2009) have revealed a negative relationship.
For an instant, Nirajini and Priya (2013), in a study, on the Capital structure and financial
performance during 2006 to 2010 carried out on listed trading companies in Sri Lanka
employing data extracted from the annual reports of sample companies which were
analysed using correlation and multiple regression analysis. The study findings revealed a
positive and significant effect of capital structure on financial performance. The study
established that there was a significant effect of capital structure on financial performance
of the firm. The study was carried out in trading companies in Sri Lanka. The current study
was carried out in energy sector institution in Kenya.
In a study carried out on the effect of capital structure on firm performance, Nasimi (2016)
while exploring the effect of capital structure on firm profitability, empirically investigated
a sample of 30 firms selected from FTSE-100 index of the London Stock Exchange
between years 2005 to 2014. The study results indicated a positive significant impact on
ROA, ROE and ROIC where DE has a positive significant impact on ROE but a negative
significant impact on ROA and ROIC. In the same vein, Lawal, Edwin, Kiyanjui and Adisa
(2014), examines the effect of capital structure on firm's performance (ROA and ROE) in
Nigeria manufacturing companies from 2003 to 2012. The descriptive and regression
research techniques were employed in their analyses for 10 manufacturing companies and
their finding revealed that capital structure is negatively related to firm's performance.

28
Mohamed and InunJariya (2015) studied the effect of capital structure on profitability of
Food and Beverage sectors in Sri Lanka by taking 14 companies of the Beverage, Food &
Tobacco industry and 24 companies from the Manufacturing industry. The study utilized
secondary data from annual report s for a period of 5 years. Capital structure was measured
by total debt to total asset and total debt to total equity. The study results revealed that
capital structure had a negative but a significant effect on profitability. The study only
used some of the constructs for the capital structure. The current study introduced other
constructs of capital structure different from the ones studied in the previous studies.
In finding out the determinants of capital structure and its impact on financial performance,
Swain and Das (2017) by means of data generated from listed companies on the Indian
stock exchange for a time period of 10 years analysed a total of 50 sampled manufacturing
companies using regression model. Capital structure was measured by debt-equity ratio,
total debt to total asset, current ratio and long-term debt to total asset ratio while the
financial performance was proxied by return on capital employed, return on assets,
earnings per shares and return on equity. From their findings, a statistically significant
positive relationship was concluded between all the independent and the dependent
variables. Yadav (2014) in studying the determinants of the capital structure and financial
leverage of selected Indian companies applied the correlations and multiple regression
analysis and found among other measures a negative correlation between firm size and
financial leverage as measured through debt to equity ratio, while Srivastava (2014) study
was carried out on Indian cement sector with the aid of a linear regression model in
estimating the effect of five variables which includes size on leverage and risk of
companies but found a negative correlation between firm size and financial leverage
whereas asset tangibility was noted to have positive effect on financial leverage.
Ahmad (2018) investigated the relationship between capital structure and performance of
non-financial firms of Pakistan. The results of the study depicted that capital structure
negatively and significantly influence the accounting measures of performance whereas
the relationship between capital structure and market performance (Q ratio) was
29
significantly positive. In addition, the results showed that 31 percent of the selected sample
firms were inclined towards the cost leadership strategy to accomplish their business
objectives. The results of moderating analysis showed that cost leadership strategy
positively moderate the relationship between capital structure and firm performance. The
study implied that debt financing is financially viable for the cost leadership firms. In
addition, the results specified that when the firms try to maintain high debt ratio while
pursuing a product differentiation or hybrid strategy, incur a significant performance
penalty.
Getahun (2014) examined the determinants of capital structure and its impact on the
Performance of Ethiopian insurance industry. The study used only secondary data. The
study used statistical tests like descriptive statistics, correlation, specific linear assumption
and fixed effect regression estimation model. The study showed that the proxies of capital
structure had a significant effect on the performance. The study results indicated a
significant negative relationship between leverage and performance. The study was
however limited to insurance industry. The current study was carried out in the energy
sector institutions. According to Arulvel and Ajanthan (2013), capital structure choice is
an important decision for a firm. It is important not only from a return maximization point
of view, but also this decision has a great impact on a firm's ability to successfully operate
in a competitive environment. The capacity of organizations to complete their partners'
needs is firmly identified with capital structure. Therefore, this derivation is an important
fact that we cannot omit. Capital structure in financial term means the way a firm finances
their assets through the combination of equity, debt, or hybrid securities (Saad, 2010).
Salim and Yadav (2012) investigated the relationship between capital structure and firm
performance of Malaysian listed companies. The study findings revealed a negative but
significant relationship between capital structure and firm performance. Tobin's Q reports
demonstrated a significantly positive relationship between short-term debt (STD) and long-
term debt (LTD). The study findings also revealed a significant negative relationship
between capital structure and the performance of the firm. The study results indicated that
firm performance have negative relationship with capital structure.

30
In another study of Pakistani firms, Nazir (2017) measured the impact of financial leverage
on financial performance of twenty-one (21) listed companies in the textile, automobile,
sugar, petroleum and energy sectors of Pakistan using ordinary least squares and
correlation techniques during the period 2012- 2015. The study unraveled that financial
leverage measured by debt to asset ratio has significant negative effect on financial
performance proxy by ROA. Abubakar (2017b) analyzed the effect of financial leverage
on the financial performance of industrial goods firms in Nigeria. The study used
descriptive statistics and panel data techniques. The results showed that short-term debt
ratio (STDR) and total- debt ratio (TDR) have no significant effect on the financial
performance. The study findings further indicated that there was a negative but a
statistically significant relationship between total-debt equity ratio (TDER) and the
financial performance.
Abubakar (2016) examined the effect of financial leverage on financial performance in
Health Care Sector of the Nigerian Stock Exchange. The study employed descriptive
statistics. The study used panel data techniques. The study findings resolved that short-
term debt ratio (STDR) and long-term debt ratio (LTDR) have significant positive effect
on financial performance. The results indicated a negative but a statistically relationship
between total-debt ratio (TDR) and total-debt equity ratio (TDER) and financial
performance.
Yahaya and Andow (2015) analyzed the effects of capital structure on financial
performance of conglomerate firms in Nigeria. The study examined the relationship
between capital structure and firm’s financial performance. Regression analysis was used
in the analysis to examine the relationship between the study variables. The study findings
revealed no significant association between financial leverage measures (debt equity ratio,
debt to total asset ratio and long term debt to total asset) and return on asset (ROA). The
study result reported a negative statistical relationship between firm’s financial
performance and debt capital. The findings further indicated a positively statistically
significant relationship between equity capital to financial performance. Also, there is

31
evidence that size is positively related to financial performance. Enekwe, Agu and Eziedo
(2014) revealed a negative but a statistically significant relationship between financial
leverage and financial performance. The study examined the effect of financial leverage
on the financial performance of pharmaceutical firms in Nigeria. The study used
descriptive statistics. The study employed the ex-post facto research design. Secondary
data was obtained from the financial records Pearson correlation and multiple regression
was used in the analysis. The study findings indicated that debt ratio and debt-equity ratio
have negative relationship with ROA, while interest coverage ratio is positively associated
with ROA. The study results also revealed leverage no statistically significant effect on
financial performance.
Nirajini and Priya (2013) studied the impact of capital structure on financial performance
of listed trading companies in Sri Lanka. The study extracted data from the annual reports.
The study used descriptive statistics. The study utilized multiple and correlation regression
in the analysis. The study results revealed a positive and a statistically significant
relationship between capital structure and financial performance. The findings also
showed a statistically significant relationship between capital structure and financial
performance of the firm. Using 136 quoted companies in South Africa during the period
2000- 2014, Abata, Migiro, Akande & Layton (2017) discovered that total debt to total
equity and total debt to total assets are negatively related to Tobin’s and ROA, while long-
term debt to total assets is positively related to Tobin’s and ROA. The study results
indicated that total debt to total equity and long-term debt to total assets are negatively
linked to ROE.
Akingunola, Olawale and Olaniyan (2017) evaluated the effect of capital structure
decisions on the performance of 22 listed non-financial firms in Nigeria spanning 2011 to
2015. The study used panel dataset. The results revealed that short term debt to total asset
(STDTA) and total debt to total equity (TD/TE) have significant negative effect on
performance indicated by ROA, while STDTA and longterm debt to total asset (LTDTA)
have significant positive effect on the ROE. The study results found total debt to total asset
(TD/TA) to be significantly positively associated with ROE.

32
Ubesie (2016) study unraveled mixed results on the effect of capital structure on financial
performance. The study examined the relationship between Nigerian banks’ capital
structure on the performance of conglomerates. The study used descriptive statistics for
data analysis. The study findings showed that LTDTA and STDTA a significant negative
effect on ROA. The results indicated that TD/TA has no effect on ROA. The study
indicated that the debt proxies (short-term debt ratio, long term debt ratio and total debt
ratio) have negative effect on firm’s performance surrogated by Tobin’s Q and ROA. The
study results that capital structure has effect on both return on assets and asset turnover of
the conglomerates but no effect on return on equity and earnings per share of the
conglomerate.
Hsu (2013) investigated the moderating effect of leverage and ownership structure on firm
performance. The study revealed a positive statistical relationship between ownership
structure and performance. the study targeted 336 information technology firms in Taiwan.
Utilizing descriptive statistics, correlation and multiple regression techniques, the study
revealed that ratio of total debt to total asset has a negative effect on the association between
research and development and performance. The study findings showed that leverage has
a negative effect on the relationship between R&D and firm performance. Enakirerhi and
Chijuka (2016) study results revealed a negative statistical relationship between
profitability and the long term debt, short term debt and total debt. The study assessed the
determinants of capital structure of United Kingdom (UK) Financial Times Security
Exchange (FTSE). Panel data was used by the study. The study targeted UK FTSE 100
firms. The study findings showed that firms engage in trading off the benefit and the cost
of debt in order to determine their capital structure.
Javed, Rao, Akram and Nasir (2015) examined the effect of financial leverage on
performance of textile companies in Pakistan. The target population was 154 companies.
The study employed regression analysis. The study findings indicated that negative but a
statistically significant relationship between leverage and the efficiency of firms. The study
results further showed a negative but statistically significant relationship between leverage,

33
return of assets and equity. Kuria and Omboi (2015) investigated the relationship between
capital structure and financial performance of listed firms from the investment and banking
sector of Kenya. Descriptive analysis was used to asses the relationship between the study
variables. The study results revealed that revealed that debt to equity have a positive and
negative significant relationship with ROE. The findings further revealed a negative
significant relationship between debt to capital and ROE. Finally, the result established that
long term debt does not have a statistically significant relationship with financial
performance of investment companies and banking institutions listed in NSE.
Sivathaasan and Rathika (2013) studied the impact of capital structure on earnings per
share (EPS) in selected financial institutions listed on Colombo Stock Exchange in Sri
Lanka during 2006 to 2010. Regression analysis was used to test the study hypothesis. The
study findings showed a negative relationship between equity and debt ratio and earnings
per share. The study results also indicated a positive correlation earnings per share. The
capital structure was found to have significant effect on earnings per share. Another effort
by Kalpana (2014) to study the impact of leverage on profitability i.e. earnings per share
of selected steel companies traded in BSE shows that that there is a negative correlation
between degree of operating leverage and Earning per share, degree of financial leverage
and Earning per share, and degree of combined leverage and Earning per share. The study
looked at how the fixed financial charges and operating cost were influenced by
profitability. The study used the secondary data. The study revealed that the profitability
of the firms would decline if the debt and fixed cost expenses were used.
Anafo, Amponteng and Yin (2015) in determining the impact of capital structure or
leverage on profitability employed data collected from 17 listed banks on Ghana stock
exchange from 2007 to 2013 using descriptive statistics and multiple regression models.
The study gave a mixed result on the effect of capital structure, leverage on profitability.
The study findings showed a significant positive relationship between financial leverage
and profitability. The findings also indicated that firm size had a positive and significant
relation with all the profitability. The study results indicated that asset growth rate had a
negative and insignificant relationship with profitability. The study was however limited

34
to banks in Ghana and therefore the results cannot be generalized. The study also did not
exhaust all the indicators of capital structure hence the current study sought to introduce
other constructs of capital structure.
Nyanamba (2018) study revealed that the internal equity financing, debt financing and
retained earnings have significant influence on the financial performance. The study looked
at the influence of capital structure on financial performance. The study used semi-
structured questionnaires. Stratified sampling technique was employed. The also used both
descriptive and inferential statistics. Khatoon and Hossain (2017) reported that short-term
debt and cash flows have significant positive effect on performance variables. The study
results also revealed that long-term debts, tangibility of assets and liquidity have significant
negative effect on the financial performance variables except on ROE. The study looks at
the effects of capital structure and firm’s financial performance. The study used panel data.
Ahmad (2018) studied the effects of capital structure and firm performance. The study
results indicated that the relationship between capital structure and market performance (Q
ratio) was significantly positive. The results of moderating analysis showed that cost
leadership strategy positively moderate the relationship between capital structure and firm
performance.
Hantiro and Maina (2020) looked at strategy implementation and performance. The study
was anchored by resource-based theory, systems theory and stakeholder theory. The study
used proportionate stratified sampling method. The study employed descriptive research
design. Data was collected using the questionnaires. The study used both qualitative and
quantitative data. The association between the study variables was tested using multiple
regression. The study revealed a significant relationship between organizational structure,
organizational culture, resource allocation, communication and organizational
performance.

35
2.3.3 Strategy Implementation, Macro Environment and Performance
Njoroge et al. (2015) conducted on the effect of strategy implementation on performance
of Kenya state corporations. The study was done on 98 state corporations in Kenya. The
findings revealed that external environment has a positive significant effect on performance
of those organizations. The study also found out that strategy implementation has a
statistically significant influence on performance. The study established a statistically
significant influence of performance contracting and external environment on the
relationship between strategy implementation and performance. The research was
significant to the current study in that they both employed cross sectional research design
and quantitative analysis were used to study relationship between various constructs of
strategy implementation and performance. The current study sought to establish
moderating effect of macro environment on the relationship between the strategy
implementation and performance.
Cherugutt and Juma (2016) examined the determinants of strategy implementation at Libya
Oil. The study sought to fill this gap by investigating the factors affecting strategy
implementation at Libya Oil (K) ltd. The target population of the study was 64 respondents
from a population of 30 percent of 212 employees. Random sampling was used to select
the respondents. The study used structured questionnaires to collect data. The study used
descriptive and inferential statistics to analyze the relationship between the study variables.
The study results showed existence of budget allocation however, it was never timely. The
study exhibits limitation on the constructs of strategy implementation. The current study
looked at different constructs not covered by the previous study. The Nguyen and Nguyen
(2017) study results revealed a significant positive relationship between strategy
formulation and business strategy implementation. The study looked at the impact of
factors affecting on business strategy implementation of Vietnam garment companies. The
study used questionnaires to collect data. The study also indicated a positive correlation
between human resources, communication, corporate culture, organizational structure and
strategy implementation. However, the study did not consider all the constructs of strategy
implementation. Thus, the current study will seek to introduce different constructs of
strategy implementation.

36
In addition, Murgor (2014) study found mixed results on the relationship between on
external environment, firm capabilities, strategic responses and performance of large-scale
manufacturing firms in Kenya. Descriptive and inferential statistics to assess the
relationship between the study variables. The study used cross- sectional survey. The study
revealed positive correlations between external environment dimensions and some
strategic response variables. The results further indicated that external environment had a
statistically significant influence on some indicators of performance. The study however
indicated that firm capabilities was not statistically significant in moderating the
relationship between external environment and strategic responses.
Njagi and Kombo (2014) carried out study on effect of strategy implementation on
performance of Commercial Banks in Kenya. Correlational research design was used. The
study results revealed that there is a moderately strong relationship between strategy
implementation and organizational performance. The study conducted a census of all the
commercial banks. The study used descriptive statistics to analyze the relationship between
strategy implementation and performance. The relationship between the strategy
implementation and performance was tested using Pearson’s correlation. The study was
however limited to commercial banks and therefore the results cannot be generalized. The
study also used different constructs of strategy implementation different from the current
study’s constructs hence the study results yielded may be different.
Iamratanakul (2015) analyzed the modeling the macro-environmental factors of
international distribution. The contexts on the model leveraged the understanding of
macro-environmental influences on international distribution. The six influences also
provided significant challenges for international distribution. The analysis showed that the
political, economic, and cultural influences become the most challenge that international
trade specialists should be concerned vigilantly. Guo, Wang, Wang (2017) did an empirical
study on the effect of environmental factors on enterprise growth-comparative analysis of
Chinese Large-Scale Industrial Enterprises and Small/Medium Industrial Enterprises. The
study extracted and used secondary data from financial records. The study employed

37
exploratory factor analysis. The study revealed a positive impact of environment on the
small/medium industrial enterprises. However, the study was limited to Small/Medium
Industrial Enterprises hence the study findings cannot be generalized.
Kihara (2017) study revealed that a positive and significant influence exists between
strategy implementation and performance of the manufacturing SMEs. The study looked
at the influence of strategy implementation on the performance of manufacturing small and
medium firms in Kenya. The study was guided by dynamic capability theory. The
employed logical positivism philosophy. The study also used both qualitative and
quantitative methods. The study used random sampling to select the sample size from the
population. The data was analyzed using SPSS.
2.3.4 Moderating Effect of Macro Environment on the intervening effect of capital
structure
Moderated mediation is used to examine the extent to which the mechanism(s) by which
an effect operates depends on or varies across situation, context, stimulus, or individual
differences (MacKinnon, 2008; Hayes & Rockwood, 2020. Although Moderated mediation
is a relatively new term, introduced into the literature in 2013 (Hayes & Preacher, 2013;
also in the first edition of Hayes, 2018a), the idea of analytically combining moderation
and mediation is not new. Some of the seminal articles in mediation analysis discussed
their integration (Baron & Kenny, 1986; James & Brett, 1985; Judd & Kenny, 1981).
Previously, several important articles have introduced systematic approaches to integrating
moderation and mediation analysis (Edwards & Lambert, 2007; Fairchild & MacKinnon,
2009; Hayes, 2018a; Langfred, 2004; MacKinnon, 2008; Muller, Judd, & Yzerbyt, 2005;
Preacher, Rucker, & Hayes, 2007; VanderWeele, 2015). Although Moderated mediation is
becoming more common, it remains obscure or unknown to many.
Rajasekar (2014) examined how different factors affect electricity distribution companies
in the Sultanate of Oman by addressing the role played by organizational communications
in strategy implementation. The study looked at the effect of available resources on
organizational effectiveness in Non-governmental organizations (NGOs). The study was

38
supported by positivism research philosophy. Descriptive research design was also used.
Data collection utilized the questionnaires. Inferential and descriptive statistics was used
in the analysis. The study revealed that the process efficiency was negatively though
significantly influenced by staff empowerment. Mbaka and Mugambi (2014) study
established that level of management support, inadequacy of resources and technical
expertise among staff affected the strategy implementation. Descriptive design was used
in the study. The study used secondary data to assess factors affecting the strategy
implementation. The type of management leadership and the communication effectiveness
was also found to affect the strategy implementation. The study however did not use the
primary data. The current study will employ both the primary and secondary data to
determine the influence of strategy implementation on performance. The study was carried
out in water sector which have different operating environment as compared to energy
sectors institutions and therefore the results cannot be generalized.
Akeem, Terer, Kiyanjui and Kayode (2014) established a negative and significant
relationship between capital structure and firm’s performance. The study looked at the
effect of capital structure on firm’s performance. Descriptive and regression analysis was
employed. Secondary data was used in the study. The study only used secondary study to
assess the effects of capital structure on performance. From the study findings, there was a
negative correlation between capital structure measures like total debt and debt to equity
ratio and the firm performance.
Mardones and Cuneo (2020) examined the relationship between capital structure and
performance in Latin American companies. The study realized a positive relationship
between financial performance, growth, and size of the company. The study also found a
positive relationship between company’s performance with size and growth as proposed
performance measures. Finally, the study revealed no relationship between firm
performance and ownership structure, except for first largest shareholder with Tobin’s Q.
M’ng, Rahman and Sannacy (2017) reviewed the determinants of capital structure. The
study found out that profitability has a significant negative influence on capital structure.
Firm size had a significant positive influence on capital structure. The study further

39
indicated that the tangibility of assets has a significant positive influence on capital
structure. Balios, Daskalakis, Eriotis and Vasiliou (2016) study on SMEs capital structure
determinants during severe economic crisis revealed that there was a negative relationship
between profitability, tangibility of assets and leverage.
Muyundo, Eugine and Jinghong (2020) studied the effect of capital structure on the
financial performance of non-financial firms. The study revealed a direct relationship of
financial performance to changes in the capital structure. The study employed secondary
data obtained from financial statements. Regression analysis was used to analyze the data.
The findings showed that capital structure has a direct influence on the financial
performance. The results showed that the financial performance of firms increases with the
increase in the changes in debt in the capital structure. However, the study utilized only
qualitative data and failed to use the quantitative data. The current study will incorporate
both qualitative and quantitative data to establish the effects of capital structure on
performance. Saeedi and Mahmoodi (2011) looked at the relationship between capital
structure and firm performance. The study used panel data. The results showed a positive
association between the capital structure and performance. The study also indicated that
there was no significant relationship between ROE and capital structure. Siddik, Alam,
Kabiraj and Joghee (2017) examined the impacts of capital structure on performance. The
study employed panel data. The results of the pooled ordinary least square analysis showed
that capital structure inversely affects bank performance.
Rouf (2015) examined the relationship between capital structure and firm performance
and found out that a significant negative relationship between capital structure and
performance. Hossain and Hossain (2015), investigated the antecedents of capital
structure. The study indicated that tangibility and liquidity ratio have positive relationship
with long term debt and negative relationship with short term debt and total debt. The study
also found out that the pecking-order theory and Static. The study used panel data. Trade-
off theory were associated with capital structure. In a similar study, which excluded the
performance of bank sector, Hasan, Ahsan, Rahaman and Alam (2014) studied the
influence of capital structure on firm performance. The study used panel data. The study

40
revealed that there is no statistically significant relationship between capital structure and
firm’s performance. The study also found out that capital structure has negative impact on
firm’s performance. On the contrary, Nikoo (2015) found a significant positive effect of
capital structure choice on the performance. The study used panel data. Memon, Bhutto,
and Abbas (2012) studied the effects of capital structure on firm performance. The study
used linear regression to test the relationship between the study variables. The study found
out that there was a significant relationship between capital structure and firm performance.
Detthamrong, Chancharat and Vithessonthi (2017) examined the corporate governance,
capital structure and firm performance. The study results indicated a negative effect of
audit committee size on firm performance. The study further indicated that financial
leverage mediates the effect of audit committee size on firm performance. Tudose (2012)
also studied the effects of capital structure on firm performance and realized that there is
no significant relationship between capital structure and firm performance. However, the
study established that there was positive significant relationship between the firm’s debt
level and performance.
Ashraf, Ameen and Shahzadi (2017) study revealed mixed results. The study established
that debt ratio and long term debt ratio have significantly negative relationship with return
on asset (ROA) and return on equity (ROE), while short term debt have significantly
positive link with ROA and ROE. The study examined the impact of capital structure on
firm’s profitability in 18 firms listed on Karachi Stock Exchange (KSE. The study used
descriptive and inferential statistics. The firm’s profitability was measured by ROA and
ROE, while capital structure was measured by debt equity ratio (DER), interest coverage
ratio (ICR), debt Ratio (DR), short term debt ratio (STDR), and long term debt ratio
(LTDR). Jayiddin, Jamil and Roni (2017) study finds a mixed result where short term debts
ratio indicates a significant negative effect, while long term debt ratio presents a non-
significant influence. The study examined the effects of capital structure on performance
in the construction firm. The study used Tobin’s Q as a proxy for firm performance. the
study results indicated that capital structure had a significant effect on the firm
performance.

41
Usman (2019) looked at the impact of capital structure on financial performance of
Consumer Goods Industry in Nigeria. The Dependent variable of the study is financial
performance proxied by return on asset (ROA), while the independent variables of the
study are: Short term debt (STD), Long term debt (LTD) and shareholders’ funds (ROE).
The data generated from annual report and accounts of the selected companies were
analyzed by means of descriptive statistics, correlation and regression analysis using E-
views 8.0. The result of the analysis was tested at 0.05 (5%) significance level. The study
results indicated showed that Short term debts have no significant impact on the financial
performance of listed firms in the Nigeria consumer goods industry. The results also
indicated that Long term debts have no significant impact on the financial performance of
listed firms in the Nigeria consumer goods industry. The study also revealed that Equity
has significant impact on the financial performance.
Kausar, Nazir and Butt (2014) explored the association between firm performance and
capital structure of 197 listed firms of Pakistan during the period of 2004 to 2011. Capital
structure was determined through long term, short term and total debt ratio while price
earnings ratio and Q ratio were selected to determine the performance of the selected firms.
The outcomes of the Ordinary Least Square and panel regression analysis indicated that all
proxies of the capital structure were inversely and significantly related to P/E ratio and
Tobin’s Q. Moreover, the study also showed that the listed firms of Pakistan were largely
dependent upon the short term debt financing. Javed, Younas and Imran (2014) empirically
examined the leverage-performance relationship by selecting 63 listed firms of Karachi
Stock Exchange over the period of five years from 2007 to 2011. Performance of the
selected sample was calculated through return on sales, return on assets and return on
equity while long term debt ratio, total debt ratio and equity to assets ratio were selected to
compute the capital structure of the firms. The results of the study revealed mixed results
as leverage positively predated ROA and ROE when measured through equity to assets
ratio. Conversely, LDR and TDR significantly and negatively predicted ROS.
Tauseef, Lohano and Khan (2015) explored the leverage-performance relationship by
selecting the sample of 95 listed textile firms of Pakistan from 2002 to 2008. Return on

42
equity was selected to measure the financial performance while capital structure computed
through debt to assets ratio. Results showed a non-liner relationship between debt to asset
ratio and return on equity. It implied that as the leverage increases, performance of the
firms enhances till optimal level of capital structure and then starts declining. The study
also designated that optimal level of debt ratio is around 56 percent in textile sector of
Pakistani. Moreover, firm’s sales growth was positively predicting return on equity while
size was not predicting performance of the firms. Shahzad, Ali, Ahmad and Ali (2015)
explored the relationship between capital structure and financial performance of panel data
of 112 listed textile firms of Pakistan over the period of fourteen years i.e. 1999 to 2008.
The study utilized both accounting i.e. return on total assets and market measures i.e. Q
ratio to compute the financial performance while total debt ratio, long term debt ratio, short
term debt ratio and debt to equity ratio were selected to measure the capital structure. The
findings of the research illustrated mixed results as capital structure of the selected sample
showed negative impact on accounting performance and positive impact on market
performance of the firms.
Kerosi, Mugo and Fredrick (2018) examined the relationship between capital structure and
profitability of firms listed at the Nairobi Securities Exchange. The study employed a
longitudinal research design. Secondary data was obtained the annual reports. The study
used descriptive and inferential statistics to analyse the relationship between the study
variables. The study findings showed that organizations relied more on short-term debt
than long-term debt. The findings also indicated that firms preferred internal equity to
external equity. The study results reported a negative but significant relationship between
long-term debt and ROCE. The result also showed a negative statistically significant
relationship between Short-term debt and profitability. The study findings also revealed a
statistically significant relationship between external equity and profitability. The study
concluded that there was a significant relationship between sales growth and profitability
while there was no statistically significant relationship between firm size and the
profitability of firms.

43
Rouf (2015) studied the relationship between capital structure and firm performance of
listed non-financial companies in Bangladesh. The study employed regression analysis to
examine the relationship between the variables. The study employed secondary data. The
results obtained from regression models show that Debt Ratio, Debt Equity Ratio and
Proprietary of Equity Ratio are negatively and significant relationship with Return On
Asset (ROA) and Return On Sales (ROS). The study findings further indicated a positively
and significant relationship between the control variable total asset and Return On Asset
(ROA). There was also positively and significant relationship between control variable
total asset and Return On Sales (ROS).
Ahmad and Ali (2016) studied the impact of financial leverage on the performance of the
cement sector of Pakistan. They selected 18 listed firms of cement sector over the period
of six years from 2009 to 2015. The performance was measured through return on total
assets while debt ratio was utilized to compute the financial leverage. The outcomes
illustrated a statistically significant negative relationship between debt ratio and
profitability. The appropriate mixture of debt and equity financing is considered one of the
fundamental and critical decisions faced by the company’s top management to enhance the
shareholders wealth or overall performance of the organization. Awais, Iqbal, Iqbal and
Khursheed (2016) explored the impact of capital structure on the firm’s financial
performance. The financial data of 100 listed non-financial firms of Pakistan was selected
over the period of 2004 to 2012. Study showed that total debt ratio enhanced all indicators
of the firm’s performance i.e. ROA, ROE, Q ratio and EPS while long term and short term
debt ratios negatively influenced the firm’s corporate performance.
Anowar (2016) studied the relationship between capital Structure and profitability of
Bangladeshi Firms. Secondary data was gotten from annual reports of the 40 companies in
the Dhaka Stock Exchange (DSE). The study used Granger causality test and fully
modified least square (FMOLS) to examine the long and short run relationship between
Current Ratio CR and other explanatory variables in this study. This finding indicates
liquid firms have less preference for debt in the short run. Moreover, unidirectional
causality also exists among profitability to capital structure and firm size to liquidity in the

44
short run. The study revealed that there was astatistically significantly relationship between
capital structure and profitability. The study findings confirmed a statistically significant
relationship between capital structure and profitability, firm size and liquidity.
Habib, Khan and Wazir (2016) expanded the existing literature by empirically examining
the leverage-performance relationship by selecting the financial data of 340 listed firms of
Pakistan over the period of ten years (2003 to 2012). The study used SDR, LDR and TDR
as explanatory variables while firm’s performance was measured through return on assets.
The outcomes of the panel regression analysis indicated that the relationship between all
proxies of capital structure and firm performance were significantly negative. By selecting
the panel data of 218 oil exploration firms for the period of 1970 to 2007, Chung, Na and
Smith (2013) investigated the impact of capital structure on the firm’s survival. The results
support the pecking order hypothesis and illustrated that debt financing declines the
financial performance of the firms in the presence of retained earnings.
Yazdanfar and Ohman (2015) selected the cross-sectional sample of 15,897 Swedish small
and medium enterprises (SMEs) during the span of 2009 to 2012 to investigate the
leverage-performance relationship. The outcomes of the research depicted that both short
term and long term debt ratios negatively influence the firm performance of selected SMEs.
In addition, the owners of SMEs preferred equity financing due to agency cost and threat
of losing control on firms associated with the debt capital. By choosing the 136 listed
industrial firms of Turkey over the period of 2005-2012, Nassar (2016) examined the
relationship between debt ratio and firm’s performance. Return on Asset (ROA), Earnings
per Share (EPS) and Return on Equity (ROE) and were utilized to compute the performance
while capital structure of the selected firms was computed through debt ratio. The
outcomes of the multivariate regression analysis indicated the leverage was harmful for the
performance of Turkish companies as all the measures of performance were inversely
related to debt ratio.
Abata and Migiro (2016) empirically examined the impact of capital structure on the
performance of listed firms of Nigeria. A sample of 30 companies was selected over the

45
period of 2005 to 2014. Results of multivariate regression analysis indicated that both
proxies of the performance i.e. ROA and ROE decline with the increase of debt
financing. Mauwa, Namusonge and Onyango (2016) used both primary and secondary data
of listed firms in Rwanda Stock Exchange (RSE) Nigeria to investigate the leverage-
performance relationship. The results of the regression analysis depicted that all measures
of firm performance i.e. ROE and ROA were inversely and significantly related with the
firm’s performance. Vithessonthia and Tonguraib (2016) explored the impact of capital
structure and the firm’s performance by collecting the financial data of 159,375 non-
financial firms of Thailand during the phase of financial crises (2007-2009). The outcomes
of the study revealed that high debt financing was harmful for the financial performance of
the whole selected sample. The explanatory power of the leverage-performance
relationship was higher in the case of domestically oriented firms. Additionally, Mwangi,
Makau and Kosimbei (2014) The study examined effects of capital structure on
performance of non-financial companies listed in the Kenya. Non- experimental research
design was used in the study. The study carried out census of 42 non-financial companies
in Nairobi Securities Exchange (NSE). Secondary data was obtained from the annual
financial reports of the companies. Inferential and descriptive statistics were used in the
study. The study used panel data. The study results revealed a negative but a statistically
significant relationship between financial leverage and performance. The study further
revealed a statistically significant positive relationship between total current assets to total
assets ratio and performance of companies listed in the NSE as measured by return on
equity.
Mumtaz, Rauf, Bashir and Noreen (2013) selected 83 listed firms from KSE 100 index of
Pakistan to examine the association between capital structure and firm’s financial value.
Leverage was measured through total debt ratio while earnings per share, return on assets
and net profit margin and return on equity were selected to compute the performance of the
firms. The outcomes of the study reported that firm’s accounting performance was
significantly and negatively affected by the formation of debt and equity financing.
Moreover, market performance and level of risk was inversely related to debt financing.
Khan (2012) investigated that stock returns of the 189 listed textile firms of Pakistan are

46
sensitive to change in the debt equity choice. The financial data was collected over the
period of 2003 to 2009. Findings of the ordinary least square regression analysis suggested
that variations in the stock returns were not significantly affected by the financing choices
of the firms.
Zavala and Salgado (2019) study reported that there was a positive and statistically
significant relationship between changes in financial leverage and the firm value. The study
examined the effects of capital structure on market value among Mexican publicly listed
companies. The study looked at the impact of capital structure changes on the market
value. The study sampled 69 of the non-financial firms. The findings showed a negative
but statistically significant relationship between firm size and the relative firm value. The
results indicated a positive and statistically significant relationship between profitability
and firm value. The findings also revealed a negative but a statistically significant
relationship between risk and the firm value.
Badar and Saeed (2013) selected the financial data of 10 listed food firms of Pakistan
during the period of 2007 to 2011 to empirically examine the impact of capital structure on
firm’s performance. Return on assets and assets turnover ratio as response were used to
variables to compute the firm’s value. On the other hand, capital structure of the firm was
computed through long term debt ratio, short term debt ratio and debt to equity ratio. The
results of the multiple regression models showed significant and inverse relationship of
debt to equity ratio and short term debt ratio with firm’s performance while long term debt
financing significantly enhances the company’s performance. Rehman (2013) conducted
a research to examine the leverage-performance relationship of 35 listed firms from sugar
industry of Pakistan. The study selected debt ratio to estimate the capital structure whereas
return on total assets, earnings per share, net profit margin, return on total equity, and sales
growth were chosen to measure firm’s performance. The findings of the research
demonstrated mixed results as capital structure positively was related to sales growth and
return on total assets while debt ratio was negatively related to ROE, NPM and EPS.

47
Using the sample of 25 listed cement firms of Pakistan over the period of 20092013,
Muhammad, Shah and Islam (2014) examined the association between debt ratio and firm’s
performance. They selected debt to assets ratio and debt to equity ratio to measure the
capital structure of the selected firms while firm’s performance was measured through
return on total assets, return on equity, gross profit margin and net profit margin. The
outcome of the research revealed a significant and negative relationship between leverage
and firm performance. Mujahid and Akhtar (2014) considered the 155 listed textile firms
of Pakistan covering a pan of six years (2006 to 2011) to explore the impact of capital
structure on the firm’s financial performance. The research used EPS, ROE and ROA to
compute the firm’s performance and shareholders wealth and the outcomes of the research
showed that leverage was significantly and positively associated to shareholders wealth
and firm’s performance. Inam and Mir (2014) investigated the impact of debt ratio on the
firm’s performance by selecting the sample of all listed energy and fuel sectors of Pakistan.
Financial performance of the firms was computed through earnings per share, return on
capital employed, return on equity, return on total assets and net profit margin and while
capital structure was measured through gearing ratio and debt to equity ratio. The outcomes
of the study showed that leverage had a positive relationship with financial performance of
the firms. They also proposed that Pakistan’s energy and fuel sectors can uplift their future
growth by incorporating the appropriate capital structure or more debt financing.
Taani (2013) looked at the relationship between capital structure and firm performance in
Jordan. The study obtained the secondary data from the annual financial statements. The
study used a target population of 45 manufacturing companies listed on the Amman Stock
Exchange. The study employed regression analysis to assess the relationship between the
study variables. The study findings indicated there was a negative and insignificant
relationship between Short term Debt to Total Assets (STDTA) and Long term debt to
Total assets (LTDTA), and ROA and Profit Margin (PM). The study findings reported
positively and statistically significant relationship between Total debt to Equity (TDE) and
ROA. The results also indicated a negatively but a statistically significant relationship
between TDE and PM. STDTA is significant using ROA while LTDTA is significant using
PM. The study concluded that there was no statistically significant relationship between

48
capital structure and firm performance. This is buttressed by a study on Malaysian listed
firms by Salim and Yadav (2012) analyze the effect of capital structure on performance of
listed firms. The results indicated that capital structure as measured by total debt and short
term debts have negative impacts on ROE. Long term debt and Total debt as measure of
capital structure has negative impact on the performance of firms when it was measured by
ROA. This result is consistent with Ebaid (2009) study which revealed. The study
examined the empirical relationship between debt level and financial performance of 64
listed non-financial Egyptian firms. The study findings showed a negative but a statistically
significant relationship exists between short term debt, total debt and financial
performance. The findings further revealed that there was no statistically significant
relationship between financial leverage and long-term debt. The study findings also
reported that there was no statistically significant relationship between short-term debt,
long-term debt and total debt and financial performance when it was measured by ROE
and Gross Margin.
This supports the findings of Zeitun and Tian (2007) and Abor (2007) that indicate that
performance is negatively related to capital structure. The study also found that Tobin’s Q
has positive and significant impact on short term. Fosu (2013) examined the relationship
between capital structure and firm performance. The target population was 257 South
African firms listed on the Johannesburg Stock Exchange (JSE) Limited. The study used
panel data. The findings revealed a positive and significant relationship between that
financial leverage and firm performance. Oino and Ukaegbu (2015) study on Nigeria firms
indicated that profitability is negatively related to leverage. The study used descriptive
statistics. The study revealed observed a negatively but a statistically significant
relationship between leverage profitability and asset structure. The study findings reported
a positively and a statistically significant relationship between the leverage and size of the
firm and non-debt tax shield. Bandyopadhyay and Barua (2016) examined the relationship
between capital structure and firm performance in India. The study results indicated a
statistically significant relationship between macroeconomic cycle and capital structure
choice of firms.

49
Dao and Ta (2020) examined the relationship between capital structure and performance
of the firm. The study used secondary data. The study findings indicated a negatively but
statistically significant relationship between corporate performance an capital decisions.
Vătavu (2015) studied the impact of capital structure on financial performance in
Romanian listed companies. The results indicated that there was preference for debt by
firms when they encountered financial crisis thereby subjecting the firms to high business
risks. The study findings further indicated that performance was higher when the firms
avoided debt and worked with equity. In addition, Gharaibeh (2015) examined the effect
of capital structure on the financial performance of listed companies in Bahrain bourse.
Secondary data was used in the study. The study used multiple regression in the analysis.
The results indicated a positive and a statistically significant relationship between capital
structure on the performance of the firm. The results also indicated a negative but a
statistically significant relationship between macroeconomic variables of inflation and
ROA, ROE, and Earnings Per Share (EPS). Furthermore, the results indicated a
significantly negative relationship between gross domestic product growth (GDPG) and
financial performance. The results indicated a significantly relationship between gross
domestic product growth and financial performance.
Khodavandloo, Zakaria and Nassir (2017) studied the effects of capital structure and firm
performance during global financial crisis. The study targeted 45 listed companies
involved in trading and services sector of the Bursa Malaysia, over the period between
2004-2006, crisis (2007-2009), and post-crisis recovery (2010-2013). The study results
showed that there was a negative but a statistically significant relationship between that
financial leverage and firms’ performance. Further consistent evidence from Jordan results
from the study by Soumadi and Hayajneh (2012) who examined the relationship between
capital structure and corporate performance. The study targeted 53 industrial firms and 23
service corporations. The study results revealed that there was a negative but a statistically
significant relationship between financial leverage and firm performance. Similarly,
Kanwal, Shahzad, ur Rehman and Zakaria (2017) study revealed that there was a negative
but a statistically significant relationship between financial leverage and the firms’
financial performance. The study examined the effects of capital structure on performance

50
of non-financial listed companies in Pakistan. The study sampled 213 companies listed on
Karachi Stock Exchange for the years 1999 to 2015. The findings further indicated a
negative but a statistically significant relationship between the short term and long term
debts and the financial performance.
Sheikh and Wang (2013) examined the impact of capital structure on performance. The
study targeted non-financial firms listed on the Karachi Stock Exchange Pakistan during
2004-2009. The study used secondary data extracted from the annual financial reports. The
study results revealed that there was a negative but a statistically significant relationship
between capital structure and return on assets. The findings further indicated that there was
a negative but a statistically significant relationship between total debt ratio and long-term
debt ratio and market-to-book ratio. The study results showed there was a positive but a
statistically non-significant relationship between short-term debt ratio and market-to-book
ratio. A negative relationship between capital structure and performance indicates that
agency issues may lead the firms to use higher than appropriate levels of debt in their
capital structure. Similarly, Awunyo-Vitor and Badu (2012) examined the relationship
between capital structure and performance of listed banks in Ghana. The result revealed
there was negative but a statistically significant relationship between high level gearing
and performance of the banks. From the results, it was evident that there was high level
gearing among the listed banks. This can be attributed to their over dependency on short
term debt as a result relatively high Bank of Ghana Lending rate and low level of bond
market activities. The study results further reported an inversely relationship between
capital Structure and the performance of the banks (return on Equity and Tobin’s q).
Pouraghajan, Malekian, Emamgholipour, Lotfollahpour and Bagheri (2012) examined the
relationship between capital structure and firm performance among Companies Listed in
the Tehran Stock Exchange. The study results suggested a significant negative relationship
between debt ratio and financial performance of companies. The study findings showed a
significant positive relationship between asset turnover, firm size, asset tangibility ratio,
and growth opportunities with financial performance measures. The findings further
revealed that there was no significant relationship between ROA and ROE measures and

51
firm age. In addition, study results showed that by reducing debt ratio an organization could
increase their profitability thus increase the financial performance. Venugopal and Reddy
(2016) examined the effects of capital structure on firms’ profitability and shareholder
wealth maximization. The target population was the cement manufacturing companies
listed on NSE. The study employed descriptive and inferential statistics. Two kinds of
variables were used in the study. The study results showed that there was a positive and a
statistically non-significant relationship between the capital structure (debt equity ratio) the
firm’s profitability, market value and shareholder wealth. Githire and Muturi (2015) looked
at the effects of capital structure on financial performance of firms in Kenya. The study
conducted a census of firms listed on the NSE from the year 2008-2013. The study used
nonexperimental research design. The study extracted secondary data form the annual
financial reports. The study results indicated that there was a positive and a statistically
significant relationship between equity and long term debt and financial performance. The
results further showed that there was a negative but a statistically significant relationship
between short term debt and financial performance.
Chinaemerem and Anthony (2012) studied the impact of capital structure on the financial
performance of Nigerian firms. The study employed panel data. The result showed a
negative but a statistically significant relationship between firm’s capital structure firm’s
financial performance. Additionally, Birru (2016) looked at the impact of capital structure
on financial performance of commercial banks in Ethiopia. The study obtained secondary
data collected from the financial statements of the commercial banks. The study then used
multiple regression models to analyse the data. The study used two accounting-based
measures of financial performance (i.e. return on equity (ROE) and return on assets (ROA))
as dependent variable and five capital structure measures (including debt ratio, debt to
equity ratio, loan to deposit, bank’s size and asset tangibility) as independent variable. The
study findings indicated a negatively but a statistically significant relationship between
financial performance and capital structure. Musah (2017) examined the impact of capital
structure on profitability of commercial banks in Ghana. Data was analysed using
inferential and descriptive statistics. The study results negative but statistically significant
between profitability and short term debt ratio and long term debt ratio of banks in Ghana.

52
The study findings reported a positively and a statistically significant relationship between
total debt ratio and profitability of Banks in Ghana. The study findings further revealed a
positively and a statistically significant relationship between profitability and firm size,
foreign ownership and age of the bank. The study results showed a negative but a
statistically significant relationship between customers' deposits and banks' profitability.
Chadha and Sharma (2015) studied the relationship between capital structure and firm
performance. The study utilized secondary data. The study also used panel data. Empirical
study was examined using the ratio analysis. The study findings indicated that there was
no statistically significant relationship between financial leverage and firm’s financial
performance parameters of return on asset and Tobin’s Q. The study results further showed
a negative but a statistically significant relationship between financial leverage and return
on equity. Aggarwal and Padhan (2017) studied the effects of capital structure on firm
value. The panel data was used to perform the empirical study. The study findings revealed
a statistically significant relationship between the firm value and firm quality, leverage,
liquidity, size and economic growth. The results also indicated that there was a statistically
significant relationship between the leverage and the firm value. Le and Phan (2017) study
posited a positive and a statistically significant relationship between capital structure and
firm performance. The study examined the relationship between capital structure and firm
performance in performance in Vietnam. The study used secondary data from the annual
financial records of between 2007-2012. Kodongo, Mokoaleli-Mokoteli and Maina (2015)
examined the relationship between capital structure, profitability and firm value. The study
revealed negative but a statistically significant relationship between leverage and firm
profitability. The study findings postulated that there was no statistically significant
relationship between leverage and the firm value. The findings further reported that there
was a negative but a statistically significant relationship between asset tangibility and
profitability.
Strategy implementation affects organization performance by anchoring the organization
to its external environment (Murgor, 2014). Effects of strategy implementation on
organization performance may be affected by other variables including capital structure

53
(Dawar, 2014). The effectiveness of strategy implementation is effected by the individuals
involved. The strategic management process includes analysis, direction setting,
developing strategies, implementation and control (Kotter & Keller, 2012). The three
organizational elements that provide fundamental long-term success for a business strategy
are leadership, structure and culture. Strategies entail creating a vision, communicating the
strategy and anchoring new approaches in the culture of an organization (Kotter & Keller,
2012). Strategy is executed at corporate, business and functional levels of the organization.
These strategies are responsible for ensuring that the firms are competitive (Coulter &
Robbins, 2013).
Operational strategies combine all the functions of the organization and when a strategy
does not deliver, it is because it was not well executed. Those who lead organizations to
success should be able to implement the strategies rather than just having the ideas. The
problem is always on how to deliver results from the strategies (Prinsloo, 2014). Without
being coherently aligned, the strategies become void. Unfortunately strategies flop at the
implementation stage resulting in significant loss of resources already invested (Prinsloo,
2014). Baroto (2014) asserts that in most cases up to 75 percent of the strategies may fail.
Kaplan (2012) states that 70 to 90 percent of entities may fail while at the implementation
stage. Additionally, 66 percent of the plans are never implemented, 95 percent of people
do not understand why execution fails.
Kola-Lawal (2015) study on the relationship between pro-environmental behaviour
environmental performance revealed mixed results. The study results gave a conflicting
view on environmental performance. The study concluded that there is need for a better
knowledge of organisations’ interpretation of environmental performance and a
determination of the indicators used to measure performance. Results also revealed that
organizations had differing views of environmental performance. Pîndiche and Ionita
(2013) reviewed the influence of micro and macro environment components on trade
companies in Romania. The study investigated the impact of micro and macro environment
components on trade companies in Romania. The results showed that trade companies
organize and operate under specific environmental conditions impact or both.

54
Banahene, Ahudey and Mensah (2016) analyzed macro environment for strategy
implementation. The study employed qualitative approach. The study examined the
environmental analysis done by managers of handicraft export organizations. Strategy
implementation enables such as political, international and economic factors were found
as some of the challenging factors to strategy implementation. From the study, the results
indicated that the firms should be keen on the macro environment as it a key player on
strategy implementation.
The executives have tried to create coherence between finances and the proper capital
structure because of their relationship (Mohammadzadeh, Rahimi, Rahimi, Aarabi &
Salamzadeha, 2013). Organization performance will, therefore be as a result of managing
the interplay between strategy implementation as the independent variable, and capital
structure and external environment as intervening and moderating variables, respectively.
Macro environments are ever dynamic and turbulent depending on the industry in which
an organization is operating (Favaro, 2015). Events within this environment may have a
bearing on the relationship between strategy implementation and performance (Messah &
Kariuki, 2011).
Milovanovic and Wittine (2014) did a research on the moderating role of external
environment on entrepreneurial orientation and business performance relationship among
Italian small enterprises. The findings showed that there was a positive relation between
the external environment and entrepreneurial orientation and the dynamism of the
marketplace had an influence on the entrepreneurial orientation variables and performance.
Descriptive statistics was used to analyse the quantitative data collected using SPSS. The
study established that to ensure strategy is implemented as intended, senior executives must
not spare any effort to persuade the employees of their ideas. The current study investigated
the role of leadership in terms of leadership style and skills, communication, decision
making and teamwork to assess their effect on performance. Data analysis was done using
descriptive and inferential statistics and sampling was conducted through stratified and
random sampling techniques.

55
Genc (2017) established a positive and significant relationship between strategy
implementation and organizational performance. The study looked at the effects of strategy
implementation styles and the performance of public sector organizations. The study
employed a mixed research design. The study used 134 survey responses and 16 semi
structured interviews to collect data. Quantitative data was analysed using multiple
regression. The study findings result established the presence of a significant and a positive
relationship between strategy implementation and organizational performance. Strategy
implementation is the process of putting strategies into practice, which includes planning
and delivering services, developing the efficiency and effectiveness of operations, and
designing organizational structures, evaluation systems and cultures required to fit the new
strategy (Hill &Jones, 2008). It is considered as a difficult task that demands persistence,
draws attention to details and prepares the organization for the future (Ferlie & Ongaro,
2015).
Andrews, Beynon, and Genc (2017) studied the relationship between strategy
implementation style and public service effectiveness, efficiency, and equity. Using fuzzy
cluster analysis, the study explored the effects of strategy implementation style on
perceived service effectiveness. The study identified four distinctive though inter-related
styles of strategy implementation. A logical-incremental and mostly rational style of
implementation were associated with better effectiveness, efficiency and equity; with the
absence of an implementation style associated with worse performance.
Katamei, Omwono and Wanza (2015) studied challenges of strategy implementation on
performance of constituency development fund projects. The study adopted descriptive
research design. The study targeted 263 Management Committees. Stratified random
sampling was used to select 79 respondents. Questionnaire and Interview Guide were used
to collect data. Descriptive statistics was used for data analysis. The findings showed that
leadership, cultural receptivity; structural factors and communication were identified to be
challenges to performance of projects. Measures established included training of various
committees through workshops, incorporating well educated people in various committees,

56
involving all stakeholders in the implementation processes, and adopting effective and
efficient methods of transferring information.
Kakanda, Bello and Abba (2016) studied the effect of capital structure on the performance
of listed consumer goods companies in Nigeria. The annual financial reports served as the
source of secondary data the sampled firms from the year 2008 – 2013. This was obtained
from Nigerian Stock Exchange website. The relationship between independent and
dependent variables was tested using ex-post facto research design the while controlling
for other variables. In order to test the hypotheses developed in the study, the descriptive
statistics and multiple regression analysis were used. The study results indicated a positive
and significant relationship between firm’s capital structure and corporate financial
performance.
Ogenche, Githui and Omurwa (2018) conducted a study on effect of capital structure on
financial performance of consumer goods firms Listed in the Nairobi Securities Exchange
(NSE). The study employed panel research design. The study used all the 12 firms listed
in Nairobi Securities Exchange was used as a unit of analysis from the year 2012 to 2016.
Secondary data extracted from the financial statements was used to compute the relevant
ratios. The study employed a dynamic panel data regression model and E-views software
was used for data analysis. The results showed that debt ratio had a negative coefficient of
-0.401967 and a t-statistic of -6.006392. The p-value of 0.0000 suggests that the
relationship is statistically significant at 5 percent significant level since the value is lower
than the critical p-value of 0.05. The null hypothesis was that debt ratio does not have a
statistically significant effect on financial performance of consumer goods firms listed on
the NSE. The study adopted the alternative hypothesis that debt ratio has a statistically
significant effect on financial performance of consumer goods firms listed on the NSE. The
results also indicated that firm size has a positive coefficient of 0.080114 and a t-statistic
of 4.085403. The p-value of 0.0002 suggests that the relationship is statistically significant
at 5 percent significant level since the value is lower than the critical p-value of 0.05. The
null hypothesis was that firm size does not have a statistically significant effect on financial
performance of consumer goods firms listed on the NSE. The study rejected the null

57
hypothesis that firm size has no statistically significant effect on financial performance of
consumer goods firms listed on the NSE. Debt ratio and firm size were found to be
important aspects of capital structure influencing financial performance of consumer goods
firms listed on the NSE.
Mauwa, Namusonge and Onyango (2016) studied the effect of capital structure on financial
performance of firms listed on the Rwanda Stock Exchange. The descriptive research
design was used in the study. The target population were the six companies listed in the
Rwanda Stock Exchange (RSE). The study adopted census survey used purposive sampling
technique to select the respondents to participate in the study. Descriptive and inferential
statistics was tested using SPSS version 20. The study results showed a negative correlation
between the capital structure and the ROA and ROE. Ganiyu, Adelopo, Rodionova and
Samuel (2019) studied the relationship between Capital structure and firm performance in
Nigeria. Using a non-monotonic relationship between capital structure and firm
performance based on the prediction of the agency cost theory of capital structure, the
relationship between capital structure and firm performance was examined. This was
examined against when firm use debt financing excessively. The study used dynamic panel
model on panel data of 115 listed non-financial firms in Nigeria. The result showed a
statistically significant relationship between capital structure and firm performance
particularly when debt financing is moderately employed.
Nassar (2016) looked at the impact of capital structure on Financial Performance of firms.
The relationship between the capital structure and financial firm performance of industrial
companies in Turkey was examined. The secondary data was obtained from the annual
financial statements of 136 industrial companies listed on Istanbul Stock Exchange (ISE)
from 2005-20012. The relationship between capital structure and firm performance was
checked using the multiple regression. A negative significant relationship between capital
structure and firm performance was realized from the study. This finding collaborates the
finding of Saeedi and Mahmoodi (2011) who found a negative relationship between capital
structure and ROA, but no significant relationship between capital structure and ROE.

58
Skopljak and Luo (2012) found a significant relationship between capital structure and firm
performance of Australian Authorised Deposit-taking Institutions. The impacts of variation
in debt at different levels of leverage on firm performance were found relatively different.
Agnihotri (2014) showed that firms’ decision on a suitable capital structure whether high
or low leverage will reduce the cost of debts depending on their competitive strategies and
market condition, and consequently increasing their performance. Tan and Hamid (2013)
found a significant positive relationship between capital structure and return on equity
(ROE) and significant negative relationships between capital structure and gross profit
margin (GPM) as well as with return on assets (ROA).
Echekoba and Ananwude (2016) examined the effect of financial structure on the
performance of Nigeria consumer goods firms. The study assessed the effect of financial
structure on performance of consumer goods firms quoted in Nigerian Stock Exchange. In
this study, twenty-three (23) out of the twenty-seven (27) firms were randomly chosen for
the period 1993 to 2013. The study applied earnings per share and return on equity as
performance indices. Total debt to total equity ratio, short term debt to total equity ratio
were adopted to measure financial structure while tangibility, firm size, growth and risk
were included as control variables capable of influencing performance. The effect of
financial structure on performance was analysed using pooled ordinary least square, fixed
effect and random effect regression technique. The results of the analysis divulged that
financial structure represented by total debt to total equity ratio and short-term debt to total
equity ratio, negatively affect financial performance of consumer goods firms measured by
earnings per share and return on equity. The negative effect of financial structure variables:
total debt to total equity ratio and short-term debt to total equity ratio tends to buttress that
as result of agency conflict, performance of firms that are highly geared are negatively
affected. The findings also were in conformity with the proposition of the pecking order
theory that firm performance and financial structure are negatively correlated.
Ajayi (2016) assessed the impact of external business environment on organisational
performance of small and medium scale enterprises. The relationship between
organizational performance and the external environment on of Micro, Small and Medium

59
Scale Enterprises in Nigeria was examined. From the review, it was evident that the SMEs
are greatly affected by the environment they operate in. The study revealed the need to scan
the external environment in which the business operates and how it affects the performance
hence recognizing the opportunities and threats faced by their businesses.
Mark and Nwaiwu (2015) studied the impact of political environment on business
performance of multinational companies in Nigeria. The relationship between the
performance of multinational firms the business performance and the political environment
was tested. Twenty-seven (27) of such companies were identified and the necessary data
were sourced from the Nigerian Stock Exchange Fact Book of 2012 and the World
Development Indicators of World Bank Group. Political stability and absence of violence
was used to measure the political environment while profitability was used to performance.
The study results revealed that the performance of the businesses was significantly affected
by the political environment.
Ruhomaun, Saeedi and Nagavhi (2019) studied the effects of selected macro and micro
economic variables on firm performance. The study established the relationship exchange
rate, interest rate, financial distress and derivatives usage as independent variables and firm
performance as dependent variable. A dynamic panel data model was employed in this
study which comprised of 196 companies over a time period of 5 years (2012-2016). The
relationship between the variables was established via GMM as econometric analysis
technique. The study revealed that exchange rate had a negative but not significant impact
on firm performance. Moreover, both interest rate and financial distress had a negative and
significant effect on firm performance.
Tawane and Muathe (2019) studied the relationship between strategy implementation and
growth of Small and Medium Enterprises. The study looked at the growth of SMEs in the
Garissa County of Kenya. This study used exploratory and descriptive research design.
Stratified sampling technique was used to sample 294 SMEs. Data was analysed using
descriptive and regression statistics. The study results revealed a positive and statistically
significant relationship strategy implementation components and the growth of the SMEs.

60
Orugun, Nafiu and Aduku (2017) examined the effects of strategy implementation on
superior performance and competitive advantage of SMEs in Nigeria. The study the survey
technique to collect data. Yamane formula was used to sample the study population. Data
was analysed using regression models. The study results revealed a statistically significant
relationship between strategy implementation and performance.
Nderitu, Waiganjo and Orwa (2020) study results revealed a linear positive relationship
between clan culture and strategy implementation. The study examined the relationship
between organizational culture and strategy implementation process of private chartered
universities in Kenya. The study used cross-sectional survey research design. The study
employed stratified sampling to select the respondents for the study. The study employed
both quantitative and qualitative data. Multiple regression analysis was used to analyse the
data. Breusch-Pagan tests were used to test the hypotheses of the study. The study findings
also indicated that clan culture had a significant influence on the strategy implementation
process.
Mwanthi (2018) linked strategy implementation to organizational performance in Kenyan
universities. The study unveiled that the business environment is characterized by
turbulence, unpredictability, and ever-changing circumstances. This situation calls for
organizations to position themselves in the ever-changing environment the effort to remain
competitively advantaged. Universities in Kenya are not an exception, and therefore have
to adapt to the dynamic environment and create a competitive edge. There is need for
organization to embrace strategy implementation which entails putting into place intended
strategies towards organizational performance for them to stay competitive. The paper
sought to establish whether strategy communication, organizational leadership, employee
participation, and resource allocation had a positive influence on strategy implementation
in Kenyan universities.
Jabeen, Aliyu and Mahmood (2016) studied the moderating effect of external environment
on the relationship between market orientation and business performance. The purpose of
this study is to examine the moderating role of external environment on the relationship

61
between market orientation (MO) and business performance of small and medium
enterprises (SMEs) in Punjab, Pakistan. A five-point questionnaire was used to collect the
data. SPSS was used to code the data. The study findings showed that there is a significant
market orientation-performance link while this relationship is moderated by the external
environment.
Milovanovic and Wittine (2014) analyzed the external environment's moderating role on
the entrepreneurial orientation and business performance relationship among Italian Small
Enterprises. The findings showed that entrepreneurial orientation and performance as
moderated by the internal and external factors is complicated. Dragnić (2014) looked at the
impact of internal and external factors on the performance of fast-growing small and
medium businesses. The study aimed at broadening the understanding of small and
medium businesses (SMBs) as a significant driver of economic development, as
particularly related to their market performance, as well as the impact of the internal and
external environment on it. The results indicated that the internal factors had a significant
impact on the performance/effectiveness (sales growth and achievement of goals) of
SMBs. Emeka and Eyuche (2014) examined the relationship between environmental
factors and organizational performance in Nigeria. The population of 1,152 companies
were used. Using Taro Yamene’s formulae, a sample of 297 was achieved. The results gave
concerns about the unhealthy and unsafe work environment, lack of motivation,
interference and lack of innovation within the companies. The study further revealed the
unsafe and unhealthy situation at Juhel which caused low productivity in the company.
Waititu (2016) study revealed a negative but a statistically significant relationship between
organization structure and performance. The study examined the relationship between
strategy implementation and performance in commercial banks in Nairobi County
Kenya. The study used cross-sectional design. System sampling was used to select the
firms. The study used questionnaires to collect data. The study revealed that
communication had a positively and significant statically relationship with the
performance. The study findings further revealed a positive statistical relationship between

62
organization culture, communication systems, leadership styles, organization structure, and
the performance.
2.4 Research and Knowledge Gaps
The review of literature above identified several research gaps in the relationship among
the four variables, which are strategy implementation, capital structure, macro
environment and performance. The research gaps relate to conceptual, contextual and
methodological gaps. The conceptual gaps comprise of gaps identified during the
literature review among the various concepts in the study. The research methodological
gaps relate to population, research design, and data analysis gaps.
Specifically, in Kenya strategy implementation moderated and intervened by macro
environment and capital structure respectively have scantly been studied to establish their
effects on performance, hence there exists a contextual gap with respect to the few studies
conducted in developing countries. It is on this basis and the knowledge gaps documented
above that this study was carried out to investigate the influence of strategy
implementation, capital structure and macro environment on the performance of Energy
sector in Kenya. Table 2.1 below presented the empirical evidence and research gaps of
the study.

63
Table 2.1: Summary of Research Gaps
Author (s) Focus of the Study Methodology Findings Knowledge Gap(s) Contribution of
Current Study
Ongeti (2014) Organizational
resources, corporate
governance and
performance of Kenyan
state-owned
corporations.
Used Primary and secondary
data
The findings
revealed a
statistically
significant
relationship
between aggregated
organizational
resources and
performance.
The context was the
state-owned
corporations
in Kenya.
The study used
secondary data
This study was
contextualized
in Energy sector
institutions in Kenya.
Mkalama
(2014)
Top Management
demographics, strategic
decision making, and
Macro- Environment and
Performance of Kenyan
State-owned
corporations
Primary and secondary data
were used
The findings
indicated that top
management
demographics had
a statistically
significant
influence on the
performance of
Kenyan SCs.
The variables under
study were the
Top Management
demographics,
strategic decision
making, and Macro-
Environment and
Performance.
The context was the
state-owned
corporations
in Kenya.
This study used purely
primary data
This study considered
influence of capital
structure which the
previous studies did not
test for.
Ongombe &
Mungai
(2018),
Capital structure
decisions and financial
performance of sugar
manufacturing firms in
Kisumu County
The study used secondary
data
The findings
indicated that debt-
ratio had a negative
insignificant
statistical
relationship while
debt-equity ratio
had a significant
negative effect on
monetary
performance
The study used
secondary data
This study used primary
data
This study was carried out
in Energy sector
institutions in Kenya.
This study considered
influence of strategy
implementation which the
previous studies did not
test for.
Olokoyo
(2013)
Capital structure and
corporate performance
of Nigerian quoted
Descriptive research design Capital structure
had a significant
impact on the
firm’s accounting
Study did not
employ moderating
effect of macro
This study examined
effects of macro
environment on
performance

64
Author (s) Focus of the Study Methodology Findings Knowledge Gap(s) Contribution of
Current Study
firms: A panel data
approach
performance
measure
environment was
not considered
Njoroge et al.
(2015)
Strategy implementation,
performance contracting,
external environment
and performance of 108
Kenyan state
corporations
Cross sectional research
design and used primary data
Strategy
implementation
effects performance
contracting,
external
environment effects
Intervening effect of
capital structure was
not considered
Study introduced capital
structure as a variable
Odundo
(2012)
Environmental context,
implementation of
strategic (performance of
state corporations in
Kenya
A combination of cross-
sectional survey design and
relational study design.
Primary data used
Political goodwill
and support affects
relationship
between strategic
plans
implementation and
performance of
commercial state
corporations
Study focused on
moderating effects
of political goodwill
and support.
Moderating effects
of capital structure
and external
environment were
not highlighted
The current study
focused on different
context of Energy sector
institutions and
investigates moderating
effects of capital
structure and macro
environment on
relationship between
strategy implementation
and performance
Letangule and
Letting (2012)
Effects of performance
contract on performance
Descriptive research design
using data from cross
sectional survey
Performance
contracting affected
employee
creativity, quality,
efficiency and
consistency of
service at Ministry
of Education
Other factors that
could affect
performance like
strategy
implementation,
capital structure,
macro environment
was not considered
Study considers effect of
strategy implementation,
capital structure and
macro environment on
performance
Nyamwanza
(2013)
Strategy formulation and
implementation link
Cross sectional survey of 8
SMEs in four Zimbabwe
cities with less than 100
employees
Lack of linkage
between strategy
formulation and
implementation as
a part of a process
affects performance
of SMEs
Context different
being SMEs in
Zimbabwe. Other
variables not
considered
Study examined effect of
strategy implementation
on performance

65
2.5 Operationalization of the Study Variables
The study was informed by four variables, that is, strategy implementation as the independent
variable, capital Structure as the intervening variable, macro environment as the moderating
variable, and performance as the dependent variable. Table 3.2 below presents operationalization
and measurement of the study variables.
Table 2.2: Measurement of Study Variables
Study Variables Indicators Measurement Section
Independent Variable:
Strategy Implementation
-Leadership
-Structure
-Responsibility and
Accountability
-Culture
Interval B
Intervening Variable:
Capital Structure
-Cost of capital
-Covenants
-Debt
-Equity
Interval C
Moderating Variable:
Macro Environment
-Political – policy and support
-Ecological
-Social
-Technology
-Economic
-Legal
Interval D
Dependent Variable:
Performance
-Customers satisfaction
-Innovation
-Cost of power
-Quality of service
Interval E

66
2.6 Hypotheses of the Study
Based on the empirical review and the conceptual framework, the following research hypotheses
were developed.
H01: There is no significant effects of strategy implementation on performance of energy sector
institutions in Kenya.
H02: There is no significant intervening effect of capital structure on the relationship between
strategy implementation and performance of energy sector institutions in Kenya
H03: There is no significant moderating effect of macro environment on the relationship between
strategy implementation and performance of energy sector institutions in Kenya
H04: There is no significant moderating effect of macro environment on the intervening effect of
capital structure and performance of energy sector institutions in Kenya
2.7 Conceptual Framework
Literature reviewed has provided the relationship between the variables being studied and the gaps,
which this study seeks to fill. The study addressed four key relationships - the effects of strategy
implementation on performance; the intervening role of capital structure on the relationship
between strategy implementation and performance; the moderating role of macro environment on
the strategy implementation and performance; the moderating effect of macro environment on the
intervening effect of capital structure.
The operational indicators have been developed guided by conceptual, empirical and contextual
literature. The strategy implementation was measured using the following indicators; processes,
responsibility and accountability. The indicators for measuring the macro environment were;
political (policy and support), environment, social, technology, economic and legal. Capital
structure was measured by cost of capital, covenants, debt, and equity. The performance was
measured by the customer satisfaction levels, innovation, quality of service and cost of power.

67
Figure 2.1: Conceptual Model
2.8 Summary
The chapter looked at the various theories underpinning this study. Conceptual and empirical
literature has also been reviewed. The chapter has discussed and synthesized conceptual and
empirical evidence of strategy implementation, capital structure, macro environment and
performance relationship. A summary of selected empirical studies was presented and clearly
highlighted the focus of study, findings and conclusions, the knowledge gaps and how the current
study addresses them. The chapter also presents a conceptual model in a diagrammatic relationship
with variables of the study with resultant hypotheses. Chapter three presents the research
methodology employed in this study.
H2
Strategy
Implementation
H1
Capital Structure
Macro environment
Organizational
Performance
Independent Variable Moderating Variable
Intervening Variable
Dependent Variable
H4
H3

68
CHAPTER THREE: RESEARCH METHODOLOGY
3.1 Introduction
This chapter presented processes that were followed to conduct the study. This section outlined
the study’s research philosophy, research design, target population, data collection,
operationalization of variables, validity and reliability, data analysis and ethical considerations.
3.2 Research Philosophy
Research philosophy is a belief about the way in which data about a phenomenon should be
gathered, analyzed and used (Saunders, Lewis & Thornhill, 2012). This research involved
drawing conclusion and considering research issues using a quantitative research approach.
Research philosophy includes three major aspects; ontology, epistemology and axiology
(Scotland et al., 2012). There are three main research philosophies that is, realism, interpretivism
and positivism. A research philosophy can be either positivist or constructivist depending on the
approach to be used for the study. The principle of a realist research philosophy is that what the
senses show us as reality is the truth such that objects have an existence independent of the human
mind i.e. a reality quite independent of the mind exists (Scotland et al., 2012). Critical realism
ontologically assumes that a reality exists although it is usually difficult to understand. Realism
differentiates between the real world, the actual events that are created by the real world and the
empirical events which a researcher captures and records. Further, in realism it is argued that there
are entities in the real world which have powers to act and are prone to be acted on by others
(Easton, 2010).
This study adopted a positivist paradigm which involves a statistical analysis approach. This is
closely associated with the scientific approach and implies that investigations should be capable
of replication (Scotland et al., 2012). While phenomenology is suitable in exploratory approach
to research, positivism enables generalizations and predictions to be made about phenomena
through statistical approaches (Hammersley, 2015). This study adopted positivism view with the
aim of predicting and generalizing about the relationship between strategy implementation and
performance of Energy sector institutions through the intervening influence of capital structure

69
and moderation by macro environment. The reviewed studies concerning the variables mainly
adopted explorative case study design and phenomenological viewpoint hence the need to apply
positivism in subsequent studies. This study adopted the positivism philosophy due to ontological,
epistemological and methodological considerations. These influenced the assumptions that were
made in the study as well as the hypothesis testing results from the identified variables in the
determination of the existing relationship in the generalization of study population.
3.3 Research Design
A research design constitutes the blueprint for the collection, measurement and analysis of data
(Cooper & Schindler, 2014). It ensures that the research is relevant to the problem and is an
economical procedure for acquiring information. This implies that a research design is a
methodological link between the adopted philosophical underpinnings and the subsequent choice
of methods to collect and analyse data. There are common types of research designs capable of
affecting the credibility of the research findings. They include case study, survey, action research
and experimental design (Bryman & Bell, 2011; Farquhar, 2012).
The experimental design places a high level of confidence in statistical inference, thus ensuring
that the significant relationship established raises reliability (Maxwell, 2010) and hence achieves
an internal validity that demonstrates cause-effects between the two variables. This design is often
preferred in natural science research rather than business research because the independent
variables are usually manipulated to examine their impact on the dependent variable (Creswell &
Creswell, 2017). It is not just associated with laboratory research but often grounded in hypothesis
(Saunders et al., 2012). This study did not adopt the experimental design because of its close
association with laboratory research. The need for this design arises out of the desire to explore a
phenomenon within its real-life context (Saunders et al., 2012). This enables the researcher to gain
an in-depth understanding of the phenomenon under investigation (Yin, 2014). It implies that the
case study design is capable of enabling a phenomenon to be studied in its natural setting so that
meaningful and relevant theory is generated from the understanding gained through actual practice
(Farquhar, 2012). For this reason, it can be argued that the case study design has the objective of

70
presenting a detailed and intensive analysis of the phenomenon. When used for qualitative
research, a structured or semi-structured interview guide is employed to draw large amounts of
data, which offers an opportunity for the researcher to carry out an in-depth investigation into the
problem (Creswell & Creswell, 2017; Easterby-Smith et al., 2012).
The core feature of case study design is its ability to combine both qualitative and quantitative data
collection techniques which, to an extent, enhances the robustness of the analysis, hence adding
value to the results (Yin, 2014). Yin refers to the technique of collecting data using interviews,
observations and documentary review as data triangulation. Common case study types include
critical, revelatory and longitudinal (Yin, 2014). In a critical case the researcher clearly specifies
the hypothesis and the chosen case creates an opportunity for better understanding of the
conditions in which the findings may be accepted or rejected. The revelatory case is more
associated with a laboratory type of investigation to analyse a previous situation that was not
considered, whereas a longitudinal case is concerned with how a condition has changed over time
(Bryman & Bell, 2011; Yin, 2014). Questions related to why, what and how are better answered
with a relatively full understanding of the nature of the phenomenon in case study design
(Easterby-Smith et al., 2010; Yin, 2014).
This study employed a cross-sectional survey design. The adopted design enabled collection of
data across different facilities and testing their relationships. The cross-sectional study was
concerned with finding out what, when and how much of the phenomena under study (Cooper &
Schindler, 2014). This design was preferred because it enabled production of statistical
information about the matter at hand, testing hypotheses quantitatively and drawing conclusions.
Cross- sectional survey design involves a systematic method of collecting data from individuals
by use of open-ended, closed-ended questionnaires, interviews and observations.
Other researchers (Awino & Gituro, 2011; Sifa, 2009; Kariuki 2014) have used cross-sectional
survey and regarded it appropriate and reliable to investigate similar studies. This approach is
versatile since organizational capacity is a broad concept which can be studied using a survey.

71
This allows the pattern of convergence to develop and corroborate the overall interpretation of
relationships between the study variables. This design was deemed appropriate because of the need
to collect data from several organizations at one point in time and data analysis according to set
hypotheses and the corresponding objectives. This approach provided the researcher with an
opportunity to develop a broad understanding effects of strategy implementation, capital structure
and macro environment on performance of Energy sector institutions in Kenya.
Cross-sectional surveys are descriptive in nature and may support inferences of cause and effect.
Cross- sectional surveys involve collecting data at a specific point in time unlike longitudinal
studies which involve a series of observations of the study population over a period of time. Cross-
sectional design is appropriate for studies where data is collected from a large sample with several
variables being studied at the same point in time as opposed to longitudinal designs where
variables are studied over a period of time (performance). Cross-sectional survey design was
considered to be ideal since Mugenda and Mugenda (2003) indicate that it can be used for
explaining or exploring the existing status of two or more variables, at a given point in time, and
is usually the most appropriate measure of characteristics of large populations.
3.4 Population of the Study
The study population comprised all key players under energy sector covering both public and
private institutions listed in the register of Energy and Petroleum Regulation Authority February
2019. According to ERC (2019), there are 68 institutions under the energy sector. These 68
institutions formed the target population for the study. These are the units of analysis as listed in
Appendix VIII.

72
Table 3.3: Population Distribution
Category No. of Institutions
Policy & Regulation 3
Distribution & Transmission 2
Generation 63
Total 68
Source: ERC (2019)
The unit of observation comprised of the Chief Executive Officer or the Head of the Institution
and two members of management involved in finance, operations and technical. This is because
they are at policy and strategy level. This made it 3 respondents from each category. The researcher
purposively included CEO, head of finance and technical or operation manager from all the
institutions to select 204 employees.
3.5 Data Collection and Instruments
The study used primary data. Primary data was obtained from the selected respondents using
structured questionnaires. A questionnaire is a collection of questions or statements that assesses
attitudes, opinions, beliefs, biographical information or other forms of information (Cooper &
Schindler, 2014). According to researchers, questionnaires are preferred for primary data
collection because they are less costly, especially when the population is large and widely spread
geographically. They ensure anonymity, permit use of standardized questions and ensure uniform
procedures. It also ensures that respondents who are not easily approachable are reached
conveniently. Besides, questionnaires can provide time for respondents to think about responses
and are easy to administer and score (Mugenda & Mugenda, 2003; Kothari& Garg, 2014). Thus,
questionnaires were used as important tools for collection of primary data due to their many
positive attributes discussed herein. The method was found useful in the interest of time and given
the wide spread of the counties that were involved in the study. Likert scale types of questions
were designed in the questionnaire and balanced between quantity and quality of data collected.

73
Quantitative methods are those methods which aim to collect data on numbers, or data which can
be quantified to enable researchers use statistical techniques and compare different groups in the
study (Bryman & Bell, 2011; Martin & Bridgmon, 2012). Conversely, Qualitative methods enable
researchers to understand new phenomena through exploration and understanding the social world
surrounding these phenomena (Cohen & Crabtree, 2008). One of the potential strengths of
qualitative research methods comes from the close and interactive relationship between the
researcher and the participants (Bryman & Bell, 2011). However, that same close relationship may
lead to difficulty in distinguishing between the researcher’s views from the participant’s views.
This means that the researcher’s responsibilities are extended, with positionality and bias being
carefully considered (Mayo, van Knippenberg, Guillen, & Firfiray, 2016).
Qualitative research methods focus on the data that relate individuals to their experience, judgment
and feelings, which, to a large extent, may not be quantified. Some scholars and researchers believe
that the primary differences between the two research methods are not serious since the two
methods produce and generate data (Bryman & Bell, 2011). However, the two methods are totally
different in terms of the methodologies and data analytic tools used. Additionally, the two methods
differ fundamentally in addressing the research questions or objectives. For instance, quantitative
methods use the terms ‘determine’ or ‘identify’ the factors while qualitative methods use ‘explore’
or ‘describe’ the challenges or obstacles. The ontological position gives the main difference
between the qualitative and quantitative data. For example, qualitative data depends upon
construction of information through understanding the reality of social phenomena. These
phenomena are also constructed through the interaction between the interviewees and interviewer
(Ennis & Chen, 2012).
The questionnaires for the study consisted of closed and open-ended questions on the various
study objectives. The questionnaire were coded using a five- point key where 1 = SD (strongly
Disagree), 2=D (Disagree), 3= N(Neutral), 4=A(Agree), 5= SA (Strongly Agree) to enable the
researcher capture responses on the study variables. This likert five-point scale was used in similar
studies by Lee et al., (2013) and Nyamute et al., (2015) to measure qualitative variables. The

74
questionnaire comprised of five sections. The first section comprised of the respondent’s general
information while all the other four sections focused on gathering information focused on the four
objectives of the study. The questionnaire was arranged in terms of objectives. The questionnaire
was in five sections. Section A contained demographic information; Section B was on strategy
implementation; Section C was on macro environment and Section D was on capital structure.
3.6 Data Collection Procedure
Data collection is a process of collecting information from all the relevant sources to find answers
to the research problem, test the hypothesis and evaluate the outcomes (Cooper & Schindler, 2014).
Data collection can be divided into two categories, secondary and primary methods of data
collection. Secondary data is a type of data that has already been published in books, newspapers,
magazines, journals, online portals. Primary data on the other hand is defined as data used in
research originally obtained through the direct efforts of the researcher (Saunders & Lewis, &
Thornhill, 2012). Primary data collection methods can be divided into two groups, qualitative and
quantitative. Qualitative data collection method includes case studies, observation focus groups
and interviews. Quantitative data collection methods include use of questionnaires, surveys, census
and experiments (Cooper & Schindler, 2014).
Depending on the adopted philosophical stance, the method and procedure for data collection can
either be qualitative, quantitative or both (Saunders et al., 2012; Yin, 2014). Qualitative data
collection is associated with tools such as semi-structured questionnaires and interview guides,
whereas quantitative data collection predominantly uses structured questionnaires or closed-ended
questions (Creswell & Creswell, 2017; Bryman & Bell, 2011). According to Yin (2014),
qualitative research is deeply rooted in understanding a phenomenon. Basic research
methodologies include quantitative, qualitative and mixed-methods. Welch, Plakoyiannaki,
Piekkari, and Paavilainen-Mantymaki (2020) indicated that a quantitative method is appropriate
to examine the relationship between two or more variables in the study, and is mainly relevant for
theory testing. Tsang (2014) identified an important difference between qualitative and
quantitative methods.

75
Allwood (2012) indicated a qualitative method is appropriate to describe particular situations using
interviews, observations, and document reviews. A qualitative method met the needs for the study
because the qualitative method is important to explore the phenomenon in the study (Tsang, 2014).
The qualitative method is the most popular method in business and management research (Welch
et al., 2020). Yin (2014) indicated that the qualitative method is appropriate for social science
research, particularly in studying individual and group behaviour in the organization. A qualitative
method was appropriate for the study because the qualitative method applies to studying individual
and group behaviours in the organization. Allwood (2012) noted the importance of a qualitative
method to explore experiences, processes, and problems in the study.
The quantitative method is important to compare two groups or to determine the existence of a
relationship between two or more variables in the study (Tsang, 2014). Allwood (2012) indicated
a quantitative method is appropriate to analyze quantifiable and numerical data in the research.
Quantitative and mixed-methods are appropriate to quantify causal relationships and to analyze
numbers instead of exploring and describing situations (Allwood, 2012). Prior to commencing the
study, the researcher obtained a letter of authority from MUA and research permit was also
obtained from NACOSTI. The study respected and honoured all guarantees of privacy,
confidentiality and anonymity in carrying out research. Participants were informed of the nature
of the study and were allowed to choose whether to participate or not. Confidentiality was assured
to the participants of the information provided in the questionnaires through a written introductory
letter to ensure high response rate. Confidentiality in this case referring to the separation of any
personal identifying information provided by participants from the data and ensuring protection of
the information shared (Saunders & Lewis, 2016).
Data was collected by administering of questionnaires to respondents who were considered in the
sampling to obtain the quatitative data. A questionnaire is described as an objective method of
obtaining information from members of a population. It is a cost-effective way of gathering
quantitative data for further analysis. Questionnaires offer anonymity thus encouraging the

76
respondents to answer. It provides a channel for the standardized collection of data that can be
compared easily (Saunders & Lewis, 2016). The researcher administered questionnaires through
either drop and pick-later method or electronic method where appropriate considering distance or
convenience. One set of the questionnaire was administered per respondent. Primary data was
obtained from the selected respondents of the research project using questionnaire.
The study was quantitative in nature. Quantitative data was obtained through close-ended
questions (Cooper & Schindler, 2014). A questionnaire with a 5-point Likert rating scale was
divided into five sections. the first section capturing the demographics of the respondents such as
gender, age and education, with the remaining sections focusing on the research questions. Section
two focused on identifying the Strategy implementation in place in the organization and its effect
on performance, section three focused on Capital structure and its effect on performance and
section four focused on Macro environment and its effect on performance and finally section five
focused on performance.
3.7 Pilot Study
A pilot test was carried out to test whether the instruments meet the reliability and validity
thresholds before the actual study is conducted. This was done by taking a sample equivalent to
10 percent of the selected sample size for the test as suggested by Mugenda and Mugenda (2003).
Respondents were picked from each category. The researcher picked 1 respondent from Policy
and Regulation; 1 respondent from distribution and transmission; and 6 respondents from
generation. This will sum up to 24 respondents from the 3 categories. These respondents were
allowed to participate in the main study. The pre-test was aimed at determining whether the
questions was understood by the respondents.
Pre-testing is considered necessary since it is a means of determining to what extent a questionnaire
communicates. It is important to pre-test the research instrument to actually determine the
strengths and weaknesses of the questionnaire in terms of the format, wording, and order of the
questions and clarity of questions (Collis & Hussey, 2013; Cooper & Shindler, 2013). The

77
questionnaires were administered through drop and pick-later method and the respondents
requested to complete the questionnaires and return in time owing that it is for academic purpose.
Appropriate electronic method was also used to supplement questionnaires.
3.7.1 Validity
Validity concerns what research instrument measures, and how well it does so (Mohajan, 2017).
Validity is the accuracy and meaningfulness of inferences, which are based on the research results
(Mugenda & Mugenda, 2003). According to Creswell and Creswell (2017) and Pallant (2011)
validity test is mainly divided into four types of content validity, face validity, construct validity,
and criterion-related validity.
Face validity is how much a test seems to gauge what it professes to measure (Leedy & Ormrod,
2005). It is a quick assessment of what the test is measuring (Mohajan, 2017). If the research
instrument is known to have content validity, face validity can be assumed, but face validity does
not ensure content validity (Mohajan, 2017). Since the content validity for the research instrument
under this study was known, it was assumed to have face validity. Concurrent validity is how much
the scores on a test are identified with the scores on another test, effectively settled as substantial,
intended to measure a similar construct.
Content validity is the extent to which the questions on the research instrument and the scores from
these questions represent all possible questions that could be asked about the content (Creswell &
Creswell, 2017). Content validity was achieved through structuring the questionnaire into sections.
Each section contained specific variable, and this was also achieved through expert judgments to
confirm if the theoretical dimensions emerge as conceptualized for this study. Construct validity
was assessed from conceptual framework and correlation of variables, checked for
multicollinearity and normality to ensure that statistical assumptions were valid in this study. The
data was normal and did not suffer from multicollinearity.
78
Validity ensures that the questionnaire includes an adequate set of items that represent items
therein. The more the scale items represent the domain of the concept being measured, the greater
the content validity (Sekaran & Bougie, 2016). There is no statistical test to determine whether a
measure adequately covers a content area, content validity usually depends on the judgment of
experts in the field (Mohajan, 2017). According to Mohajan (2017), the unclear and obscure
questions can be amended, and the ineffective and nonfunctioning questions can be discarded by
the advice of reviewers. In this study, the questionnaire was reviewed by the researcher and the
supervisors. Unclear questions were reframed, some questions added, and others discarded.
Content validity was also increased by studying questionnaires and questions used in similar
studies. This study adopted content validity. Content validity was also increased by studying
questionnaires and questions used in similar studies
A test done simultaneously or to some other available criterion accessible simultaneously. It is
necessary when a test is constructed with a view to replacing less efficient one used (Mohajan,
2017). In this study, the research instrument was not replacing another one. Theoretical assessment
of validity, also referred to as translational validity looks into how items of the theoretical
parameter is put in an operational measure. Translational validity was achieved by the procedures
developed by Cooper and Schindler (2013) which involved identifying the existing scales,
developing data collection instrument and administering it for clarity, comprehensiveness and
relevance.
3.7.2 Reliability
Reliability is concerned with the consistency, stability or repeatability of a variable being measured
and therefore mirrors on the estimates of the degree to which the measurement is free of being
random or unstable (Cooper & Schindler, 2013). There are three genres of validity, namely; face,
content and construct validity, (Awino & Gituro, 2011). The measurement scales used in the
questionnaire were deemed to have face validity because they reflected the key issues in strategy
implementation, capital structure and macro environment and performance and was subjected to
expert judgment.

79
The study used ‘split-halves’ and ‘internal consistency’ method to measure reliability. Split-halves
method was used for comparing the two halves of the responses to each other and similarities
identified. Reliability focused on the degree to which empirical indicators were consistent across
two or more attempts to measure the theoretical concept. To achieve reliability in this study, the
researcher used inter-rater reliability. This was achieved by issuing the questionnaires to different
senior executives of the same organizations to gauge whether their judgement of same constructs
would produce similar results.
Internal consistency is the most relevant for the survey questionnaire that this study employed
(Cooper & Schindler, 2014). Internal consistency is defined as the mean of correlations of all
variables, and does not depend on their arrangement (Anastasiadou, 2011). A high measure of
reliability implies that if future researchers were to undertake the research process independently,
they would obtain similar results (Saunders, et al., 2012). For measuring reliability, the study used
the Cronbach Coefficient (Alpha value) to evaluate the internal consistency of the data collection
tool. It is a common statistical measure of reliability for a set of two or more construct indicators.
Cronbach alpha is considered the most important reliability index and considers the number of
variables/items of the instrument, and the correlation between the variables. The range of values
is between 0 and 1.0 Poor and unrelated items could lead to a low value of alpha. This could be
also due to a low number of questions or due to heterogeneous constructs.
The more similarities between the two halves and each question can be found the greater the
reliability. Split-halves method is the most suitable and basic method for checking reliability when
there is a large amount of raw data. Internal consistency method was tested using Cronbach’s
Alpha. As a general rule, a coefficient greater than or equal to 0.7 is considered acceptable and a
good indication of construct reliability (Zaiontaz, 2013).

80
3.8 Data Processing and Analysis
Data analysis refers to scrutinizing the collected data and making deductions and inferences (Oso
& Onen, 2011; Cooper & Schindler, 2011; Kothari, 2011; Mugenda & Mugenda, 2012; Kombo &
Tromp, 2011). Data analysis involves uncovering underlying structures, extracting important
variables, detecting any anomalies and testing any underlying assumptions. It involves scrutinizing
the acquired information and making inferences. Qualitative data from open-ended questions were
analysed using conceptual content analysis. The data collected in this study was organized and
classified based on the research design and the problems formulated. The data was coded, tallied
and tabulated to facilitate the presentation and interpretation of results. This generated quantitative
reports through tabulations, percentages, and measure of central tendency.
Statistical Package for Social Sciences (SPSS version 22) was used to analyse the quantitative
data. The study employed linear regression analysis to determine the relationships that exist
between the independent variable(s) and dependent variable. Effects of the capital structure on the
performance of Energy sector institutions in Kenya and the relative effects of macro environment
and strategic implementation on the performance were tested using multiple linear regression
model.
The direction and strength of the relationship between dependent - independent study variables
were measured using the Pearson correlation analysis. The technique of applying precursor
Pearson’s correlation analysis on the independent variables to establish the association levels with
the dependent variable, was used. The construct variable is a composite variable and is obtained
by aggregating the components in the independent variable that are significantly correlated with
the dependent variable (Kothari & Garg, 2014). By this technique, the components that were not
statistically significantly correlated with the dependent variable were eliminated from the
composite of the construct variable.

81
3.9 Diagnostic Tests
Before conducting regression analysis, the following diagnostic tests were carried out to minimize
errors that the data collected may have had influence on the decisions to reject or not to reject the
hypothesis. The researcher carried out diagnostic tests to confirm data normality, linearity, and
multicollinearity before actual data analysis. For normality, the researcher used P-P (probability)
plots and numerically using skewness, kurtosis and Shapiro-Wilk’s test for normality. This was
important because correlation, regression, chi-tests, t- tests, and analysis of variance all assume
that data is normally distributed. Multicollinearity was tested by examining tolerance and the
variance inflation factor (VIF) and linearity was tested using scatterplots and analysis of variance
(ANOVA). Regression analysis was used to establish the relative significance of each of the
variables on the influence of strategy implementation, capital structure and macro environment on
the performance of Energy sector institutions.
3.9.1 Multicollinearity
Multicollinearity refers to a situation in which two or more explanatory variables in a multiple
regression model are highly linearly related. Strong multicollinearity may lead to over acceptance
of null hypothesis for individual parameters (Cameron, 2005). Multicollinearity was tested using
variance inflation factor (VIF) and Tolerance, since both are widely used measures of the degree
of multi-collinearity of the ith independent variable with the other independent variables in a
regression model. A VIF =10 would indicate presence of multicollinearity.
According to Hair et al. (2011), if the VIF is greater than 10 and the tolerance is less than 0.1, a
serious problem is indicated. Therefore, it becomes important to ensure that no multicollinearity
exists among the predictor variables. There are two most popular ways of testing for
multicollinearity in the data: a) Tolerance, and b) Variance Inflation Factor (VIF). VIF can be
derived from Tolerance by inversing it. According to Hair et al. (2011), multicollinearity exists
among the predictor variables when the value of Tolerance is less than 0.10 and the value for VIF
is more than 10. Tolerance and VIF can be calculated using SPSS while performing multiple
regressions.

82
In statistics Multicollinearity occurs when two or more predictor variables in a multiple regression
model are highly correlated (Bickel, 2015). The Gauss Markov assumption requires that there be
no perfect multicollinearity. So long as there is no perfect multicollinearity the model can estimate
all the coefficients and that the coefficients remain best linear unbiased estimates and that the
standard errors are correct and efficient (DeFusco, McLeavey, Pinto, Anson & Runkle, 2013). To
detect multicollinearity one can use; correlation matrix, Variance Inflation factor, or Eigen System
of Correlation Matrix. In this study, Variance Inflation Factor (VIF) analysis was used to test the
degree of possible multicollinearity of the independent variables in the regression model. VIF
helped to identify whether a predictor has a strong linear relationship with the other predictor(s).
Therefore, for the VIFj a value greater than 5, Xj is highly correlated with other explanatory
variables. Multicollinearity is present when the VIF is higher than 5 to 10 or the condition indices
are higher than 10 to 30.
3.9.2 Normality
Normality refers to the extent in which the distribution of the sample data corresponds to the
normal distribution (Hair, 2010). A variable is reasonably close to normal if its skewness and
kurtosis have values between -1.0 and +1.0 (Myoung, 2008). Normality test was crucial because
regression model estimation methods were based on assumption of normality since normally
distributed data ensured that the data was fit for further statistical analysis and did not result to
inflated statistics or under-estimated standard errors (Field, 2013). Kolmogorov-Smirnova and
Shapiro-Wilk Test was also performed. A normality test is important as it enables a researcher to
compute the likelihood of a random variable underlying the data set to be normally distributed
(Cooper & Schindler, 2014).
A normality test is also important as it enables a researcher to compute the likelihood of a random
variable underlying the data set to be normally distributed (Cooper & Schindler, 2014). A
normality test was, thus, carried out on the dependent variable, the performance. The rule of thumb
is that if the significance level is >0.05, we assume that the data is normally distributed and if less

83
than 0.05, we assume that the data is not normally distributed. Statistical tests have the advantage
of making an objective judgment of normality, but are disadvantaged by sometimes not being
sensitive enough at low sample sizes or overly sensitive to large sample sizes (Ghasemi &
Zahediasl, 2012). Normality of the data was tested using Shapiro –Wilk test. The significance level
for this study was at a =5 percent, for P=0.05 normality would be assumed while P=0.05 deviation
from normality was assumed. The Shapiro-Wilk Test was more appropriate for small sample sizes
(< 50 samples), even though it can equally handle sample sizes as large as 2000. For this reason,
the Shapiro-Wilk test was used as the numerical means of assessing normality. If the p-values is
significant, then the data deviates significantly and as such the normality assumption is violated,
otherwise the data does not significantly deviate from normal. The normality of data was tested
using the Kolmogorov-Smirnov test and the Shapiro-Wilk test. If the probability is greater than
0.05, then the data is normally distributed (Saunders &Thornhill, 2012).
Based on the Quantile-Quantile (Q-Q) plots, when the data is normally distributed, the data points
are close to the diagonal line but when data points are scattered far from the line in a physical non-
linear fashion, the data was regarded as not normally distributed Field (2013) has justified that a
test with a large sample size is very sensitive, and a minor deviation from normality is enough to
bias any statistical procedures that is applied to the data. Thus, a significant test does not reveal
departure from normality of data. A normality test was, thus, carried out on the dependent variable,
the Performance of Energy Sector Institutions in Kenya. A Normal Q-Q plot of the data was then
generated. The values of Skewness and Kurtosis should be zero if the data is normally distributed
otherwise the data is said to be skewed or highly peaked but the acceptable range of values is -2
and +2 (Field, 2013). To test the normality of organizational performance (dependent variable)
was done by use of Kolmogov-Smirvov test. The hypothesis was tested at a critical value at 0.05,
where the rule is that reject H0 if the probability (P) value is less than 0.05 or else fail to reject.
The dependent variable should be normally distributed for the condition of normality to be
satisfied.

84
3.9.3 Homoscedasticity
Homoscedasticity is the extent to which the data values for the dependent and independent
variables have equal variances (Hair, et al., 2010). However, if the variances happen to be unequal,
then heteroscedasticity exists. Homoscedasticity refers to the level of homogeneity of variance that
assumes dependent variable(s) exhibit equal levels of variance across the range of predictor
variable(s) (Hair et al., 2010). It gives the assumption that the criterion variable exhibits equal
levels of variance across the range of predictor variables. Thus, the normality is assumed because
when the multivariate normality assumption is met, the relationships between variables are
homoscedasticitic.
The study used the 0.05 significance level to determine statistical significance so, if Levine’s test
shows a significance value of less than 0 .05, then it is concluded that the variances are significantly
different meaning the study’s statistical test (t-test or F-test) is invalid and therefore conclusive
inferences cannot be made from it. Likewise, if Levine’s test shows a significance value of greater
than 0.05, then the conclusion is that the variances are not significantly different (Hair et al., 2010).
3.9.4 Linearity
The study adopted the scatter diagram to test linearity. Linear regression is performed under the
assumption that the relationship between the independent and dependent variables is linear. The
linearity assumption tested by scrutinizing a scatter plot. From a scatter plot, outliers were
identified and the source of the outlier investigated if it is a legitimate observation or an error in
entry. If it was due to error it was removed. If it was legitimate observation, it was retained.
The scatter plot also revealed the nature of correlation between the independent variables and
dependent variable. The use of linear regression models to predict the independent-dependent
variable relationship is premised on the assumption of linearity. Holding all other factors constant,
the dependent variable’s expected value is a direct function of each predictor variable and these
are additive (Kothari & Garg, 2014). Rejecting a null hypothesis means there is a significant linear
relationship between the independent and dependent variables (Kothari & Garg, 2014).

85
3.10 Hypotheses Testing
Each of the hypotheses was tested using a multiple regression model, since the hypotheses are
premised on a single response variable that depends linearly on a number of predictor variables.
Every test of significance begins with a null hypothesis H0 (Kaur, 2015). The testing of hypotheses
was done using the T-test and F-Test. A Null hypothesis is a specific baseline statement to be
tested and it usually takes such forms as “no effect” or “no difference.” An alternative (research)
hypothesis is a denial of the null hypothesis (Bali, Gupta, & Gadhi, 2007).
3.10.1 Model for the Study
The significance of the independent variable (Strategy Implementation) on the dependent variable
(Performance) was tested using the following empirical model: In order to facilitate application of
regression model incorporating the moderating and intervening variables, the independent variable
was computed from weighted averages of the constructs.
According to Talukder, Hipel and vanLoon (2017), a typical composite indicator can be built from
a weighted linear aggregation rule that is applied to a set of variables as follows:
𝐼 = ∑ 𝑤𝑖
𝑛
𝑖=1
𝑥𝑖
where:
𝑥𝑖 = normalized variable
𝑤𝑖 = weight attached to 𝑥𝑖
∑ 𝑤𝑖𝑛𝑖=1 = 1 and 0 ≤ 𝑤𝑖 ≤ 1, i = 1, 2. . . n.
Thus, the composite variable for Strategy Implementation was established using the following
equation:
𝑆𝐼 = ∑(𝑤1𝑃𝐿 + 𝑤2𝑃𝑆 + 𝑤3𝑃𝑆𝑃 + 𝑤3𝑃𝑅𝐴 + 𝑤3𝑃𝐶 )………………………………… (X1)
Where
SI = Composite variable for Strategy Implementation
𝑤1, 𝑤2, 𝑤3, 𝑤4 = relative weight of each aspect of the Strategy Implementation variable
𝑤1𝑃𝐿, 𝑤2𝑃𝑆, 𝑤3𝑃𝑆𝑃 , 𝑤3𝑃𝑅𝐴 , 𝑤3𝑃𝐶 = components of the Strategy Implementation variable
(Leadership, 𝑃𝐿; Structure, 𝑃𝑆𝑃; Responsibility and Accountability, 𝑃𝑅𝐴; Culture, 𝑃𝐶)

86
The model for the study:
P = α0 + ß0SI+ ε………………………………………………………………………… (1)
Where:
P = Performance
SI= Strategy Implementation
α0 = Constant
β1= Beta coefficients
ε = Error term
P = α0 + 𝑤1𝑃𝐿 + 𝑤2𝑃𝑆 + 𝑤3𝑃𝑅𝐴 + 𝑤3𝑃𝐶 + ε…………………………………...….… (2)
3.10.2 Moderation Model
Regression analysis (process analysis method) as suggested by Baron and Kenny (1986) was used
to establish the moderating effect of Macro Environment on Strategy Implementation and
Performance of Energy sector institutions in Kenya. The model checks the prediction of the
dependent variable, “P”, differs across levels of a third variable, “ME”. Since the moderating
variable affects the strength and direction between the independent and dependent variable, the
test involves determination of the statistical significance of the interaction term (Whisman &
McClelland, 2005).
P= α + (β1SI) + ε………………………………………………………………………… (3)
P= α + (β1SI) + (β2ME) + ε……………………………………………………………… (4)
P = α + β1SI+ β2ME+ (β3SI*ME) + ε…………………………………………...………. (5)
Where:
P= Performance; SI= Strategy Implementation; ME= Macro Environment; α = constant (intercept);
β=Coefficient parameters to be determined, composite* =interaction term, ε = Error/disturbance)
ε = Constant error
3.10.3 Intervening Model
Four Step Mediation Methodology (Baron & Kenny,1986) was used to establish the intervening
effect of capital structure on the relationship between strategy implementation and performance of
Energy sector institutions in Kenya.

87
Step1: a regression analysis of SI Predicting P
P = α + β1SI + ε……………………………………………………………...… (3)
Step 2: a regression analysis of SI Predicting CS
CS = α + β1SI + ε…………………………………………………………….… (6)
Step3: a regression analysis of CS Predicting P:
P= α + β2CS + ε………………………………………………………………… (7)
If the relationship is significant then proceed to:
Step 4: a regression analysis of SI and CS Predicting P.
P= α + (β1SI) + β3CS + ε………………………………………………………. (8)
P= Performance of Energy sector;
SI = Strategy Implementation,
CS = Capital Structure
β = Coefficient parameters to be determined
ε = Constant error
Steps 1-3 was used to establish that zero-order relationship existed among the variables. Situations
where one or more of the relations is non-significant depicts no possibility of mediation (Baron &
Kenny, 1986). If there are significant relationships from Step 1 to Step 3, then one proceeds to
Step 4 where the mediation is supported if the effect of CS remains significant after controlling for
SI. If SI is not significant when CS is controlled, then there is full mediation, and if both SI and
CS significantly predict P, there is partial mediation.
3.10.4 Moderated Mediation
To determine moderating effect of macro environment on the intervening effect of capital
structure, Hayes and Rockwood (2020) model for moderated mediation was adopted.
M =iM +aSIi + ε …………………………………………………….……………...…....... (9)
P= iY+ c’SI +b1M +b2 CS+ b3M*CS+ ε………………………………………….……... (10)
Where;
iY and iM = Constants
P= Performance; CS= Capital structure; ME= Macro Environment
βCS*ME = Interaction

88
3.11 Analytical Models
Table 3.4: Objectives, Hypothesis Testing, Analysis and Model Estimation
Objectives Hypotheses Analytical Model Analyses Interpretation of
Results
Establish the
effects of strategy
implementation on
performance of
energy sector
institutions in
Kenya
There is no
significant effects
of strategy
implementation
on performance
of energy sector
institutions in
Kenya.
Univariate model
P = β0 + β1SI + ε
Where: P = Performance
SI = Strategy implementation
Simple
linear
regression
• R2 for goodness-of
fit
• F-test for overall
significance
• t-test for individual
significance
• Marginal changes
Determine the
intervening effect
of capital structure
on the relationship
between strategy
implementation and
performance of
energy sector
institutions in
Kenya
There is no
significant
intervening effect
of capital
structure on the
relationship
between strategy
implementation
and performance
of energy sector
institutions in
Kenya
Multivariate model for
mediation
(i) P =β0+β1SI+ε
ii. CS=β0+β1 SI+ε
iii. P = β0+β2 CS+ε
iv. P=β0+β1 SI+ β2 CS+ε
Where:
P = Performance
SI= Strategy Implementation
CS = Capital structure
β0 = Intercept, β1, β2=
Coefficient
ε =Error term
• Multipl
e linear
regressi
on and
Baron
and
Kenny’s
test
• R2 for goodness-of
fit
• Test i, ii &iii,
• If significant, move
to iv. Control SI in
model iv, if M
becomes
insignificant then
there is full
mediation if both
are significant then
there is partial
mediation
Determine the
moderating effect
of macro
environment on the
relationship
strategy
implementation and
performance of
energy sector
institutions in
Kenya
There is no
significant
moderating effect
of macro
environment on
the relationship
between strategy
implementation
and performance
of energy sector
institutions in
Kenya
Multivariate model for
moderation
i. P=β0+β1 SI +ε
ii. P=β0+β1SI+β3MC+ε
iii. P=β0+β1 SI+β4 SI* ME+ ε
Where:
P = Performance
β0 = Intercept, β1, β4, =
Coefficients
SI* ME = Interaction Term
SI= Strategy Implementation
ME= Macro Environment
Multiple
linear
regression
• R2 for goodness-
of fit
• F-test for overall
significance
• t-test for
individual
significance
• Marginal changes
• Check on R2
change if positive it
means enhancing
moderation
Determine the
moderating effect
of macro
environment on the
intervening effect
of capital structure
and performance of
energy sector
institutions in
Kenya
There is no
significant
moderating effect
of macro
environment on
the intervening
effect of capital
structure and
performance of
energy sector
institutions in
Kenya.
Moderated Mediation
Stepwise regression analysis:
M =iM +aSIi + ε
P = iY+ c’SI +b1M +b2 CS+
b3M*CS+ ε
Where;
P= Performance
CS= Capital structure
ME= Macro Environment
Multiple
linear
regression
• R2 for goodness-of
fit
• F-test for overall
significance
• t-test for individual
significance
• Marginal changes

89
3.12 Ethical Considerations
The researcher officially wrote to the target population top management for permission to conduct
the study in their institutions. Clearance from the Management University of Africa and the
National Commission of Science, Technology and Innovation was obtained before proceeding to
the field to collect data. A consent form was written to the respondents explaining the nature of
the research and confidentiality of any information obtained was assured. Using the consent forms,
the researcher was able to gain the informed consent of all the participants.
Neuman (2014) indicates that social researchers must balance between the pursuit of knowledge
on the one hand, and the rights of research participants or of others in society on the other. There
should also be a balance between potential benefits of the research outcome and its potential costs
like loss of dignity, privacy, self-esteem or democratic freedoms. It is important that ethical
considerations are taken into account in the business research process (Zikmund, Babin, Carr &
Griffin, 2010). Care must be taken while conducting social research so that the research
participants are not harmed be it physical harm, psychological abuse, stress related, loss of self-
esteem or legal jeopardy (Neuman, 2014). According to Neuman (2014), ethical principles should
ensure that research participants give informed consent in which participation is voluntary and
based on an informed decision. Participants are guaranteed privacy, anonymity and confidentiality.
Privacy was ensured by the nature of the questions which were generally non-intrusive, and were
emailed to the respondents without physical contact. Anonymity was ensured by putting in place
measures not to disclose the participant’s identity after the information is gathered. Confidentiality
required that the information collected be kept in confidence away from public disclosure
(Neuman, 2014) or sharing with others (Zikmund et al., 2010).
All participants were informed of the nature and proceedings of the study, were assured of
anonymity, and names were not required on the questionnaire. Identified information including
that they may be disclosed in the return email while submitting the completed questionnaire were
not to be made available to anyone and were stored securely to ensure data protection and
guarantee of privacy. The respondents were assured that the research was being carried out as

90
fulfilment of the requirements of a doctoral program and would not be used for any other purposes
outside the doctoral program. Data was collected and reviewed for inconsistencies and proper
methods of coding and analysis applied. Pseudonyms was used in respect of the respondents of
the institutions. The purpose of this was to ensure that anonymity and confidentiality is strictly
adhered to. Permission was sought from the respective institutions by giving self-introduction and
the purpose of the study. An introductory statement was placed on every research tool.
3.13 Chapter Summary
This chapter discussed the general methodology used in this research to answer the research
questions and to achieve the set study objectives. The research philosophy, research design, target
population, respondents of the study, data collection and instruments, data collection procedure
were discussed. The chapter also discussed piloting, hypotheses testing and ethical considerations.
Data analysis and research results and were presented in the next chapter.

91
CHAPTER FOUR: FINDINGS AND DATA ANALYSIS
4.1 Introduction
In this chapter both descriptive and inferential analysis were applied to analyze the data.
The chapter presents the demographic characteristics, descriptive statistics, inferential
statistics and test for hypothesis. The details of descriptive analysis using frequency
distribution tables, descriptive statistics such as means, standard deviations and coefficient
of variations are well presented and discussed.
Through the use of descriptive statistics, this chapter provides the premise on which further
statistical operations and analyses were carried out to test the study hypotheses. The data
analyzed were obtained through a well-structured questionnaire. For each study variable,
respondents were presented with descriptive statements in a 5-point likert scale and were
required to indicate the extent to which the statements applied in their organizations.
4.2 Response Rate
The study population comprised all key players under energy sector covering both public
and private institutions listed in the register of Energy and Petroleum Regulation Authority
February 2019. According to ERC (2019), there were 68 institutions under the energy
sector. These 68 institutions formed the target population for the study. The unit of
observation comprised of the C.E.O or the Head of the Institution and two members of
management involved in finance, operations and technical. This made it 3 respondents
from each category which accumulated to 204 employees from all the institutions.
The researcher distributed 204 questionnaires, out of which 166 responded positively by
filling and returning the questionnaires. This represented an overall positive response rate
of 81.37 percent. The remaining 18.63 percent were unresponsive even after several
follow-ups and reminders. Table 4.5 and 4.6 give results for the response rate.

92
Table 4.5: Response Rate of Study Population
Category Targeted
employees
Response of
employees
Percent
Policy & Regulation 9 7 77.78
Distribution and Transmission 6 5 83.33
Generation 189 154 81.15
Total 204 166 81.37
Table 4.6: Response Rate
Category Questionnaires
distributed
Questionnaires filled
and returned
Percent
Respondents 204 166 81.37
This response rate was comparable to similar studies by Odhiambo (2014) at 96 percent
and Nyongesa (2018) at 87.27 percent. Previous studies in a similar area which had lower
response rates include Wanambisi and Bwisa, (2013) at 67.7 percent and Oborah (2014) at
74.6 percent. Therefore, this study’s response rate is considered good for survey research
as recommended by Punch (2003) who proposes a score of 80-85 percent as good response
rate, whereas Mugenda and Mugenda (1999) suggest a 50 percent response rate is adequate,
60 percent good and above 70 percent very good. On his part, Fowler (1984) cited in Njeru,
(2013) suggests that a response rate of 60 percent is representative of the population of the
study.
4.3 Reliability and Validity Tests
Reliability refers to a measure of degree to which results from an instrument are consistent
on repeated measurements. Its goal is the estimation of measurement errors which are
normally random. It is a measure of an instrument’s internal consistency. The measurement
instrument should be reliable for it to measure consistently (Mugenda & Mugenda, 1999;
Cooper & Schindler, 2014). The test items for internal consistency or average correlation
was assessed using Cronbach's alpha. The alpha coefficient value ranging from 0 to 1 were
used. This study adopted the alpha coefficients ranges to describe reliability factors
extracted from formatted questionnaires on Likert-type scale (rating from scale 1 to 5).

93
The study used a cut off Cronbach alpha coefficient of 0.7. Different authors recommend
different cut off points for reliability. Nunally (1978) and Gliem and Gliem, (2003) indicate
that Cronbach value of 0.7 and above is considered reliable, Cooper and Schindler (2014)
suggest a range of 0.7 to 0.9 Cronbach's alpha coefficient to be good for reliability test,
while Asikhia (2009) recommends a reliability cut off point of 0.6. Hair, Babin, Anderson
and Tatham (2007) and Bagozzi and Yi (2012) instead recommend a value of 0.5 to be the
reliability cut off point necessary for further analysis. The reliability for this study had a
Cronbach cut off of 0.7.
This study adopted a cut off Cronbach value of 0.7 which is considered a strong measure
of reliability consistency as suggested by Gliem and Gliem, (2003) and Cooper and
Schindler (2006). Reliability of the survey instrument was thus established by carrying out
a pilot study on firms who were required to respond to the questionnaire and report any
ambiguous questions, identify any defects in the questions or lack of clarity in the
instructions as well as suggest any changes. Hair et al. (2007) suggests that a pretest of 5
to 10 respondents selected from the targeted population is sufficient enough to allow
validation of a questionnaire. The results of the reliability tests are summarized in Table
4.7

94
Table 4.7: Cronbach’s Alpha Reliability Coefficients
Variable Components of Variables Cronbach’s
Alpha
Number
of items
Decision
Strategy
Implementation
-Leadership
-Structure
-Responsibility and Accountability
-Culture
.906 20 Reliable
Macro
Environment
-Political
-Ecological
-Social
-Technology
.921 26 Reliable
Capital
Structure
-Cost of capital
-Covenants
-Debt
-Equity
.749 19 Reliable
Performance
-General performance
-Service delivery
.853 14 Reliable
As shown in Table 4.7, the alpha coefficients for all the variables are above the 0.7
threshold. This was confirmation of reliability of the data used to draw conclusions from
theoretical concepts. Cronbach’s alpha coefficient ranged from 0.749 (Capital structure) to
0.921 (macro environment) revealing a high degree of reliability of the instrument. The
results indicate that all constructs had high scores of reliability coefficients. This implies
that all the variables had a reliable index measure indicating that the instrument was reliable
in collecting data. The findings of this study are consistent with the findings of Creswell
and Clark (2017) who asserted that the reliability score of more than 70 percent is sufficient
for performing of other statistical tests.
Validity refers to the questionnaire’s ability to measure what is intended meaningfully and
describe the construct accurately (Cooper & Schindler, 2014). Validity is used in science
as an evaluation criterion on whether conclusions made in a study explain what happened
accurately. Aiken, West and Reno (1991) further stated that validity refers to whether the
research instrument is able to produce the expected measurement in a study.

95
Pre-testing for validity of the questionnaire initially involved a few respondents from the
study population to improve the instrument. Construct and criterion validity were carried
out on the instrument by pilot testing 24 respondents from the 3 categories to establish if
the respondents could answer the responses. The final survey included this pilot group.
Construct validity shows how the instrument is measuring the target construct (Zapolski,
Guller & Smith, 2012). In extracting the factors, Principal Component Analysis was used
and Varimax rotation method applied to rotate the factors.
4.4 Factor Analysis
Factor analysis (FA) was employed to test for convergent validity, discriminate validity
and construct validity. It was performed by use of Kaiser-Meyer-Olkin (KMO) and
Bartlett's Test for sampling adequacy to test various types of validity including construct,
discriminant and convergent validity. The study results are presented in Table 4.8
Table 4.8: Summary of Kaiser-Meyer-Olkin and Bartlett’s Test
Variable KMO Bartlett’s Test of Sphericity
Chi-square (χ) Df Sig. Level
Strategy Implementation .715 719.563 231 .000
Macro Environment .807 468.864 136 .000
Capital Structure .830 5843.112 171 .000
Performance .794 1000.423 91 .000
The results indicate that the sampling adequacy for all the variables under study showed
adequacy in the respective samples. Strategy implementation (KMO=.715, Chi-square (χ)=
719.563, df=231 and sig. level=0.000); Macro Environment (KMO=.807, Chi-square (χ)=
468.864, df=136 and sig. level=0.000), Capital Structure (KMO=.830, Chi-square (χ)=
5843.112, df=171 and sig. level=0.000), Performance (KMO=.794, Chi-square (χ)=
1000.423, df=91 and sig. level=0.000). All the variables showed varied factor loadings

96
therefore implying that they closely measure the dependent variable. This result indicates
a highly significant relationship among variables. According to Ghazali (2008), any item
with KMO score ranging from .70 to .99 is deemed valid and reliable for making further
statistical analysis. From the statistical analysis as shown above, all the KMO score was
significant with a value greater than 0.70 which implied that all the items captured were
valid for making further statistical analysis on the dataset.
4.5 Tests for Normality, Multicollinearity, Homoscedasticity and Linearity
In this study, several tests were used to test for linearity, normality, multicollinearity and
homogeneity. Prior to performing the inferential analyses, statistical assumptions were
tested to establish whether the data met the normality, linearity, independence,
homogeneity and collinearity assumptions. It was on the basis of these results, that the
measures of central tendency, dispersion, tests of significance, tests of associations and
prediction were performed. Bolker et al., (2009) indicated that all data is considered to have
been included in the model if the basic assumptions are met. Otherwise information had
been left on violation of these assumptions. Data multicollinearity, homogeneity and
normlity were tested after which the model was applied to analyse results of the regression
and significance testing of the slopes. The objective of the regression analysis was to
predict the strength and direction of association between the study variables.
Use of inferential parametric statistical procedures requires that the data to be tested is
normally distributed. Ghasemi and Zahediasl (2012) noted that the assumption of normality
needs to be checked before carrying out any parametric test, because validity depends on
it. Normality test was intended to ascertain whether data was distributed normally. When
normality is absent using statistical tests that assume normality may not be appropriate.
The Shapiro-Wilk test was employed to test for normality. This test establishes the extent
of normality of the data by detecting existence of skewness or kurtosis or both. Shapiro-
Wilk statistic ranges from zero to one with figures higher than 0.05 indicating that the data
is normal (Razali & Wah, 2011). The results are presented in Table 4.9.

97
Table 4.9: Shapiro-Wilk Test of Normality
Tests of Normality
Kolmogorov-Smirnova Shapiro-Wilk
Statistic df Sig. Statistic df Sig.
Strategy
Implementation .172 166 .200* .797 166 .106
Macro Environment .106 166
.200* .913 166
.116
Capital Structure .111 166
.159 .890 166
.059
Performance .152 166
.000 .864 166
.600
*. This is a lower bound of the true significance.
a. Lilliefors Significance Correction
Normality test using the Shapiro-Wilk showed that all the variables were above 0.05 (p >
0.05) hence confirming data normality. Normality assumes that the sampling distribution
of the mean is normal. As shown in Table 4.9, p-values for the Shapiro-Wilk tests were
0.106 for strategy implementation, 0.116 for Macro environment, 0.059 for capital
structure and 0.600 for firm performance.
Since all the p-values were greater than the cutoff point of 0.05, this confirms the
hypothesis that data was collected from a population which is normally distributed. Data
normality was also demonstrated by the plotted Q-Q plot and normal histograms. Q-Q
plots are as presented in Figures 4.2, 4.3, 4.4 and 4.5. The normal distribution had a good
fit for the study variables.

98
Figure 4.2: Normal Quantile-Quantile Plot of Data on Strategy Implementation
The findings in Figure 4.2 shows that data was normal since most of the cases were
observed to cleave along the best fit line. The few cases of the observed values that cleaved
away from the straight line can be taken care of by the large sample (n ≥ 30). This
demonstrates a good fit and therefore normal data on strategy implementation variable.
According to Mordkoff (2012), the assumption of normality turns out to be relatively
uncontroversial, at least when large samples are used, such as N ≥ 30.

99
Figure 4.3: Normal Quantile-Quantile Plot of Data on Macro Environment
Figure 4.3 shows that data was normal since most of the cases were observed to cleave
along the best fit line. The few cases of the observed values that cleaved away from the
straight line can be taken care of by the large sample (n ≥ 30). According to Mordkoff
(2012), the assumption of normality turns out to be relatively uncontroversial, at least when
large samples are used, such as N ≥ 30.

100
Figure 4.4: Normal Quantile-Quantile Plot of Data on Capital Structure
Figure 4.4 shows that data was normal since most of the cases were observed to cleave
along the best fit line. The few cases of the observed values that cleaved away from the
straight line can be taken care of by the large sample (n ≥ 30). According to Mordkoff
(2012), the assumption of normality turns out to be relatively uncontroversial, at least when
large samples are used, such as N ≥ 30.

101
Figure 4.5: Normal Quantile-Quantile Plot of Data on Performance
Figure 4.5 shows that data was normal since most of the cases were observed to cleave
along the best fit line. The few cases of the observed values that cleaved away from the
straight line can be taken care of by the large sample (n ≥ 30). According to Mordkoff
(2012), the assumption of normality turns out to be relatively uncontroversial, at least when
large samples are used, such as N ≥ 30.
Multicollinearity test was conducted to assess whether high correlation existed between
one or more variables in the study with one or more of the other independent variables.
Multicollinearity is a phenomenon whereby high correlation exists between the
independent variables. Multicollinearity occurs in a multiple regression model when high
correlation exists between these predictor variables leading to unreliable estimates of
regression coefficients. This leads to strange results when attempts are made to determine
the extent to which individual independent variables contribute to the understanding of
dependent variable (Creswell, 2014).

102
The consequences of multicollinearity are increased standard error of estimates of the
Betas, meaning decreased reliability and often confusing and misleading results. Variable
Inflation Factor (VIF) measured correlation level between the predictor variables and
estimated the inflated variances due to linear dependence with other explanatory variables.
A common rule of thumb is that VIFs of 10 or higher (conservatively over 5) points to
severe multi-collinearity that affects the study (Newbert, 2008). A tolerance threshold
value of below 0.2 indicates that collinearity is present (Menard, 2000). Table 4.10 presents
the result of tests for Multicollinearity.
Table 4.10: Test for Multicollinearity
Model Collinearity Statistics Comment
Tolerance VIF
(Constant)
Strategy Implementation .535 1.869 No multicollinearity
Macro Environment .529 1.891 No multicollinearity
Capital Structure .631 1.584 No multicollinearity
As shown in Table 4.10 the results revealed no problem with multicollinearity. The
variables of the study indicated VIF values of between 1.584 and 1.891 which is less than
the VIFs value of 10 or higher figure recommended by the rule of thumb. Therefore, the
data set investigated displayed no multicollinearity.
Homoscedasticity was measured by Levene’s test. This test examines whether or not the
variance between independent and dependent variables is equal. If the Levene’s Test for
Equality of Variances is statistically significant α= 0.05 this indicates that the group
variances are unequal. It is a check as to whether the spread of the scores in the variables
are approximately the same.

103
Table 4.11: Test of Homogeneity of Variances
Variable Levene’s Statistic df1 df2 Sig.
Strategy Implementation 2.282 24 128 .102
Macro Environment 2.124 24 128 .204
Capital Structure 1.161 24 128 .290
a. Predictors: (Constant), Strategy, Macro environment, Capital structure
b. Dependent Variable: Performance
As presented in Table 4.11, the significant values for the Levene’s test were 0.102 for
strategy implementation, 0.204 for Macro environment and 0.290 for Capital structure.
From the results in Table 4.11, P-values of Levene’s test for homogeneity of variances
were all greater than 0.05. The test therefore was not significant at α= 0.05 confirming
homogeneity.
The study used scatterplots to test for linearity. Scatter plot shows a visual impression of
the relationship between the independent and dependent variables. The relationship may
be positive (both dependent and independent variables moving in the opposite directions),
negative, meaning that dependent and independent variables moving in the opposite
directions or none at all, thus, no clear pattern of linear relationship. The absence of a linear
relationship between independent variables and the dependent variables influences the
outcomes of the regression linear analysis to mis-approximate the true relationship.
Regression models only estimate the relationship between the dependent and independent
variables if the relationship is linear, hence the need to test of linearity assumption. As
shown in the scatter plot below there exist a moderate positive linear relationship between
the independent variables (strategy implementation, macro environment and capital
structure) and the dependent variable (Performance). That is, as independent variables
increase, dependent variables also increase. This shows that the relationship supports the
assumption of linearity.

104
Figure 4.6: Test for Linearity for Strategy Implementation
Figure 4.7: Test for Linearity for Macro Environment

105
Figure 4.8: Test for Linearity for Capital Structure
4.6 Employee Demographic Profile
The study sought to establish the demographic profile of respondents and hence
respondents were requested to indicate their age distribution and highest level of education.
The age of the employees in organizations is an important factor because it determines how
well they can interpret the environment (Miles & Snow, 1978). Therefore, adapt to changes
from the environment (Bourgeois & Elsenhardt, 1988) and consequently make decisions
for their organizations that would eventually influence performance. Education is the level
of academic and professional qualifications that is possessed by employees. It is an
indicator of their knowledge, skills and capability (Horwitz, 2005). Education can
influence decisions made in respect to the need for building valuable strategy
implementation leading to overall performance. The results on the demographic profiles of
respondents are presented in Table 4.12.

106
Table 4.12: Respondents’ Demographic Profiles
Demographic Profiles Frequency Percentage (%)
Age Bracket
Under 25 years 2 1.2
25 – 34 years 12 7.2
35 - 44 years 67 40.4
45- 54 years 77 46.4
55 years and Above 8 4.8
Total 166 100.0
Highest Academic
Qualifications
Diploma 14 8.4
Graduate Degree 107 64.5
Master’s Degree 45 27.1
Total 166 100.0
The results in Table 4.12 show that 46.4 percent of employees were in the age bracket 45-
54 years and 35-44 years at 40.4 percent. other respondents were in age bracket 25-34 years
at 7.2 percent, 55 years and above at 4.8 percent and under 25 years at 1.2 percent. these
findings indicated that most of the respondents were within the active age of 35-54 years.
This is an indication that in the energy sector most of the employees in management
positions managers were within the active age and hence could actively interpret innovative
environment to boost performance. Further, it indicates that most managers, being in the
active ages, they are receptive to technological changes in the energy sector.
The study further sought to establish the education level of the employees in the energy
sector. The results indicated that majority of the respondents 64.5 percent, had Graduate
degree as the highest academic qualification followed with those that had Master’s degree
as the highest qualification at 27.1 percent. Those with diploma as highest academic
qualification were 8.4 percent. This was a clear indication that education levels of
employees were considered as important and most of them were well educated. Employees
with higher levels of education and especially those in management positions perform their
duties better because higher education provides them with the knowledge and skills as well

107
as have the capacity and expertise to steer organization’s success. According to Kariuki et
al. (2012) an individual’s level of formal education reflects cognitive abilities and qualities.
High levels of formal education are associated with a high ability to process information
and to discriminate between varieties of alternatives. The results thus indicate that the
respondents had the ability to make informed decisions that could influence performance
of institutions in the energy sector.
4.7 Institutional Demographic Profile
The firms that were studied manifested demographic profiles. The firm profile
demographics that were considered in the study include years organization has been in
existence, number of employees the organization has and type of institution. These firm
characteristics established in the study are all summarized in the table 4.13.
Table 4.13: Institutional Demographic Profile
Institutional Demographic Frequency Percentage
(%)
Years Organization has been in operation
5 to 10 years 13 7.8
11 to 15 years 10 6.0
16 to 20 years 111 66.9
Over 20 years 32 19.3
Total 166 100.0
Number of employees in the organization
1 to 50 3 1.8
101 to 200 17 10.2
201 to 300 79 47.6
Over 300 67 40.4
Total 166 100.0
Type of Institution
Regulation 7 4.2
Generation 154 92.8
Distribution 5 3.0
Total 166 100.0

108
Results of the findings indicate that most of the surveyed institutions had been in operation
for 16 to 20 years at 66.9 percent. Other institutions had been in operation for over 20 years
at 19.3 percent, 11-15 years at 6 percent and 5 o 10 years of operation at 7.8 percent. The
findings therefore suggest that majority of the firms having been in the industry for long
are in position to innovate and make informed decisions on environmental issues that affect
operation and have best strategy implementation in place. Old firms have a better
experience on handling clients and hence because of this experience in the market, they are
able to attract many clients. Despite the positive impact that age has on performance of a
firm, other studies indicated that older firms are highly inertial and tend to become
increasingly ill-suited to cope with changing competitive environment. Additionally, the
more years of operation of institutions in this sector could be explained by strict
requirements of operation hence only limited firms operate to give affordable, clean and
sustainable energy.
The findings further indicated that majority of the surveyed institutions had 201-300
employees at 47.6 percent and over 300 employees at 40.4 percent. Other firms had 101-
200 employees at 10.2 percent and 1 to 50 employees at 1.8 percent. The findings indicate
that majority of the firms (47.6%) were large in size based on the number of employees
recorded which could be attributed to the many years of operation that has seen the
companies expand in business and operation as well as recruit more employees. The study
further sought to establish the category of operation the institutions surveyed operated in.
The findings indicate that majority of the surveyed institutions were in generation of energy
at 92.8 percent while other firms were in regulation at 4.2 percent and in distribution at 3
percent.

109
4.8 Effects of Strategy Implementation on Performance of Energy Sector
Institutions in Kenya
The study focused on how the key variables were manifested in different institutions in
energy sector in Kenya. This was determined through presenting statements in each of the
study sub variables to be responded to in line with how the manifestation occurred. The
key study variables included strategy implementation, capital structure, macro
environment and performance. The results were derived and discussed in the following
subsections.
To determine the dimensions of strategic implementation that influenced performance,
statements to measure this aspect were developed. The respondents were asked to rate
factors on strategic implementation on a Likert scale of 1(strongly disagree) to 5 (strongly
agree) as applied in the energy sector. Table 4.14 gives the results of the findings.
Table 4.14: Strategy Implementation Dimensions
Strategy Implementation N Mean Std.
Deviation
Coefficient
of Variation
(percent)
Leadership
My leader ensures that employees have
adequate knowledge, experience and skills to
perform their work
166 4.27 .443 10
The vision of our leaders is aligned to our
strategy
166 4.27 .443 10
My organization gives adequate information,
encourages employee feedback and
participation before a new strategy is
implemented
166 4.23 .421 10
Employees have annual performance targets
linked to our strategic goals
166 4.18 .416 10

110
Strategy Implementation N Mean Std.
Deviation
Coefficient
of Variation
(percent)
Adequate resources are allocated to support
delivery of strategic goals
166 4.02 .373 9
My leader ensures that employees are
rewarded equitably based on their work
performance and achievement of set
objectives.
166 4.01 .389 10
The leadership in my organization
demonstrates commitment to strategy
implementation in order to achieve the set
strategic objectives
166 4.11 .355 9
Overall Mean 166 4.16 0.406 10
Structure
My organization structure supports our
strategy and is revised regularly to match the
changes in strategy requirements.
166 4.03 .473 12
My organization is governed by a clear system
of policies, rules, regulations, and procedures
which guide implementation of strategy.
166 4.20 .400 10
My organization’s structure allows quick
timely decisions and feedback during
implementation of strategy to ensure we
achieve our goals
166 4.08 .412 10
Overall Mean 166 4.10 0.428 10
Responsibility and Accountancy
Decision-making is mainly done by top
management and managers must consult in
most cases
166 4.01 0.561 14

111
Strategy Implementation N Mean Std.
Deviation
Coefficient
of Variation
(percent)
The management encourage employees to
conduct continuous research to improve
products and services.
166 4.09 0.394 10
All employees of our company including
those at the lower level are held accountable
for achievement of the goals of the company
166 4.07 0.390 10
The middle managers are better in strategy
implementation as compared to senior
managers
166 3.02 0.572 19
Overall Mean 166 3.80 0.479 13
Culture
The management encourages employees to be
creative, try new methods and conduct
continuous research to improve products and
services
166 4.07 0.333 8
My organization is like a family where
everyone is focused on smooth
implementation of strategies in order to
achieve set goals
166 3.93 0.689 18
My organization has precise rules, procedures
and methods for implementing strategic
objectives
166 4.01 0.412 10
My organization regularly reviews and
measures progress against set targets as teams
when implementing strategies
166 3.98 0.460 12
My organization encourages teamwork
among employees
166 4.14 0.466 11

112
Strategy Implementation N Mean Std.
Deviation
Coefficient
of Variation
(percent)
In my organization problems affecting
strategy implementation are addressed openly
and resolved
166 4.08 0.440 11
Overall Mean 166 4.04 0.467 12
Grand Mean 166 4.03 0.445 11
The grand mean of statements depicting strategy implementation was 4.03, standard
deviation of 0.445 and coefficient of variation of 11 percent, a high mean indicating that
strategy implementation played a key role in influencing performance of institutions in the
energy sector, that is, success of any organization depends on how strategy employed is
implemented. The findings further indicated that on aspects of strategy implementation,
leadership had the highest mean of 4.16, standard deviation of 0.406 and coefficient of
variation of 10 percent. Leadership cover all aspects of dealing within and outside of an
organization, handling or dealing with conflicts, helping and guiding the workforce to
achieve and accomplish their tasks and appearing as a role model for all. Strategic
leadership brings interaction between leaders and their followers and how such leaders
influence the said followers in pursuing certain organizational goals. Strategic leaders
define key and crucial organizational strategic change moments, create appropriate
strategies and translate such strategies to actions in operational terms for the change
direction required. Therefore, strategic leadership is required to harness and deploy
requisite organizational capabilities that allow the organizations achieve their goals and
objectives through formulating and implementing necessary strategies to ensure successful
performance.
Statements depicting leadership were My leader ensures that employees have adequate
knowledge, experience and skills to perform their work (Mean=4.27, SD=0.443 and
CV=10 percent), The vision of our leaders is aligned to our strategy (Mean=4.27,

113
SD=0.443 and CV=10 percent), My organization gives adequate information, encourages
employee feedback and participation before a new strategy is implemented (Mean=4.23,
SD=0.421 and CV=10 percent), Employees have annual performance targets linked to our
strategic goals (Mean=4.18, SD=0.416 and CV=10 percent), The leadership in my
organization demonstrates commitment to strategy implementation in order to achieve the
set strategic objectives (Mean=4.02, SD=0.373 and CV=9 percent), Adequate resources
are allocated to support delivery of strategic goals (Mean=4.01, SD=0.389 and CV=10
percent).
The findings indicated that leaders in institutions in the energy sector ensured that
employees had adequate knowledge and skills to perform their duties, encouraged
employee participation in formation and implementation of strategy as well as provided
adequate resources for strategy implementation, all these geared for better organization
performance. Hence from the findings, leaders in organizations in the energy sector play a
crucial role in steering the organizations for better performance which is achieved by the
leaders coming up with ways of advancing the organizations key mandate in the face of
scarce resources, linking job performance to valued rewards and by ensuring employees
have the resources needed to get the job done and therefore performance in the
organizations. On structure, the average mean recorded in the study was 4.10, standard
deviation of 0.428 and coefficient of variation of 10 percent, a high mean indicating that a
good structure is necessary to promote coordination in an organization by ensuring that
people across the organization know what to do and to ensure that they stay focused on the
key targets under everyday pressures.
An organization structure provides a mechanism for keeping today's actions in congruence
with tomorrow's goals. Statements on structure were My organization is governed by a
clear system of policies, rules, regulations, and procedures which guide implementation of
strategy (Mean=4.20, SD=0.400 and CV=10 percent), My organization’s structure allows
quick timely decisions and feedback during implementation of strategy to ensure we

114
achieve our goals (Mean=4.08, SD=0.412 and CV=10 percent), My organization structure
supports our strategy and is revised regularly to match the changes in strategy requirements
(Mean=4.03, SD=0.473 and CV=12 percent).
On structure the findings established that there was a clear system that outlined rules and
regulation in strategy implementation and that the institutions indicated high level of
respect in terms of employees’ ideas, and opinions as they were allowed to participate in
the organizational decision-making process by giving feedbacks in the implementation of
strategy. On statements depicting culture, the average mean established in the study was
4.04, standard deviation of 0.467 and coefficient of variation of 12 percent, a high mean
indicating that culture had a great influence on performance. Statements on culture were
My organization encourages teamwork among employees (Mean=4.14, SD=0.466 and
CV=12 percent), In my organization problems affecting strategy implementation are
addressed openly and resolved (Mean=4.08, SD=0.440 and CV=11 percent), The
management encourages employees to be creative, try new methods and conduct
continuous research to improve products and services (Mean=4.07, SD=0.333 and CV=8
percent), My organization has precise rules , procedures and methods for implementing
strategic objectives (Mean=4.01, SD=0.412 and CV=10 percent), My organization
regularly reviews and measures progress against set targets as teams when implementing
strategies (Mean=3.98, SD=0.466 and CV=11 percent), My organization is like a family
where everyone is focused on smooth implementation of strategies in order to achieve set
goals (Mean=3.93, SD=0.689 and CV=18 percent).
The findings indicated that organization culture was essential during strategy
implementation as it ensured organizations promoted teamwork among employees,
effectively addressed problems encountered during strategy implementation on a timely
basis and also encouraged everyone to be focused on smooth implementation of strategies
in order to achieve set goals. Strategies implemented within an organization that support
the culture associated with the firm enhances organizational performance. The proposed

115
strategy should preserve, emphasize, and enhance the culture, in accordance with the
culture supporting the proposed strategy. Therefore, from the findings strategies to be
implemented must be consistent with organizational culture to realize the desired
organizational performance results.
On responsibility and accountancy, the average mean was 3.80, standard deviation of 0.479
and coefficient of variation of 13 percent, a relative moderate mean indicating that
attributes of responsibility and accountability in the surveyed institutions were found to
influence firm performance to a moderate extent. Statements depicting responsibility and
accountancy were The management encourage employees to conduct continuous research
to improve products and services (Mean=4.09, SD=0.394 and CV=10 percent), All
employees of our company including those at the lower level are held accountable for
achievement of the goals of the company (Mean=4.07, SD=0.390 and CV=10 percent),
Decision-making is mainly done by top management and managers must consult in most
cases (Mean=4.01, SD=0.561 and CV=14 percent), and The middle managers are better in
strategy implementation as compared to senior managers (Mean=3.02, SD=0.572 and
CV=19 percent).
The findings indicated that there was effective accountability in the surveyed institutions
as each employee was held accountable for achievement of goals in the companies.
Additionally, top managers were responsible for decision making process assisted by other
middle managers and staff. From the findings it is evident that there was effective
leadership by the top management through creation and sharing of organizational goals,
acting as a role model, encouraging creativity, providing support for employees, and
allowing employee participation in making job-related decisions which influenced
employees’ attitude and reflected in their performance. In general, the findings suggested
that effective strategy implementation should devise internal action approaches, develop
effective strategies to improve organizational performance, attain clarity of future
direction, promote team work and expertise based on resources, deal effectively with

116
organizational changes and uncertainties in external environment, processes and people
and make appropriate choices and priorities in order to achieve better organizational
performance. The regression results were presented in section 4.15
Table 4.15: Regression Test of the Effect of Strategy Implementation
Model Summary
Model R R Square Adjusted R Square Std. Error of the Estimate
1 .716a .513 .510 .30712
a. Predictors: (Constant), strategy implementation
ANOVAa
Model
Sum of
Squares Df Mean Square F Sig.
1 Regression 16.309 1 16.309 172.902 .000b
Residual 15.469 164 .094
Total 31.778 165
a. Dependent Variable: performance
a. Predictors: (Constant), strategy implementation
Coefficients
Model
Unstandardized
Coefficients
Standardized
Coefficients
T Sig. B Std. Error Beta
1 (Constant) 1.771 .195 9.083 .000
Strategy
implementation .598 .046 .716 13.149 .000
a. Dependent Variable: performance
P =1.771 +.598 SI
The results in Table 4.15 indicate that there is a strong association between strategy
implementation and performance (R=.716). The coefficient of determination R2 =.513
implies that strategy implementation explains 51.3 percent of the variation in performance.
The other variables not included in this study explain the remaining 48.7 percent. This
result shows a strong influence of strategy implementation on performance. The overall
model was statistically significant (F = 172.902, P-value < 0.05). The results of the beta
coefficient showed that a unit increase in strategy implementation will cause a .716
increase in performance (B=1.771, t=13.149, p<0.05) suggesting that the influence of

117
strategy implementation on performance was statistically significant. Additionally, in the
absence
of strategy implementation, organizational performance will be constant at 1.771. This
implies, overall, strategy implementation is a good predictor of performance. The findings
thus were sufficient to reject the first hypothesis this implies that strategy implementation
significantly influence performance and therefore the hypothesis that Strategy
implementation has no significant effect on performance of energy sector institutions in
Kenya was rejected and the alternative hypothesis accepted.
Based on the outcomes of the results of the regression analysis, the model becomes
P=1.771 +.598 SI
Where P was performance and SI is strategy implementation.
On performance, respondents were asked to rate factors depicting performance of
institutions in the energy sector on a Likert scale of 1(strongly disagree) to 5 (strongly
agree). Table 4.16 gives the results of the findings.
Table 4.16: Performance Attributes
Performance N Mean Std.
Deviation
Coefficient
of
Variation
(percent)
Performance agreements have enhanced
performance at my organization
166 4.45 0.666 15
The reward structure at my organization
has enhanced performance
166 4.35 0.737 17
Strategic alignment with organization
goals and objectives have enhanced
performance
166 4.33 0.796 18
Performance appraisal is conducted to
check on the performance
166 4.25 0.726 17
Organization conceptualizes continuous
innovativeness as a tool in strategy
execution
166 4.18 0.749 18

118
Performance N Mean Std.
Deviation
Coefficient
of
Variation
(percent)
My organization has enough skilled and
experienced employees to achieve high
performance
166 4.33 0.715 17
Overall Mean 166 4.32 0.732 17
Performance (Service Delivery)
Quality of outputs is high (e.g. reliability
of service delivery).
166 4.33 0.766 18
Quantity of outputs is adequate (e.g.
volume of service delivery).
166 4.27 0.689 16
Value for Money is high (e.g. cost per unit
of service delivery).
166 4.20 0.780 19
Effectiveness (e.g. whether your
objectives were achieved).
166 4.37 0.664 15
Citizen satisfaction is high 166 4.23 0.947 22
Financial (e.g. services are fairly
distributed amongst shareholders).
166 4.37 0.789 18
Innovation is high 166 4.34 0.828 19
Overall performance is excellent 166 4.54 0.535 12
Overall Mean 166 4.33 0.750 17
Grand Mean 166 4.33 0.741 17
The grand mean of statements depicting performance was 4.33, standard deviation of
0.741 and coefficient of variation of 17 percent. On performance measured in terms of
service delivery, the average mean depicted in the study was 4.33, standard deviation of
0.750 and coefficient of variation of 17 percent. Statements on service delivery were
Overall performance is excellent (Mean=4.54, SD=0.535 and CV=12 percent), Financial
(e.g. services are fairly distributed amongst shareholders) (Mean=4.37, SD=0.789 and
CV=18 percent), Effectiveness (e.g. whether your objectives were achieved) (Mean=4.37,
SD=0.664 and CV=15 percent), Innovation is high (Mean=4.34, SD=0.828 and CV=19
percent), Quality of outputs is high (e.g. reliability of service delivery) (Mean=4.33,
SD=0.766 and CV=18 percent), Quantity of outputs is adequate (e.g. volume of service

119
delivery) (Mean=4.27, SD=0.689 and CV=16 percent), Citizen satisfaction is high
(Mean=4.23, SD=0.947 and CV=22 percent), Value for Money is high (e.g. cost per unit
of service delivery) (Mean=4.20, SD=0.780 and CV=19 percent). The findings indicated
that on service delivery, the surveyed firms delivered quality outputs as the citizens were
satisfied with the services they received from the institutions. Additionally, there was
value for money that is services offered were efficient. The findings further indicated that
the institutions in the energy sector had achieved objectives which led to conclusion of
effective firm performance.
The findings established that there was good operation and efficiency in the firms
surveyed. The organization should focus on operational efficiency which is not just about
cutting the company costs and expenses but largely looking at how the back end of the
company and the operations of the company as a whole are taking place. The approach
that will ensure consistent healthy profits is not only for a firm to look at what it is doing
but more so to how it is doing it, and how it is offering its goods and services to its
customers. Well-structured organizations can operate on low cost, create healthier
environment and therefore increase its profits.
The average mean recorded for general performance was 4.32, standard deviation of 0.732
and coefficient of variation of 17 percent. Statements on general performance were
Performance agreements have enhanced performance at my organization (Mean=4.45,
SD=0.666 and CV=15 percent), The reward structure at my organization has enhanced
performance (Mean=4.35, SD=0.737 and CV=17 percent), Strategic alignment with
organization goals and objectives have enhanced performance (Mean=4.33, SD=0.796
and CV=18 percent), My organization has enough skilled and experienced employees to
achieve high performance (Mean=4.33, SD=0.715 and CV=17 percent), Performance
appraisal is conducted to check on the performance (Mean=4.25, SD=0.726 and CV=17
percent), Organization conceptualizes continuous innovativeness as a tool in strategy
execution (Mean=4.18, SD=0.749 and CV=18 percent). The study results from the

120
surveyed firms showed that they recognized the importance of good treatment to
employees and offering of rewards in ensuring a good working environment as well as
motivation to employees. Employee recognition is an important aspect to be considered
for any firm to succeed. Annual employee appraisals are not just enough, employees need
regular and frequent feedbacks. Where the management teams provide regular feedback,
employees are normally motivated to constantly maintain good performance.
4.9 Intervening Effect of Capital Structure on the Relationship Between Strategy
Implementation and Performance of Energy Sector Institutions in Kenya
The dimensions of capital structure that were hypothesized to affect performance of
institutions in the energy sector were cost of capital, covenants, debt and equity. The
respondents were asked to rate factors on capital structure on a Likert scale of 1(strongly
disagree) to 5 (strongly agree) as applied in the energy sector. Table 4.17 gives the results
of the findings.
Table 4.17: Capital Structure Dimensions
Capital Structure N Mean Std.
Deviation
Coefficient
of Variation
(percent)
Cost of Capital
An aggressive financing policy is
important for the firm
166 4.82 0.430 9
Investors are likely to invest in a firm
where shareholders have a stake
166 4.82 0.386 8
Firms rank internal sources of finance
higher than external sources
166 4.51 0.932 21
My organization ensures cost of capital is
minimized while maximizing the value of
the firm
166 4.25 0.463 11
My organization creates benchmark to
evaluate its performance and discount rate
for evaluating capital investments
166 4.17 0.467 11

121
Capital Structure N Mean Std.
Deviation
Coefficient
of Variation
(percent)
My organization employs’ financial ratios
for business analysis
166 4.11 0.528 13
Overall Mean 166 4.45 0.534 12
Covenants
My organization has debt agreements with
the external financiers
166 4.01 0.534 13
Stakeholder are given right of partial
information disclosure to the company’s
debt holder
166 4.01 0.534 13
Investors are protected from extravagant
investments by the covenants
166 3.74 0.622 17
My organization has large assets which
could be used to act as collateral for
securing the loans.
166 3.99 0.447 11
Overall Mean 166 3.94 0.534 14
Debt
The firm has a mix of debt and equity in
its capital structure
166 3.85 0.629 16
The survival of my business is highly
dependent on the country’s economy
166 4.55 0.751 17
The organization prefers internal funding
to external funding
166 3.27 0.832 25
High levels of debt in a firm’s capital
structure may cause liquidity problems
166 3.86 0.622 16
Excessive use of debt can lead to higher
financial distress costs
166 3.90 0.619 16
There are tax savings associated with use
of debt as a source of financing
166 4.05 0.531 13
Overall Mean 166 3.91 0.664 17
Equity
Equity element in a firm’s capital
structure is attractive to lenders
166 4.08 0.440 11
My organization’s net income is greater
than ordinary shareholders’ equity
166 3.96 0.452 11

122
Capital Structure N Mean Std.
Deviation
Coefficient
of Variation
(percent)
My organization’s leverage ratio is
inversely related to market-to-book equity
ratio.
166 3.75 0.639 17
Overall Mean 166 3.93 0.510 13
Grand Mean 166 4.06 0.561 14
The grand mean of statements on capital structure was 4.06, standard deviation of 0.561
and coefficient of variation of 14 percent, a high mean indicating that capital structure
decisions play a key role in the overall firm strategy in order to enhance shareholder firm
value in Energy sector institutions. On factors of capital structure, cost of capital had the
highest mean of 4.45, standard deviation of 0.534 and coefficient of variation of 12 percent.
Statements on cost of capital were An aggressive financing policy is important for the firm
(Mean=4.82, SD=0.430 and CV=9 percent), Investors are likely to invest in a firm where
shareholders have a stake (Mean=4.82, SD=0.386 and CV=8 percent), Firms rank internal
sources of finance higher than external sources (Mean=4.51, SD=0.932 and CV=21
percent), My organization ensures cost of capital is minimized while maximizing the value
of the firm (Mean=4.25, SD=0.463 and CV=11 percent), My organization creates
benchmark to evaluate its performance and discount rate for evaluating capital investments
(Mean=4.17, SD=0.467 and CV=11 percent), My organization employees financial ratios
for business analysis (Mean=4.11, SD=0.528 and CV=13 percent).
The findings indicated that an appropriate and strategic financial policy was a crucial factor
to be considered for efficient financial performance of an organization. Additionally, for
effective firm performance, the surveyed institutions ensured that they minimized cost of
capital in order to maximize profits for their organizations as well as adopted benchmark
programs which constantly evaluated performance. The choice of financing makes cost of
capital a crucial variable for every organization since it determines the company’s capital

123
structure and hence firms ought to develop and implement right strategies which provide
adequate funding and as well as minimize cost of capital for improved firm performance.
The average mean on statements on covenants was 3.94, standard deviation of 0.534 and
coefficient of variation of 14 percent. Statements depicting covenants were My
organization has debt agreements with the external financiers (Mean=4.01, SD=0.534 and
CV=13 percent), Stakeholder are given right of partial information disclosure to the
company’s debt holder (Mean=4.01, SD=0.534 and CV=13 percent), My organization has
large assets which could be used to act as collateral for securing the loans (Mean=3.99,
SD=0.447 and CV=11 percent), Investors are protected from extravagant investments by
the covenants (Mean=3.74, SD=0.622 and CV=17 percent). The findings indicated
presence of debt covenant of the surveyed firms with external financiers and that most of
the firms had large assets to be used as security when acquiring loans. Effective debt
covenants facilitate development and implementation of right strategies that steer a firm to
increase its income to enable it clear debt and enjoy profits hence better performance.
On equity, the average mean recorded was 3.93, standard deviation of 0.510 and coefficient
of variation of 14 percent. Statements on equity were Equity element in a firm’s capital
structure is attractive to lenders (Mean=4.08, SD=0.452 and CV=11 percent), My
organization’s net income is greater than ordinary shareholders’ equity (Mean=3.96,
SD=0.452 and CV=11 percent), My organization’s leverage ratio is inversely related to
market-to-book equity ratio (Mean=3.75, SD=0.639 and CV=17 percent). Lastly on debt,
the average mean depicted by the findings was 3.91, standard deviation of 0.664 and
coefficient of variation of 17 percent. Statements on debt were The survival of my business
is highly dependent on the country’s economy (Mean=4.55, SD=0.751 and CV=17
percent), There are tax savings associated with use of debt as a source of
financing(Mean=4.05, SD=0.531 and CV=13 percent), Excessive use of debt can lead to
higher financial distress costs (Mean=3.90, SD=0.619 and CV=16 percent), High levels of
debt in a firm’s capital structure may cause liquidity problems (Mean=3.86, SD=0.622 and
CV=16 percent), The firm has a mix of debt and equity in its capital structure(Mean=3.85,

124
SD=0.629 and CV=16 percent), The organization prefers internal funding to external
funding (Mean=3.27, SD=0.832 and CV=25 percent). The findings indicated that capital
structure decisions played a key role in the overall firm strategy in order to enhance
shareholder firm value in Energy sector institutions. Determining the optimal composition
and level of long-term debt and specific short-term debt relative to equity can enable an
Energy sector Institution to gain competitive advantages over its rivals.
To test this relationship, the following hypothesis was tested; H02: There is no significant
intervening effect of capital structure on the relationship between strategy implementation
and performance of energy sector institutions in Kenya.
Baron and Kenny (1986) four-step method was used to test the hypothesis using regression
analysis. Intervening is confirmed when the following four conditions are fulfilled. The
first condition; the independent variable must be significantly related to the dependent
variable in the absence of the intervening variable.
The second condition; the independent variable must be significantly related to the
intervening variable. The third condition; the intervening variable must be significantly
related to the dependent variable and the final condition; when the effect of the intervening
variable on the dependent variable is controlled, the effect of the independent variable on
the dependent variable should not be significant. Thus, step one involved regressing
strategy implementation with performance. The process moves to step two if step one
yields statistically significant results. If step one does not yield significant results, the
process terminates. In such a case it would be concluded that capital structure does not
intervene the relationship between strategy implementation and performance.
In step two strategy implementation was regressed against capital structure. If the results
are significant, the process moves to step 3 because the necessary condition for an
intervening effect exist. In step three the influence of capital structure on performance is

125
tested using a simple linear regression model. A statistically significant effect of capital
structure on performance is a necessary condition in testing for the intervening effect.
Finally, step four tested the influence of strategy implementation on performance while
controlling for the effect of capital structure. These tests were done using simple linear
regression analysis. The influence of strategy implementation on performance should be
statistically significant when capital structure is controlled. This is a necessary condition
in testing for an intervening effect. Results from the four steps are presented in Table 4.18,
4.19, 4.20 and 4.21 respectively.
Step One: strategy implementation was regressed against performance. The results are
presented in Table 4.18.
Table 4.18: Regression Test of the Effect of Strategy Implementation
Model Summary
Model R R Square Adjusted R Square Std. Error of the Estimate
1 .716a .513 .510 .30712
a. Predictors: (Constant), strategy implementation
ANOVAa
Model
Sum of
Squares Df Mean Square F Sig.
1 Regression 16.309 1 16.309 172.902 .000b
Residual 15.469 164 .094
Total 31.778 165
a. Dependent Variable: performance
b. Predictors: (Constant), strategy implementation
Coefficients
Model
Unstandardized
Coefficients
Standardized
Coefficients
T Sig. B Std. Error Beta
1 (Constant) 1.771 .195 9.083 .000
Strategy
implementation .598 .046 .716 13.149 .000
a. Dependent Variable: performance
The findings in Table 4.18 shows a statistically strong and positive relationship between
strategy implementation and performance (R=.716). Coefficient of determination

126
(R2=.513) depicts that strategy implementation explains 51.3 percent of performance. The
F-value of 172.902 with p-value of 0.00 which is less than the level of significant 0.05,
hence the model is statistically significant. The results thus confirmed the first step of
testing for the intervening effect of capital structure on the relationship between strategy
implementation and performance.
The intervening testing then proceeded to step two that involved testing the influence of
strategy implementation on capital structure. The results of the tests are presented in table
4.19.
Table 4.19: Regression Test of the Intervening influence of Capital Structure
Model Summary
Model R R Square Adjusted R Square Std. Error of the Estimate
1 .546a .299 .294 .38735
a. Predictors: (Constant), strategy implementation
ANOVAa
Model
Sum of
Squares Df Mean Square F Sig.
1 Regression 10.478 1 10.478 69.833 .000b
Residual 24.606 164 .150
Total 35.083 165
a. Dependent Variable: Capital Structure
b. Predictors: (Constant), Strategy Implementation
Coefficientsa
Model
Unstandardized Coefficients
Standardized
Coefficients
T Sig. B Std. Error Beta
1 (Constant) 2.163 .246 8.796 .000
Strategy
implementation .480 .057 .546 8.357 .000
a. Dependent Variable: capital structure
The results presented in Table 4.19 indicated that strategy implementation have a positive
and statistically significant relationship with capital structure (R = .546). Further the
coefficient of determination (R2 = .299) depicted that capital structure is explained by 29.9
percent by strategy implementation. Further the F-value was 69.833 with P-value of .00

127
which is < 0.05, hence the model is statistically significant. The results therefore, suggest
that the second step of testing confirms the process of testing the intervening effect to move
to step 3.
In Step Three capital structure was regressed against performance. The results for the step
3 are presented in Table 4.20
Table 4.20: Regression Test of the Effect of Capital Structure on Performance
Model Summary
Model R R Square Adjusted R Square Std. Error of the Estimate
1 .569a .324 .320 .36188
a. Predictors: (Constant), Capital structure
ANOVAa
Model
Sum of
Squares df Mean Square F Sig.
1 Regression 10.301 1 10.301 78.656 .000b
Residual 21.477 164 .131
Total 31.778 165
a. Dependent Variable: Performance
b. Predictors: (Constant), Capital structure
Coefficientsa
Model
Unstandardized
Coefficients
Standardized
Coefficients
T Sig. B Std. Error Beta
1 (Constant) 2.038 .258 7.891 .000
Capital structure .542 .061 .569 8.869 .000
a. Dependent Variable: performance
The results in Table 4.20 indicate that capital structure had a strong and significant
relationship with performance (R = .569) with capital structure explaining 32.4 percent of
performance (R2 = .324) with remaining percent being explained by other factors not
considered in the model. The analysis from the model had F-value of 178.592 with P-value
of 0.00 which is less than the level of significance 0.05, hence the model is statistically
significant. Therefore, the condition in the third step in testing for intervening effect was
satisfied and therefore progressed to step 4 in testing for the intervening effect.

128
Finally, step four tested the influence of strategy implementation on performance while
controlling for the effect of capital structure. These tests were done using simple linear
regression analysis. The mediation is supported if the effect of capital structure remains
significant after controlling for strategy implementation. If strategy implementation is not
significant when capital structure is controlled, then there is full mediation, and if both
strategy implementation and capital structure significantly predict Performance, there is
partial mediation. The influence of strategy implementation on performance should not be
statistically significant at α=.05 when capital structure is controlled. The relevant results
are summarized in Table 4.21.
Table 4.21: Regression Test of the Intervening Effect of Capital Structure
Model Summaryc
Mo
del
R R
Squar
e
Adjuste
d R
Square
Std.
Error of
the
Estimate
Change Statistics
R
Square
Change
F
Change
df1 df2 Sig. F
Change
1 .716a .513 .510 .30712 .513 172.90
2
1 164 .000
2 .747b .559 .553 .29336 .045 16.744 1 163 .000
a. Predictors: (Constant), Strategy Implementation
b. Predictors: (Constant), Strategy Implementation, Strategy implementation Capital
structure controlled
c. Dependent Variable: Performance
ANOVAa
Model Sum of
Squares
df Mean Square F Sig.
1 Regression 16.309 1 16.309 172.902 .000b
Residual 15.469 164 .094
Total 31.778 165
2 Regression 17.750 2 8.875 103.123 .000c

129
Residual 14.028 163 .086
Total 31.778 165
a. Dependent Variable: Performance
b. Predictors: (Constant), Strategy Implementation
c. Predictors: (Constant), Strategy Implementation, Strategy implementation, Capital structure
controlled
Coefficientsa
Model Unstandardized
Coefficients
Standardized
Coefficients
T Sig. Collinearity Statistics
B Std.
Error
Beta Tolerance VIF
1 (Constant) 1.771 .195 9.083 .000
Strategy
Implementation
.598 .046 .716 13.149 .000 1.000 1.000
2 (Constant) 1.244 .226 5.496 .000
Strategy
Implementation
.240 .098 .287 2.453 .015 .198 5.062
SI_CS .485 .119 .479 4.092 .000 .198 5.062
P= 1.244 + 0.240SI + 0.485SI_CS
The results in Table 4.21 shows that when capital structure is controlled strategy
implementation is statistically significant (p-value=0.000 which is less than 0.05 threshold
at 95 percent confidence level).
At model 2, capital structure adds significantly to the firm performance as the variation
increased from coefficient of 0.513 to .559 and p-value=.000. The results further reveal
that the variance explained by capital structure is significant (p-value=.000<0.05) and the
significance was increased from F=172.902 in the first model to (F=103.123, p-value<.05)
in the second model.
The results show that when capital structure was controlled, model 2 was statistically
significant and therefore there was no full mediation. This is because the condition for full
mediation is that the influence of strategy implementation on organizational performance
should not be statistically significant when capital structure is controlled, the study

130
therefore supports partial mediation and the hypothesis that there is no significant
mediating effect of capital structure on the relationship between strategy implementation
and organizational performance was partially supported and therefore concluded that work
place culture partially mediates the relationship between strategy implementation and
organizational performance. The hypothesis that there is no significant intervening effect
of capital structure on the relationship between strategy implementation and performance
of institutions in the energy sector in Kenya was rejected and the alternative hypothesis
accepted.
This objective was guided by the following model; P4= α+ β1 SI+ β2CS+ε
Where: Pi is Performance
SI is Strategy implementation
SI_CS is capital structure (Intervening variable controlled)
= Error term
β = the beta coefficients of independent variables
After the regression analysis the model became P= 1.244 + 0.240SI + 0.485SI_CS
4.10 Moderating Effect of Macro Environment on the Relationship Between
Strategy Implementation and Performance of Energy Sector Institutions in Kenya
The macro-environment comprises of factors that originate beyond and usually irrespective
of any firms operating situation. Organizations must adapt to their environments if they
have to remain viable. The environment is important and Energy sector institutions have
to respond to its dynamism, heterogeneity, instability and uncertainty. To be successful
overtime, Energy sector institutions must be in tune with its macro environment and
respond to challenges posted by such actions. The factors in the environment that were
thought to affect performance of institutions in the energy sector were political, ecological,
social, technology, economic and legal. The respondents were asked to rate factors on

131
macro environment on a Likert scale of 1(strongly disagree) to 5 (strongly agree) as applied
in the energy sector. Table 4.22 gives the results of the findings.
Table 4.22: Macro Environment Dimensions
Macro Environment N Mean Std.
Deviation
Coefficient
of Variation
(Percent)
Political- policy and support
There is a lot of political interference which
makes us adjust how we implement our
strategic objectives.
166 2.20 0.647 29
Policy and Regulation (licensing, land, tariff)
influences how my organization implements
strategic plans in order to achieve our goals.
166 3.75 0.943 25
There is adequate Political support for our
organization which enables us achieve our
strategic goals
166 2.46 0.898 37
Regulation of Power tariffs has affected
achievement of our strategic goals
implementation
166 3.59 0.881 25
Overall Mean 166 3.00 0.842 29
Ecological
Our company considers the environment
when implementing strategy
166 4.21 0.438 10
Ecological factors affect our organization
when implementing our strategy.
166 4.06 0.392 10
Our firm consider competitors as important
market players and sources of information and
opportunities for cooperation are explored
166 4.02 0.269 7
Resource commitment is guided by social
environmental variable
166 3.96 0.187 5
Overall Mean 166 4.06 0.322 8
Social

132
Macro Environment N Mean Std.
Deviation
Coefficient
of Variation
(Percent)
The social forces change very fast and they
influence the way we implement our strategic
initiatives
166 3.83 1.050 27
Harmonious working relationships with the
stakeholders (community, employees,
suppliers, political and administrative class)”
is important when implementing our
strategies
166 4.81 0.391 8
Preserving positive public image is one of the
main policies for our Organization when
implementing strategy
166 4.78 0.497 10
Resource commitment is guided by social
environmental variable
166 4.54 0.989 22
Overall Mean 166 4.49 0.732 17
Technology
My organization uses the most appropriate
technology in the market to produce power or
provide services
166 4.61 0.547 12
The level of technology in place has greatly
assisted my organization to implement
strategies
166 4.69 0.526 11
Our organization updates and improves our
technology and systems to ensure they are the
latest and most efficient
166 4.54 0.864 19
Our organization is keen to ensure that
technology required is availed
166 4.73 0.494 10
Our organization is quick to respond to the
changes in technology
166 4.64 0.698 15
My organization allocates funding for new
technology, research and development
166 4.31 1.268 29
Overall Mean 166 4.59 0.733 16
Economic

133
Macro Environment N Mean Std.
Deviation
Coefficient
of Variation
(Percent)
The actions of our competitors have made us
change our strategy in the last five years
166 3.35 0.859 26
Bargaining powers of suppliers to service
providers is very competitive
166 3.67 0.827 23
My company experiences threat of substitute
services from other sources.
166 3.13 0.896 29
Economic factors like inflation, exchange
rates, economic growth has significant
influence on our strategy implementation
166 3.84 0.876 23
Overall Mean 166 3.50 0.865 25
Legal
Strict government rules and regulation could
hinder the viability of my business
166 2.92 0.846 29
Compliance requirement with various laws
and regulations (e.g environmental,
procurement, safety etc) has influenced
implementation of our strategy
166 3.79 0.581 15
Laws on taxation has been unfavorable to our
organization and impacted implementation of
our strategic goals
166 3.62 0.878 24
Regulation of access to licenses has impacted
implementation of our organization strategy
166 3.66 0.872 24
Overall Mean 166 3.50 0.794 23
Grand Mean 166 3.86 0.715 19
The grand mean of statements on macro environment was 3.86, standard deviation of 0.715
and coefficient of variation of 19 percent, a moderate mean indicating that macro
environment factors were found to moderately affect performance. The factor that recorded
the highest mean was technology with an average mean of 4.59, standard deviation of 0.733
and coefficient of variation of 16 percent. Technological factors suggest possibility of new

134
products, manufacturing and market techniques and hence it is important since it improves
productivity of firms. Additionally, technological capability plays an important role in
achieving competitive advantages. It also increases performance of firms, industries, and
as well as for the countries. Statements on technology were Our organization is keen to
ensure that technology required is availed (Mean=4.73, SD=0.494 and CV=10 percent),
The level of technology in place has greatly assisted my organization to implement
strategies (Mean=4.69, SD=0.526 and CV=11 percent), Our organization is quick to
respond to the changes in technology(Mean=4.64, SD=0.698 and CV=15 percent), My
organization uses the most appropriate technology in the market to produce power or
provide services (Mean=4.61, SD=0.547 and CV=12 percent), Our organization updates
and improves our technology and systems to ensure they are the latest and most efficient
(Mean=4.54, SD=0.864 and CV=19 percent), My organization allocates funding for new
technology, research and development (Mean=4.31, SD=1.268 and CV=29 percent).
The findings indicated that most of the surveyed institutions used appropriate technologies
and constantly updated the technology and systems to the latest for efficiency and effective
power generation and distribution. Hence from the findings, it is evident that Technology
infrastructure is an important factor in achieving business objectives and hence firms need
to be technologically ready to take on the strategic challenges that can fuel growth.
Additionally, firms with higher technological capability are able to deliver their services
effectively. The implementation of strategy is affected by technological innovations, in that
improved technology facilitates efficient communication and adoption of effective
strategies for better firm performance. In order for strategies and strategic plans to be
relevant, it is important for the management of organizations to keep a close eye on
technology and various innovation initiatives (Phaal & Palmer, 2010). With knowledge of
the various technological developments in a particular industry and the impact these
technologies have on the business processes, products and services, management can
ensure it factors this into the strategy formulation process to facilitate organizational
success (Tassey, 2012).

135
The average mean of statements on social was 4.49, standard deviation of 0.732 and
coefficient of variation of 17 percent, a high mean indicating that social factors affected
implementation of strategy for improved firm performance. Statements on social were
Harmonious working relationships with the stakeholders(community, employees,
suppliers, political and administrative class)” is important when implementing our
strategies (Mean=4.81, SD=0.391 and CV=8 percent), Preserving positive public image is
one of the main policies for our Organization when implementing strategy (Mean=4.78,
SD=0.497 and CV=10 percent), Resource commitment is guided by social environmental
variable (Mean=4.54, SD=0.989 and CV=22 percent), The social forces change very fast
and they influence the way we implement our strategic initiatives (Mean=3.83, SD=1.050
and CV=27 percent). The findings indicated that harmonious working relationship among
all stakeholders was crucial in strategy implementation for efficient firm performance. The
firms were careful to promote positive public image as they implemented their strategies.
A good social environment is hence necessary for implementation of strategy to influence
better firm performance.
The average mean on statements on ecological factors was 4.06, standard deviation of
0.322 and coefficient of variation of 8 percent, a high mean indicating that the ecological
environment which provides natural resources for manufacturing and energy production,
is a key part of strategy implementation to influence firm performance. Statements on
ecological factor were Our company considers the environment when implementing
strategy (Mean=4.21, SD=0.438 and CV=10 percent), Ecological factors affect our
organization when implementing our strategy (Mean=4.06, SD=0.392 and CV=10
percent), Our firm consider competitors as important market players and sources of
information and opportunities for cooperation are explored(Mean=4.02, SD=0.269 and
CV=7 percent), Resource commitment is guided by social environmental variable
(Mean=3.96, SD=0.817 and CV=5 percent). The findings indicated that ecological factors
were found to affect the firms when implementing strategy as well as competitors were

136
found to greatly affect market. The strength of business competition is a constantly
changing factor in the external environment as competitors influence changes in the
marketing strategies, product lines and prices which affect firm performance. Hence from
the findings, firms ought to be keen on changes and competition present in the ecological
environment to formulate and adopt effective strategies for efficient firm performance.
On economic, the average mean recorded was 3.50, standard deviation of 0.865 and
coefficient of variation of 25 percent, a relative moderate mean indicating that economic
factors had a moderate effect on strategy implementation to influence firm performance.
Statements on economic were Economic factors like inflation, exchange rates, economic
growth has significant influence on our strategy implementation (Mean=3.84, SD=0.865
and CV=23 percent), Bargaining powers of suppliers to service providers is very
competitive (Mean=3.67, SD=0.827 and CV=23 percent), The actions of our competitors
have made us change our strategy in the last five years (Mean=3.35, SD=0.859 and CV=26
percent), My company experiences threat of substitute services from other sources
(Mean=3.13, SD=0.896 and CV=29 percent). The findings indicated that economic factors
affected strategy implemented on a moderate extent and hence its effect on performance
was moderate.
The average mean on statements on legal was 3.50, standard deviation of 0.794 and
coefficient of variation 23 percent. Statements on legal were Compliance requirement with
various laws and regulations( e.g environmental, procurement, safety etc.) has influenced
implementation of our strategy (Mean=3.79, SD=0.581 and CV=15 percent), Regulation
of access to licenses has impacted implementation of our organization strategy
(Mean=3.66, SD=0.872 and CV=24 percent), Laws on taxation has been unfavorable to
our organization and impacted implementation of our strategic goals (Mean=3.62,
SD=0.878 and CV=24 percent), Strict government rules and regulation could hinder the
viability of my business (Mean=2.92, SD=0.846 and CV=29 percent).

137
The findings on legal environment indicated that most of the surveyed institutions in the
energy sector had found legal factors such as taxations, compliance with laws and
regulations and government strict rules affect strategy implementation which in turn affects
firm performance. From the findings, in order for firms to cope with the legal environment,
there is a need to develop and implement appropriate strategies that are compliant with the
laws and regulations of the industry which would safeguard their operations and hence
yield the desired results. Lastly on political (policy and support), the average mean was
3.00, standard deviation of 0.842 and coefficient of variation of 29 percent, a relatively low
mean indicating that political factors ought to be looked into clearly for effective strategy
implementation leading to better firm performance. Statements on political factors were
Policy and Regulation ( licensing, land, tariff) influences how my organization implements
strategic plans in order to achieve our goals (Mean=3.75, SD=0.943 and CV=25 percent),
Regulation of Power tariffs has affected achievement of our strategic goals implementation
(Mean=3.59, SD=0.881 and CV=25 percent), There is adequate Political support for our
organization which enables us to achieve our strategic goals(Mean=2.46, SD=0.898 and
CV=37 percent), There is a lot of political interference which makes us adjust how we
implement our strategic objectives (Mean=2.20, SD=0.647 and CV=29 percent). The
findings indicated that the political environment in most firms was not favorable and there
was need for leaders in the firms to ensure firms receive adequate political support for
effective strategy implementation to influence better firm performance.
To test this relationship, the following hypothesis was tested; H03: There is no significant
moderating effect of macro environment on the relationship between strategy
implementation and performance of energy sector institutions in Kenya. The hypothesis
was tested through Stepwise regression analysis using two steps. The first step involved
testing the influence of strategy implementation and macro environment on performance.
The second step involved introduction of the interaction term through stepwise regression
analysis. Regression results for the influence of macro environment on the relationship
between strategy implementation and performance are contained in Table 4.23.
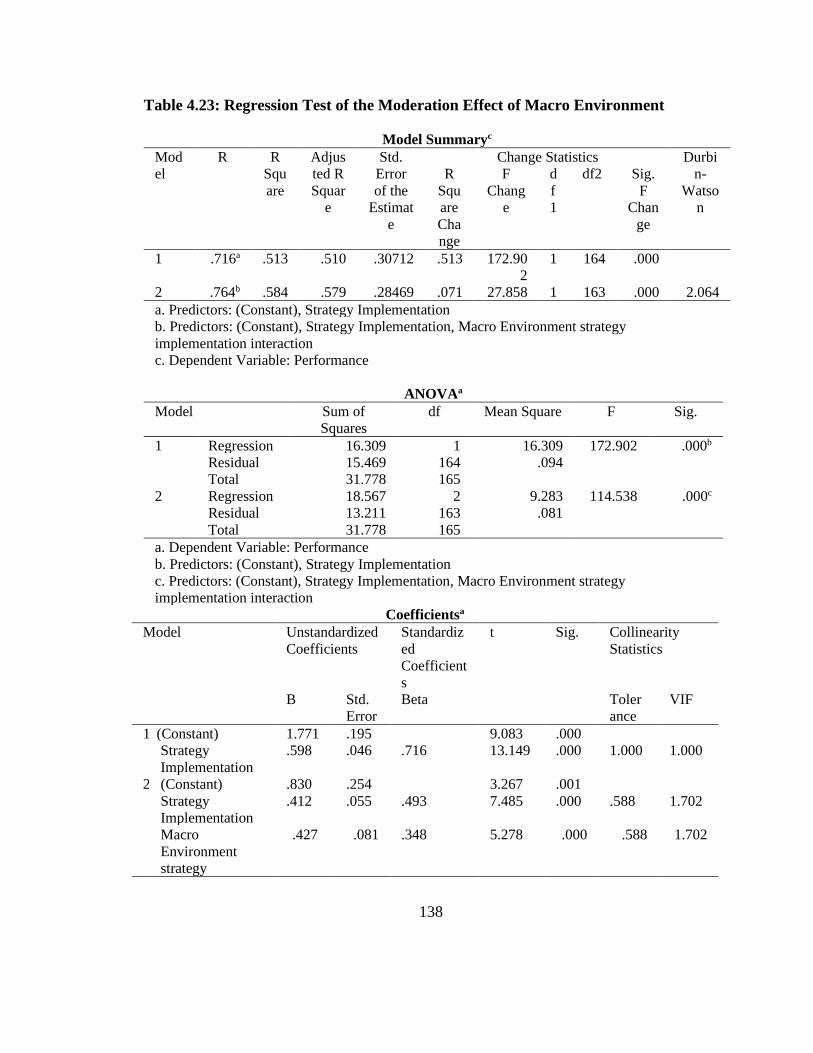
138
Table 4.23: Regression Test of the Moderation Effect of Macro Environment
Model Summaryc
Mod
el
R R
Squ
are
Adjus
ted R
Squar
e
Std.
Error
of the
Estimat
e
Change Statistics Durbi
n-
Watso
n
R
Squ
are
Cha
nge
F
Chang
e
d
f
1
df2 Sig.
F
Chan
ge
1 .716a .513 .510 .30712 .513 172.90
2
1 164 .000
2 .764b .584 .579 .28469 .071 27.858 1 163 .000 2.064
a. Predictors: (Constant), Strategy Implementation
b. Predictors: (Constant), Strategy Implementation, Macro Environment strategy
implementation interaction
c. Dependent Variable: Performance
ANOVAa
Model Sum of
Squares
df Mean Square F Sig.
1 Regression 16.309 1 16.309 172.902 .000b
Residual 15.469 164 .094
Total 31.778 165
2 Regression 18.567 2 9.283 114.538 .000c
Residual 13.211 163 .081
Total 31.778 165
a. Dependent Variable: Performance
b. Predictors: (Constant), Strategy Implementation
c. Predictors: (Constant), Strategy Implementation, Macro Environment strategy
implementation interaction
Coefficientsa
Model Unstandardized
Coefficients
Standardiz
ed
Coefficient
s
t Sig. Collinearity
Statistics
B Std.
Error
Beta Toler
ance
VIF
1 (Constant) 1.771 .195 9.083 .000
Strategy
Implementation
.598 .046 .716 13.149 .000 1.000 1.000
2 (Constant) .830 .254 3.267 .001
Strategy
Implementation
.412 .055 .493 7.485 .000 .588 1.702
Macro
Environment
strategy
.427 .081 .348 5.278 .000 .588 1.702

139
implementation
interaction
a. Dependent Variable: Performance
P = 0.830 + 0.412SI + 0.427SI_ME
Table 4.23 shows that model 1 is significant (p-value < 0.05, R2 = .513) implying that
strategy implementation and macro environment jointly explain 51.3 percent of variation
in performance. Further, upon introduction of the interaction term, coefficient of
determination (R2) changed from .513 in model 1 to .584 in model 2 therefore giving a
variation change of .087 which is significant at 95 percent confidence level
(p=0.000<0.05). Further the change in p-value in model 2 is 0.00 which is also significant
(p-value<0.05) implying that macro environment significantly moderate the relationship
between strategy implementation and performance. The results further depict that F-value
for both models were high and significant (F=172.902 for model 1; F=114.538 for model
2) (p-value<0.05) implying that the overall models for direct and moderating relationships
are significant and have explanatory value in explaining performance. The results further
show that strategy implementation and macro environment individually are significant in
explaining performance (t=13.149, p<0.05) and for model 2 when interaction term is
introduced it is also significant (t=5.278, p<0.05). Therefore, it was concluded that, the
introduction of macro environment had an enhancing moderating effect on the relationship
between strategy implementation and organizational performance Therefore, based on the
results of the test, the hypothesis that there is no significant moderating effect of macro
environment on the relationship between strategy implementation and performance of
energy sector institutions in Kenya was rejected and the alternative hypothesis supported.
This was guided by the following model; P = α+ β1SI+ β2ME+β3 SI.ME + ε
Where: P is Performance
SI is Strategy implementation
ME is Macro environment (Moderating variable)
SI.ME is strategy implementation and macro environment (interaction)

140
= Error term
β = the beta coefficients of independent variables after the regression analysis results, the
model became P = 0.830 + 0.412SI + 0.427SI_ME
4.11 Moderating Effect of Macro Environment on the Intervening Effect of Capital
Structure and Performance of Energy Sector Institutions in Kenya
To test this relationship, the following hypothesis was tested; H04: There is no significant
moderating effect of macro environment on the intervening effect of capital structure and
performance of energy sector institutions in Kenya. The hypothesis was tested through
Stepwise regression analysis using two steps. The first step involved testing the influence
of capital structure and macro environment on performance. The second step involved
introduction of the interaction term through stepwise regression analysis. Regression
results for the influence of macro environment on the relationship between capital structure
and performance are contained in Table 4.24
Table 4.24: Moderated Mediation of Capital Structure
Model Summary
Model R R
Squ
are
Adjust
ed R
Squar
e
Std.
Error of
the
Estimate
Change Statistics
R
Squar
e
Chan
ge
F
Change
df
1
df2 Sig. F
Change
1 .707b .50
0
.494 .31227 .176 57.245 1 163 .000
2 .734c .53
9
.530 .30080 .039 13.678 1 162 .000
a. Predictors: (Constant), Capital Structure and Macro Environment
b. Predictors: (Constant), Capital Structure and Macro Environment, Interaction

141
ANOVAa
Model Sum of
Squares
df Mean Square F Sig.
1 Regression 15.883 2 7.941 81.438 .000c
Residual 15.895 163 .098
Total 31.778 165
2 Regression 17.120 3 5.707 63.074 .000d
Residual 14.657 162 .090
Total 31.778 165
a. Dependent Variable: Performance
b. Predictors: (Constant), Capital Structure and Macro Environment
c. Predictors: (Constant), Capital Structure and Macro Environment, Interaction
Coefficientsa
Model Unstandardize
d Coefficients
Standardize
d
Coefficients
t Sig. 95.0%
Confidence
Interval for B
Collinearity
Statistics
B Std.
Erro
r
Beta Lowe
r
Boun
d
Upper
Boun
d
Tolera
nce
VIF
1 (Constant) 4.316 .024 178.06
9
.000 4.268 4.364
Capital
Structure
-.276 .063 -.290 -4.364 .000 -.401 -.151 .693 1.443
Macro
Environmen
t
-.618 .082 -.503 -7.566 .000 -.779 -.457 .693 1.443
2 (Constant) 4.343 .024 177.54
4
.000 4.295 4.391
Capital
Structure
-.199 .064 -.209 -3.085 .002 -.326 -.072 .620 1.613
Macro
Environmen
t
-.552 .081 -.449 -6.835 .000 -.711 -.392 .659 1.518
CS_ME -.297 .080 -.231 -3.698 .000 -.456 -.139 .730 1.370
a. Dependent Variable: Performance
Analysis in Table 4.24 shows that model 1 is significant (p-value = 0.000 < 0.500, R2 =
.500) indicating that capital structure and macro environment collectively explain 50
percent of variation in performance. In model 2 when interaction term was introduced,
coefficient of determination (R2) improved from .500 in model 1 to .539 in model 2. This

142
resulted in a significant R2 change of .039 with p-value=0.000<0.05. The findings further
showed that F-value for both models were high and significant (F=81.438, p-value =
.000<.05 for model 1; F=63.074, p-value = .000<.05), thus the two models were in overall
significant. Individually in model 1, capital structure (β =-.276, t = -4.364, p-value =
.000<.05) and macro environment (β =-.618, t = -7.566, p-value = .000<.05) were
significant. This facilitated analysis in step two. In model two when the interaction term
was introduced, the results (β =-.297, t = -3.698, p-value = .000<.05) indicated a significant
relationship, thus macro environment moderates the relationship between capital structure
and performance (moderated mediation). Therefore, it was concluded that, the introduction
of macro environment had an enhancing moderating effect on the relationship between
capital structure and performance. Based on the results of the test, the hypothesis that there
is no significant moderating effect of macro environment on the intervening effect of
capital structure and performance of energy sector institutions in Kenya was rejected and
the alternative hypothesis accepted.
The predictive model become; P = α+ β1CS+ β2ME+β3 CS.ME + ε
Where: P is Performance
CS is Capital structure (mediating variable)
ME is Macro environment (Moderating variable)
CS.ME is Capital Structure and Macro Environment (interaction)
= Error term
β = the beta coefficients of independent variables after the regression analysis results, the
model became P = 4.343 -.199 CS -.552 ME - .297CS.ME

143
CHAPTER FIVE: DISCUSSION OF THE FINDINGS
5.1 Introduction
This chapter presents a critical discussion of the findings in line with the research
objectives and the formulated hypotheses from which the study results were discussed,
corroborated with the literature reviewed and inferences drawn. The primary objective of
the study was to determine the influence of strategy implementation, capital structure and
macro environment on the performance of Energy sector institutions in Kenya. The
research objectives and the hypotheses were formulated based on existing conceptual and
empirical literature and led to the development of the conceptual model which outlined the
relationships between the variables. This chapter discusses the results and explains the
reasons for the findings and the extent to which they are consistent or not consistent with
previous empirical studies or theoretical arguments. To test the hypotheses, regression
analysis was used after conducting tests for statistical assumptions.
The results showed that there is a statistically significant relationship between strategy
implementation and performance of energy sector institutions in Kenya. Additionally, the
study also noted a significant intervening effect of capital structure on the relationship
between strategy implementation and performance, while macro environment had a
moderating effect on the relationship between strategy implementation and performance.
In addition, macro environment had a significant moderating effect on the relationship
between capital structure and performance. A detailed discussion of these findings is
provided in the next sections.
5.2 Strategy Implementation and Performance
On general effects of strategy implementation and performance, the study found a strong
association between strategy implementation and performance (R=.716). The coefficient
of determination R2 =.513 implies that strategy implementation explains 51.3 percent of
the variation in performance. The other variables not included in this study explain the

144
remaining 48.7 percent. This result shows a strong influence of strategy implementation
and performance. The overall model was statistically significant (F = 172.902, P-value <
0.05). The results of the beta coefficient showed that a unit increase in strategy
implementation will cause a .716 increase in performance (B=1.771, t=13.149, p<0.05)
suggesting that the influence of strategy implementation on performance was statistically
significant. This implies, overall, strategy implementation is a good predictor of
performance. The findings were sufficient to reject the first hypothesis this implies that
strategy implementation significantly influence performance and therefore the hypothesis
that Strategy implementation has no significant effect on performance of energy sector
institutions in Kenya was rejected and the alternative hypothesis accepted.
A strong association between strategy implementation and performance has been reported
in the extant literature to the extent that strategy implementation is a key strategy for
performance. The first objective of this study was to determine the relationship between
strategy implementation and the performance of Energy sector institutions in Kenya. The
descriptive summary showed that of the strategy implementation dimensions, leadership
had the highest mean followed by structure, while the inferential statistics showed that
there was a significant relationship between strategy implementation and performance.
Findings of the study suggested that leaders in the energy sector institutions define key and
crucial organizational strategic change moments, create appropriate strategies, and
translate such strategies to actions in operational terms for the change direction required.
Therefore, strategic leadership is required to harness and deploy requisite organizational
capabilities that allow the organizations accomplish their goals and objectives through
formulating and implementing necessary strategies to ensure successful performance. It
further indicated that leaders in institutions in the energy sector ensured that employees
had adequate knowledge and skills to perform their duties, encouraged employee
participation in formation and implementation of strategy as well as provided adequate
resources for strategy implementation, all these geared for better organization performance.

145
Hence from the findings, leaders in organizations in the energy sector play a crucial role in
steering the organizations for better performance which is achieved by the leaders coming
up with ways of advancing the organizations key mandate in the face of scarce resources,
linking job performance to valued rewards and by ensuring employees have the resources
needed to get the job done.
This finding concurs with studies by Lunenburg (2011) which focused on leadership
behavior that promotes employee commitment to organizational goals and standards. A
particular chosen type of leadership ensures increased productivity and therefore, managers
should ensure that their employees are well motivated to ensure that the optimum
performance is realized. This is essentially because the human achievement is greatly
predicted by the motivation as a driving force. The findings are also supported by Chen et
al. (2016) which concluded that successful strategy implementation requires that strategy
is reflected in the way the firm organizes its activities, the key organizational leaders and
the culture of the organization so that the strategy and the organization become one.
Systems that offer strategic control as well as capability of adjusting strategies, the
confirmed commitments, as well as objectives in response to the dynamic conditions must
also be put in place by the implementers.
This study finding is supported by Abdullah, Haim Hilman and Siam,
Mohammed (2014) who looked at the influence of organizational structure and
organization culture on the organizational performance of higher educational institutions.
The study concluded that the organization structure should be flexible enough to respond
quickly to change, challenge and uncertainty. This flexibility should be enhanced by the
creation of core groups and by using part-time, temporary and contract workers to handle
extra demands. The study established that even in troubled organizations, structural change
is intermittent and can take long periods of time and changes with little or no tangible
results.

146
The study by Musyoka (2011) avers that there is an intrinsic association between strategy
formulation and structure of the organization. The structures facilitate how the process and
relationships work, thus affecting strategy implementation process. Organizational
structure and strategy have to be linked for the success of any firm. The firm’s strategies
need to be aligned to its structure. There is a relationship between organizational structure
and leadership in any successful strategy implementation process. However, the findings
of the study were confined to commercial banks in Kenya but failed to address variables
of this study.
The study is further supported by Ogunmokun, Hopper and McClymont (2005) who
investigated on strategy implementation and performance. The study found out that the
changes in organizational structure, enables organizations to register high levels of
performance. The research gap in this case was conducting the same study in a developing
country such as Kenya, and the factors affecting organizational structure are: formal
organizational structures, structural design (tall vs. flat) and alignment of structures to
implemented strategy, in a bid to evaluate whether strategy implementation has an effect
on performance.
Additionally, on culture, the findings noted that strategies implemented within an
organization that support the culture associated with the firm enhances organizational
performance. The preferred strategy should preserve and enhance the organizational
culture. Therefore, from the findings strategies to be implemented must be consistent with
organizational culture to realize the desired organizational performance results. The study
findings are supported by Ahmadi, Ali, Salamzadeh, Daraei, and Akbari (2012) who
studied the relationship between organizational culture and strategy implementation. The
results confirm the hypotheses and unveil the relations between all typologies and
dimensions of cultures and components of implementation. Additionally, the findings
verify flexible cultures have to do more with policy formation and structural factors in

147
implementation. The study findings revealed that there was a significant correlation
between the organizational culture and strategy implementation within the organizations.
The study concurs with Calciolari, Prenestini and Lega (2018) who reviewed how cultural
type dominance and strength influence different performance goals. According to the
study, organizational culture might influence results, especially in public healthcare
organizations characterized by strong professional control. This is also evidenced through
a study conducted by Hotstede, Fritz, Canavan, Oosterkamp and Van (2010) who observed
norms, values, beliefs, tactics and guidelines as additives of organizational culture.
According to Kinyanjui and Juma (2014), well-developed systems help to overcome
resistance on strategy implementation within an organization. Top management is involved
in resolving the conflict by mediating between groups, and they are also involved in
promoting project acceptance by building cooperation between various stakeholders. The
study concluded that even though organizational culture influences performance, there
exist a difference between culture and organizational performance.
Lastly on responsibility and accountancy, the findings noted that there was effective
accountability in the surveyed institutions as each employee was held accountable for
achievement of goals in the companies. Additionally, top managers were responsible for
decision making process assisted by other managers. Effective leadership by the top
management through creation and sharing of organizational goals, acting as a role model,
encouraging creativeness, providing support for employees, and allowing employee
participation in making job-related decisions which influenced employees’ attitude and
reflected in their performance.
The findings concur with Rajasekar (2014) who examined how different factors affect
electricity distribution companies in the Sultanate of Oman by addressing the role played
by organizational communications in strategy implementation. The findings of the study
also agree with that of Murgor (2014) who opined that strategy implementation affects

148
organization performance by anchoring the organization to its external environment.
Effects of strategy implementation on organization performance may be affected by other
variables including capital structure (Dawar, 2014). The effectiveness of strategy
implementation is affected by the individuals involved. The strategic management process
includes analysis, direction setting, developing strategies, implementation and control
(Kotter & Keller, 2012). This argument thus supports the ability of the firm to develop and
implement strategies as a crucial aspect to fostering performance.
The findings concur with Njoroge et al. (2015) who studied the effect of Strategy
Implementation on Performance of Kenyan State Corporations. The study results indicated
that the indicators of performance had a significant influence on strategy implementation.
Additionally, studies by Njagi and Kombo (2014) on the effect of strategy implementation
on performance of commercial banks found that there is a moderately strong association
between strategy implementation and organizational performance and that institutions that
want to thrive and compete effectively must implement strategy effectively.
The study findings coincide with that of Salum (2018) that looked at factors influencing
implementation of strategic plans in Tanzania’s Executive Agencies. The result indicated
that, collectively and individually all predictors that is top management (R-square = 0.473);
organizational resource (R-square = 0.315); organizational culture (R-square = 0.085); and
Role of stakeholders (R-square = 0.056) influences implementation of strategic plans, but
only top management support (R = 0.690) and organizational resources (R = 0.562) had
significant strong positive relationship while organizational culture (R = 0.292) and the
role of stakeholders (R = 0.236) had significant weak positive correlation with
implementation of strategic plans. The findings recommended more emphasis on
organizational culture as a key element in the strategic plans.

149
5.3 Strategy Implementation, Capital Structure and Performance
The second objective of the study was to determine the intervening effect of capital
structure on the relationship between strategy implementation and performance of Energy
sector institutions in Kenya, through the hypothesis there is no significant intervening
effect of capital structure on the relationship between strategy implementation and
performance. The study sought to establish whether cost of capital, covenants, debt and
equity had an intervening effect on the relationship between strategy implementation and
performance.
The findings indicated that capital structure decisions played a key role in the overall firm
strategy in order to enhance shareholder firm value in Energy sector institutions in Kenya.
Determining the optimal composition and level of long-term debt and specific short-term
debt relative to equity can enable an Energy sector Institution to gain competitive
advantage over its rivals. On testing the intervening effect of capital structure on the
relationship between strategy implementation and performance, the study found that when
capital structure is controlled strategy implementation is statistically significant. The
hypothesis that there is no significant intervening effect of capital structure on the
relationship between strategy implementation and performance of institutions in the energy
sector in Kenya was rejected and the alternative hypothesis supported.
The study findings indicated that an strategic financial policy was a crucial factor to be
considered for efficient financial performance of an organization. Additionally, for
effective firm performance, the surveyed institutions ensured that they minimized cost of
capital in order to maximize profits for their organizations as well as adopted benchmark
programs which constantly evaluated performance. The choice of financing makes cost of
capital a crucial variable for every organization since it determines the company’s capital
structure and hence firms ought to develop and implement right strategies which provide
adequate funding and as also minimize cost of capital for improved firm performance.
Additionally, the findings indicated presence of debt covenant agreements of the surveyed

150
firms with external financiers and that most of the firms had large assets to be used as
security when acquiring loans. Effective debt covenants facilitate development and
implementation of right strategies that steer a firm to increase its income to enable it clear
debt and enjoy profits hence better performance.
The study is supported by that of Riesel (2014) who studied the impact of firm’ growth
opportunities on the restrictive covenants in debt contracts. The study realized that high-
growth firms are generally less likely to include covenants, which suggests that the
advantage of preserving future flexibility outweighs the advantage of reducing the cost of
debt, and this by including covenants. The study also found that high-growth firms are less
likely to include covenants that limit investment activities and asset sales, as well as
covenants that restrict dividend payments to shareholders. The creditor’s power is not just
suspected to be influential in default situations, but in non-default situations as well. After
financial covenant violation creditors have the right to immediate repayment, but instead
of opting for this immediate repayment they use the chance of a waiver violation to impose
stronger restrictions on the debtor by renegotiating the credit agreement, resulting in
amended credit agreements with less funding, having higher interest rate spreads and
shorter maturities. Due to a lower possibility of managerial expropriation induced by
improved monitoring of creditors, the agency costs are assumed to decrease, positively
affecting firm value.
The finding is buttressed by Kajirwa (2015) who sought to find out whether the use of debt
in a firm’s debt structure affects firm performance. The study concluded that the use of
debt in a firms’ capital structure has a negative influence on the performance of commercial
banks in Kenya though not statistically significant. The findings are also supported by
Chava, Kumar and Warga (2010) manifested that, in a growth opportunity scenario, the
use of covenants in debt agreements may limit the opportunities perceived in the future and
the use of short-term debt can bring the company liquidity risk problems. As these
instruments may limit future investments by firms, the logical solution is to decrease the

151
current level of indebtedness or to use less debt to raise funds in need of funding (Chava et
al., 2010). As debt covenants and short-term debt may limit future opportunities, some
companies might prefer not to raise debt instruments when they face growth opportunities
(Chava et al., 2010). The findings also concur with Jensen (2013) that capital structure of
a firm influences its performance and that a firm needs to finance its operations and in so
doing, there is need to choose debt and equity combination which will form its capital
structure. Debt keeps the leaders in check. An appropriate capital structure is a critical
decision for any business organization. The decision is important not only because of the
need to maximize returns to various organizational constituencies, but also because of the
impact such a decision has on an organization’s ability to deal with its competitive
environment. Once established, this capital structure should provide greater returns to
stockholders than they would receive from an all-equity firm.
The study findings coincide with that of Akomeah, Bentil and Musah (2018) who examined
the effect of firm capital structure decisions on their performance based on a sample of
non-financial firms. The study findings allude that there is a significant relationship
between capital structure and performance. The findings showed that Short-term debt had
negative relationship with the performance. The results indicate that the capital structure
decisions significantly affect the return on equity. Finally, the study findings also
correspond to that by Okoth (2017) who studied the effect of debt financing on
performance of non-financial Firms listed at Nairobi Securities Exchange in Kenya. The
study concluded that there is need for efficient management of debt as a source of capital.
The results from Dube (2013) study on the relationship between debt financing and
productivity of small and medium scale enterprises in Zimbabwe, concluded that
performance and level of debt financing had a positive relationship. The study also realized
that Debt financing affects a company’s performance because companies will usually agree
to fixed repayments for a specific period. These repayments occur regardless of the firm’s
performance. Although equity financing typically avoids these repayments, it requires

152
companies to give an ownership stake in the company to venture capitalist or investors.
Thus, the choice of capital structure is fundamentally a financing decision problem which
becomes even more difficult in times when the firm’s environment operates presents a high
degree of instability.
Sadeghian, Latifi, Soroush and Aghabagher (2012) studied the effect of debt policy on
corporate performance. The relationship between debt policies and performance was
looked into. Financial performance indicators were considered such as Gross Margin
Profit, Return on Assets (ROA), Tobin's Q Ratio, and Debt Ratios (Current Debt, Non-
Current Debt, and Total Debt). The results showed a direct negative relationship between
debt policy on performance. Additionally, Olaniyi, Elelu and Abdulsalam (2015) studied
the impact of capital structure on corporate performance. The study examined the impact
of capital structure choices (Equity or Debt) on performance of selected firms in US in the
pre, during and post crisis periods (2003-2006), 2007-2008 and 2009-2012 respectively)
with a view to determine whether or not the relationship between the two variables is period
related. The results showed a significant relationship between capital structure and
performance. This finding is also supported by the work of John (2013) studied capital
structure and its effect on firm performance. The study results indicated that Long-term
Debt to Capital (LDC) was significantly but negatively related to ROE. Similarly, each of
DC, DCE, SDTD and AGE was significantly and positively related to ROA. However,
LDC was significantly and negatively related to ROA. The hypotheses tested confirmed
that there was significant relationship between capital structure and financial performance
using both ROA and ROE.
5.4 Strategy Implementation, Macro Environment and Performance
The third objective of the study was to determine the moderating effect of macro
environment on strategy implementation and performance of Energy sector institutions in
Kenya done through the hypothesis, there is no significant moderating effect of macro
environment on the relationship between strategy implementation and performance.

153
On testing the moderating effect, coefficient of determination (R2) changed from .513 in
model 1 to .584 in model 2 therefore giving a variation change of .087 which is significant
at 95 percent confidence level (p=0.000<0.05). Further the change in p-value in model 2 is
0.00 which is also significant (p-value<0.05) implying that macro environment
significantly moderate the relationship between strategy implementation and performance.
The results further depict that F-value for both models were high and significant
(F=172.902 for model 1; F=114.538 for model 2) implying that the overall models for
direct and moderating relationships are significant and have explanatory value in
explaining performance. The results further show that strategy implementation and macro
environment individually are significant in explaining performance (t=13.149, p<0.05) and
for model 2 when interaction term is introduced it is also significant (t=5.278, p<0.05).
Therefore, based on the results of the test, the hypothesis that there is no significant
moderating effect of macro environment on the relationship between strategy
implementation and performance was rejected and the alternative hypothesis supported.
The study findings are in agreement with that of Njoroge et al. (2016) who assessed
whether external environment influence organizational performance. The study results
were in agreement with the study hypothesis and manifested a positive significant influence
performance indicator. The environment appeared to have a positive effect contrary to the
common belief. The organization had a well-developed environmental scanning tools for
the environmental effects. The findings showed a direct external environment-
performance link.
Nyakego (2017) conducted a study on strategy implementation, planning typologies and
performance of Universities in Kenya. The study results showed that proactive planning
typology did not significantly moderate the relationship between organizational leadership,
organizational culture and the overall performance of the universities. In this study, the
use of the Balanced Scorecard Model was extended to non-profit organizations to measure
performance. Subsequently, moderating variables were added to extend the literature on
the match between strategy implementation and university performance. The study

154
established that reactive planning typology moderated the relationship between leadership
and society expectations, leadership and employee effectiveness, culture and society
expectations and culture and employee effectiveness. Proactive typology also moderated
the relationship between leadership and research and leadership and financial
sustainability.
According to Ireland, Hoskisson and Hit (2009), technological factors involves institutions
and activities which create new knowledge and translate that knowledge to new products,
outputs, processes, and materials. Technology involves rapidly changing hence firms need
to thoroughly embrace and study the technological segment (Ireland, Hoskisson & Hit,
2009). The study agrees with Pearce and Robinson (2007) who state that sudden
technological breakthrough can have a dramatic effect on a firm’s environment in terms of
new markets, products or significantly shortened manufacturing life. Therefore, all firms
especially those in turbulent growth must strive to understand both existing technology and
technological advances and the probable future advances that may affect their products and
services.
The study findings are supported by Pearce and Robinson (2007) who argue that political
factors determine the legal boundaries in which an organization operates considering the
regulatory requirements. The set laws tend to eat on the organization’s profits as they strict
and must adhered to. These laws tend to reduce the firms’ profits or to benefit by protecting
some firms through actions like patent laws and government subsidies. The findings are
propped by Ireland, Hoskisson and Hitt (2009) who state that economic factors concern the
nature and direction of the economy that the organisation operates in both the national and
international level management must consider the availability of credit, the level of
disposable income, the propensity of people to spend, interest rates, inflation rates, and
trends in the growth of the gross national product among other economic factors. Pearce
and Robinson (2007) further identify that as nations are interconnected as a result of the

155
global economy the organizations must therefore scan, monitor, forecast and assess the
health of the economy outside their host nation.
The study findings are also supported by Pearce and Robinson (2007) who hold that the
social factors that affect a business involve from beliefs, values, attitude, opinions and
lifestyles of persons in the business or firm’s external environment. This usually is
developed from cultural, ecological, demographic, religious, educational and ethic
conditions. It has however been noted that translating social change into business forecasts
is a difficult process due to shifts in population, changing work values, ethical standards
and religious orientation. Ireland et. al. (2009) states that sociocultural factors is mainly
concerned with the society’s attitude and cultural values. Ireland et. al. (2009) also noted
that attitude and values form the cornerstone of a society as well as drive demographic,
economic, political/legal and technological conditions and changes. The findings of the
study are supported by Machuki and Aosa, (2011) who opined that organizational
performance is vastly associated to the vibrant evolutionary nature of the fit between the
environment and the organization. For any organization to thrive, they must constantly
interact with the ever-changing macro environment.
The findings concur with Murgor (2014) who carried out a study on external environment,
firm capabilities, strategic responses and performance of large-scale manufacturing firms
in Kenya. Through a cross-sectional descriptive survey, the inferential and descriptive
statistics were analyzed. The results showed that performance is to great extent is affected
by the environment. The parameters of strategic response and that of external environment
indicated a positive correlation. The study findings agree with that of Mbithi, Muturi and
Rambo (2017) who studied the moderating effect of macro environment factors on
relationship between combined strategy choices and performance. The moderating effects
of macro environment on the relationship between strategic choice and performance were
tested and the result showed that the macro environment factors in the organization
manifest and affect strategy-performance relationship in various ways. The results suggest

156
that organizations depend on the environment hence appropriate strategy should be weaved
to deal with this organization environment interface, a fitting procedure decision is
essential. The results additionally introduced a vital connection between the organization
and performance with the end goal that administrators of such organizations ought to
consider in improving organization endurance and development.
Ivančić, Mencer, Jelenc and Dulčić (2017) looked at strategy implementation–external
environment alignment. The study examined the relationship between the external
environment and strategy implementation process, taking into account two perspectives of
analysis. The study was based on empirical research, conducted in large Croatian
enterprises. The sample includes 78 enterprises and includes respondents from different
hierarchical levels and business functions. The results indicated that, enterprises do not
associate the lack of implementation success to the context uncertainty. The study also
found that enterprises with a higher level of proactiveness in researching context
characteristics, demonstrate a greater level of preparation in opportunities exploitation. In
addition, private enterprises, mainly focused on international market, perceive a higher
level of context uncertainty.
Akpoviroro and Owotutu (2018) examined the impact of external business environment on
organizational performance of frozen fish companies in Nigeria. The study looked at the
relationship between the operating environment and the performance. Questionnaires were
used to data from 3 fish companies making a sample size of 120. Multiple regression was
used in the study analysis. The results showed that the organizational operating
environment had a significant influence on the performance of the firms. Thus,
organization should understand the implications of the firm’s environment on the
organizational performance to be able to survive in the industry. Kowo, Akinrinola and
Sabitu (2018) assessed the relationship between macro environment and performance of
multinational agricultural enterprises. The study adopted survey method. Cronbach Alpha
was used to test for reliability. 114 copies of questionnaire were administered. The results

157
revealed that variance in multinational agricultural enterprise performance could be
explained by service macroeconomic environment. Itani and Mason (2014) looked at the
macro-environment approach to civil aviation strategic planning. By using Structural
Equation Modelling (SEM) significant factors were found to be environmental enablers in
determining the capacity of an economy and society to benefit from the air transport
system’s productivity. The findings direct the organization to consider the environmental
dynamism during the situation analysis part of the strategic planning process.
5.5 Moderating Effect of Macro Environment on the Intervening Effect of Capital
Structure
The fourth objective of the study was to determine moderating effect of macro environment
on the intervening effect of capital structure and performance of energy sector institutions
in Kenya through the hypothesis; there is no significant moderating effect of macro
environment on the intervening effect of capital structure and performance of energy sector
institutions in Kenya. The study revealed that there was a statistically significant
moderating effect of macro environment on the intervening effect of capital structure. The
results show that jointly the variables explain 53.9 percent of the variations in performance
(R2 = .539). Therefore, the hypothesis was supported by the results of the study. The results
show that capital structure and macro environment collectively explain 53.9 percent of
variation in performance. The joint effect was thus higher and significant compared to the
individual effect of individual variables therefore rejecting the hypothesis.
The findings of the study concur with Murgor (2014) who opined that strategy
implementation affects organization performance by anchoring the organization to its
external environment. Effects of strategy implementation on organization performance
may be affected by other variables including capital structure (Dawar, 2014). The
effectiveness of strategy implementation is effected by the individuals involved. The
strategic management process includes analysis, direction setting, developing strategies,
implementation and control (Kotter & Keller, 2012). The three organizational elements

158
that provide fundamental long-term success for a business strategy are leadership, structure
and culture. Strategies entail creating a vision, communicating the strategy and anchoring
new approaches in the culture of an organization (Kotter & Keller, 2012). Strategy is
executed at corporate, business and functional levels of the organization. These strategies
are responsible for ensuring that the firms are competitive (Coulter & Robbins, 2013).
Robin (2014) suggests that well formulated strategies only produce superior performance
for the firm when they are successfully implemented. Studies agree with the nature of
strategic planning, which includes strategy implementation that shows the organizational
characteristics suggested as significant factors for effective strategy implementation. It is
also portrayed as a lively process by which companies identify future opportunities
(Chiang, Kocabasoglu-Hillmer & Suresh, 2012).
The study findings agree with that of Mailu, Ntale and Ngui (2018) who conducted a study
on strategy implementation and organizational performance in the pharmaceutical industry
in Kenya. The purpose of this study was to investigate the strategy implementation and
organizational performance in the Kenyan pharmaceuticals. The study reviewed the effects
of organizational structure, organizational resources and organizational culture on strategy
implementation among the pharmaceutical industry in Kenya. The study applied a
descriptive survey research design and the population target comprised of all the 64
pharmaceutical companies in Nairobi Kenya. Data was collected through the
questionnaires and analysed using descriptive statistics. The findings were presented using
tables and graphs for further analysis and to facilitate comparison. Multiple regressions
were used to estimate the effect of strategy implementation on organizational performance.
The study found out that there was a significant influence of strategy implementation on
organizational performance. The study established that organizational structure,
organizational resources and organizational culture have a significant effect on the
performance of the pharmaceutical industry. Mutua and Atheru (2020) studied the
relationship between capital structure and financial performance of companies listed under
manufacturing and allied sector at Nairobi Securities Exchange in Kenya. The purpose of

159
this study was to assess capital structure and financial performance of companies listed
under manufacturing and allied sector at Nairobi Securities Exchange, Kenya. The study
employed descriptive research design and data was analyzed using multiple regressions.
The target population comprised all the eight companies listed under manufacturing and
allied sector at the Nairobi Security Exchange, Kenya where census approach was
adopted. Results of the study revealed that retained earnings and equity have negative
influence on financial performance of firms listed under manufacturing and allied sector in
Kenya. Long term debt however, was found to have a positive impact on financial
performance. Mwangi (2016) studied the effect of financial structure on financial
performance of firms listed at East Africa Securities Exchanges. Specifically, it evaluated
the effect of short-term debt, long term debt, retained earnings and other shareholders funds
on financial performance. The study concluded that gross domestic product growth rate
had indeed a significant moderating effect. In addition, short term financing was found to
be the preferred choice of financing though equity financing generally contributed more to
financial performance. The study therefore concluded that pecking order theory may not
be applicable in practice, at least at East Africa Securities Exchanges.
Wangombe and Kibati (2019) did a study on the influence of capital structure on financial
performance of licensed microfinance banks in Kenya. The study was descriptive in
nature. The study used panel data of five years. The study population was the microfinance
banks that are licensed to operate in Kenya. The results uncovered that the organizations
used trade credits to back microfinance banks. Further the study demonstrated that, the
authorized microfinance banks considered the utilization of asset-based lenders to
guarantee consistency in capital stream. Essentially, the results additionally demonstrated
that the firm considered the financing through commercial banks as a method for raising
their capital.
Hidayat and Akhmad (2015) examined the effects of environmental factors on corporate
strategy and performance of manufacturing industries in Indonesia. The study looked at

160
previous studies on the environmental factors (external and internal) and their effects on
strategy and performance on the firms. 150 questionnaires were used to obtain the primary
data. To obtain the study samples, random sampling was employed. The study findings
showed that the environmental factors to a great extent affected the integration of their
firm’s environment with the surrounding environment in order to realize the performance
set by the organization. Ibrahim and Primiana (2015) studied the influence of business
environment on the organization performance. The purpose of the study was to find
solutions for problems related to the organization performance when connected with
business environment. The study was theoretical review, especially about the effect of
business environment on the organization performance. The results showed that business
environment has a significant effect on organization performance. Furthermore, it was
found that business environment has implication for organization performance.
VanderWeele (2015) and Hayes (2018a) indicated that moderated mediation allows for an
evaluation conditional indirect effects, which is not the case when mediation and
moderation are tested independently of one another. Moderated mediation analysis allowed
for a simultaneous test of the mediating effect of capital structure and the moderating effect
of macro environment.
5.6 Summary of the Findings
This section presented a summary of the objectives, hypotheses, analytical models.
Summary of the findings were presented in table 4.25
Table 4.25: Summary of the Objectives, Hypotheses, Analytical Models
Objectives Hypothesis Findings
Objective One:
Establish the effects of strategy
implementation on performance
of energy sector institutions in
Kenya;
H01: There is no significant
effect of strategy
implementation on
performance of energy
sector institutions in Kenya
There was a significant
effect of strategy
implementation on
predictor of performance of
energy sector institutions in
Kenya.

161
Objectives Hypothesis Findings
H1 was rejected
Objective Two:
Determine the intervening effect
of capital structure on the
relationship between strategy
implementation and performance
of energy sector institutions in
Kenya
H02: There is no significant
intervening effect of capital
structure on the relationship
between strategy
implementation and
performance of energy
sector institutions in
Kenya.
There was a significant
intervening influence of
capital structure on the
relationship between
strategy implementation
and performance of energy
sector institutions in
Kenya.
H02 was rejected
Objective Three:
Determine the moderating effect
of macro environment on the
relationship between strategy
implementation and performance
of energy sector institutions in
Kenya
H03: There is no significant
moderating effect of macro
environment on the
relationship between
strategy implementation
and performance of energy
sector institutions in
Kenya.
There was a significant
moderating effect of macro
environment on the
relationship between
strategy implementation
and performance of energy
sector institutions in
Kenya.
H03 was rejected
Objective Four:
Determine the moderating effect
of macro environment on the
intervening effect of capital
structure and performance of
energy sector institutions in
Kenya.
H04: There is no significant
moderating effect of macro
environment on the
intervening effect of capital
structure and performance
of energy sector institutions
in Kenya.
There was a significant
moderating effect of macro
environment on the
intervening effect of capital
structure and performance
of energy sector institutions
in Kenya.
H04 was rejected

162
From the results, there is a statistically significant and positive association between strategy
implementation and performance of energy sector institutions in Kenya. Capital structure
and Macro environment were found to significantly intervene and moderate the
relationship between strategy implementation and performance. Regarding the joint effects
the results reveal that this effect is significantly greater than the individual effect of each
variable. Therefore, all four study hypotheses were rejected and the alternative hypothesis
supported.

163
CHAPTER SIX: SUMMARY AND CONCLUSION
6.1 Introduction
This chapter presents a summary of findings of the objectives of the study. The chapter
also presents conclusion drawn from the study findings. The chapters present a summary
of findings of the objectives of the study. Then, recommendation and the implication for
theory, practice and policy are presented. The chapter ends by presenting the limitations of
the study, suggestion on areas for further study and a discussion of the contribution this
research has made to the body of knowledge
6.2 Summary of Findings
The purpose of this study was to investigate the influence of strategy implementation,
capital structure and macro environment on the performance of Energy sector institutions
in Kenya. There were four specific objectives out of which four hypotheses were developed
and tested.
6.2.1 Strategy Implementation and Performance
The first objective was to determine the relationship between strategy implementation and
the performance of Energy sector institutions in Kenya. A hypothesis was developed on
this objective which stated there is no significant relationship between strategy
implementation and performance and thereafter tested. The research findings established
that the hypothesis was rejected and the alternative hypothesis supported.
6.2.2 Strategy Implementation, Capital Structure and Performance
The second objective of the study was to determine the intervening effect of capital
structure on the relationship between strategy implementation and performance of Energy
sector institutions in Kenya. A hypothesis was developed on this objective which stated
that there is no significant intervening effect of capital structure on the relationship between
strategy implementation and performance. Baron and Kenny (1986) approach was used to
test the hypothesis. The results provided evidence to support capital structure intervenes

164
the relationship between strategy implementation and performance and hence the
hypothesis was rejected and the alternative hypothesis supported.
6.2.3 Strategy Implementation, Macro Environment and Performance
The third objective of the study was to determine the moderating effect of macro
environment on strategy implementation and performance of Energy sector institutions in
Kenya. This was done through formulating and testing the hypothesis that states there is
no significant moderating effect of macro environment on the relationship between strategy
implementation and performance. Baron and Kenny (1986) approach was used to test the
hypothesis. The results provided evidence to support macro environment moderates the
relationship between strategy implementation and performance and hence the hypothesis
was rejected and the alternative hypothesis accepted.
6.2.4 Moderating Effect of Macro Environment on the Intervening Effect of Capital
Structure
The fourth objective of the study was to determine the moderating effect of macro
environment on the intervening effect of capital structure and performance of energy sector
institutions in Kenya. A hypothesis stating there is no significant moderating effect of
macro environment on the intervening effect of capital structure and performance of energy
sector institutions in Kenya was formulated and tested. The hypothesis was tested using
stepwise regression analysis. The research findings showed that there was a statistically
significant moderating effect of macro environment on the intervening effect of capital
structure.
6.3 Conclusion
6.3.1 Strategy Implementation and Organization Performance
The overall objective of the study was to investigate the influence of strategy
implementation, capital structure and macro environment on the performance of Energy
sector institutions in Kenya. The study prepared a conceptual framework that was used to

165
test this relationship. Data was collected using questionnaire from employees of energy
sector institutions in Kenya. The data facilitated in the testing of the model.
The findings show that the relationship between strategy implementation and performance
is statistically significant. The findings in the study suggested that strategy implementation
attributes that include leadership, structure, responsibility and accountancy and culture had
a great influence on performance. The results of this study therefore provide a concrete
reason to give more attention on strategy implementation to be able to achieve better
outcomes. The study further concluded that effective strategy implementation should
devise internal action approaches, develop effective strategies to improve organizational
performance, attain clarity of future direction, assign team work and expertise based on
resources, deal effectively with organizational changes and uncertainties in external
environment, processes and people and make appropriate choices and priorities in order to
achieve better organizational performance. The study findings observed that a proposed
structure is a precursor to a great organizational performance and a successful strategy
implementation.
6.3.2 Strategy Implementation, Capital Structure and Organizational Performance
On testing the effect of capital structure on the relationship between strategy
implementation and performance, the study established a significant intervening effect of
capital structure on the relationship between strategy implementation and performance.
The study further concluded that an appropriate capital structure is a critical decision for
any business organization. The decision is significant not just on account of the need to
increase the returns of various departments, yet additionally due to the effect such a
decision has on the capacity of the organization to manage its ever-competitive
environment. When set up, this capital structure ought to give more noteworthy returns to
the investors than they would get from an all equity-value firm.

166
From the findings, it is prudent for organizations’ management to be keen on current and
emerging issues in the external environment such as emerging technologies, new legal
regulations, inflation, customer behavior, competition, supplier challenges, sponsor
demands, political shifts among other issues that may affect strategy implementation for
effective organizational performance. Failure to be on the lookout for environmental shifts,
adaptation and response may lead to loss of market share, losses and at times extinction.
6.3.3 Strategy Implementation, Macro Environment and Performance
On testing effect of macro environment on the relationship between strategy
implementation and performance, the study found that macro environment moderates the
relationship between strategy implementation and performance. Finally, the study’s
conceptual model was tested and retained as is by empirical evidence hence pointing to the
likelihood of the organizational performance being influenced by more than one variable.
The retention of the model therefore, served to validate the main objective of this study
that capital structure and macro environment significantly influence the relationship of
strategy implementation and performance of energy sector institutions in Kenya.
Organizational external environment consists of the micro and macro environments. In this
regard it is prudent for organizations’ management to be keen on current and trending
issues, emerging technologies, new legal regulations, inflation, customer behavior,
competition, supplier challenges, sponsor demands, political shifts among other issues that
may affect their organizational performance. Failure to be on the lookout for environmental
shifts, adaptation and response may lead to loss of market share, losses and at times
extinction. Energy sector institutions operate in open systems where they transact with the
environment. They are thus affected by environmental changes in the micro and macro
environments.
The study found that most of the surveyed institutions used appropriate technologies and
constantly updated the technology and systems to the latest for efficiency and effective

167
power distribution. Customer service agents in the energy sector institutions can serve
customers since the available puts all the information needed available to both parties.
Hence from the findings, it is evident that Technology infrastructure is an important factor
in achieving business objectives and hence firms need to be technologically ready to take
on the strategic challenges that can fuel growth. Additionally, firms with higher
technological capability are able to deliver their services effectively. The implementation
of strategy is affected by technological innovations, in that improved technology facilitates
efficient communication and adoption of effective strategies for better firm performance.
The study findings further indicated that harmonious working relationship among all
stakeholders was crucial in strategy implementation for efficient firm performance. The
firms were careful to promote positive public image as they implemented their strategies.
A good social environment is hence necessary for implementation of strategy to influence
better firm performance.
6.3.4 Moderating Effect of Macro Environment on the Intervening effect of Capital
Structure
On testing the moderating effect of macro environment on the intervening effect of capital
structure. The findings indicated presence of debt covenant agreements of the surveyed
firms with external financiers and that most of the firms had large assets to be used as
security when acquiring loans. Effective debt covenants facilitate development and
implementation of right strategies that steer a firm to increase its income to enable it clear
debt and enjoy profits hence better performance. The study also found that high-growth
firms are less likely to include covenants that limit investment activities and asset sales, as
well as covenants that restrict dividend payments to shareholders. Ecological factors were
found to affect the firms when implementing strategy as well as competitors were found to
greatly affect market.
The findings also revealed that when the when interaction term was introduced, indicated
a significant relationship, thus macro environment was found to moderate the relationship

168
between capital structure and performance (moderated mediation). Therefore, it was
concluded that, the introduction of macro environment had an enhancing moderating effect
on the relationship between capital structure and performance. Hence from the findings,
firms ought to be keen on monitoring changes and competition present in the economic
environment in order to formulate and adopt effective strategies for efficient firm
performance.

169
CHAPTER SEVEN: RECOMMENDATIONS
7.1 Introduction
The objective of the study was to investigate the influence of strategy implementation,
capital structure and macro environment on the performance of Energy sector institutions
in Kenya. This chapter presents the recommendations and limitations of the study. It also
discusses the implication of this study on theory, policy and practice.
7.2 Implications of the Study
The study was anchored mainly on the institutional theory, open systems theory, pecking
order theory and Resource based view theory. The overal purpose of this study was to
determine the influence of strategy implementation, capital structure and macro
environment on the performance of Energy sector institutions in Kenya: Specifically,
Determine the relationship between strategy implementation and the performance of
Energy sector institutions in Kenya; Determine the intervening effect of capital structure
on the relationship between strategy implementation and performance of Energy sector
institutions in Kenya; Determine the moderating effect of macro environment on strategy
implementation and performance of Energy sector institutions in Kenya; Determine the
moderating effect of macro environment on the intervening effect of capital structure. The
findings have several implications on strategic management theory, policy, practice and
methodology as discussed below.
7.2.1 Theoretical Implications
The study found that strategy implementation had a positive effect on performance of
energy sector institutions in Kenya. The findings in the study concurs with institutional
theory which suggest that organizations are deeply embedded in an expansive environment
and consequently become influenced by the pressures and constraints of this environment.
The institutional theory assumes that organizations are influenced by normative
reassurance arising from external forces such as the state and sometimes arising from forces

170
within. This theory is concerned with how information flow in an organizational structure
affects its performance. The adoption of this theory enables the organization to coordinate
different resources towards a given strategy implementation reducing chances of any
deviations from the anticipated results. The institutional theory also emphasizes the logic
and the thinking of the senior managers and how they interpret their business environment
and its challenges; and how these same processes define their collective purposes and
organizational arrangements, the institutionalist perspective challenges the quasi-rational
strategic thinker central to much strategic management theorizing. This theory is relevant
in that the institutional theory may help students of organizational culture to explore how
cultures within organizations are worked out in relation to cultures outside organizations.
The theory is significant since it will also help the government look at the possibility of the
influencing or improving existing laws and regulations in the implementation of strategies.
7.2.2 Implication on Policy
The study has examined ways by which strategy implementation affects performance of
institutions in the energy sector in Kenya. Also, the study examined the moderating effect
of macro environment and intervening effect of capital structure between strategy
implementation and performance. Centered on the research findings, recommendations are
made that best practices that were identified in the process of implementation of strategy
ought to be done while putting into consideration the effects of external environment in
order to attain superior performance. The study is useful to policy-making agencies as it
will guide in formulation of policies that could enforce best practices in development of
formal guidelines for strategy implementation, performance management s and
establishment of key performance indicators to increase level of success of institutions in
the energy sector in implementation of strategy.
The study recommends that Policy guidelines should be developed to support institutions
in Energy sector access capital, build capacity and adopt appropriate technology and earn
a fair return on their investment. In addition, policy makers should enhance Political

171
support and develop enabling Laws, policies and regulations which facilitate investment
for superior performance by Energy Sector Institutions.
Managers in institutions in the energy sector ought to formulate policies that facilitate
development of leadership and appropriate structures. In addition, the policis should enable
employees to acquire adequate knowledge and skills to perform their duties, encourage
employee participation in formation and implementation of strategy as well as provide
adequate resources for strategy implementation, all these geared towards better
organization performance. Additionally, policies that promote harmonious working
relationship among all stakeholders should be enhanced for efficient strategy
implementation. The study recommended that employees should be enlightened on the
strategies that the organization aim to adopt to eradicate the possibility of opposition to its
implementation and other challenges faced in the process of changes.
7.2.3 Implication on Practice
The study showed that each of the tested variables had an effect on performance either
individually or jointly. The findings suggested that leaders in the energy sector institutions
define key and crucial organizational strategic change moments, create appropriate
strategies and translate such strategies to action in operational terms for the change
direction required. Hence the study advocates for strategic leadership to be enhanced in
institutions in the energy sector to harness and deploy requisite organizational capabilities
that allow the organizations achieve their goals and objectives through formulating and
implementing necessary strategies to ensure successful performance.
The choice of financing makes cost of capital a crucial variable for every organization since
it determines the company’s capital structure and hence management of institutions in the
energy sector ought to develop and implement right strategies which provide adequate
funding and also minimize cost of capital for improved firm performance. Additionally,
management of institutions in the energy sector ought to promote effective debt covenants

172
which facilitate development and implementation of right strategies that steer a firm to
increase its income to enable it clear debt and enjoy profits hence better performance.
Organizational macro environment was found to affect the relationship between strategy
implementation and performance and hence it is prudent for organizations’ management to
be keen on current and trending issues, emerging technologies, new legal regulations,
inflation, customer behavior, competition, supplier challenges, sponsor demands, political
shifts among other issues that may affect implementation of strategy to enhance
organizational performance. The study results revealed that the macro environment had a
positive and significant effect between strategy implementation and performance. This
study there recommends that the linkages between macro environment and strategy
implementation should not be ignored.
7.3 Limitation of the Study
Among the key challenges faced in the course of the study, confidentiality of information
was a key constraint as some respondents appeared to withhold crucial information
pertinent to the achievement of the study objectives. It was necessary therefore for the
researcher to explain to the respondents that the study was only meant for education
purposes. The researcher also presented the introductory letter from the University to prove
to them that the research had no negative motive as it is meant for education purposes.
The study was conducted only among key players under energy sector engaged in policy
and regulation, generation, transmission and distribution and therefore the results from this
research should be generalized with caution. The study adopted a cross-sectional survey
research design since it had clearly stated hypotheses or investigative questions. The design
however has the disadvantage that it cannot establish causality among variables. Thus,
while the study could establish the direction and nature of relationships among variables,
it may not establish the causality effects among the variables.

173
Similarly, the selection of strategy implementation parameters included in the
operationalization of study variables was not exhaustive. Therefore, other factors could
provide additional insights into the effect of strategy implementation on performance of
energy sector institutions. The major underlying issues driving the study variables as
identified by factor analysis could provide a good start. The inclusion of more variables
and application of more robust set of statistical tools apart from those used in this study
could increase the robustness of study models and hence the validity of the results.
Therefore, the study would serve as an important reference for future research on strategy
implementation and performance of energy sectors.
7.4 Suggestions for Further Research
The study sought to establish the relationship between strategy implementation, capital
structure and macro environment on performance of the energy sector institutions in
Kenya. Further studies should also consider introducing different variables other than
capital structure and macro environment in testing for intervening and moderating effect.
Secondly the current study used quantitative measures of performance energy sector
institutions performance. A similar study could be conducted based both qualitative and
quantitative measures of performance by using institutional records like performance
contracting.
The cross-sectional design adopted by this study limited the ability to draw hard
conclusions about the direction of causality on the variables studied. For instance,
institutions that are good at implementation of their selected strategies may be better at
hiring and ensuring that their employees are better equipped to do their jobs. Future
research could use longitudinal design set up to address this limitation and draw specific
conclusions on the direction of causality. This could further widen the scope of the current
study. Further research may validate the findings and conclusions of the study in a different
time frame. It would be interesting to carry out a similar research in the same sector so as
to come up with strategies that integrate various strategies, environment and fiscal
structures of the institutions. Future study could be done on other sectors other than energy

174
and compare the similarities and differences that will be established in these sectors. The
scope of this study was energy sector institutions in Kenya. The study recommends that
researchers replicate this study in other studies. Both the contextual and organizational
factors in these other sectors will be different and so are bound to influence the study
variables differently.
7.4.1 Chapter Summary
This chapter has presented a summary of the study, conclusion and the recommendations.
The chapter discussed the findings of the study where all the hypotheses were supported as
statistically significant. Conclusion of the study was discussed. The chapter discussed the
various implications of the study on theory, managerial practice, policy and methodology.
This study recommendations and suggestions for future study were discussed. The chapter
concluded by discussing limitations of the study, bearing in mind that the respondents were
rigid and not enthusiastic to participate in the study.

175
REFERENCES
Abass, M. K., Munga, J., & Were, E. (2017). The relationship between strategy
implementation and performance in county governments of Kenya: A case study of
Wajir County government. International Academic Journal of Human Resource
and Business Administration, 2(3), 381-401.
Abata, M. A., Migiro, S. O., Akande, J. O., & Layton, R. (2017). Does Capital Structure
Impact on the Performance of South African Listed Firms?. Acta Universitatis
Danubius. Œconomica, 13(6).
Abata, M.A., & Migiro, S.O. (2016). Capital structure and firm performance in Nigerian-
listed companies. Journal of Economics and Behavioral Studies, 8(3), 5474.
Abdul, M. (2015). Investigating capital structure decisions and its effect on the Nigerian
capital market. Second 21st Century Academic Forum Conference Proceedings,
Boston, USA at Harvard.
Abdullah, H., H., & Siam, M. (2014). The influence of organizational structure and
organization culture on the organizational performance of higher educational
institutions: The moderating role of strategy communication. Asian Social Science,
10 (13). pp. 142-154. ISSN 1911-2017
Abok, A. M. (2014). Factors affecting effective implementation of strategic plans in non-
governmental organizations in Kenya (Doctoral dissertation).
Abor, J. (2007). Corporate governance and financing decisions of Ghanaian listed firms.
Corporate Governance: The International Journal of business in society, 7(1), 83-
92.
Abubakar, A. (2016). Financial leverage and financial performance: Evidence from the
health care sector of the Nigerian stock exchange from 2005-2014. ADSU Journal
of, 45-64.
Abubakar, A. (2017b). Financial leverage and financial performance of quoted industrial
goods firms in Nigeria. KASU Journal of Management Science, 8 (2),89- 108.
Abubakar, A., Maishanu, M. M., Abubakar, M. Y., & Aliero, H. M. (2018). Financial
leverage and financial performance of quoted conglomerate firms in Nigeria.
Sokoto Journal Management Studies, 14 (1), 85- 100.

176
Aggarwal, D., & Padhan, P. C. (2017). Impact of capital structure on firm value: evidence
from Indian Hospitality Industry. Theoretical Economics Letters, 7(4), 982-1000.
Agnihotri, A. (2014). Impact of Strategy–Capital Structure on Firms' Overall Financial
Performance. Strategic Change, 23(1‐2), 15-20.
Ahmad, N., & Ali, M. (2016). Impact of capital structure on firm's financial performance:
Cement industry of Pakistan. European Journal of Business and
Management, 8(4).
Ahmad, S. N. (2018). Capital structure and firm performance: Moderating role of business
strategy and competitive intensity (Doctoral dissertation). COMSATS University
Islamabad
Ahmad, Z., & S. Yousaf. (2018). Impact of Capital Structure, Dividend Policy and
Sustainability on Value of Firm: A Case Study of Spinning Textile Sector of
Pakistan. World Academy of Science, Engineering and Technology, International
Journal of Economics and Management Engineering 5 (1).
Ahmad, Z., Abdullah, N. M. H., & Roslan, S. (2012). Capital structure effect on firm’s
performance: Focusing on consumers and industrials sectors on Malaysian firms.
International Review of Business Research Papers, 8(5), 137 – 155.
Ahmadi, A., Ali, S., Salamzadeh, Y., Daraei, M., & Akbari, J. (2012). Relationship
between organizational culture and strategy implementation: Typologies and
dimensions. Global Business & Management Research, 4.
Ajayi, A. (2016). Impact of external business environment on organisational performance
of small and medium scale enterprises in Osun State, Nigeria. Scholedge
International Journal of Business Policy & Governance, 3(10), 155-166.
Akeem, L. B., Terer, E. K., Kiyanjui, M. W., & Kayode, A. M. (2014). Effects of capital
structure on firm’s performance: Empirical study of manufacturing companies in
Nigeria. Journal of Finance and Investment analysis, 3(4), 39-57.
Akingunola, R. O., Olawale, L. S., & Olaniyan, J. D. (2018). Capital structure decision and
firm performance: Evidence from non-financial firms in Nigeria. Acta Universitatis
Danubius. Œconomica, 13(6).

177
Akomeah, E., Bentil, P., & Musah, A. (2018). The impact of capital structure decisions on
firm performance: The case of listed non-financial institutions in Ghana.
International Journal of Academic Research in Accounting, Finance and
Management Sciences, 8(4), 1-15.
Akpoviroro, K. S., & Owotutu, S. O. (2018). Impact of external business environment on
organizational Performance. IJARIIE, 4(3), 498-506.
Alavi, S., Wahab, A. D. Muhamad N., & Shirai, A. B. (2014). Organic Structure and
Organizational Learning as the Main Antecedents of Workforce Agility.
International Journal of Production Research. 52(21), 6273-6295.
Alharthy, A. H., Rashid, H., Pagliari, R., & Khan, F. (2017). Identification of strategy
implementation influencing factors and their effects on the performance.
Management Research Review, 41(1), 46-73.
Allwood, C. M. (2012). The distinction between qualitative and quantitative research
methods is problematic. Quality & Quantity: International Journal of
Methodology, 46(5), 1417–1429.
Almajali A. Y., Alamro S.A. and Al-Soub, Y. Z. (2012). Factors Affecting the Financial
Performance of Jordanian Insurance Companies Listed at Amman Stock Exchange.
Journal of Management research, Vol. 4(2), pp 266-289.
Anafo, S. A., Amponteng, E., & Yin, L. (2015). The impact of capital structure on
profitability of banks listed on the Ghana stock exchange. Research Journal of
Finance and accounting, 6(16), 26-34.
Anastasiadou, S. (2011). Reliability and Validity Testing of a New Scale for Measuring
Attitudes Towards Learning Statistics with Technology. Acta Didactica
Napocensia, 4(1), 1-10.
Andrews, R., Beynon, M. J., & Genc, E. (2017). Strategy implementation style and public
service effectiveness, efficiency, and equity. Administrative Sciences, 7(1), 4.
Andrews, R., Boyle, G. A., Law, J., & Walker, R. M. (2011). Strategy implementation and
public service performance. Administration & Society, Vol 43 (6) Sage
Publications, 643-671.

178
Anowar, Z. (2016). Capital Structure and Profitability of Bangladeshi Firms: A Causal
Investigation. Universal Journal of Accounting and Finance, 4(4), 130-35.
Ansoff, H.I., & Mc Donnell, E.J. (1990). Implanting Strategic Management. (2nd ed). New
York: Prentice Hall.
Anwar, W. (2011). Cross-industry determinants of capital structure: Evidence from
Pakistani data. African Journal of Business Management, 7(17), 1625-1629.
ARE (2012). Rural electrification with renewable energy. Technologies, qualities and
business models. Alliance for Rural Electrification, Brussels, Belgium.
Arulvel, K., & Ajanthan, A. (2013). Capital structure and financial performance: A study
of listed trading companies in Sri Lanka. ACADEMICIA: An International
Multidisciplinary Research Journal, 3(6), 1-13.
Ashraf, M., Ameen, A., & Shahzadi, K. (2017). The Impact of Capital Structure on Firm’s
Profitability: A Case of Cement Industry of Pakistan. International Journal of
Business and Social Science, 8(4), 140-147.
Awais, M., Iqbal, W., Iqbal, T., & Khursheed, A., (2016). Impact of capital structure on
the firm performance: Comprehensive study of Karachi stock exchange, Science
International, 28 (1), 501-507.
Awino, Z. B. and Gituro W. (2011). An Empirical Investigation of Supply Chain
Management Best Practices in Large Private Manufacturing Firms in Kenya. Prime
Journals. Business Administration and Management (BAM). 1(2), 26-31.
Awunyo-Vitor, D., & Badu, J. (2012). Capital structure and performance of listed banks in
Ghana. Global Journal of Human Social Science, 12 (5).
Aziz, S., & Abbas, U. (2019). Effect of Debt Financing on Firm Performance: A Study on
Non-Financial Sector of Pakistan. Open Journal of Economics and
Commerce, 2(1), 8-15.
Badar, R., & Saeed, A. (2013). Impact of capital structure on performance empirical
evidence from sugar sector of Pakistan. European Journal of Business and
Management, 5(5), 78-86.
Bali, N. P., Gupta, P. N., & Gandhi, C. P. (2007). A textbook of quantitative techniques.
Firewall Media.

179
Balios, D., Daskalakis, N., Eriotis, N., & Vasiliou, D. (2016). SMEs capital structure
determinants during severe economic crisis: The case of Greece. Cogent Economics
& Finance, 4(1), 1145535.
Banahene, S., Ahudey, E., & Mensah, C. (2016). Analysis of Macro Environment for
Strategy Implementation: What is important to Handicraft Export Organisations in
Ghana? International Journal of Business Management and Economic
Research, 7(3), 632-642.
Bandyopadhyay, A., & Barua, N. M. (2016). Factors determining capital structure and
corporate performance in India: Studying the business cycle effects. The Quarterly
Review of Economics and Finance, 61, 160-172.
Barney, J. (1991). Firm Resources and Sustained Competitive Advantage. Journal of
Management, 17(1), 99-120.
Barney, J. B. (2002). Gaining and Sustaining Competitive Advantage (2nd ed.). Upper
Saddle River, NJ: Prentice Hall.
Baron, R. M., & Kenny, D. A. (1986). The moderator-mediator variable distinction in
social psychological research: Conceptual, strategic and statistical considerations.
Journal of Personality and Social Psychology, 51(6), 1173-1182.
Baroto, M. B., Arvand, N., & Ahmad, F. S. (2014). Effective strategy implementation.
Journal of Advanced Management Science, 2(1), 50-54.
Beggs, J. J. (1995). The institutional environment: Implications for race and gender
inequality in the U.S. labor market. American Sociological Review, 60, 613-633.
Berger, A. N., & Di Patti, E. B. (2006). Capital structure and firm performance: A new
approach to testing agency theory and an application to the banking
industry. Journal of Banking & Finance, 30(4), 1065-1102.
Bhattacherjee, A. (2012). Social Science Research: Principles, Methods, and Practices,
Textbooks Collection. Book 3. http://scholarcommons.usf.edu/oa_textbooks/3.
Bickel, P. J., & Doksum, K. A. (2015). Mathematical statistics: basic ideas and selected
topics, volume I (Vol. 117). New York: Chapman and Hall/CRC Press.

180
Birru, M. W. (2016). The impact of capital structure on financial performance of
commercial banks in Ethiopia. Global Journal of Management and Business
Research, 16(8), 2249-4588.
Blimpo, M., S. McRae, & J. Steinbuks. (2018). Why are connection charges so high? an
analysis of the electricity sector in Sub-Saharan Africa. Policy Research Working
Paper, World Bank, Washington, DC.
Bolker, B. M., Brooks, M. E., Clark, C. J., Geange, S. W., Poulsen, J. R., Stevens, M. H.
H., & White, J. S. S. (2009). Generalized linear mixed models: a practical guide for
ecology and evolution. Trends in ecology & evolution, 24(3), 127-135.
Brendea, G. (2012). The impact of the recent financial crisis on the capital structure choices
of the Romanian listed firms. Review of Economic Studies and Research Virgil
Madgearu, 6(2), 15-22.
Bridoux, F. (2004). A resource-based approach to performance and competition: An
overview of the connections between resources and competition. Luvain, Belgium
Institut et de Gestion, Universite Catholique de Louvain, 2(1), 1-21.
Bryman, A. (2012). Social Research Methods (4th ed.). New York, Oxford University Press
Inc.
Bryman, A., & Bell, E. (2011). Ethics in business research. Business Research
Methods, 7(5), 23-56.
Bryson, J. M. (2011). Strategic planning for public and nonprofit organizations (4th ed.).
Wiley: New York.
Burlton, R. T. (2015). Delivering business strategy through process management.
In Handbook on Business Process Management. Springer, Berlin, Heidelberg.
Burnes, B. (2004). Managing change: A strategic approach to organisational dynamics.
Pearson Education.
Butler, M., & Kazakov, D. (2010). Modeling the behavior of the stock market with an
artificial immune system. In Evolutionary Computation (CEC), 2010 IEEE
Congress on (pp. 1-8).

181
Calciolari, S., Prenestini, A., & Lega, F. (2018). An organizational culture for all seasons?
How cultural type dominance and strength influence different performance
goals. Public Management Review, 20(9), 1400-1422.
Čater, T., & Pučko, D. (2010). Factors of effective strategy implementation: Empirical
evidence from Slovenian business practice. Journal for east european Management
Studies, 207-236.
Chadha, S., & Sharma, A. K. (2015). Capital structure and firm performance: Empirical
evidence from India. Vision, 19(4), 295-302.
Chava, S., Kumar, P., & Warga, A. (2010). Managerial agency and bond covenants. The
Review of Financial Studies, 23(3), 1120-1148. Chen, L., Ellis, S. C., Suresh, N., Brown, S., & Hill, A. (2016). A Supplier Development
Adoption Framework using Expectancy Theory. International Journal of
Operations & Production Management, Vol. 36 No. 5.
Cherugutt, K. B., & Juma, D. (2016). Determinants of Strategy Implementation at Libya
Oil (Kenya). The Strategic Journal of Business and Change Management, 3(4),
502-519.
Chiang, C. Kocabasoglu-Hillmer, C.& Suresh, N. (2012). An empirical investigation of the
impact of strategic sourcing and flexibility on firm's supply chain agility.
International Journal of Operations and Production Management, 32 (1), 49-78.
Chinaemerem, O. C., & Anthony, O. (2012). Impact of capital structure on the financial
performance of Nigerian firms. Arabian Journal of Business and Management
Review (OMAN Chapter), 1(12), 43.
Chiuri, B. W. (2015). Challenges of strategy implementation in higher education
institutions in Kenya (Doctoral dissertation, JKUAT).
Chung, Y. P., Na, H. S., & Smith, R. (2013). How important is capital structure policy to
firm survival? Journal of Corporate Finance, 22, 83-103.
Cohen, D. J., & Crabtree, B. F. (2008). Evaluative criteria for qualitative research in health
care: controversies and recommendations. The Annals of Family Medicine, 6(4),
331-339.

182
Cole, C., Yan, Y., & Hemley, D. (2015). Does capital structure impact firm performance:
An empirical study of three US sectors. Journal of Accounting and Finance, 15(6),
57.
Collis, J., & Hussey, R. (2013). Business research: A practical guide for undergraduate
and postgraduate students. Macmillan International Higher Education, 175 Fifth
Avenue, New York, NY.
Cooper, D. R. & Schindler, P. S. (2013). Business research methods (12thed.). New York,
NY. McGraw-Hill/Irwin.
Coulson‐Thomas, C. (2013). Implementing strategies and policies. Strategic Direction, 29
(3), 33-35
Coulter, S.P., & Robbins, M. (2013). Management (12th ed.). Harlow, UK: Pearson.
Creswell, J. W., & Creswell J. D. (2017). Research Design: Qualitative, Quantitative, and
Mixed Methods Approaches. (5th ed). Los Angeles: SAGE, 2018
Črnigoj, M., & Mramor, D. (2009). Determinants of capital structure in emerging European
economies: Evidence from Slovenian firms. Emerging Markets Finance and
Trade, 45(1), 72-89.
Dada, A. O., & Ghazali, Z. B. (2016). The impact of capital structure on firm performance:
Empirical evidence from Nigeria. Journal of Economics and Finance, 7(4), 23-30.
Dada, A. O., & Ghazali, Z. B. (2016). The impact of capital structure on firm performance:
Empirical evidence from Nigeria. Journal of Economics and Finance, 7(4), 23-30.
Dao, B. T. T., & Ta, T. D. N. (2020). A meta-analysis: capital structure and firm
performance. Journal of Economics and Development, Vol. 22 No. 1, pp. 111-129.
Daskalakis, N., Jarvis, R. & Schizas, E. (2013). Financing practices and preferences for
micro and small firms. Journal of Small Business and Enterprise Development,
20(1), 80-101.
Dawar, V. (2014). Agency theory, capital structure and firm performance: some Indian
evidence. Managerial Finance, 40 (12), 1190 – 1206.
DeFusco, R. A., McLeavey, D. W., Pinto, J. E., Anson, M. J., & Runkle, D. E. (2015).
Quantitative investment analysis. New York: John Wiley & Sons.

183
Detthamrong, U., Chancharat, N., & Vithessonthi, C. (2017). Corporate governance,
capital structure and firm performance: Evidence from Thailand. Research in
International Business and Finance, 42, 689-709.
Dimaggio, P. J., & Powell, W. W. (1991). The iron cage revisited: institutional
isomorphism and collective rationality in organizational fields. In W. W. Powell &
P. J. DiMaggio (Eds.). The new institutionalism in organizational analysis.
Chicago: The University of Chicago Press.
Dragnić, D. (2014). Impact of internal and external factors on the performance of fast-
growing small and medium businesses. Management-Journal of Contemporary
Management Issues, 19(1), 119-159.
Easterby-Smith, M., Thorpe, R., & Jackson, P. R. (2012). Management research. Sage. Easton, G. (2010). Critical realism in case study research. Industrial marketing
management, 39(1), 118-128.
Ebaid, I. E. S. (2009). The impact of capital‐structure choice on firm performance:
empirical evidence from Egypt. The journal of risk Finance, 10(5), 477-487.
Echekoba, F., & Ananwude, A. (2016). The effect of financial structure on the performance
of Nigeria consumer goods firms. Journal of Scientific Research & Reports, 10(4),
1-15.
Edwards, J. R., & Lambert, A. L. (2007). Methods for integrating moderation and
mediation: A general analytical framework using moderated path analysis.
Psychological Methods, 12, 1-22.
Emeka, N., & Eyuche, A. H. (2014). Environmental factors and organizational
performance in Nigeria: A study of Juhel company. World Engineering & Applied
Sciences Journal, 5(3), 75-84.
Enakirerhi, L. I., & Chijuka, M. I. (2016). The Determinants of Capital Structure of FTSE
100 Firms in the UK: A Fixed Effect Panel Data Approach. Research Journal of
Finance and Accounting, 7(13), 59-73.
Enekwe, C. I., Agu, C. I., & Eziedo, K. N. (2014). The effect of financial leverage on
financial performance: Evidence of quoted pharmaceutical companies in
Nigeria. Journal of Economics and Finance, 5(3), 17-25.

184
Energy in Kenya. (2013). Presented at the Energy Scenarios Workshop, Institute of
Economic Affairs. Retrieved from file:///C:/Users/Desmond/Downloads/Energy-
Scenarios.pdf
Ennis, C. D., & Chen, S. (2012). Chapter 16: Interviews and focus groups. In K. Armour
& D. Macdonald (Eds.), Research methods in physical education and youth sport
(pp. 217-236). New York: Routledge.
ERC (2019). Register of Licenses and Permits for Electric Power Undertakings as At
February 2019. Retrieved from file://www.erc.go.ke/download/register-of-
licenses-and-permits-for-electrical-power-undertakings/
Fairchild, A. J., & MacKinnon, D. P. (2009). A general model for testing mediation and
moderation effects. Prevention Science, 10, 87-99.
Farquhar, J. D. (2012). Case study research for business. Sage Publications Ltd.
Fatoki, O. I. (2018). Effect of Financial Performance on Capital Structure of Non-
Financial Firms in the Nigerian Stock Exchange (Doctoral dissertation, JKUAT-
COHRED).
Ferlie, E., & Ongaro, E. (2015). Strategic management in public services organizations:
Concepts, schools and contemporary issues. London: Routledge
Ferlie, E., & Ongaro, E. (2015). Strategic management in public services organizations:
Concepts, schools and contemporary issues. Routledge.
Foss, K., Foss J. N., Klein G. P., & Klein K. S. (2007b). The Entrepreneurial Organization
of Heterogeneous Capital. Journal of Management Studies, 44(7), 1165.
Fosu, S. (2013). Capital structure, product market competition and firm performance:
Evidence from South Africa. The quarterly review of economics and finance, 53(2),
140-151.
Freeman, S.J., & Ehrhardt, K. (2012). The antecedents of downsizing, In Cooper, C. L.,
Pandey, A. and Campbell Quick, J. (eds.) Downsizing. Is LessStill More?
Cambridge, Cambridge University Press.

185
Gachua, M. W., & Orwa, B. H. (2015). Factors Affecting Strategy Implementation in
Public Universities in Kenya: Case of Jomo Kenyatta University of Agriculture and
Technology. International Journal of Education and Research, 3(12), 313-326.
Ganiyu, Y. O., Adelopo, I., Rodionova, Y., & Samuel, O. L. (2019). Capital structure and
firm performance in Nigeria. African Journal of Economic Review, 7(1), 31-56.
Gebczynska, A. (2016). Strategy Implementation Efficiency on the Process Level.
Business Process Management Journal, 22(6), 1079-1098.
Gebhardt, K. M., & Eagles, O.S. (2014). Factors leading to implementation of strategy
plans for parks and recreation in province of Ontario, Canada: Chicago: American
Library Association
Genc, E. (2017). Strategy implementation, organizational culture and performance in
Turkish local government (Doctoral dissertation, Cardiff University).
Georgakakis, D. (2014). Antecedents and Consequences of Top Management Team
Diversity: Expanding the Upper Echelons Research Stream. Dissertation of the
University of St. Gallen, School of Management, Economics, Law, Social Sciences
and International Affairs, 1-179.
Getahun, M. (2014). Determinants of Capital structure and its impact on the Performance
of Ethiopian insurance industry (Doctoral dissertation, Jimma University).
Getz, G., & Lee, J. (2011). Why Your Strategy Isn't Working. Business Strategy Series,
12(6), 303-307.
Gharaibeh, A. M. (2015). The effect of capital structure on the financial performance of
listed companies in Bahrain bourse. Journal of Finance and Accounting, 3(3), 50-
60.
Ghasemi, A. and Zahediasl, S. (2012). Normality tests for statistical analysis: A guide for
non-statisticians, International Journal of Endocrinology and Metabolism, 10(2),
pp. 486– 489.
Githire, C., & Muturi, W. (2015). Effects of capital structure on financial performance of
firms in Kenya: Evidence from firms listed at the Nairobi securities
exchange. International journal of economics, commerce and management, 3(4),
1-10.

186
Government of Kenya (2013). Sessional Paper Number 4 on Energy. Ministry of Energy,
Nairobi.
Griffin, R. W. (2013). Management. USA: Cegage Learning.
Guo, T., Wang, G., & Wang, C. (2017). Empirical Study on the Effect of Environmental
Factors on Enterprise Growth-Comparative Analysis of Chinese Large-Scale
Industrial Enterprises and Small/Medium Industrial Enterprises. Eurasia Journal of
Mathematics, Science and Technology Education, 13(11), 7549-7559.
Habib, H. J., Khan, F., & Wazir, M.I., (2016). Impact of debt on profitability of firms;
evidence from non-financial sector of Pakistan. City University Research Journal
6(1), 70-80.
Hammersley, M. (2015). On ethical principles for social research. International Journal of
Social Research Methodology, 18(4), 433-449.
Hantiro, S. B., & Maina, R. (2020). Strategy Implementation and Performance of Tana
River County Government, Kenya. Journal of Strategic management, 4(1), 16-34.
Hasan, M. B., Ahsan, A. M., Rahaman, M. A., & Alam, M. N. (2014). Influence of capital
structure on firm performance: Evidence from Bangladesh. International Journal
of Business and Management, 9(5), 184.
Hasan, M. B., Ahsan, A. M., Rahaman, M. A., & Alam, M. N. (2014). Influence of capital
structure on firm performance: Evidence from Bangladesh. International Journal
of Business and Management, 9(5), 184.
Hayes, A. F. (2018a). Introduction to mediation, moderation, and conditional process
analysis: A regression-based approach (2nd ed.). New York, NY: Guilford Press.
Hayes, A. F. (2018b). Partial, conditional, and moderated moderated mediation:
Quantification, inference, and interpretation. Communication Monographs, 85, 4-
40.
Hayes, A. F., & Preacher, K. J. (2013). Conditional process modeling: Using structural
equation modeling to examine contingent causal processes. In G. R. Hancock & R.
O. Mueller (Eds.), Structural equation modeling: A second course (2nd ed., pp.
219–266). Greenwich, CT: Information Age.

187
Hayes, A. F., & Rockwood, N. J. (2020). Conditional process analysis: Concepts,
computation, and advances in the modeling of the contingencies of
mechanisms. American Behavioral Scientist, 64(1), 19-54.
Hayes, A. F., Montoya, A. K., & Rockwood, N. J. (2017). The analysis of mechanisms and
their contingencies: PROCESS versus structural equation modeling. Australasian
Marketing Journal, 25, 76-81.
Hidayat, R., & Akhmad, S. (2015). Effects of environmental factors on corporate strategy
and performance of manufacturing industries in Indonesia. Journal of Industrial
Engineering and Management (JIEM), 8(3), 763-782.
Hill, C. W., Jones, G. R., & Schilling, M. A. (2014). Strategic management: theory: an
integrated approach. Cengage Learning.
Hinton, K. E. (2012). A Practical Guide to Strategic Planning in Higher Education. Society
for College and University Planning, 1-50.
Hitt, M. A., Ireland, D. R., & Hoskisson, R. E. (2013). Strategic Management:
Competitiveness & Globalization: Concepts and Cases (10th ed.). South Western,
USA: Cenveo Publisher Services.
Hitt, M. A., Ireland, R. D., & Hoskisson, R. E. (2009). Concepts & Cases. Strategic
Management, Competitiveness &Globalization, South-Western Cengage Learning,
Mason.
Hossain, A. T., & Nguyen, D. X. (2016). Capital structure, firm performance and the recent
financial crisis. Journal of Accounting and Finance, 16(1).
Hossain, I., & Hossain, M. A. (2015). Determinants of capital structure and testing of
theories: A study on the listed manufacturing companies in
Bangladesh. International Journal of Economics and Finance, 7(4), 176-190.
Hotstede, A., Fritz, D., Canavan, F., Oosterkamp, G., & Van, L. (2010). Towards
Organizational Culture. A journal of social science research, 3, 49-55.
Hsu, H. E. (2013). The moderating effects of leverage and ownership structure on firm
performance. South East Asia Journal of Contemporary Business, Economics and
Law, 2(1), 73-76.

188
Hubbard, G. (2009). Measuring organizational performance: beyond the triple bottom
line. Business strategy and the environment, 18(3), 177-191.
Iamratanakul, S. (2015). Modeling the Macro-Environmental Factors of International
Distribution. In Conference Proceedings: Technology Innovation and Industrial
Management. (pp. 625-631). ToKnowPress.
Ibrahim, M., Sulaiman, M., Kahtani, A., & Abu-Jarad, I. (2012). The relationship between
strategy implementation and performance of manufacturing firms in Indonesia: the
role of formality structure as a moderator. World Applied Sciences Journal, 20(7),
955-964.
Ibrahim, R., & Primiana, I. (2015). Influence Business Environment on The Organization
Performance. International Journal of Scientific & Technology Research, 4, 283-
293.
Inam, A., & Mir, G.M. (2014). The Impact of Financial Leverage on Firm Performance in
Fuel and Energy Sector, Pakistan. European Journal of Business and Management,
6(37), 339-347.
Ireland, R., Hoskisson, R. and Hitt, M., (2009). The management of strategy, (8th Ed.).
South-Western Cengage Learning: USA
Isaboke, C. M. (2015). Influence of Organization Culture on Strategy Implementation in
Selected Universities in Kenya. International Journal of Economics, Commerce
and Management, United Kingdom,3(9).
Ismail, A. I., Raduan R.C., Uli J. & Abdullah H. (2011). The Relationship between
Organizational Resources and Systems: An Empirical Research. Asian Social
Science, 7(5), 72-80.
Itani, N., & Mason, K. (2014). A macro-environment approach to civil aviation strategic
planning. Transport Policy, 33, 125-135. Ivančić, V., Mencer, I., Jelenc, L., & Dulčić, Ž. (2017). Strategy implementation–external
environment alignment. Management: journal of contemporary management
issues, 22(Special Issue), 51-67.

189
Jabeen, R., Aliyu, M. S., & Mahmood, R. (2016). The moderating effect of external
environment on the relationship between market orientation and business
performance: A quantitative approach. International Postgraduate Business
Journal, 8(1), 16-25.
James, L. R., & Brett, J. M. (1984). Mediators, moderators, and tests for mediation. Journal
of Applied Psychology, 69, 307-321.
Javed, T., Younas, W., & Imran, M. (2014). Impact of capital structure on firm
performance: Evidence from Pakistani firms. International Journal of Academic
Research in Economics and Management Sciences, 3(5), 28.
Javed, Z. H., Rao, H. H., Akram, B., & Nazir, M. F. (2015). Effect of financial leverage on
performance of the firms: Empirical evidence from Pakistan. SPOUDAI-Journal of
Economics and Business, 65(1-2), 87-95.
Jayiddin, N. F., Jamil, A., & Roni, S. M. (2017). Capital Structure Influence on
Construction Firm Performance. In SHS Web of Conferences, 36(25). EDP
Sciences.
Jensen, A. W. H. (2013). Determinants of Capital Structure: An Empirical Study of Danish
Listed Companies. Mater Thesis, Aarhus University, Business and Social Sciences.
Jespersen, K. R., & Bysted, R. (2016). Implementing New Product Development: A Study
of Personal Characteristics Among Managers. International Journal of Innovation
Management, 20(3), 1650043.
Jiang, N., & Carpenter, V. (2013). A Case Study of Issues of Strategy Implementation in
Internationalization of Higher Education. International Journal of Educational
Management, 27(1), 4-18.
John, A. O. (2013). Effect of Capital Structure on Firm Performance: Evidence from
Nigerian Manufacturing Industry. International Journal of Innovative Research
and Studies, 2(9), 469-480.
Judd, C. M., & Kenny, D. A. (1981). Process analysis: Estimating mediation in treatment
evaluations. Evaluation Review, 5, 602-619.

190
Kajirwa, H. I. (2015). Effects of debt on firm performance: A survey of commercial banks
listed on Nairobi Securities Exchange. Global Journal of Advanced Research, 2(6),
1025-1029.
Kakanda, M., Bello, A., & Abba, M. (2016). Effect of capital structure on the performance
of listed consumer goods companies in Nigeria. Research Journal of Finance and
Accounting, 7(8).
Kalpana, V. (2014). A Study on leverage analyses and its impact on profitability of select
steel companies traded in BSE (From 2003 To 2012). Indian Journal of Applied
Research, 4(10), 276-280.
Kanwal, M., Shahzad, S. J. H., ur Rehman, M., & Zakaria, M. (2017). Impact of capital
structure on performance of non-financial listed companies in Pakistan. Pakistan
Business Review, 19(2), 339-353.
Kaplan, R. S. (2012). The balanced scorecard: comments on balanced scorecard
commentaires. Journal of Accounting & Organizational Change, 8(4), pp. 539-545.
Kariithi, B., & Ragui, M. (2018). Strategy Implementation Practices on Performance of
Huduma Centres in Nairobi City County, Kenya. International Journal of
Contemporary Aspects in Strategic Management, 2(1), 106-118.
Kariuki, A. (2014). Intellectual capital, corporate reputation, corporate culture and
performance of firms listed at the Nairobi securities exchange. Unpublished Ph. D
Thesis). School of Business, University of Nairobi.
Katamei, J. M., Omwono, G. A., & Wanza, S. L. (2015). Challenges of strategy
implementation on performance of constituency development fund projects in
Kenya: a case of Marakwet west constituency. International Journal of Business
Administration, 6(3), 48.
Kaur, J. (2015). Techniques Used in Hypothesis Testing in Research Methodology–A
Review. International Journal of Science and Research (IJSR), 4(5), 2319-7064.
Kausar, A., Nazir, M. S., & Butt, H. A. (2014). Capital structure and firm value: Empirical
Evidence from Pakistan. Asian Journal of Research in Economics and
Finance, 1(1), 11-22.

191
Kengatharan, L., & Kengatharan, N. (2014). The influence of behavioral factors in making
investment decisions and performance: Study on investors of Colombo Stock
Exchange, Sri Lanka. Asian Journal of Finance & Accounting, 6(1), 1-23.
Kenya Association of Manufacturers (2012). High cost of electricity to stall economic
growth. Nairobi: Standard Group Limited.
Kenya Power FY (2017/2018). Annual Report. Retrieved from
https://www.kplc.co.ke/content/item/2734/annual-report-and-audited-financial-
statements-for-the-year-ended-30th-june-2018
Kerosi, D. O., Mugo, R., & Fredrick, K. (2018). The Relationship Between Capital
Structure and Profitability of Firms Listed at The Nairobi Securities
Exchange (Doctoral dissertation, Egerton University).
Kevin, R. L., & Strickland, T. U. (2016). The relationship between strategy implementation
practices and performance of public universities in Australia. International Journal
of Educational Management, 24(2), 139-158.
Khan, A. G. (2012). The relationship of capital structure decisions with firm performance:
a study of the engineering sector of Pakistan. International Journal of Accounting
and Financial Reporting, 2(1), 245-262.
Khatoon, T., & Hossain, M. (2017). Capital structure and firm’s financial performance:
Evidence from listed cement companies of Dhaka stock exchange of
Bangladesh. International Journal of Business and Statistical Analysis, 4(01), 29-
37.
Khodavandloo, M., Zakaria, Z., & Nassir, A. M. (2017). Capital Structure and Firm
Performance During Global Financial Crisis. International Journal of Economics
and Financial Issues, 7(4).
Kibicho, P. M. (2015). Determinants of Strategy Implementation Success in the Insurance
Industry: A Survey of Insurance Companies in Kenya. International Journal of
Business and Social Science, 6(4), 74-91
Kibicho, P. M. (2015). Determinants of strategy implementation in the insurance industry
in Kenya (Doctoral dissertation).

192
Kihara, M. P. (2017). Influence of strategy implementation on the performance of
manufacturing small and medium firms in Kenya (Doctoral dissertation, COHRED,
JKUAT).
Kiliç, M., & Aktuna, A. (2015). Perceptions on the obstacles of strategy Execution: The
Case of Turkish Public Organizations. Hacettepe Üniversitesi İktisadi ve İdari
Bilimler Fakültesi Dergisi, 33(1).
Kinuu, D. (2014). Top management team psychological characteristics, institutional
environment, team processes and performance of companies listed in Nairobi
securities exchange. Unpublished PhD Thesis), University of Nairobi.
Kinyanjui, N. J., & Juma, D. (2014). Investigate the effect of strategic plans
implementation on performance in Kenya’s public universities. A case study of the
University of Nairobi. European Journal of Business Management, 2(1), 161-173.
Kirmi, P.N. (2017). Relationship between capital structure and profitability, evidence from
listed energy and petroleum companies listed in Nairobi Securities Exchange,
Journal of Investment and Management, 6(5),97–102
Kodongo, O., Mokoaleli-Mokoteli, T., & Maina, L. N. (2015). Capital structure,
profitability and firm value: panel evidence of listed firms in Kenya. African
Finance Journal, 17(1), 1-20.
Kola-Lawal, C. O. (2015). Investigating the relationship between pro-environmental
behavior and environmental performance through development and application of
a model for categorizing environmental management system implementation
factors (Doctoral dissertation, University of Salford).
Kostopoulos, K. C., Spanos, Y. E., & Prastacos, G., P. (2003). The Resource-Based View
of the Firm and Innovation: Identification of Critical Linkages. Athens, G: Athens
University of Economics and Business.
Kothari, C.R., & Garg, G. (2014). Research Methodology methods and techniques (3rd ed.).
New Delhi: New Age International Limited
Kotler, P., & Keller, L. K. (2012). Marketing Management, (14th ed.). New Jersey: Pearson
Education Limited.

193
Kowo, S., Akinrinola, O., & Sabitu, O. (2018). Macro environment and performance of
multinational agricultural enterprises: a case from Nigeria. Agricultural and
Resource Economics: International Scientific E-Journal, 4(1868-2019-382), 31-
40.
KPMG. (2014). KPMG Kenya Budget Brief. Retrieved from
http://www.kpmg.com/eastafrica/en/Documents/KPMG_Kenya_Budget_Brief_20
14.pdf
Kuria, J., & Omboi, B. (2015). Relationship between the Capital Structure and the
Financial Performance of Investment and Banking Firms Listed at the Nairobi
Securities Exchange in Kenya. Prime Journal of Business Administration and
Management, 5, 1983-1991.
Langfred, C. W. (2004). Too much of a good thing? The negative effects of high trust and
autonomy in self-managing teams. Academy of Management Journal, 47, 385-399.
Le, T. P. V., & Phan, T. B. N. (2017). Capital structure and firm performance: Empirical
evidence from a small transition country. Research in international business and
finance, 42, 710-726.
Leedy, P. D., & Ormrod, J. E. (2005). Practical research. Pearson Custom.
Lefort, F., McMurray D. &Tesvic J. (2015). Secrets to implementation success. McKinsey
and Company NY.
Letangule, S. L., Letting, D., & Nicholas, K. (2012). Effects of performance contract on
organization performance: The case study of Kenya’s ministry of
education. International Journal of Management & Business Studies, 2(3), 29-37.
Lin, T. (2011), How the environment affects travel agency performance. African Journal
of Business Management. 5(3), 960-966.
Lokoyo, F. O. (2012). Capital Structure and Corporate Performance of Nigerian Quoted
Firms: A Panel Data Approach. Phd Thesis, Covenant University, Ota.
Lunenburg, F.C. (2011). Organizational Culture-Performance Relationships: Views of
Excellence and Theory Z. National Forum of Educational Administration and
Supervision Journal, 29(4), 1-10.

194
M’ng, J. C. P., Rahman, M., & Sannacy, S. (2017). The determinants of capital structure:
Evidence from public listed companies in Malaysia, Singapore and
Thailand. Cogent Economics & Finance, 5(1), 1418609.
Macharia, W. N. (2014). Competitive strategy, Organizational Competencies co-
alignment, Micro environment and performance of private middle level colleges in
Nairobi County, Kenya. Unpublished PhD Thesis, School of Business, University
of Nairobi.
Machuki, V. N. (2011). Strategy Implementation: The Influence of Organizational Design.
Lambert Academic Publishing.
Machuki, V. N., & Aosa, E. (2011). The influence of external environment on the
performance of publicly quoted companies in Kenya. Business Administration and
Management Journal, 1(7), 205-218.
MacKinnon, D. P. (2008). An introduction to statistical mediation analysis. New York,
NY: Routledge
MacKinnon, D. P. (2008). An introduction to statistical mediation analysis. New York,
NY: Routledge.
Maika, L. K. (2020). Effects of organisational culture on strategy implementation in water
boards in Kenya (Doctoral dissertation).
Mailu, R. N., Ntale, J. F., & Ngui, T. K. (2018). Strategy implementation and
organizational performance in the pharmaceutical industry in Kenya. International
Academic Journal of Human Resource and Business Administration, 3(2), 33-47.
Mailu, R. N., Ntale, J. F., & Ngui, T. K. (2018). Strategy implementation and
organizational performance in the pharmaceutical industry in Kenya. International
Academic Journal of Human Resource and Business Administration, 3(2), 33-47.
Maina L., & Kondongo O. (2013). Capital Structure and Financial Performance in Kenya:
Evidence from Firms Listed at the Nairobi Securities Exchange. Paper Presented at
the Jomo Kenyatta University of Science and Technology Research Conference,
Kenya.

195
Mardones, J. G., & Cuneo, G. R. (2020). Capital structure and performance in Latin
American companies. Economic Research-Ekonomska Istraživanja, 33(1), 2171-
2188.
Margaritis, D., & Psillaki, M. (2010). Capital structure, equity ownership and firm
performance. Journal of banking & finance, 34(3), 621-632.
Mark, J., & Nwaiwu, J. N. (2015). Impact of political environment on business
performance of multinational companies in Nigeria. African Research
Review, 9(3), 1-10.
Martin, W. E., & Bridgmon, K. D. (2012). Quantitative and statistical research methods:
From hypothesis to results (Vol. 42). John Wiley & Sons.
Mateev, M., Poutziouris, P., & Ivanov, K. (2013). On the determinants of SME capital
structure in Central and Eastern Europe: A dynamic panel analysis. Research in
International Business and Finance, 27(1), 28-51.
Mauwa, J., Namusonge, G. S., & Onyango, S. (2016). Effect of capital structure on
financial performance of firms listed on the Rwanda Stock Exchange. European
Journal of Business, Economics and Accountancy, 4(4), 1-11.
Mayo, M., van Knippenberg, D., Guillen, L., & Firfiray, S. (2016). Team diversity and
categorization salience: Capturing diversity-blind, intergroup-biased, and
multicultural perceptions. Organizational Research Methods, 19(3), 433-474.
Mbaka, R. M., & Mugambi, F. (2014). Factors affecting successful strategy
implementation in the Water Sector in Kenya. Journal of Business and
Management, 16(7), 61-68.
Mbithi, Muturi and Rambo (2017). Macro environment moderating Effects on Strategy and
Performance. Haya: The Saudi Journal of Life Sciences, DOI: 10.21276/haya
Memon, F., Bhutto, N. A., & Abbas, G. (2012). Capital structure and firm performance: A
case of textile sector of Pakistan. Asian Journal of Business and Management
Sciences, 1(9), 9-15.
Milovanovic, B. M., & Wittine, Z. (2014). Analysis of External Environment's Moderating
Role on the Entrepreneurial Orientation and Business Performance Relationship

196
among Italian Small Enterprises. International Journal of Trade, Economics and
Finance, 5(3), 224.
Ministry of Energy and Petroleum (2015). National Energy and Petroleum Policy.
Retrieved from http://www.energy.go.ke/wp-
content/uploads/2016/12/National_Energy_Petroleum_Policy_August_2015-1.pdf
Ministry of Energy and Petroleum (2016). National Energy and Petroleum Policy.
Retrieved from http://www.energy.go.ke/wp-
content/uploads/2016/12/National_Energy_Petroleum_Policy_August_2015-1.pdf
Mkalama, R. N. (2014). Top Management demographics, strategic decision making, and
Macro- Environment and Performance of Kenyan State-owned corporations.
University of Nairobi, PhD Thesis (Unpublished).
Modigliani, F., & Miller, M. H. (1958). The cost of capital, corporation finance and the
theory of investment. The American economic review, 48(3), 261-297.
Mohajan, H. K. (2017). Two criteria for good measurements in research: Validity and
reliability. Annals of Spiru Haret University. Economic Series, 17(4), 59-82.
Mohamed, A., & Inunjariya. (2015). Effect of capital structure on profitability of food and
beverage sectors in Srilanka. Epra International Journal of Economic and Business
Review, 3(11), 57-63.
Mohammadzadeh, M., Rahimi, F., Rahimi, F., Aarabi, S. M., & Salamzadeh, J. (2013).
The effect of capital structure on the profitability of pharmaceutical companies the
case of Iran. Iranian journal of pharmaceutical research: IJPR, 12(3), 573.
Mohammed, F.S., & Jaafer, M. (2012). The relationship between capital structure and
profitability: International Journal of Business and Social Science, 3(16).
Mugenda, M. &. Mugenda (2003). Social science research: Theory and
principles. Nairobi: Applied.
Muhammad, H., Shah, B. & Islam, Z. (2014). The Impact of Capital Structure on Firm
Profitability: Evidence from Pakistan. Journal of Industrial Distribution and
Business, 5(2), 13–20.

197
Mujahid, M., & Akhtar, K. (2014). Impact of Capital Structure on Firms Financial
Performance and Shareholders Wealth: Textile Sector of Pakistan. International
Journal of Learning and Development, 4(2), 27-33.
Muller, D., Judd, C. M., & Yzerbyt, V. Y. (2005). When moderation is mediated and
mediation is moderated. Journal of Personality and Social Psychology, 89, 852-
863.
Mumtaz, R., Rauf, S. A., Bashir, A., & Noreen, U. (2013). Capital structure and financial
performance: Evidence from Pakistan (Kse 100 Index). Journal of Basic and
Applied Scientific Research, 3(4), 113-119.
Murgor, P. K. (2014). External environment, firm capabilities, strategic responses and
performance of Large-Scale manufacturing firms in Kenya. University of Nairobi,
PhD Thesis (Unpublished).
Musah, A. (2017). The impact of capital structure on profitability of commercial banks in
Ghana. Asian Journal of Economic Modelling, 6(1), 21-36.
Musyoka, L. W. (2011). Challenges of strategy implementation in Jomo Kenyatta
foundation. International Journal of Current Research, 3(11), 301-308.
Mutua, L. M., & Atheru, G. K. (2020). Capital Structure and Financial Performance of
Companies listed under Manufacturing and Allied Sector at Nairobi Securities
Exchange in Kenya. Journal of Finance and Accounting, 4(1), 24-38.
Muyundo, M. C., Eugine, K. W., & Jinghong, S. (2020). Effect of Capital Structure on the
Financial Performance of Non-Financial Firms Quoted at the Nairobi Securities
Exchange. International Journal of Science and Business, 4(4), 165-179.
Mwangi, J. M. (2016). Effect of Financial Structure on Financial Performance of Firms
Listed at East Africa Securities Exchanges. (Doctoral dissertation, JKUAT-
COHRED).
Mwangi, L. W., Makau, M. S., & Kosimbei, G. (2014). Relationship between capital
structure and performance of non-financial companies listed in the Nairobi
Securities Exchange, Kenya. Global Journal of Contemporary Research in
Accounting, Auditing and Business Ethics, 1(2), 72-90.

198
Mwanthi, T. N. (2018). Linking strategy implementation with organizational performance
in Kenyan universities. Kabarak Journal of Research & Innovation, 5(2), 27-49.
Myers, S. C. (1984). The Capital Structure Puzzle. Journal of Finance, 39, 581-582.
Myers, S.C., & Majluf, N.S. (1984). Corporate financing and investment decisions when
firms have information that investors do not have. Journal of Financial Economics,
12, 187-221.
Nasimi, A. N. (2016). Effect of capital structure on firm profitability (An empirical
evidence from London, UK). Global Journal of Management and Business
Research, 16(4), 29-41.
Nassar, S. (2016). The impact of capital structure on Financial Performance of the firms:
Evidence from Borsa Istanbul. Journal of Business & Financial Affairs, 5(2).
National Energy and Petroleum Policy. (2014, October 11). Ministry of Energy and
Petroleum.Retrievedfromhttp://www.energy.go.ke/downloads/National
percent20Energy percent20and percent20Petroleum percent20Poli cy.pdf
National Energy. (2018, October). Ministry of Energy and Petroleum
Nazir, U. (2017). Impact of capital structure on firm’s financial performance: Textile,
automobile, sugar, petroleum and engineering industry of Pakistan. European
Journal of Business and Management, 9(25), 62-66.
Nderitu, J. W., Waiganjo, E., & Orwa, G. O. (2020). Investigating the effect of
organizational culture on strategy implementation process of private chartered
universities in Kenya. International Journal of Research in Business and Social
Science (2147-4478), 9(3), 01-13.
Neuman, L. (2014). Basics of Social Research: qualitative and quantitative approaches
(3rd ed.). Harlow, England: Pearson education Limited.
Nguyen, H. V., & Nguyen, D. N. (2017). Factors Affecting Business Strategy
Implementation of Vietnam Garmet Companies. International Journal of Business
Management, 12(1), 133-139.
Nirajini, A., & Priya, K. B. (2013). Impact of capital structure on financial performance of
the listed trading companies in Sri Lanka. International Journal of Scientific and
Research Publications, 3(5), 1-9.

199
Njagi, I.K., Kimani, E.M. & Kariuki, S. (2017). Equity financing and financial
performance of SMEs in Embu town Kenya. International academic journal of
economics and finance, 2 (3),74-91.
Njagi, L., & Kombo, H. (2014). Effect of strategy implementation on performance of
commercial banks in Kenya. European Journal of Business and
Management, 6(13), 62-67.
Njeru, A. W. (2014). Determinants of Choice of Source of Entrepreneurial Finance for
Small and Medium Size Enterprises. Survey of Thika, District Kenya (Doctoral
dissertation).
Njoroge, J. K., Machuki, V. N., Ongeti, W. J., & Kinuu D. (2015). The Effect of strategy
implementation on performance of Kenya State Corporations. Prime Journals, 5(9),
1913-1922
Njoroge, J. K., Ongeti, W. J., Kinuu, D., & Kasomi, F. M. (2016). Does external
environment influence organizational performance? The case of Kenyan State
Corporations. Management and Organizational Studies, 3(3), 41.
Noble, C. (1999). The eclectic roots of strategy implementation research. Journal of
Business Research Vol 45, 119-134.
Nyakego, M. O. (2017). Strategy Implementation, Planning Typologies and Performance
of Universities in Kenya (Doctoral dissertation, Moi University).
Nyamwanza, T. (2013). A case study review of the strategy formulation and
implementation link among SMES in Zimbabwe. European Journal of Business
and Management Vol 5, No 31, 138-144.
Nyanamba, S. O. (2018). Influence of Capital Structure on Financial Performance of Craft
Micro Enterprises in Kenya (Doctoral dissertation, JKUAT-COHRED).
Obeidat, B.Y., Al-Hadidi, A., Tarhini, A. and Masa’deh, R. (2017). Factors affecting
strategy implementation: A case study of pharmaceutical companies in the middle
east. Review of International Business and Strategy, Vol. 27 No. 3, pp. 386-408.

200
Odundo, E. O. (2012). Environmental context, implementation of strategic plans and
performance of State Corporations in Kenya. Unpublished PhD thesis, University
of Nairobi, Kenya.
Ogenche, R. M., Githui, T., & Omurwa, J. (2018). Effect of Capital Structure on Financial
Performance of Consumer Goods Firms Listed in the Nairobi Securities
Exchange. Journal of Finance and Accounting, 2(1), 57-74.
Ogollah, K., Bolo, Z.A. & Ogutu, M. (2011). Strategy structure environment linkage and
corporate performance: A conceptual view. Prime Journals, 1, (3), 101-113.
Ogunmokun, G., Hopper, T., & McClymont, H. (2005). Strategy Implementation and
Organizational Performance: A study of private hospitals. Presented at Australian
Business & Behavioural Sciences Association (ABBSA) Conference, Cairns,
Australia. August 5-7. Retrieved on 5th July 2010 from http://eprints.usq.edu.au.
Oino, I., & Ukaegbu, B. (2015). The impact of profitability on capital structure and speed
of adjustment: An empirical examination of selected firms in Nigerian Stock
Exchange. Research in International Business and Finance, 35, 111-121.
Okioga, C. K. (2012). Strategies Which Are Key to the Success of the Corporate Institution
in Kenya. A Case of Selected Corporate Institutions in Kenya. European Journal
of Business and Management, 4 (15), 31-43.
Okoth, K. O. (2017). Effect of debt financing on performance of non-financial Firms listed
at Nairobi securities exchange, Kenya (Doctoral dissertation, Maseno University).
Olaniyi, T. A., Elelu, M. O., & Abdulsalam, T. S. (2015). Impact of capital structure on
corporate performance: A pre and post crisis evaluation of selected companies in
US. International Journal of Accounting Research, 42(2441), 1-20.
Olokoyo, F. O. (2013). Capital structure and corporate performance of Nigerian quoted
firms: A panel data approach. African Development Review, 25(3), 358-369.
Ongeti, W.J. (2014). Organizational resources, corporate governance and performance of
Kenyan state-owned corporations. (Unpublished) Ph.D. Thesis, University of
Nairobi).

201
Ongombe, K. O., & Mungai, J. (2018). Capital structure decisions and financial
performance of sugar manufacturing firms in Kisumu County, Kenya. International
Academic Journal of Economics and Finance, 3(2), 336-356.
Orugun, J. J., Nafiu, A. T., & Aduku, D. J. (2017). Strategy Implementation and Its Effect
on Superior Performance and Competitive Advantage of SMEs in Kogi State,
Nigeria. Asian Journal of Economics, Business and Accounting, 1-13.
Pallant, J. (2011). SPSS Survival Manual 4th edition: A step by step guide to data analysis
using SPSS version 18. Maidenhead, Berkshire: Open University Press. Retrieved
from http://www. allenandunwin. com/SPSS.
Parijat, P. & Bagga, S., (2014). Victor Vroom’s Expectancy Theory of Motivation – An
Evaluation. International Research Journal of Business and Management, 7(9).
Parnell, J. A. (2011). Strategic capabilities, competitive strategy, and performance among
retailers in Argentina, Peru and the United States. Management decision, Vol. 49
No. 1, pp. 139-155.
Pearce II, J. A., & Robinson, Jr., R. B. (2013). Strategic Management; Planning for
Domestic & Global Competition. New York: McGraw-Hill Education.
Pearce, J. A., & Robinson, R. B. (2007). Strategic Management: Strategy Formulation and
Implementation. Richard D. Irwin Inc, INC. Homewood, Illinois 60430.
Penrose, E.T. (1959). The Growth of the Firm. Wiley: New York.
Pîndiche, E., & Ionita, R. (2013). The influence of micro and macro environment
components on trade companies in Romania. Journal of knowledge Management,
Economics and information Technology, 9, 327-337.
Polit, D. F., & Beck, C. T. (2012). Nursing research: generating and assessing evidence
for nursing practice. Philadelphia: Wolters Kluwer Health/Lippincott Williams &
Wilkins.
Pouraghajan, A., Malekian, E., Emamgholipour, M., Lotfollahpour, V., & Bagheri, M. M.
(2012). The relationship between capital structure and firm performance evaluation
measures: Evidence from the Tehran Stock Exchange. International journal of
Business and Commerce, 1(9), 166-181.

202
Preacher, K. J., Rucker, D. D., & Hayes, A. F. (2007). Assessing moderated mediation
hypotheses: Theory, methods, and prescriptions. Multivariate Behavioral
Research, 42, 185-227.
Prinsloo, J. L. (2014). Evaluation of strategy execution practices in a case study
organisation (Doctoral dissertation, Stellenbosch: Stellenbosch University).
Quick, L., T. (1988). Expectancy Theory in Five Simple Steps. Training and Development
Journal. (42) 7, 1-30.
Radomska, J. (2014). Linking the Main Obstacles to the Strategy Implementation with the
Company's Performance. 10th International Strategic Management Conference
(pp. 263-270). Poland: Elsevier Ltd.
Rajasekar, J. (2014). Factors affecting effective strategy implementation in a service
industry: a study of electricity distribution companies in Sultanate of Oman.
International Journal of Business and Social Science, 9(1), 169-183.
Rehman, S.H. F. (2013). Relationship between financial leverage and financial
performance: empirical evidence of listed sugar companies of Pakistan. Global
Journal of Management and Business Research Finance, 13(8), 33-40
Reisel, N. (2014). On the value of restrictive covenants: Empirical investigation of public
bond issues. Journal of Corporate Finance, 27, 251-268.
Robin, S. (2014). Bridging the strategy implementation skills gap, Strategic Direction, 30
(1), 29– 30.
Rouf, D. (2015). Capital structure and firm performance of listed non-financial companies
in Bangladesh. The International Journal of Applied Economics and Finance, 9(1),
25-32.
Ruhomaun, M. A., Saeedi, M., & Nagavhi, N. (2019). The Effects of Selected Macro and
Micro Economic Variables on Firm Performance for Listed Firms in the “Industrial
Products” Sector in Malaysia. International Journal of Recent Technology and
Engineering, 7 (5), 95-101
Saad, N. M. (2010). Corporate Governance Compliance and the Effects to capital Structure.
International Journal of Economics and Financial, 2(1),105-114.

203
Sadeghian, N. S., Latifi, M. M., Soroush, S., & Aghabagher, Z. T. (2012). Debt policy and
corporate performance: empirical evidence from Tehran Stock Exchange
companies. International Journal of Economics and Finance, 4(11), 217-224.
Saeed, M. M., Gull, A. A., & Rasheed, M. Y. (2013). Impact of capital structure on banking
performance (A Case Study of Pakistan). Interdisciplinary journal of contemporary
research in business, 4(10), 393-403.
Saeedi, A., & Mahmoodi, I. (2011). Capital structure and firm performance: Evidence from
Iranian companies. International Research Journal of Finance and Economics, 70,
20-29.
Saeedi, A., & Mahmoodi, I. (2011). Capital structure and firm performance: Evidence from
Iranian companies. International Research Journal of Finance and Economics, 70,
20-29.
Salim, M., & Yadav, R. (2012). Capital structure and firm performance: Evidence from
Malaysian listed companies. Procedia-Social and Behavioral Sciences, 65, 156-
166.
Salum, V. S. (2018). Factors Influencing Implementation of Strategic Plans in Tanzania’s
Executive Agencies (Doctoral dissertation, JKUAT-COHRED).
Saunders, M., & Lewis, P. (2016). In Thornhill Adrian. Research methods for business
students, 7(2), 23-34.
Saunders, M., Lewis, P. & Thornhill, A. (2012). Research Methods for Business Students
(6th ed.). Pearson Education Limited, Harlow.
Scotland, J. (2012). Exploring the philosophical underpinnings of research: Relating
ontology and epistemology to the methodology and methods of the scientific,
interpretive, and critical research paradigms. English Language Teaching, 5(9), 9-
16.
Scott, W. R. (1995). Organizations, rational, natural and open systems (4th ed.). New
Jersey: Prentice Hall.
Sekaran, U., & Bougie, R. (2016). Research methods for business: A skill building
approach. John Wiley & Sons.

204
Shahzad, S. J. H., Ali, P., Ahmad, T., & Ali, S. (2015). Financial Leverage and Corporate
Performance: Does Financial Crisis Owe an Explanation? Pakistan Journal of
Statistics and Operation Research, 11(1): 67-90.
Sheikh, N. A., & Wang, Z. (2013). The impact of capital structure on
performance. International Journal of commerce and Management, 23(4).
Siddik, M., Alam, N., Kabiraj, S., & Joghee, S. (2017). Impacts of capital structure on
performance of banks in a developing economy: Evidence from
Bangladesh. International journal of financial studies, 5(2), 13.
Sifa, C. B. (2009). Influence of core competences on the relationship between co-alignment
variables and performance of profit-oriented Parastatals in Kenya. Unpublished
doctoral dissertation), University of Nairobi, Nairobi, Kenya.
Singh, H., & Mahmood, R. (2014). Manufacturing Strategy and Export performance of
Small and Medium Enterprises in Malaysia: Moderating Role of External
Environment, International Journal of Business and Commerce, 3(5): 37-52.
Sivathaasan, N., & Rathika, S. (2013). Capital structure and EPS: a study on selected
financial institutions listed on Colombo stock exchange (CSE) in Sri
Lanka. European Journal of Business and Management, 5(14), 69-73.
Skopljak, V., & Luo, R. H. (2012). Capital structure and firm performance in the financial
sector: Evidence from Australia. Asian Journal of Finance & Accounting, 4(1),
278-298.
Soumadi, M.M., & O.S. Hayajneh. (2012). Capital structure and corporate performance:
Empirical study on the public Jordanian shareholdings firms listed in the Amman
stock market. European Scientific Journal, ESJ 8 (22).
Srivastava, N. (2014). Determinants of leverage of Indian companies: An empirical
analysis (A study of cement industry in India). The International Journal of
Business & Management, 2(3), 49.
Swain, K. R. & Das, P.C. (2017). Impact of capital structure on financial performance and
its determinants. International Journal of Informative & Futuristic Research, 4(11),
8404-8413.
Taani, K. (2013). The relationship between capital structure and firm performance:
evidence from Jordan. Global Advanced Research Journal of Management and
Business Studies, 2(11), 542-546.

205
Talukder, B., Hipel K. W., & vanLoon G. W. (2017). Developing composite indicators for
agricultural sustainability assessment: effect of normalization and aggregation
techniques. Resources, 6(66), doi: 10.3390/resources6040066
Tan, S. L., & Hamid, N. I. N. A. (2013). Capital structure and performance of Malaysia
plantation sector (Doctoral dissertation, Universiti Teknologi Malaysia).
Tauseef, S., Lohano, H.D., & Khan, S.A. (2015). Effect of debt financing on corporate
performance: evidence from textile firms in Pakistan. Pakistan Business Review,
16(4), 903-916.
Tawane, I.A. & Muathe, S.M. (2019). Strategy Implementation and Growth of Small and
Medium Enterprises in Garissa County, Kenya. Eastern Africa Journal of
Contemporary Research, 1(2), 79-88.
Tsang, E. W. K. (2013). Case study methodology: causal explanation, contextualization,
and theorizing. Journal of International Management, 19,195-202
Tudose, M. B. (2012). Capital structure and firm performance. Economy
Transdisciplinarity Cognition, 15(2), 76.
Ubesie, M. C. (2016). The effect of capital structure on the financial performance of
Nigerian quoted conglomerates. European Journal of Accounting, Auditing and
Finance Research, 4(6), 61-69.
Umar, M., Tanveer, Z., Aslam, S., & Sajid, M. (2012). Impact of capital structure on firms’
financial performance: Evidence from Pakistan. Research Journal of Finance and
Accounting, 3(9), 1-12.
UNEP, (2015). CDM Sustainable Development Impacts. UNEP Risø Centre on Energy,
Climate and Sustainable Development, Risøe National Laboratory. Roskilde.
Denmark. CD4CDM Report.
Uremadu, S. O., & Onyekachi, O. (2019). Impact of capital structure on corporate
performance in Nigeria: A quantitative study of consumer goods sector. Current
Investigations in Agriculture and Current Research, 5 (4), 697-705.
Usman, M. (2019). The Impact of Capital Structure on Financial Performance of Consumer
Goods Industry in Nigeria. Open Journal of Accounting, 8(4), 47-62.
VanderWeele, T. J. (2015). Explanation in causal inference: Methods for mediation and
interaction. New York, NY: Oxford University Press.

206
Vătavu, S. (2015). The impact of capital structure on financial performance in Romanian
listed companies. Procedia Economics and Finance, 32, 1314-1322.
Venugopal, M., & Reddy, R. (2016). Impact of Capital Structure on Firms’ Profitability
and Shareholder Wealth Maximization: A Study of listed Indian cement
companies. Journal of Business and Management, 18(4), 21-27.
Vithessonthia, C., & Tonguraib, J. (2016). The effect of leverage on performance:
Domestically-oriented versus internationally-oriented firms. Research in
International Business and Finance, 34, 265-280.
Vroom, V. H. (1964). Work and motivation. San Francisco, CA: Jossey-Bass
Wahome, M. N., Memba, F., & Muturi, W. (2015). The effects of firm size and risk on
Capital Structure decisions of Insurance Industry in Kenya. International Journal
of Scientific and Research Publications, 5(8), 1-12.
Waititu, J. W. (2016). Relationship between strategy implementation and performance in
commercial banks in Nairobi County Kenya. International Journal of Business and
Management, 11(9), 230-253.
Wangombe, B. G., & Kibati, P. (2019). Influence of capital structure on financial
performance of licensed microfinance banks in Kenya. The Strategic Journal of
Business & Change Management, 6(2), 815-835.
Welch, C., Piekkari, R., Plakoyiannaki, E., & Paavilainen-Mäntymäki, E. (2020).
Theorising from Case Studies: Towards a Pluralist Future for International Business
Research. In Research Methods in International Business (pp. 171-220). Palgrave
Macmillan, Cham.
Whisman, M. A., & McClelland, G. H. (2005). Designing, testing and interpreting
moderator effects in family research. Journal of Family Psychology, 19(1), 111-
120
World Bank (2017). Sustainable Energy for All Global Tracking Framework: Progress
toward Sustainable Energy. Retrieved from http://www.worldbank.org/
en/topic/energy/publication/global-trackingframework-2017.
Yadav, C. S. (2014). Determinants of the capital structure and financial leverage: evidence
of selected Indian companies. Asia Pacific Journal of Research, 1.

207
Yahaya, O. A., & Andow, H. A. (2015). Capital Structure and Firm’s Financial
Performance: Panel Evidence of Listed Conglomerate Firms in Nigeria. Kaduna
Business Management Review, 2(1).
Yazdanfar, D. & Ohman, P., (2015). Debt financing and firm performance: an empirical
study based on Swedish data. The Journal of Risk Finance, 16(1), 102 –118.
Yin, R. K. (2014). Case study research: Design and methods (applied social research
methods). Thousand Oaks, CA: Sage publications.
Zaidi, F. I., Zawawi, E. M. A., Nordin, R. M., & Ahnuar, E. M. (2018). An empirical
analysis of strategy implementation process and performance of construction
companies. In IOP Conf. Series: Earth and Environmental Science (Vol. 117).
Zaiontaz, S. (2013). Real statistics using excel. Real Statistics Resources.www.real-
statistics.com
Zavala, M. D. R. V., & Salgado, R. J. S. (2019). Empirical evidence on the relationship of
capital structure and market value among Mexican publicly listed
companies. Contaduría y administración, 64(1), 7.
Zeitun, R., & Tian, G. G. (2007). Capital structure and corporate performance: Evidence
from Jordan. The Australasian Accounting Business and Finance Journal, 1(4), 40
61
Zeyringer, M., Pachauri, S., Schmid, E., Schmidt, J., Worrell, E., & Morawetz, U. B.
(2015). Analyzing grid extension and stand-alone photovoltaic systems for the cost-
effective electrification of Kenya. Energy for Sustainable Development, 25, 75-86.
Zikmund, W. G., Babin, B. J., Carr, J. C., & Griffin, M. (2010). Business Research Methods
(8th ed.). Mason, Ohio: South-western Cengage Learning.
Zunckel, S., & Nyide, C. J. (2019). Capital structure of small, medium and micro
enterprises: major factors for a developing economy. Problems and Perspectives in
Management, 17(2), 124.

208
APPENDICES
Appendix I: Letter of Introduction
Dear Sir/Madam,
I am a postgraduate student at Management University of Africa pursuing a Doctor of
Philosophy in Management and Leadership. I am conducting a research on “Strategy
Implementation, Capital Structure, Macro environment and Performance of Energy
sector institutions in Kenya”.
In view of the above, I am requesting you to answer the questions, which are provided in
the questionnaires attached here-with. I also request you to provide me with the necessary
documentation and information regarding strategy implementation practices of your firm.
This will help me collect the necessary data which will help me to achieve the objectives
of the study.
The information that you will provide will remain confidential and will be used exclusively
for this research and not for any other purpose. Your response and cooperation in this
matter will be highly appreciated. Thank you in advance.
Yours Faithfully,
JOHN MUDANY

209
Appendix II: Questionnaires
SECTION A Demographic Information
1. Kindly indicate your experience.
Under 25 years [ ]
25 to 34 years [ ]
35 to 44 years [ ]
45 to 54 years [ ]
55 and above [ ]
2. What is your highest educational qualification achieved?
Diploma [ ]
Under Graduate Degree [ ]
Master’s Degree [ ]
PhD [ ]
Others please specify……………………………………………………...
3. How many years have this organization been in operation?
Below 5 years [ ]
5 to 10 years [ ]
11 to 15 years [ ]
16 to 20 years [ ]
Over 20 years [ ]
4. Kindly indicate the number of employees in your organization
1 to 50 [ ]
51 to 100 [ ]
101 to 200 [ ]
201 to 300 [ ]
Over 300 [ ]
4. Type of institution
Regulation [ ]
Generation [ ]

210
Transmission [ ]
Distribution [ ]
SECTION B STRATEGY IMPLEMENTATION
5. Using a scale of 1 to 5 tick the appropriate answer from the alternatives provided for
each of the questions
(1=Strongly Agree, 2=Agree, 3=Neutral, 4 =Disagree, 5=Strongly Disagree)
Questions 1 2 3 4 5
Leadership
1. My leader ensures that employees have adequate knowledge, experience
and skills to perform their work
2. The vision of our leaders is aligned to our strategy
3. My organization gives adequate information, encourages employee
feedback and participation before a new strategy is implemented
4. Employees have annual performance targets linked to our strategic
goals
5. Adequate resources are allocated to support delivery of strategic goals
6. My leader ensures that employees are rewarded equitably based on their
work performance and achievement of set objectives.
7. The leadership in my organization demonstrates commitment to strategy
implementation in order to achieve the set strategic objectives
Structure
1. My organization structure supports our strategy and is revised regularly
to match the changes in strategy requirements.
2. My organization is governed by a clear system of policies, rules,
regulations, and procedures which guide implementation of strategy.
3. My organization’s structure allows quick timely decisions and feedback
during implementation of strategy to ensure we achieve our goals
Responsibility and Accountability
1. Decision-making is mainly done by top management and managers must
consult in most cases
2. The management encourage employees to conduct continuous research
to improve products and services.
3. All employees of our company including those at the lower level are held
accountable for achievement of the goals of the company
4. The middle managers are better in strategy implementation as compared
to senior managers

211
Culture
1. The management encourages employees to be creative, try new methods
and conduct continuous research to improve products and services
2. My organization is like a family where everyone is focused on smooth
implementation of strategies in order to achieve set goals
3. My organization has precise rules , procedures and methods for
implementing strategic objectives
4. My organization regularly reviews and measures progress against set
targets as teams when implementing strategies
6. My organization encourages teamwork among employees
7. In my organization problems affecting strategy implementation are
addressed openly and resolved
SECTION C MACRO ENVIRONMENT
6. In a scale of 1 to 5, indicate the extent to which each environmental aspects have been
favorable in the development and provision of Energy sector services.
(1=Not at all, 2=Small extent, 3=Neutral, 4= Large extent, 5=Very large extent)
Environmental Factors 1 2 3 4 5
Political – policy and support
1. There is a lot of political interference which makes us adjust how we
implement our strategic objectives.
2. Policy and Regulation (licensing, land, tariff) influences how my organization
implements strategic plans in order to achieve our goals.
3. There is adequate Political support for our organization which enables us
achieve our strategic goals
4. Regulation of Power tariffs has affected achievement of our strategic goal’s
implementation
Ecological
1. Our company considers the environment when implementing strategy
2. Ecological factors affect our organization when implementing our strategy.
3. Our firm consider competitors as important market players and sources of
information and opportunities for cooperation are explored
4. Resource commitment is guided by social environmental variable
Social
1. The social forces change very fast and they influence the way we implement
our strategic initiatives

212
2. Harmonious working relationships with the stakeholders(community,
employees, suppliers, political and administrative class)” is important when
implementing our strategies
3. Preserving positive public image is one of the main policies for our
Organization when implementing strategy
4. Resource commitment is guided by social environmental variable
Technology
1. My organization uses the most appropriate technology in the market to
produce power or provide services
2. The level of technology in place has greatly assisted my organization to
implement strategies
3. Our organization updates and improves our technology and systems to ensure
they are the latest and most efficient
4. Our organization is keen to ensure that technology required is availed
5. Our organization is quick to respond to the changes in technology
6. My organization allocates funding for new technology, research and
development
Economic
1. The actions of our competitors have made us change our strategy in the last
five years
2. Bargaining powers of suppliers to service providers is very competitive
3. My company experiences threat of substitute services from other sources.
4. Economic factors like inflation, exchange rates, economic growth has
significant influence on our strategy implementation
Legal
1. Strict government rules and regulation could hinder the viability of my
business
2. Compliance requirement with various laws and regulations (e.g
environmental, procurement, safety etc) has influenced implementation of our
strategy
3. Laws on taxation has been unfavorable to our organization and impacted
implementation of our strategic goals
4. Regulation of access to licenses has impacted implementation of our
organization strategy

213
SECTION D: CAPITAL STRUCTURE
7. Kindly indicate the extent to which the following attributes of capital structure affect your
firm’s performance. Please (ƴ) tick appropriately on a scale of 1-5. 1- Strongly Disagree, 2-
Disagree, 3- Uncertain, 4- Agree, 5- Strongly Agree.
Statement 1 2 3 4 5
Cost of capital
1. An aggressive financing policy is important for the firm
2. Investors are likely to invest in a firm where shareholders have a stake
3. Firms rank internal sources of finance higher than external sources
4. My organization ensures cost of capital is minimized while maximizing the
value of the firm
5. My organization creates benchmark to evaluate its performance and discount
rate for evaluating capital investments
6. My organization employees financial ratios for business analysis
Covenants
1. My organization has debt agreements with the external financiers
2. Stakeholder are given right of partial information disclosure to the company’s
debt holder
3. Investors are protected from extravagant investments by the covenants
4. My organization has large assets which could be used to act as collateral for
securing the loans.
Debt
1. The firm has a mix of debt and equity in its capital structure
2. The survival of my business is highly dependent on the country’s economy
3. The organization prefers internal funding to external funding
4. High levels of debt in a firm’s capital structure may cause liquidity problems
5. Excessive use of debt can lead to higher financial distress costs
6. There are tax savings associated with use of debt as a source of financing
Equity 1. Equity element in a firm’s capital structure is attractive to lenders
2. My organization’s net income is greater than ordinary shareholders’ equity
3. My organization’s leverage ratio is inversely related to market-to-book
equity ratio.

214
SECTION D PERFORMANCE
Questions 1 2 3 4 5
1. Performance agreements have enhanced performance at my organization
2. The reward structure at my organization has enhanced performance
3 Strategic alignment with organization goals and objectives have enhanced
performance
4. Performance appraisal is conducted to check on the performance
5. Organization conceptualizes continuous innovativeness as a tool in strategy
execution
6. My organization has enough skilled and experienced employees to achieve
high performance
8. Please indicate the extent to which you agree with each of the following statements using
a scale of 1- Strongly Disagree, 2- Disagree, 3- Uncertain, 4- Agree, 5- Strongly Agree., in
relation to your firm’s performance.
Statement 1 2 3 4 5
1. Quality of outputs is high (e.g. reliability of service delivery).
2. Quantity of outputs is adequate (e.g. volume of service delivery).
3. Value for Money is high (e.g. cost per unit of service delivery).
4. Effectiveness (e.g. whether your objectives were achieved).
5. Citizen satisfaction is high
6. Financial (e.g. services are fairly distributed amongst shareholders).
7. Innovation is high
8. Overall performance is excellent

215
Appendix III: Research Permit

216
Appendix IV: Medium Term Plan I Installed Power Generation Capacity for Kenya
Table 1 Medium Term Plan I Installed Power Generation Capacity for Kenya
(2007/2008-2012/2013)
Period Installed Power Generation Capacity
2011/2012
2012/2013
1690
1,765
Table 2 Medium Term Plan II Installed Power Generation Capacity for Kenya
(2013/2014 – 2017/2018).
Period Installed Power Generation Capacity
2013/2014 2,195
2014/2015 2,333
2015/2016
2016/2017
2017/2018
2,341
2,333
2,351
Source: KPLC Report (2017/2018)

217
Appendix V: Organogram of the Kenya’s Energy Sector
Source: Ministry of Energy and Petroleum Strategic Plan, 2013-2016

218
Appendix VI: Krejcie and Morgan Table

Appendix VII: Electric Power Generation Licenses and Permits
Table 1 Electric Power Generation Licenses and Permits
Licensee
Technology
Location
of
Power
Plant(s)
Capacity
(MW)
Date
Granted
Duration
(Years)
Supply
To
Remarks
1 KenGen1 Geothermal Olkaria I 185 2ndOct
2008
25 Grid Modified on
6th
Dec
201
2 2 Tsavo Power6 Thermal Mombasa 74 21st Mar
2000
23 Grid
3 Iberafrica7 Thermal Nairobi 108.8 20thJuly
2005
27 Grid
4 OrPower48 Geothermal Naivasha 150 24th Nov
2000
25 Grid Modified on
16th
July
201
5 5 Pwani oil products limited Biomass Kilifi 1.5 24th Jan
2018
20 Captive
6 Nzoia Sugar Co. Ltd Bagasse Bungoma 7 11th April
2018
20 Captive
7 Homabay Biogas One Biogas Homabay 8 11th April
2018
20 Grid
8 Hydro project services peters Ltd Hydro Meru 0.51 11th April
2018
20 Grid
9 Chania Green Generation Ltd Wind Kajiado 50 11th April
2018
20 Grid
10 Oserian Development Co.ltd Solar Nakuru 1 22rd
August
2
0
1
8
20 Captive

11
Pan Paper9
Cogeneration
Webuye
9
2004
15
Captive
12 Mumias Sugar Cogeneration
(Bagasse)
Mumias 38 24th Apr 2008
25
Grid
13
Rabai Power
Thermal
Mombasa
90
15thJuly 2008
15
Grid
14
Lake Turkana10
Wind
Marsabit
300
16th Dec 2010
20
Grid
15
Bidco11
Biothermal
Thika
2.125
18thAug 2011
20
Grid
16
KPRL12
MSD
Mombasa
8.5
24thFeb 2011
20
Captive
17
GulfPower Ltd
Thermal
Athi River
80
14thSept 2011
20
Grid
18
Triumph13
Thermal
Athi River
83
14thSept 2011
20
Grid
19
Thika Power
MSD
Mang’u Area
87
9th Feb 2012
20
Grid
20
Kinangop14
Wind
Kinangop
61
9th Feb 2012
20
Grid
21
RegenTerem15
Hydro
Mt. Elgon
5.2
27thFeb 2014
20
Grid
22
Cummins16
Biomass
Marigat
8.4
29thJan 2014
20
Grid
23 QPEA Menengai17
Geothermal
Nakuru
35
4th Dec 2014
25
Grid
24 Mt Kenya Power 18 Hydro Meru 0.6 4thDec 2014 25 Grid
25
Tindinyo19
Hydro
River Yala,
Nandi County
1.5
4thDec 2014
25
Grid
26 Sosian- Menengai20 Geothermal Nakuru 35 4thDec 2014 25 Grid
27 Orpower 22 21 Geothermal Nakuru 35 16thJuly 2015 25 Grid
28 CemtechLtd Coal West Pokot 30 16thJuly 2015 30 Captive
29 Kleen Energy22 Hydro Embu 6 16thJuly 2015 25 Grid
30 Kipeto Energy Limited Wind Kajiado 100 16th Sep 2015 20 Grid
31 Ol-ndanyat Power Ltd Wind Kona Baridi,
Kajiado County
30
3rd December
2015
25
Grid
32 Greater Meru Tea Power Co
Ltd
Hydro Meru County 1.5 30th March
2016
25 Grid
33 Greater Meru Power Co Ltd Hydro TharakaNithi
County
2 30th March
2016
25 Grid

34 Kirinyaga
Power Co Ltd
Hydro
Kirinyaga
County
1.8
30th March
2016
25
Grid
35 Chania Power
Co Ltd
Hydro
Murang’a
County
1
30th March
2016
25
Grid
36 Kwale International Sugar Co
Ltd
Cogen Kwale County 18 25th February
2016
20 Grid and
Captive
37 Devki Energy Co Ltd Coal Merrueshi,
Kajiado
County
15 25th May
2016
20 Captive
38 Butali Sugar
Mills Limited
Cogen Kakamega
County
11 1st December
2016
25 Captive
39 Chemelil Sugar
Co Limited
Cogen Kisumu
County
3 1st December
2016
25 Captive
40 Amu power Coal Lamu County 1050 3rd March
2017
20 Grid
41 Alten Energy Solar Uasin Gichu
County
40 3rd March
2017
25 Grid
42 Radiant Energy Solar Uasin Gichu
County
40 3rd March
2017
25 Grid
43 Eldosol Energy Solar Uasin Gichu
County
40 3rd March
2017
25 Grid
44 SONY Co. Ltd Bagasse Migori County 8.7 26th April
2017
20 Captive
45 Ofgen Power Ltd Solar Nairobi &
Taita
Taveta
Counties
0.455 26th April
2017
20 Captive
46 Strathmore
University
Solar Nairobi County 0.6 26th April
2017
20 Grid
& Captive
47 Malindi solar Solar Kilifi 40 26th July
2017
20 Grid
Table 2 Electric Power Generation, Distribution and Supply Licenses
Ref
No
Name of
Licensee
Technology Location of
Undertaking
Capacity
(MW)
Date Granted Duration
(Years)
Supply to Remarks
48 James Finlay Hydro and
Thermal
Kericho 6.7 19th April 05 15 Self and
Grid
49 Sotik Tea23 Thermal Arroket Tea
Factory
1.5 19th April 05 15 Self
50 Sotik Highlands24 Thermal Sotik
Highlands
Tea Factory
1.06 19th April 05 15 Self
51 Unilever25 Hydro and
Thermal
Kericho 4.66 11th Dec 08 25 Self Modified 28th
Oct 2010
52 Imenti26 Hydro Imenti Tea
Factory
0.92 29th April 10 25 Self and
Grid

53 Powerhive27 Solar PV Kisii and
Nyamira
Counties
3.0 16th Feb 15 25 Public Transferred to
Cloverfield
Energy
Services Ltd
in June 2016 54 Talek Power
Company Ltd
Solar PV-
Diesel
Hybrid
Talek, Narok
County
0.05 16th Sep 15 25 Public Mini-grid
55 Two Rivers Power Company
Ltd
Solar, Diesel
& Purchase
from KPLC
Nairobi County 2 MW Solar,
35 MW
purchase from
KPLC&
10 MW
Diesel
16th
September
15
25 Self &
Public
Ref
No
Name of
Licensee
Technology
Location of
Undertaking
Capacity
(MW)
Date Granted
Duration
(Years)
Supply to
Remarks
56 Biojoule Kenya
Ltd
Biogas Naivasha, off
Moi South
Lake Road,
Nakuru County
2.6 3rd December
2015
25 Self and
Grid
The energy
will
be supplied
primarily to
Gorge Farm
and surplus to
the grid 57 Metumi Power
Co Ltd
Hydro Murang’a
County
5.6 30th March
2016
25 Self and
Grid
58 Oserian Development
Company
Geothermal Nakuru County 3.7 26th April
2017
20 Captive Amended on
26th April
2017 to
include
distribution &
supply 59 Nyakwana Power
Company ltd
Hydro Kisii County 2 28th June
2017
25 Self and
Grid
60 Gura Power
Company Ltd
Hydro
Nyeri County
5.8
28th June
2017
25
Self and
Grid
61 Tatu City Power
Co. ltd
Grid power Kiambu 135 26th Sep 2018 25 Import of
Grid
power

Table 3 Electric Power Distribution and Supply Permits for Kenya Power and Lighting Company Off-Grid
Stations
Ref No
Licensee
Technology
Location of
Power Plant(s)
Capacity
(kW)
Date Granted
Duration
(Years)
Supply
To
Remarks
62
KPLC29
30IDO Elwak 520
24th Sep 2009
50
Mini
grid
Table 4 Electric Power Transmission, Distribution and Supply Licenses
Ref No
Name of
Licensee
Description of the Undertaking
Date
Granted
Duration
(Years)
Remarks
63
KPLC34
Transmission of electrical energy in bulk over the Kenya National Grid,
comprising 1,323 km of 220 kV lines and 993 km of 132 kV lines, from the
major sources of generation to the transmission substations, together with the
interconnection with Ugandan Grid.
The sources of generation comprise the Seven Forks hydro power plants,
vizMasinga` Kamburu, Kindaruma, Gitaru and Kiambere, Turkwel and
SonduMiriu hydro power plants operated by KenGen, the geothermal power
plants at Olkaria operated by KenGen and Orpower4 and the thermal power
plants at Mombasa operated by KenGen, Tsavo and Rabai Power.
24th Sep
2009
50
64 REA Rural Electrification Authority
65 KETRACO35 Transmission of electrical energy in bulk over the 132 kV, 220 kV, 400kV ac
and 500kV HVDC36network in Kenya and interconnections with all
neighboring countries
18thJuly
2013
50
66 GDC Geothermal development Company
67 MOE Ministry of Energy
68 ERC Energy Regulation Commission