Embed Size (px)
Citation preview

Strategy DevelopmentBlank Slide Pack

Version Control
Version # Updated By Date Updated Change Details

Project Plan
Insert Project Plan in format required

Stakeholder Map templateImpact of Commodity on Stakeholder
HighLow Med
Imp
act
on
su
cces
s
High
LowAdvocacy and
OwnershipSupport and
Buy-inAwareness Commitment and ActionUnderstandingUnaware
Med
Level of Engagement

UIG Welcome Pack
Insert Welcome Pack (in word format)
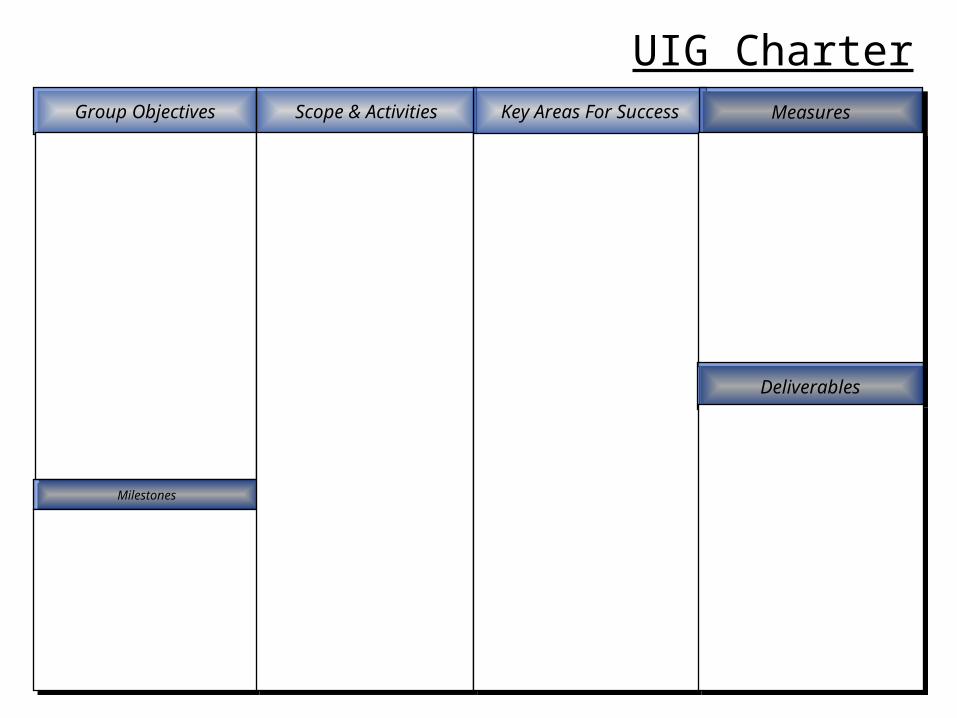
UIG CharterGroup ObjectivesGroup Objectives Scope & ActivitiesScope & Activities Key Areas For SuccessKey Areas For Success MeasuresMeasures
MilestonesMilestones
DeliverablesDeliverables

UIG Membership
Name Location Dept. Role Tel.
Add Commodity Name here

Current Status of Commodity/Contracts
Commodity Name Definition Source
1 - Commodity Definition

Current Status of Commodity/Contracts
Contract Detail Contract Scope Expiry Date Current Pricing
2 – Current Contracts

Policy detail Reason of impact Source
3 – Relevant Policies/ Processes
Current Status of Commodity/Contracts

Create your Spend Analysis and add it here. This is an example of one format
Spend Analysis
Annual Spend
£0.00
£100,000.00
£200,000.00
£300,000.00
£400,000.00
£500,000.00
£600,000.00
£700,000.00
£800,000.00
£900,000.00
Glasgo
w
Gram
pian
Ayrsh
ire &
Arra
n
Lothi
an
Lana
rksh
ire
Argyll
& C
lyde
Fife
Taysid
e
Forth
Valley
Dumfries &
Gall
oway
Highla
nds
Border
s
Weste
rn Is
les
Golden
Jubile
e
Shetla
nd
Organisations
Va
lue
Monmouth
Keymed
Diagmed
Cook
Conmed
Boston

SustainabilitySustainability
AspectsConsiderations Actions
Social
Economic
Environmental

Classifying a Commodity
<INSERT COMMODITY>
<INSERT COMMODITY> <INSERT COMMODITY>
<INSERT COMMODITY> <INSERT COMMODITY>
<INSERT CATEGORY>
<Add Text for Details> <Add Text for Details>
<Add Text for Details>
<Add Text for Details>
<Add Text for Details>

Key Commodity Characteristics
Functionality End User Requirements
Organisation Requirements
Future Trends
Constraints

Market Summary TemplateFactor Findings from research
Market definition
Market Overview
Trade Associations
Key Suppliers
Market growth
Trends and developments
Supply market trends

External Data SourcesReference
No.Source Dated Web address
1) <Add source/report title> <Add date of report/article/quote>
<Add website address for future reference>
2)
3)
4)
5)
6)
7)
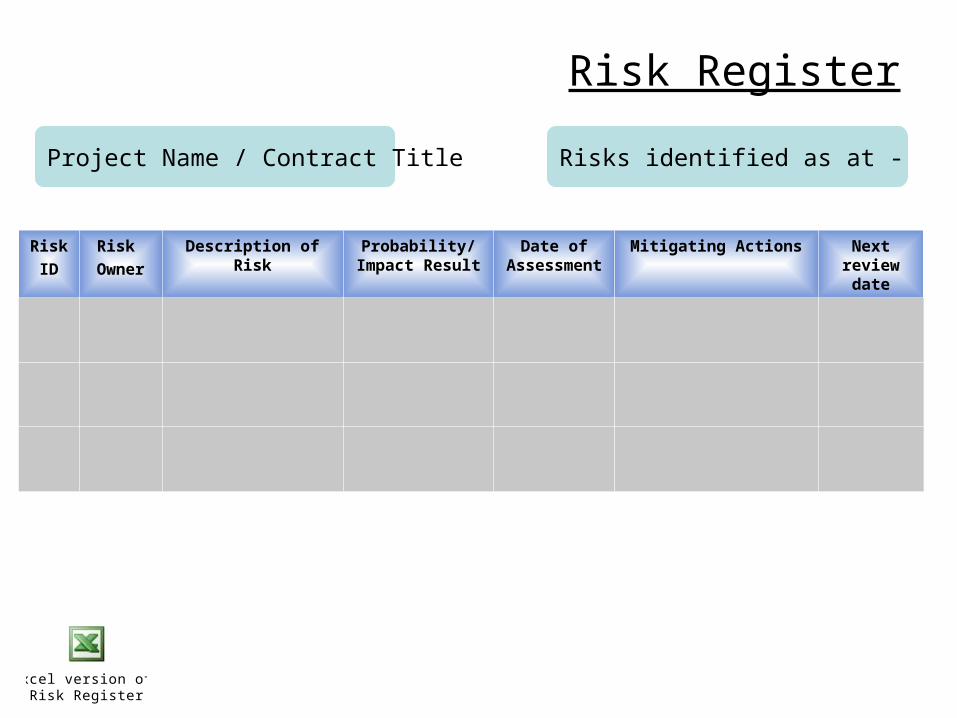
Risk Register
Risk
ID
Risk
Owner
Description of Risk Probability/ Impact Result
Date of Assessment
Mitigating Actions Next review date
Project Name / Contract Title Risks identified as at -
Excel version of Risk Register

Supplier Profile Analysis
Organization and HistoryOrganization and History Strategy and Key Market Segments Strategy and Key Market Segments
Products, Service Range and Operations Products, Service Range and Operations Key Financials and Other DevelopmentsKey Financials and Other Developments
X Supplier is the global leader in the provision of Y solutions
Insert commodity specific Supplier Data. Use 1 slide for each of the top 5 suppliers.You should base the top 5 on whether you think the market is global, European, or UK only

Porter’s 5 forces – Competitive Positioning
Power of BuyerPower of Buyer
<Add Comment> <Add Comment>
Competition in IndustryCompetition in Industry
<Add Comment> <Add Comment>
Power of SupplierPower of Supplier
<Add Comment> <Add Comment>
Threats of SubstitutesThreats of Substitutes
<Add Comment> <Add Comment>
Threats of New EntrantsThreats of New Entrants
<Add Comment> <Add Comment>
<Add Opportunity Notes>
<Add Opportunity Notes><Add Opportunity Notes>
<Add Opportunity Notes>

SWOT Analysis
Strengths Weaknesses
Opportunities Threats
• Text• Text• Text
• Text• Text• Text
• Text• Text• Text
• Text• Text• Text

PESTLEE Analysis
POLITICAL
TECHNOLOGICAL
ECONOMIC
SOCIAL-DEMOGRAPHIC
LEGAL
ETHICAL
ENVIRONMENTAL
PEST LEEPEST LEEAnalysisAnalysis
PEST LEEPEST LEEAnalysisAnalysis
Add overall statement of findings here

Supplier Cost Drivers
Cost Element
(e.g. Material, Labour, Sub-contract, Transport, Overheads…)
% of Overall Price
(Use estimates, market, supplier and existing analysis)
Source of Data Data Confidence (Low, Medium, High)

Total Cost of Ownership: Considerations
Acquisition
•
•
•
•
•
•
•
•
•
•
Operation
•
•
•
•
•
•
•
•
•
•
Ownership
•
•
•
•
•
•
•
•
•
•
Disposal
•
•
•
•
•
•
•
•
•
•

Best Value Triangle – Identifying Opportunities
Impr
ove
Spec
ifica
tion R
estructure
Relationships
Increase
Com
petition
Restructure
Supply Base
Red
uce
Con
sum
ptio
n
Optimise Total Supply Chain Costs
Reduce / EliminateTransactions
Total Cost Management
Pur
chas
e D
eman
d
Man
agem
ent S
upply Base
Managem
ent
Reduce Total Life cycle / Ownership Costs
CostQualityService
InnovationSustainability
Con
solid
ated
Spe
nd
Improve Specification
• •
Consolidate Spend
• •
Restructure Relationships
• •
Increase Competition
• •
Reduce Consumption
• •
Restructure Supply Base
• •
Optimise Supply Chain Costs
• •
Reduce Total Ownership Costs
• •
Reduce/Eliminate Transactions
• •

Best Value – Tabled version
Best Value Opportunity AssessmentDescription Ease Time Benefits Resources Pros Cons
Purchase Demand Management
“Have you considered this?”
Reduce Consumption
Consolidate Spend
Improve Specification
Supply Base Management
“Have you considered this?”
Restructure Relationships
Increase Competition
Restructure Supply Base
Total Cost Management
“Have you considered this?”
Optimise Total Supply Chain Costs
Reduce Total Ownership Costs
Reduce Transactions
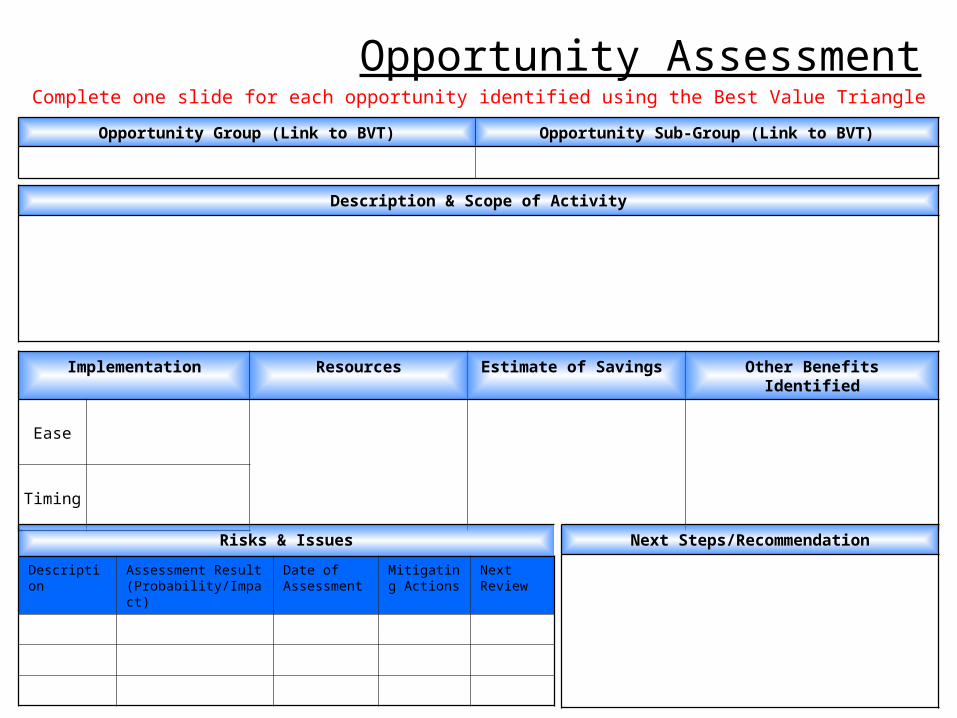
Opportunity Assessment
Opportunity Group (Link to BVT) Opportunity Sub-Group (Link to BVT)
Implementation Resources Estimate of Savings Other Benefits Identified
Ease
Timing
Risks & Issues
Description Assessment Result (Probability/Impact)
Date of Assessment
Mitigating Actions
Next Review
Description & Scope of Activity
Next Steps/Recommendation
Complete one slide for each opportunity identified using the Best Value Triangle
Bu
s in
ess
Imp
act
Hig
h
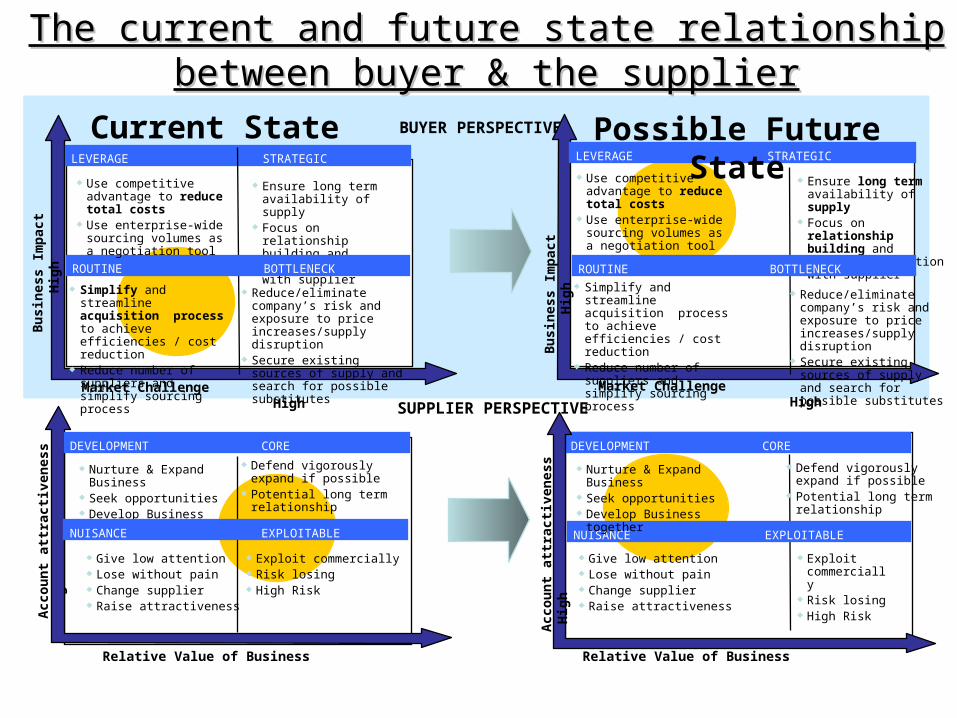
LEVERAGE STRATEGIC
BUYER PERSPECTIVE
Ensure long term availability of supply
Focus on relationship building and process integration with supplier
Reduce/eliminate company’s risk and exposure to price increases/supply disruption
Secure existing sources of supply and search for possible substitutes
Market Challenge High
Use competitive advantage to reduce total costs
Use enterprise-wide sourcing volumes as a negotiation tool
Simplify and streamline acquisition process to achieve efficiencies / cost reduction
Reduce number of suppliers and simplify sourcing process
LEVERAGE STRATEGIC
ROUTINE BOTTLENECK
Reduce/eliminate company’s risk and exposure to price increases/supply disruption
Secure existing sources of supply and search for possible substitutes
Ensure long term availability of supply
Focus on relationship building and process integration with supplier
Market Challenge High
ROUTINE BOTTLENECK
Simplify and streamline acquisition process to achieve efficiencies / cost reduction
Reduce number of suppliers and simplify sourcing process
Use competitive advantage to reduce total costs
Use enterprise-wide sourcing volumes as a negotiation tool
Current State Possible Future State
The current and future state relationship between buyer The current and future state relationship between buyer & the supplier& the supplier
Bu
s in
ess
Imp
act
Hig
h
Acc
ou
nt
attr
acti
ven
ess
H
igh
Nurture & Expand Business Seek opportunities Develop Business together
Defend vigorously expand if possible
Potential long term relationship
Exploit commercially Risk losing High Risk
Give low attention Lose without pain Change supplier Raise attractiveness
Relative Value of Business
DEVELOPMENT CORE
NUISANCE EXPLOITABLE
Relative Value of Business
DEVELOPMENT CORE
NUISANCE EXPLOITABLE
Nurture & Expand Business
Seek opportunities Develop Business
together
Defend vigorously expand if possible
Potential long term relationship
Give low attention Lose without pain Change supplier Raise attractiveness
Exploit commercially
Risk losing High Risk
SUPPLIER PERSPECTIVE
Acc
ou
nt
attr
acti
ven
ess
H
igh

Option 1 Option 2 Option 3 Option 4Recommendation &
Justification
1
Procurement Route
Not applicable Do nothing Use existing framework
Develop bespoke contract
Benefits & Concerns
2
OJEU Procedure
Open Restricted Competitive Dialogue
Other
Benefits & Concerns
Options Decision Matrix & SummaryComplete the table below with the various options available for Procurement Route, OJEU Procedure (if applicable), Lotting Strategy and Suppliers (examples provided) and detail the benefits/concerns associated with each before recommending a preferred option with justification.

Option 1 Option 2 Option 3 Option 4Recommendation &
Justification
3
Lots Not applicable 1 Lot Geographical Product / Service
Benefits & Concerns
4
Suppliers Per Lot
Not applicable 1 Supplier 3 – 5 Suppliers 5 + Suppliers
Benefits & Concerns

Executive SummaryKey insights
Options Considered
Recommendations and key actions


![Version 6 - 1945 · TR Version 6.71B Page 2TR Version 6.71B Page 2 [This page intentionally left blank]](https://img.dokumen.tips/doc/110x75/608437c0a91a450ed9408acd/version-6-tr-version-671b-page-2tr-version-671b-page-2-this-page-intentionally.jpg)