Embed Size (px)
Citation preview

Analyst Presentation February 2015Richard Rushton –Managing Director
Strategy and Performance Overview

Strong performance in the core businessDespite economic headwinds and a challenging competitor environment, Distell continues to grow its position as South Africa’s leading producer of
ciders, wines and spirits with a strong increase in volumes and revenue in our domestic market and in several international markets
We are investing at an accelerated pace in our core brands, organisation capability, building Route To Market in Africa, and in owning the ‘last mile’ in
Southern Africa
To this end we have appointed a number of senior leaders who contribute greatly to the depth of global experience in our leadership team
2
Agenda
• Market Review
• Salient features of our performance
• Strategy Review & Close
123
3

• Macro Environment
• Key Industry Trends
12
Market Review
• Competitor Performance3

The Macro-EnvironmentSouth Africa: Slight GDP recovery as oil price feeds through• Consumer spending recovering
• Lower inflation outlook
• US$ strength
• Rand volatility set to continue
• SA’s electricity supply challenge
• Investment ratings due in June0.0
1.0
2.0
3.0
4.0
Q12014
Q22014
Q32014
Q42014 f
Q12015 f
Q22015 f
% G
row
th
RSA % Real Growth
Consumer spend Real income
Source: BER 5

The Macro-EnvironmentAfrica: GDP growth outlook favourable , but slowing
• Nigeria - oil price drop, Boko Haram, election driving uncertainty
• Angola - lower oil prices, Kwanza weakening, import restrictions
• East Africa growing - led by Kenya
• West Africa affected by Ebola – recovery later in 2015
• Kenya, Tanzania set to benefit as net oil importers
International: Global projections revised downward• Increased global geo-political risk – Russia, Middle East
• Slower China growth – at or below 7%
• Russia and Brazil face challenges
• Continued Euro Zone weakness – QE announced6

0% 10% 20% 30% 40% 50% 60% 70%
United States (241 mn litres)
Australia (105 mn litres)
South Africa (299 mn litres)
United Kingdom (981 mn litres)
Global (2177 mn litres)
% Volume Growth - 2014
Leading Cider Markets - 80% of Global Consumption
Industry Trends Cider remains the highest growing category
• Growth in global cider consumption x4 times faster than global alcoholic beverages; and x8 times more than global RTD growth
• SA cider growth moderating, still favourable market fundamentals for future growth
• Growth in global cider consumption x4 times faster than global alcoholic beverages; and x8 times more than global RTD growth
• SA cider growth moderating, still favourable market fundamentals for future growth
Sources: Euromonitor (2014)
Cider % of Total RTD Volumes
1%
18%
8%
6%
1%
7

Industry Trends Wine becomes an emerging market play
8
• Global wine consumption trends in line with total alcoholic beverages growth• Variable performance geographically: Emerging markets growing faster• Eurozone widely impacted• SA wine growth ahead of total alcohol market• Africa’s wine market remains largely untapped
• Global wine consumption trends in line with total alcoholic beverages growth• Variable performance geographically: Emerging markets growing faster• Eurozone widely impacted• SA wine growth ahead of total alcohol market• Africa’s wine market remains largely untapped
Sources: Wine intelligence; SAWIS (2014) -5% 5% 15%
Super Premium(Ave R/litre: R62)
Premium(Ave R/litre: R24)
Standard Price(Ave R/litre: R15)
Total(Ave R/litre:R28)
SA Wine Consumption 2014
% Value Growth % Vol Growth
-2% 0% 2% 4% 6% 8%
Australasia
Middle East & Africa
Latin America
Eastern Europe
North America
Asia Pacific
Western Europe
Global
Global Wine Consumption Volume Growth % 2014
% Share of Global Wine Consumption
40%23%13%11%7%3%2%

Industry Trends Headwinds for Cognac & Scotch Whisky Exports
Source: BNIC, HM Revenue & Customs
• Volumes of Scotch Whisky shipments declined by 1.2%• Cognac exports (shipment volumes) declined by 1.2%• Significant slump in sales to Eastern Europe led by Russia• Austerity measures affect cognac in China
• Volumes of Scotch Whisky shipments declined by 1.2%• Cognac exports (shipment volumes) declined by 1.2%• Significant slump in sales to Eastern Europe led by Russia• Austerity measures affect cognac in China
Cognac Export Volume Growth: Key BisquitMarkets July-December 2014 vs. History
Scotch Whisky: Volume Growth of Exports June-November 2014 vs. History
-1%-12%
65%-9%
32%-41%
-3%5%
16%
-80% -30% 20% 70%
Belgium
South Africa
Taïwan
France
USA
-76%-11%
-4%-2%
3%3%4%
15%
-100% -70% -40% -10% 20%
Eastern EuropeCentral & South…
AustralasiaOther Europe
North AmericaAfrica
AsiaMiddle East
9

Competitor Performance Distell ahead of competitors
10Source: Companies’ latest published trading results Data note: Net sales revenue excludes excise duties
• Distell performed well, outpacing leading competitors’ revenue growth− Emerging market footprint− Diverse brand portfolio (product and category mix)− Capability investment showing early benefits
• Competitors impacted by slowdown in Europe, China, Brazil and Russia.
Beer Spirits Wine Cider, Wine & Spirits
Company SABMiller Heineken Pernod Ricard Diageo
Treasury Wine
Estates
Vina Concha Y
Toro Distell Ltd
(Normalised)Distell Ltd (Inflationadjusted)
Reported NSV Growth
1.5% 0.1% 1.0% -0.1% 3.6% 10.0% 10.5% 5.2%
• Corporate
• RSA
12
Salient features of our performance
• Africa3• International4

Key December 2014 YTD metrics
R10.997 bn369m litresR1.473 bn
R1 bn
reported revenue – up 10.5% on history
sold - up 3.7 % on prior year
normalised operating profit – an increase of 7.0% on history
normalised headline earnings - up 9.5% on prior year
Investments in capability accelerated for: Expanding African structures, Revenue Management, SA Sales Force Effectiveness , Supply Chain Excellence, Brand innovation, Strengthening People Capability
12

Strong results from our core South African operations!
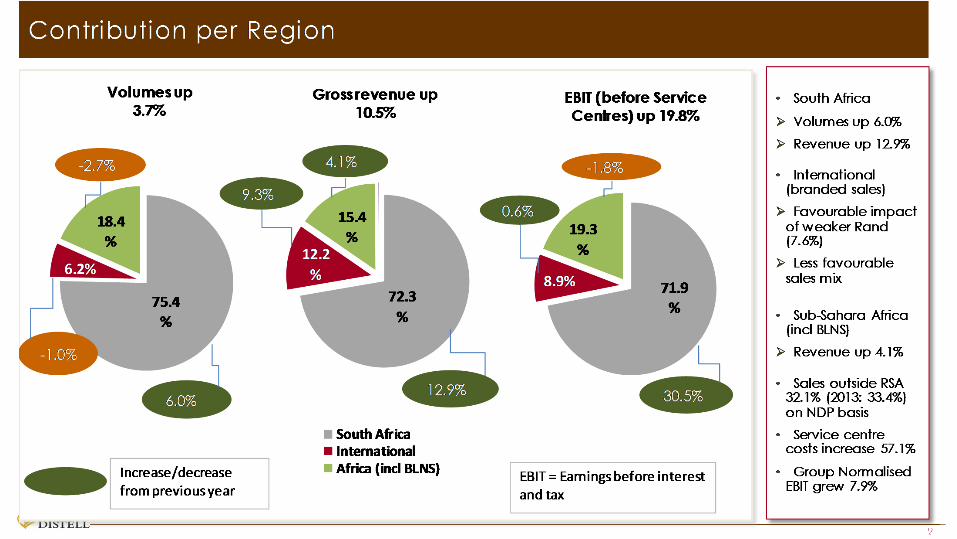
• Volume growth of 6%
• Ciders continue to grow – innovation underway
• Wine -strong double digit volume/value growth
• 4th Street volume up 166%
• Brandy bottoming out-premiums growing
• SA whisky story emerging – Bains revenue +61%
Revenue % Distell
RSA 12.9% 72.3%
Rev growth against history 13

SA Brandy showed early signs of stabilising
Brandy grew 1.7% - first growth period in many years
14

The ciders growth story
0200400600800
100012001400160018002000
2,000 2,002 2,004 2,006 2,008 2,010 2,012 2,014
Reve
nue
Inde
x
Cider Revenue Total Cider
15

Africa growing but Angola impacted by shipments….
* Incl. BNLS, all reported against history
Angola: Timing of shipments, PY sell-in ahead of duty increases. In- market sales up 18%
Kenya: KHEAL 26% stake - growth
Ghana: In-market sales 11%, In country bottling facility
Zimbabwe & Tanzania: Strong in-market performances via SABMiller JV’sEquity income up > 30%
Nigeria: Currently seeding brands, normalising stocks and building RTM
16
Revenue % Distell
Africa* 4.1% 15.4%Africa* (excl Angola) 7.2%
% AfricaBNLS 10.4% 53.6%Angola -4.5% 21.1%Zambia 76.2% 5.5%Mozambique 70.7% 5.0%Kenya 12.5% 2.7%Ghana 21.3% 2.0%Zimbabwe 18.9% 1.9%Nigeria -69.7% 1.9%
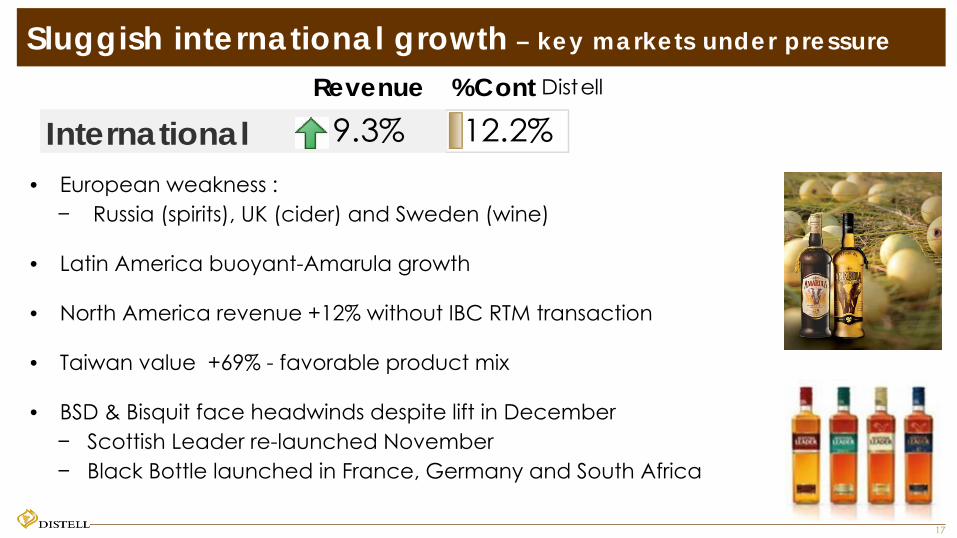
Sluggish international growth – key markets under pressure
Revenue
International 9.3% 12.2%%Cont Distell
• European weakness :− Russia (spirits), UK (cider) and Sweden (wine)
• Latin America buoyant-Amarula growth
• North America revenue +12% without IBC RTM transaction
• Taiwan value +69% - favorable product mix
• BSD & Bisquit face headwinds despite lift in December− Scottish Leader re-launched November− Black Bottle launched in France, Germany and South Africa
17

• Our Aspirations
• Strategy and Initiatives
12
Strategy Review
18

A Reminder of our Aspirations• A dominant regional alcoholic beverage brand and RTM owner
− #1 Cider company globally− #2 Alcoholic beverages company in SA− Leading player in core markets of Africa− Presence in at least one major international market/geography − Scale positions established in core markets
• Integrate BSD acquisition• A differentiated player
− Core ciders, wines and spirits resonating across different consumer occasions
• Enhance operating margins, cost and working capital efficiency• Unlock value from our wine assets
19

LEADSELECTED
EMERGING MARKETS
OWN THE LAST MILE
SCALE UPEXCELLENCE
CARE AND CONTRIBUTESHAPE THE
FUTURE
CRAFT DISTINCTIVE & COMPELLING
BRANDS
Corporate Strategy-Initiatives and UpdateStrategic Aspiration:Double revenue and profit by 2020!
Key initiatives:• Grow and win in RSA
• Expand into Africa & one major international market
• Leverage core brand portfolio
• Build scale positions in core markets and segments
20

LEAD SELECTED MARKETS!Organic Growth –TOP 10 markets
• SA performs!
• Distell brands competitive in key African markets
• Focused investment in Ghana & Kenya
• Nigeria & Angola - RTM alternatives advanced
• Nordics – down with SA wine-RTM and portfolio focus
• Taiwan holds promise!
• Brazil rev +78%
21

CRAFT DISTINCTIVE & COMPELLING BRAND PORTFOLIOS
• Accessible power brands deliver solid performances - Richelieu, 3 Ships, Hunter's, AH Crackling & 4th Street
• Accessible wines: revenue up 13%
• SA wine growth in all segments
• Pursuing new cider growth
• Positive value growth in “luxury brands”
• New Black Bottle launch underway-select markets, Revenue+13%
• Bisquit shows strong SA growth, underperforms in China
22
Category YTD Dec 2014Rev
GrowthContribution
DistellAccessible Power Brands 9% 87.0%"Luxury" Brands 17% 8.0%Vineyards & Estates 6% 4.0%

OWN THE LAST MILE –COMPETE IN THE STREET!
• SA Sales Force Effectiveness -increased coverage and service− YTD: 5 688 mainstream outlets, 60 sales people − Embedding execution standards - hard work ahead− Exceeding targets and ROI
• African RTM capability build continues− Detailed portfolio/RTM plans completed - Nigeria & Angola− Detailed brand & channel activity grids rolled out in selected markets − Ghana SFA pilot success
− Angola to commence− 230 in-country sales people trained
• Taiwan RTM expansion – deploy people and bulk up portfolio
23

SCALE UP EXCELLENCE• Supply Chain reliability & Customer service a major priority!
− Expansion of Springs capacity on track
− Freeze plant grows efficiency levels
• Supply Chain capability strengthened with senior appointments
• Network Optimization project underway
• Centralised Procurement - implement in waves
• Revenue Management - exceeding targets
24

SHAPE THE FUTURE!
• Senior appointments strengthen leadership team
• HR leadership in place, succession plan completed
• HR / Talent systems scoped & preferred ICT solution identified
• Change enablement capability build commenced
• Corporate strategy alignment process on track
• ICT architecture reviewed, strategy developed & approved
25

CARE AND CONTRIBUTE
• Role of corporate brand clarified
• Localised apple concentrate sourcing project formally commenced
• Transformation strategy developed to guide BBBEE progress
• Wine value unlocking strategy commenced
• Role of Distell Development Trust agreed• Align and prioritise CSI opportunities
• Step change initiatives aimed at addressing BBBEE
26

Thank you

Merwe Botha –Financial Director
1
Financial Results

Index
2
Salient features
Delivering value
Operating costs
Earnings and profit performance
Investment in operating assets
Cash flow and financing
ABCDEF

Delivering value
3
Operating profit
Salient features1
2
3 Headline earnings

4
Reported NormalisedSales volumes up 3.7% 3.7%Revenue up 10.5% 10.5%EBITDA -1.0% 9.9%Operating profit -4.6% 7.0%Headline earnings -7.6% 9.5%Growth in total assets 10.6%
Sal ient features of our performance to December 2014

5

6

Delivering value
7
Managing the underlying drivers of shareholder value
Contribution per region
Contribution per category
1
2
3

8
Rm Rm Trend Trend2014/15 Report Normal2013/14 9.0% 10.8% 990.3 1,071.8 92.4 109.5
9.1% 9.2%
ReportedNormalised 5.55% 6.64% 10,997 9,948 110.5
5.60% 5.65%
0.62 0.62 17,851 16,147 110.6
10.8% 12.6%
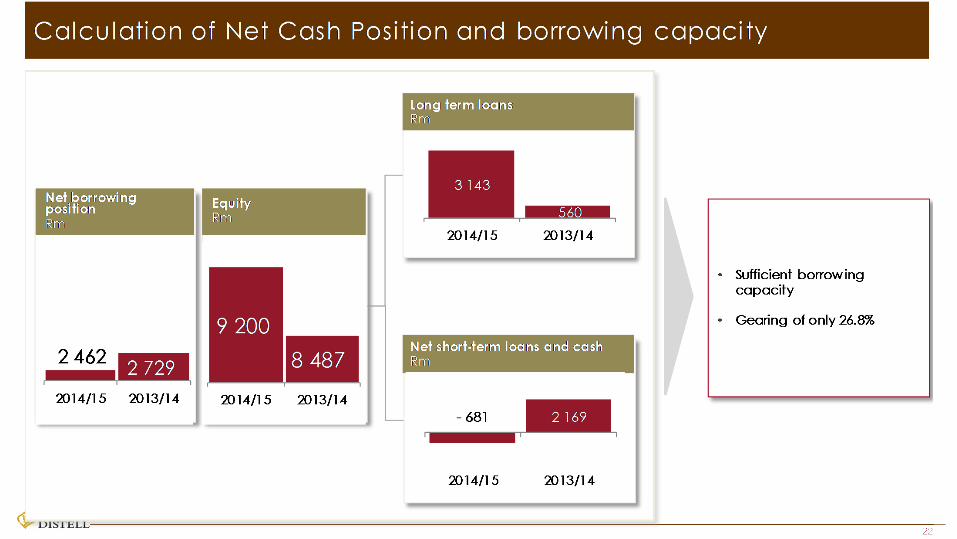
17,851 16,147 110.6Gearing
1.94 1.90
9,200 8,487 108.4
Equity and liabilities
Total equity
Return on Equity (ROE)
Revenue
Net Profit after Tax (NPAT)
Total assets
NPAT%
Return on assets (ROA)
Asset turn
Managing the underlying drivers of shareholder value
2013/14 Full year: 15.9% (normalised)
9

10

Operating costs
11
Operating expenses1

12

13

Earnings and profit performance
14
Margin management
Growth in operating profit
Headline earnings
123

15

16

17

Investment in operating assets
Net operating assets1
18

19

Cash flow and financing
Cash outflow and funding
Net cash position and borrowing capacity
1
2
20

21
22

Summary
1
23
Summary of performance

Summary
24
Satisfactory but uneven topline growth under challenging trading conditions
Efficiency gains reinvested in building capacity and capability to support future growth
Steep increases in excise duties impact margins
Gross margins improves marginally
Operating margin contracted from 13.8% to 13.4%
Disciplined investment and maintaining asset turn
Strong cash generation

Thank you
25
Questions?• This presentation contains ‘forward-looking’ statements, including specifically all statements that
express market forecasts; Distell’s commentary on macro and industry related market trends;and projections related to Distell’s business strategy.
• All forward-looking statements contained in this presentation involve risk and uncertainty sincethey are dependent on assumptions of circumstances that will occur in the future. There aremultiple variables which could cause actual results to differ from the forward-looking statementswhich are not within Distell’s management control. Such variables include, but are not limitedto, political, macro and socio-economic changes; legal and regulatory changes; litigationdevelopments; technological changes; environmental risks and changes in consumer trends,among others.
• As such, you are cautioned not to place undue reliance on the forward-looking statementscontained herein, as they apply only as at the date of this presentation.
• There is no obligation on Distell in the future to provide updates on forward-looking statementscontained in this presentation to reflect any changes in Distell’s projections with regard theretoor any changes in events or underlying assumptions on which any such statement is based.