Embed Size (px)
Citation preview

1
2
Strategy 5 Table of Contents Introduction and Strategy 5 Learning Objectives……………………………………………………...3 Key TPM Terms and Definitions……………………………………………………............................4 Unit 5.1 Developing and Selecting Performance Measures…………………………………………6
Exercise 1: Understanding Talent Supply Chain Performance Measures Unit 5.2 Designating Preferred Providers, Co-Engineering Programs, and Aligning
Incentives……...………………………………………………………………………………..10 Exercise 2: Preferred Provider Selection Criteria Case Study
Exercise 3: Employer Incentives Case Study Unit 5.3 Communicating Talent Supply Chain Performance and Incentives through
Visualization Tools……………………………………………………………………………..20 Exercise 4: Comparing Talent Supplier Performance Case Study
Unit 5.4 Calculating Return on Investment…………………………………………………………...27 Exercise 5: Calculating Return on Investment Case Study Ready for Next Steps? …………………………………………………………………………………29

3
Strategy 5 Learning Objectives
1. Understand the role of
performance measures
and incentives in TPM.
2. Select and develop
appropriate performance
measures to meet your
collaborative’s needs.
3. Designate preferred
providers of talent that
make up your talent
supply chain.
4. Identify and inventory
existing and potential
employer incentives to
improve supply chain
performance.
5. Develop and use
visualization tools such as
value stream maps and
performance scorecards.
6. Communicate and
manage ROI for
collaborative members.
Introduction
Having identified and projected demand for critical jobs (Strategies
2 and 3) and mapped the existing and potential talent supply chain
for addressing that demand (Strategy 4), we now explore how
employer collaboratives build and manage their talent supply
chains to create shared value for employers and their talent
sourcing partners, otherwise known as providers.
The most critical decisions in managing talent supply chains are
determining how to measure and incent performance in ways that
create a positive return on investment (ROI) for employers as well
as shared value for all partners.
These decisions are very important in Talent Pipeline Management
(TPM) because employer collaboratives will get the results that
they measure and reward. If they are measuring or rewarding the
wrong employer and partner behaviors, then collaboratives will not
be successful in managing cost-effective supply chains.
Strategy 5 addresses how to establish performance measures to
build talent supply chains and utilize incentives to manage them.
Strategy 5 builds off Strategy 4 in engaging talent- provider
partners in establishing measures and providing incentives that
matter most to them, including being designated as preferred
providers. Strategy 5 also develops and uses visualization tools
such as value stream maps and performance scorecards. Strategy
6 builds off of Strategy 5 and uses the tools to identify and manage
improvement projects to optimize employer ROI.
4
Key TPM Terms and Definitions
Employer Return on Investment (ROI): A measure that calculates the returns that employers
receive from investments, usually expressed as a ratio of total dollar benefits compared with
total dollar costs.
Performance Measures: Quantitative indicators of outcomes that are expressed in terms of
rates, ratios, or percentages addressing one or more critical variables, all of which contribute to
improved business performance and competitiveness:
Quality refers to whether individuals have the right mix of competencies to successfully
perform work for critical business functions and positions.
Time addresses maximizing efficiency in value-adding activities and reducing time spent
in non-value-adding activities and wait time between activities or services (e.g.,
employee training).
Cost refers to the balancing of dollars spent in producing quality outcomes, including the
reduction of opportunity costs (e.g., reducing foregone earnings).
Incentives: Financial and nonfinancial rewards provided to recognize results and to support
continuous improvement. Financial incentives include anything that has a monetary value,
including equipment donations, work-based learning opportunities, and access to staff.
Nonfinancial incentives include designations such as “preferred” provider status that can be
marketed by a program or institution for recruitment purposes.
Continuous Improvement: A structured method to improve a process over time. Continuous
improvement processes in the business world include Lean Six Sigma and the five-step DMAIC
(define, measure, analyze, improve, and control) process, which are used to optimize
performance and eliminate waste.
Value Stream: The process that a product or service goes through from beginning to end, with
each step adding incremental value until the product reaches the end-customer.
Value Stream Map: A visual tool used to show the major activities and roles in sequence that
make up a value stream.
Performance Scorecard: A set of metrics used to identify and improve performance within and
across a talent supply chain and to manage effective transitions.
Leading and Lagging Measures: Leading measures are short-term, intermediate measures
that address actions that are major determinants and predictors of longer-term, bottom-line
measures, otherwise known as lagging measures.

5
Transition Point: The moment when an individual moves from one program or service to the
next, which can occur within or between providers. For example, in TPM, transition points occur
when someone moves from a Tier 2 provider to a Tier 1 provider.
Feeder Schools: Education or workforce providers that are known to transition individuals
receiving education or services to another provider before reaching employers. For example, in
TPM, Tier 2 providers transition students to Tier 1 providers.
Preferred Providers: Providers of talent sourcing and development services—including
education and workforce providers and staffing organizations—that are recognized by an
employer collaborative based on their ability to meet employer requirements, such as ability and
proven track record for supplying qualified talent for jobs.
Transition Measures: The key performance measures at each point of transition.
Performance Dashboard: A visualization tool used to communicate the major performance
indicators that have been prioritized to tell employers and their stakeholders how effective
partnerships have been in managing key transition points and achieving intended outcomes.
Baseline Cost: The total cost incurred by employers measured in dollars relative to their
starting position prior to taking any kind of action. An example of a baseline cost is the cost of a
hire prior to engaging in a talent supply chain solution.
Benefits Achieved: The value derived by employers over and above the cost of implementing a
solution, which can be measured, for example, in dollars, such as reduced cost in filling a
position, or in time, such as a shorter onboarding process.
Cost of Engaging in a Collaborative: The total cost in terms of time spent and resources
committed when working as a member of an employer collaborative. This calculation is needed
to compare total cost versus total benefit to calculate an employer ROI.
Full Productivity: The point at which an individual has reached expected levels of productivity
in a destination job. In TPM, time to full productivity can be tracked as a performance measure
to ensure individuals are managing transitions and being effectively onboarded into employment
with minimal time lost.
6
Unit 5.1 Developing and Selecting Performance Measures
Where to Start: Measuring Key Pain Points Connected to Business Performance
The first step in building your talent supply chain is determining which performance measures
are most important in delivering an ROI to your employer members. From there, collaboratives
can designate the preferred providers that are best positioned to deliver against those measures
and identify other incentives that can help optimize performance.
In TPM, performance measures start from an employer perspective by addressing how
improved talent sourcing for the most critical business functions and jobs will contribute to
improved business performance and competitiveness. These measures create a clear “line of
sight” or relationship between talent sourcing measures and overall business performance
measures.
For example, reducing the time it takes to fill critical job openings with qualified talent
contributes to improved productivity and revenue generation because essential work gets done
on time or more work can be taken up. In addition, reducing turnover cuts costs associated with
recruitment, onboarding, and training, which contributes to the overall profitability of the
organization.
The examples above hit on three talent management challenges associated with key pain points
experienced by employers that were first presented in Strategy 1:
Unfilled Job Openings: The inability to fill critical job openings with qualified talent in
the time frames needed to meet business needs, results in lost revenues.
Onboarding and Upgrading Costs: Costs of onboarding recent hires and upgrading
existing workers are high and increasing.
Turnover and Retention: The inability to retain workers who are leaving the industry
and the region results in additional hiring and training expenses as well as lost
productivity.
In developing performance measures, collaboratives should identify specific measures that
address these challenges. They should start by asking employers what measures they currently
use to track and analyze their key pain points and how collaboratives can build on these
measures. Collaboratives should also ask how frequently employers gather and report data on
these measures and the internal data sources they use.

7
Here are some example measures for the three identified pain points:
Unfilled Job Openings: Measuring at the Point of Hire
Percentage of partners’ referred applicants who meet hiring requirements
Ratio of job openings to qualified applicants
Average number of days between initial job posting and hire
Percentage of jobs filled within a needed time period
Cost per hire
Onboarding and Upgrading Costs: Measuring Hires against Meeting Performance
Expectations
Percentage of hires meeting employer performance expectations within expected time
periods
Average number of days from hiring to meeting employer performance expectations
Costs of onboarding to meet performance expectations
Turnover and Retention: Measuring Longer-Term Results
Percentage of hires retained in employment after defined time period
Cost of turnover within defined time period
In most cases, employer collaboratives will have to collect data on these pain point measures
directly from employers based on common measures and time periods.
Measuring Performance Drivers and Key Points of Transition in the Pipeline
The next step is for collaboratives to develop additional leading measures that may drive or
predict performance on these pain point measures and also help manage key transition points,
including transitions from career exploration and awareness to enrollment in programs of talent
sourcing partners.
The best measures are:
1. Actionable: Those measures where employer collaboratives can take action to improve
performance on their key pain points but also help partners address these pain points in
ways that create shared value for all partners. These are leading measures because
they are important determinants or drivers of performance on pain point measures. They
also are important in creating shared value because they improve the cost effectiveness
of supply chains in addressing employer needs.

8
2. Aligned: Employer collaboratives should consider how these measures not only align
with their own company measures but also align with government measures so that
talent providers are not pulled in different directions.
3. Cost-Effective: One final consideration is ongoing data collection costs for employers
and their partners. In most cases, employer collaboratives will have to ask talent
sourcing partners to report this information based on an annual data request. In some
cases, this also will involve additional data collection from employers, such as the
percentage of completers applying for jobs with employers in the collaborative.
Table 5.1 illustrates how employer collaboratives can design leading indicators at key transition
points that are predictive of performance on pain point measures. In this example, employer
collaboratives can track whether they are getting the right numbers of students from feeder
schools into career preparation and pre-employment training programs (e.g., ratio of enrolled to
total capacity) and whether the number and percentage of students coming out of these
programs and applying for open positions is sufficient to reach the desired ratio of openings to
qualified applicants.
One major challenge in aligning key points of transition measures (leading measures) to more
bottom-line employer pain point measures (lagging measures) is deciding when to expect
interventions in the supply chain to have major impact on employer metrics, including employer
ROI. These expectations are important in managing and incenting performance.
Table 5.1: Examples of Types of Measures
Employer Pain Point Measures
Career Preparation/ Pre-Employment Training
Transition Measures
Career Awareness/Exploration
Transition Measures
Percentage of partners’ referred applicants who meet hiring requirements
Ratio of job openings to qualified applicants
Average number of days between initial job posting and hire
Percentage of jobs filled within needed time period
Cost per hire
Number and percentage of completers from talent-provider partners applying for jobs with collaborative employers
Percentage of enrolled students completing programs and attaining required or preferred credentials
Ratio of enrolled students to total enrollment capacity
Cost per credentialed student
Percentage of students from feeder schools enrolling in targeted programs of talent-provider partners
Percentage of students from feeder schools indicating a career interest related to critical jobs
Percentage of students from feeder schools participating in career exploration activities related to critical jobs
9
Exercise 1: Understanding Talent Supply Chain Performance Measures
After reviewing the example measures on the previous page, discuss the following with
your group:
1) What types of performance measures do you have experience with? Which are the most
common in your line of work, including your work with employers and any grants or
programs you have been part of or administered?
2) In what ways are the performance measures described in this strategy similar to or
different from your past experience?
3) Which pain point, driver, and transition measures would be of most interest and value to
your collaborative?

10
Unit 5.2 Designating Preferred Providers, Co-Engineering Programs, and Aligning
Incentives
With a process in place for measuring performance, collaboratives are now prepared to
designate those providers that are best positioned to drive performance and achieve an ROI for
the collaborative members. This process can be informed by the back mapping and talent flow
analysis conducted in Strategy 4. With providers chosen, the collaborative can then co-engineer
programs with preferred providers and develop a strategy for aligning a broad range of potential
incentives that reward those providers and networks that deliver results.
Designating Preferred Providers
The most important incentive a collaborative can reward in the TPM process is designating or
recognizing an education or workforce provider as a “preferred” provider of talent to their
member companies, based on their past or anticipated ability to produce results. In managing
supply chains, businesses have established standards and recognition systems to manage and
improve suppliers that provide them materials and services. However, the business community
has yet to set standards and develop a recognition process when it comes to education and
workforce providers that supply them with talent.1
The preferred provider incentive is the foundation used to target other financial incentives, such
as internships and equipment donations, which can improve performance in the talent supply
chain and contribute toward a stronger ROI for employers. However, employers in the
collaborative must first designate which providers are eligible to receive their incentives.
When organized effectively, a preferred provider designation can be a highly sought-after
incentive by education and training providers that wish to demonstrate that they have a
validated special relationship with employers. This can improve recruitment of students into
programs and contribute significantly toward getting those students quality outcomes in terms of
employment—an increasingly important point given increased government and public scrutiny of
education outcomes.
1 To learn more about the global ISO system used to set quality management standards for suppliers and provides the foundation for supplier certification, read the following publications: Robert Sheets and Jason Tyszko, Changing the Debate on Quality Assurance in Higher Education: The Case for Employer Leadership and a Roadmap for Change (Washington, D.C.: U.S. Chamber of Commerce Foundation, 2015). Jason A. Tyszko (2017) Employer-led Quality Assurance, Change: The Magazine of Higher Learning, 49:1, 26-33.

11
When a collaborative comes together to establish the criteria necessary to earn preferred
provider status, it effectively creates an employer-led quality assurance system that
complements public-sector-driven accreditation and accountability systems. Having this type of
market signaling in place could also activate new incentives, such as better financing tools for
preferred providers.
How to manage and distribute the designation of preferred provider is the choice of the
collaborative, but below are important considerations members of each collaborative must work
through together:
Collaborative or Employer-Specific Designation: Will the collaborative manage the recognition process and provide the endorsement, will it manage a process that enables its employer members to make endorsements, or will it do both?
Current or Potential Providers: The collaborative can narrow its list to those providers that it previously identified through Strategy 4 and back mapping, or it can expand the review to include potential providers of talent that no company has recruited from to date.
Process and Performance Requirements: How will the collaborative or employer members establish the criteria for recognizing a preferred provider? Will these criteria include process considerations, such as how the provider utilizes employer inputs (e.g., employer-specified competencies) and demonstrates flexibility, or will they include performance expectations, such as proven ability to deliver a quality workforce on time and at the right cost?
Level of Recognition: Will the collaborative have one or more levels of recognition? What will be the requirements to achieve recognition? For example, a collaborative can set foundational requirements for providers—such as the ability to integrate industry-recognized credentials—while employer members can set more advanced requirements based on their particular talent needs, such as actual hires.
Tiers: Will the preferred provider designation go only to Tier 1 providers—one step removed from employment (see Strategy 4)—or will it be extended to Tier 2 and beyond to tier feeder programs as well?
How to Validate: What processes will the collaborative use to validate that a provider has met the requirements? Who will manage the process, and what data do they need access to?

12
There are also potential unintended consequences that should be watched for and avoided when designating preferred providers. Examples include:
Partner Lock-In: Employer collaboratives should be mindful of maintaining their leverage with preferred partners by always having opportunities to work with other potential sources of talent. Collaboratives should always preserve choice in who they can work with in order to maintain the responsiveness and flexibility that their talent supply chain requires.
Restricted Access to Talent: Talent supply chains should not be rigid in that they restrict access to other sources of qualified talent that apply for jobs. Employers need to be open to all qualified talent but should be proactive in sourcing from preferred partners that have demonstrated the responsiveness and flexibility needed to fill their need.
Community Reputation: Designating preferred providers does not come without risk to reputation and brand. There is a risk that employers may be labeled as not being good partners to education and workforce providers and might be characterized as cutting certain providers out. This should be avoided by always being open and transparent about what the collaborative is trying to accomplish and the requirements for being designated a preferred partner, and by always allowing for adjustments over time based on the ability of new providers to demonstrate that they can meet the needs of the collaborative.
Being a preferred provider will be very important to almost all talent providers in any community,
especially publicly funded providers that have a mission to address employer needs. As a result,
employer collaboratives should manage this process in ways that build acceptance and trust
with existing and future providers in their communities. This especially applies for providers that
are already involved as partners in established public-private partnerships (see Strategy 1) and
may even be members of chambers of commerce and economic development organizations
that are playing the function of host organization.

13
Exercise 2: Preferred Provider Selection Criteria Case Study
A 10-member manufacturing collaborative has come together to improve the pipeline of
qualified machinists, a position that has a chronic shortage, which the companies agreed needs
a shared solution. As part of its efforts to manage the talent pipeline, the collaborative wants to
identify current and potential future sources of machinists and explore how to better signal to
students interested in manufacturing careers what career pathways reach their companies. The
companies have agreed that a key part of their efforts must be to increase the number of
industry machining credentials awarded during training to ensure students are better qualified
and need less training once onboarded.
The collaborative collectively identifies that each company gets the most qualified recruits from
an area community college. However, there are not enough students coming out of the college
to satisfy the level of need now or in the future. In addition, many students coming out of the
program do not leave with an industry credential in machining. Further review of HR records
indicates that students coming from the program often need additional training and retention
rates are consistently low.
Two employer members inform the other collaborative members that they have recently started
sourcing machinists from a community-based nonprofit that provides training for low-income
workers seeking a career in manufacturing. The customized training program has smaller class
sizes and doesn’t award college credit, but students do earn industry credentials in machining
and require little additional training once onboarded. Another private college in the area has
recently developed a new machining program that has industry credentialing as a central
feature of the program, but none of the collaborative members currently has a relationship with
the college. Last, a feeder high school to the community college is excited to learn about the
manufacturing collaborative that has formed and has reached out to the host organization
requesting an endorsement.
After reviewing the case study above, discuss the following:
1) Which of the four providers (i.e., the area community college, the community-based nonprofit,
the private college, and the feeder high school) should be considered a preferred provider?
Discuss how you arrived at your decision.
2) What evidence would the collaborative need in order to recognize a program as a preferred
provider?
3) What are the major questions or issues that will arise if some providers are recognized and
not others? How could the employer collaborative manage this process to build acceptance and
trust in the process?

14
Co-Engineering Programs
After an employer collaborative has designated preferred providers, the next step is to work with
those providers to co-engineer programs delivered across a network of education and workforce
providers and that can achieve an ROI for the employer collaborative members.
We define programs as education and training services (learning objectives, activities, and
resource materials) provided through classroom and/or work-based learning as well as related
services, such as student recruitment, orientation, assessment, screening, scheduling, advising,
and other support services that might impact performance, including quality, cost, and time.
Host organizations—along with selected representatives from the employer collaborative—
should take the information gathered in Strategies 2 and 3 as part of their needs assessment
and share this information with preferred providers that were identified in Strategies 4 and 5.
Information related to the level of need for critical positions and the competencies and
credentials required to fill that need can be used to co-engineer programs where each provider
that makes up the supply chain can identify what role it will play in building the talent pipeline.
When possible, the collaborative should defer to the expertise of faculty, curriculum designers,
and student service providers to develop programs that provide the most cost-effective and
responsive way to meet the collaborative’s hiring requirements. However, host organizations
should not be afraid to weigh in when the design of the program fails to balance the needs of
the collaborative as defined by time, quality, and cost.
They can also determine how students will demonstrate the acquisition of technical and soft
skills in ways that are trusted and accepted by members of the collaborative. This includes
having input on the preferred types of assessment used by preferred providers to validate that
learning objectives have been met.
In addition to mapping out which providers play which roles in the talent supply chain, the host
organization can also connect performance metrics to each of the preferred providers to track
talent supply chain performance relative to expectations. Using the performance metrics
identified in section 5.1, the host organization can identify the most important transition
measures and link them across the talent supply chain in a transparent way that shows the
expectation of each partner relative to one another. These measures should inform the
previously referenced bottom-line or pain point measures that help define an ROI for the
employer collaborative members.
15
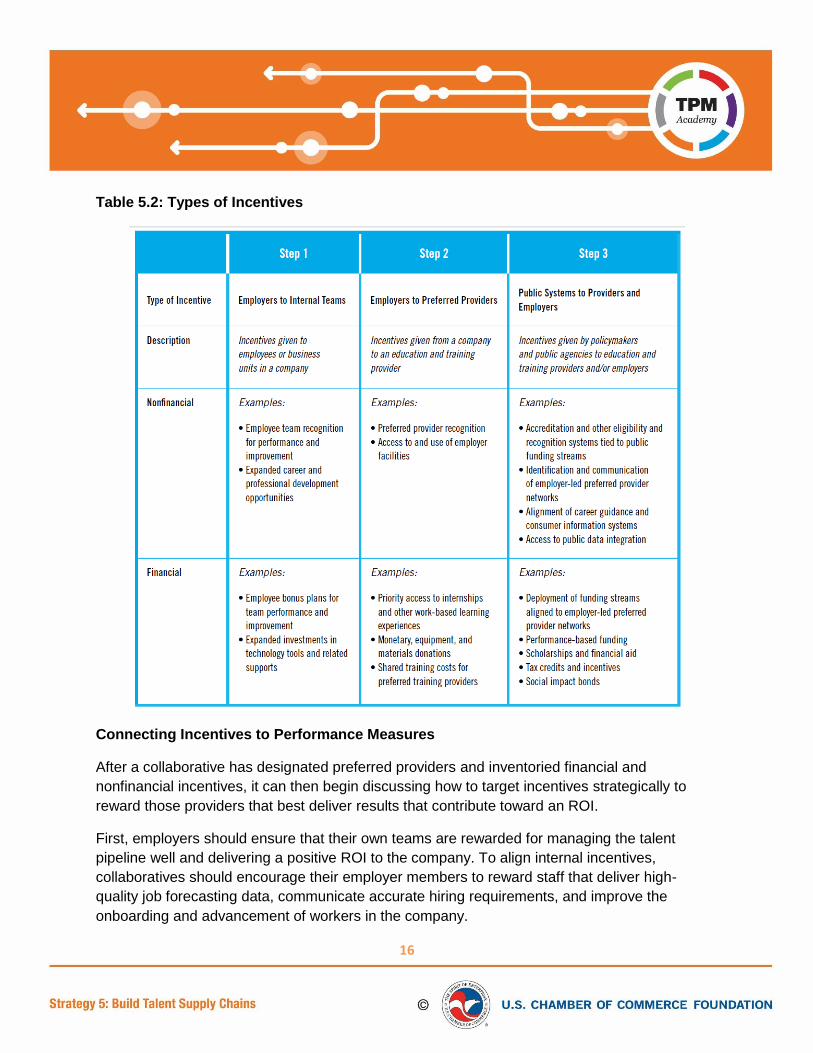
Inventorying Incentives
Once employers have made their selection of preferred talent providers and begun the process
of co-engineering programs, they can then inventory a wide range of other incentives that can
be targeted in ways that optimize talent supply chain performance. This includes incentives
employers already use and other incentives they could use in the future.
Inventorying existing and potential incentives provides critical information in helping employers
establish a clear baseline understanding of what they currently spend in the form of financial
incentives and how they can improve the use of both financial and nonfinancial incentives in
improving talent supply chain performance (see Table 5.2: Types of Incentives on page 16 for
examples) and improving their ROI.
Incentives can be financial and nonfinancial. For example, collaboratives can provide exclusive
access to equipment, staff, and work-based learning opportunities as financial incentives. We
have already covered the preferred provider designation as a critical nonfinancial incentive that
employer collaboratives can use to signal to the marketplace that the institution or program has
a special relationship with the collaborative’s employer members.
Employer collaboratives have significant leverage when they coordinate incentives across
companies. Targeting incentives is critical to ensuring employers are getting the right type of
responsiveness and flexibility out of providers. It also ensures providers that their efforts to
understand and meet employer needs reap rewards for their programs and, most importantly,
their students.
Employer collaboratives can increase their leverage even further by working with public
agencies to align incentives and ensure the right mix of incentives is in place in order to deliver
ROI for employer partners.
When managing the talent pipeline, employer collaboratives should consider and document the
full range of private and public incentives that could be used to drive performance in talent
pipelines. These include the following:
Employer Incentives for Internal Talent Management Teams: Incentives that reward internal talent management teams—including line managers, trainers, and human resource staff—for working effectively together to build the talent pipeline
Employer Incentives for Preferred Providers: Incentives targeted toward external talent providers that produce results for the collaborative
Public Incentives for Employers and Providers: Incentives provided by public entities to support employers and their preferred providers in building a talent pipeline
16
Table 5.2: Types of Incentives
Connecting Incentives to Performance Measures
After a collaborative has designated preferred providers and inventoried financial and
nonfinancial incentives, it can then begin discussing how to target incentives strategically to
reward those providers that best deliver results that contribute toward an ROI.
First, employers should ensure that their own teams are rewarded for managing the talent
pipeline well and delivering a positive ROI to the company. To align internal incentives,
collaboratives should encourage their employer members to reward staff that deliver high-
quality job forecasting data, communicate accurate hiring requirements, and improve the
onboarding and advancement of workers in the company.

17
Companies have many resources at their disposal to recognize these internal teams and reward
them for helping achieve a positive ROI. This is critical to demonstrate that efforts aimed at
improving the talent pipeline generate for the company positive returns that are recognized and
valued.
Next, employers should target incentives to their designated preferred providers and from there
align with public incentives where possible. Not all incentives have to be tied to a preferred
provider designation. However, the more a collaborative can tie incentives to a preferred
provider designation, the more likely providers will see the value in being more responsive and
flexible in meeting the collaborative’s requirements.
The most important incentive of all is priority access to jobs, but there are many other ways to
reward providers. Incentives range from equipment donations and priority access to work-based
learning opportunities, scholarship access and tuition reimbursement. What is most important is
that employers understand that these incentives are highly valued and sought after and should
not be given away lightly, but should be part of a continuous improvement system for talent
supply chain performance and employer ROI. The process of inventorying and aligning
incentives should also be done as an extension of the process for co-engineering programs.
Below are important considerations every collaborative should work through when identifying
and targeting incentives to providers of talent sourcing and development services:
Available Incentives: Per your incentive inventory, what types of financial and nonfinancial incentives are collaborative members providing now and capable of providing in the future?
Incentive Eligibility: Will any incentives provided in the future be available to any provider or will they be reserved for those providers that have obtained an endorsement from the collaborative, such as a preferred provider designation?
Managing Incentives: Who will manage the distribution of incentives? Will it be the host organization managing the collaborative or individual employer members?
Demand for Incentives: Are the incentives in demand from providers? Were incentives accounted for in the process for co-engineering programs with preferred providers? Is there a process to solicit feedback from preferred providers on what incentives would be most valuable?
Connection to Performance: Is there a connection between the type of incentive given and performance? Can the incentive be tied to maintaining high levels of performance and improving performance against any of the previously selected performance measures?

18
Aligning Public Incentives
The last types of incentive your collaborative should consider are those that are managed by
public-sector agencies. For the most part, employer collaboratives should be focused on how to
manage the talent pipeline using their own incentives. This ensures that employers preserve
their end-customer role and achieve the right level of responsiveness and flexibility with
preferred providers.
When collaboratives are formed, they bring about opportunities to substantially improve
employer-signaling in the talent marketplace. The signaling that results from these employer
collaborative members can be leveraged by public-sector partners to achieve a better return on
public-sector investments. However, while public-sector incentives often bring much-needed
resources to the table, public-sector partners must be cautious that they do not remove
employers from the end-customer role in ways that reduce quality and increase time and cost.

19
Exercise 3: Employer Incentives Case Study
The manufacturing collaborative from the previous case study decided to inventory the
incentives that member companies currently provide to education and training providers and
better manage those incentives in a way to help build an improved talent pipeline.
The members discovered that each of them sponsors facility tours for younger students in the
fall and spring. Some of the collaborative members also allow their employees to visit
community college classes, where they advocate for careers in manufacturing. Many of the staff
members who participate in these site visits also mentor interested students. The companies
recognize this volunteerism annually in industry newsletters and during an annual manufacturer
association dinner and fundraiser.
In addition to site visits and mentorship, many of the collaborative’s employers offer some type
of internship program. However, there is wide variation in the number of internships offered and
how the program is delivered and assessed. Outside of anecdotal evidence, members have not
intentionally tracked whether interns are retained by the companies and in the region.
The collaborative also discovered that last year one of the manufacturers had to upgrade some
of its machinery and donated the used equipment to an area high school looking to improve its
career and technical education program for manufacturing.
Last, two of the larger manufacturers in the collaborative offered scholarships to 15 high-
achieving students in the machining program of the high school where equipment was donated.
After reviewing the case study above, discuss the following:
1) What incentives are the member companies currently providing, and which are most
important to helping improve their talent pipeline?
2) Should certain incentives be managed by individual employers or by the collaborative?
3) Based on your previous designation of preferred providers, which incentives should be
targeted to which providers and why?
4) What are additional incentives not mentioned in the above example that the collaborative
might want to consider adding?

20
Unit 5.3 Communicating Talent Supply Chain Performance and Incentives through
Visualization Tools
With the most critical performance measures and incentives selected, collaborative members
can now develop visualization tools that organize talent supply chain networks and
communicate performance. The most important visuals include value stream maps, talent
supply chain networks, and performance dashboards.
Value Stream Maps
An employer collaborative can develop a visual blueprint of the talent supply chain using a value
stream by identifying not only the major activities involved in developing talent, but also the
performance expectations at each transition point. The value stream map can be a product of
the process used to co-engineer programs with preferred providers. Value stream maps are a
useful tool for communicating how employers and preferred providers understand the talent
development process from start to finish and provide a way of clearly signaling the major
transition points and the roles and responsibilities of all partners involved in the process. The
maps can also be used to visually show the major performance drivers in sequence, along with
the incentives tied to them. Value stream maps have five major components:
Talent Pipeline Roles: The major roles or functions (e.g., career awareness) played by employers and their partners, showing shared responsibilities at each transition point in the pipeline
Transition Measures: The key performance measures at each point of transition
Aligned Incentives: The incentives that are targeted at each stage of the talent-development process
Tiers: Which roles fall under which tiers
Preferred Providers: Which providers are tagged to which tiers and roles
See Figure 5.1 Basic Value Stream Map and Figure 5.2 Advanced Value Stream Map on page
21 for each transition point and associated performance goals. The more advanced map
provides the added advantage of showing how the five major components fit together.

21
Figure 5.1: Basic Value Stream
Map
Figure 5.2: Advanced Value Stream Map
22
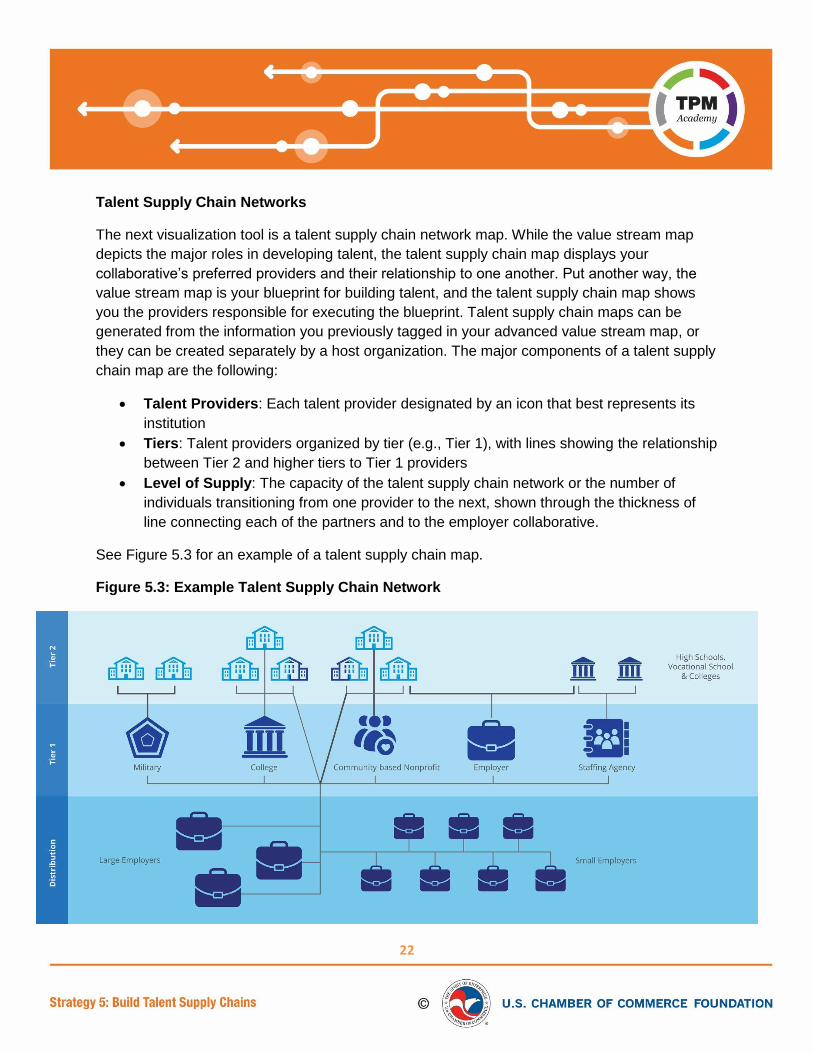
Talent Supply Chain Networks
The next visualization tool is a talent supply chain network map. While the value stream map
depicts the major roles in developing talent, the talent supply chain map displays your
collaborative’s preferred providers and their relationship to one another. Put another way, the
value stream map is your blueprint for building talent, and the talent supply chain map shows
you the providers responsible for executing the blueprint. Talent supply chain maps can be
generated from the information you previously tagged in your advanced value stream map, or
they can be created separately by a host organization. The major components of a talent supply
chain map are the following:
Talent Providers: Each talent provider designated by an icon that best represents its
institution
Tiers: Talent providers organized by tier (e.g., Tier 1), with lines showing the relationship
between Tier 2 and higher tiers to Tier 1 providers
Level of Supply: The capacity of the talent supply chain network or the number of
individuals transitioning from one provider to the next, shown through the thickness of
line connecting each of the partners and to the employer collaborative.
See Figure 5.3 for an example of a talent supply chain map.
Figure 5.3: Example Talent Supply Chain Network

23
Performance Dashboards
Now that you have mapped the value stream and created a talent supply chain map, the next
visualization tool is a performance dashboard that allows you to compare the performance of
your preferred providers against key performance drivers and outcomes. In reporting
performance data, employer collaboratives should start by developing simple performance
dashboards that communicate how well the collaborative and its partners meet performance
expectations.
The dashboard minimally should include the following:
Name and Description of the Performance Measure: A clear and concise name and
description
Performance Level: Achievement against the measure expressed as a ratio,
percentage, or absolute number or rating
Performance Relative to Expectations: Whether current level of performance is
meeting, exceeding, or not meeting the expected level of performance, expressed in
letters, icons, or colors
Performance Trend: Whether the performance level is improving over recent time
periods, expressed in upward or downward arrows or other types of icons and colors
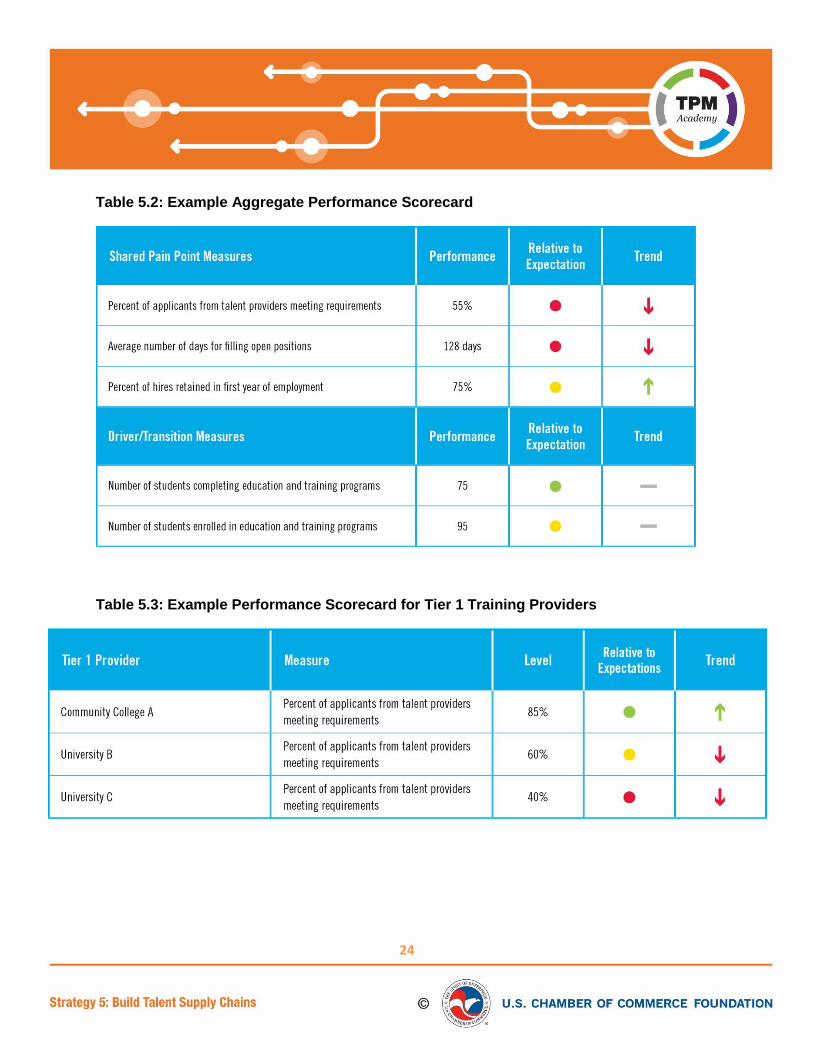
Employer collaboratives can use performance dashboards to benchmark progress of any one
provider against one or more transition measures, or they can use them to compare
performance across multiple providers.
For those employer collaboratives managing multiple talent supplier networks, these dashboard
tools can be used to compare performance among partners and make strategic choices about
talent pipeline partnerships. By comparing performance, your collaborative can identify leading
practices that can inform continuous improvement or make determinations about whether to
ramp up, ramp down, or discontinue a partnership. See Table 5.2 for an example of an
aggregate performance scorecard and Table 5.3 for an example of a performance scorecard
comparing providers against a common metric; both tables can be found on page 24.
24
Table 5.2: Example Aggregate Performance Scorecard
Table 5.3: Example Performance Scorecard for Tier 1 Training Providers
25
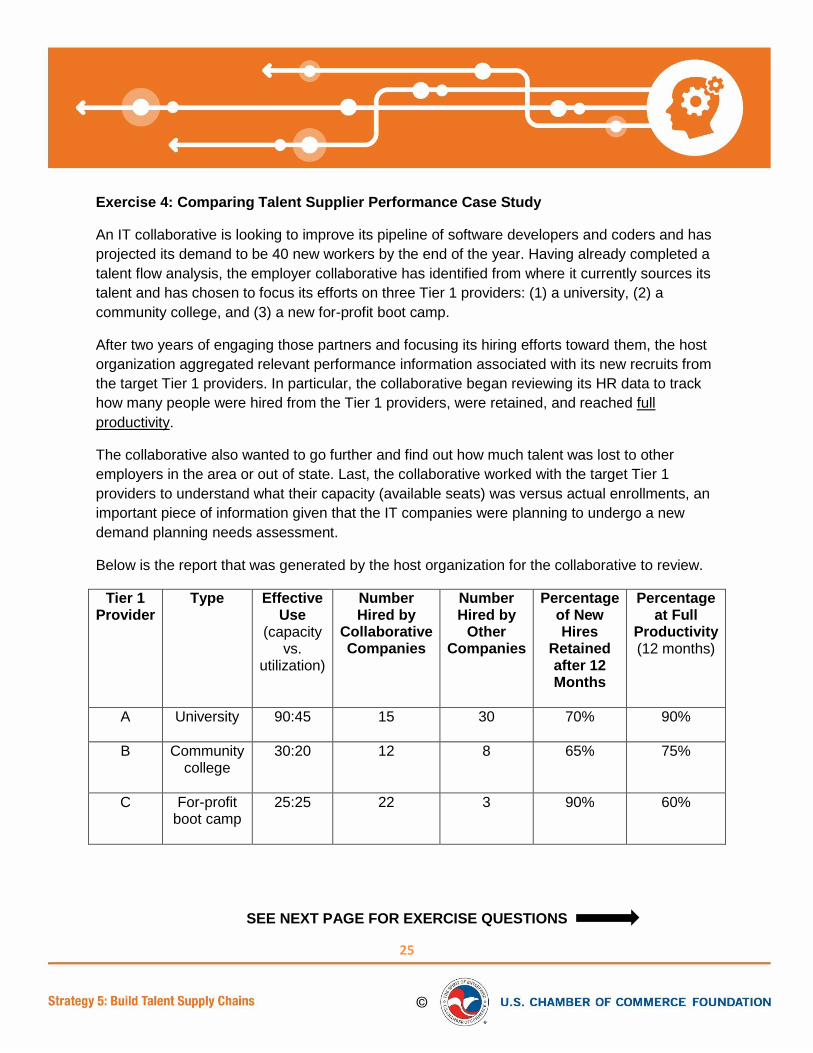
Exercise 4: Comparing Talent Supplier Performance Case Study
An IT collaborative is looking to improve its pipeline of software developers and coders and has
projected its demand to be 40 new workers by the end of the year. Having already completed a
talent flow analysis, the employer collaborative has identified from where it currently sources its
talent and has chosen to focus its efforts on three Tier 1 providers: (1) a university, (2) a
community college, and (3) a new for-profit boot camp.
After two years of engaging those partners and focusing its hiring efforts toward them, the host
organization aggregated relevant performance information associated with its new recruits from
the target Tier 1 providers. In particular, the collaborative began reviewing its HR data to track
how many people were hired from the Tier 1 providers, were retained, and reached full
productivity.
The collaborative also wanted to go further and find out how much talent was lost to other
employers in the area or out of state. Last, the collaborative worked with the target Tier 1
providers to understand what their capacity (available seats) was versus actual enrollments, an
important piece of information given that the IT companies were planning to undergo a new
demand planning needs assessment.
Below is the report that was generated by the host organization for the collaborative to review.
Tier 1 Provider
Type Effective Use
(capacity vs.
utilization)
Number Hired by
Collaborative Companies
Number Hired by
Other Companies
Percentage of New Hires
Retained after 12 Months
Percentage at Full
Productivity (12 months)
A
University 90:45 15 30 70% 90%
B
Community college
30:20 12 8 65% 75%
C
For-profit boot camp
25:25 22 3 90% 60%
SEE NEXT PAGE FOR EXERCISE QUESTIONS

26
After reviewing the case study on the previous page, discuss the following:
1) Did the collaborative achieve its goal? Explain your answer.
2) Which provider performed better and why? What grade would you assign each of them?
3) What questions might the collaborative have for each talent provider after reviewing the
report, and what decisions might the collaborative make to improve the pipeline?
4) What additional performance information might you include in a future report, or what
pertinent information might be missing?
27
Unit 5.4 Calculating Return on Investment With an understanding of how to develop and select key performance measures tied to employer pain points and how employers should identify their current and future financial incentives, we now turn to how employer collaboratives should provide the necessary guidance for employers to calculate their ROI in participating in the collaborative. As discussed in Strategy 1, employer collaboratives must communicate a clear value proposition to employers that they will better address their key pain points and achieve a greater ROI by supporting the work of the collaborative. Employer collaboratives should strongly encourage employers to calculate their ROI in working with the collaborative by considering at least two major types of costs:
Employer Collaborative Participation: Time and resources spent working with the collaborative on managing a talent supply chain solution
Employer Incentives: Costs associated with any direct investments made by employer partners to support and reward provider networks
In addition, host organizations should encourage their employer members to calculate their own ROI using their preferred methodologies. Host organizations can assist their employer members by providing benchmarks from their own industries, such as measures for cost of hire and cost of turnover in manufacturing and information technology The simplest form of calculating ROI is by comparing the baseline cost (BC) versus benefits achieved. To do this, take the baseline cost and subtract the updated cost (UC) plus the cost of engaging in a collaborative (CEC) (participation cost and incentives), and divide by the baseline cost. Take the total and multiply by 100 to get an ROI percentage. Formula: [BC – (UC + CEC) / BC] x 100 For example, if the measure that was most important to a collaborative was to calculate the ROI achieved in reducing the cost of a hire, then you can take the baseline cost of a hire over a specified baseline time period before participating in the collaborative (BCH) and subtract the updated cost of a hire after participating in the collaborative (UCH) plus the cost of engaging in a collaborative (e.g., membership fees, staff time) and divide the total by the baseline cost, then multiply by 100.
Example Formula: [BCH – (UCH + CEC) / BCH] x 100

28
Exercise 5: Calculating Return on Investment Case Study
An IT collaborative has come together to solve a critical shortage of network administrators
across its members’ companies. The companies’ pain point challenge is not finding enough
highly qualified workers to meet the cybersecurity needs of many of their new defense
contractor clients. The host organization has convinced its members to buy in to an ROI
calculation that will show whether the collaborative is adding value and, if so, by how much.
To start, the collaborative members decided to focus on the total cost of a hire to see if they
have achieved any savings by working together. They also decided to provide ROI data to the
collaborative in ways that can be aggregated annually to show the average level of returns to
collaborative members and benchmark progress.
Having agreed on how success would be measured, the members established their baseline
costs. The collaborative used an industry methodology for measuring hiring costs, along with
some standard benchmarks for costs. This methodology includes advertising, candidate
screening and selection, and onboarding. The average hiring cost reported by employers using
this methodology and related benchmarks was $8,000 per hire. The companies then added in
the expense of staff time and related expenses incurred in serving on education and workforce
advisory groups and attending related meetings and events, averaging about $30,000 per hire.
After a year of working together and sourcing new network administrators with a set of preferred
providers, the collaborative increased the number of highly qualified job candidates and new
hires. After sharing their data with the host organization, members found that they reduced their
advertising, candidate screening and selection, and onboarding costs by 50% to $4,000 per
hire. The collaborative members continued to provide staff to engage directly with providers but
focused staff time on essential meetings and events with preferred providers, resulting in a 50%
reduction in employer costs to a cost of $15,000 per hire. The time and cost associated with
engaging in the collaborative (e.g., membership dues, time spent in meetings), was estimated at
about $2,500 per company, per hire. In addition, as part of the collaborative’s incentives
employers now offer paid work experience for students from these providers, averaging $10,000
per hire.
In all, members concluded that they received a positive ROI that could be further increased by
cooperating on new initiatives to improve talent pipeline performance.
After reviewing the case study above, discuss the following:
1) What is the baseline cost of a new hire versus post-collaborative engagement?
2) What is the return on investment?

29
Ready for Next Steps?
Before you move to the next strategy, make sure you have achieved the learning objectives necessary to move forward. Ensure that when you go back to your community, you will be able to execute the following activities:
Explain the role of performance measures and incentives in TPM; Develop and select performance measures; Calculate ROI for employer members; Design value stream maps and performance management dashboards; Compare performance of networks and providers with one another; Develop preferred provider criteria and designations; Select and target incentives for managing talent pipelines. Optional: For those using the TPM web-based tool, use the tool to implement
performance measures and incentives.