Embed Size (px)
Citation preview

Strategist’s Handbook:Chart Updates
Yardeni Research, Inc.
July 12, 2018
Dr. Edward Yardeni516-972-7683
Please visit our sites atwww.yardeni.comblog.yardeni.com
thinking outside the box

Table Of Contents Table Of ContentsTable Of Contents
July 12, 2018 / Strategist’s Handbook: Chart Updates www.yardeni.com
Yardeni Research, Inc.
Stock Prices 1S&P 500 Earnings, Revenues, Margins 2S&P 500 Revenues & Margins 3Forward Revenues, Earnings, & Margins 4S&P 500/400/600 Forward Earnings & Margins 5Blue Angels 6Valuation 7-8S&P 500 Sectors Forward P/Es 9S&P 500 Sectors Price Indexes 10S&P 500 Sectors Forward Earnings 11Equity Flows 12Dollar & Commodities 13Stocks & Commodities 14Big Picture 15US Economic Indicators 16-17China 18Eurozone 19Global 20
1995 1996 1997 1998 1999 2000 2001 2002 2003 2004 2005 2006 2007 2008 2009 2010 2011 2012 2013 2014 2015 2016 2017 2018 20193.0
3.5
4.0
4.5
5.0
5.5
6.0
6.5
7.0
7.5
8.0
8.5
9.0
9.5
3.0
3.5
4.0
4.5
5.0
5.5
6.0
6.5
7.0
7.5
8.0
8.5
9.0
9.5
7/11
7/11
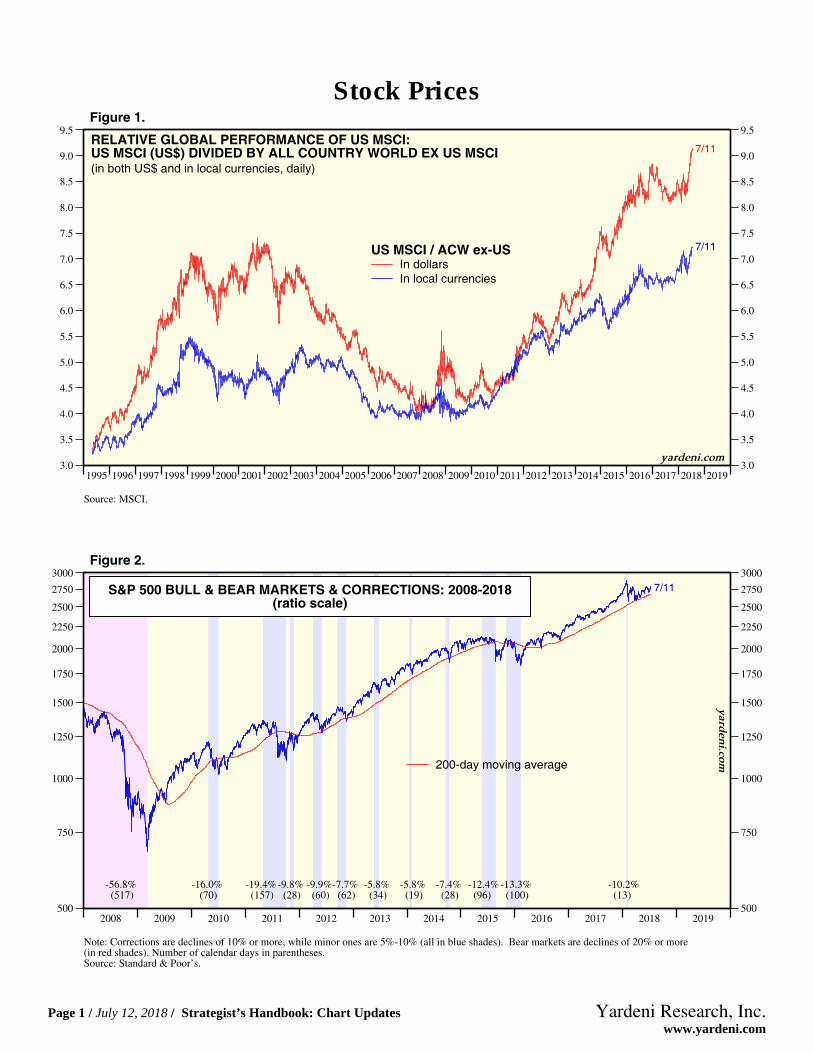
RELATIVE GLOBAL PERFORMANCE OF US MSCI:US MSCI (US$) DIVIDED BY ALL COUNTRY WORLD EX US MSCI(in both US$ and in local currencies, daily)
US MSCI / ACW ex-USIn dollarsIn local currencies
Source: MSCI.
yardeni.com
Figure 1.
2008 2009 2010 2011 2012 2013 2014 2015 2016 2017 2018 2019500
750
1000
1250
1500
1750
2000
2250
2500
2750
3000
500
750
1000
1250
1500
1750
2000
2250
2500
2750
3000
S&P 500 BULL & BEAR MARKETS & CORRECTIONS: 2008-2018(ratio scale)
7/11
200-day moving average
-56.8% (517)
-16.0% (70)
-19.4% (157)
-9.8% (28)
-9.9% (60)
-7.7% (62)
-5.8% (34)
-5.8% (19)
-7.4% (28)
-12.4% (96)
-13.3% (100)
-10.2% (13)
Note: Corrections are declines of 10% or more, while minor ones are 5%-10% (all in blue shades). Bear markets are declines of 20% or more(in red shades). Number of calendar days in parentheses.Source: Standard & Poor’s.
yarden
i.com
Figure 2.
Stock Prices
Page 1 / July 12, 2018 / Strategist’s Handbook: Chart Updates www.yardeni.com
Yardeni Research, Inc.

Figure 3.
2004 2005 2006 2007 2008 2009 2010 2011 2012 2013 2014 2015 2016 2017 2018 2019650
750
850
950
1050
1150
1250
1350
1450
650
750
850
950
1050
1150
1250
1350
1450
7/5
Q2
S&P 500 REVENUES PER SHARE: ACTUAL (S&P quarterly data) & FORWARD (TR weekly data)(dollars)
Revenues Per Share52-week Forward*
Actual (x4)
2004 2005 2006 2007 2008 2009 2010 2011 2012 2013 2014 2015 2016 2017 2018 20190
20
40
60
80
100
120
140
160
180
0
20
40
60
80
100
120
140
160
180
Q1
7/5
Q1
S&P 500 EARNINGS PER SHARE: FORWARD & ACTUAL OPERATING EARNINGS(dollars)
Earnings Per Share52-week Forward*Thomson Reuters Operating (x4)S&P Operating (x4)
2004 2005 2006 2007 2008 2009 2010 2011 2012 2013 2014 2015 2016 2017 2018 20190
2
4
6
8
10
12
14
0
2
4
6
8
10
12
14
7/5Q1
S&P 500 PROFIT MARGIN MEASURES(percent)
S&P 500 Operating Profit Margins
52-week Forward* (12.2)
Thomson Reuters (11.9)
S&P (11.4)
* Time-weighted average of consensus operating earnings estimates for current and next years. Source: Standard & Poor’s (for actual revenues) and Thomson Reuters I/B/E/S (for forward revenues), and Bureau of the Census.
yardeni.com
S&P 500 Earnings, Revenues, Margins
Page 2 / July 12, 2018 / Strategist’s Handbook: Chart Updates www.yardeni.com
Yardeni Research, Inc.

94 95 96 97 98 99 00 01 02 03 04 05 06 07 08 09 10 11 12 13 14 15 16 17 18 19 20-25
-20
-15
-10
-5
0
5
10
15
20
25
-25
-20
-15
-10
-5
0
5
10
15
20
25
May
S&P 500 AGGREGATE REVENUES & US BUSINESS SALES OF GOODS(yearly percent change)
S&P 500 Aggregate Revenues* (7.2)Business Sales of Goods** (8.4)
** Manufacturing and trade sales.* Revenues are derived by multiplying S&P 500 revenues per share by the S&P 500 divisor for each quarter.
Source: Census Bureau and Standard & Poor’s.
yardeni.com
Figure 4.
47 49 51 53 55 57 59 61 63 65 67 69 71 73 75 77 79 81 83 85 87 89 91 93 95 97 99 01 03 05 07 09 11 13 15 17 19 212
3
4
5
6
7
8
9
10
11
12
13
2
3
4
5
6
7
8
9
10
11
12
13
S&P 500 OPERATING PROFIT MARGIN (Thomson Reuters data)& AFTER-TAX CORPORATE PROFIT MARGIN
(without IVA & CCAdj)
Corporate Profits After Tax*(as a percent of nominal GDP)
(blue line)Q1
S&P 500 Operating Profit MarginUsing TR Earnings**
(percent, quarterly, nsa)(red line)
Q1
Note: Shaded areas denote recessions according to the National Bureau of Economic Research.
* After-tax profits as reported to IRS excluding Inventory Valuation Adjustment (IVA) and Capital Consumption Adjustment (CCAdj), which restate thehistorical cost basis used in profits tax accounting for inventory withdrawals and depreciation to the current cost measures used in GDP.
** Operating Proft Margin derived using revenues from S&P and earnings from Thomson Reuters I/B/E/S.
Source: Standard & Poor’s, Thomson Reuters I/B/E/S and Bureau of Economic Analysis.
yardeni.com
Figure 5.
S&P 500 Revenues & Margins
Page 3 / July 12, 2018 / Strategist’s Handbook: Chart Updates www.yardeni.com
Yardeni Research, Inc.

Figure 6.
2006 2007 2008 2009 2010 2011 2012 2013 2014 2015 2016 2017 2018 2019900
1000
1100
1200
1300
1400
1500
900
1000
1100
1200
1300
1400
1500
18
197/5
17
S&P 500 REVENUES PER SHARE(consensus analysts estimates in dollars, weekly, ratio scale)
Consensus ForecastsAnnual RevenuesForward Revenues*
2006 2007 2008 2009 2010 2011 2012 2013 2014 2015 2016 2017 2018 201950
75
100
125
150
175
200
50
75
100
125
150
175
200
7/5
17 1819
S&P 500 OPERATING EARNINGS PER SHARE(consensus analysts estimates in dollars, weekly, ratio scale)
Consensus ForecastsAnnual EarningsForward Earnings*
2006 2007 2008 2009 2010 2011 2012 2013 2014 2015 2016 2017 2018 20196
7
8
9
10
11
12
13
6
7
8
9
10
11
12
13
1819
7/517
yardeni.com
S&P 500 PROFIT MARGIN(using analysts average earnings and sales forecasts, percent)
Consensus Forecasts
Forward Margins* (12.2)Annual Margins
* Time-weighted average of the consensus estimates for current and next year. Source: Thomson Reuters I/B/E/S and Standard & Poor’s.
Forward Revenues, Earnings, & Margins
Page 4 / July 12, 2018 / Strategist’s Handbook: Chart Updates www.yardeni.com
Yardeni Research, Inc.

1999 2000 2001 2002 2003 2004 2005 2006 2007 2008 2009 2010 2011 2012 2013 2014 2015 2016 2017 2018 201910
35
60
85
110
135
160
185
10
35
60
85
110
135
160
1857/5S&P 500/400/600 FORWARD EARNINGS
(dollars per share, ratio scale)
Forward Earnings*S&P 500 LargeCap (169.43)S&P 400 MidCap (119.67)S&P 600 SmallCap (59.10)
* Time-weighted average of consensus estimates for current year and next year.Source: Thomson Reuters I/B/E/S.
yardeni.com
Figure 7.
2006 2007 2008 2009 2010 2011 2012 2013 2014 2015 2016 2017 2018 20193
4
5
6
7
8
9
10
11
12
13
3
4
5
6
7
8
9
10
11
12
13
7/5
yardeni.com
S&P FORWARD PROFIT MARGINS*(using analysts average earnings and sales forecasts, percent)
Forward Profit Margins*S&P 500 (12.2)S&P 400 (7.7)S&P 600 (5.5)
* Time-weighted average of the consensus estimates for current and next year using forward earnings divided by forward revenues.Source: Thomson Reuters I/B/E/S and Standard & Poor’s.
Figure 8.
S&P 500/400/600 Forward Earnings & Margins
Page 5 / July 12, 2018 / Strategist’s Handbook: Chart Updates www.yardeni.com
Yardeni Research, Inc.

2007 2008 2009 2010 2011 2012 2013 2014 2015 2016 2017 2018 2019600
800
1000
1200
1400
1600
1800
2000
2200
2400
2600
2800
3000
3200
3400
600
800
1000
1200
1400
1600
1800
2000
2200
2400
2600
2800
3000
3200
3400
x10
x11
x12
x13
x14
x15
x16
x17
x18
x19S&P 500, FORWARD EARNINGS, and VALUATION(weekly)
Actual 07/11/18Implied* 07/05/18
* Implied price index calculated using forward earnings times forward P/Es. Weekly data start January 2007.
Blue Angels: S&P 500
Source: Standard & Poor’s and Thomson Reuters I/B/E/S.
yardeni.com
Figure 9.
2007 2008 2009 2010 2011 2012 2013 2014 2015 2016 2017 2018 2019100
150
200
250
300
350
400
450
500
100
150
200
250
300
350
400
450
500
x8
x10
x12
x14
x16
ALL COUNTRY WORLD EX-US MSCI, FORWARD EARNINGS, & VALUATIONAll Country World Ex-US MSCI Index (In local currencies)07/11/18Blue Angels Implied Price Index*07/06/18
* Implied price index calculated using forward earnings times forward P/Es. Monthly through December 2005, weekly thereafter.Source: MSCI and Thomson Reuters I/B/E/S.
yardeni.com
Figure 10.
Blue Angels
Page 6 / July 12, 2018 / Strategist’s Handbook: Chart Updates www.yardeni.com
Yardeni Research, Inc.

1999 2000 2001 2002 2003 2004 2005 2006 2007 2008 2009 2010 2011 2012 2013 2014 2015 2016 2017 2018 20196
8
10
12
14
16
18
20
22
24
26
28
6
8
10
12
14
16
18
20
22
24
26
28
7/11
FORWARD P/E RATIOS FOR S&P STOCK PRICE INDEXES*(daily)
S&P 500 LargeCap (16.4)S&P 400 MidCap (16.6)S&P 600 SmallCap (17.7)
* Daily stock price index divided by 52-week forward consensus expected operating earnings per share.Source: Thomson Reuters I/B/E/S and Standard & Poor’s.
yardeni.com
Figure 11.
2006 2007 2008 2009 2010 2011 2012 2013 2014 2015 2016 2017 2018 20195
10
15
20
25
5
10
15
20
25
7/5
MSCI FORWARD P/E(weekly)
Forward P/E*
EMU (13.2)Emerging Markets (11.1)
US (16.3)
Japan (12.5)UK (13.1)
Capped at 20
yardeni.com
* Price divided by 12-month forward consensus expected operating earnings per share.Source: Thomson Reuters I/B/E/S.
Figure 12.
Valuation
Page 7 / July 12, 2018 / Strategist’s Handbook: Chart Updates www.yardeni.com
Yardeni Research, Inc.

89 90 91 92 93 94 95 96 97 98 99 00 01 02 03 04 05 06 07 08 09 10 11 12 13 14 15 16 17 18 19 208
12
16
20
24
28
32
8
12
16
20
24
28
32
Q1
May
S&P 500 P/E RATIOSS&P 500 P/Es
Trailing (using operating earnings)* (20.7)Forward** (16.5)
* Using quarterly average of daily data for S&P 500 price index, and 4-quarter trailing operating earnings.** S&P 500 stock price index divided by S&P 500 12-month forward consensus expected operating earnings.
Source: Thomson Reuters I/B/E/S and Standard & Poor’s.
yardeni.com
Figure 13.
52 54 56 58 60 62 64 66 68 70 72 74 76 78 80 82 84 86 88 90 92 94 96 98 00 02 04 06 08 10 12 14 16 18 20 22-3
0
3
6
9
12
-3
0
3
6
9
12
S&P 500 REPORTED EARNINGS YIELD* MINUS CPI INFLATION RATE**
Q1
Latest (2.6)Average 3.3
* S&P 500 reported earnings as a percent of quarterly average S&P 500 index. Q4-2008 dropped because of negative value.** Year-over-year percent change in three-month average of each quarter.
Note: Shaded red areas denote S&P 500 bear market declines of 20% or more. Yellow areas show bull markets.Source: Standard & Poor’s and Bureau of Labor Statistics.
yardeni.com
Figure 14.
Valuation
Page 8 / July 12, 2018 / Strategist’s Handbook: Chart Updates www.yardeni.com
Yardeni Research, Inc.

Figure 15.
06 07 08 09 10 11 12 13 14 15 16 17 18 198
10
12
14
16
18
20
7/5
S&P 500(forward P/E) P/E (16.1)
06 07 08 09 10 11 12 13 14 15 16 17 18 198
11
14
17
20
23
7/5
INDUSTRIALS(15.5)
06 07 08 09 10 11 12 13 14 15 16 17 18 1910
15
20
25
30
7/5
CONSUMER DISCRETIONARY
(20.3)
06 07 08 09 10 11 12 13 14 15 16 17 18 198
12
16
20
24
7/5
INFORMATION TECHNOLOGY(17.9)
06 07 08 09 10 11 12 13 14 15 16 17 18 1910
12
14
16
18
20
22
7/5
CONSUMER STAPLES(16.9)
06 07 08 09 10 11 12 13 14 15 16 17 18 195
10
15
20
25
7/5
MATERIALS(15.1)
06 07 08 09 10 11 12 13 14 15 16 17 18 195
15
25
35
45
55
65
7/5
ENERGY(17.2)
06 07 08 09 10 11 12 13 14 15 16 17 18 1915
25
35
45
55
65
75
7/5
REAL ESTATE(38.6)
06 07 08 09 10 11 12 13 14 15 16 17 18 196
8
10
12
14
16
18
20
7/5
FINANCIALS
Includes Real Estatethrough September 2016
(12.0)
06 07 08 09 10 11 12 13 14 15 16 17 18 198
10
12
14
16
18
20
22
7/5
TELECOMMUNICATION SERVICES(10.3)
06 07 08 09 10 11 12 13 14 15 16 17 18 198
10
12
14
16
18
20
7/5
HEALTH CARE
Source: Thomson Reuters I/B/E/S and Standard & Poor’s.
(15.0)
06 07 08 09 10 11 12 13 14 15 16 17 18 198
10
12
14
16
18
20
7/5
yardeni.com
UTILITIES(16.5)
S&P 500 Sectors Forward P/Es
Page 9 / July 12, 2018 / Strategist’s Handbook: Chart Updates www.yardeni.com
Yardeni Research, Inc.

Figure 16.
2015 2016 2017 2018500550600650700750800850900950
CONSUMER DISCRETIONARY 7/11
S&P 500 sectorprice indexes
2015 2016 2017 2018400
500
600
700
800
INDUSTRIALS
7/11
2015 2016 2017 2018450
500
550
600
650
CONSUMER STAPLES
7/11
2015 2016 2017 2018600
800
1000
1200
1400
INFORMATION TECHNOLOGY 7/11
2015 2016 2017 2018350
425
500
575
650
725
ENERGY
7/11
2015 2016 2017 2018200
250
300
350
400
450
MATERIALS
7/11
2015 2016 2017 2018250
300
350
400
450
500
550
600
FINANCIALS
7/11
2015 2016 2017 2018125
150
175
200
225
TELECOMMUNICATION SERVICES
7/11
2015 2016 2017 2018700750800850900950
1000105011001150
HEALTH CARE
7/11
Source: Standard & Poor’s and Haver Analytics.
2015 2016 2017 2018200
225
250
275
300
UTILITIES
7/11
yardeni.com
S&P 500 Sectors Price Indexes
Page 10 / July 12, 2018 / Strategist’s Handbook: Chart Updates www.yardeni.com
Yardeni Research, Inc.

Figure 17.
06 07 08 09 10 11 12 13 14 15 16 17 18 1960
90
120
150
180210
18 19 7/5S&P 500(forward earnings*)
Annual consensusestimatesForward earnings
06 07 08 09 10 11 12 13 14 15 16 17 18 1913
19
25
31
3743
1819 7/5INDUSTRIALS
06 07 08 09 10 11 12 13 14 15 16 17 18 195
17
29
4153
18 19 7/5CONSUMER DISCRETIONARY
06 07 08 09 10 11 12 13 14 15 16 17 18 1915
30
45
60
75
1819
7/5INFORMATION TECHNOLOGY
06 07 08 09 10 11 12 13 14 15 16 17 18 1913
19
25
31
37
18 19 7/5CONSUMER STAPLES
06 07 08 09 10 11 12 13 14 15 16 17 18 196
12
18
24
30
18 197/5MATERIALS
06 07 08 09 10 11 12 13 14 15 16 17 18 198
28
48
6888
108
18 197/5
ENERGY
06 07 08 09 10 11 12 13 14 15 16 17 18 191
3
5
79
19 7/517 18REAL ESTATE
06 07 08 09 10 11 12 13 14 15 16 17 18 198
20
32
4456
1819 7/5
FINANCIALS
Includes Real Estatethrough September 2016
06 07 08 09 10 11 12 13 14 15 16 17 18 197
9
11
13
15
17
1819
7/5TELECOMMUNICATIONS SERVICES
06 07 08 09 10 11 12 13 14 15 16 17 18 1920
35
50
65
80
18 19 7/5HEALTH CARE
* Time-weighted average (in blue) of consensus operating earnings estimates for current and next year (in red). Source: Thomson Reuters I/B/E/S.
06 07 08 09 10 11 12 13 14 15 16 17 18 1911
12
13
14
15
161718
1819 7/5
UTILITIES
yardeni.com
S&P 500 Sectors Forward Earnings
Page 11 / July 12, 2018 / Strategist’s Handbook: Chart Updates www.yardeni.com
Yardeni Research, Inc.

0
600
1200
1800
2400
3000
3600
0
600
1200
1800
2400
3000
3600
Q2
Q1
Jun
Q2
Q1
1999 2000 2001 2002 2003 2004 2005 2006 2007 2008 2009 2010 2011 2012 2013 2014 2015 2016 2017 2018 2019 20203
4
5
6
7
8
9
10
11
12
13
3
4
5
6
7
8
9
10
11
12
13
7/6
7/6
S&P 500 DIVIDENDS & BUYBACKS(billion dollars, annualized)
Buybacks
Dividends
S&P 500 Index
S&P 500 FORWARD EARNINGS YIELD & CORPORATE BOND YIELD(percent)
Investment GradeCorporate Bond Yield** (4.1)
S&P 500 Forward Earnings Yield* (6.1)
* Forward earnings (time-weighted average of consensus operating earnings estimates for current and next year) divided by S&P 500 index.** BoA Merrill Lynch data for AA-AAA yields.
Source: Thomson Reuters I/B/E/S, Federal Reserve Board, and Standard & Poor’s.
yardeni.com
Figure 18.
2003 2004 2005 2006 2007 2008 2009 2010 2011 2012 2013 2014 2015 2016 2017 2018 20190
50
100
150
200
250
300
350
400
0
50
100
150
200
250
300
350
400
May
EQUITY ETFs*(yearly net inflows, billion dollars)
* Net share issuance by equity ETFs.Source: Investment Company Institute.
yard
eni.
com
Figure 19.
Equity Flows
Page 12 / July 12, 2018 / Strategist’s Handbook: Chart Updates www.yardeni.com
Yardeni Research, Inc.

94 95 96 97 98 99 00 01 02 03 04 05 06 07 08 09 10 11 12 13 14 15 16 17 18 19 2080
90
100
110
120
130
100
200
300
400
500
600
700
800
900
1000
7/11
7/11
S&P GOLDMAN SACHS COMMODITY INDEX & TRADE-WEIGHTED DOLLAR(daily)
Goldman SachsCommodity Index(nearby futures price)
JP Morgan NominalBroad EffectiveExchange Rate*
Source: Standard & Poor’s, JP Morgan, and Haver Analytics.
yardeni.com
Figure 20.
2005 2006 2007 2008 2009 2010 2011 2012 2013 2014 2015 2016 2017 2018 2019 202020
30
40
50
60
70
80
90
100
110
120
130
140
150
160
130
125
120
115
110
105
100
95
90
85
7/11
7/11
BRENT CRUDE OIL PRICE & TRADE-WEIGHTED DOLLAR
JP Morgan NominalBroad Effective Exchange Rate**(inverted scale)
Brent Crude Oil Futures Price*(dollars per barrel)
* Nearby futures price.** Argentina, Australia, Brazil, Bulgaria, Canada, Chile, China, Colombia, Croatia, Czech Republic, Denmark, Ecuador, Egypt, France, Germany, Hong Kong,
Hungary, Japan, India, Indonesia, Israel, Italy, Korea, Kuwait, Malaysia, Mexico, Morocco, New Zealand, Nigeria, Norway, Pakistan, Panama, Peru,Philippines, Poland, Romania, Russia Saudi Arabia, Singapore, South Africa, Spain, Sweden, Switzerland, Taiwan, Thailand, Turkey, United Kingdom,Ukraine, Uruguay, Venezuela, Vietnam, and United States. Source: JP Morgan and Haver Analytics.
yardeni.com
Figure 21.
Dollar & Commodities
Page 13 / July 12, 2018 / Strategist’s Handbook: Chart Updates www.yardeni.com
Yardeni Research, Inc.

2000 2001 2002 2003 2004 2005 2006 2007 2008 2009 2010 2011 2012 2013 2014 2015 2016 2017 2018 2019600
800
1000
1200
1400
1600
1800
2000
2200
2400
2600
2800
3000
80
90
100
110
120
130
140
150
160
170
180
190
200
210
6/30
S&P 500 INDEX & YRI WEEKLY LEADING INDEX
S&P 500 Index
YRI Weekly Leading Index*
* Average of Consumer Comfort Index (which is a four-week average) and the four-week average of Boom-Bust Barometer, which is CRB raw industrialsspot price index (weekly average) divided by weekly initial unemployment claims.Source: Bloomberg, Commodity Research Bureau, Bureau of Labor Statistics, and Standard & Poor’s.
yardeni.com
Figure 22.
95 96 97 98 99 00 01 02 03 04 05 06 07 08 09 10 11 12 13 14 15 16 17 18 19 200
500
1000
1500
200
300
400
500
600
700
7/11
7/11
EMERGING MARKETS MSCI STOCK PRICE INDEX (in dollars)& INDUSTRIALS COMMODITY PRICE INDEX(daily)
Emerging MarketsMSCI Stock Price Index(in dollars)
CRB Raw IndustrialsSpot Price Index*
* Includes copper scrap, lead scrap, steel scrap, tin, zinc, burlap, cotton, print cloth, wool tops, hides, rosin, rubber, and tallow.Source: MSCI and Commodity Research Bureau.
yardeni.com
Figure 23.
Stocks & Commodities
Page 14 / July 12, 2018 / Strategist’s Handbook: Chart Updates www.yardeni.com
Yardeni Research, Inc.

1800 1810 1820 1830 1840 1850 1860 1870 1880 1890 1900 1910 1920 1930 1940 195020
40
60
80
100
20
40
60
80
100CONSUMER PRICE INDEX*: 1800-1947
War of 1812(1812-1815)
Civil War(1861-1865)
World War I(1914-1918)
World War II(1939-1945)
* Annual data. Base index from 1800 to 1947 is 1967 = 100.** 1982-84=100.
Source: Census Bureau, Historical Statistics of the United States
yardeni.com
1948 1958 1968 1978 1988 1998 2008 2018 20280
50
100
150
200
250
300
0
50
100
150
200
250
300
MayCPI**Cold War(1947-1989)
Figure 24.
60 62 64 66 68 70 72 74 76 78 80 82 84 86 88 90 92 94 96 98 00 02 04 06 08 10 12 14 16 18 20 220
1
2
3
4
5
6
7
8
9
10
11
34
36
38
40
42
44
46
48
50
52
May
AGE WAVE & INFLATION
Inflation Trend**
Age Wave*
Source: Bureau of Labor Statistics.** Five-year moving average of yearly percent change in CPI.* Percent of labor force 16-34 years old.
yardeni.com
Figure 25.
Big Picture
Page 15 / July 12, 2018 / Strategist’s Handbook: Chart Updates www.yardeni.com
Yardeni Research, Inc.
2007 2008 2009 2010 2011 2012 2013 2014 2015 2016 2017 2018 20194.0
4.5
5.0
5.5
6.0
6.5
7.0
7.5
4.0
4.5
5.0
5.5
6.0
6.5
7.0
7.5
Jun
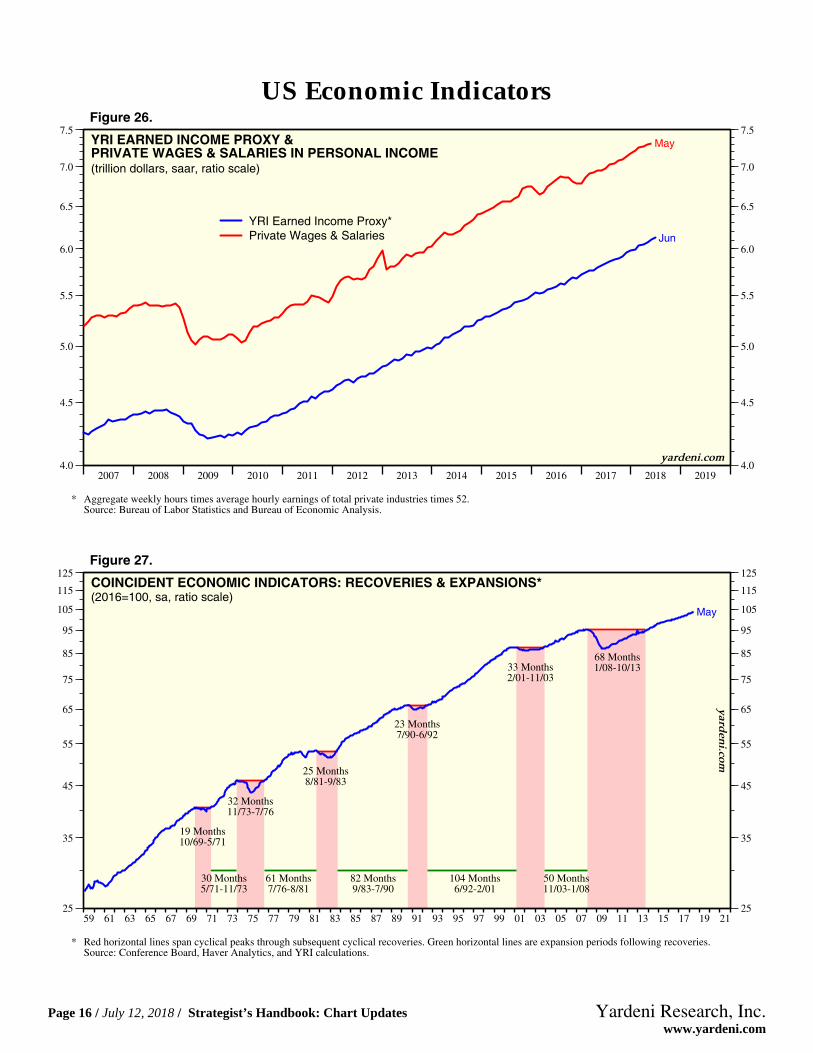
MayYRI EARNED INCOME PROXY &PRIVATE WAGES & SALARIES IN PERSONAL INCOME(trillion dollars, saar, ratio scale)
YRI Earned Income Proxy*Private Wages & Salaries
* Aggregate weekly hours times average hourly earnings of total private industries times 52.Source: Bureau of Labor Statistics and Bureau of Economic Analysis.
yardeni.com
Figure 26.
59 61 63 65 67 69 71 73 75 77 79 81 83 85 87 89 91 93 95 97 99 01 03 05 07 09 11 13 15 17 19 2125
35
45
55
65
75
85
95
105
115
125
25
35
45
55
65
75
85
95
105
115
125
68 Months1/08-10/1333 Months
2/01-11/03
23 Months7/90-6/92
25 Months8/81-9/83
32 Months11/73-7/76
19 Months10/69-5/71
30 Months5/71-11/73
61 Months7/76-8/81
82 Months9/83-7/90
104 Months6/92-2/01
50 Months11/03-1/08
May
COINCIDENT ECONOMIC INDICATORS: RECOVERIES & EXPANSIONS*(2016=100, sa, ratio scale)
* Red horizontal lines span cyclical peaks through subsequent cyclical recoveries. Green horizontal lines are expansion periods following recoveries.Source: Conference Board, Haver Analytics, and YRI calculations.
yarden
i.com
Figure 27.
US Economic Indicators
Page 16 / July 12, 2018 / Strategist’s Handbook: Chart Updates www.yardeni.com
Yardeni Research, Inc.

68 70 72 74 76 78 80 82 84 86 88 90 92 94 96 98 00 02 04 06 08 10 12 14 16 18 2040
60
80
100
120
140
40
60
80
100
120
140
2016
2017
REAL CONSUMER INCOME & SPENDING PER HOUSEHOLD*(thousand 2009 dollars, saar)
Real Income & Spending per Household*Personal Income (122.3)Personal Consumption Expenditures (99.7)Disposable Personal Income (107.0)Money Income** (75.0)
* All series deflated using Personal Consumption Expenditures Deflator.** Mean household income.
Source: Bureau of Economic Analysis, Bureau of the Census and Current Population Reports.
yardeni.com
Figure 28.
48 50 52 54 56 58 60 62 64 66 68 70 72 74 76 78 80 82 84 86 88 90 92 94 96 98 00 02 04 06 08 10 12 14 16 18 20 2210
20
30
40
50
60
70
8090100110120130140150
10
20
30
40
50
60
70
8090
100110120130140150
CMANUFACTURING PRODUCTION & CAPACITY
(2012=100, ratio scale)May
May
ManufacturingProductionCapacity
yardeni.com
Note: C = China joined WTO on December 11, 2001. Shaded areas denote recessions according to the National Bureau of Economic Research.Source: Federal Reserve Board.
Figure 29.
US Economic Indicators
Page 17 / July 12, 2018 / Strategist’s Handbook: Chart Updates www.yardeni.com
Yardeni Research, Inc.

98 99 00 01 02 03 04 05 06 07 08 09 10 11 12 13 14 15 16 17 18 19 20-10
-5
0
5
10
15
20
25
-10
-5
0
5
10
15
20
25
May
Jun
CHINA: INDUSTRIAL PRODUCTION & PRODUCER PRICE INDEX(yearly percent change)
Industrial Production* (6.8)PPI: TotalIndustrial Products (4.7)
* Value added basis.Source: IMF International Financial Statistics and China National Bureau of Statistics.
yardeni.com
Figure 30.
2000 2001 2002 2003 2004 2005 2006 2007 2008 2009 2010 2011 2012 2013 2014 2015 2016 2017 2018 20190
5
10
15
20
25
30
0
5
10
15
20
25
30
May
May
May
BANK LOANS & MONEY SUPPLY(trillion US dollars)
China: Bank Loans (nsa) (20.0)US: Bank Loans (sa) (9.3)China: M2 (27.3)
Source: Federal Reserve Board and People’s Bank of China.
yardeni.com
Figure 31.
China
Page 18 / July 12, 2018 / Strategist’s Handbook: Chart Updates www.yardeni.com
Yardeni Research, Inc.

2006 2007 2008 2009 2010 2011 2012 2013 2014 2015 2016 2017 2018 2019 202050
60
70
80
90
100
110
120
130
50
60
70
80
90
100
110
120
130EUROZONE: INDUSTRIAL PRODUCTIONEXCLUDING CONSTRUCTION(January 2006=100)
Germany (May=119.0)France (May=93.0)Italy (May=87.6)Spain (May=81.8)
Eurozone (Apr=103.9)
Source: Haver Analytics.
yardeni.com
Figure 32.
2000 2001 2002 2003 2004 2005 2006 2007 2008 2009 2010 2011 2012 2013 2014 2015 2016 2017 2018 2019-8
-6
-4
-2
0
2
4
6
60
70
80
90
100
110
120
130
Jun
EUROZONE: ECONOMIC SENTIMENT INDICATOR* & REAL GDP
Real GDP(yearly percent change) (2.5)
Economic Sentiment Indicator*(long-term average=100, sa) (112.3)
* The overall economic sentiment indicator (ESI) is derived from the industrial (weight 40%), service (30%), consumer (20%), construction (5%), andretail trade (5%) confidence indicators.Source: Statistical Office of the European Communities, European Commission, and Haver Analytics.
yardeni.com
Figure 33.
Eurozone
Page 19 / July 12, 2018 / Strategist’s Handbook: Chart Updates www.yardeni.com
Yardeni Research, Inc.

95 96 97 98 99 00 01 02 03 04 05 06 07 08 09 10 11 12 13 14 15 16 17 18 19 2022
20
18
16
14
12
10
8
6
4
2
0
-2
-4
-6
-8
-10
-12
-14
-16
-18
-20
-22
-2
-1
0
1
2
May
7/6
IMPLIED WORLD EX-US CAPITAL FLOWS & TRADE-WEIGHTED DOLLAR
JP Morgan NominalBroad EffectiveExchange Rate(inverted scale,yearly percent change)
Implied World Ex-USCapital Flows*(trillion dollars)
* 12-month change in non-gold international reserves minus 12-month sum of the merchandise trade surplus (deficit). US trade deficit multiplied by -1.0.Source: International Monetary Fund and JP Morgan.
yardeni.com
Figure 34.
2008 2009 2010 2011 2012 2013 2014 2015 2016 2017 2018 2019 20203
4
5
6
7
8
9
10
11
12
13
14
15
16
600
800
1000
1200
1400
1600
1800
2000
2200
2400
2600
2800
3000
QE1 QE2 QE3
S&P 500 INDEX & QE7/11
S&P 500 Index
Total ofFed, ECB, BOJ
Note: QE1 (11/25/08) = Fed starts buying $1.24tn in mortgage securities. QE1 expanded (3/16/2009) = Fed starts buying $300bn in Treasuries.QE2 (11/3/10) = Fed starts buying $600bn in Treasuries. QE3 (9/13/12) = Fed starts buying $40bn/month in mortgage securities (open ended).QE3 expanded (12/12/12) = Fed starts buying $45bn/month in Treasuries.Source: Federal Reserve Board, Standard & Poor’s and Haver Analytics.
yardeni.com
Figure 35.
Global
Page 20 / July 12, 2018 / Strategist’s Handbook: Chart Updates www.yardeni.com
Yardeni Research, Inc.

http://blog.yardeni.com
http://blog.yardeni.com
Copyright (c) Yardeni Research, Inc. 2018. All rights reserved. The informationcontained herein has been obtained from sources believed to be reliable, but is notnecessarily complete and its accuracy cannot be guaranteed. No representation orwarranty, express or implied, is made as to the fairness, accuracy, completeness, orcorrectness of the information and opinions contained herein. The views and the otherinformation provided are subject to change without notice. All reports posted onwww.yardeni.com, blog.yardeni.com, and YRI’s Apps for iPads and iPhones are issuedwithout regard to the specific investment objectives, financial situation, or particular needsof any specific recipient and are not to be construed as a solicitation or an offer to buy or sellany securities or related financial instruments. Past performance is not necessarily a guideto future results. Company fundamentals and earnings may be mentioned occasionally, butshould not be construed as a recommendation to buy, sell, or hold the company’s stock.Predictions, forecasts, and estimates for any and all markets should not be construed asrecommendations to buy, sell, or hold any security--including mutual funds, futurescontracts, and exchange traded funds, or any similar instruments.
The text, images, and other materials contained or displayed on any Yardeni Research, Inc.product, service, report, email or website are proprietary to Yardeni Research, Inc. andconstitute valuable intellectual property. No material from any part of www.yardeni.com, blog.yardeni.com, and YRI’s Apps for iPads and iPhones may be downloaded, transmitted,broadcast, transferred, assigned, reproduced or in any other way used or otherwisedisseminated in any form to any person or entity, without the explicit written consent ofYardeni Research, Inc. All unauthorized reproduction or other use of material from YardeniResearch, Inc. shall be deemed willful infringement(s) of this copyright and other proprietaryand intellectual property rights, including but not limited to, rights of privacy. YardeniResearch, Inc. expressly reserves all rights in connection with its intellectual property,including without limitation the right to block the transfer of its products and services and/orto track usage thereof, through electronic tracking technology, and all other lawful means,now known or hereafter devised. Yardeni Research, Inc. reserves the right, without furthernotice, to pursue to the fullest extent allowed by the law any and all criminal and civilremedies for the violation of its rights.
The recipient should check any email and any attachments for the presence of viruses.Yardeni Research, Inc. accepts no liability for any damage caused by any virus transmittedby this company’s emails, website, blog and Apps. Additional information available onrequest.