Embed Size (px)
Citation preview

Strategies to IncreaseCollege and Career Success for
Community College Students
Illinois Board of Higher EducationAugust 10, 2010
Chicago, IL
Davis JenkinsCommunity College Research Center
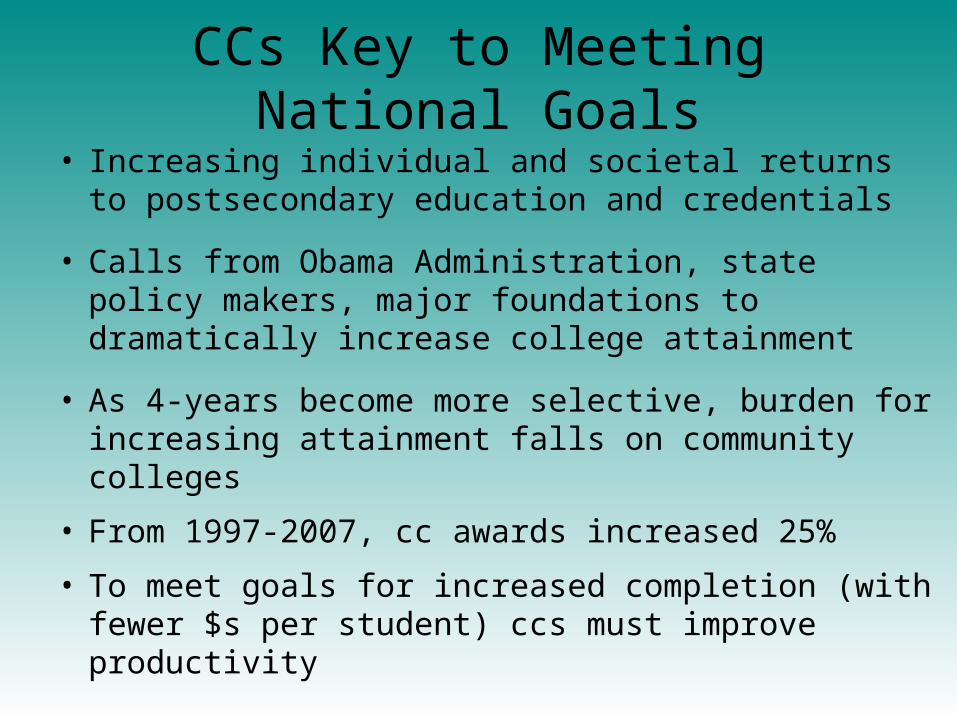
CCs Key to Meeting National Goals
• Increasing individual and societal returns to postsecondary education and credentials
• Calls from Obama Administration, state policy makers, major foundations to dramatically increase college attainment
• As 4-years become more selective, burden for increasing attainment falls on community colleges
• From 1997-2007, cc awards increased 25%
• To meet goals for increased completion (with fewer $s per student) ccs must improve productivity

CC Student Achievement Gaps
Source: BPS (96/01).
6-Year Highest Educational Attainment of Students who Started at a Community College by Household Income
4%
14%10%
23%18%
31%
12% 13%9%
12%8%
47%
0%5%
10%15%20%25%30%35%40%45%50%
Certificate AssociateDegree
Still Enrolled(No Degree)
Transfer(No Degree)
Bachelor'sDegree
Not Enrolled(No Degree)
Highest quartile
Lowest quartile

CC Student Achievement Gaps
Source: BPS (96/01).
6-Year Highest Educational Attainment of Students who Started at a Community College by Age at First Enrollment
8%
17%
9%14% 13%
39%
17%11%
6% 4% 2%
60%
0%
10%
20%
30%
40%
50%
60%
70%
Certificate AssociateDegree
Still Enrolled(No Degree)
Transfer (NoDegree)
Bachelor'sDegree
Not Enrolled(No Degree)
17-24
25-64

Semi-Skilled Jobs
Skilled Technicians
Managers/Technical
Professionals
Entry-LevelTechnicians
UnskilledLaborer Jobs
Entry-Level SkilledJobs
Disconnected Pathways to College and Career Success
WorkplaceLiteracyTraining
H.S./Adult VocSkills Training
Career-longLearning /
ProfessionalDevelopment
College Remedial /
Developmental
A.A. A.S.
B.A. B.S.
Advanced Certificate
Graduate /Professional Education
A.A.S
Key
= Weak connection between education levels
= Strong connection between education levels
= strong job connection to jobs
Community College Programs
High SchoolAcademicPrograms
ABE, GED, ESL

Questions for Local Stakeholders
1) What occupations in our region offer family-supporting jobs?
2) What is the demand for these jobs and how do workers get into and advance in them?
3) How effective are our education and workforce systems in preparing individuals to enter and advance in these fields?
4) What changes are needed to strengthen pathways to careers for individuals and the supply of qualified workers for employers?
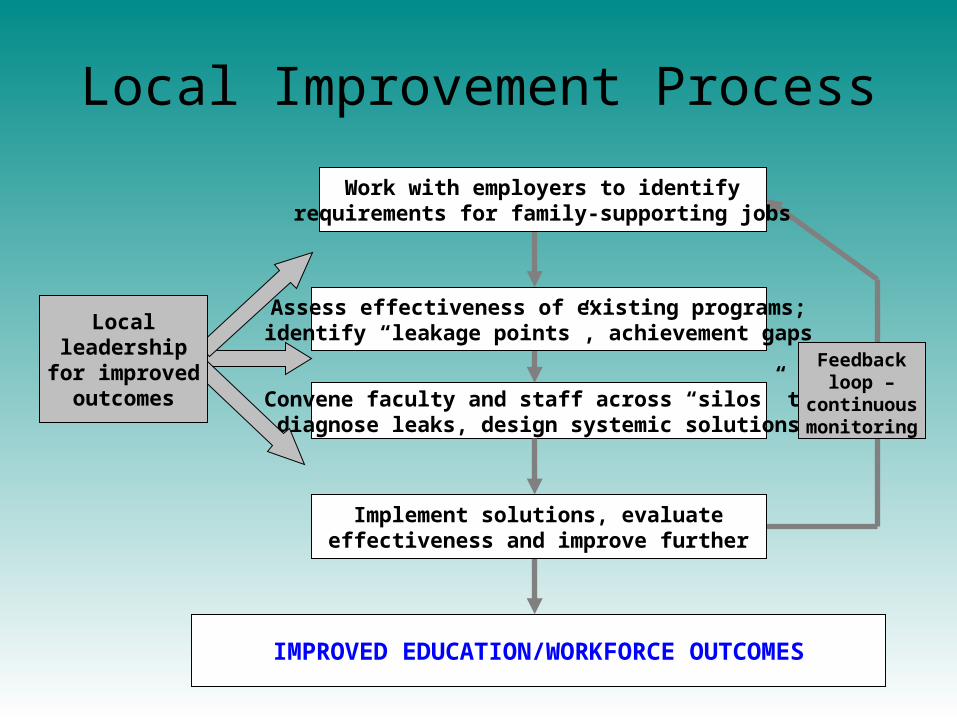
IMPROVED EDUCATION/WORKFORCE OUTCOMES
Work with employers to identifyrequirements for family-supporting jobs
Convene faculty and staff across “silos” todiagnose leaks, design systemic solutions
Localleadership
for improvedoutcomes
Implement solutions, evaluateeffectiveness and improve further
Assess effectiveness of existing programs;identify “leakage points”, achievement gaps
Feedbackloop –
continuousmonitoring
Local Improvement Process

Demand-Supply Gap Analysis
Source: EMSI, based on IPEDS data from 2007 and state regional employment projections.
SOC Code Description
2009-2014 Avg Annual
Opening
2009 Median Hourly
Earnings
2007 Completers Community
College
2007 Completers
- Region 43-3031
Bookkeeping, accounting, and auditing clerks 317 $14.49 0 11
43-4051
Customer service representatives 553 $13.28 0 0
43-5071
Shipping, receiving, and traffic clerks 113 $12.68 12 12
29-2012
Medical and clinical laboratory technicians 19 $19.47 5 13
29-2034
Radiologic technologists and technicians 39 $27.29 34 34
29-2041
Emergency medical technicians and paramedics 52 $14.43 0 0
29-2061
Licensed practical and licensed vocational nurses 119 $21.38 62 133

Community College Student Milestones
• Took and passed college-level courses (for students starting in adult basic skills or remedial)
• Earned 12 college credits and still enrolled
• Completed college-level math and English
• Persisted term to term and year to year
• Earned 30 credits and still enrolled
• Earned occupational certificate
• Earned associate degree
• Transferred to a baccalaureate program

Community College Student Milestones5-Year Gatekeeper Course Attempt and Completion Rates
College-Ready Students vs Those Referred to Developmental
45%
37%
60%
52%
30%
24%
67%
55%
0%
10%
20%
30%
40%
50%
60%
70%
80%
Attempted "gatekeeper"math course
Completed "gatekeeper"math course
Attempted "gatekeeper"English
Completed "gatekeeper"English course
College-ReadyDevelopmental
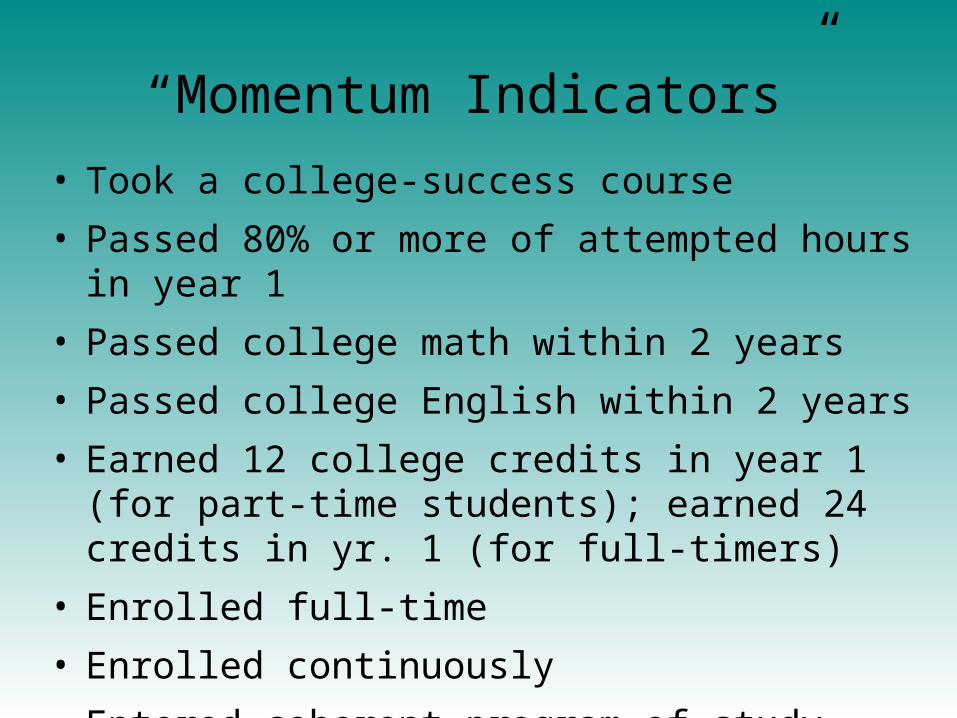
“Momentum Indicators”
• Took a college-success course
• Passed 80% or more of attempted hours in year 1
• Passed college math within 2 years
• Passed college English within 2 years
• Earned 12 college credits in year 1 (for part-time students); earned 24 credits in yr. 1 (for full-timers)
• Enrolled full-time
• Enrolled continuously
• Entered coherent program of study

“Momentum Indicators”
5-Year Success Rates for College-Ready Students
69%
78%
68%
19%
29% 27%
0%
10%
20%
30%
40%
50%
60%
70%
80%
90%
Earned 12 or more credits inyear 1 (p-t students)
Passed college math within 2years
Passed college Englishwithin 2 years
Yes
No

“Momentum Indicators”5-Year Success Rates for
Students Referred to Remediation
59%
72%
56%
17% 18%12%
0%
10%
20%
30%
40%
50%
60%
70%
80%
Earned 12 or more credits inyear 1 (p-t students)
Passed college math within 2years
Passed college Englishwithin 2 years
Yes
No

Promising Practices• College readiness protocols (El Paso CC)• Bridge programs to connect adult basic skills
students to college (WA I-BEST)• Required college success courses (VA ccs)• Risk factor early alert systems (Purdue Signals,
Queensborough CC CUNY)• Accelerated dev ed (Baltimore County, Denver)• Accelerated programs (CUNY – Accelerated Study
in Associate Programs)• Aligned learning outcomes (Hillsborough CC, FL)• University centers (Macomb CC, MI) and applied
baccalaureates (WA ctcs)

Questions for State Policy Makers
1) What is the demand for family-supporting jobs by occupation, level of education and region?
2) How many credentials are awarded annually in demand fields by institution, credential type? Are these sufficient to meet the demand?
3) How many students are enrolled in programs that lead to demand jobs by institution, what are their demographics, where do they come from, and what is their likelihood of completion?
4) How can access to and completion of programs leading to career-path jobs be improved?
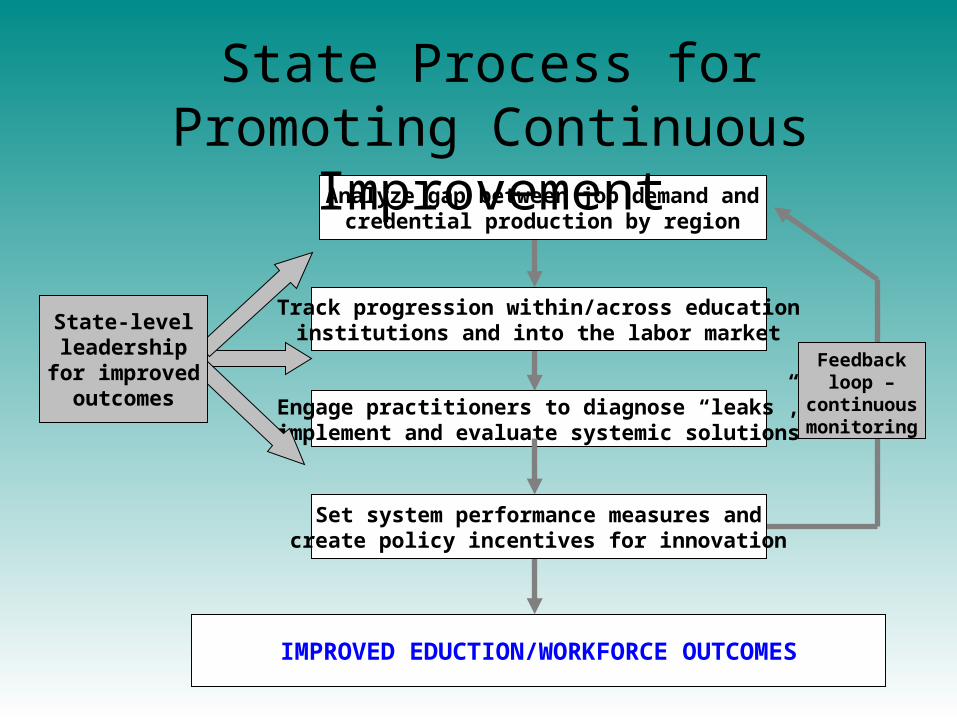
IMPROVED EDUCTION/WORKFORCE OUTCOMES
Analyze gap between job demand andcredential production by region
Engage practitioners to diagnose “leaks”,implement and evaluate systemic solutions
State-levelleadership
for improvedoutcomes
Set system performance measures andcreate policy incentives for innovation
Track progression within/across educationinstitutions and into the labor market
Feedbackloop –
continuousmonitoring
State Process forPromoting Continuous Improvement

WA Student Achievement Initiative• Performance funding for WA 2-year colleges based
on student achievement of key points across mission areas:– Remediation (basic skills gains, passing precollege writing or math)– First-year retention (earning 15 then 30 college level credits)– College-level math (passing math courses required for either
technical or academic associate degrees)– Program completion (degrees, certificates, apprenticeships)
• Initial funding ($1.8M in fall 2009) based on each college’s change in total points from baseline year
• Colleges receive quarterly performance data to help decide where to invest resources to accelerate student achievement

New OH Performance Funding Policy
• Performance funding for 2-year colleges based on student achievement of “success points”
• Colleges will receive increasing share of base-budget funding based on share of total success points (5% in 2011, increasing to 20% by 2015)
• Universities receive funding based on course completion, not just enrollment

Suggested Steps for IBHE• Strengthen longitudinal tracking of students within/
across education sectors and into labor market
• Report achievement of intermediate and “completion” milestones as well as “momentum indicators,” disaggregated by level of readiness, age, enrollment status, race/ethnicity and gender
• Report rates of progression and success by college
• Engage colleges in identifying areas for improvement and developing and evaluating strategies using local data
(More) Suggested Steps • Provide guidance and TA to colleges on using data
to improve programs and services
• Partner with ISBE and DCEO agencies to strengthen knowledge worker career pathway/ “supply chain” tracking and improvement
• Partner with outside researchers to answer questions critical to the state’s policy agenda
• Communicate research findings strategically to practitioner and policy audiences

For more information:
Please visit us on the web at http://ccrc.tc.columbia.edu,where you can download presentations, reports,
CCRC Briefs, and sign up for news announcements.
CCRC funders include: Alfred P. Sloan Foundation, Lumina Foundation for Education, The Ford Foundation,
National Science Foundation (NSF), Bill & Melinda Gates Foundation
and Institute of Education Sciences of the U.S. Department of Education
Community College Research CenterInstitute on Education and the Economy, Teachers College, Columbia University
525 West 120th Street, Box 174, New York, NY 10027 E-mail: [email protected]: 212.678.3091