Embed Size (px)
Citation preview

Utah State UniversityDigitalCommons@USU
All Graduate Plan B and other Reports Graduate Studies
5-2013
Strategies to Enhance Conversion ofLignocellulosic Biomass to Fermentable Sugars andto Enhance Anaerobic Digestion of Algal Biomassfor Biogas ProductionKristen M. Sims
Follow this and additional works at: https://digitalcommons.usu.edu/gradreports
This Report is brought to you for free and open access by the GraduateStudies at DigitalCommons@USU. It has been accepted for inclusion in AllGraduate Plan B and other Reports by an authorized administrator ofDigitalCommons@USU. For more information, please [email protected].
Recommended CitationSims, Kristen M., "Strategies to Enhance Conversion of Lignocellulosic Biomass to Fermentable Sugars and to Enhance AnaerobicDigestion of Algal Biomass for Biogas Production" (2013). All Graduate Plan B and other Reports. 256.https://digitalcommons.usu.edu/gradreports/256

STRATEGIES TO ENHANCE CONVERSION OF LIGNOCELLULOSIC BIOMASS TO FERMENTABLE SUGARS AND TO ENHANCE ANAEROBIC DIGESTION OF ALGAL BIOMASS FOR BIOGAS
PRODUCTION By
Kirsten M. Sims
A report submitted in partial fulfillment of the requirements for the degree of
MASTER OF SCIENCE
In
Biological Engineering
Approved:
Charles Miller Issa Hamud Committee Chair Committee Member Byard Wood Committee Member
UTAH STATE UNIVERSITY Logan, Utah
2012
2
ABSTRACT
Strategies to Enhance Conversion of Lignocellulosic Biomass to Fermentable Sugars
and to Enhance Anaerobic Digestion of Algal Biomass for Biogas Production
By
Kirsten M.Sims, Master of Science
Utah State University, 2012
Major Professor: Dr. Charles Miller Department: Biological Engineering
For economical conversion of cellulosic biomass to biofuel sources, such as
ethanol and biogas, high concentrations of biomass must be processed to minimize
downstream costs associated with dilute solutions. Further, the fundamental
processes that drive biomass transformation must be understood in order to
optimize conversion processes and to efficiently overcome the technological and
economic barriers of biofuel production. One such barrier includes the recalcitrance
of biomass to degradation. In order to overcome the recalcitrance of biomass, this
study focuses on pretreatment strategies to break down the cell wall components
and to make the biomass more susceptible to enzymatic action.
Specifically, this study focuses on the use of alkaline peroxide pretreatment
under varying conditions for processing lignocellulosic biomass. Optimal conditions
for alkaline peroxide pretreatment were identified for increasing subsequent
enzymatic saccharification to fermentable sugars.

3
This study also evaluated the use of alkaline pretreatment for algal biomass
that is present in the Logan Lagoon Wastewater System in order to enhance the
anaerobic digestibility of the algae. Different bacterial seed sludges were also
evaluated for increasing gas production from anaerobic digestion of algal biomass.

4
ACKNOWLEDGEMENTS
I would like to thank the Logan City Environmental Department for allowing
me to use their laboratory facilities and to collect algae samples from the Logan
Lagoons. I would like to thank everyone involved in this project for their knowledge
and support. I would like to thank my major advisor, Dr. Charles Miller, as well as
my committee members Dr. Byard Wood and Mr. Issa Hamud for their support and
guidance. I would also like Anne Martin for her continued help and support.
Special thanks to my family for their support, especially to my parents for
their support and guidance. Special thanks also to my husband, Nurivan, for his
support and love throughout this process.
Kirsten M. Sims

5
FORWARD
This report investigates potential strategies for enhancing the biological
transformation of biological feed stocks to intermediate compounds that can be further
utilized to produce biofuels. Specifically, this report focuses on the development of
pretreatment processes that include the use of environmentally benign compounds and
the reduction of energy input requirements to enhance the conversion of biomass to
biofuel. The two feed stocks that were investigated were lignocellulosic biomass and
algal biomass.
The first portion of this report focuses on the transformation of lignocellulosic
biomass to fermentable sugars that may be subsequently converted to ethanol using
enzymatic saccharification processes. This research was carried out under the direction of
Dr. Sridhar Viamajala, a USTAR professor in the Biological Engineering Department at
Utah State University. After one year of research, Dr. Viamajala took a position at the
University of Toledo.
After Dr. Viamajala’s departure from USU, I transitioned to work under Dr.
Charles Miller, an Assistant Professor in the Biological Engineering Department at USU.
Under the guidance of Dr. Miller, I focused on the transformation of algal biomass to
methane gas through anaerobic digestion, which may subsequently be used as
compressed natural gas. The anaerobic digestion of algal biomass is the focus of the
second portion of this report.

6
CONTENTS Abstract………………………………………………………………………………………………………………………….3 Acknowledgements…………………………………………………………………………………………………………5 List of Tables…………………………………………………………………………………………………………………...7 List of Figures………………………………………………………………………………………………………………….8 Chapter One: Strategies to Enhance Conversion of Lignocellulosic Biomass to Fermentable Sugars Introduction and Literature Review for lignocellulosic biofuels…………………………………………9 Summary and Problem Statement…………………………………………………………………………………..34 Research Design and Methods………………………………………………………………………………………..36 Development of Sugar Standards …………………………………………………………………………………...36 Effect of High Solids Concentrations……………………………………………………………………………….36 Pretreatment Optimization Experiments………………………………………………………………………..37 Determination of Structural Carbohydrates…………………………………………………………………….39 Structural composition and pretreatment …………………………………………………………….………..40 Results Effect of High Solids Concentration…………………………………………………………………………………40 Pretreatment Optimization Experiments………………………………………………………………………...41 Determination of Structural Carbohydrates…………………………………………………………………….45 Structural composition and pretreatment……………………………………………………………………….46 Discussion and Conclusion……………………………………………………………………………………………..48 Future Work………………………………………………………………………………………………………………….49 References…………………………………………………………………………………………………………………….51 Chapter Two: Strategies to Enhance Anaerobic Digestion of Algal Biomass for Biogas Production Introduction…………………………………………………………………………………………………………………57 Summary and Problem Statement…………………………………………………………………………………84 Materials and Methods Conversion Efficiency Based on Digester Inoculum…………………………………………………………86 Effect of Pretreatment on Anaerobic Digestion of Algae………………………………………………….88 Results and Discussion Conversion Efficiency Based on Digester Inoculum…………………………………………………………89 Effect of Pretreatment on Anaerobic Digestion of Algae…………………………………………………..95 Conclusion…………………………………………………………………………………………………………………….97 Future Work………………………………………………………………………………………………………………….97 References…………………………………………………………………………………………………………………….99 Appendix……………………………………………………………………………………………………………………..101
7
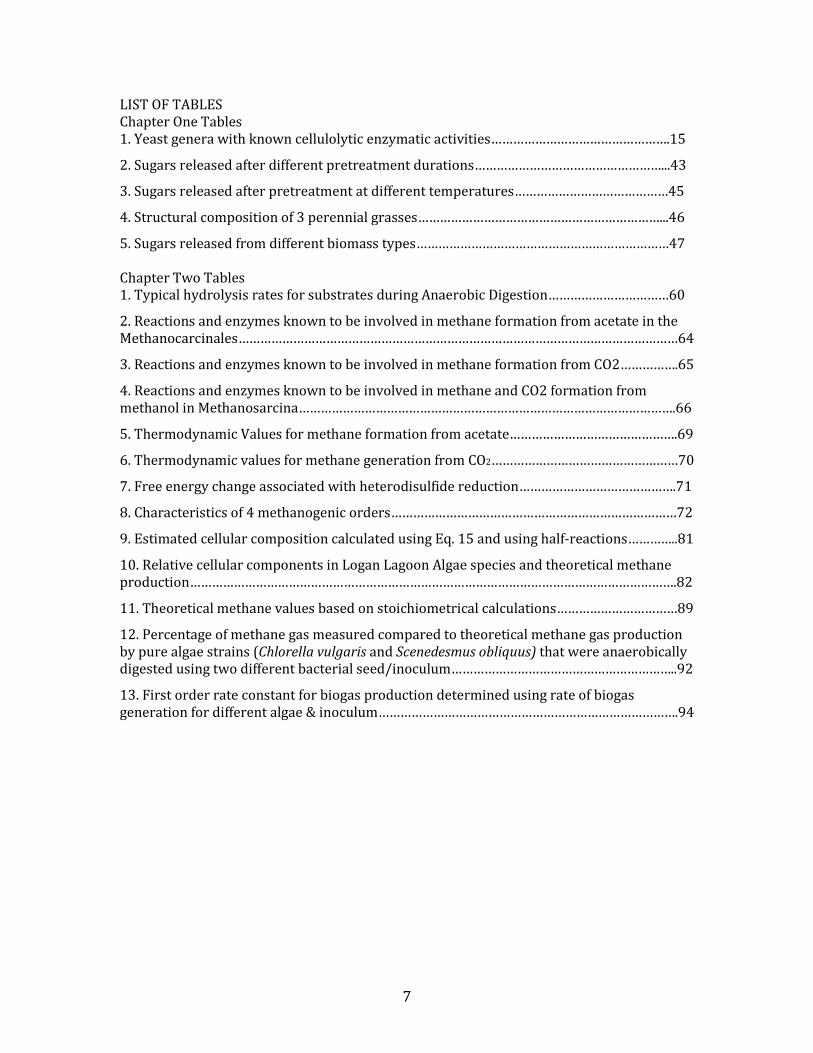
LIST OF TABLES Chapter One Tables 1. Yeast genera with known cellulolytic enzymatic activities………………………………………….15
2. Sugars released after different pretreatment durations……………………………………………...43
3. Sugars released after pretreatment at different temperatures……………………………………45
4. Structural composition of 3 perennial grasses…………………………………………………………...46
5. Sugars released from different biomass types……………………………………………………………47 Chapter Two Tables 1. Typical hydrolysis rates for substrates during Anaerobic Digestion……………………………60
2. Reactions and enzymes known to be involved in methane formation from acetate in the Methanocarcinales…………………………………………………………………………………………………………64
3. Reactions and enzymes known to be involved in methane formation from CO2…………….65
4. Reactions and enzymes known to be involved in methane and CO2 formation from methanol in Methanosarcina………………………………………………………………………………………….66
5. Thermodynamic Values for methane formation from acetate……………………………………….69
6. Thermodynamic values for methane generation from CO2……………………………………………70
7. Free energy change associated with heterodisulfide reduction…………………………………….71
8. Characteristics of 4 methanogenic orders……………………………………………………………………72
9. Estimated cellular composition calculated using Eq. 15 and using half-reactions…………..81
10. Relative cellular components in Logan Lagoon Algae species and theoretical methane production…………………………………………………………………………………………………………………….82
11. Theoretical methane values based on stoichiometrical calculations……………………………89
12. Percentage of methane gas measured compared to theoretical methane gas production by pure algae strains (Chlorella vulgaris and Scenedesmus obliquus) that were anaerobically digested using two different bacterial seed/inoculum……………………………………………………..92
13. First order rate constant for biogas production determined using rate of biogas generation for different algae & inoculum……………………………………………………………………….94

8
LIST OF FIGURES Chapter One Figures 1a. 5-day enzymatic digestibility data for pretreated corn stover ……………………………………41 1b. 5-day enzymatic digestibility data for pretreated corn stover ……………………………………41 2. Effect of H2O2 level on digestibility of corn-stover……………………………………………………….42 3. Effect of pretreatment duration………………………………………………………………………………….43 4. Effect of temperature during pretreatment…………………………………………………………………44 5. Pretreatment with alternative biomass types………………………………………………………………47 Chapter Two Figures 1. Experimental design for digestion efficiency based on inoculum …………………………………87
2. Total biogas production after 35 days of pure algae strains anaerobically digested using two different bacterial seed/inoculum……………………………………………………………………………90
3. Total biogas production after 35 days of a mixed algae sample from the Logan Lagoons after being anaerobically digested using two different bacterial seed/inoculum………………91
4. Rate of Biogas Production over 35 days of two different algae strains…………………………..94
5. Biogas production after pretreatment…………………………………………………………………………95
6. Total biogas produced after 35-day digestion of non-pretreated mixed culture algae from the Logan Lagoons when digested with sludge from the bed of the Logan Lagoons. …………96

9
Introduction
Life on Earth is driven by the photosynthetic conversion of sunlight to
chemical energy, wherein photosynthesis results in the production of plant biomass
with cellulose as the major component of plant cell walls. Cellulose is the most
abundant polysaccharide in the biosphere.
Cellulose-utilizing microorganisms, present in the soil and in the guts of
animals, are primarily responsible for major conversion of cellulosic materials in the
biosphere. Thus, microbial cellulose utilization is responsible for one of the largest
material flows in the biosphere and is of interest in relation to analysis of carbon
flux on micro and macro scales. Microbial cellulose utilization is also an integral
component of widely used processes such as anaerobic digestion and composting.
Cellulosic materials are particularly attractive as a sustainable source of fuels
and other bioproducts. Important distinguishing features of cellulosic biomass
compared to other potential feedstocks for biological processing include low
purchase price, potential for supply on a large scale, recalcitrance to reaction, and
heterogeneous composition.
For production of biologically derived fuel, as well as other bulk chemicals, a
feedstock having a low cost and wide availability is required. The economics of cost-
competitive commodity processes are dominated by feedstock cost, and thus
require high product yields (Hinman, N.D. et al., 1992; Lynd, L.R. 1999; Lynd, et al.,

10
1999; Wright, J.D. 1988). A primary technological impediment to the large-scale
development and use of cellulosic material as a source of fuel is the general absence
of low-cost technology and processing methods for overcoming the recalcitrance of
cellulosic biomass.
Specifically, lignocellulosic biomass, which includes agricultural residues,
energy crops, wood residues and municipal paper waste, represents a relatively
unused source for biogas and ethanol production. Lignocellulose is plant biomass
that is composed of cellulose, hemicellulose, and lignin. Many factors, however, are
shown to limit the digestibility of the hemicellulose and cellulose present in
lignocellulosic biomass. These factors include lignin content, crystallinity of
cellulose, and particle size.
Lignocellulosic Biomass Structural Components
Cellulose, the most abundant component of plant biomass, is found in nature
almost exclusively in plant cell walls. Cellulose is also known to be produced by
some animals and a few bacterial species. Cellulose has been shown to comprise
approximately 35-50% of plant dry weight (Lynd, 1999). In most cases, cellulose
fibers are embedded in a matrix of other structural biopolymers, primarily
hemicelluloses and lignin, which comprise 20 to 25 and 5 to 30% of plant dry weight
(Lynd, 1999; Marchessault et al., 1957; and Van Soest, 1994), respectively.

11
Cellulose
In nature, cellulose is synthesized as individual chains of glucosyl residues.
Cellulose exists of D-glucose subunits, linked by B-1,4 glycosidic bonds. The linear
cellulose chains undergo self-assembly at the site of biosynthesis (Brown et al.,
1977). There is evidence that associated hemicelluloses may regulate this
aggregation process (Atalla, et al., 1993). Approximately 30 individual cellulose
molecules are assembled into larger units, referred to as protofibrils. The
protofibrils may be packed into even larger units, known as microfibrils. Microfibrils
are in turn assembled into cellulose fibers.
The chains are strengthened by both interchain and intrachain hydrogen
bonds. In cellulose type I, the most abundant form of cellulose in nature, sheets of
substantially parallel cellulose chains lie adjacent to one another, and overlie one
another. These sheets are held together by weak intersheet van der Waals forces.
Despite the relative weakness of individual van der Waal forces, their cumulative
effect of their many residues in the protofibrils is considerable (Hatfield et al.,
1999).
This well-defined organization of cellulose molecules yields a crystalline
structure, implying a structural order in which all of the atoms are fixed in discrete
positions relative to one another. The component molecules of the resulting
crystalline structure microfibrils are packed together tightly such that they
sufficiently prevent penetration not only by degradative enzymes, and but also by
small molecules such as water (Hatfield et al., 1999)

12
Although cellulose forms a distinct crystalline structure, cellulose fibers in
nature are not purely crystalline, having cellulose fibers that are more loosely
associated and can in fact be completely amorphous, as well as all degrees of order
in between (Marchessault et al., 1957). In addition to crystalline and amorphous
regions, cellulose fibers may contain various structural irregularities, such as voids
or twists in the fibers that provide significant additional surface area. These
irregularities may be shaped to allow penetration by relatively large molecules,
including some cellulolytic enzymes. (Blouin et al., 1970; Cowling, 1975; Fan et al.,
1980). The heterogeneity may also allow for portions of the fiber to by hydrated by
water when immersed in aqueous media.
Several types of purified celluloses have been identified for use in studies
pertaining to hydrolysis. Holocelluloses are produced by delignification of wood or
other biomass materials, and may retain substantial amounts of various
hemicelluloses. Microcrystalline celluloses are nearly pure cellulose, and the dilute-
acid treatment used in their preparation removes both hemicelluloses and some
amorphous regions of the cellulose fibers. Commercial microcrystalline celluloses
differ in particle size distribution, which has significant implications for the rate of
hydrolysis and utilization. Several species of bacteria are known to produce
cellulolytic materials, such as that produced by Acetobacter sylinum. This bacterial
cellulose has been identified as a useful model system for studying cellulose
biosynthesis, but has rarely been used for studies in cellulose utilization.

13
The variable structural complexity of pure cellulose and the difficulty of
working with insoluble substrates have led to a wide use for investigative studies
and for industrial processing of another cellulosic material, carboxymethylcellulose
(CMC). Carboxymethylcellulose is a highly soluble and pure cellulose ether.
Utilization of cellulosic biomass is more complex than is that of pure
cellulose, however. The added complexity is attributed to the presence of
hemicelluloses and lignin, as well as the diverse architecture of plant cells in nature.
(Fan et al., 1980).
Hemicellulose
Hemicellulose is a complex carbohydrate structure that consists of different
polymers like pentoses (xylose and arabinose), hexoses (mannose, glucose and
galactose), and sugar acids. The dominant component of hemicellulose from
hardwood and agricultural plants, like grasses and straw, is xylan (Fengel and
Wegener, 1984). Hemicellulose has a lower molecular weight than cellulose, and
includes branches with short, lateral chains that consist of different sugars. The
short branches are easily hydrolyzed polymers (Fengel and Wegener, 1984).
Hemicellulose serves to link the lignin and the cellulose fibers, thus increasing the
cellulose-hemicellulose-lignin rigidity (Hatfield, et al., 1999).
Lignin
After cellulose and hemicellulose, lignin is one of the most abundant
polymers in nature. Lignin is an amorphous heteropolymer consisting of the

14
following three different phenylpropane units: p-coumaryl, coniferyl, and sinapyl
alcohol. These phenylpropane units are held together by various types of linkages.
Lignin serves primarily to give structural support to plants as well as to
increase impermeability and resistance against microbial attack and oxidative
stress. Lignin is also non-water soluble and optically inactive. Therefore, lignin has
been shown to be highly resistant to degradation (Fengel and Wegener, 1984).
Lignin and hemicellulose have been shown to dissolve in water at around
180 degrees C under neutral conditions (Bobleter, 1994). Solubility of lignin in acid,
neutral, or alkaline environments is dependent on the precursor molecules and their
associations with one another in the lignin structure (Grabber, 2005).
Cellulolytic Organisms and Enzymatic Systems
There also exists in nature a broad distribution of cellulolytic capabilities. It
has been suggested that cellulolytic abilities evolved alongside the emergence of
algae and land plants, when presumably there existed the selective pressure of
abundant cellulose availability following the development of cellulose biosynthesis.
Fungi in particular have well-documented cellulolytic capabilities (Lee et al., 2002).
A number of species of the most primitive group of fungi, the anaerobic
Chytridomycetes, are well-known for their ability to degrade cellulose in the
gastrointestinal tracts of ruminant animals. Cellulolytic capability is also well
represented among aerobic fungi. Particularly, fungal subdivisions Ascomycetes,
Basidiomycetes, and Deuteromycetes, contain large numbers of cellulolytic species.

15
Referring to Table 1, members of genera that have received considerable
investigations with respect to their cellulolytic enzymes and/or wood degrading
capability are described (Lee et al., 2002)
Table 1. Yeast genera that have known cellulolytic enzymatic activities
Ascomycetes Basidiomycetes Deuteromycetes
Bulgaria Coriolus Aspergillus
Chaeetomium Phanerochaete Sladosporium
Helotium Poria Fusarium
Schizophyllum Geotrichum
Serpula Myrothecium
Paecilomyces
Penicillium
Trichoderma
A variety of cellulase enzyme systems produced by cellulolytic organisms
have been identified. Components of cellulase systems were first classified based on
their mode of catalytic action. More recently, the structure of the different
components of cellulolytic systems have been elucidated.
The following three major types of enzymatic activities are known:
i) Endoglucanases or 1,4-β-D-glucan-4-glucanohydrolases (EC 3.2.1.4)
ii) Exoglucanases, including 1,4-β-D-glucan glucanohydrolases
(cellodextrinases) (EC 3.2.1.74) and 1,4-β-D-glucan cellobiohydrolases
(cellobiohydrolases) (EC 3.2.1.91)

16
iii) β-glucosidases or β-glucoside glucohydrolases (3.2.1.21)
Endoglucanases act to cut the cellulose polysaccharide chains at random
intervals at internal amorphous sites. This generates oligosaccharides of various
lengths, and consequently new chain ends that are available to exoglucanases.
Exoglucanases act on the reducing or nonreducing ends of cellulose polysaccharide
chains in a processive manner, moving along the length of the chain. This action
releases either glucose (glucanohydrolases) or cellobiose (cellobiohydrolases) as
major products.
Cellulases are unique in their ability to hydrolyze β-1,4-glucosidic bonds
between glucosyl residues. The enzymatic breakage of the β-1,4-glucosidic bonds in
cellulose proceeds through an acid hydrolysis mechanism. A general feature
common to most cellulases is a modular structure often including both a catalytic
module and a carbohydrate-binding module (CBM). The CBM contains binding sites
for engaging the cellulose surface, and presumably acts to facilitate cellulose
hydrolysis by positioning the catalytic domain in close proximity to the substrate. It
has been demonstrated that the presence of CBMs is particularly integral to the
initiation and processivity of exoglucanases (Teeri et al., 1998).
Cellulase systems exhibit synergy, or a higher collective enzymatic activity than
the sum of the activities of individual enzymes. The following four types of synergy
have been identified in cellulolytic systems:
i) endo-exo synergy between endoglucanases and exoglucanases

17
ii) exo-exo synergy between exoglucanases processing from the reducing
and non-reducing ends of cellulose chins
iii) synergy between exoglucanases and β-glucosidases and remove
cellobiose (and cellodextrins) as end products of the first two enzymes
iv) intramolecular synergy between catalytic domains and CBMs (Teeri,
1997; Aoyagi et al., 1995)
Cellulases from aerobic fungi have received more investigation than have those
of other physiological groups. Fungal cellulase systems are of particular interest due
to their wide spread use in industrial ethanol-producing applications. Trichoderma
reesei has been the primary focus of much of the research for at least 50 years
(Mandels and Weber, 1957; Reese, 1956; Reese and Mandels, 1971; and Reese et al.,
1950). T. reesei produces at least two exoglucanases, five endoglucanases and two β-
glucosidases.
The two exoglucanases, referred to as Cellobiohyrolase I and II (CBH I and
CBH II) are the principal components of the T. reesei cellulase system, representing
60 and 20% respectively (Wood, 1992). Both include a CBM to facilitate binding and
drive processive degradation along the length of the cellulose chains.
Crystallography has elucidated the three-dimensional structure of CBH I and
CBH II. Both enzymes have been identified to contain a tunnel-like structural
feature. CBHI has been shown to include four surface loops that comprise a tunnel,
with a length of approximately 50 Angstroms. CBHII contains two surface loops
that comprise a tunnel of approximately 20 Angstroms. The tunnels are essential for

18
the processive cleavage of the cellulose chains from the reducing or non-reducing
ends. It has been demonstrated that as the enzymes move along the length of the
chain, the chain is passed through at least a portion of the tunnel structures, where
cleavage of the bonds occur.
A 3-D structure of CBHI confirmed that cellobiose is the major hydrolytic
product as the cellulose chain is passed through the tunnel. Both CBHI and CBHII are
indicated to be relatively slow to decrease the degree of polymerization.
The five endoglucanases, EGI, EG II, EGIII, EGIV and EGV are thought to be
primarily responsible for decreasing the degree of polymerization of cellulose by
internal cleaving of cellulose chains at relatively amorphous regions, thereby
generating new cellulose chain ends available for action by the cellobiohydrolases
(Teeri et al., 1998).
The structure of EGI has also been resolved using crystallography (Kleywegt
et al., 1997) to reveal a plurality of sorter loops that comprise a groove rather than a
tunnel. The groove presumably acts to allow the entry of the cellulose chain and
facilitates cleavage of the chain. A similar groove is seen to exist in EGIII, although
EGII lacks a CBM.
T. reesei produces β-glucosidases at low levels compared to other fungi
species (Reczey et al., 1998). The production of at least two β-glucosidases by T.
reesei facilitates by hydrolysis of cellobiose and small oligosaccharides to glucose
(Reczey et al., 1998; Usami et al., 1990) The β-glucosidases in T. reesi cellulase

19
cohorts have also been shown to be subject to product inhibition, primarily glucose
inhibition (Chen et al., 1992; Gong et al., 1977; Maguire, 1977). This inhibition effect
is thought to be exacerbated when the solids concentration during enzymatic action
is increased (Sridhar Viamajala, personal communication, June, 2008), presumably
due to the overall increase in glucose production.
Rate Limiting Factors for Cellulolytic Action
For enzymatic hydrolysis of natural celluloses, several hydrolysis rate-
determining factors have been proposed, including crystallinity, degree of
polymerization, particle size, pore volume, and accessible surface area (Fan et al.,
1980).
Within any given cellulose sample, there is a great degree of variability in the
size and shape of individual particles (Walker et al., 1990; Weimer et al., 1990).
Measurements of fine-structure features, including particle size, crystallinity, or
surface area yield average values for that particular population. Thus, experiments
to evaluate the quantitative effect of these rate-limiting factors on hydrolysis are
restricted to comparing measurements of hydrolysis or utilization among
populations of particles and their average structural characteristics.
Even within a given population of cellulose fibers, structure-utilization
relationships are further complicated by various interrelationships among various
structural features. For example, structural discontinuities that contribute to
increased pore volume also act to lower the average degree of crystallinity.
Therefore, it is difficult to alter a first fine-structure feature without simultaneously,

20
and often inversely, altering at least a second fine-structure feature to determine the
effect of the first structure feature on utilization and rate of hydrolysis.
Crystallinity is widely considered a major determinant of cellulose hydrolysis
at both enzymatic and microbial levels. Several pretreatment process options have
been identified to decrease the degree of crystallinity. Studies with pure celluloses
indicate that amorphous celluloses are degraded five to ten times more rapidly than
are high crystalline celluloses by fungal enzymes (Gama et al., 1994). Pretreatment
strategies will be discussed in further detail later in this review.
Cellulose utilization efficiency has also been shown to be subject to physical
and chemical conditions, such as pH and redox potential in the surrounding
environment. Cellulosic substrates occurring in nature and those resulting from
pretreatment processes typically contain lignin, to which many cellulase
components bind. Naturally occurring cellulosic substrates and some pretreated
substrates also contain hemicellulose, which impedes access of cellulase
components to 1,4-β-glucosidic bonds.
Cellulose materials that include hemicellulose may require distinct
hydrolysis enzymatic activities from those involved in cellulose degradation. Kinetic
properties, such as adsorption capacity and affinity may vary over the course of
hydrolysis as the structure of the cellulose material changes. Chemical properties,
such as fractional composition of different components (for example, the overall
ratio of cellulose to hemicellulose) and physical properties such as size, shape,
density, and rigidity, may also vary over the course of hydrolysis. Given the

21
enzymatic, substrate and organismal properties, as well as the interactions among
these properties, cellulose hydrolysis is recognized as an exceedingly complex
phenomenon. Many kinetic models that have been developed represent
simplifications of the real situation.
Pretreatment
Incubation of naturally occurring cellulosic material in the presence of either
pure cultures of cellulolytic microorganisms or cell-free cellulase enzyme
preparations have generally resulted in cellulose hydrolysis yields that are less than
20% of theoretical hydrolysis values (Gama et al., 1994). Consequently, the need for
a pretreatment process before hydrolysis is nearly always required to bring the
hydrolysis value closer to theoretical values, thus increasing the economic feasibility
of cellulosic ethanol production. “Pretreatment” of cellulosic materials generally
refers to an engineering process step in which the recalcitrance of lignocellulosic
biomass to enzyme systems is reduced, increasing the availability of the biomass to
enzymatic hydrolysis.
β-glucosidic bonds in naturally occurring lignocellulosic materials are
inaccessible to cellulase enzymes due to small pore sizes and enzyme-associated
inaccessibility. The structural complexity, including association of hemicellulose and
other structural polysaccharides, further hinders enzyme activity on the cellulosic
material. Overcoming these physical and chemical barriers require a pretreatment
step to render lignocellulosic materials amenable to enzymatic hydrolysis.
Pretreated lignocellulosic materials are generally characterized by increased surface

22
area that is accessible to cellulase enzymes and solubilization, specifically increased
porosity and/or redistribution of lignin. Increasing porosity, and therefore surface
area, requires hemicellulose solubilization, lignin solubilization and lignin
redistribution.
Pretreatment Methods
The goal of pretreatment is to improve the digestibility of lignocellulosic
biomass. Each pretreatment has a unique effect on the cellulose, hemicellulose, and
lignin.
Lignin redistribution is the primary result of dilute acid and steam explosion
pretreatment methods, although lignin is not significantly removed (Converse,
1993). It is proposed that during these procedures, lignin “melts”, and then
coalesces upon cooling, substantially altering its properties (Brownell and Saddler,
1987; Converse, 1993; Donaldson et al., 1988; Tanahashi et al., 1983).
Additional proposed pretreatment processes that have been identified as
promising include dilute acid, steam explosion at high solids concentration,
“hydrothermal” process, “organosolv” processes involving organic solvents in an
aqueous medium, ammonia fiber explosion (AFEX), and strong alkali processes
using a strong base such as NaOH, or lime. Each of these processes have been shown
to produce pretreated fiber derived from herbaceous and/or hardwood-derived
feedstocks that retains nearly all of the cellulose present in the original material and
allows close to theoretical yields of sugars upon enzymatic hydrolysis, under
23
appropriate conditions. These processes, similar processes and combinations of
these processes, are discussed in further detail below.
Thermal pretreatment processes include heating the lignocellulosic biomass.
Hemicelluloses and lignin will begin to solubilize as the temperature approaches
150-180 degrees C. Composition of the hemicellulose backbone, as well as the
arrangement of branching groups determine the thermal, acid and alkali stability of
the hemicellulose. Xylans are slightly less thermally stable than glucomannans.
Above 180 degrees C, an exothermal reaction of hemicellulose begins (Beall and
Eickner, 1970; Domansky and Rendos, 1962).
During thermal processes, a part of the hemicellulose is hydrolyzed, forming
various acids. These acids are assumed to further catalyze hydrolysis of
hemicellulose (Gregg and Saddler, 1996). Compounds that are released during lignin
solubilization as temperature increases are usually phenolic and have been shown
to have an inhibitory effect of cellulosic bacteria, yeast and methanogens/archae
(Gossett et al., 1982). The phenolics are also highly reactive and unless they are
removed quickly will re-condense on the biomass (Liu and Wyman, 2003),
presenting challenges to thermal pretreatment in the presence of lignin.
When solids concentrations exceeded 3% with temperatures of 220 degrees
C during a two-minute pretreatment process, ethanol production was essentially
completely inhibited, due to formation of furfural and other compounds (Laser et al.,
2002). Temperatures, however, cannot exceed 250 degrees C to avoid inducing
pyrolysis reactions (Brownell et al., 1986). Some studies have also shown that

24
thermal pretreatment can also cause an increase in crystallinity (Weimer et al.,
1995).
Thermal processes include steam pretreatment/steam explosion (ST/SE).
The objective of a steam pretreatment/steam explosion is to solubilize the
hemicellulose to make the cellulose more accessible for enzymatic hydrolysis, and to
avoid the formation of inhibitory bi-products. During steam pretreatment processes,
the biomass is put in a large vessel and exposed to steam at very high temperatures
and pressure (up to 240 degrees C) for a short duration (2-3 minutes). The steam is
then suddenly released and the biomass is quickly cooled. The quick
depressurization and cooling differentiates “steam preatreatment” and “steam
explosion”. The depressurization causes the water in the biomass to “explode”,
although the advantageous effect of the explosion is somewhat doubted (Brownell
et al., 1986).
During steam pretreatment, in situ formed acids help to catalyze (auto-
cleave) the process itself. The acids most likely catalyze the hydrolysis of the soluble
hemicellulose oligomers (Bobleter et al., 1991; Mok and Antal, 1992). Low-pressure
steam pretreatment (2 bars, 120 degrees C, and pretreatment times up to 300
minutes) did not have a large effect on the composition and structure of pretreated
wheat straw according to Lawther et al. (1996).
Liquid hot water (LHW) is another example of thermal pretreatment, in
which liquid hot water is used instead of steam. The objective of LHW is primarily to
solubilize hemicellulose, thus making the cellulose more accessible, and to avoid the

25
formation of inhibitors. To avoid the formation of inhibitory compounds, the pH is
kept between 4 and 7 during pretreatment (Kohlmann et al., 1995; Mosier et al.
2005; Weil et al., 1997).
In LHW, the amount of solubilized products is higher than in steam
pretreatment, while the concentration of these products is lower than in steam
pretreatment (Bobleter, 1994). This most likely results from dilution due to higher
water input in LHW. The yield of solubilized xylan is generally also higher for LHW
pretreatment, though this trend does not hold when solid concentration increases.
Another study has shown that flow-through systems removed more
hemicellulose and lignin from corn-stover during pretreatment than batch systems
did, under the same pH and temperature conditions. Additionally, the addition of an
external acid during a flow through process caused higher hemicellulose and lignin
removal, while in batch processes, the addition of an external acid caused less lignin
removal. Presumably, the inhibitory factors are captured in the effluent for removal
during flow-through process. Other studies, however, have shown that acid
additions have no substantial effect or are not the only factor affecting the
solubilization of hemicellulose and lignin.
Methane producing bacteria have been shown to be able to adapt to the
inhibitory compounds that may result from steam pretreatment/steam explosion, at
least to certain concentrations. The adaption has been observed in various studies,
wherein up to a six-fold increase in enzymatic digestibility has been reported after
steam pretreatment (Benjamin et al., 1984; Fox et al., 2003).

26
The use of LHW is advantageous, as the solubilized hemicellulose and lignin
products are present in lower concentrations when compared to steam
pretreatment. Weil et al. (1998) showed a 2- to 5- fold increase in enzymatic
hydrolysis of their substrate after LHW pretreatment.
Pretreatment of lignocellulose material is sometimes performed with acids to
enhance the anaerobic digestibility. The objective is to solubilize the hemicellulose,
making the cellose better accessible. Acid pretreatment is done with either dilute or
strong acids.
Xylan is particularly affected, while glucomannan is relatively acid stable.
Solubilized oligomers can be subjected to hydrolytic reactions producing
monomers, furfural, HMF and other volatile products in acidic environments (Fengel
and Wegener, 1984; Ramos, 2003). During acid pretreatment, solubilized lignin will
quickly condense and re-precipitate in acidic environments (Liu and Wyman, 2003;
Shevchenko et al., 1999). Solubilization of hemicellulose and precipitation of
solubilized lignin is more pronounced in strong acid pretreatment.
The risk of formation of volatile degradation products during acid
pretreatment may lead to lost carbon for the conversion to ethanol. These volatile
products may be converted to methane, however. Strong acid pretreatment for
ethanol production has been determined to be unfeasible due to the high amounts of
inhibiting compounds that are likely to be formed. Dilute acid pretreatment,
however, has been identified to be one of the most promising pretreatment
methods.
27
Acid pretreatment is particularly attractive for methane production, because
methanogens have been shown to be able to handle compounds such as furfural and
HMF at certain concentrations after an acclimatization period. For both ethanol and
methane production, soluble lignin compounds are often inhibiting. Methanogens,
however, are more capable of adapting. (Benjamin et al., 1984; Xiao and Clarkson,
1997). The use of sulfuric or nitric acids in pretreatment, however, may reduce
methane production as a result of reduction of sulfate and nitrate to H2S and N2.
Another example of a pretreatment method includes the use of ammonia.
This pretreatment method, commonly referred to as AFEX pretreatment, is
conducted with ammonia loadings around 1:1 (kg ammonia/kg dw biomass) at
temperatures ranging from ambient temperature with a duration between 10 and
60 days, to temperatures of 120 degrees C with a duration of only several minutes
(Alizadeh et al., 2005; Kim and Lee, 2005). A six-fold increase in enzymatic
hydrolysis yield and a 2.5 fold ethanol yield after AFEX pretreatment has been
reported (Alizadeh et al., 2005). Significant swelling of the cellulose and increased
delignification have been identified as factors responsible for the increased yield.
Alkaline pretreatment causes biomass to swell via solvation and
saphonication. This causes the biomass to be more accessible to enzyme action. At
“strong” alkali concentrations, end groups are peeled and alkaline hydrolysis occurs.
This peeling is an advantage for later conversion, although carbon dioxide
production also occurs, leading to the loss of carbon for conversion processes.

28
Xylan can be targeted for removal with aqueous potassium hydroxide and
low temperature. Low temperature prevents peeling (Hon and Shiraishi, 2001).
During alkaline pretreatment processes, the biomass consumes a portion of the
alkali itself. Alkali extraction can also cause solubilization, redistribution and
condensation of lignin as well as modifications in the crystalline state of the
cellulose. These effects can lower, or counteract the positive effects of lignin
removal and cellulose swelling (Gregg and Saddler, 1996). Additionally, during
alkaline pretreatment, the cellulose structure is changed to a form that is denser and
thermodynamically more stable than the native cellulose.
Gosset et al. (1982) concluded that lignin-containing biomass containing
lignin concentrations of over 1g/l that is subjected to alkaline heat pretreatment
yielded a major inhibitory effect to methanogenic microorganisms. This inhibition is
most likely caused by the inhibitory products that are released from lignin during
the alkaline heat pretreatment. The loss of fermentable sugars and the production of
inhibitory compounds makes the alkaline pretreatment less attractive for high-
lignin biomass for enzymatic saccharification and subsequent ethanol production.
The production of inhibitors is less severe for methanogens as compared to yeasts
for ethanol production.
Oxidative pretreatment is yet another pretreatment method. The process
consists of the addition of an oxidizing compound, such as hydrogen peroxide or
peracetic acid to the biomass that has been suspended in water. The objective of
oxidative pretreatment is to remove the hemicellulose and lignin, thereby increasing

29
the accessibility of the cellulose. Several reactions target the various linkages in the
lignin structure, such as electrophilic substitution, displacement of side chains,
cleavage of alkyl aryl ether linkages or oxidative cleavage of aromatic nuclei.
The oxidant is generally not selective. Therefore, loss of hemicellulose and
cellulose may occur. Formation of inhibitory compounts is also a significant risk, as
lignin is oxidized and soluble aromatic compounds are formed. Peracetic acid,
however is very lignin selective, and no significant carbohydrate loss has been
observed. The enzymatic hydrolysis of the cellulose increased from 6.8% in the
untreated biomass to a maximum hydrolysis of about 98% on the pretreated
biomass at a 21% peracetic acid level in a study performed by Teixeira et al. (1999).
The same study also showed similar results for digestibility using a mixture of NaOH
and peracetic acid. These experiments were performed at ambient temperatures.
Experiments that were conducted at higher temperatures did not show as
significant increases in hydrolysis rates, however.
Gould (1984) demonstrated the use of H2O2 for delignification with a
maximum amount of delignification at pH 11.5 to 11.6. Delignification most likely
results from the action of the hydroxyl ion, which is generated as a degradation
product of hydrogen peroxide with a maximum production occuring at pH 11.5-
11.6. Approximately half of the total lignin content was solubilized when the
reaction was carried out at around 25 degrees C and for a duration of 18-24 hours.
Delignification is significantly reduced as the pH is lowered, with a minimum
occurring below a pH of 10.0. Also, hydrogen peroxide is shown to have no real

30
effect on the enzymatic digestibility at a pH 12.5 or higher. Gould (1984) found that
the hydrogen peroxide concentration should be at least 1%, and the weight ratio
between H2O2 and biomass should be 0.25 for sufficient delignification.
The pretreatment methods that have been described may be combined for
enhanced results. For example, a way to improve the effect of thermal steam or LHW
pretreatment is the addition of an external acid. The acid addition catalyzes the
solubilization of the hemicellulose, lowers the optimal pretreatment temperature,
and gives a better enzymatic hydrolysable substrate (Brownell et al. 1986; Gregg
and Saddler, 1996). In this process, the lignocellulose may be impregnated with SO2,
which is converted to H2SO4 quickly during steam pretreatment. The H2SO4
subsequently catalyzes hydrolysation of the hemicellulose.
Another example of a pretreatment combination includes thermal
pretreatment in combination with alkaline pretreatment. Lime is most commonly
used as an external source of alkalinity. Lime additions of approximately 0.1 g
Ca(OH) g substratae-1 to biomass that has been heated to 100-150 degrees C (Chang
et al., 2001). The lime pretreatment acts to loosen up the lignin, making the
substrate more accessible to hydrolysis (Chang and Holtzapple, 2000). According to
Kaar and Holtzapple (2000), lime pretreatment with heated biomass sufficiently
increases the digestibility of biomass with low lignin content, but not for high lignin
biomass. Lime pretreatment of switchgrass and corn stover does not seem to inhibit
the enzymatic saccharification and fermentation. Pretreated softwood, however,
needs to be washed before enzymatic saccharification and fermentation to prevent

31
inhibition by the relatively large amount of solubilized lignin, adding an additional
process step, thus lowering the economic feasibility. Lime, however, is relatively
inexpensive and safe (Gandi et al., 1997) and the calcium can be regained as
insoluble calcium carbonate by reacting the leachate with carbon dioxide. The
calcium carbonate can then be reconverted to lime again using a lime kiln. One study
reported an improvement in methane production with by a factor of 3 to 4.5 after
pretreating newspaper with alkaline heat pretreatment.
Thermal pretreatment can also be combined with an oxidative pretreatment
method, such as peracetic acid, or with an alkaline oxidative pretreatment. As
previously noted, the effectiveness of lime pretreatment is severely reduced with
high-lignin biomass. The addition of oxygen increased the digestibility of the treated
biomass by 13 fold, although the pretreated biomass had to be washed to remove
any inhibiting soluble lignin compounds (Chang et al. 2001). Approximately 21% of
the added lime could be recovered after carbon dioxide carbonation.
Carbon dioxide may also be used at high pressure and high temperatures as a
carbon-dioxide explosive steam pretreatment method. This may cause the liquid in
which the biomass is suspended to become acidic, leading to the hydrolysis of the
hemicellulose (Puri and Mamers, 1983). The high energy-input requirements
however, make this pretreatment method less economically feasible.
In addition to the pretreatment processes presented above, mechanical
pretreatment processes are also contemplated. Mechanical pretreatment generally
involves milling, or reducing the lignocellulosic biomass into smaller pieces. The

32
objective is to reduce particle size and crystallinity. The reduction in particle size
increases the available specific surface area and reduces the degree of
polymerization (DP) (Palmowski and Muller, 1999). Milling using a particle
reduction size below 40 mesh has been shown to increase the shear on the biomass
and to increase the available specific surface area. This results in an increase of the
hydrolysis yield of lignocellulose up to 24%, and a reduction of the required
digestion time by 23-59%, thus increasing the hydrolysis rate (Delgenes et al. 2002;
Hartmann et al., 1999).
Milling has shown to increase methane production if the pretreated
lignocellulosic biomass is anaerobically digested. Methane production increases of
5-25% have been reported (Delgenes et al., 2002). No production of inhibitors, such
as furfural and hydroxymethylfurfural (HMF) are produced during milling, making it
suitable for subsequent methane and ethanol production. However, milling requires
a high energy input (Cowling and Kirk, 1976; Ramos, 2003) and therefore was
determined not to be economically feasible as a pretreatment method for large scale
operations (Fan et al., 1987).
Enzymatic Digestion of Pretreated Biomass
The following characteristics have been identified as key desirable traits for
cellulolytic systems for processing cellulosic biomass that has undergone a
pretreatment process:
1) The cellulolytic enzymes system should be effective against crystalline
cellulose. Cellulose crystallinity does not decrease as a result of pretreatment of

33
biomass by dilute acid (Grethelein 1985; Knappert et al., 1981; Thompson et al.,
1992.), seam explosion (Puls et al., 1985), or lime (Chang and Holtzapple, 2000)
under conditions that result in high hydrolysis yields.
2) The cellulolytic system should remain metabolically active in the presence of
inhibitory compounds generated during pretreatment with minimal cost for
detoxification methods. Such compounds result from hydrolytic release of
compounds present in unpretreated biomass, such as organic acids, extractives, and
phenolics. Other inhibitory compounds are the result of reactions of carbohydrates
and other solubilized components to form degadation products, such as furfural and
hydroxymethyl furfural. Still other inhibitory compounds arise from corrosion,
resulting in the release of inorganic ions. The amounts of inhibitors produced
depend greatly on process conditions and configuration.
Process Engineering
Converting cellulosic biomass into fuels and chemicals comprises the
following process steps:
1) Cellulase system production
2) Hydrolysis of cellulose and other present insoluble polysaccharides
3) Fermentation of soluble cellulose hydrolysis products
4) Fermentation of soluble hemicellulose hydrolysis products
The above listed processes may be condensed into fewer individual steps.
For example, simultaneous saccharification and cofermentation (SSCF) involves two
process steps: cellulase production and a second step in which cellulose hydrolysis
and fermentation of both cellulose and hemicellulose hydrolysis products occurs. In

34
another example, consolidated bioprocessing (CBP), cellulase production, hydrolysis
and fermentation of products of both cellulose and hemicellulose hydrolysis are
accomplished in a single process step.
Summary and Problem Statement
In order to achieve low cost biochemical conversion of lignocellulosic
biomass to liquid biofuel, high initial concentrations of biomass must be used in
order to reduce high downstream processing costs associated with dilute solutions.
Further, the recalcitrance of the biomass must be overcome by developing
pretreatment processes that are minimally energy intensive and that use reagents
that are both environmentally safe and of relatively low cost.
Economic analyses performed at the National Renewable Energy Laboratory
(NREL) suggest that increasing total solids concentration in enzymatic digestion
step of the biochemical lignocellulose conversion process from 20% to 30% would
result in a 10% decrease in the ethanol production cost. By starting with a high
concentration of solid substrate, a higher concentration of sugars can be achieved
after enzymatic digestion. Subsequent fermentation of these concentrated sugar
streams would produce higher ethanol concentrations in the process stream that
would ultimately result in improved process economics due to lower product
purification costs.
The cost of downstream processing is a significant cost sink of the
lignocellulose conversion process. Other cost sinks include the high cost of
equipment and energy input costs. Higher substrate concentrations imply lower
process equipment volumes and will therefore lead to the reduction of equipment
and energy input costs.
35
A wealth of research has focused on the characterization of cellulase activity
in the hydrolysis of cellulose to monomeric sugars. However, most of these studies
have been performed at low solid concentrations to avoid confounding mass
transfer or product inhibition effects. While these studies provide valuable and
fundamental insights into the biochemical mechanisms of cellulase systems under
ideal reaction conditions, they provide only limited understanding of lignocellulose
degradation under process-relevant conditions. Only a few studies have reported
enzymatic digestibility results at high solid concentrations (up to 40% w/w);
however, none has sought to characterize the kinetics of the process to develop
predictive mathematical models.
Project Goal
The goal of the current project is to develop an understanding of the effect of
high solids concentrations on enzymatic digestion of lignocellulosic biomass
material. Further, the goal of this work is to elucidate optimal pretreatment
conditions for lignocellulosic biomass using an alkaline-peroxide pretreatment
strategies. Specifically, this study focused on identifying optimal pretreatment levels
of H2O2, optimal pretreatment duration, and optimal pretreatment temperatures.
Once optimal pretreatment conditions had been identified, the effect of
lignocellulose biomass composition on pretreatment efficacy was determined.

36
Research Design and Methods:
1. Development of Sugar Standards Using a DNS Assay
Sugar standards were determined using the Dinitrosalicylic Acid Reagent
Assay (DNS), as developed by Miller (1959). The standard curves generated using
the DNS assay were used to determine the amount of reducing sugars liberated in
reaction mixtures. Sugar standards were made for Glucose, Xylose and Arabinose.
This assay was used to determine the concentration of reducing sugars that were
released from lignocellulosic biomass after pretreatment and subsequent enzymatic
saccharification in the following experiments.
2. Effect of High Solids Concentration on Enzymatic Digestibility
Inhibition of enzymatic digestion rates and yields were quantified in the
presence of added background sugars. This was done in order to account for
potential compounding inhibition and rate determining factors, such as a change in
physical substrate characteristics during treatment.
Kinetic experiments were performed at solid concentrations between 2-40%
(w/w) using freeze-dried, dilute-acid pretreated corn stover. The corn-stover was
obtained from the National Renewable Energy Laboratory (NREL). A commercial

37
cellulase mix, Spezyme CP was used as the source of enzymes for enzymatic
digestion of the pretreated biomass. The Spezyme CP, which is sold by Genecor
International (Copenhagen, Denmark), was supplemented by Novo188, B-
glucosidase, sold by Novozymes Ltd. (Basvaerd, Germany).
Digestions using the commercial enzymes were performed in sealed 100mL
bottles containing a total mass of 30g (solid substrate + liquid enzyme solution). The
following two enzyme loadings were used: 1) A low-loading of 25mg/g cellulose, as
recommended by the standard NREL protocol (Brown and Torget, 1996), and 2) a
high loading of 100mg/g cellulose to provide enough cellulase to enable more
complete digestion. A glucosidase concentration of 90mg/g cellulose was used in
both cases (Selig et al., 2007). Tetracyline and cyclohexamide was added to inhibit
microbial growth and maintain sterile conditions. Enzyme solutions were prepared
in 200mM citrate buffer at pH 5 and reactions were incubated at 60 degrees C.
Soluble sugars were separated via HPLC and analyzed using a refractive
index detector. The HPLC was run using a Shodex SP0810 sugar column, with an
injection volume of 20 uL, at a flow rate of 0.6 mL/min and at 80 degrees C for 35
minutes. Triplicate experiments were performed in each case. Standard deviations
and 95% confidence intervals of mean measured values were calculated.
3. Pretreatment Optimization Experiments
a. Optimal H202

38
Milled wheat straw was slurried in water (8.6% w/v, unless otherwise
indicated) with varied amounts of H2O2 in 15 mL centrifuge tubes. The following
levels of H2O2 were tested: 0%, 1.0%, 2.0%, 3.0%, 5.0%, 7.0%, and 9.0% (v/v). The
pH was then adjusted to 11.5 using NaOH. The samples were placed in a shaking
incubator at 250 rpm at 35 degrees C for 24 hours to allow extensive pretreatment.
After pretreatment, the pH was adjusted to 5.0 using HCl. Enzymatic saccharification
was then performed at 45 degrees C at 4ml/g biomass for 120 hours. The resulting
soluble sugars were separated via HPLC and analyzed using a refractive index
detector.
b. Optimal Pretreatment Duration
Milled wheat straw was slurried in water (8.6% w/v) containing H2O2 (3%
v/v) and adjusted to pH 11.5 using NaOH and shaken in an incubator at 250 rpm at
35 degrees C for the following time intervals: 3 hours, 6 hours, 9 hours, 12 hours, 15
hours, 18 hours and 24 hours. After pretreatment, the pH was adjusted to 5.0 using
HCl. Enzyme saccharification was then performed at 45 degrees C at 4ml/g biomass
for 120 hours. The resulting soluble sugars were separated via HPLC and analyzed
using a refractive index detector.
c. Optimal Pretreatment Temperature
Milled wheat straw was slurried in water (8.6% w/v) containing H2O2 (3%
v/v) and adjusted to pH 11.5 using NaOH and shaken in an incubator at 250 rpm for
18 hours at the following temperatures: 18 degrees C, 25 degrees C, 35 degrees C
and 40 degrees C. After pretreatment, the pH was adjusted to 5.0 using HCl. Enzyme

39
saccharification was then performed at 45 degrees C at 4 ml/g biomass for 120
hours. The resulting soluble sugars were separated via HPLC and analyzed using a
refractive index detector.
4. Determination of Structural Carbohydrates in Three Types of Biomass
The structural composition of three types of biomass was determined using
sections 10.1 and 10.4 the NREL standard Laboratory Analytical Procedure (LAP),
titled “Determination of Structural Carbohydrates and Lignin in Biomass”, issued
April 25, 2008. The following types of lignocellulosic biomass were analyzed: Tall
Wheat Grass, Intermediate Wheat Grass and Basin Wild Rye. The samples that were
analyzed were obtained from Dr. Sridhar Viamajala. The samples were collected in
the early summer months.
Tall wheatgrass is difficult to cultivate in saline environments due to high
concentrations of salts and heavy metals, as well as potentially high emission levels
of nitrous and sulfuric oxides. It is a tall, long- lived perennial bunchgrass reaching 1
to 3 m tall. If is found throughout all western states of the U.S and most Canadian
provinces (USDA Conservation Plant Report, 2011).
Intermediate Wheatgrass is a cool-season perennial sod forming grass. It
grows to a height of 23-47 inches. Typical growth season for intermediate
wheatgrass extends between mid-April through September. It is projected to

40
perform well in the Central Great Plains, Upper Midwest and parts of the
Intermountain West (USDA Conservation Plant Report, 2011).
Basin wildrye is found throughout the western United States and Canada. It is
a large, coarse and robust perennial bunchgrass. It is a long-lived, cool-season
native. Clumps of Basin wildrye may stand 3 to 6 feet all (USDA Conservation Plant
Report, 2011).
5. Determination of Structural Composition of Biomass on Pretreatment Efficacy
The three types of biomass that were analyzed for structural composition
were subjected to alkaline peroxide pretreatment under the conditions that were
determined to be “optimal” for milled wheat straw. Each biomass was slurried in
water containing H2O2 (4%) for 18 hours at 35 degrees C in 15 mL centrifuge tubes.
During pretreatment, the pH was adjusted to 11.5 using NaOH. After pretreatment,
the pH was adjusted to 5.0 using HCL. Enzyme saccharification was then performed
at 45 degrees C at 4mL/g biomass for 120 hours. The resulting soluble sugars were
separated via HPLC and analyzed using a refractive index detector.
Results
1. Effect of High Solids Concentration on Enzymatic Digestibility
Referring to Figures 1a and 1b, a five-day digestibility study to elucidate the
relationship between solids concentration and digestibility of pretreated corn-
stover indicates that as solids concentration is increased, overall digestibility of the
biomass decreases. Figure 1a indicates that as the solids concentration, represented

41
Figure 1: 5-day enzymatic digestibility data for pretreated corn stover showing (a) decrease in conversion with increasing solids concentration and (b) Plateau in glucose release after a solids concentration of 30%.
a)
b)
as the insoluble solid fraction increases from 215% to 40%, the amount of biomass
converted decreases substantially. Further, as indicated by the results shown in
Figure 1b, the amount of glucose released per unit of biomass plateaus after a solids
concentration of 30%.

42
2. Pretreatment Optimization Experiments
a. Optimal H2O2
Referring to Figure 2, the effect of H2O2 level (0-10%, v/v) for the
pretreatment of milled wheat straw is shown. An optimal level of 3% H2O2 (v/v)
was demonstrated, as indicated by the maximal sugar release that was
demonstrated after enzymatic hydrolysis of the pretreated biomass. Sugar release
did not increase significantly after 3% H2O2 (v/v), and in fact, showed a slight
decrease, indicating perhaps increased toxicity or release of inhibitory compounds
that effect the cellulolytic enzymes at higher levels of H2O2 pretreatment.
Figure 2. Effect of H2O2 level on digestibility of corn-stover. Sugar production did not
increase significantly after an H202 level of 3.0%.
0
100
200
300
400
500
600
0 1 2 3 5 7 9
Re
du
cin
g S
ug
ar
(mg
/g
Wh
ea
t S
tra
w)
H2O2 (%, v/v)
Glucose
Xylose
Arabinose
Total Sugars

b. Optimal Pretreatment Duration
AAs shown in Figure 3, an increase in formation of total sugars of 29
mg/g of straw was observed
at 3% H2O2. It has been reported that the reaction is sufficiently completed within
24 hours, however, some studies have reported that sugar yields increase slightly
up to 120 hours, after which there is no more increase in sugar concentration. This
indicates that there is a long incubation time
sugar yield under the conditions used. Table 2 provides the released sugar values
and statistical range.
Figure 3. Effect of pretreatment duration on digestibility of cornreleased increased substantially between 3 and 24 hours. Studies have indicated that sugar release continues to occur up to 120 hours of pretreatment. Significant increasehowever, did not occur between 18 hours and 24 hours.
Table 2. Amount of reducing sugars released after different pretreatment durations
0
50
100
150
200
250
300
350
400
450
500
3 6
Re
du
cin
g S
ug
ar
(mg
/g
Wh
ea
t S
tra
w)
43
Optimal Pretreatment Duration
Figure 3, an increase in formation of total sugars of 29
observed by increasing the pretreatment time from 3 to 24 hours
reported that the reaction is sufficiently completed within
24 hours, however, some studies have reported that sugar yields increase slightly
ch there is no more increase in sugar concentration. This
indicates that there is a long incubation time is required for obtaining maximum
sugar yield under the conditions used. Table 2 provides the released sugar values
Effect of pretreatment duration on digestibility of corn-stover. The amount of sugar ly between 3 and 24 hours. Studies have indicated that sugar release
continues to occur up to 120 hours of pretreatment. Significant increases in sugar production, however, did not occur between 18 hours and 24 hours.
. Amount of reducing sugars released after different pretreatment durations
9 12 15 18 24
Time (hour)
Figure 3, an increase in formation of total sugars of 29 ± 4
t time from 3 to 24 hours
reported that the reaction is sufficiently completed within
24 hours, however, some studies have reported that sugar yields increase slightly
ch there is no more increase in sugar concentration. This
is required for obtaining maximum
sugar yield under the conditions used. Table 2 provides the released sugar values
stover. The amount of sugar ly between 3 and 24 hours. Studies have indicated that sugar release
s in sugar production,
Arabinose
Xylose
Glucose

44
Time Glucose Xylose Arabinose
3 250 ± 8.5 151 ± 4.9 15 ± 0.9 6 248 ± 8.4 150 ± 5.1 16 ± 0.8
9 250 ± 8.4 154 ± 3.4 16 ± 0.9
12 254 ± 8.9 155 ± 6.2 16 ± 1.0
15 255 ± 8.4 155 ± 5.2 17 ± 0.8
18 265 ± 6.1 157 ± 5.2 18 ± 1.3
24 265 ± 6.8 160 ± 5.1 20 ± 1.5
c. Optimal Pretreatment Temperature
Referring to Figure 4, an increase in soluble sugar release of 34 mg/g of
wheat straw was observed in samples digested at 18 degrees C and samples
digested at 40 degrees C for 18 hours at 3% H2O2. There was not a significant
difference, however, between sugar yields at 35 degrees C and 40 degrees C.

Figure 4. Effect of temperature during alkalinesignificant increase in sugar production was observed between 35 and 40 degrees C. A increase was seen, however, between 18 degrees C and 35 degree
Table 3. Reducing sugar release after pretreatment at various temperatures, after enzymatic saccharification.
Temp
(Degrees C)
Glucose
18 248
25 257
35 268
40 267
0
50
100
150
200
250
300
350
400
450
500
18
Re
du
cin
g S
ug
ar
(mg
/g
Wh
ea
t S
tra
w)
Temperature (Degrees Celsius)
45
. Effect of temperature during alkaline-peroxide on digestibility of corn-stover. No significant increase in sugar production was observed between 35 and 40 degrees C. A increase was seen, however, between 18 degrees C and 35 degrees C.
. Reducing sugar release after pretreatment at various temperatures, after
Glucose Xylose Arabinose
248 ± 5.7 145 ± 5.8 13 ± 1
257 ± 5.2 154 ± 3.1 15 ± 1
268 ± 4.3 159 ± 2.1 15 ± 1
267 ± 4.4 158 ± 2.3 15 ± 1
25 35 40
Temperature (Degrees Celsius)
stover. No
significant increase in sugar production was observed between 35 and 40 degrees C. A substantial
. Reducing sugar release after pretreatment at various temperatures, after
Arabinose
1
1
1
1
Arabinose
Xylose
Glucose

46
Preliminary Results for Determination of Structural Components in Three Types of
Biomass
3. Determination of Structural Carbohydrates in Three Types of Biomass
Referring to Table 4, the structural composition of three different biomass
samples was determined. Biomass composition, particularly of perennial grasses
that are found in the plain and northern states in the US, is known to change in
response to seasonal changes (Nyren et al. 2008). Generally, perennial grasses
become higher in cellulose during late summer and fall months. Surrounding
ecology (i.e. various plant and environmental interactions) is also known to change
the structural composition of different perennial grasses.
Of the samples that were analyzed, Tall Wheat Grass exhibited the highest
percentage of cellulose, wherein the Basin Wild Rye exhibited the lowest percentage
of cellulose.
Table 4. Structural Composition of 3 perennial grasses
Biomass Cellulose % Hemicellulose %
Tall Wheat Grass 35.2 ± 3.4 22.1 ± 2.7
Intermediate Wheat
Grass 31.5 ± 3.2 26.7 ± 2.5
Basin Wild Rye 25.2 ± 2.9 16.8 ± 1.8
4. Determination of Structural Composition of Biomass on Alkaline Peroxide
Pretreatment Efficacy

47
After determining the structural composition of the three different perennial
grasses, presented in Table 4, the three different grasses were pretreated and
subsequently subjected to enzymatic saccharification. The samples were slurried in
water containing H2O2 (4%) for 18 hours at 35 degrees C in 15 mL centrifuge tubes.
During pretreatment, the pH was adjusted to 11.5 using NaOH. After pretreatment,
the pH was adjusted to 5.0 using HCL. Enzyme saccharification was then performed
at 45 degrees C at 4mL/g biomass for 120 hours. The resulting soluble sugars were
separated via HPLC and analyzed using a refractive index detector.
As expected, the sample that had the highest cellulose content had the
highest sugar release. After pretreatment and subsequent enzyme saccharification,
Tall Wheatgrass released a total of 418 mg sugars/g grass. The sample that had the
lowest cellulose content had the lowest sugar release. After pretreatment and
subsequent enzyme saccharification, Basin Wildrye released 370 mg sugars/g grass.

Figure 5. Three perennial grasses were pretreatment conditions that were determined to be optimal in the optimization experiments. As expected, Tall Wheatgrass, which has the highest composition of cellulose, had the highest level of digestibility as indicated by the highest level of sugar release.
Table 5. Reducing Sugars released from various biomass types after pretreatment and enzymatic saccharification
Biomass
Type
Glucose
Tall Wheatgrass
218
Intermediate Wheatgrass
202
Basin Wild Rye
187
0
50
100
150
200
250
300
350
400
450
Tall Wheatgrass
Re
du
cin
g S
ug
ars
(m
g/
g S
ub
stra
te)
48
. Three perennial grasses were subjected to alkaline peroxide pretreatment under the pretreatment conditions that were determined to be optimal in the optimization experiments. As expected, Tall Wheatgrass, which has the highest composition of cellulose, had the highest level of
bility as indicated by the highest level of sugar release.
Reducing Sugars released from various biomass types after pretreatment and
Glucose Xylose Arabinose
218 ± 9.3 187 ± 6.5 13 ± 1
202 ± 7.9 185 ± 6.3 14 ± 1
187 ± 8.04 170 ± 5.9 13 ± 1
Tall Wheatgrass Intermediate Wheatgrass
Basin Wildrye
subjected to alkaline peroxide pretreatment under the
pretreatment conditions that were determined to be optimal in the optimization experiments. As expected, Tall Wheatgrass, which has the highest composition of cellulose, had the highest level of
Reducing Sugars released from various biomass types after pretreatment and
Arabinose
1
1
1
Arabinose
Xylose
Glucose

49
Discussion and Conclusion
The observed decrease of cellulose conversion to glucose as solids concentration
is increased suggests inhibition effects at higher concentrations. Further, the plateau
in sugar concentrations supports this hypothesis, suggesting that digestibilities are
lower as a result of highly accumulated sugar levels. Since this data was generated
by a single measurement at 5 days, it is possible that the digestions at lower solid
concentrations were more near completion while at higher solid concentrations,
digestions were farther from completion due to slower kinetics.
Further, it is not known if the observed inhibition was due to products directly
inhibiting cellulases by interacting with the active site, or if secondary effects such
as lowering of water activity or increase in ionic strength caused inhibition.
Lack of “available” water can alter enzyme activity and/or binding due to altered
hydration of enzymes leading to poor digestion (Fervais et al., 1988; Yang et al.,
2004). High ionic strength of the solution from sugar accumulation can alter protein
structure and/or function, again resulting in lower enzyme activity (Kim and Hong,
2000). Mass transfer limitations may arise due to challenging slurry rheology, i.e.
insufficient free water can limit transport of products from the site of enzymatic
action, leading to localized accumulation of product sugars that can exacerbate any
product inhibition effects.
The digestibility of lignocellulosic material may be enhanced by pretreatment
methods that reduce or remove lignin from biomass surfaces, thus exposing the
more easily digestible cellulose and hemicellulose components to enzymatic action.
50
Pretreatment optimization experiments indicated that for corn-stover feedstock,
optimal pretreatment occurs at 35 degrees C and at 3% H202. Subsequent
pretreatment studies were carried out for 18 hours, even though sugar release has
been shown to occur up to 120 hours. Sugar release greatly slowed down at 18
hours. Thus to increase process efficiency and to reduce process costs, a shortened
pretreatment duration is desirable.
Alternative lignocellulosic biomass feedstocks were also studied. Specifically,
perennial grasses were considered as alternative to traditional corn-stover in order
to mitigate the conflict between food and fuel sources. Tall Wheatgrass,
Intermediate Wheatgrass and Basin Wild Rye were selected, and were analyzed for
structural composition. Specifically, the grasses were analyzed for their cellulose
and hemicellulose content. Tall Wheatgrass was shown to have the highest
percentage of cellulose, while Basin Wild Rye was shown to have the lowest
percentage of cellulose. When these grasses were subjected to alkaline peroxide
pretreatment and subsequent enzyme saccharification, the sample with the highest
cellulose content yielded the most reducing sugars, as expected. None of the
perennial grass samples, however, yielded the amount of sugar that was released by
corn-stover after alkaline peroxide pretreatment and saccharification.
Future Work
Kinetic and yield data should be developed for enzymatic cellulose digestions
at high solids digestion concentration. The following additional control experiments
should also be performed:

51
1) Digestions of commercially available purified microcrystalline cellulose (avicel,
Sigma Aldrich, St. Louis, MO) to determine the digestibility of cellulose in the
absence of lignin.
2) Enzyme and substrate-free reactions
3) Reactions supplemented with initial glucose at concentrations of 50, 100, 150 and
200 mg/L to independently observe inhibition of reaction rate in the presence of
glucose.
Additionally, studies on enzyme activities of a purified exo-glucanase (CBH1) should
also be performed at high solid and product concentrations to elucidate enzyme-
specific inhibition. Water activity and ionic strength should be monitored during
digestion studies to quantify changes in these parameters.
The pretreatment optimization experiments for alkaline peroxide
pretreatment should be repeated using a variety of biomass feedstocks in order to
determine a relationship between feedstock composition and pretreatment
condition optimization.
Biomass composition of perennial wheatgrasses should be conducted on
samples that were collected over a range of seasons and in a variety of
environments. Further quality control experiments should include the development
of calibration verification standards, and lignin structural composition should be
determined using the NREL LAP entitled “Determination of Structural
Carbohydrates and Lignin in Biomass”, sections 10.2 and 10.3.

52
Literature Review
Alizadeh, H., Teymouri, F., Gilbert, T.I., Dale, B.E. 2005. Pretreatment of switchgrass by ammonia fiber explosion (AFEX). Appl. Biochem. Biotechnol., 1133-1141.
Aoyagi, H., Uemura, O., Takebe, H., Tanaka, H. 1995. Estimation of microbial cell concentration in suspension culture by the osmotic pressure measurement of culture broth. Biotechnol. Tech. 9: 429-434.
Atalla, R.H., Hackney, J.M., Uhlin, I., Thompson, N.S. 1993. Hemicelluloses as structure regulators in the aggregation of native cellulose. Int. J. Biol. Macromol. 15: 109-112.
Beall, F.C., Eickner, H.W. 1970. Thermal degradation of wood components: a review of the Literature. U.S.D.A Forest service, research paper FPL 130.
Benjamin, M.M., Woods, S.L., Ferguson, J.F. 1984. Anaerobic toxicity and biodegradability of pulp mill waste consituents. Water Res. 18: 601-607.
Blouin, F.A., Martin, L.F., Rowland, S.P. 1970. Gel permeation properties of cellulose. III. Measurement of pore structure of unmodified and of mercerized cottons in fibrous form. Textile Re. J. 40: 809-813.
Bobleter, O. 1994. Hydrothermal degradation of polymers derived from plants. Prog. Polym. Sci. 19: 797-841.
Bobleter, O., Bonn, G., Prutsch, W. 1991. Steam explosion-hydrothermolysis-organolsolv. A comparison. In Focher, B., Marzetti, A., Crerscenzi, V. (Eds.) Steam explosion techniques. Gordon and Breach, Philadelphia, pp. 59-82.
Brownell, H.H., Saddler, J.N. 1987. Steam pretreatment of lignocellulosic material for enhanced enzymatic hydrolysis. Biotechnol. Bioeng. 29: 228-235.
Brownell, H.H., Yu, E.K.C., Saddler, J.N. 1986. Steam=explosion pretreatment of wood: effect of chip size, acid, moisture content and pressure drop. Biotechnol. Bioeng. 28: 792-801.
Brown, D.E., and M.A. Zainudeen. 1977. Growth kinetics and cellulase biosynthesis in continuous culture of Trichoderma viride. Biotechnol. Bio-eng. 14: 941-958.
Brown, L., Torget, R. 1996. Enzymatic Saccharification of Lignocellulosic Biomass. Laboratory Analytical Procedure #009. National Renewable Energy Laboratory, Golden, CO.
Chang, V.S., Holtzapple, M.T. 2000. Fundamental factors affecting enzymatic reactivity. Appl. Biochem. Biotechnol., 5-37.

53
Chang, V.S., Kaaar, W.E., Burr, B., Holtzapple, M.T. 2001. Simultaneous saccharification and fermentation of lime-treated biomass. Biotechnol. Lett. 23: 1327-1333.
Chen, H.Z., Hayn, M., Esterbauer, H. 1992. Purification and characterization of two extracellular B-glucosidases from Trichoderma reesei. Biochem. Biophys. Acta 1121: 54-60.
Converse, A.O. 1993. Substrate factors limiting enzymatic hydrolysis, p. 93-106. In
J.N. Saddler (ed.) Bioconversion of forest and agricultural plant residues. CAB International, Wallinford, Conn.
Cowling, E.B. 1975. Physical and chemical constraints in the hydrolysis of cellulose and lignocellulosic materials. Biotechnol. Bioeng. Symp. 5: 163-181.
Cowling, E.B., Kirk, T.K. 1976. Properties of cellulose and lignocellulosic materials as substrates for enzymatic conversion process. Biotechnol. Bioeng. Symp. 6: 95-123.
Delgenes, J.P., Penaud, V., Moletta, R. 2002. Pretreatments for the enhancement of anaerotic digestion of solid wastes Chapter 8. In Biomethanization of the Organic Fraction of Municipal Solid Wastes. IWA Publishing, pp. 201-228.
Domansky, R., Rendos, F. 1962. On the pyrolysis of wood and its components. Holz Roh Werkst. 29: 473-476.
Donaldson, L.A., Wong, K.K.Y., Mackie, K.L. 1988. Ultrastrucutre of steam-exploded wood. Wood Sci. Technol. 22: 103-114.
Fan, L.T., Gharpuray, M.M., Lee, Y.H. 1987. Cellulose hydrolysis. Springer-Verlag, Berlin, Germany.
Fan, L.T., Lee, Y.G., and Beardmore, D.H. 1980. Mechanism of the enzymatic hydrolysis of cellulse: effects of major structural features of cellulse on enzymatic hydrolysis. Biotecnol. Bioegn. 22: 177-199.
Fan, L.T., Lee, Y.H., Beardmore, D.H. 1980. Major chemical and physical features of cellulose materials as substrates for enzymatic hydrolysis. Adv. Biochem. Eng. 14: 101-117.
Fengel, D., Wegener, G. 1984. Chemical composition and analysis of wood. In
Wood: Chemistry, Ultrastructure, Reactions. Walter de Gruyter, Berlin. 26-65.
Fox, M.H., Noike, T., Ohki, T. 2003. Alkaline subcritical-water treatment and alkaline heat treatment for the increase in biodegradability of newsprint waste. Water Sci. Technol. 48: 77-84.
Gama, F.M., Teixeira, J.A., Mota, M. 1994. Cellulose morphology and enzymatic reactivity: a modified solute exclusion technique. Biotechnol. Bioeng. 43: 381-387.

54
Gandi, J., Holtzapple, M.T., Ferrer, A., Byers, F.M., Turner, N.D., Nagwani, M.,
Change, S. 1997. Lime treatment of agricultural residues to improve rumen digestibility. Anim. Feed Sci. Technol. 68: 195-211.
Gervais, P. Bensoussan, M., GrajckW. 1988. Water activity and water content: comparative effects on the growth of Peniculium roqueforti on solid substrate. Applied Microbiology and Biotechnology. 27: 389-392
Gong, C.S., Ladisch, M.R., Tsao, G.T. 1977. Cellobiase from Trichoderma viride: purification, properties, kinetics, and mechanism. Biotechnol. Bioeng. 19: 959-981.
Gossett, J.M., Stuckey, D.C., Owen, W.F., McCarty, P.L. 1982. Heat treatment and anaerobic digestion of refuse. J. Environ. Eng. Div. 108: 437-454.
Gould, D., Saddler, J.N. 1984. Alkaline peroxide delignification of agricultural residues to enhance enzymatic saccharification. Biotechnol. Bioeng. 26: 46-52.
Grabber, J.H. 2005. How do lignin composition, structure, and cross-linking affect degradability? A review of cell wall model studies. Crop Sci. 45: 820-831.
Gregg, D., Saddler, J.N. 1996. A techno-economic assessment of the pretreatment and fractionation steps of a biomass-to-ethanol process. Appl. Biochem. Biotechnol. 711-727.
Grethelein, H.E. 1985. The effect of pore size distribution on the rate of enzymatic hydrolysis of cellulosic substrates. Bio/Technology 2: 155-160.
Hatfield, R.D., Ralph, J., Grabber, J.H. 1999. Cell wall structural foundation: molecular basis for improving forage digestibility. Crop Sci. 29: 27-37.
Hartmann, H., Angelidaki, I., Ahring, B.K. 1999. Increase of anaerobic degradation of particulate organic matter in full-scale biogas plants by mechanical maceration. In
Mata-Alvarez, J., Tilche, A., Cecchi, F. (Eds). Proceedings of the Second International Symposium on Anaerobic Digestion of Solid Wastes. Barcelona vol. 1, pp 129-136.
Hinman, N.D., J Schell, C.J. Riley, P.W Bergeron, and P.J. Walter. 1992. Preliminary estimate of the cost of ethanol production for SSF technology. Appl. Biochem. Biotechnol. 34-35: 639-649.
Hon, D.N.S., Shiraishi, N. 2001. Wood and Cellulosic Chemistry, second ed. Dekker, New York.
Kaar, W.E., Holtzapple, M.T. 2000. Using lime pretreatment to facilitate the enzymatic hydrolysis of corn stover. Biomass Bioenergy 18: 189-199.
Kim, T.H., Lee, Y.Y. 2005. Pretreatment of corn stover by soakin in aqueous ammonia. Appl. Biochem. Biotechnol., 1119-1132.
Kleywegt, G.J., Zou, J.Y., Civne, C., Davies, G.J., Sinning, I., Stahlberg, J.,
Reinikainen, T., Srisodsuck, M., Teeri, T.T., Jones, T.A. 1997. The crystal

55
structure of the catalytic core domain of endoglucanases I from Trichoderma reesei at 3.6 A resolution, and a comparison with related enzymes. J. Mol. Biol. 272: 383-397.
Knappert, D.R., Grethlein, H.E., Converse, A.O. 1981. Partial acid hydrolysis of poplar wood as a pretreatment for enzymatic hydrolysis. Biotechnol. Bioeng. Symp. Ser. 11: 66-77.
Kohlmann, K.L., Westgate, P.J., Sarikaya, A., Velayudhan, A., Weil, J.,
Hendrickson, R., Ladisch, M.R. 1995. Enhanced enzyme activities on hydrated lignocellulosic substrates. BTEC paper 127. In 207th American Chemical Society National Meeting, ACS Symposium series No. 618. Enzymatic Degradation of Insoluble Carbohydrates, pp. 237-255.
Laser, M., Schulman, D., Allen, S.G., Lichwa, J., Antal Jr, M.J., Lynd, L.R. 2002. A comparison of liquid hot water and steam pretreatments of sugar cane bagasse for bioconversion to ethanol. Bioresour. Technol. 81: 33-44.
Lawther, J.M., Sun, R., Banks, W.B. 1996. Effect of steam treatment on the chemical composition of wheat straw. Holzforschung 50: 365-371.
Lee, Lynd R., Weimer, Paul J., van Zyl, William H., Preorius, Isak S. 2002. Microbial Cellulose Utilization: Fundamentals and Biotechnology. Microbiology and Molecular Biology Reviews. 3: 506-577.
Liu, C., Wyman, C.E. 2003. The effect of flow rate of compressed hot water on xylan, lignin and total mass removal from corn stover. Ind. Eng. Chem. Res. 42: 5409-5416.
Lynd, L.R. 1989. Ethanol production from lignoce3llulosic substrates using thermophilic bacteria: critical evaluation of potential and review, Adv. Biochem. Eng. Biotechnol. 38: 1-52.
Lynd, L.R., C.E. Wyman, and T.U. Gerngross. 1999. Biocommodity engineering. Biotechnol. Prog. 15: 777-7693.
Maguire, R.J. 1977. Kinetics of the hydrolysis of cellobiose and p-nitro-phenyl-B-D-glucoside by cellobiase of Trichoderma viride. Can. J. Biochem. 55: 19-26.
Mandels, M., Weber, J. 1957. Induction of cellulase in Trichoderma viride as influenced by carbon sources and metals. J. Bacteriol. 73: 269-278.
Marchessault, R.H., and P.R. Sundararajan. 1957. Experimental evaluation of the lateral order distribution in cellulose. Text. Res. J. 27: 30-41.
Mok, W.S.L., Antal, M.J.A. 1992. Uncatalyzed solvolysis of whole biomass hemicellulose by hot compressed liquid water. Ind. Eng. Chem. Res. 31: 1157-1161.

56
Mosier, N., Hendrickson, R., Ho, N., Sedlak, M., Ladisch, M.R. 2005. Optimization of pH controlled liquid hot water pretreatment of corn stover. Bioresour. Technol. 96: 1986-1993.
Palmowski, L., Muller, J. 1999. Influence of the size reduction of organic waste on their anaerobic digestion. In II International Symposium on Anaerobic Digestion of Solid Waste. Barcelona 15-17 June, pp. 137-144.
Puls, J., Poutanen, K., Korner, H.U., Viikari, L. 1985. Biotechnoligcal utilization of wood carbohydrates after steamin pretreatment. Appl. Microbiol. Biotechnol. 22: 416-423.
Puri, V.P., Mamers, H., 1983. Explosive pretreatment of lignocellulosic residues with high-pressure carbon dioxide for the production of fermentation substrates. Biotechnol. Bioeng. 25: 3149-3161.
Ramos, L.P. 2003. The chemistry involved in the steam treatment of lignocellulosic materials. Quim. Nova. 26: 863-871.
Reczey, L., Brumbauer, A., Bollok, M., Szengyel, Z., Zacchi, G. 1998. Use of hemicellulose hydrolysate for B-glucosidase fermentation. Appl. Biochem. Biotechnol. 70-72: 225-235.
Reese, E.T. 1956. A microbiological process report: enzymatic hydrolysis of cellulose. Appl. Microbiol. 4: 39-45.
Reese, E.T., Mandels, M. 1971. Enzymatic degradation. P. 1079-1094 In N.M. Bikales and L. Segal (ed.), Cellulose and cellulose derivatives. Wiley Interscience, New York, N.Y.
Reese, E.T., Sui, R.G.H., Levnison, H.S. 1950. The biological degradation of soluble cellulose derivatives and its relationship to the mechanism of cellulose hydrolysis. J. Bacteriol. 59: 485-497.
Selig, M.M., Viamajala, S., Decker, S.R., Tucker, M.P., Himmel, M.E., Vinzant, T.B. 2007. Deposition of Lignin Droplets Produced During Dilute Acid Pretreatment of Maize Stems Retards Enzymatic Hydrolysis of Cellulose. Biotechnology Progress. 23: 1333-1339.
Shevchenko, S.M., Beatson, R.P., Saddler, J.N. 1999. The nature of lignin from steam explosion/enzymatic hydrolysis of softwood. Appl. Biochem. Biotechnol. 867-876.
Tanahashi, M., Takada, S., Aoki, T., Goto, T., Higuchi, T., Hanai, S. 1983. Characterization of explosion wood. 1. Structure and physical properties. Wood Res. 69: 36-51.
Teeri, T. T. 1997. Crystalline cellulose degradation: new insight into the function of cellobiohydrolases. Trends Biotechnol. 15:160-178.

57
Teeri, T.A., Koivula, A., Linder, M., Wohlfarht, G., Divne, C., and Jones, T.A. 1998. Trichoderma reesei cellobiohydrolases: why so efficient on crystalline cellulose? Biochem. Soc. Trans. 26: 173-178.
Teixeira, L.C., Linden, J.C., Schroeder, H.A. 1999. Alkaline and peracetic acid pretreatments of biomass for ethanol production. Appl. Biochem. Biotechnol., 19-34.
Thompson, D.N., Chen, H.C., Grethlein, H.E. 1992. Comparison of pretreatment methods on the basis of available surface area. Biores. Technol. 39: 155-163.
Usami, S., Kirimura, K., Imura, M., Morikawa, S. 1990. Cellular localization of the constitutive B-glucosidase in Trichoderma viride. J. Ferment. Bioeng. 70: 185-187.
Van Soest, P.J. 1994. Nutritional ecology of the ruminant, 2nd ed. Cornell University Press, Ithaca, N.Y.
Walker, L.P., Wilson, D.B., Irwin, D.C. 1990. Measuring fragmentation of cellulose by Thermomonospora fusca cellulase. Enzyme Microb. Technol. 12: 378-386.
Weil, J.R., Brewer, M., Hendrickson, R., Sarikaya, A., Ladisch, M.R. 1997. Continuous pH monitoring during pretreatment of yellow poplar wood sawdust by pressure cooking in water. Appl. Biochem. Biotechnol. 68: 21-40.
Weimer, P.J., Hacnkey, J.M., French, A.D. 1995. Effects of chemical treatments and heating on the crystallinity of celluloses and their implications for evaluating the effect of crystallinity on cellulose biodegradation. Biotechnol. Bioeng. 48: 169-178.
Weimer, P.J., Lopez-Guisa, J.M., French, A.D. 1990. Effect of cellulose fine structure on kinetics of its digestion by mixed ruminal microorganisms invitro. Appl. Environ. Microbiol. 56: 2421-2429.
Wood, T.T. 1992. Fungal cellulases. Biochem. Soc. Trans. 20: 46-53.
Wright, J.D. 1988. Ethanol from biomass by enzymatic hydrolysis. Chem. Eng. Pog. 84: 62-74.
Xiia, W., Clarkson, W.W. 1997. Acid solubilization of lignin and bioconversion of treated newsprint to methane. Biodegradation 8: 61-66.
Yang, K., Want, Y-J., and Juo, M.I. 2004. Effects of Substrate Pretreatment and Water Activity on Lipase-Catalyzed Cellulose Acetylation in Organic Media. Biotechnology Progress. 20: 1053-1061

58
Introduction
Anaerobic digestion has been the process most often used to stabilize
wastewaters and biosolids since the early 20th century. This process has also been
used to treat a wide variety of other types of biological wastes, such as brewery
wastewater, food waste, household waste, agricultural waste, petrochemical
wastewaters, and the organic portion of municipal solid wastes (Sheatley et al.,
1997; Bouallagui et al., 2005; Krzystek et al.,2001; Badawi et al., 1992; Britz et al.,
1988; and Bolzonella et al., 2005). Recently, the potential of microalgae as a source
of biofuels and as a feedstock for anaerobic digestion has been subjected to intense
academic and industrial research (Afi et al., 1996; Asinari et al., 1982; Chen 1987).
In systems that include the anaerobic digestion of algal biomass, solar energy
is transformed into cellular energy, which can subsequently be converted to the
chemical energy of methane through the anaerobic fermentation of algae by
bacteria. The resultant methane can either be burned in a gas-turbine-generator
system to produce electricity or, through catalytic processes, be converted to
hydrocarbon fuel.
Methanogenic anaerobic digestion of organic material in wastewater is
advantageous over aerobic active sludge systems because of its high organic
removal rates, low energy-input requirement, energy production (methane) and low
sludge production (Angenent et al.).
Additional fundamental benefits of anaerobic treatment include the following
(Thauer, 1998):
- Low cost technology

59
- Easy implementation
- High space loading rates
- Low space requirements of anaerobic digesters
- Low volume of excess sludge produced in anaerobic treatment
- High dewatering capacity
- Well stabilized excess sludge
- Useful byproducts such as ammonia can be recovered from the
process
There are, however, a number of challenges associated with anaerobic digestion
that need to be addressed in order to develop a strategy to successfully utilize the
technology as a method for treating municipal and industrial wastewater (Visser et
al., 1993; Stewart et al., 1984). These challenges include, but are not limited to the
following:
- Relatively high susceptibility of methanogens and acetogens to a variety of
xenobiotic compounds
- Presumed low stability of anaerobic treatment (susceptibility to digester
upsets)
- Slow “start-up” time of digester process
- Inaccessibility of plant material due to the recalcitrance of the cell wall
These challenges are most likely due to a general lack of understanding
concerning the fundamental microbial processes that drive anaerobic digestion.
Therefore, by investigating the properties of the microbial cohort that are
responsible for the transformation of biomass to methane through synergistic

60
processes, we can successfully address these challenges, making anaerobic digestion
of biosolids a promising and easily implemented technology for advanced waste-
water treatment.
Many studies have been conducted to develop possible methods to minimize or
eliminate the above-mentioned problems. Complexities within the microbiological
processes that occur during anaerobic digestion have been particularly investigated
(Zeikus, 1980; Richards et al., 1991; Pavlostathis et al., 1985).
Microbiological Processes of Anaerobic Digestion
The relative abundance of bacteria within a typical anaerobic digester is
often greater than 1016 cells/ml. Bacterial populations within an anaerobic digester
consists of saccharolytic bacteria, proteolytic bacteria, lipolytic bacteria, and
methanogens (Gerardi, 2003). The anaerobic bioconversion of complex organic
material to methane requires four major steps and five physiologically distinct
groups of microorganisms (Gerardi, 2003). The four major steps include hydrolysis,
acidogenesis, acetogenesis and methanogenesis. (Ahring, 2003; Bitton, 2005).
Anaerobic digestion occurs in the absence of free molecular oxygen, and therefore
relies on the ability of organisms to respire using an alternative electron acceptor
such as nitrate or sulfate. The absence of molecular oxygen suggests that the process
must occur in a highly reducing environment (i.e., an oxidation-reduction
environment of -200 to -400 mV).

The purpose of the first three microbial processes
acetogenesis) is to ferment complex organic molecules to acetate, CO
acetate, formate and H2, (Equation 1)
Equation 1:
1. Hydrolysis
In the first stage, large insoluble compounds (most likely cellulose,
hemicellulose, lipids and proteins) are hydrolyzed by bacterial enzymes, causing the
smaller organic subunits to become soluble and
involved in subsequent stages of digestion
typically carried out by extracellular enzymes. The kinetics o
dependent on several different parameters
production, and diffusion and adsorption of enzymes to particles.
an example of a hydrolysis reaction in which organic waste is broken down into a
simple sugar, in this case, glucose during hydrolysis
Equation 2: C6H10O4
Table 1 presents typical hydrolysis rates of various substrates during this
phase of anaerobic digestion.
61
The purpose of the first three microbial processes (hydrolysis, acidogenesis,
is to ferment complex organic molecules to acetate, CO2 and H
Equation 1):
In the first stage, large insoluble compounds (most likely cellulose,
s and proteins) are hydrolyzed by bacterial enzymes, causing the
smaller organic subunits to become soluble and bio-available to the organisms
subsequent stages of digestion (Kelleher et al., 2000). Hydrolysis is
carried out by extracellular enzymes. The kinetics of hydrolysis is
several different parameters, such as particle size, pH, enzyme
production, and diffusion and adsorption of enzymes to particles. Equation 2
an example of a hydrolysis reaction in which organic waste is broken down into a
simple sugar, in this case, glucose during hydrolysis (Ostrem, 2004).
4 +2H20 � C6H12O6 + 2H2
Table 1 presents typical hydrolysis rates of various substrates during this
phase of anaerobic digestion.
(hydrolysis, acidogenesis,
and H2, or to
In the first stage, large insoluble compounds (most likely cellulose,
s and proteins) are hydrolyzed by bacterial enzymes, causing the
available to the organisms
(Kelleher et al., 2000). Hydrolysis is
f hydrolysis is
pH, enzyme
Equation 2 shows
an example of a hydrolysis reaction in which organic waste is broken down into a
Table 1 presents typical hydrolysis rates of various substrates during this

62
Table. 1 Typical hydrolysis rates for various substrates during AD
Substrate Hydrolysis Rate, d-1 Reference
Carbohydrates 0.025-0.200 Christ et al., 2000 Cellulose 0.040-0.130 Gujer and Zehnder,
1983 Proteins 0.015-0.075 Christ et al., 2000
Lipids 0.005-0.010 Christ et al., 2000
2. Acidogenesis
During acidogenesis, which is also referred to as the fermentative step of
anaerobic digestion, dissolved organic matter is transformed mainly to volatile fatty
acids (VFAs) ketones, alcohols, hydrogen and carbon dioxide by a heterogenous
microbial population. The principal acidogenesis stage products are propionic acid
(CH3CH2COOH), butyric acid (CH3CH2CH2COOH), acetic acid (CH3COOH), formic acid
(HCOOH), lactic acid (C3H6O3), ethanol (C2H5OH) and methanol (CH3OH). The
hydrogen, carbon dioxide and acetic acid will be utilized directly by the
methanogenic bacterial in the final stage of anaerobic digestion, while the other
organic products will be subsequently subjected to the acetogenesis phase.
Equations 3-5 illustrated three typical acidogenesis reactions whereby glucose is
converted to ethanol, propionate and acetic acid, respectively:
Equation 3: C6H12O6 ↔ 2CH3CH2OH + 2CO2
Equation 4: C6H12O6 + 2H2 ↔ 2CH3CH2COOH + 2H2O
Equation 5: C6H12O6 → 3CH3COOH

63
Factors that have been shown to affect the fermentation process in an
anaerobic digester include interspecies hydrogen transfer, pH, hydraulic retention
time, and previous acclimation of the anaerobic culture (Gunaseelan, 1997).
3. Acetogenesis
During the third stage of anaerobic digestion, the residual products of
acidogenesis (i.e. the propionic acid, butyric acid and alcohols) are transformed by
acetogenic bacteria into hydrogen, carbon dioxide and acetic acid, which will be
subsequently utilized by the methanogenic bacteria. Hydrogen plays an important
intermediary role in this process. The reactions have been shown to occur only if the
partial pressure of hydrogen is low enough to thermodynamically allow the
conversion of all of the acids. The partial pressure is lowered due to hydrogen-
scavenging bacteria. Thus, the hydrogen concentration in a digester can be used as
an indicator of the health and stability of the digester conditions (Mata-Alvarez,
2003). Equation 6 illustrates the conversion of propionate to acetate, which is only
achievable at low hydrogen pressure.
Equation 6: CH3CH2COO- + 3H2O ↔ CH3COO- + H+ + HCO3- + 3H2
Equation 7 shows the tranformation of ethanol to acetate during the third stage of
fermenations (Ostrem, 2004).
Equation 7: CH3CH2OH + 2H2O ↔ CH3COO- + 2H2 +H+
4. Methanogenesis

Methanoarchaea include
reduction of the metabolites that were generated in the previous three steps
(hydrolysis, acidogenesis, acetogene
the kinetics specifically of the methanogenic bacteria. Due to the low energy yields
of their metabolic processes, they are generally extremely slow growing and require
a high level of substrate. Optimal opera
for satisfactory rates of solids conversion and methane production.
A. Methanogenic Pathway
The energy metabolism of methanogens can be addressed in two parts: an
“oxidative” set of reactions, in which coenzyme M
and coenzyme B (H-S-CoB, 7
heterodisulfide, and a “reductive” set of reactions, in which th
reduced:
The specific enzymes and reactions involved
primary substrates for methanogenesis are listed in the tables 2
64
Methanoarchaea include the diverse group of organisms that facilitate the
the metabolites that were generated in the previous three steps
(hydrolysis, acidogenesis, acetogenesis) to methane. It is important to understand
the kinetics specifically of the methanogenic bacteria. Due to the low energy yields
of their metabolic processes, they are generally extremely slow growing and require
a high level of substrate. Optimal operational conditions must then be maintained
for satisfactory rates of solids conversion and methane production.
A. Methanogenic Pathway
The energy metabolism of methanogens can be addressed in two parts: an
“oxidative” set of reactions, in which coenzyme M (H-S-CoM, 2-thioethanesulfonate)
CoB, 7-thioheptanoylthreonine-phosphate) are oxidized to a
heterodisulfide, and a “reductive” set of reactions, in which the heterodisulfide is re
The specific enzymes and reactions involved in the transformation of the three
primary substrates for methanogenesis are listed in the tables 2-4.
the diverse group of organisms that facilitate the
the metabolites that were generated in the previous three steps
It is important to understand
the kinetics specifically of the methanogenic bacteria. Due to the low energy yields
of their metabolic processes, they are generally extremely slow growing and require
tional conditions must then be maintained
The energy metabolism of methanogens can be addressed in two parts: an
thioethanesulfonate)
phosphate) are oxidized to a
e heterodisulfide is re-
in the transformation of the three

65
Table 2: Reactions and enzymes known to be involved in methane formation from acetate in the Methanocarcinales (Adapted from Thauer, 1998; Yang and Okos, 1987).
Reaction Enzyme
Acetate + CoA � Acetyl CoA + H2O
Acetate Kinase and phosphotransacetylase
Acetyl-CoA + H4SPT � CH3 H4SPT + CO2 + CoA + 2H
Carbon-monoxide dehydrogenase/acetyl CoA synthase
CH3-H4SPT + H-S-CoM � CH3-S-CoM + CH4
Methyl-H4SPT: Coenzyme M Mehtyltransferase
CH3-S-CoM + H-S-CoB�CoM-S-S-CoB + CH4
Methyl-coenzyme M reductase
CoM-S-S-CoB + 2H� H-S-CoM + H-S-CoB
Heterodisulphide reductase

66
Table 3: Reactions and enzymes known to be involved in methane formation from CO2 (Adapted from Thauer, 1998).
Reaction Enzyme
CO, + MFR + 2[H] � formyl-MFR
Formylmethanofuran dehydorgenase
Formyl-MFR + H,MPT � formyl-H,MPT + MFR
Formethylmethanofuran: H4MPT formyltransferase
Formyl-H,MPT + H+ � methenyl-H,MPT+ + H,O
Methenyl-H4MPT cyclohydrolase
Methenyl-H,MPT+ + F,,,H, � methylene-H,MPT + F420 + H+
F420-dependent methylene-H4MPT dehyrogenase
Methenyl-H,MPT+ + H,� methylene-H,MPT + H+
H2-forming methylene-HrMPT dehydrogenase
Methylene-H,MPT + F420H� CH,-H,MPT + F,20
F420-dependent methylene-H4MPT reductase
CH,-H,MPT + H-S-COM+� CH,-S-CoM + H,MPT
Methyl-H4MPT: coenzyme M methyl-trasferase
CH,-S-CoM + H-S-COB� COM-S-S-COB + CH,
Methyl coenzyme M reductase
COM-S-S-COB + 2[H]� H-S-COM + H-S-COB
Heterodisulphide reductase

67
Table 4: Reactions and enzymes known to be involved in methane and CO2 formation from methanol in Methanosarcina (Adapted from Thauer, 1998).
Reaction Enzyme
1. Methane Formation: H30H + H-S-CoM� CH3-S-CoM + H2O
Methanol: coenzyme M methyltransferase
CH3-S-CoM + H-S-CoB� CoM-S-S-CoB + CH4
Methyl-coenzyme M reductase
CoM-S-S-CoB + 2H� H-S-CoM + H-S CoB
Heterodisulphide reductase
2. CO2 Formation:
CH3-OH + H-S-CoM�CH3-S-CoM + H2O
Methanol: coenzyme M methyltransferase
CH3-S-CoM _ H4SPT�H-S-CoM +CH3-H4SPT
Methyl-H4SPT: coenzyme M methyltransferase
CH3OH + H4SPT�CH3-H$SPT + H2O
Enzyme not yet identified
CH3- H4SPT + F420�methylene- H4SPT + F420H2
F420 dependent methylene-H4SPT reductase
Methylene-H4 + F420 + H+� methenyl- H4SPT + F420H2
F420-dependent methylene-H4SPT dehydrogenase
Methenyl- H4SPT + H2O � formyl- H4SPT + H+
Methenyl-H4SPT cyclohydrolase
Formyl- H4SPT + MFR � formyl-MFR + H4SPT
Formylmethanofuran H4SPT formyltransferase
Formyl-MFR�CO2 + MFR + 2H Formylmethanofuran dehydrogenase

68
Reactions coupled to ATP Synthesis:
In the pathways described in Tables 2-4, a methyl group is transferred to
coenzyme M in the oxidative part of the energy metabolism. This process is coupled
with the build-up of an electrochemical sodium gradient. In turn, the reduction of
the heterodisulfide bond during the reduction process is coupled with electrogenic
hydrogen (H+) translocation. Methanogens have been shown to contain a Na+/H+
antiporter capable of interconversion of the electrochemical and H+ and Na+
potentials.
The stoichiometry of coupling methanogenesis with ADP phosphorylation
has appeared to be inconsistent and has been shown to be dependent on H2,
concentrations.
Methanogens, like many anaerobic bacteria and archaea, can use sulfur as a
terminal electron acceptor, but unlike other sulfur reducers, they can act
independent of an external sulfur source as electron acceptor since they can
reoxidize the “reduced sulfur” with CO2 or one of the other methanogenic carbon
substrates, which themselves are concomitantly reduced to methane.
B) Kinetics of Methanogenesis
Methane formation has been found to be associated with cell growth (Yang
and Okos, 1987). Kinetic models have been developed based on a number of
different initial substrates. A study by Borja et. al. resulted in a Michaelis-Menten
equation type for methane production (Equation 8):

Equation 8:
The following kinetic constants were obtained:
- Maximum rate of total volatile acids consumption:
Cod/l-day
- Saturation constant:
A study by Yang et al. (1987) s
on acetate during methanogenic grow
each mole of acetate consumed. They found a maximum specific growth rate of
0.022 hr -1 at acetic acid concentration
inhibition was found when
Evidence is available that during growth of methanogens on H
yield increases with decreasing H
concentrations, coupling of heterodisulfide reduction with ADP p
tighter than at high H2, concentrations (Thauer, 1998
C) Thermodynamics of Methanogenesis
In anaerobic freshwater sediments, plant material such as glucose from cellulo
in algae is completely decomposed to CO
Equation 9: Glucose � 3 CO
69
The following kinetic constants were obtained:
Maximum rate of total volatile acids consumption: k6= 3.6 +/- 0.2 g TVA
Saturation constant: k7= 3.1 +/- 0.2 g TVA-COD/liter.
A study by Yang et al. (1987) showed nearly equimolar methane production
nogenic growth, and about 1.94 g of cells were formed from
each mole of acetate consumed. They found a maximum specific growth rate of
at acetic acid concentrations around 7 g/L. Substantial substrate
inhibition was found when the acetate concentration was higher than 0.12 M.
Evidence is available that during growth of methanogens on H2, and CO2
yield increases with decreasing H2, concentrations, indicating that at low
concentrations, coupling of heterodisulfide reduction with ADP phosphorylation is
, concentrations (Thauer, 1998).
Thermodynamics of Methanogenesis
In anaerobic freshwater sediments, plant material such as glucose from cellulo
in algae is completely decomposed to CO2 and CH4 (Equation 9):
3 CO2 + 3CH4 ∆G°= -418.1 kJ/mol
0.2 g TVA-
howed nearly equimolar methane production
th, and about 1.94 g of cells were formed from
each mole of acetate consumed. They found a maximum specific growth rate of
substrate
acetate concentration was higher than 0.12 M.
2, the growth
indicating that at low H2,
hosphorylation is
In anaerobic freshwater sediments, plant material such as glucose from cellulose
418.1 kJ/mol

70
This reaction is the result of syntrophic associations of micro-organisms who
ferment the glucose first to i) acetate, CO2 and H2,, or to ii) acetate, formate and H2,
(Equations 10-11):
Equation 10: Glucose + 2H2O � 2CH3COO- + 2H+ + 2 CO2 + 4 H2, ∆G°= -215.7 kJ/mol Equation 11: Glucose + 2H2O � 2CH3COO- + 2HCOO- + 4H+ + 2 H2, ∆G°= -208.7 kJ/mol
The intermediates (acetate, formate, H2, and CO2) are then converted by
methanogens to CH4, CO2, and water (Equations 12-14):
Equation 12: Acetate: CH3COO- + H+ � CO2 + CH4 ∆G°= -36 kJ/mol
Equation 13: H2, and CO2: 4 H2, + CO2 � CH4 + H2O ∆G°= -131 kJ/mol
Equation 14: Formate: 4HCOO- + 4H+ � CH4 + 3 CO2 + H2O ∆G°= -144 kJ/mol
Tables 5-6 give the thermodynamic values associated with methane
production from acetate and CO2.
Table 5: Thermodynamic Values for methane formation from acetate
Reaction Thermodynamic Value
Acetate + CoA � Acetyl CoA + H2O
∆G°= + 35.7 kJ/mol
Acetyl-CoA + H4SPT � CH3H4SPT + CO2 + CoA + 2H
∆G°= 41.3 kJ/mol E’o= - 200mV
CH3-H4SPT + H-S-CoM � CH3-S-CoM + CH4
∆G°= - 30 kJ/mol
CH3-S-CoM + H-S-CoB�CoM-S-S-CoB + CH4
∆G°= -45 kJ/mol
CoM-S-S-CoB + 2H� H-S-CoM + H-S-CoB
∆G°= - 40 kJ/mol E’o= - 200mV
Table 6: Thermodynamic values for methane generation from CO2

71
Reaction Thermodynamic Value
CO, + MFR + 2[H] � formyl-MFR
∆G°= + 16 kJ/mol E’o= - 530 mV
Formyl-MFR + H,MPT � formyl-H,MPT + MFR
∆G°= - 4.4 kJ/mol
Formyl-H,MPT + H+ � methenyl-H,MPT+ + H,O
∆G°= - 4.6 kJ/mol
Methenyl-H,MPT+ + F,,,H, � methylene-H,MPT + F420 + H+
∆G°= + 5.5 kJ/mol
Methenyl-H,MPT+ + H,� methylene-H,MPT + H+
∆G°= -5.5 kJ/mol
Methylene-H,MPT + F420H� CH,-H,MPT + F,20
∆G°= -6.2 kJ/mol
CH,-H,MPT + H-S-COM+� CH,-S-CoM + H,MPT
∆G°= -30kJ/mol
CH,-S-CoM + H-S-COB� COM-S-S-COB + CH,
∆G°= -45 kJ/mol
COM-S-S-COB + 2[H]� H-S-COM + H-S-COB
∆G°= -40 kJ/mol E’o= -200 mV
Thermodynamics of a) Oxidative Reactions and b) Reductive Reactions
a) Oxidative Reactions: Methyl coenzyme M, formed from coenzyme M
and acetate, CO2 or reduced C1 compounds is the central intermediate. It is
subsequently reduced with coenzyme B to methane with concomitant formation of
heterodisulfide of coenzyme M and coenzyme B (Equation 15):
Equation 15: CH3-S-CoM + H-S-CoB � CH4 + CoM-S-S-CoB ∆G°= -45 kJ/mol

72
b) Reductive Reactions: Energy for growth of methanogens is generated
during the reduction of heterodisulfide bond that were generated in the oxidative
reactions. The reduction of the heterodisulfide is coupled with phosphorylation of
ADP via a chemiosmotic mechanism as described in Table 7.
Table 7: Free energy change associated with heterodisulfide reduction (adapted from Borja et al., 2005).
Compound Free Energy Change
H2 ∆G°= -40 kJ/mol
Formate ∆G°= = 43.5 kJ/mol
Ethanol (acetate) ∆G°= - 35 kJ/mol Methanol (CO2) ∆G°= -34 kJ/mol
Each of these is sufficient to drive the phosphorylation of 1 mol ADP: ∆G°= + 31.8
kJ/mol.
D) Relevant Organisms involved in Methanogenesis
Methanogenic organisms were originally thought to be eubacteria, but are now
recognized as belonging to a separate phylogenetic domain, the Archaea. They are
highly specialized, as they can only use acetate, H2 and CO2, methylthiols and
methylamines as energy substrates. Despite the high degree of specialization, not all
methanogens are phylogenetically closely related. Taxonomically all belong to the
archaeal kingdom of Euryarchaeota and are classified in the following five orders:
Methanobacteriales, Methanococcales, Methanomicroiales, Methanopyrales and
Methosarcinales (Table 8).

73
Table 8: Characteristics of 4 methanogenic orders
Order Morphology Physiology Methanobacteriales Rods or filaments Hydrogenotrophic,
mesophilic or thermophilic
Methanococcales Irregular cocci Hydrogenotrophic, mesophilic or thermophilic
Methanomicrobiales Small rods, irregular cocci, flat oval shaped cells
Hydrogenotrophic, mesophilic
Methanosarchinales Rods or filaments, irregular cocci
Strict aceticlastic, aceticlastic or hydrogenotrophic, mesophilic or thermophilic
E. Effect of Environmental Conditions on Methanogenesis
Methane-forming bacteria are strict anaerobes and are extremely sensitive to
environmental changes in alkalinity (buffering capacity), pH and temperature. The
optimal temperature for methanogenesis is dependent on the microbial community
present, but is generally in the range of 55 - 65°C. Small, sudden shifts in
temperature will significantly disrupt the microbial activity (Zinder et al., 1984).
Methanogenesis occurs at fairly neutral pH values (6.75-7.4), and is usually
inhibited almost completely at pH values greater than 8 (Visser et al., 1993). The
process of methanogens occurs in the absence of free molecular oxygen, suggesting
that the process must occur in a highly reducing environment.
74
F) Nutrient Requirement:
A study conducted at the University of Illinois by Bryant (1971) showed that
strains of methanogens that are contained in the rumens of animals and humans
that are grown in H2 and with CO2 as the energy source require NH4+ as the main
source of cell nitrogen and have little ability to incorporate or metabolize organic
nitrogen compounds such as amino acids or peptides (Bryant, 1971). Therefore, a
sufficient amount of ammonia is required for methanogenic growth. Other nutrient
requirements of methanogens include trace metals, branched chain fatty acids and
coenzyme M, as well as low partial pressures of H2 to keep methanogenesis
thermodynamically favorable.
Anaerobic Digestion Process Engineering Parameters
Methane-forming bacteria are strict anaerobes, and are extremely sensitive
to environmental changes in alkalinity (buffering capacity), pH (optimum = 6.8 –
7.2) and temperature (optimum = ~35°C). Digester operational conditions must be
closely monitored to determine how sensitive our system is to changes in these
parameters.
Most anaerobic digestion takes place at mesophilic temperatures, between
30-38 degrees C. Digesters can also be operated at higher thermophilic
temperatures, typically 50-60 degrees C. Thermophilic digestion has been shown to
have several advantages, including human pathogen reduction and improved sludge
dewatering characteristics (Parkin and Owen, 1986). Higher energy requirements,

75
poor supernatant quality, and less process stability have also been indentified as
disadvantages of thermophilic digestion.
Other parameters that must be monitored include gas composition, hydraulic
retention time (HRT), oxidation-reduction potential and solids retention time (SRT).
Changes in the SRT have been shown to be more influential on the performance of
the digester than changes in the HRT because the generation time of methane-
forming bacteria is slow. If the SRT is too short, the organisms will wash out of the
digester before being able to reproduce. An SRT of less than 10 days would cause a
system wash-out.
Once the reactor has reached steady state, factors that may be responsible
for upsets and causing the reactor to become unstable should be monitored. These
conditions are usually related, and include hydraulic overload, organic overload, pH
changes, temperature fluctuations, toxicity, a large withdrawl of algal sludge and air
contamination. Ammonia build up in the digester leads to significant toxicity, which
is closely linked to changes in pH. As the pH drops below 7.2 (the pKa of ammonia)
NH4+ is favored over NH3 leading to increased toxicity levels in the digester.
Ammonia toxicity can be avoided if the pH of the digester is maintained within the
optimum ranges of 6.8 to 7.2. A decrease in methane composition of the gas is a
reliable indicator that the digester may have become unstable, because methane
production represents final degradation of organic compounds. Methane production
and alkalinity may be correlated, and this may also be used as an indication of an
unstable digester system.

76
Recommended solids loading for anaerobic digesters that are mixed and
heated are 200 - 450 lb volatile solids/1000 ft3/day (Malina and Pohland, 1992).
This is dependent, however, on the concentration of the algal sludge. Another
valuable optimization is the investigation of the effects of solids loading of algal
biomass on the performance of the system that would contribute to the
development of a kinetic-based model of the response of the organisms to increased
solid loading.
Anaerobic Digestion Processes and Designs
A) Continually Fed Digesters
Continually fed digesters are typical digesters that are used as a conventional single
stage digestion process. In these digesters, the rate of feeding should be continuous
for maximum efficiency, however, for practical reasons, the digesters are usually fed
intermittently. In a continuously stirred tank reactor (CSTR), an influent substrate
concentration of 3-8% total solids (TS) is added daily, and an equal amount of
effluent is withdrawn. The digester is maintained constantly at mesophilic or
thermophilic temperatures. The addition of large amounts of water requires large
reactor volume and high post-treatment costs for the digester residue.
B) High solids anaerobic digestion takes place at a TS concentration of more
than 25% and is also referred to as “dry anaerobic fermentation”. Most high solids
anaerobic digestions studies have been performed using municipal solid waste
(MSW) (Shulze, 1958; Cecchi, et al 1988).

77
Anaerobic Digester Reactors
Digesters involved in anaerobic digesters can be placed into two different
types: those that retain biomass, and those that allow biomass to pass through.
In a reactor that retains biomass, the SRT is decoupled from the HRT, thus
allowing for a higher concentration of “active mass” within the reactor and faster
reactions. These types of reactors are also able to adapt more quickly, provided that
the feed is consistent. Cultures will adapt to self optimize for the influent conditions.
Different seed cultures will contain different organisms in varying
concentrations. Therefore, if the seed culture is adapted to a feed that is different
from the feed to be treated, it could require additional time for the culture to adapt
before a stable community can develop.
1) Conventional Single Stage Digestion
a) Continually fed digesters are typical digesters that are used as a
conventional single stage digestion process. In these digesters, the rate of feeding
should be continuous for maximum efficiency; however, for practical reason, the
digesters are usually fed intermittently. In a continuously stirred tank reactor
(CSTR) an influent substrate concentration of 3-8% total solids (TS) is added daily,
and an equal amount of effluent is withdrawn. The digester is maintained constantly
at mesophilic or thermophilic temperatures. The addition of large amounts of water
requires large reactor volume and high post-treatment costs for the digester
residue.

78
c) In a plug-flow digester, also referred to as a tubular plug-flow digester, a
volume of the medium with a suitable inocculum enters at one end of the tubular
digester. If the rate of passage of the medium is correct, by the time the medium
reaches the other end of the reactor, the digestion is completed. For continuous
operation, some of the digested effluent flowing from the end of the tube is
separated and returned to the influent substrate. One type of plug-flow reactor is
the Upflow Anaerobic Sludge Blanket (UASB) reactor, developed by Dr. Gatze
Lettinga (Lettinga and Hulschoff Pol, 1991, Lettinga et al., 1980). Lettinga et al.
observed that under certain conditions, anaerobic consortia form granular particles,
which settle easily in aqueous solutions, forming relatively dense beds in the
bottoms of vertical upflow bioreactors.
In these reactors, the influent enters from the bottom of the reactor via a
diffuser to provide equal distribution through the sludge blanket. The substrate is
passed through the sludge blanket vertically, converting the Chemical Oxygen
Demand (COD) of the substrate to biogas, and some biomass. Biogas is directed via
deflector to a separator, while the treated liquid effluent flows to a reactor outlet.
The principle that drives UASB is the separation of SRT and HRT. As the
microbial consortia required for digestion are slow to reproduce, they can be
retained in a reactor while the fluid that carries dissolved carbon substrates that the
microbes feed on passes freely through at a rate that is optimized to the metabolic
capabilities of the active solids (Lettinga et al., 1980). Therefore, the volumetric
efficiency of the reactor is maximized. The active biomass, therefore, acts effectively
as a filter, metabolizing available carbon to methane and carbon dioxide. The UASB

79
is capable of treating both high and low strength wastes effectively, although the
substrates must be relatively clean, and free of non-volatile suspended solids that
may displace of interfere with active solids (Lettinga et al., 1980)
The Induced Bed Reactor (IBR) was developed at Utah State University to
apply high-rate anaerobic digestion techniques to high solids content substrates
(Dustin, 2010). The IBR includes an upflow design, similar to UASB. The IBR has
been optimized to treat complex high solids and wastewaters such as dairy
manures.
In order to accommodate the high solids content and large maximum particle
sizes anticipated in the influent, a relatively large inlet is required to permit the
solids to pass without plugging the feed line. The IBR is generally taller than the
typical UASB designs (10 m vs 5-8 m) (Lettinga and Hulschoff, Pol, 1991), to provide
additional separation time for active solids to settle. Operationally, the IBR is
typically operated at HRTs of 3-7 days, with waste strengths of 25-85 kg/m3 COD,
results in 30-60% reduction in COD. A typical UASB is operated at 4-14 hours HRT,
with waste strengths of 1-18 kg/m3 COD, and results in 90-95% reduction of COD.
Major advantages of the IBR include a reduced need for solids separation and
the ability to treat all of the material in the feed stream. Additionally, the HRT is
significantly less than a similarly performing plug or CSTR digester with a 20-day
HRT, therefore requiring significantly less operational volume.
Algal Biomass as Feedstock for Anaerobic Digestion

80
Microalgae have been identified as having potential for large-scale
production of biofuel. Microalgae require large quantities of nitrogen and
phosphorus for large-scale production, making environmental and economic
sustainability difficult to maintain. A process that includes the recycling of nitrogen
and phosphorous is therefore required in order to reduce the use of added nutrients
or fertilizers and to increase the economic feasibility (Olguin, 2003)
Furthermore, to reach an economical balance, the process of anaerobic
digestion of algal biomass may be integrated into a comprehensive system to
harness and transform the photosynthestic energy captured in algae. For example,
alagl lipids may be extracted to develop several bioproducts, such as bioplastics or
biodiesel. The remaining biomass, primarily the compounds that comprise the algal
cell walls may then be digested to methane to balance the process economically.
Chisti (2007) has shown the algal biomass that remains after lipid extraction can be
transformed into methane via anaerobic digestion.
Anaerobic degradation of algal cells occurs naturally in aquatic environments
as algal material sinks toward the anoxic and aphotic zones after cell death.
Ammonium and phosphate release occurs as algal cells are degraded naturally,
which serves to sustain growth of phytoplanktonic communities in the surrounding
environment. Golueke et al. (1957) published the first study on engineered
anaerobic digestion of an algal biomass. In 1960, they proposed an integrated
process associating the production of microalgae in an open pond for the treatment
of sewage water and the energetic recovery of the algal biomass by anaerobic
digestion (Oswald and Golueke 1960; Golueke 1963).

Kinetics of anaerobic degradation of algae
resistance of the cell wall (Chen, 1987; Afi et al., 1996; Chen and Oswald, 1998).
Determining the composition of microalgae has allowed researchers to determine
digestion potential. The average composition of microalgae has been determined as
CO0.48H1.83N0.11P0.01 (Grobbelaar, 2004). Microalgae also contains oligo nutrients
such as iron, zinc and colbalt,
(Speece, 1996).
The composition with respect to cellular structural components has also
been determined for variou
species-dependent, and is also a
(Leadbeater, 2006; and Droop, 1983). Two methods can be used to determine the
theoretical amount of methane produced by
method to evaluate the theoretical methane yield from anaerobic digestion of these
species is to use the following formula adapted from Symons and Buswell (1933)
(Equation 16):
Equation 16:
The second method includes
components, combined with the reduction reaction of CO
resulting stoichiometry to elucidate theoretical methane potential. Ideally, these two
81
Kinetics of anaerobic degradation of algae is highly dependent upon the
ance of the cell wall (Chen, 1987; Afi et al., 1996; Chen and Oswald, 1998).
Determining the composition of microalgae has allowed researchers to determine
digestion potential. The average composition of microalgae has been determined as
(Grobbelaar, 2004). Microalgae also contains oligo nutrients
such as iron, zinc and colbalt, which are known to stimulate methanogenesis
The composition with respect to cellular structural components has also
been determined for various types of microalgae. Cell composition is strongly
dependent, and is also affected significantly by environmental conditions
(Leadbeater, 2006; and Droop, 1983). Two methods can be used to determine the
theoretical amount of methane produced by each of the individual species. One
method to evaluate the theoretical methane yield from anaerobic digestion of these
species is to use the following formula adapted from Symons and Buswell (1933)
The second method includes using half-reactions for the individual
components, combined with the reduction reaction of CO2 to CH4, and using the
resulting stoichiometry to elucidate theoretical methane potential. Ideally, these two
is highly dependent upon the
ance of the cell wall (Chen, 1987; Afi et al., 1996; Chen and Oswald, 1998).
Determining the composition of microalgae has allowed researchers to determine
digestion potential. The average composition of microalgae has been determined as
(Grobbelaar, 2004). Microalgae also contains oligo nutrients
are known to stimulate methanogenesis
The composition with respect to cellular structural components has also
s types of microalgae. Cell composition is strongly
ffected significantly by environmental conditions
(Leadbeater, 2006; and Droop, 1983). Two methods can be used to determine the
each of the individual species. One
method to evaluate the theoretical methane yield from anaerobic digestion of these
species is to use the following formula adapted from Symons and Buswell (1933)
reactions for the individual
, and using the
resulting stoichiometry to elucidate theoretical methane potential. Ideally, these two
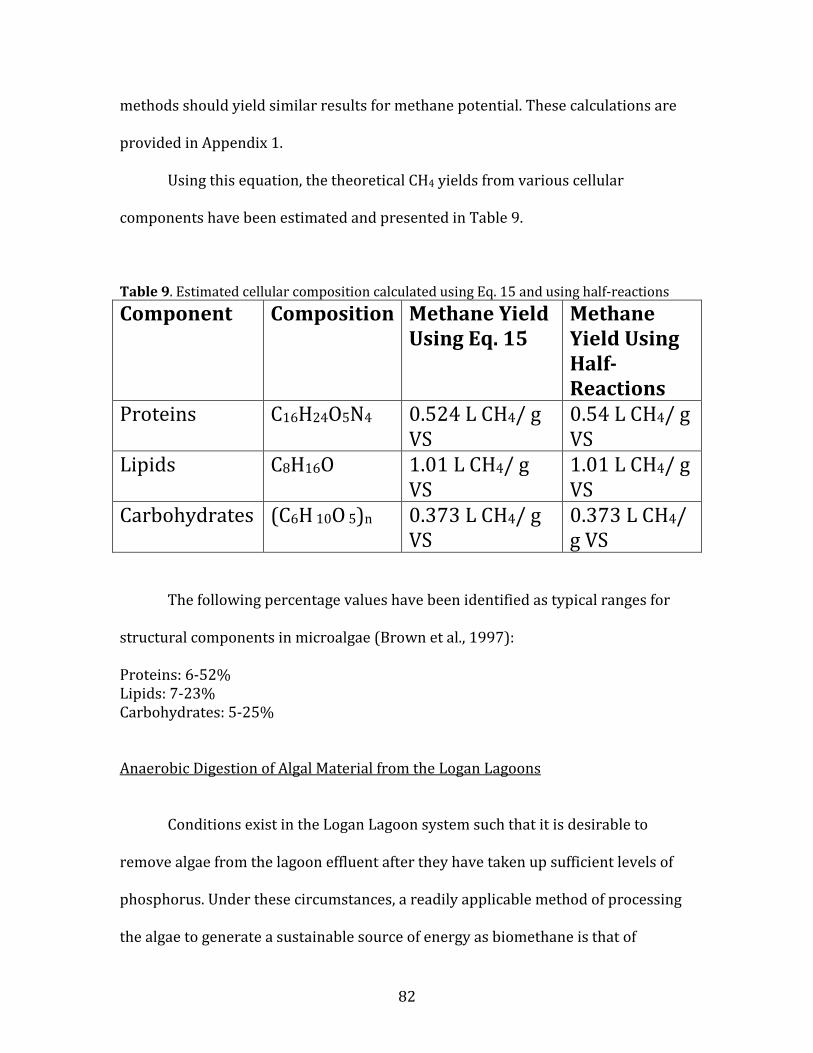
82
methods should yield similar results for methane potential. These calculations are
provided in Appendix 1.
Using this equation, the theoretical CH4 yields from various cellular
components have been estimated and presented in Table 9.
Table 9. Estimated cellular composition calculated using Eq. 15 and using half-reactions
Component Composition Methane Yield
Using Eq. 15
Methane
Yield Using
Half-
Reactions
Proteins C16H24O5N4 0.524 L CH4/ g VS
0.54 L CH4/ g VS
Lipids C8H16O 1.01 L CH4/ g VS
1.01 L CH4/ g VS
Carbohydrates (C6H 10O 5)n 0.373 L CH4/ g VS
0.373 L CH4/ g VS
The following percentage values have been identified as typical ranges for
structural components in microalgae (Brown et al., 1997):
Proteins: 6-52% Lipids: 7-23% Carbohydrates: 5-25% Anaerobic Digestion of Algal Material from the Logan Lagoons
Conditions exist in the Logan Lagoon system such that it is desirable to
remove algae from the lagoon effluent after they have taken up sufficient levels of
phosphorus. Under these circumstances, a readily applicable method of processing
the algae to generate a sustainable source of energy as biomethane is that of

83
controlled anaerobic digestion. Studies performed by researchers at Utah State
University have indicated that two of the primary algae species present in the Logan
Lagoon system are Chlorella and Scenedesmus (Christenson and Sims 2012).
For the two species that have been identified to exist in the Logan Lagoons,
Chlorella and Scenedesmus, the relative composition has been determined. From this
information, we can calculate the theoretical methane values that would result from
anaerobic digestion of the individual species, which are presented in Table 10.
Table 10. Relative cellular components in Logan Lagoon Algae species and theoretical methane production
Species Proteins
(%)
Lipids
(%)
Carbohydrate
(%)
L
CH4/
g VS
Using
Eq. 16
L CH4/ g
VS
Using
Half
Reactions
Chlorella 56 12 19 1.12 1.124 Scenedesmus 50-56 13 17 0.5 0.5
It has been documented that both Scenedesmus and Chlorella have
particularly recalcitrant cellulosic cell walls (Okuda, 2002). Another study,
performed by Takeda and Hirokawa (1978) demonstrated that the cell wall of
Chlorella ellipsoidea was composed to two major constituents: alkali-soluble
hemicellulose and alkali-insoluble rigid wall.
Pretreatment can be successfully applied in order to lower the recalcitrant
organic fraction, and thus increase the methane conversion. Chen and Oswald
(1998) studied different pretreatments for an algal biomass produced in sewage
treatment ponds. The temperature appeared to have the most important effect. The

84
optimal pretreatment consisted of heating at 100 degrees C for 8 hours, which
resulted in a 33% improvement in methane production. While the energy input is
high for this pretreatment option, the improvement in methane yield can
energetically balance the thermal pretreatment. Ultrasonic pretreatment has been
shown to enhance the crude protein digestibility, as shown with experiments on the
digestibility of C. vulgaris in rats (Janczyk et al., 2007). An additional pretreatment
option that should be considered is the use of alkaline peroxide, which relies on
radical oxygen chemistry to break down cellulose in the algal cell wall into simple
monomers.
Another potential strategy for improving methane yield is to alter the cellular
composition by “stressing” the organisms. When algae are deprived of nitrogen,
their metabolism is altered toward enhanced lipid production. A study performed
by Illman et al. (2000), showed that when algae are subjected to low nitrogen
conditions, their lipid content nearly doubles. Lipids yield more methane per gram
than carbohydrates. Thus, by increasing lipid content, more theoretical methane can
be obtained. Also, the study showed a decrease in ammonia release as well, leading
to less toxicity to the anaerobic organisms.
Summary and Problem Statement
A comprehensive understanding of the process fundamentals involved in
anaerobic digestion is necessary to ensure efficient and reliable operation. The
current conditions in the Logan City Wastewater Lagoon system require a nutrient
removal solution in order to meet anticipated permit requirements.

85
A proposed integrated nutrient removal system allows for the uptake of
nutrients by algae that exist naturally in the Logan Lagoons. The algae may
subsequently be removed and processed to yield bioproducts, including bioplastics,
biodiesel, and biomethane. The algal material may be processed immediately after
removal in an anaerobic digester to produce methane. In order to maximize the
anaerobic transformation and biogas production, this study sought to understand
the effect of digester inoculum on the digestion of algae collected from the Logan
Lagoons, as well as to understand the effect of several chemical pretreatments on
algal digestibility.
The Logan Wastewater Lagoons have been an isolated system for 40 years.
Therefore, through selective evolutionary pressures, the system has likely become
optimized for digestion (both aerobic and anaerobic) of algae species native to the
Lagoons, as the native bacteria may have become optimized to degrade the algal
species common to the system. A study performed at Utah State University (Ellis et
al., 2012) has shown that the Logan Lagoons contain a unique consortium of
methanogenic bacteria. Therefore, by inoculating anaerobic digesters with
sludge/biomass that has been collected from the bottom of the Logan Lagoons at a
depth of five feet, we predict that algal methane production may be enhanced due to
optimized bacterial cultures.
The cell walls of both Chlorella and Scenedesmus have both been
demonstrated to be extremely recalcitrant and resistant to anaerobic digestion. (Afi
et al., 1996). This study sought to determine if the pretreatment of algal species
found in the Logan Lagoons is successful in reducing the recalcitrance of the cell

86
wall, thus making the cellular components available to methanogenic bacteria, as
discussed previously in this report. Two pretreatment strategies were investigated-
dilute acid pretreatment and alkaline pretreatment.
By determining the effect of the inoculum and of pretreatment on the
anaerobic digestion of algae collected from the Logan Lagoons, we may reduce or
eliminate some of the process and economic barriers to algal transformation to
biofuels and other bioproducts that are identified and discussed in this review, and
enhance the efficiency of algae digestion in order to increase bioproduct production.

87
Materials and Methods
A. Conversion Efficiency Based on Digester Inoculum
Mixed culture algae grab samples from the Logan Lagoons Wastewater
System were provided by Dr. Daniel Dye (Department of Biological Engineering,
Utah State University). Pure cultures of Chlorella vulgaris and Scenedesmus obliquus
were obtained from the American Type Culture Collection and were grown in Algal
proteose medium. These species were chosen for evaluation because previous
researchers at Utah State University have shown that these algal species are the
most dominant in the Logan Lagoons (Bare et al., 1975).
Anaerobic digester sludge was provided by Dr. Shaun Dustin (Energy
Dynamics Laboratory, Utah State University Research Foundation). The sludge
obtained from Dr. Dustin had been obtained from a sampling port of a continuously
operating dairy waste Induced Bed Reactor anaerobic digester. Lagoon-bed sludge
was obtained from the bottom of the “A1” pond of the Logan Lagoon Wastewater
Pond System. The sludge was collected from a depth of 5 feet. The sludges collected
from the Logan Lagoons and from the IBR digester were used as bacterial seed for
anaerobic digestion studies.
The relative digestibility of the different algal cultures was analyzed using
the Biochemical Methane Potential (BMP) Assay. The BMP Assays were performed
according to the procedure described in Owen et al. (1979). The Assays were
performed by placing 116 mL deionized water, 13 mL prepared bacterial seed, 1.0
gram dried algal substrate, and 1.04 grams of sodium biocarbonate into 500 mL

Erlenmeyer Flasks. The flasks were fl
degrees C for 35 days.
Gas samples were extracted using a 60 mL syringe at day 20, 25 and 33 of the
experiment. Total volumetric gas production was determined, and relative gas
composition were determined using a
Figure 1 illustrates a flow
evaluate the relative digestibilities of three difference algal cultures when they are
digested anaerobically with two different inoculum sludge types.
Figure 1. Experimental design for digestion efficiency based on inoculum source.
Three replications of each combination of algae type and inoculum source
were performed. A standard deviation was then determined from the three
replications to represent the statistica
B. Effect of Pretreatment on Anaerobic Digestion of Algae
88
Erlenmeyer Flasks. The flasks were flushed with argon gas and were stored at 37
Gas samples were extracted using a 60 mL syringe at day 20, 25 and 33 of the
experiment. Total volumetric gas production was determined, and relative gas
composition were determined using a gas chromatograph.
Figure 1 illustrates a flow-diagram of the experimental design used to
evaluate the relative digestibilities of three difference algal cultures when they are
digested anaerobically with two different inoculum sludge types.
xperimental design for digestion efficiency based on inoculum source.
Three replications of each combination of algae type and inoculum source
were performed. A standard deviation was then determined from the three
replications to represent the statistical relationship between the combinations.
Effect of Pretreatment on Anaerobic Digestion of Algae
ushed with argon gas and were stored at 37
Gas samples were extracted using a 60 mL syringe at day 20, 25 and 33 of the
experiment. Total volumetric gas production was determined, and relative gas
diagram of the experimental design used to
evaluate the relative digestibilities of three difference algal cultures when they are
Three replications of each combination of algae type and inoculum source
were performed. A standard deviation was then determined from the three
l relationship between the combinations.

89
Mixed culture algae from the Logan Lagoons were dried for 1 hour at 105
degrees C to remove available water prior to pretreatment. Dilute acid pretreatment
was performed at 10% solids concentration, using four different concentrations of
sulfuric acid: 0.5%, 1.0%, 2.0% and 4.0%. The dilute acid pretreatment procedure
was performed at two different temperatures: 50 degrees C and 80 degrees C.
Pretreatment duration was 24 hours.
Alkaline pretreatment was performed at 10% solids concentration, using
four different levels of NaOH base: 0.25 M, 0.5 M, 1.0 M, and 2.0 M. The alkaline
procedure was performed at two different temperatures: 50 degrees C and 80
degrees C. Pretreatment duration was 24 hours. A control experiment was
performed in which non-pretreated algae from the Logan Lagoons was placed into
pH 7 H20 for 24 hours (no alkaline or acid) for 24 hours at 30 degrees C and at 50
degrees C.
After pretreatment, the algae were digested in BMP assays to evaluate the
effect of pretreatment on the digestibility of algal biomass. The BMP assays were
performed using the Logan Lagoon Bed Sludge as the prepared bacterial seed.
Volumetric gas production was measured each day for 35 days using a 60 mL
syringe. Total volumetric gas production over the period of the study was
determined.
Results/Discussion

The theoretical methane production from both
were determined using the stoichiometric relationships presented previously in
order to evaluate the efficiency of the algae digestion processes. These values are
presented in Table 1.
Table 1. Theoretical methane values based on stoichiometrical calculsee Appendix 1.
A. Conversion Efficiency Based on Digester Inoculum
Figure 2 presents the total measured biogas production of pure algae strains
(Chlorella vulgaris and Scenedesmus obliquus
different inoculum sludges containing the anaerobic micriobiological consortium.
90
The theoretical methane production from both Chlorella and Scenedesmus
were determined using the stoichiometric relationships presented previously in
order to evaluate the efficiency of the algae digestion processes. These values are
. Theoretical methane values based on stoichiometrical calculations. For example calculations
Conversion Efficiency Based on Digester Inoculum
Figure 2 presents the total measured biogas production of pure algae strains
Scenedesmus obliquus) that were digested using the
different inoculum sludges containing the anaerobic micriobiological consortium.
Scenedesmus
were determined using the stoichiometric relationships presented previously in
order to evaluate the efficiency of the algae digestion processes. These values are
ations. For example calculations
Figure 2 presents the total measured biogas production of pure algae strains
) that were digested using the two
different inoculum sludges containing the anaerobic micriobiological consortium.

Figure 2. Total biogas production after 35 days of pure algae strains (obliquus) that were anaerobically digested using two differen
IBR Sludge). Numbers (1-3), (4-6), (7-9) and (10
After 35 days, algae samples that had been digested in BMP assays using
bacteria seed sludge that was collected
statistically significantly more gas than algae samples that had been digested using
bacteria seed sludge that had been collected from an operating IBR reactor. Further,
both the Chlorella and Scenedesmus
sludge produced only slightly more gas than algae that was incubated with no
bacterial seed/inoculum. The sludge that was collected from the operating dairy
waste digester had most likely been acclimated to digest substrate
algae, and thus was unable to efficiently convert the algal biomass to methane gas.
Samples of Scenedesmus obliquus
digested with Lagoon sludge than samples of
with Lagoon sludge. There was no significant difference, however, between gas
91
Total biogas production after 35 days of pure algae strains (Chlorella vulgaris and Scenedesmus
that were anaerobically digested using two different bacterial seed/inoculum (Lagoon Sludge and 9) and (10-12) designate the individual replication numbers.
After 35 days, algae samples that had been digested in BMP assays using
bacteria seed sludge that was collected from the bed of the lagoons produced
statistically significantly more gas than algae samples that had been digested using
bacteria seed sludge that had been collected from an operating IBR reactor. Further,
Scenedesmus algae samples that were digested with the IBR
sludge produced only slightly more gas than algae that was incubated with no
bacterial seed/inoculum. The sludge that was collected from the operating dairy
waste digester had most likely been acclimated to digest substrates other than
algae, and thus was unable to efficiently convert the algal biomass to methane gas.
Scenedesmus obliquus produced substantially more biogas when
digested with Lagoon sludge than samples of Chlorella vulgaris that was digested
with Lagoon sludge. There was no significant difference, however, between gas
Scenedesmus
t bacterial seed/inoculum (Lagoon Sludge and 12) designate the individual replication numbers.
After 35 days, algae samples that had been digested in BMP assays using
from the bed of the lagoons produced
statistically significantly more gas than algae samples that had been digested using
bacteria seed sludge that had been collected from an operating IBR reactor. Further,
that were digested with the IBR
sludge produced only slightly more gas than algae that was incubated with no
bacterial seed/inoculum. The sludge that was collected from the operating dairy
s other than
algae, and thus was unable to efficiently convert the algal biomass to methane gas.
ly more biogas when
that was digested
with Lagoon sludge. There was no significant difference, however, between gas
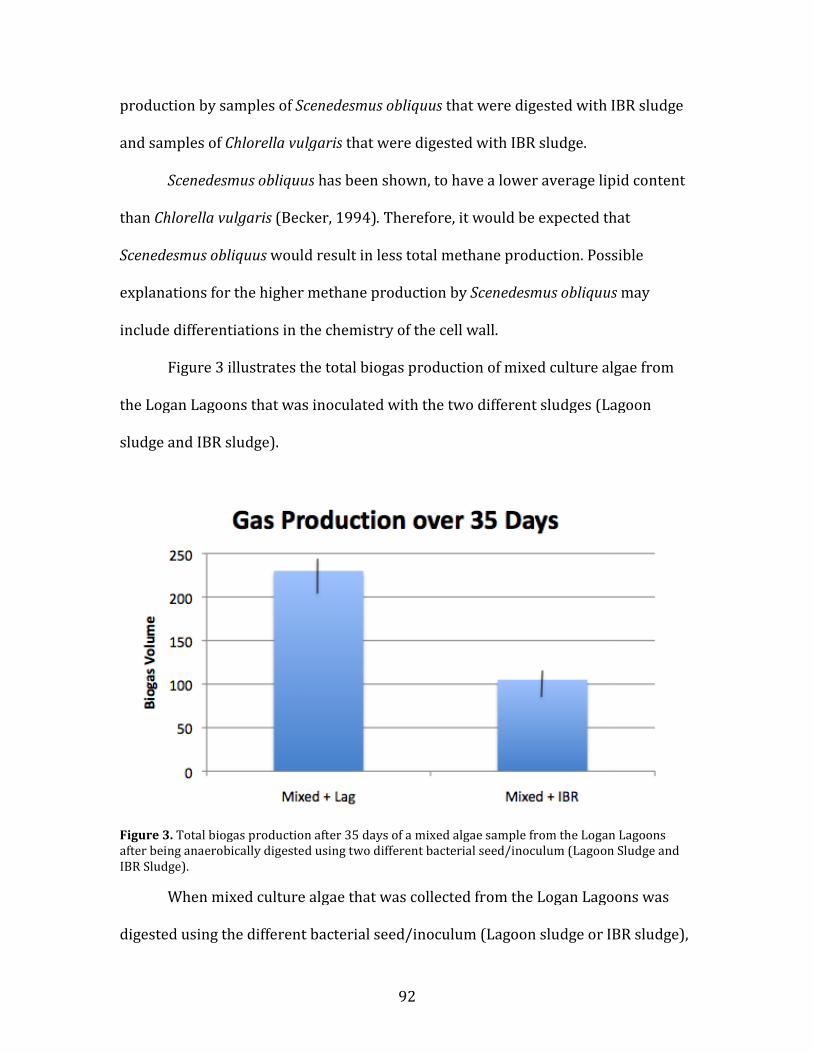
production by samples of Scenedesmus obliquus
and samples of Chlorella vulgaris
Scenedesmus obliquus
than Chlorella vulgaris (Becker, 1994)
Scenedesmus obliquus would result in less total methane production. Possible
explanations for the higher methan
include differentiations in the chemistry of the cell wall.
Figure 3 illustrates the total biogas production of mixed culture algae from
the Logan Lagoons that was inoculated with the two different sludges (Lagoon
sludge and IBR sludge).
Figure 3. Total biogas production after 35 days of a mixed algae sample from the Logan Lagoons after being anaerobically digested using two different bacterial seed/inoculum (Lagoon Sludge and IBR Sludge).
When mixed culture alga
digested using the different bacterial seed/inoculum (Lagoon sludge or IBR sludge),
92
Scenedesmus obliquus that were digested with IBR sludge
Chlorella vulgaris that were digested with IBR sludge.
smus obliquus has been shown, to have a lower average lipid content
(Becker, 1994). Therefore, it would be expected that
would result in less total methane production. Possible
explanations for the higher methane production by Scenedesmus obliquus
include differentiations in the chemistry of the cell wall.
Figure 3 illustrates the total biogas production of mixed culture algae from
the Logan Lagoons that was inoculated with the two different sludges (Lagoon
Total biogas production after 35 days of a mixed algae sample from the Logan Lagoons after being anaerobically digested using two different bacterial seed/inoculum (Lagoon Sludge and
When mixed culture algae that was collected from the Logan Lagoons was
digested using the different bacterial seed/inoculum (Lagoon sludge or IBR sludge),
that were digested with IBR sludge
has been shown, to have a lower average lipid content
Therefore, it would be expected that
would result in less total methane production. Possible
Scenedesmus obliquus may
Figure 3 illustrates the total biogas production of mixed culture algae from
the Logan Lagoons that was inoculated with the two different sludges (Lagoon
Total biogas production after 35 days of a mixed algae sample from the Logan Lagoons after being anaerobically digested using two different bacterial seed/inoculum (Lagoon Sludge and
e that was collected from the Logan Lagoons was
digested using the different bacterial seed/inoculum (Lagoon sludge or IBR sludge),

93
the total gas released after the 35 day digestion BMP assay with Lagoon sludge was
statistically equivalent to the total gas released from Scenedesmus obliquus. Similar
to the pure strain assays, when mixed algae from the Logan Lagoons was digested
with IBR sludge, a large reduction in biogas production was observed, suggesting
the IBR sludge is not as well adapted to algal digestion as is sludge from the
Lagoons.
Table 2 presents the conversion efficiencies based on the assumption the
biogas produced was approximately 70% methane and 30% carbon dioxide (Sialve
et al., 2009). This proportion of methane in the biogas produced is in a similar range
(69-70%) has been demonstrated in numerous studies (Golueke et al., 1957; Chen,
1987; Asinari Di San Marzano et al., 1982; Samson and LeDuy 1986 ) regardless of
species and operating conditions for anaerobic digestion of algal biomass.
Table 2. Percentage of methane gas measured compared to theoretical methane gas production by pure algae strains (Chlorella vulgaris and Scenedesmus obliquus) that were anaerobically digested using two different bacterial seed/inoculum.
Scenedesmus
obliquus
Chlorella vulgaris
Lagoon Sludge 35.1 ± 7.2% 25.3 ± 2.66 %
IBR Sludge 13.4 ± 3.7% 11.9 ± 43.36%
When compared to the theoretical methane production potential,
Scenedesmus obliquus digested with lagoon sludge had an average digestion
efficiency of 35%, whereas when Scenedesmus obliquus was digested with IBR
sludge, the average conversion efficiency was only 13.4%. Samples of Chlorella
vulgaris also saw a large increase in conversion efficiency when digested with

94
sludge that was collected from the Lagoons. When digested with Lagoon sludge,
Chlorella vulgaris had an average conversion efficiency of 25.3%, whereas when
digested with IBR sludge, the average conversion efficiency was 11.9%. This drop in
efficiency is likely due to the fact that the IBR sludge had a bacterium consortia that
is acclimated to the digestion of dairy waste organics, whereas the Lagoon sludge
bacterium consortia is acclimated to the degradation of algal material in the cell
wall.
Because it was observed that Scenedesmus obliquus had a higher conversion
efficiency when digested with Lagoon sludge than Chlorella vulgaris, this suggests
that the Lagoon sludge may contain a bacterial seed population that is more capable
of overcoming the recalcitrance of the call wall of Scenedesmus obliquus than of
Chlorella vulgaris.
Referring to Figure 4, the biogas production over time during the 35 day
digestion assay is presented. Representative first order rate constants were
determined and presented in Figure 5.

Figure 4. Rate of Biogas Production over 35 days of two different algae strains (Scenedesmus obliquus)
Sample
Chlorella and Lagoon Sludge
Chlorella and IBR Sludge
Scenedesmus and Lagoon
Sludge
Scenedesmus and IBR Sludge
Control
Figure 5. First order rate constant for biogas production determined using rate of biogas generation for different algae
95
. Rate of Biogas Production over 35 days of two different algae strains (Chlorella vulgaris
First Order Rate Constant
and Lagoon Sludge 0.051 day -1
and IBR Sludge 0.035 day -1
and Lagoon 0.053 day -1
and IBR Sludge 0.033 day -1
0.022 day -1
. First order rate constant for biogas production determined using rate of biogas & inoculum
Chlorella vulgaris and
First Order Rate Constant
. First order rate constant for biogas production determined using rate of biogas

The decomposition of the biodegradable organic fraction can be adequately
described by first-order decay kinetics (Foree and McCarty, 1970).
first order rate constants have been reported in the range of 0.011
rate constants presented in
B. Effect of Pretreatment on Anaerobic Digestion of Algae
Figure 6 presents the total gas production of mixed culture algae samples
that were collected from the Logan Lagoons and then
acid (H2SO4) or base (NaOH) at two different temperatures (30 degrees C and 50
degrees C)
Figure 6. Biogas generated after a 35 day BMP assay of Logan Lagoon Algae following dilute acid and alkaline pretreatment.
96
The decomposition of the biodegradable organic fraction can be adequately
order decay kinetics (Foree and McCarty, 1970). Representative
first order rate constants have been reported in the range of 0.011-0.032 day
rate constants presented in Figure 3 range from 0.022 to 0.053 day -1.
Effect of Pretreatment on Anaerobic Digestion of Algae
Figure 6 presents the total gas production of mixed culture algae samples
that were collected from the Logan Lagoons and then pretreated using either dilute
) or base (NaOH) at two different temperatures (30 degrees C and 50
. Biogas generated after a 35 day BMP assay of Logan Lagoon Algae following dilute acid and alkaline
The decomposition of the biodegradable organic fraction can be adequately
Representative
0.032 day -1. The
Figure 6 presents the total gas production of mixed culture algae samples
pretreated using either dilute
) or base (NaOH) at two different temperatures (30 degrees C and 50
. Biogas generated after a 35 day BMP assay of Logan Lagoon Algae following dilute acid and alkaline
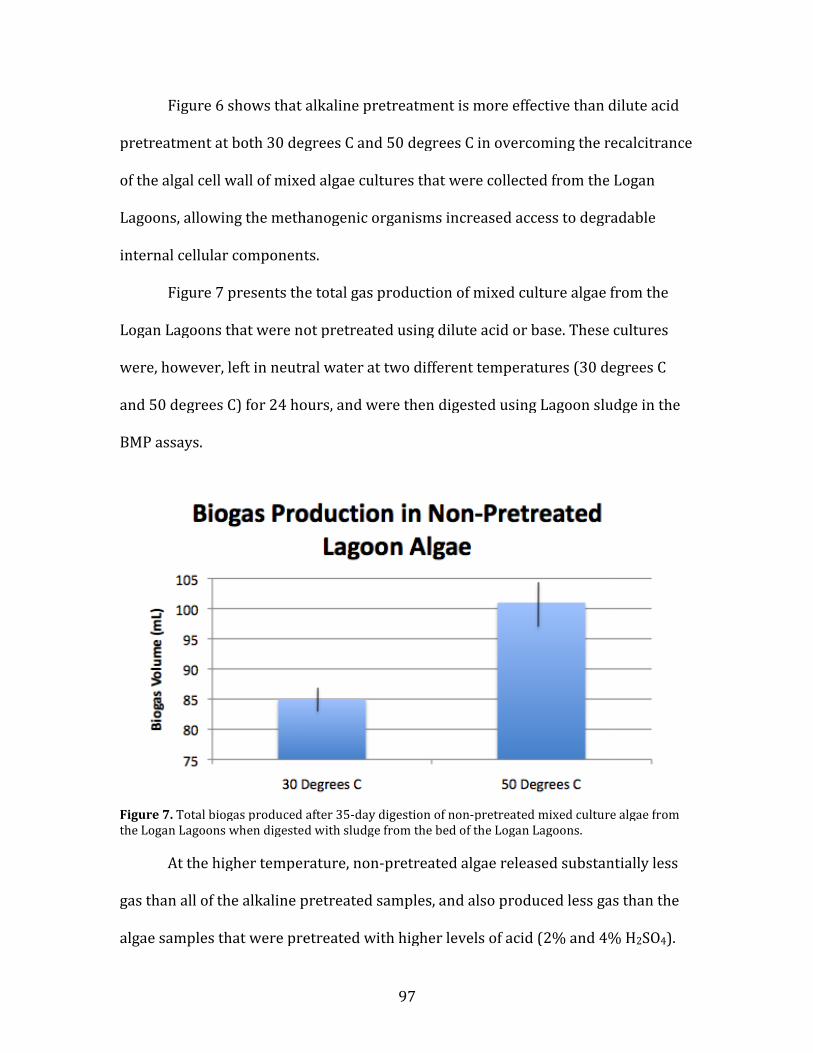
Figure 6 shows that
pretreatment at both 30 degrees C and 50 degrees C
of the algal cell wall of mixed algae cultures that were collected from the Logan
Lagoons, allowing the methanogenic organisms increased access to degradable
internal cellular components.
Figure 7 presents the total gas production of mixed culture algae from the
Logan Lagoons that were not pretreated using dilute acid or base. These cultures
were, however, left in neutral water at two different temperatures (30 degrees C
and 50 degrees C) for 24 hours, and were then digested using Lagoon sludge in the
BMP assays.
Figure 7. Total biogas produced after 35the Logan Lagoons when digested with sludge from the bed of the Logan Lagoons.
At the higher temperature, non
gas than all of the alkaline pretreated samples, and also produced less gas than the
algae samples that were pretreated with higher levels of acid (2% and 4% H
97
alkaline pretreatment is more effective than dilute acid
pretreatment at both 30 degrees C and 50 degrees C in overcoming the recalcitrance
of mixed algae cultures that were collected from the Logan
ethanogenic organisms increased access to degradable
internal cellular components.
Figure 7 presents the total gas production of mixed culture algae from the
Logan Lagoons that were not pretreated using dilute acid or base. These cultures
eft in neutral water at two different temperatures (30 degrees C
and 50 degrees C) for 24 hours, and were then digested using Lagoon sludge in the
Total biogas produced after 35-day digestion of non-pretreated mixed culture algae fwhen digested with sludge from the bed of the Logan Lagoons.
At the higher temperature, non-pretreated algae released substantiall
gas than all of the alkaline pretreated samples, and also produced less gas than the
es that were pretreated with higher levels of acid (2% and 4% H
than dilute acid
in overcoming the recalcitrance
of mixed algae cultures that were collected from the Logan
ethanogenic organisms increased access to degradable
Figure 7 presents the total gas production of mixed culture algae from the
Logan Lagoons that were not pretreated using dilute acid or base. These cultures
eft in neutral water at two different temperatures (30 degrees C
and 50 degrees C) for 24 hours, and were then digested using Lagoon sludge in the
pretreated mixed culture algae from
substantially less
gas than all of the alkaline pretreated samples, and also produced less gas than the
es that were pretreated with higher levels of acid (2% and 4% H2SO4).

98
At the lower temperature, the total amount of biogas released was also much lower
than all of the alkaline pretreated algae samples, and was also lower than the algae
samples digested with the higher levels of acid (2% and 4%).
Conclusion
The data presented in Figures 3-5 supports the hypothesis that BMP units
inoculated with Lagoon sludge will yield higher amounts of biogas than those
inoculated with dairy waste-fed IBR effluent sludge after 35 days of digestion. As
expected, when the algae strains that are known to be dominant in the Logan
Lagoons (Scenedesmus obliquus and Chlorella vulgaris) were anaerobically digested
with bacterial seed that was present in sludge collected from the bed of the Logan
Lagoons, substantially more biogas was released after the 35 day digestion assay
that when the algae strains was digested with sludge from a dairy anaerobic
digester. This suggests that the bacteria consortium present in the Logan Lagoons
have become acclimated to digest the algal species common to the system.
Further, the pretreatment of mixed algal species from the Logan Lagoons was
shown to enhance biogas production, presumably because the pretreatment worked
to break down the cellular wall to allow the cellular components to be better
accessed by the methanogenic bacteria present in the sludge.
Future Work

99
Pilot-scale studies should be performed to monitor the gas production and
gas quality produced by algal biomass digested in larger scale anaerobic digesters
that have been inoculated with sludge from the Logan Lagoons.
The effect of flocculants and coagulants should also be evaluated on the
digestibility of mixed algal species that are present in the Logan Lagoons as well as
on the production of methane. Processes that require metal-containing flocculants
or polymer-containing flocculants should be compared with processes utilizing
organic flocculants, such as chitosan or quaternary ammonium compounds
(Anthony, 2012). Further, the digestibility of algal biomass that remains after a
series of lipid extraction methods to produce biodiesel should be evaluated on both
bench and large scale operations.
By understanding the effect of sludge inoculum and pretreatment on the
anaerobic digestibility of mixed culture algae from the Logan Lagoons, the process
may be optimized and better integrated into a comprehensive system for nutrient
removal from the Logan Lagoons and bioproduct development. The conditions
within the digester may be optimized to produce the highest quality and quantity of
biomass from the algal feedstock. Any processes that occur prior to anaerobic
digestion, including steps such as flocculation and coagulation and lipid extraction
may be altered as to allow for maximum digestion and gas production from the
resulting biomass.

100
Afi L., Metzger P., Largeau C., Connan, J., Berkaloff C., Rousseau B. 1996. Bacterial degradation of green microalgae: incubation of Chlorella emersonii and Chlorell vulgaris with Pseudomonas oleovorans and Flavobacterium aquatile. Proceedings of the 17th International Meeting on Organic Geochemistry. 25: 117-130.
Amani, T., Nosrati, M., Sreekrishnan, T.R. Anaerobic digestion from the view point of microbiological, chemical and operational aspects. 2010. Environmental Reviews. 18: 255-278.
Angenent, L.T., Khursheed, K., Marhuanna, A.H., Wrenn, B.A., Domiguez-
Espinosa, R. (2004) Production of bioenergy and biochemical’s from industrial and agricultural wastewater. Trends in Biotechnology. 22: 477-485.
Anthony, R., Sathish, A., Ellis, J.T., Rahman, A., Miller, C., Sims, R.C. 2012. Effects of coagulant/flocculants on the production of biodiesel, biosolvents and bioplastic from microalgae. Algal Biomass, Biofuels and Bioproducts 2012 Conference, Sand Diego, CA. June 2011.
Asinari Di San Marzano C.M., Legros A., Naveau H.P., Nyns, E.J. 1982. Biomethanation of the marine algae Tetraselnis. Int. J Sustain Energy 1: 263-272.
Atlas, Ronald M. 1946. “Handbook of Microbiological Media”. (3rd ed): 289.
Bare, W.F.R., Jones, N.B., Middlebrooks, E.J. 1975. Algae Removal Using Dissolved Air Flotation. Water Pollution Control Federation, 37: 153-169.
Becker, E.W. 1994. In: “Microalgae: biotechnology and microbiology” Ed. Baddiley, J. et al., 186-187. Cambridge Univ. Press. Cambridge, New York.
Borja, R., Martin, A., Sanchez, E., Rincon, B., Rasposo, F. 2005. Kinetic Modeling of the hydrolysis, acidogenic and methanogenic steps in the anaerobic digestion of two-phase olive pomace. Process Biochemistry. 40: 1841-1847.
Brown, M.R, Jeffrey, S.W., Volkman, J.K., Bunstan, G.A. 1997 Nutritional Properties of microalgae for mariculture. Aquaculture. 151:315-331.
Bryant, M P. Nutrient requirements of methanogenic bacteria. In "Advances in chemistry series Anaerobic Biological Treatment Processes. 105(1971): 23-30.
Cecchi, F., Traverson, P.G., Mata-Alverez, J., Clancy J, Zror, C. 1988. State-of-the-art of R&D in the anaerobic digestion process of municipal solid waste in Europe. Biomass. 16: 257-284.
Chen, P.H. 1987. Factors invluencing methane fermentation of micro-algae. PhD thesis, University of California, Berkely.
Chen, P.H., Oswald, W.J. 1998. Thermochemical treatment for algal fermentation.
Environ Int. 24: 889-897.
101
Christ O., Wilderer, P.A., Angerhofer, R., Faulstich, M. (2000). Mathetmatical modeling of the hydrolysis of anaerobic processes. Water Sci Technol 41: 61-65.
Christension, L., Sims R., 2012. Rotating Algal Biofilm reactor and Spool Harvester for Wastewater Treatment with Biofuels By-Products. Biotechnology and Bioengineering. DOI 10 1002.
Dustin, J.S. 2010. Fundamentals of operation of the induced bed reactor (IR) anaerobic digester. Ph.D. dissertation. Utah State University Logan.
Ellis, Joshua T., Tramp, C., Sims, Ronald C., Miller, C. 2012. Metagenome analysis of a methanogenic community within an algae fed anaerobic digester. ISRN Microbiology. Submitted.
Golueke, C.G., Oswald, W.J., Gotaas H.B. 1957. Anaerobic digestion of algae. Appl Micriol. 5: 47-55.
Golueke, C., Oswald, W. 1963. Power from Solar Energy via Algae-Produced Methane. Solar Energy 7(3): 86-92.
Gujer, W., Zehnder, A.J.B. (1983). Water Sci Technol 15: 127-167.
Gunaseelan, V. Nallathambi. 1997. Anaerobic Digestion of Biomass for Methane Production: A Review. Biomass and Bioenergy 13: 83-114.
Illman, A., Scragg, A., Shales, S. 2000. Increase in Chlorella strains calorific values when grown in low nitrogen medium. Enzyme Microb Technol. 27: 631-635.
Janczyk, P., Franke, H., Souffrant, W.B. 2007. Nutritional value of Chlorella
vulgaris: effects of ultrasonication and electroporation on digestibility in rats. Anim Feed Sci Technol. 132: 163-169.
Karakashev, D., Vatstone, D.J., Angelidaki, I. Influence of Environmental Conditions of Methanogenic Compositions in Anaerobic Biogas Reactors. Applied and Environmental Microbiology. 2005. 71: 1, 331-338.
Leadbeater, B.S.C. 2006. The “Droop-Equation”- Michael Droop and the legacy of the “cell-quota model” of phytoplankton growth. Protist. 157(3):345-358.
Malina, F.J., Pohland, F.G. 1992. Design of anaerobic process for the treatment of industrial and municipal wastes. Water Quality Management Library. 7.
Mata-Alverez, J. 2003. Biomethanization of the organic fraction of municipal solid wastes.
Okuda, K. 2002. Structure and phylogeny of cell coverings. J Plant Res. 115: 283-288.
Olguin, E.J. 2003. Phycoremediation: key issues for cost-effective nutrient removal process. Biotechnol. Adv. 22: 1-91.

102
Ostrem, K. 2004. Greening Waste: Anaerobic Digestion for Treating the Organic Fraction of Municipal Solid Wastes. Earth Engineering Center Columbia University.
Oswald, W.J., Golueke, C. 1960. Biological Transformation of Solar Energy. Advances in Applied Microbiology. 2: 223-262.
Owen, W., Dtucky, D., Healy, J., Young, L., McCarty, P. 1979. Bioassay for monitoring biochemical methane potential and anaerobic toxicity. Water Research. 13: 485-492.
Pavlostathis, S.G., Gosset, J.M. 1985. Alkaline treatment of wheat straw for increasing anaerobic biodegradability. Biotechnology and Bioengineering. 27: 334-344.
Parkin, G.F., Owen, W.F. (1986). Fundamentals of Anaerobic Digestion of Wastewater Sludges. ASCE, Journal of Environmental Engineering Division. 122: 867-920.
Richards, B.K., Cummings, R.J., Jewell, W.J. and Herndon, F.G. 1991. High solids anaerobic methane fermentation of sorghum and cellulose. Biomass and Bioenergy. 1: 47-53.
Rubio-Loza, L.A., Noyola, A. Two-phase (acidogenic-methanogenic) anaerobic thermophilic/mesophilic digestion system for producing Class A biosolids from municipal sludge. Bioresouce technology. Zs 101 (2): Jan 2010: 576-585.
Samson, R., LeDuy, A. 1986. Detailed study of anaerobic digestion of Spirulina
maxima algae biomass. Biotechnol Bioeng. 28: 1014-1023.
Schulze, K.L., 1958. Sludge digestion and methane fermentation, Part 1. Increase solids concept. Sewage and Industrial Wastes. 30: 28-33.
Sialve, B., Bernet, N., Bernard, O. 2009. Anaerobic digestion of microalgae as a necessary step to make microalgal biodiesel sustainable. Biotechnology Advances. 2009. 27:409-416.
Stewart, D.J., Bogue, M.J., Badger, B.M. 1984. Biogas production rom crops and organic wastes. 2. Results of continuous digestion tests. New Zealand J. Sci., 27: 285-294.
Symons, G.E., Buswell, A.M. 1933. The methane fermentation of carbohydrates. J Am Chem Soc. 55:2028-2036.
Thauer, R.K. Biochemistry of methanogenesis: a tribute to Marjory Stephenson. Microbiology. 1998. 144: 2377-2406.
Visser, A., Gao, Y., Letting A.G. Effects of pH on methanogenesis and sulphate reduction in thermophilic UASB reactors. Bioresource technology. 1993: Vol 44 (2): 113-121

103
Yang, S.T., Okos, M.R. Kinetic Study and Mathematical Modeling of Methanogenesis of Acetate Using Pure Cultures of Methanogens. Biotechnology and Bioengineering.. 30: 5, 1987: 661-667
Zeikus, J.G. 1980. Microbial Populations in digesters. In “Anaerobic Digestion” (Eds. D.A. Stafford et al.) Applied Science Publishers Ltd. London. 61-87.
Zinder, S.H., Anguish, T., Cardwell, S.C. Effects of Temperature on Methanogenesis in a Thermophilic Anaerobic Digestor. Appl Environ Microbiol. 1984. 47(4): 808-813.

104
APPENDIX 1: Methane Potential Calculations:
a. Cellular Component Potential
Proteins:
(1/66)C16H24O5N4 + (27/66)H2O � (8/33)CO2 + (2/33)NH4+ + (31/33)H+ + e-
(1/8) CO2 + H+ + e- � (1/8) CH4 + (1/4) H2O
= 8.25 mol CH4 / mol protein Molecular Weight = 352 g/mol
Lipids:
(1/46)C8H16O + (15/46)H2O � (4/23)CO2 + H+ + e-
(1/8) CO2 + H+ + e- � (1/8) CH4 + (1/4) H2O
= 5.75 mol CH4 / mol lipid Molecular Weight = 128 g/mol
Carbohydrates:
(1/4)CH2O + (1/4)H2O � (1/4)CO2 + H+ + e-
(1/8) CO2 + H+ + e- � (1/8) CH4 + (1/4) H2O
= 0.5 mol CH4 / mol carbohydrate Molecular Weight = 30 g/mol
b. Methane Yield For Chlorella
Proteins = 56% Lipids= 12 % Carbohydrates = 19%
c. Methane Yield for Scenedesmus
Proteins = 53% Lipids = 13% Carbohydrates = 15%

105


![Biotechnology for Biofuels - indiaenvironmentportal for Biofuels Aug 2008.pdf · previously [14]. The pretreatment was performed without significant loss of valuable fermentable sugars](https://img.dokumen.tips/doc/110x75/5e428349a8d33c605344c324/biotechnology-for-biofuels-india-for-biofuels-aug-2008pdf-previously-14.jpg)