Embed Size (px)
Citation preview

A. A. Rassafi, et al. Strategies for Utilizing...Int. J. Environ. Sci. Tech.© Supplement Winter 2006, Vol. 3, No. 1, pp. 59-68
Received 28 August 2005; revised 12 February 2006; accepted 3 March 2006 available online 18 April 2006
*Corresponding Author, E-mail: [email protected]
ABSTRACT: The current paper is an attempt to find a sustainable fuel strategy for passenger cars in Iran.Currently, most of Iran’s passenger cars consume gasoline, a non-renewable fossil fuel. This fuel has well-knownenvironmental impacts, including various kinds of pollutions, as well as the threat of quick running out. These generalnegative characteristics of gasoline are amplified by the high consumption rate of Iran’s transportation sector, (e.g.about three times more than that of UK). The objective of this paper is firstly selecting possible alternative fuels forIran’s transportation sector, and then proposing the percent of cars consuming these alternative fuels (along withgasoline). The best strategies are proposed based on environmental and economic considerations, and hence are moresustainable decisions comparing with the other strategies. The best strategies are found using partial order theory andHasse diagram technique, which is a multi-criteria decision analysis (MCDA) tool.
Key words: Alternative fuels, passenger car, sustainable development, emission, MCDA
INTRODUCTION Since the publication of “Our common future”(WCED, 1987) and the introduction of sustainabledevelopment, transportation has been on the centerof the attention in many sustainability studies (Hardiand Zdan, 1997; Moffat, et al., 2001, Rassafi andVaziri, 2005; Vaziri and Rassafi, 2001; Vaziri and Rassafi,2003). It is because of the substantial impacts oftransportation on both the environment and society.The environmental impacts of transportation aremainly categorized as air pollution, and non-renewableresource depletion. Both of these environmentalimpacts of transportation are directly related to thefuels it uses. Vehicles’ engines use carbon andhydrogen from fuel, and oxygen and nitrogen from airduring a combustion process to create energy. Theunwelcome output of such burning process is theemission of dangerous gases into the environment.Fig. 1 shows the schematics of the combustion of apetroleum fuel. The pollutants of such a process havedifferent environmental impacts. Some of thesepollutants, including carbon dioxide, nitrous oxide,and methane, are called “Greenhouse Gases” whichtheir impacts are global (APEA, 1995). The otherpollutants with more local impact include carbonmonoxide, sulfur dioxide, particulates, lead, andNMHC (Non-Methane Hydrocarbons). Fig. 2 showsthe annual average concentration of pollutants and
environmental standards at a central region of Tehranduring 1995-2000 (Asadollah-Fardi, 2004). Thisvariety of pollutants raises concerns about thenegative consequences of transportation fuel usage.Despite of the above-mentioned disutility, fossil fuelsare widely used by most of the transportationvehicles. At present, 100 percent of the Iran’s demandfor transportation is met by derivatives of the fossilfuel, petroleum. Fig. 3 illustrates the consumption ofdifferent fuels by Iran’s transportation sector in year2000 (IFCOO, 2004). Furthermore, these fuels arecategorized as non-renewable resources, and soonor late, they will be finished. These two facts increasesworries about the future status of the world in termsof sustainability issues, and imply that any decisionregarding this kind of fuel is crucial to the human’sfuture. The paper is an attempt to propose a moresustainable fuel strategy for Iran which may be botheconomically and environmentally better than theothers. This is achieved by performing a multi-criteriadecision-making tool, Hasse Diagram Technique(HDT), to propose the comparatively more sustainablefuel strategy. HDT is a tool that using partial ordertheory makes a comparison among the alternatives.The rest of the paper is organized as follows: First,the method, partial order theory and HDT areexplained, and the resources which may be used as
Strategies for utilizing alternative fuels by Iranian passenger cars 1*A. A. Rassafi, 2M. Vaziri and 1A. N. Azadani
1Department of Engineering, Imam Khomeini International University, Ghazvin, Iran 2Department of Civil Engineering, Sharif University of Technology, Tehran, Iran

A. A. Rassafi, et al. Strategies for Utilizing...
alternatives of ordinary fossil fuels are introduced,and their economical and environmental characteristicsare discussed. Then, the more sustainable strategyfor passenger car fuels is proposed after utilizing HDT.Finally.
Fig. 1: Combustion of an average petroleum fuel (APEA, 1995)
Fig. 2: Annual average concentration of pollutants at Tehran’s center
MATERIALS AND METHODS In this section the method that is used for the study,and the information based on which the analysis iscarried out are introduced. The research was made forIran and the study year was 2005. However, the timeand geographical scope of the study can be altered orbe extended.
0
20
40
60
80
100
120
1995 1996 1999 2000
Year
SO 2 NO NO 2 NOx CO O 3
ENERGY
Carbon
Hydrogen
Oxygen
Nitrogen
Nitrogen
Carbon Dioxide
Water
Fuel
A
ir
Exha
ust
Carbon Monoxide
Other Pollutions
Ave
rage
PPB
60
SO2 NO NO2 NOX CO O3

A. A. Rassafi, et al. Strategies for Utilizing...
Fig. 3: Consumption of different fuels by Iran’s transportation sector in year 2000 (IFCOO, 2004)
Partial order theory and hasse diagram technique Partial order theory and Hasse diagrams appears tobe a promising tool for decision-making particularly inenvironmental issues (Lerche and Sonersen, 2003). Apartial order on a set P is a relation such as < ( P2)that is: reflexive (x x), antisymmetric (x y and y ximply x = y), and transitive (x y and y z imply x z).The set P is called the ground set of the pair (P, )which is referred to as a partially ordered set or poset.The elements of a poset which can be alternatives orobjects (or as in the current research, candidate fuels)are said to be partially ordered when it is impossible tofind a mutual relation for all criteria. In a poset, differentdescriptors are used simultaneously as rankingparameters for a series of objects (i.e. fuels).The ordered set can be visualized in a graph whereeach object is represented by a circle and thecomparability of each pair of objects is shown by a linkbetween those two objects. The higher ranked of the two is given a point withhigher vertical position. Due to the transitivecharacteristic of the posets, the graph can be greatlysimplified by only drawing next neighbor connections.This kind of graphical representation of posets isreferred to as a Hasse diagram (Lerche and Sonersen,2003). In the next sections this technique is used toevaluate the candidate fuels. As an illustrative example
for Hasse diagram, consider a group of four personsP={A, B, C, D} as a ground set, and this technique isused for comparative evaluation of their physical size.Suppose that the taller and heavier the persons are,the bigger they are. The heights of four persons of thetest are 65", 71", 75", and 78", respectively. Theirrespective weights are 132 lb, 180 lb, 155 lb, and 200 lb.Therefore, the relation ‘>’ is partial ordering on P and(P, >) is a poset. A Hasse diagram of such example isshown in Fig. 4. As it can be seen in Fig. 4, ‘A’ is boththe shortest and the thinnest member among the othersand thus takes the lowest place. On the contrary, ‘D’ isthe biggest one because he is the tallest and heaviest.Therefore, his position is at the top of the diagram.However, the same reasoning for ‘B’ and ‘C’ is not assimple as that of ‘A’ and ‘B’. ‘B’ is taller than ‘C’, while‘C’ is heavier than ‘B’. Thus, these people are notcomparable with each other and take the same level inthe diagram. The straight lines between each pair ofpeople represent the existence of relation (i.e. >)between those two. For example if the height of ‘B’ ischanged from 180 to 210 the Hasse diagram of such setwould be changed as shown in Fig. 5. The missing linebetween ‘D’ and ‘B’ means that they are not comparableeither. However, because ‘D’ is comparable with ‘C’(and is located above it in the diagram), it is located inan upper level comparing with ‘B’ too.
LPG1%
Gasoline51%
Diesel48%
61
< < <<< <
<

A. A. Rassafi, et al. Strategies for Utilizing...
Fig. 5: New Hasse diagram of the example afterapplying the change
Fig. 4: Hasse diagram of the example
Candidate fuels and their characteristics There are three major fuels currently in use by differentmodes of Iran’s transport. Gasoline and diesel are thecustomary fuels consumed by vehicles, and LPG is theother source which is recently used only by a smallportion of taxis (IFCOO, 2004). Diesel is used mainly byheavy duty vehicles and is not the paper’s focus. Thepaper considers gasoline and its alternatives in theanalysis of finding the more sustainable strategy forpassenger car fuel. The term ‘alternative fuel’ no longerrefers to experimental wishful thinking, but a range ofcommercially viable, safe materials which could feasiblyreplace gasoline and diesel. The most notablealternative fuels are LPG, CNG, hydrogen, andElectr icity. Each of these fuels produces lessgreenhouse gas emissions comparing with gasoline.The selected alternatives of gasoline are LPG, whichis currently being used by a limited number of vehicles,CNG, which is gradually being introduced to thecommunity, and hydrogen, which is the current paper’schoice as a renewable and environmentally sound fuel.The other alternative fuels such as methanol, ethanol,ethers, petrohol, etc, are impracticable due to economiclimitations as well as the problem of their publicity.The listed fuels in Table 1 are possible resources thatcan be considered for further assessments. The codesrepresent candidate fuels and will be used in theappraisal. Therefore, the study focuses on theeconomic and environmental characteristics of the 4candidate fuels (gasoline and its 3 alternatives) in orderto find a more sustainable decision.
Economic aspects of fuels The costs considered in this paper for each fuelinclude several items which are paid by both consumersand government. Consumers’ costs include paymentof the fuel price, and the cost of changing the vehicleengines (or extra payment in case of purchasing analternative fuel car) in order to be able to use alternativefuels. Government’s costs include subsidies given tothe fuel prices, and the expenditures of constructingnew stations for alternative fuels. It should be notedthat in addition to the direct costs of fuels, a wide rangeof issues are involved in developing a successfulalternative fuels program including publicity ofalternative fuels, comparison with conventional fuels,etc. These factors will not be considered in the analysisbecause of their difficulties in measuring andquantification. Table 2 has listed the economic as wellas physical characteristics of the study fuels.
Environmental aspects of fuels As stated earlier, the environmental impacts of fuelsare categorized in two major groups: pollution and non-renewable resource depletion. The first group containsthe materials which are emitted to the environment aftercombustion process. They are greenhouse gases (CO2, NOx, and CH4), as well as CO, S, lead, particles, andNMHC. The weights of these emissions for each fuelhave been listed in Table 3. The numbers in this tablefor each fuel reflect the polluting power of that fuel.The second group regards to the privilege of renewalof the fuel. In this paper a binary variable represents
62
A. A. Rassafi, et al. Strategies for Utilizing...
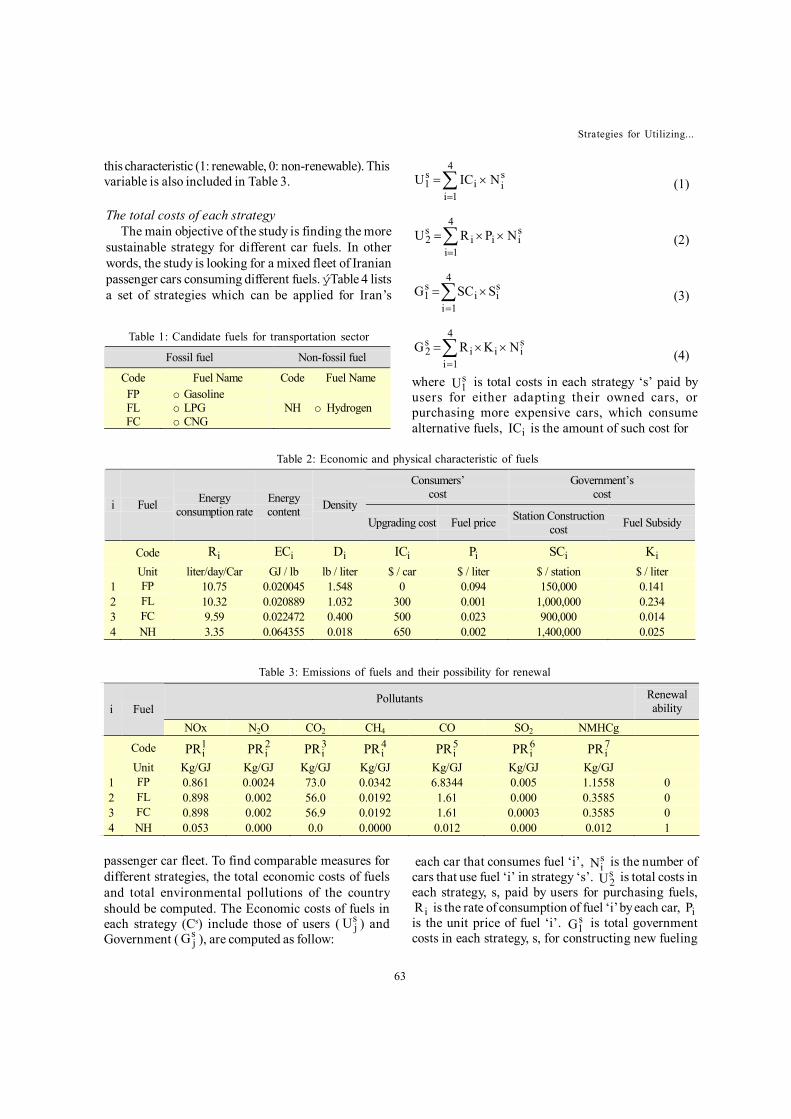
Table 1: Candidate fuels for transportation sector
Table 2: Economic and physical characteristic of fuels
Table 3: Emissions of fuels and their possibility for renewal
The total costs of each strategy The main objective of the study is finding the moresustainable strategy for different car fuels. In otherwords, the study is looking for a mixed fleet of Iranianpassenger cars consuming different fuels. ýTable 4 listsa set of strategies which can be applied for Iran’s
passenger car fleet. To find comparable measures fordifferent strategies, the total economic costs of fuelsand total environmental pollutions of the countryshould be computed. The Economic costs of fuels ineach strategy (Cs) include those of users ( s
jU ) andGovernment ( s
jG ), are computed as follow:
each car that consumes fuel ‘i’, siN is the number of
cars that use fuel ‘i’ in strategy ‘s’. s2U is total costs in
each strategy, s, paid by users for purchasing fuels,iR is the rate of consumption of fuel ‘i’ by each car, iP
is the unit price of fuel ‘i’. s1G is total government
costs in each strategy, s, for constructing new fueling
Fossil fuel Non-fossil fuel
Code Fuel Name Code Fuel Name FP FL FC
o Gasoline o LPG o CNG
NH o Hydrogen
Consumers’ cost
Government’s cost
i Fuel Energy consumption rate
Energy content Density
Upgrading cost Fuel price Station Construction cost Fuel Subsidy
Code iR iEC iD iIC iP iSC iKUnit liter/day/Car GJ / lb lb / liter $ / car $ / liter $ / station $ / liter
1 FP 10.75 0.020045 1.548 0 0.094 150,000 0.141 2 FL 10.32 0.020889 1.032 300 0.001 1,000,000 0.234 3 FC 9.59 0.022472 0.400 500 0.023 900,000 0.014 4 NH 3.35 0.064355 0.018 650 0.002 1,400,000 0.025
Pollutants Renewal ability i Fuel
NOx N2O CO2 CH4 CO SO2 NMHCg
Code 1iPR 2
iPR 3iPR 4
iPR 5iPR 6
iPR 7iPR
Unit Kg/GJ Kg/GJ Kg/GJ Kg/GJ Kg/GJ Kg/GJ Kg/GJ 1 FP 0.861 0.0024 73.0 0.0342 6.8344 0.005 1.1558 02 FL 0.898 0.002 56.0 0.0192 1.61 0.000 0.3585 03 FC 0.898 0.002 56.9 0.0192 1.61 0.0003 0.3585 04 NH 0.053 0.000 0.0 0.0000 0.012 0.000 0.012 1
63
this characteristic (1: renewable, 0: non-renewable). Thisvariable is also included in Table 3.
4
1i
sii
s1 NICU (1)
4
1i
siii
s2 NPRU (2)
4
1i
sii
s1 SSCG (3)
4
1i
siii
s2 NKRG (4)
where s1U is total costs in each strategy ‘s’ paid by
users for either adapting their owned cars, orpurchasing more expensive cars, which consumealternative fuels, iIC is the amount of such cost for

A. A. Rassafi, et al. Strategies for Utilizing...
stations, iSC is the cost of building a station for fuel‘i’, s
iS is the number of required stations for fuel ‘i’ ineach strategy ‘s’. s
2G is total government costs in eachstrategy, s, for subsidizing fuels, and iK is the amountof subsidy for each unit of fuel ‘i’. The environmentalaspect of strategies in this study comprises total airpollutions emitting during a year. The differentpollutions of fuels in each strategy are computed asfollow:
k=1, 2, …, 7 (5)where s
kPO is the total emission of pollution of type‘k’ in strategy ‘s’, iEC is the energy content of fuel ‘i’,
iD is the density of fuel ‘i’, kiPR is the polluting rate
of type ‘k’ from fuel ‘i’. Table 5 has listed the aboveparameters and variables and their units for a moreconvenient reference. The above equations are usedfor computations of total costs and pollutions of thecountry having the following assumptions:
Strategies are static. It means they will not be appliedgradually over several years, but all at once at thebeginning of the year.
The car to station ratio is constant for all fuels andequals about 1100 car/station (Iranian FuelConsumption Optimization Organization, 2004).
The subsidization for hydrogen (, which is currentlyan unused fuel in Iran) is assumed to be similar withthat of other fuels.
Number of available cars in the study year is about2 *106 (ITRS, 1997).
Table 5: Proposed strategies to be evaluated
Percent of cars that should consume:
Percent of cars that should consume: Strategy
Code FP FL FC NH
Strategy Code
FP FL FC NHS1 30 0 40 30 S24 40 30 30 0S2 30 0 50 20 S25 50 0 30 20S3 30 0 60 10 S26 50 0 40 10S4 30 0 70 0 S27 50 0 50 0S5 30 10 30 30 S28 50 10 20 20S6 30 10 40 20 S29 50 10 30 10S7 30 10 50 10 S30 50 10 40 0S8 30 10 60 0 S31 50 20 20 10S9 30 20 30 20 S32 50 20 30 0
S10 30 20 40 10 S33 60 0 20 20S11 30 20 50 0 S34 60 0 30 10S12 30 30 30 10 S35 60 0 40 0S13 30 30 40 0 S36 60 10 20 10S14 40 0 30 30 S37 60 10 30 0S15 40 0 40 20 S38 60 20 20 0S16 40 0 50 10 S39 70 0 20 10S17 40 0 60 0 S40 70 0 30 0S18 40 10 30 20 S41 70 10 10 10S19 40 10 40 10 S42 70 10 20 0S20 40 10 50 0 S43 80 0 10 10S21 40 20 20 20 S44 80 0 20 0S22 40 20 30 10 S45 80 10 10 0S23 40 20 40 0
64
4
1i
sii
kiii
sk NRPRDECPO

A. A. Rassafi, et al. Strategies for Utilizing...
Hydrogen-fuel cars use compressed hydrogen invery thick, heavy tanks. Such tanks can hold hydrogenat around 100 times atmospheric pressure, or 1500 PSI.The Ideal Gas Law identifies that in these conditionsthe hydrogen would only take up 29 cubic feet, whichis equivalent to around 60 of those high pressurestorage tanks (to match the effective capacity of the 15gallon gasoline tank) (Johnson, 2004). The density ofhydrogen in such state equals 0.018 lb/liter.
The study was performed in 2005 in Iran.
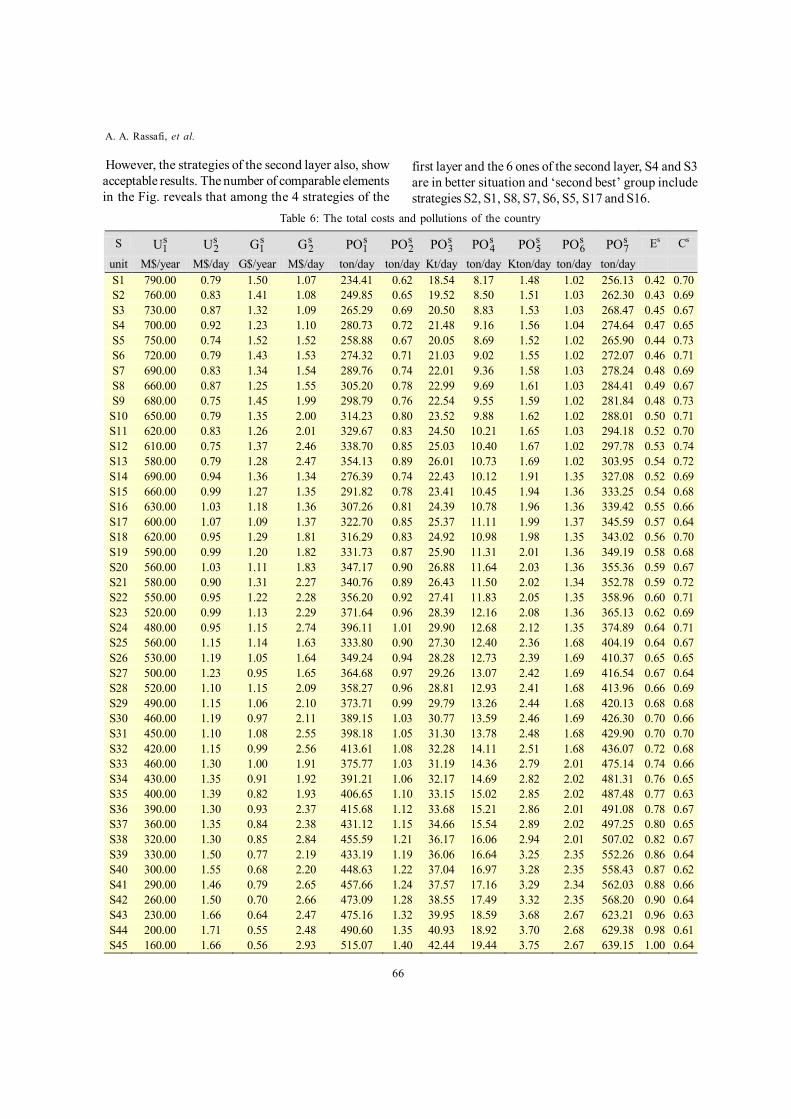
RESULTS Applying the previously-mentioned assumptions andequations will result in forming Table 6 which includesthe total costs and pollutions of the country. It is worthnoting that some of the columns have different unitbase (per year and per day). Furthermore, there are twotypes of costs: s
1U and s1G are capital costs that will
be paid once for several years, while s2U and s
2G areoperating costs. This will not affect on the final results,because the variables (columns of this table,) will notbe added together before introducing to the HDT.Furthermore, they will be rescaled into a 0-1 interval, inorder to assign equal weightings to the differentaspects of fuels. The next step (after rescaling thevalues) is finding environmental and economic indices
of each strategy. These are found by the followingequations:
7
)PO(NORME
7
1k
sk
s (6)
4
)G(NORM)U(NORMC
2
1i
2
1i
si
si
s (7)
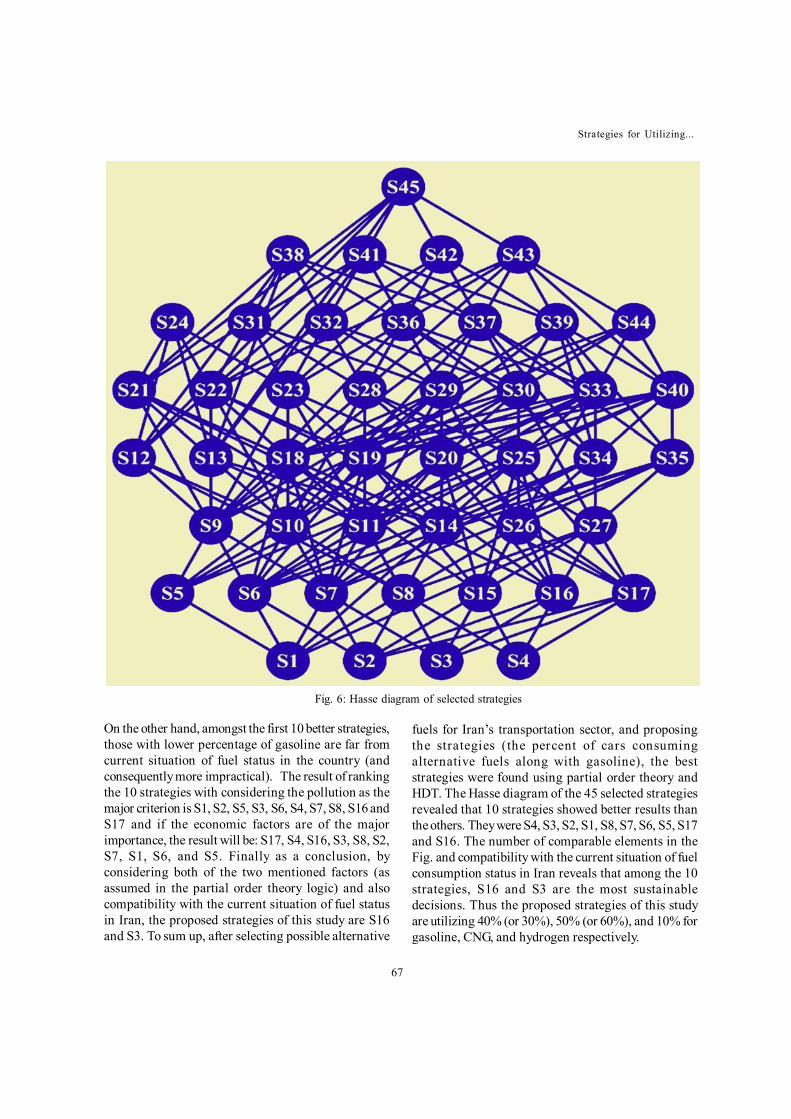
where (NORM) is the function that rescales thevariables, Es is the environmental index of strategy ‘s’,and Cs is the economic index of strategy ‘s’.These indices have been tabulated in two last columnsof Table 6. Fig. 6 is the Hasse diagram of the 45 selectedstrategies. Because all of the indices (i.e. costs andpollutions) are undesirable, the relation for the posetis ‘<’ and the lower strategies in this Fig. are better (i.e.more sustainable) than the others.
DISCUSSION AND CONCLUSION The results confirm that 4 strategies at the lowestlayer show better performance comparing with theothers. They are S4, S3, S2 and S1.
Table 5: Description of variables and parametersCode Description unit
s1U Total users’ upgrading costs in strategy ‘s’ $ /year s2U Total users’ fuel costs in strategy ‘s’ $ /day s1G Total fueling stations construction costs in strategy ‘s’ $ /year s2G Total fuel subsidies in strategy ‘s’ $ /day skPO Total emission of type-k pollution in strategy ‘s’ Kg /day
iIC Unit upgrading costs of type-i cars $ /car siN Number of type-i cars in strategy s Cars
iR Unit consumption rate of type-i cars Liters / day / car
iP Unit price of type-i fuel $ / liter
iSC Unit cost of building a type-i station $ / station siS Required type-i stations in strategy ‘s’ Stations
iK Unit type-i fuel subsidy $ / liter
iEC Energy content of type-i fuel GJ / lb
iD Density of type-i fuel Lb/liter kiPR Type-k polluting rate of type-i fuel Kg / GJ
65
A. A. Rassafi, et al. Strategies for Utilizing...
However, the strategies of the second layer also, showacceptable results. The number of comparable elementsin the Fig. reveals that among the 4 strategies of the
Table 6: The total costs and pollutions of the country
S s1U s
2U s1G s
2G s1PO s
2PO s3PO s
4PO s5PO s
6PO s7PO Es Cs
unit M$/year M$/day G$/year M$/day ton/day ton/day Kt/day ton/day Kton/day ton/day ton/day S1 790.00 0.79 1.50 1.07 234.41 0.62 18.54 8.17 1.48 1.02 256.13 0.42 0.70S2 760.00 0.83 1.41 1.08 249.85 0.65 19.52 8.50 1.51 1.03 262.30 0.43 0.69S3 730.00 0.87 1.32 1.09 265.29 0.69 20.50 8.83 1.53 1.03 268.47 0.45 0.67S4 700.00 0.92 1.23 1.10 280.73 0.72 21.48 9.16 1.56 1.04 274.64 0.47 0.65S5 750.00 0.74 1.52 1.52 258.88 0.67 20.05 8.69 1.52 1.02 265.90 0.44 0.73S6 720.00 0.79 1.43 1.53 274.32 0.71 21.03 9.02 1.55 1.02 272.07 0.46 0.71S7 690.00 0.83 1.34 1.54 289.76 0.74 22.01 9.36 1.58 1.03 278.24 0.48 0.69S8 660.00 0.87 1.25 1.55 305.20 0.78 22.99 9.69 1.61 1.03 284.41 0.49 0.67S9 680.00 0.75 1.45 1.99 298.79 0.76 22.54 9.55 1.59 1.02 281.84 0.48 0.73S10 650.00 0.79 1.35 2.00 314.23 0.80 23.52 9.88 1.62 1.02 288.01 0.50 0.71S11 620.00 0.83 1.26 2.01 329.67 0.83 24.50 10.21 1.65 1.03 294.18 0.52 0.70S12 610.00 0.75 1.37 2.46 338.70 0.85 25.03 10.40 1.67 1.02 297.78 0.53 0.74S13 580.00 0.79 1.28 2.47 354.13 0.89 26.01 10.73 1.69 1.02 303.95 0.54 0.72S14 690.00 0.94 1.36 1.34 276.39 0.74 22.43 10.12 1.91 1.35 327.08 0.52 0.69S15 660.00 0.99 1.27 1.35 291.82 0.78 23.41 10.45 1.94 1.36 333.25 0.54 0.68S16 630.00 1.03 1.18 1.36 307.26 0.81 24.39 10.78 1.96 1.36 339.42 0.55 0.66S17 600.00 1.07 1.09 1.37 322.70 0.85 25.37 11.11 1.99 1.37 345.59 0.57 0.64S18 620.00 0.95 1.29 1.81 316.29 0.83 24.92 10.98 1.98 1.35 343.02 0.56 0.70S19 590.00 0.99 1.20 1.82 331.73 0.87 25.90 11.31 2.01 1.36 349.19 0.58 0.68S20 560.00 1.03 1.11 1.83 347.17 0.90 26.88 11.64 2.03 1.36 355.36 0.59 0.67S21 580.00 0.90 1.31 2.27 340.76 0.89 26.43 11.50 2.02 1.34 352.78 0.59 0.72S22 550.00 0.95 1.22 2.28 356.20 0.92 27.41 11.83 2.05 1.35 358.96 0.60 0.71S23 520.00 0.99 1.13 2.29 371.64 0.96 28.39 12.16 2.08 1.36 365.13 0.62 0.69S24 480.00 0.95 1.15 2.74 396.11 1.01 29.90 12.68 2.12 1.35 374.89 0.64 0.71S25 560.00 1.15 1.14 1.63 333.80 0.90 27.30 12.40 2.36 1.68 404.19 0.64 0.67S26 530.00 1.19 1.05 1.64 349.24 0.94 28.28 12.73 2.39 1.69 410.37 0.65 0.65S27 500.00 1.23 0.95 1.65 364.68 0.97 29.26 13.07 2.42 1.69 416.54 0.67 0.64S28 520.00 1.10 1.15 2.09 358.27 0.96 28.81 12.93 2.41 1.68 413.96 0.66 0.69S29 490.00 1.15 1.06 2.10 373.71 0.99 29.79 13.26 2.44 1.68 420.13 0.68 0.68S30 460.00 1.19 0.97 2.11 389.15 1.03 30.77 13.59 2.46 1.69 426.30 0.70 0.66S31 450.00 1.10 1.08 2.55 398.18 1.05 31.30 13.78 2.48 1.68 429.90 0.70 0.70S32 420.00 1.15 0.99 2.56 413.61 1.08 32.28 14.11 2.51 1.68 436.07 0.72 0.68S33 460.00 1.30 1.00 1.91 375.77 1.03 31.19 14.36 2.79 2.01 475.14 0.74 0.66S34 430.00 1.35 0.91 1.92 391.21 1.06 32.17 14.69 2.82 2.02 481.31 0.76 0.65S35 400.00 1.39 0.82 1.93 406.65 1.10 33.15 15.02 2.85 2.02 487.48 0.77 0.63S36 390.00 1.30 0.93 2.37 415.68 1.12 33.68 15.21 2.86 2.01 491.08 0.78 0.67S37 360.00 1.35 0.84 2.38 431.12 1.15 34.66 15.54 2.89 2.02 497.25 0.80 0.65S38 320.00 1.30 0.85 2.84 455.59 1.21 36.17 16.06 2.94 2.01 507.02 0.82 0.67S39 330.00 1.50 0.77 2.19 433.19 1.19 36.06 16.64 3.25 2.35 552.26 0.86 0.64S40 300.00 1.55 0.68 2.20 448.63 1.22 37.04 16.97 3.28 2.35 558.43 0.87 0.62S41 290.00 1.46 0.79 2.65 457.66 1.24 37.57 17.16 3.29 2.34 562.03 0.88 0.66S42 260.00 1.50 0.70 2.66 473.09 1.28 38.55 17.49 3.32 2.35 568.20 0.90 0.64S43 230.00 1.66 0.64 2.47 475.16 1.32 39.95 18.59 3.68 2.67 623.21 0.96 0.63S44 200.00 1.71 0.55 2.48 490.60 1.35 40.93 18.92 3.70 2.68 629.38 0.98 0.61S45 160.00 1.66 0.56 2.93 515.07 1.40 42.44 19.44 3.75 2.67 639.15 1.00 0.64
66
first layer and the 6 ones of the second layer, S4 and S3are in better situation and ‘second best’ group includestrategies S2, S1, S8, S7, S6, S5, S17 and S16.
A. A. Rassafi, et al. Strategies for Utilizing...
Fig. 6: Hasse diagram of selected strategies
On the other hand, amongst the first 10 better strategies,those with lower percentage of gasoline are far fromcurrent situation of fuel status in the country (andconsequently more impractical). The result of rankingthe 10 strategies with considering the pollution as themajor criterion is S1, S2, S5, S3, S6, S4, S7, S8, S16 andS17 and if the economic factors are of the majorimportance, the result will be: S17, S4, S16, S3, S8, S2,S7, S1, S6, and S5. Finally as a conclusion, byconsidering both of the two mentioned factors (asassumed in the partial order theory logic) and alsocompatibility with the current situation of fuel statusin Iran, the proposed strategies of this study are S16and S3. To sum up, after selecting possible alternative
fuels for Iran’s transportation sector, and proposingthe strategies (the percent of cars consumingalternative fuels along with gasoline), the beststrategies were found using partial order theory andHDT. The Hasse diagram of the 45 selected strategiesrevealed that 10 strategies showed better results thanthe others. They were S4, S3, S2, S1, S8, S7, S6, S5, S17and S16. The number of comparable elements in theFig. and compatibility with the current situation of fuelconsumption status in Iran reveals that among the 10strategies, S16 and S3 are the most sustainabledecisions. Thus the proposed strategies of this studyare utilizing 40% (or 30%), 50% (or 60%), and 10% forgasoline, CNG, and hydrogen respectively.
67
A. A. Rassafi, et al. Strategies for Utilizing...
REFERENCESAsadollah-Fardi, G. R., (2004)., Current situation of a ir
pollution in Tehran with emphasis on district 12. availableat: www.iges.or.jp/kitakyushu/Meetings/KIN1/Presentations/SessionII/Teheran.pdf.
Anonymous, (1987)., World Commission on Environmentand Development (WCED), (1987)., Our Common Future.Oxford University Press, Oxford.
Anonymous, (1995)., Austra lian Petroleum ExplorationAssociation, (APEA), Alternative Transport Fuels.Petroleum Topics. Australian Institu te of Petroleum.,available at: www.appea.com.au/Publications/PetroleumTopics/ Alternative_Transport_fuels.pdf. (2004).
Anonymous, (1997)., Institute for Transportation Researchand Studies, (ITRS)., Car ownership models (in Persian),Report No. 76-11, Mashad Comprehensive TransportationPlan, Sharif University of Technology, Tehran, Iran.
Anonymous, (2004)., Iranian Fuel Consumption OptimizingOrganization, (2004)., available at: www.ieeo.org. Ministryof Petroleum.
Hardi, P. and Zdan, T., (1997)., Measuring SustainableDevelopment: Review of Current Practice, International
Institute for Sustainable Development. Occasional Paper17, Canada.
Johnson, C., (2004)., Hydrogen as a Fuel for Automobiles.available at: http://mb-soft.com/public2/hydrogen.html.
Lerche, D. and Sonersen, P. B., (2003)., Evaluation of theranking probabilities for partial orders based on randomlinear extensions, Chemosphere, 53 , 981-992.
Moffatt, I. , (2001). Measuring and modeling sustainabledevelopment, Parthenon Publishing Group, London.
Rassafi, A. A. and Vaziri, M., (2005)., Sustainable transportindicators: Definition and integration. IInt. J. Environ. Sci.Tech., 2 (1), 83-96.
Vaziri, M. and Rassafi, A. A., (2001)., An appraisal of roadtransport sustainable development in the Asian and pacificregion. Technical Papers of International Seminar onSustainable Development on Road Transport, New Delhi,India. III39-III46.
Vaziri, M. and Rassafi, A. A., (2003)., Globalization andsustainable development: European experience. Proceedingsof “7th International Conference on Global Business andEconomic Development”, Bangkok, Thailand. 36-42.
68
AUTHOR (S) BIOSKETCHESRassafi, A. A., Assistant professor, Department of Engineering, Imam Khomeini InternationalUniversity, Ghazvin, 34149, Iran. E-mail: [email protected]
Vaziri, M., Professor, Department of Civil Engineering, Sharif University of Technology, Tehran,14588, Iran.
Azadanin, A. N., M.Sc. Student, Faculty of Engineering, Imam Khomeini International University,Gazvin, 34149, Iran.
This article should be referenced as follows:Rassafi, A. A., Vaziri M. and Azadani A. N., (2006). Strategies for utilizing alternative fuels byIranian passenger cars. Int. J. Environ. Sci. Tech., 3 (1), 59-68.