Embed Size (px)
Citation preview

Director Hsueh-Yung (Mary) Tai
Division of Medical Review and Pharmaceutical Benefits
National Health Insurance Administration, Taiwan
Oct. 14, 2021
1
Strategies for Enhancing
Access to New Drugs and
Reimbursement Efficiencyunder Taiwan’s NHI System

Outline
Pharmaceutical Reimbursement System and
Expenditure in Taiwan
Principles and Procedures of drug listing
Increase Patients’ Access to New Drug
Enhance Reimbursement Efficiency
Conclusion
2

Pharmaceutical
Reimbursement System and
Expenditure in Taiwan
3

The insured
Co-payment
Medical care providers
NHIA
supportive
funding
Claim
Reimbursement
NHI IC
card
Premium
Medical
service
The Framework of NHI
4

CoverageCompulsory enrollment for all citizens and legal residents
Administration Single-payer system run by the government
Financing Premiums
Benefits Uniform package, copayment required
ProvidersAbout 93% of healthcare providers contracted with NHI
PaymentPlural payment programs under the global budget payment systems
PrivilegesPremium subsidies and copayment waivers for the
disadvantaged
5
NHI Characteristics
6
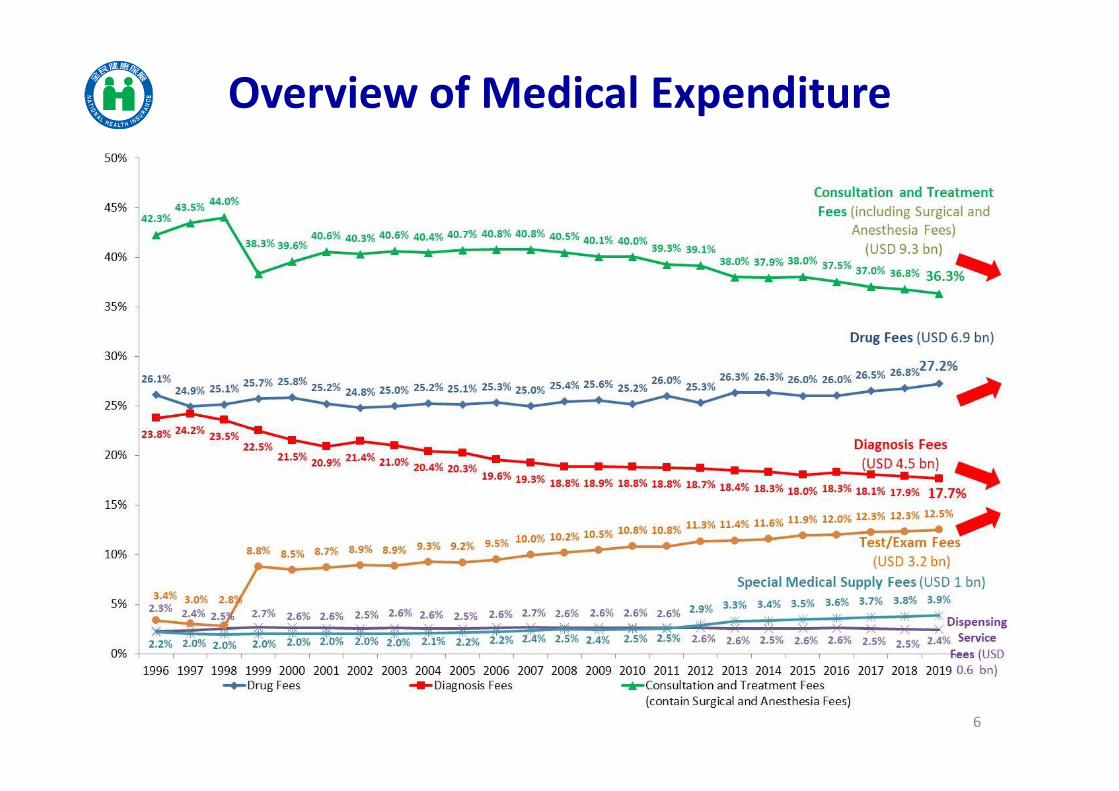
Overview of Medical Expenditure

Catastrophic disease Chronic disease (OPD) Others
YearExpenditure
(million USD)
Growth
rate%
Expenditure
(million USD)
Growth
rate%
Expenditure
(million USD)
Growth
rate%
2012 1,403 6.0% 30.7% 2,197 -2.9% 48.0% 977 -2.6% 21.4%
2013 1,529 8.9% 30.8% 2,442 11.2% 49.1% 1,000 2.2% 20.1%
2014 1,590 4.1% 30.7% 2,571 5.3% 49.6% 1,023 2.3% 19.7%
2015 1,632 2.5% 31.2% 2,597 1.0% 49.6% 1,006 -1.2% 19.3%
2016 1,735 6.4% 31.6% 2,713 4.5% 49.4% 1,045 3.7% 19.0%
2017 1,877 8.2% 31.7% 2,977 9.7% 50.3% 1,065 2.0% 18.0%
2018 2,032 8.2% 32.2% 3,187 7.0% 50.5% 1,094 2.5% 17.3%
2019 2,142 5.4% 31.9% 3,442 8.0% 51.2% 1,132 3.6% 16.9%
1. OPD chronic disease medications contribute to half of total drug expenditure . Medications
used for catastrophic diseases contribute to around 30% of total drug expenditure.
2. The expenditure on OPD chronic disease medications shows higher growth rate.
Factors Contribute to the Growth of
Drug Expenditure
7
Principles and Procedures
of Drug Listing
8

9
ValueCost
$
Pay for Value
Budget impact
SubjectsComparators CBA/CEA/PE
Ethical/legal/
social/political
impact
Relative
effectiveness
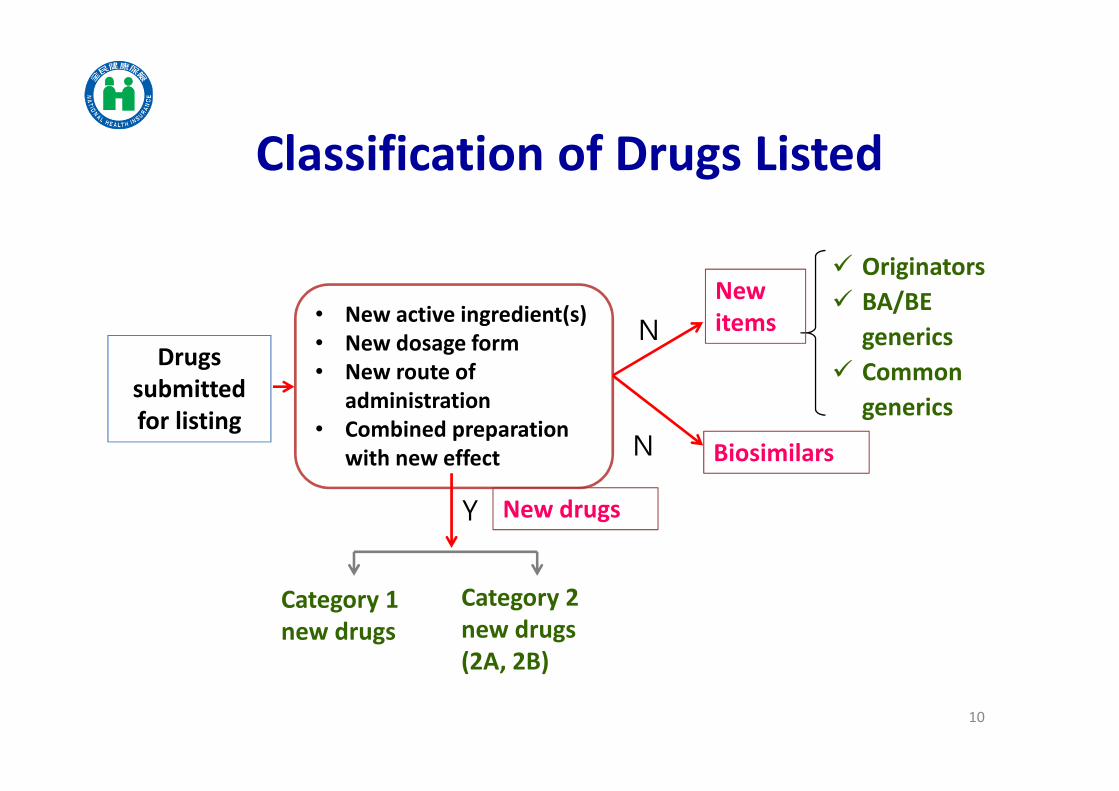
Classification of Drugs Listed
Drugs
submitted
for listing
• New active ingredient(s)
• New dosage form
• New route of
administration
• Combined preparation
with new effect
Originators
BA/BE
generics
Common
generics
N
Y
Category 1
new drugs
Category 2
new drugs
(2A, 2B)
New
items
New drugs
Biosimilars
10
N

Composed of stakeholders to ensure decision making for drug
listing and reimbursement
Healthcare Providers
Scholars and Experts
13
The Insured
Employers
Health Regulatory Authority
(MoHW)
Drug Regulatory Authority
(TFDA)
9
3
3
1
1
11
The Suppliers 3
PBRS Joint Meeting
2Patients

Category Pricing Mark-ups
1 Breakthrough Median price of A-10 countries• domestic clinical trials
(10%)
• domestic pharmaco-
economic study (up to 10%)
• better therapeutic effects
(up to 15%)
• greater safety (up to 15%)
• more convenient (up to
15%)
• pediatric preparations with
clinical implications (up to
15%)
2A Me-better
Capped at A-10 median price
• lowest price in A10
• price in original country
• international price ratio
• treatment-course dosage
ratio
• a combination drug is priced
at 70% of the sum of each
ingredient’s price, or at the
price of the single active
ingredient.
2B Me-too
12
A-10 reference countries:Australia, Belgium, Canada, France, Germany, Japan, Sweden,
Switzerland, US, UK.
Pricing of New Drug

Criteria Mark-ups
Performing domestic clinical trials 10%
Conducting domestic pharmaco-economic (PE) study Up to 10%
13
Criteria Mark-ups
Superior therapeutic effects, better safety,
favorable dosage forms of children’s medications
compared to the chosen comparators
Up to 15% for
each criterion
Better convenience (ex: longer dosing interval, better
route of administration, etc.)Up to 15%
To encourage innovation
To encourage local development of new drugs
Incentives in Pricing of New Drugs (1)

14
A new drug that demonstrates significant clinical value and is first introduced in Taiwan among the world
Based on actual transaction price
Cost calculation method
The listing prices of A-10 countries of the new drug and its comparators
Incentives in Pricing of New Drugs (2)

15
Year of
listing
No. of
cases
No. of
items
Minimum
(month)
Average
(month)
Maximum
(month)
Median
(month)
2013 19 26 4.2 7.8 12.9 7.7
2014 23 45 4.0 8.4 14.9 7.9
2015 22 40 6.3 11.5 22.0 10.0
2016 17 26 7.3 11.3 21.1 10.4
2017 29 50 7.3 12.0 31.3 8.9
2018 26 51 7.3 11.7 28.2 10.2
2019 33 51 3.7 11.5 19.1 10.6
2020 27 45 3.3 13.6 27.5 10.0
Total 196 334 3.3 11.1 31.3 10.0
New Drug Listing Time Course (from submission to listing)
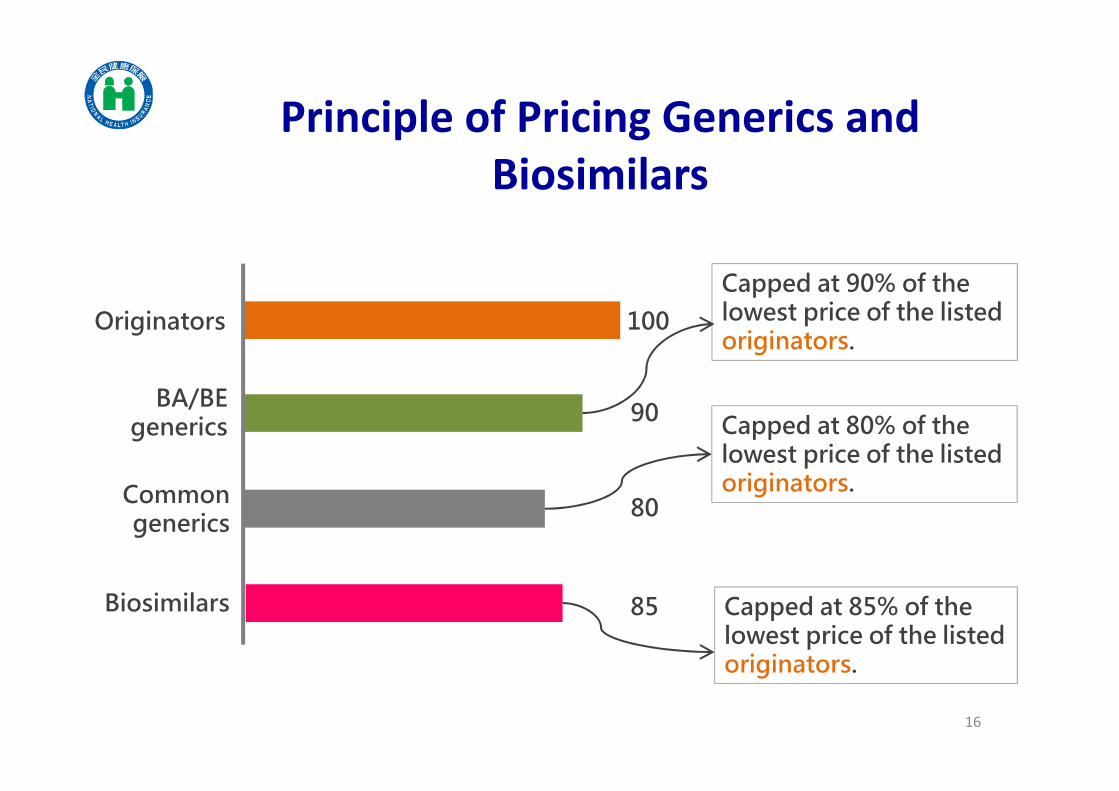
Principle of Pricing Generics and
Biosimilars
16
100Originators
BA/BE generics
Common generics
90
80
Capped at 80% of the lowest price of the listed originators.
Capped at 90% of the lowest price of the listed originators.
85Biosimilars Capped at 85% of the lowest price of the listed originators.
Increase Patients’ Access to
New Drug
17

18
New Drug Registration
Submission for listing
Expected indication
Expected date of
launch in Taiwan
Type of Budget
Expected date of submission
Expected reimbursed
indications
Expected date of listing
Suggested listing price
Comparator
Financial Forecast
MEA proposal or local PE
New Drug
Expansion of
reimbursed
indications
Breakthrough
drug
2A
2B
Claimed value of
the new drug Target population for disease
Target population for new
drug
New drug expenditure
Replaced drug expenditure
Budget impact
Launched in Sep. 2020
Submission type
The Registration Platform for Horizon Scanning

20212020
19
Horizon Scanning (2)
The end of Nov.
Deadline for HS
registration
2022 2023
Reference for estimating
the budget for 2022Data
collected
• New drug
• New reimbursed indication
1st yr 2st yr
1st yr
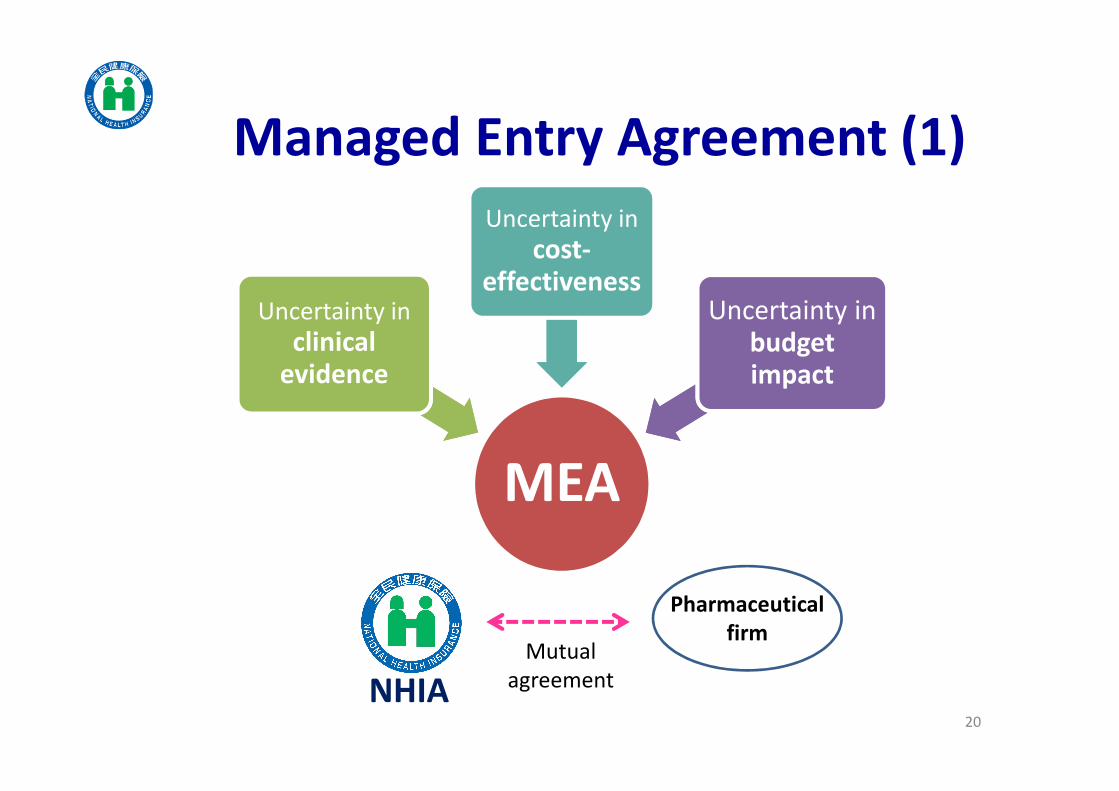
MEA
Uncertainty in
clinical evidence
Uncertainty in
cost-effectiveness
Uncertainty in budget impact
20
Managed Entry Agreement (1)
NHIA
Mutual
agreement
Pharmaceutical
firm

MEAs Models in Taiwan
Category Mechanism of MEAs Models
1. Performance-based 1. Ensure the improvement in overall survival
2. Ensure the progression-free survival
3. Refund / payback based on response rate etc.
2. Financial-based 1. Fixed-rate refund / payback
2. Free doses
3. Payback for co-prescribed drugs
3. Mutual share by
negotiation
Mutual share of refund / payback among
pharmaceutical products with the same ingredient
or pharmacological category.
• Any one (or more than one) of the models be chosen on a case by case basis.
• Mutual share of drug expenditure between the supplier and the insurer via refund/ payback.
21

Specify the dossier required for submission
Create a check-list for submission dossier and
MEA proposal
Create a self-assessment sheet for cost-
benefit analysis
Good Submission Practice (GSP)
Improve the completeness and quality of
submission dossier
Accelerate pricing review process
22
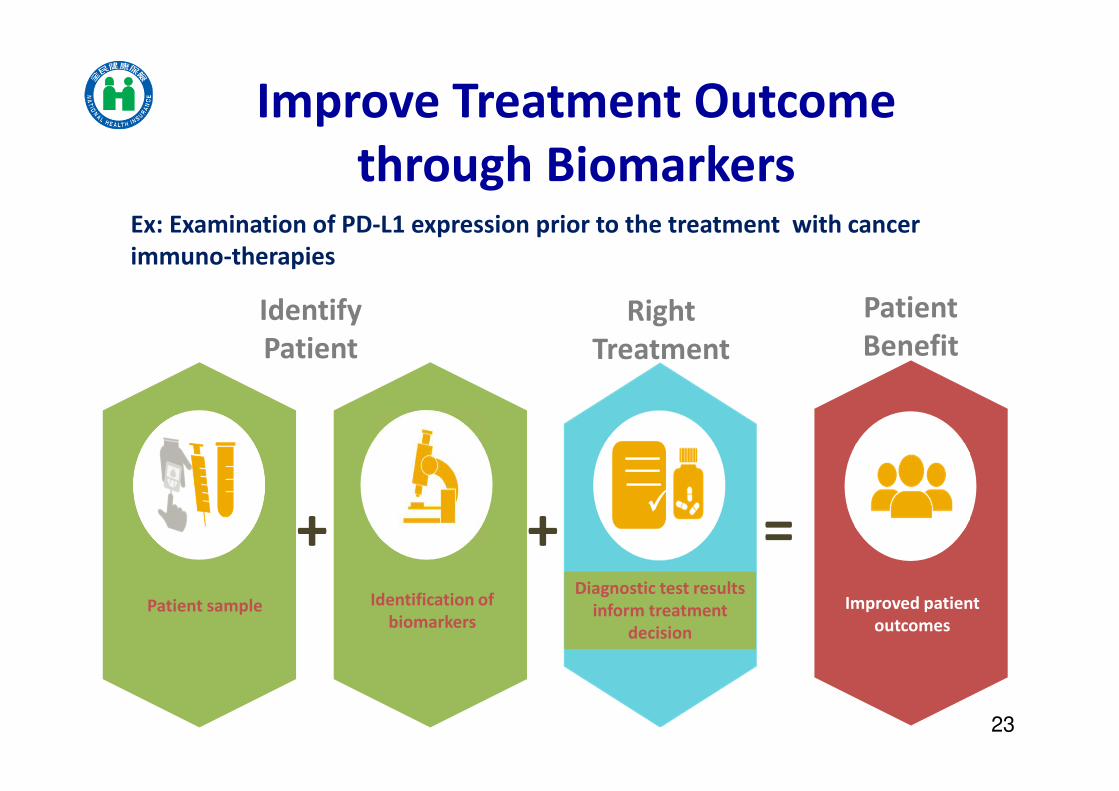
Improve Treatment Outcome
through Biomarkers
Identification of
biomarkersImproved patient
outcomesPatient sample
+ + =
Identify
Patient
Right
Treatment
Patient
Benefit
Diagnostic test results
inform treatment
decision
23
Ex: Examination of PD-L1 expression prior to the treatment with cancer
immuno-therapies

Enhance Reimbursement
Efficiency
24

25
Proposal
(Initiation)
Identifying candidates
Prioritization of candidates
Reassessment Decision
Health Technology Reassessment (HTR)
Criteria for identifying candidates for
assessment (Elshaug et al., 2009)
• Clinical evidence
• Variation in cares (e.g., variation in volume, geographic
variations, clinical heterogeneity of
procedure, etc.)
• Technology development
• Public interest or controversy
Items under assessment in 2021
• Efficacy:Bevacizumab (Avastin), Cetuximab
(Erbitux), Cilostazol, Drugs for
orphan diseases
• Safety:minocycline, amiodarone,
dronedarone, etc.

26
17.9 18.5
19.5 20.6
21.6 22.5
23.7
2.8 2.9 3.0 3.3 3.7 4.0 4.3
0.64 0.69 0.8 0.88 0.97 1.06 1.29
61
6465
68
72
7677
50
55
60
65
70
75
80
85
0
5
10
15
20
25
2014 2015 2016 2017 2018 2019 2020
PA
TIE
NT
S (T
EN
TH
OU
SAN
DS)
BIL
LIO
N (
USD
)
Global budget Expenditure on cancer treatment Cancer drug expenditure No. of cancer patient
Item Average growth rate
Global budget 4.80%
Expenditure on cancer treatment 7.24%
Cancer drug expenditure 10.68%
No. of cancer patients 4.52%
Expenditure on Cancer Treatment

27
Surrogate endpoint Clinical
indicator
Clinical benefit Cost-
effectiveness
Clinical trial: few participants Post-market:
large p’t population
Accelerated Market Approval but Lack
of Clear Clinical Evidence
Highly uncertain!
RWE needed!!

Registry System for Cancer
Immuno-therapies (1)
28
Type and stage of cancer
Results of genetic examinations
Results of biomarker examinations
Treatment outcomes
Severe side effect
Reasons for withdrawals
The NHIA has
established a registry
system for IO to
collect data including:
• Evaluate the value of
IO
• Review reimbursed
indications
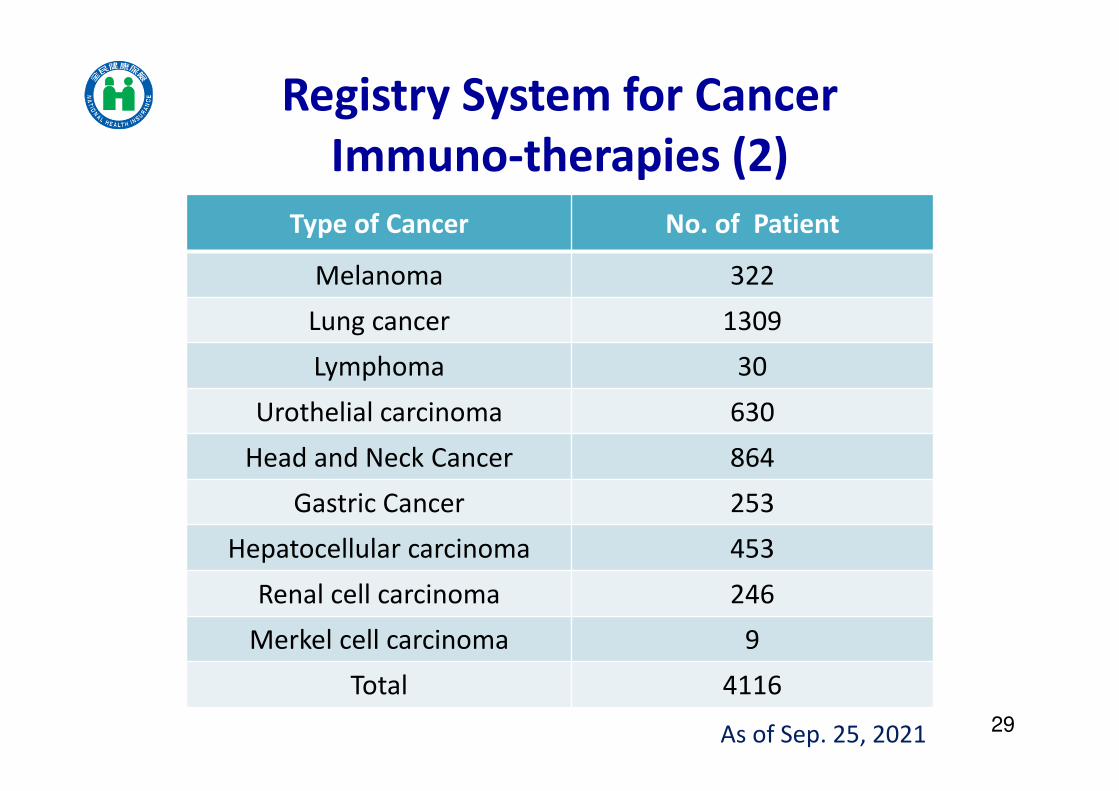
Registry System for Cancer
Immuno-therapies (2)
29
Type of Cancer No. of Patient
Melanoma 322
Lung cancer 1309
Lymphoma 30
Urothelial carcinoma 630
Head and Neck Cancer 864
Gastric Cancer 253
Hepatocellular carcinoma 453
Renal cell carcinoma 246
Merkel cell carcinoma 9
Total 4116
As of Sep. 25, 2021
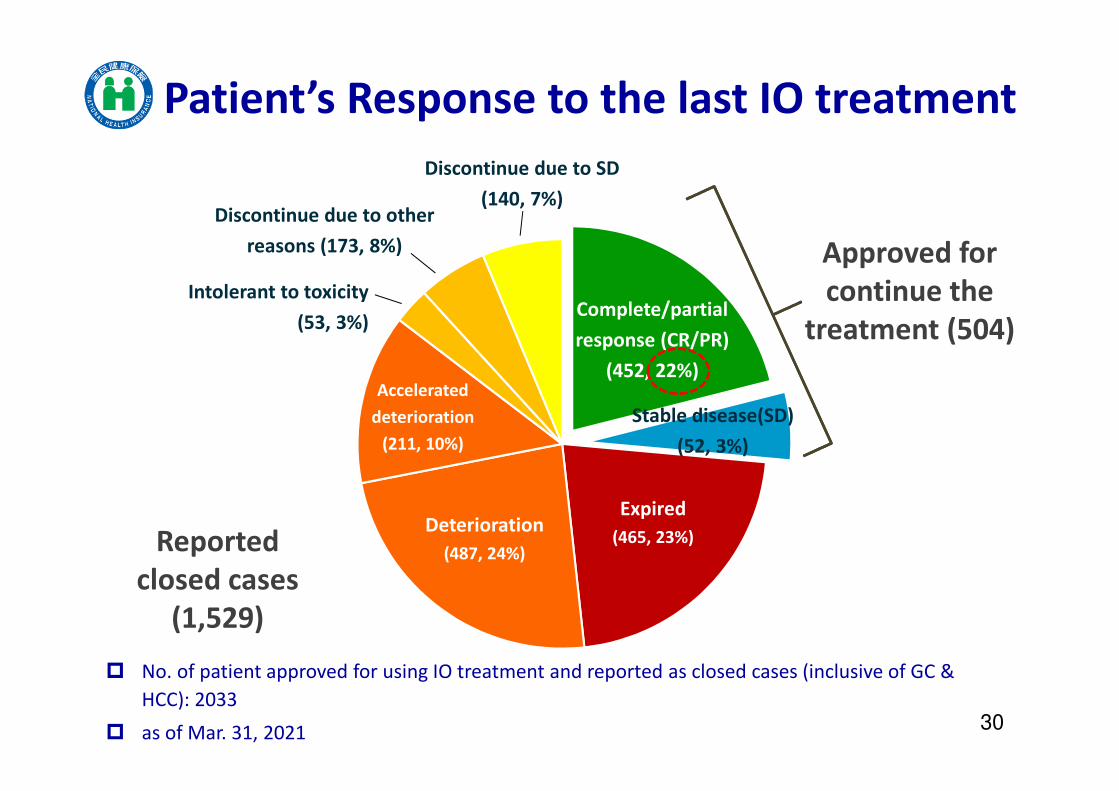
Approved for
continue the
treatment (504)
Deterioration
(487, 24%)
Expired
(465, 23%)
Complete/partial
response (CR/PR)
(452, 22%)Accelerated
deterioration
(211, 10%)
Discontinue due to other
reasons (173, 8%)
Discontinue due to SD
(140, 7%)
Intolerant to toxicity
(53, 3%)
Reported
closed cases
(1,529)
No. of patient approved for using IO treatment and reported as closed cases (inclusive of GC &
HCC): 2033
as of Mar. 31, 202130
Patient’s Response to the last IO treatment
Stable disease(SD)
(52, 3%)

31
Revise Reimbursed Indications of IO
based on RWE
If effective…
➔ Expand the scope of reimbursement
(1) PR/CR: Extend the course of treatment to 2 years
(2) SD: Extend from 3+1 months to 3+3 months
(3) Increase budget to 1 billion NTD
If NOT effective...
➔ Rebate
(1) Suspend applications from GC & HCC new cases
(2)Price revision based on A-10 lowest price
(3)Continue evaluating treatment outcomes and negotiate performance-based MEA.

32
One drug for all
patientsTarget therapy
/precision medicinePrecision health
Frost & Sullivan’s Visionary Healthcare program, 2017
Precise Matching of Patients to
Treatments
Facilitate reimbursement of drug companion diagnosis tests
– Listing of RAS & ALK test in 2021
Reinforce the precise utilization of medications
– Collect RWE
– Revise reimbursed indications
Integrate medical information and AI review to improve cancer treatment

Conclusion
33

Future Prospects
HTM(Health Technology
Management)
HS(Horizon Scanning)
HTR(Health
Technology
Reassessment)
HTA(Health Technology
Assessment)
35
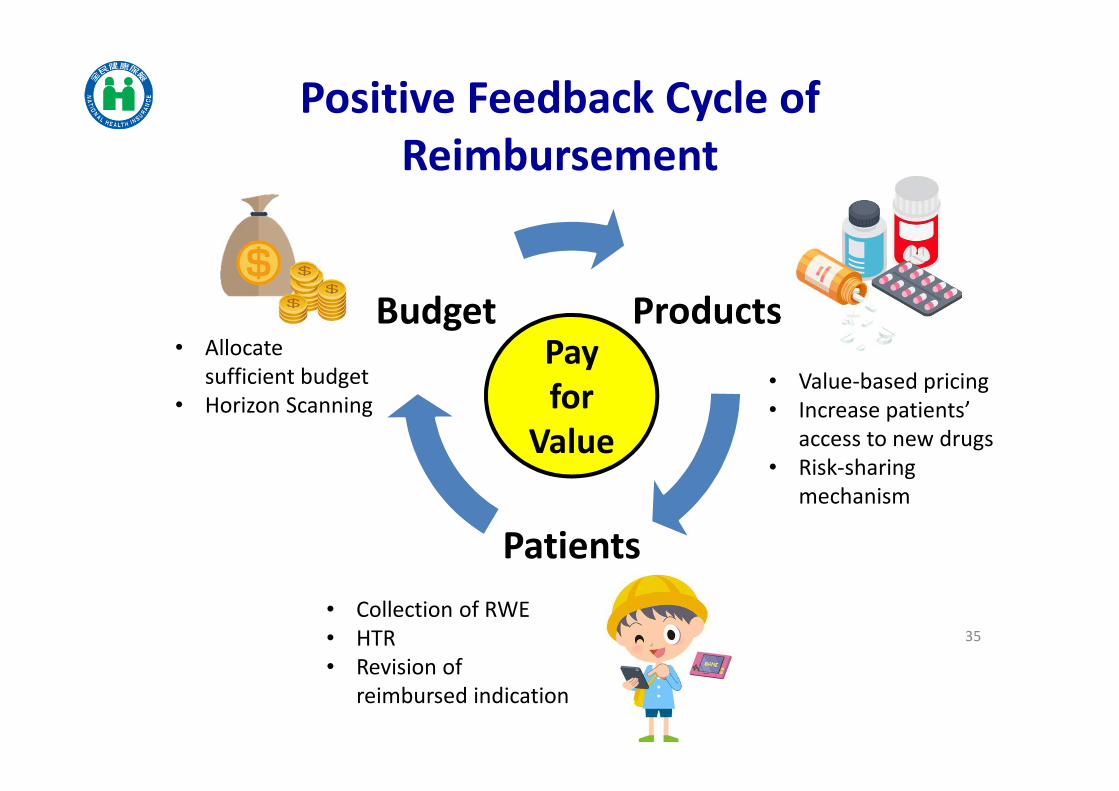
Positive Feedback Cycle of
Reimbursement
Products
Patients
BudgetPay
for
Value
• Value-based pricing
• Increase patients’
access to new drugs
• Risk-sharing
mechanism
• Allocate
sufficient budget
• Horizon Scanning
• Collection of RWE
• HTR
• Revision of
reimbursed indication
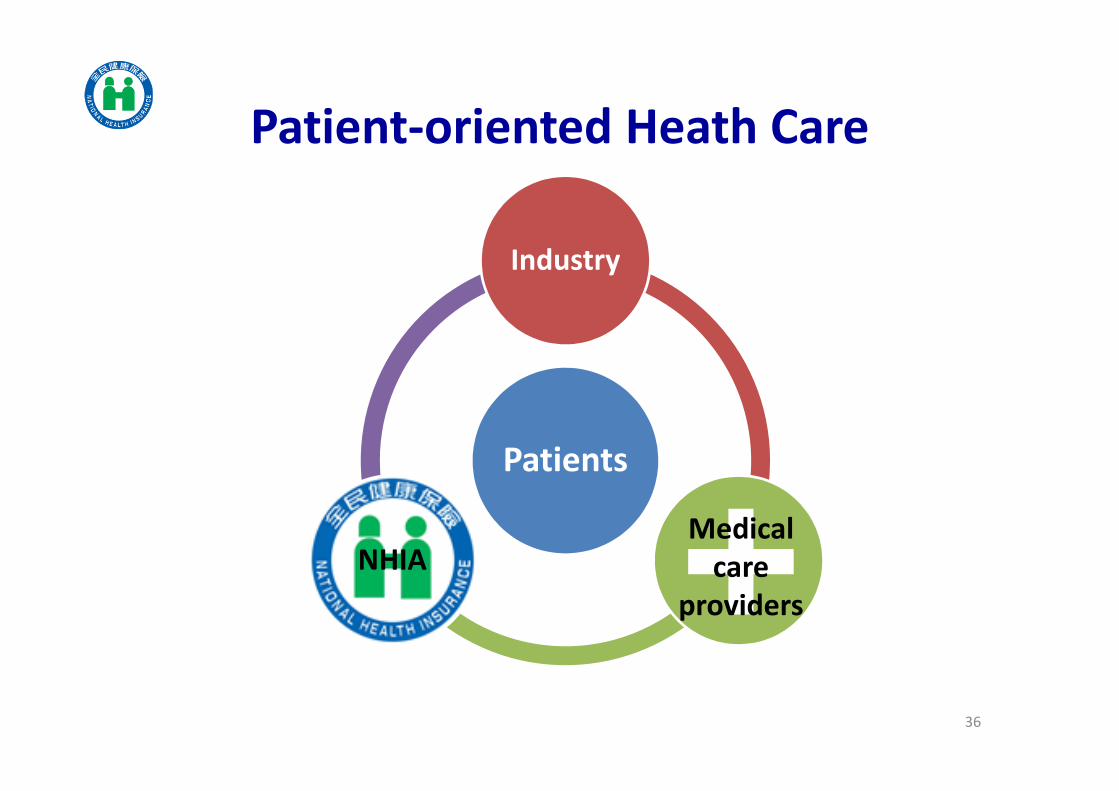
Patients
Industry
NHIA
36
Patient-oriented Heath Care
Medical
care
providers
37
Thank you