Embed Size (px)
Citation preview

1
Strategic Staffing? How Performance Pressures Affect the Distribution of Teachers within Schools and Resulting Student Achievement
Jason A. Grissom
Vanderbilt University
Demetra Kalogrides Susanna Loeb
Stanford University
***
Abstract School performance pressures apply disproportionately to tested grades and subjects. Using longitudinal administrative data and teacher survey data from a large urban school district, we examine schools’ responses to those pressures in assigning teachers to high-stakes and low-stakes classrooms. We find that teachers who produce greater student achievement gains in math and reading are more likely to be placed in a tested grade-subject combination in the following year and that the relationship between prior performance and assignment is stronger in schools where principals have more influence over assignments. This strategic response has the consequence of disadvantaging achievement in early grades, however, concentrating less effective teachers in K–2 classrooms, which in turn produces lower achievement for those students, as measured by low-stakes assessments, that may persist into tested grades as well.
***
Evidence abounds that schools respond strategically to the pressures of high-stakes
accountability systems in both productive and unproductive ways. Researchers have documented
a long list of unintended responses to these pressures, including gaming the composition of the
population by suspending low achievers during the testing window or reclassifying them as
learning-disabled (e.g., Figlio, 2006; Jacob, 2005), focusing school resources away from lower
achievers towards those near proficiency cutoffs (Booher-Jennings, 2005), or cheating by
altering students’ responses to test items (Jacob & Levitt, 2003). More productively,
accountability pressures push schools to increase instructional time, focus teacher attention on
core subjects, provide supplemental educational services for struggling students, and expand
time for teacher collaboration (see Dee, Jacob, & Schwartz, 2013; Hannaway & Hamilton, 2008;

2
Jacob & Lefgren, 2004; Rouse, Hannaway, Goldhaber, & Figlio, 2007). Some recent evidence
suggests that strategic behavior seeking to improve student test performance may also extend to
how schools make decisions about their teacher workforce. For example, in interviews principals
report engaging in strategic hiring, assignment, development, and dismissal practices with the
goal of improving their schools’ average test performance (Cohen-Vogel 2011). Research
documenting these behaviors systematically or linking them explicitly to accountability
pressures, however, is scarce.
In this article, we focus specifically on one area of strategic staffing Cohen-Vogel (2011)
identified: assignments of teachers to students and classes. While a long literature has examined
the sorting of teachers across schools—and repeatedly documented the matching of better
qualified teachers towards higher achieving students (e.g., Lankford, Loeb, & Wyckoff, 2002;
Clotfelter, Ladd, & Vigdor, 2006)—a small literature has begun to consider teacher assignment
decisions within schools as well. For example, despite research demonstrating that beginning
teachers are less effective (Nye et al., 2004; Rockoff, 2004), schools systematically assign less
experienced teachers to lower performing students, though evidence also suggests that this
tendency is less pronounced in high-growth schools (Loeb, Kalogrides, & Béteille, 2010;
Kalogrides, Loeb, & Béteille, 2013). Decisions about how schools deploy existing teacher
resources likely impact student achievement levels and gaps among students, given that
matching a student to an effective teacher is a primary means whereby a school can affect his or
her outcomes (e.g., Aaronson, Barrow, & Sander, 2007). Assignment decisions are also
amenable to direct influence from school leaders, unlike some other areas of personnel
management, such as teacher hiring, which may rest more heavily on factors (e.g., the quality of
the applicant pool) that are beyond school leader control. Thus, by understanding and adjusting

3
patterns of teacher assignment across classrooms, we may be able to improve outcomes for
students and reduce gaps in access to high-quality teachers.
Because accountability systems measure school performance using student achievement
test scores from some grades and subjects but not others, accountability pressures are felt
disproportionately in some classrooms. Under No Child Left Behind (NCLB), in most states—
including in Florida, the context for the present study—elementary schools are evaluated on the
basis of math and reading achievement performance in grades 3, 4, and 5. In Cohen-Vogel’s
(2011) interviews, principals reported reassigning teachers from these “high-stakes” classrooms
if their students showed inadequate test score performance to “low-stakes” assignments in grades
K–2. Such a strategic move may improve student performance in the tested grade (and thus
measured school performance) in the short term, particularly if a more effective teacher is
available to fill the reassigned teacher’s position. Longer term effects on school performance are
less clear. They could be positive if, for example, the move results in a better match of a
teacher’s skills to his or her students or the content, or they could be negative if that match is
poor, or if the move is to an assignment that is low-stakes but that has important effects on later
learning, as might be the case for an ineffective third-grade teacher moved to an untested
position in first grade (Claessens, Duncan, & Engel, 2009; Fuller & Ladd, 2013). Evidence on
the importance of early-grades learning for later life outcomes suggests that a system that pushes
schools to concentrate ineffective teachers in the earliest grades could have serious unintended
consequences (Chetty et al., 2011; Schweinhart et. al., 2005).
Using detailed administrative and survey data from Miami-Dade County Public Schools
(M-DCPS), we first ask whether the test performance of a teacher’s students is associated with
the likelihood that a teacher remains in or is moved out of a tested grade or subject in a

4
subsequent year. This analysis echoes that of Chingos and West (2011), who showed that Florida
teachers with lower value-added scores were less likely to be reassigned to tested classrooms.
Second, we ask whether the relationship between the test performance of a teacher’s students and
the likelihood that they move to an untested area varies systematically across schools. In
particular, we test differences by school level, the school’s performance in the state
accountability system, and school-level value-added. We also draw on data from a survey that
we conducted with M-DCPS teachers to characterize class assignment policies in each school
and test whether the relationship between teacher performance and where they are subsequently
assigned varies by the factors that are considered in the assignment process (e.g., teacher
seniority) and the participants that have higher perceived influence over assignments (e.g., the
principal, parents). Finally, we assess whether a strategic school response to accountability
pressure that moves low-performing teachers from high- to low-stakes classrooms is likely to
have negative effects on student learning in grades in which the accountability pressures are
weaker. We focus specifically on elementary schools, where moves of less effective teachers out
of tested grades are likely to result in reassignment to untested early grades. Using student scores
on the Stanford Achievement Test, Version 10 (SAT-10), a low-stakes exam administered in M-
DCPS in early grades, we estimate learning gains among first and second graders taught by
teachers reassigned from tested elementary grades.
The next section reviews what we know about strategic responses to accountability
pressures, including the small body of research on strategic personnel assignments. We then
detail our data and methods before turning to a presentation of the results. We conclude with a
discussion of the implications of the study for school and district policy and for future research.

5
Strategic Responses to Accountability Pressures
Test-based accountability systems, such as those imposed by the No Child Left Behind
Act (NCLB), create incentives for schools to improve student outcomes and sanctions for
schools that fail to do so. Prior research has documented the effects of accountability policy on
the behaviors of teachers and school leaders. The types of strategies identified by these studies
can be grouped into two categories: behaviors that increase average test scores without
improving productivity and those that identify changes in the ways that schools deliver education
that generate meaningful improvements to student learning.
There are several examples in the literature that describe educators’ attempts to “game
the system” as a means of increasing average student test scores. Jacob and Levitt (2003), for
example, estimate that a minimum of 4–5 percent of elementary school teachers in Chicago
Public Schools cheat on state tests by systematically altering students’ responses to test items.
The frequency of cheating increased when the incentives to do so increased (via grade retention
policies tied to minimum test score cut-offs and threats to reconstitute low-performing schools).
Figlio (2006) shows that schools differentially punish low-achieving students for misbehavior,
particularly during testing periods, as a way of removing them from the testing pool. He
compares incidents involving more than one student that was suspended. He finds that schools
always tend to assign harsher punishments to low-performing students than to high-performing
students but that this gap grows during the testing period of the school year. Moreover, these
patterns are only evident in tested grades. There is also evidence that some schools respond to
accountability pressure by differentially reclassifying low-achieving students as learning
disabled so as to exclude their scores from the formula that determines schools’ accountability
ratings. Figlio and Getzler (2006), for example, use student fixed-effects models and find

6
increases in reclassification rates for low-income and previously low-performing students to
disabled after the introduction of Florida’s testing regime. Such behaviors were concentrated
among low-income schools on the margin of failing to meet the accountability standards.
Such practices may increase schools’ average test scores—all important for high-stakes
accountability systems—but have little meaningful impact on actual student learning. Other
studies, however, suggest that schools also respond to accountability pressures in educationally
meaningful ways. Rouse et al. (2007), for example, find that student achievement increases in
response to accountability pressure and that changes to school policy explain at least some of
these increases. In their study, increased accountability pressure was associated with increased
focus on low-performing students, increasing the amount of the school day spent on instruction,
increasing the resources available to teachers and decreasing the amount of control held by the
principal. Dee, Jacob, and Schwartz (2013) similarly find that NCLB increased the allocation of
instructional time to math and language arts, which may partially account for achievement gains
associated with the law (Dee & Jacob, 2011). Cohen-Vogel’s (2011) study shows that school
leaders engage in a variety of personnel policies in hopes of increasing student achievement,
which she terms “staffing to the test.” In interviews, principals reported hiring, developing, and
dismissing teachers in an effort to improve their schools’ average test performance. For example,
principals described selecting teacher candidates in part by looking at their past student outcomes
data in hopes of ensuring that they are hiring more effective teachers.
Strategic Assignment of Personnel
Cohen-Vogel (2011) finds that principals report using student test scores when making
decisions to reassign teachers within their schools. This strategic approach to human resource

7
decisions is especially evident in lower performing schools, where some principals report
moving effective teachers to tested grades (Cohen-Vogel, 2011). In keeping with the principals’
reports, Chingos and West (2011) find that effective teachers are more likely to remain in grades
and subjects where high stakes testing takes place and that this relationship is strongest in
schools receiving lower ratings from the state’s accountability system. Similarly, Fuller and Ladd
(2013), in an examination of the distribution of elementary teacher credentials across grades in
North Carolina, show that NCLB pushed schools to move more qualified early grades teachers to
higher grades and less qualified upper elementary teachers to early grades.
The strategic allocation of staff described by these prior studies aligns with the large body
of literature demonstrating that there is wide variability in teacher effectiveness and that teachers
are one of the most important resources available to schools to improve student learning
outcomes (Aaronson, Barrow, & Sander, 2007; Kane, Rockoff, & Staiger, 2008; Nye,
Konstantopoulos, & Hedges, 2004; Rivkin, Hanushek, & Kain, 2005; Rockoff, 2004; Sanders &
Rivers, 1996). Test-based accountability systems focus on student achievement in certain grades
and subjects while placing less emphasis on others. School leaders, therefore, have clear
incentives to keep their more effective teachers in tested grades and subjects while reassigning
less effective teachers to positions that will not influence the school’s accountability rating.
It is not clear, however, what effects on students or schools this type of strategic
reallocation of low-performing teachers to low-stakes classrooms has over the long term,
particularly if those low-stakes classrooms are in earlier grades that feed into later high-stakes
classrooms. One on hand, the skills necessary to be successful in earlier grades may not be the
same as those required to teach older children effectively, and reassignment may positively
impact a teacher’s performance if it leads to a better match with that teacher’s skills. In this case,

8
student achievement will be positively affected. On the other hand, if an ineffective teacher in
later grades is also ineffective in earlier grades, such reassignment may have negative longer-run
consequences for both students and the school, particularly if student-learning trajectories are
affected by the foundations laid in earlier grades. Certainly learning is a cumulative process, and
student learning in early grades are strong predictors of achievement in later schooling (e.g.,
Claessens, Duncan, & Engel, 2009; Perry, Guidubaldi, & Kehle, 1979; Watts et al., 2014). As
one principal in a high-growth school interviewed by Cohen-Vogel (2011) put it, “you can’t say
you want your higher achieving teachers in grades three, four, five. If you have high achieving
teachers in K, one, and two, then you are going to be okay with three, four. . . . You need strong
teachers everywhere” (494).1 Relocating an ineffective teacher to a grade prior to the onset of
high-stakes testing may allow for the placement of a more effective teacher in the tested grade,
but gains from that replacement may be undercut in subsequent years if there are deleterious
effects on student learning in the earlier grade associated with the ineffective teacher that cannot
be fully remediated. Moreover, student learning in early grades may affect post-schooling
outcomes as college attendance and earnings, even if gains made in early grades do not show up
in differences in achievement scores in later grades (Chetty et al., 2011).
Data
Our analysis of strategic assignment uses data from administrative files on all staff,
students and schools in the Miami-Dade County Public School (M-DCPS) district from the
2003-04 through the 2011-12 school years. We also use data from a web-based survey of 8,000
1 To this same point, another pointed out: “if you don’t teach your children to read in first and second grade, you cannot make that up in third, fourth and fifth grade. . . . So, I have always hired my strongest teachers and put them in that first and second configuration” (Cohen-Vogel, 2011, 494).
9
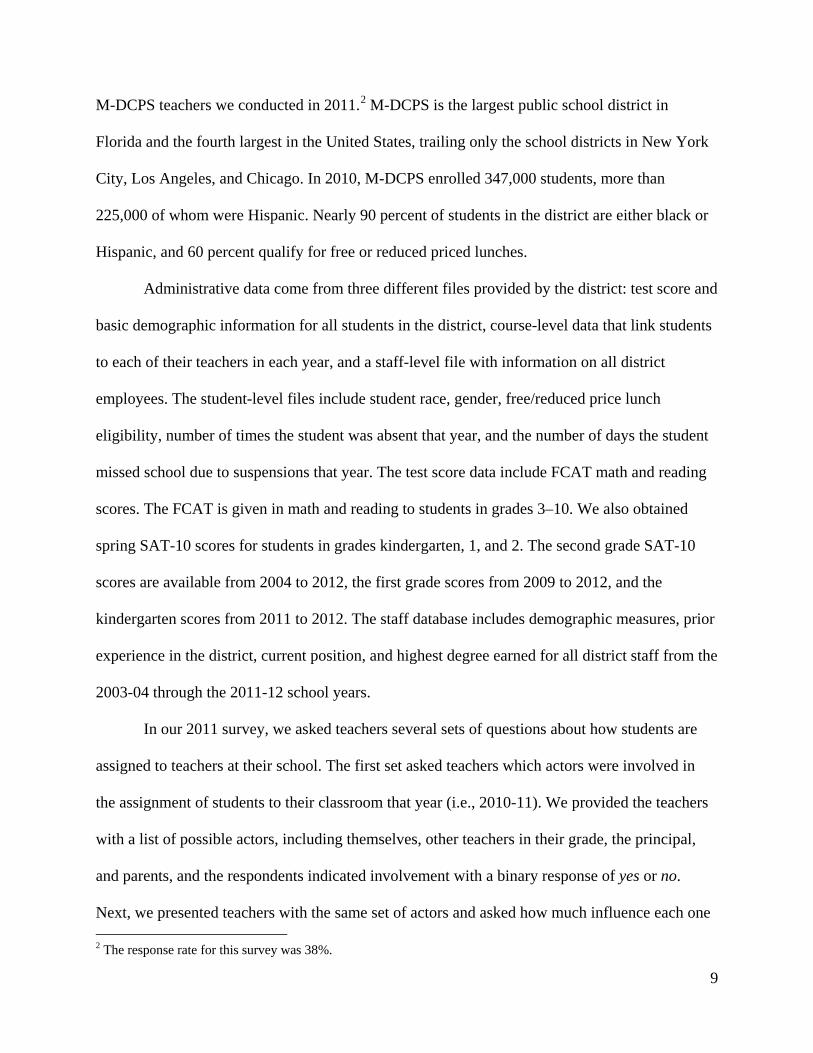
M-DCPS teachers we conducted in 2011.2 M-DCPS is the largest public school district in
Florida and the fourth largest in the United States, trailing only the school districts in New York
City, Los Angeles, and Chicago. In 2010, M-DCPS enrolled 347,000 students, more than
225,000 of whom were Hispanic. Nearly 90 percent of students in the district are either black or
Hispanic, and 60 percent qualify for free or reduced priced lunches.
Administrative data come from three different files provided by the district: test score and
basic demographic information for all students in the district, course-level data that link students
to each of their teachers in each year, and a staff-level file with information on all district
employees. The student-level files include student race, gender, free/reduced price lunch
eligibility, number of times the student was absent that year, and the number of days the student
missed school due to suspensions that year. The test score data include FCAT math and reading
scores. The FCAT is given in math and reading to students in grades 3–10. We also obtained
spring SAT-10 scores for students in grades kindergarten, 1, and 2. The second grade SAT-10
scores are available from 2004 to 2012, the first grade scores from 2009 to 2012, and the
kindergarten scores from 2011 to 2012. The staff database includes demographic measures, prior
experience in the district, current position, and highest degree earned for all district staff from the
2003-04 through the 2011-12 school years.
In our 2011 survey, we asked teachers several sets of questions about how students are
assigned to teachers at their school. The first set asked teachers which actors were involved in
the assignment of students to their classroom that year (i.e., 2010-11). We provided the teachers
with a list of possible actors, including themselves, other teachers in their grade, the principal,
and parents, and the respondents indicated involvement with a binary response of yes or no.
Next, we presented teachers with the same set of actors and asked how much influence each one 2 The response rate for this survey was 38%.

10
had over the assignment of students to their classroom that year. We recorded responses were on
a scale of 0 (not involved/no influence) to 4 (a lot of influence). Lastly, we presented teachers
with a list of factors, such as student academic needs, teacher seniority, teacher effectiveness,
and parent preferences, and asked them to rate the importance of each factor in determining
assignments at their school on a similar five-point scale.
We combine the survey data with the administrative data to create a teacher-level file
with teachers’ survey responses, demographic information from administrative data, and
characteristics of the students in teachers’ courses generated by matching teachers to student
course-level data. We determine whether teachers teach tested grades and subjects by matching
students to each of their teachers via course-level data. We code a teacher as teaching in a tested
grade or subject if more than 50 percent of his or her students in a given year are in grades 3–10
and are enrolled in math or English/reading courses with that teacher. Note that in our data
elementary school students also have course-level data but their teacher is generally the same
across most subjects. Florida schools are required to test students in grades 3-10. In K–5
elementary schools, therefore, kindergarten, first, and second grades are untested grades while
third, fourth and fifth grades are tested grades. For middle and high schools, we consider math
and English/reading in grades 6 through 10 to be tested grades/subjects and consider teachers to
be teaching in tested grades if at least half of their students meet those criteria are in these
classes.
Table 1 provides the mean and standard deviations of the main variables used in our
analyses. The first three columns show descriptive statistics for teachers in the administrative
data and the final three columns show descriptive statistics for teachers that responded to our
survey. Table 1 shows that the characteristics of our survey sample looks remarkably similar to

11
the characteristics of the district as a whole. Survey respondents are similar to the district
population of teachers in terms of race/ethnicity, gender, highest degree earned, total years of
experience, and whether they teach in a tested grade or subject. Teachers average about 8 years
of experience at their current school; they are predominately female (80 percent); 40 percent are
Hispanic; 26 percent are black; and 46 percent have a master’s degree or higher. The average
teachers’ class is 28 percent black, 9 percent white and includes 57–67 percent of students
receiving free/reduced priced lunches.
Table 1 also shows basic descriptive statistics for the class assignment items included in
our survey. Sixteen percent of survey respondents report that they themselves participate in the
class assignment process at their school. Teachers report more involvement from principals,
assistant principals and counselors with 51, 64, and 38 percent, respectively, reporting
involvement from these three types of personnel. Seven percent of teachers also report that
students and parents play some role in determining class assignments. Teachers also report that
various factors related to student test performance and student academic needs play some role in
the assignment process. For example, the academic needs of individual students and individual
students’ test performance are given ratings of above 3—which indicates that teachers view them
as being somewhat to very influential in the assignment process (these items are rated on a 5
point scale that ranges from not influential at all to most important). All of the items have means
of above 2 indicating that they have at least a little influence over how class assignment are
made. We will use these items to examine whether assignments in tested areas happen differently
in schools with different teacher-reported class assignment practices.
Methods

12
Our analysis comprises multiple components. First, we examine whether principals
engage in strategic staffing when making teacher assignments to high-stakes classrooms. We do
so by estimating the relationship between teacher effectiveness and assignments to tested grades
and subjects. We test whether teachers in tested areas are more likely to be moved into a non-
tested area following a year that their students perform poorly on state tests. For teachers who
teach in a tested area in year t we predict whether they remain in a tested area in year t+1 as a
function of a measure of their performance and control variables:
Pr(𝑡𝑡𝑡𝑡𝑡𝑡 𝑐𝑐𝑐𝑡𝑡𝑐𝑐𝑐𝑐 𝑐𝑡 𝑡 + 1)𝑖𝑖 = 𝛽0 + 𝑃𝑃𝑃𝑃𝑃𝑃𝑃𝑃𝑃𝑃𝑃𝑖𝑡𝛽1 + 𝑇𝑖𝑡𝛽2 + 𝛿𝑡𝑡 + 𝜀𝑖𝑡𝑡 (1)
Equation (1), which we estimate as a linear probability model, models the probability of
remaining in a high-stakes classroom as a function of teacher performance, teacher-level
characteristics (gender, race, highest degree, years in current school), and a school-by-year fixed
effect that isolates the association between assignment and performance to be within school and
year combinations.3 We use three measures of teacher performance: (a) the average math test
scores of students in a teacher’s class(es) in year t ; (b) the proportion of students in a teacher’s
class(es) scoring proficient or higher; and (c) teacher’s value-added to math achievement in year
t.4 The first measure captures whether principals consider the average test scores of teachers’
students when determining class assignments; the second more closely captures the measure used
for accountability purposes; and the third measure captures whether principals consider the
adjusted student test score gains of teachers’ students. The third measure is likely to capture
something that more closely reflects teacher quality than the first and second, but it is harder for
3 Results are similar using logistic regression. 4 Teacher value-added is computed by predicting student math test scores in the current year as a function of math and reading scores in the prior year, student, school and class-level control variables, grade and year indicators and a teacher by year fixed effect. The teacher-by-year fixed effect, which we shrink to account for measurement error using the empirical Bayes method, is our measure of value-added.

13
principals to observe. Both average test performance and test score gains are considered in
Florida’s accountability formula, so all three metrics could influence strategic assignment
decisions. In these models we also include a school-by-year fixed effect so that we make
comparisons among teachers who teach at the same school.
In the second stage of our analysis, we assess whether the association between student
test performance and the probability that a teacher remains in a tested area varies across schools
with different characteristics. In most cases, this analysis simply includes appropriate interaction
terms in the estimation of Equation 1, though in the case of one characteristic, school level, we
re-estimate Equation 1 separately for elementary, middle, and high schools, given differences in
the accountability context at each school level. For example, in middle schools, all grades are
tested, so the only way a middle school teacher can be switched out of a tested area is if they
change subjects or switch schools. In high schools, higher grades with more advanced course
content are generally preferred by teachers (Neild & Farley-Ripple, 2008), so principals may feel
pressured to assign their best or more experienced teachers to those (untested) grades.
We then test interactions with school accountability grades.5 The direction of this
interaction is not clear, a priori. Schools facing more accountability pressure may feel more
compelled to engage in strategic staffing as a means of improving their school’s performance. At
the same time, however, one reason for lower school performance could be a failure to engage in
strategic staffing, which would induce a negative correlation. In a related third analysis, we
include an interaction with school value-added. School value-added, estimated from student
5 School grades are determined by a formula used by the district that weighs the percentage of students meeting high standards across various subjects tested, the percentage of students making learning gains, whether adequate progress is made among the lowest 25 percent of students, and the percentage of eligible students who are tested. For more information, see: http://schoolgrades.fldoe.org/pdf/0708/2008SchoolGradesTAP.pdf

14
FCAT scores using a model comparable to the one used to estimate teacher value-added only
replacing the teacher fixed effect with a school fixed effect, captures the average adjusted
achievement gains associated with a school over time. Again, the direction for this interaction is
unclear a priori. On one hand, high-growth schools may be high-growth in part because they
have engaged in strategic behavior that has increased student test score gains over time,
suggesting that school value-added will be a positive moderator between teacher performance
and the probability of future assignment to a tested classroom. On the other, low-growth schools
may feel greater pressure to engage in strategic assignment, in which case the direction will be
negative.
We next include interactions of the teachers’ student achievement level and value-added
with teacher reports of class assignment policies at their school. We hypothesize that the
relationship might be weaker in schools that place more emphasis on teacher preferences when
determining assignments and stronger in schools that place more emphasis on students’ academic
needs and teacher effectiveness. In using the class assignment items, we aggregate teacher
survey responses to the school level and examine the average rating (on a scale of 1–5) of the
importance of the following factors when determining assignments: students’ academic needs,
teacher preferences, teacher experience in a certain grade or subject, teacher seniority, teachers’
overall effectiveness, and teachers’ effectiveness in a certain grade or subject. We also include
interactions with school-average ratings of the amount of influence of the following personnel
over assignments (on a scale of 0-4): the teacher themselves, other teachers in their grade,
teachers in the grade below, other teachers, principals, assistant principals, counselors, parents,
and students. Although we collected these measures in 2011, when collapsing them to the
school-level and combining them with administrative data from other years, we treat them as a
15
time-invariant feature of schools. Note that not all survey respondents were asked each of these
assignment factor items, which is one of the rationales for aggregating responses to the school-
level. We presented each teacher with 12 randomly drawn possible contributors to class
assignments (from a list of 23) and asked them to rate the importance of each. The random
assignment of questions reduced the burden on each individual teacher. We still have
approximately 3,000 responses from teachers for each of these items (though the individual
teachers that responded to each item differ).
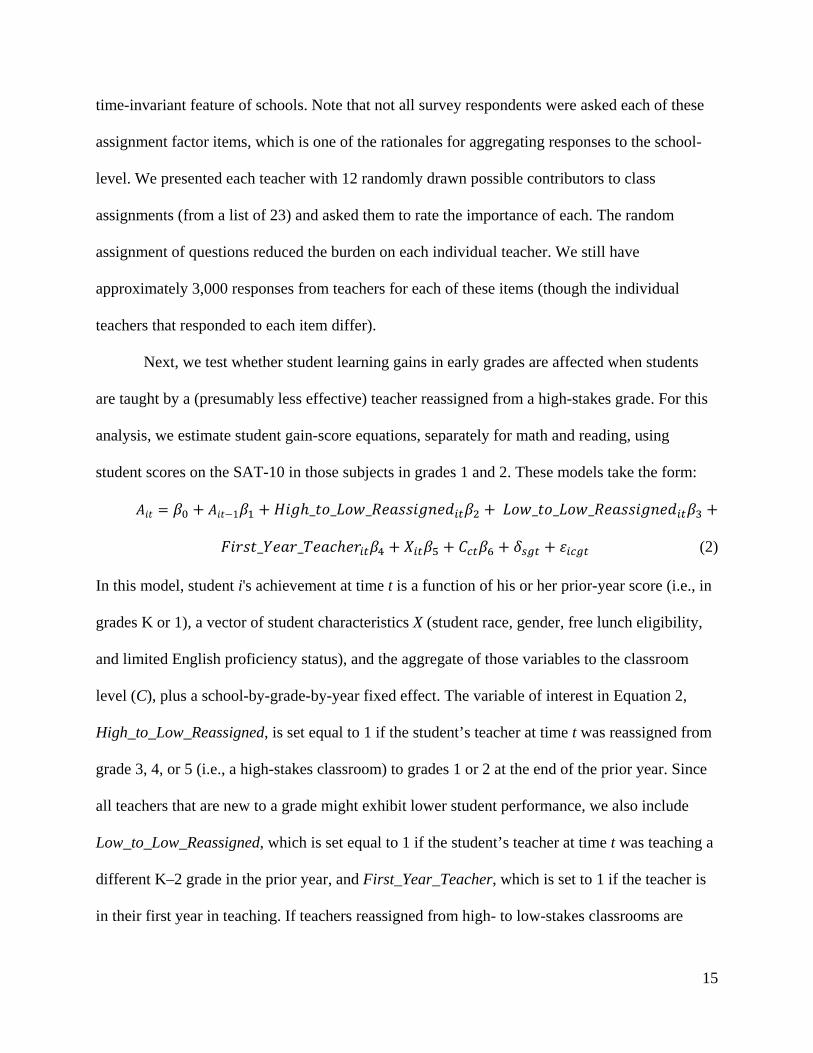
Next, we test whether student learning gains in early grades are affected when students
are taught by a (presumably less effective) teacher reassigned from a high-stakes grade. For this
analysis, we estimate student gain-score equations, separately for math and reading, using
student scores on the SAT-10 in those subjects in grades 1 and 2. These models take the form:
𝑃𝑖𝑡 = 𝛽0 + 𝑃𝑖𝑡−1𝛽1 + 𝐻𝑖𝐻ℎ_𝑡𝑐_𝐿𝑐𝐿_𝑃𝑡𝑐𝑡𝑡𝑖𝐻𝑔𝑡𝑡𝑖𝑖𝛽2 + 𝐿𝑐𝐿_𝑡𝑐_𝐿𝑐𝐿_𝑃𝑡𝑐𝑡𝑡𝑖𝐻𝑔𝑡𝑡𝑖𝑖𝛽3 +
𝑃𝑖𝑐𝑡𝑡_𝑌𝑡𝑐𝑐_𝑇𝑡𝑐𝑐ℎ𝑡𝑐𝑖𝑖𝛽4 + 𝑋𝑖𝑖𝛽5 + 𝑃𝑐𝑖𝛽6 + 𝛿𝑠𝑠𝑖 + 𝜀𝑖𝑐𝑠𝑖 (2)
In this model, student i's achievement at time t is a function of his or her prior-year score (i.e., in
grades K or 1), a vector of student characteristics X (student race, gender, free lunch eligibility,
and limited English proficiency status), and the aggregate of those variables to the classroom
level (C), plus a school-by-grade-by-year fixed effect. The variable of interest in Equation 2,
High_to_Low_Reassigned, is set equal to 1 if the student’s teacher at time t was reassigned from
grade 3, 4, or 5 (i.e., a high-stakes classroom) to grades 1 or 2 at the end of the prior year. Since
all teachers that are new to a grade might exhibit lower student performance, we also include
Low_to_Low_Reassigned, which is set equal to 1 if the student’s teacher at time t was teaching a
different K–2 grade in the prior year, and First_Year_Teacher, which is set to 1 if the teacher is
in their first year in teaching. If teachers reassigned from high- to low-stakes classrooms are

16
associated with lower average learning gains, the coefficient β2 will be negative, and potentially
larger in magnitude (i.e., more negative) than β3 and β4.
Finally, we test whether students taught by a reassigned teacher in grade 2 have lower
achievement in grade 3. If reassigned teachers are of lower quality, then students with reassigned
teachers may learn less in second grade which may contribute to lower achievement in third
grade. For this analysis, we predict student achievement on the FCAT in third grade, separately
for math and reading. The following equation describes the model:
𝑃𝑖3 = 𝛽0 + 𝑆𝑃𝑇10𝑖2𝛽1 + 𝐻𝑖𝐻ℎ_𝑡𝑐_𝐿𝑐𝐿_𝑃𝑡𝑐𝑡𝑡𝑖𝐻𝑔𝑡𝑡𝑖2𝛽2 + 𝐿𝑐𝐿_𝑡𝑐_𝐿𝑐𝐿_𝑃𝑡𝑐𝑡𝑡𝑖𝐻𝑔𝑡𝑡𝑖2𝛽3 +
𝑃𝑖𝑐𝑡𝑡_𝑌𝑡𝑐𝑐_𝑇𝑡𝑐𝑐ℎ𝑡𝑐𝑖2𝛽4 + 𝑋𝑖𝑖𝛽5 + 𝑃𝑐𝑖𝛽6 + 𝛿𝑠𝑠𝑖 + 𝜀𝑖𝑐𝑠𝑖 (3)
In this model, student i's achievement at grade 3 is a function of his or her SAT-10 test score in
grade 2, a vector of student characteristics X (student race, gender, free lunch eligibility, and
limited English proficiency status), and the aggregate of those variables to the classroom level
(C), plus a school-by-grade-by-year fixed effect. The variable of interest in Equation 2,
High_to_Low_Reassigned, is set equal to 1 if the student’s teacher at in grade 2 was reassigned
from grade 3, 4, or 5 (i.e., a high-stakes classroom) at the end of the year before the student was
in their class. Again, since all teachers that are new to a grade might exhibit lower student
performance, we also include Low_to_Low Reassigned, which is set equal to 1 if the student’s
teacher in second grade was teaching grade K or 1 in the year before the student was in their
class. Finally, First_Year_Teacher is set to 1 if the student’s second grade teacher was in their
first year when the student was in their class. If having a reassigned teacher in second grade has
negative effects on third grade achievement, the coefficient β2 will be negative and potentially
larger in magnitude than β3 and β4.
Results

17
Teacher Effectiveness and Assignment to Tested Students
We first examine the relationship between the test performance of a teacher’s students
and whether he or she remains in a tested area in a subsequent year. Following a given year,
there are 5 distinct destinations to which teachers in tested areas can move: (1) they can stay in a
tested grade/subject and remain at the same school (70%); (2) they can move to an untested
grade/subject and remain in the same school (13%); (3) they can stay in a tested grade/subject
but move to a different school (5%); (4) they can move to an untested grade/subject and move to
a different school (2%); or (5) they can leave the sample (10%). We create four different
outcomes using this information: (1) for teachers in a tested grade/subject in year t, we predict
whether they stay in a tested grade/subject in t+1, irrespective of their school assignment; (2) for
teachers in a tested grade/subject in year t, we predict whether they stay in a tested grade/subject
in t+1 and remain in the same school; (3) for teachers in a tested grade/subject in year t, we
restrict the model to teachers that remain in the same school in t+1 and predict whether they
remain in a tested area in t+1; and (4) for teachers in a tested grade/subject in year t, we restrict
the model to teachers that switch schools in t+1 and predict whether they remain in a tested area
in t+1. Comparing the estimates for the third and fourth outcomes shows whether teacher
performance is just as important in determining assignments to tested/non-tested areas for
teachers that do and do not switch schools.
Table 2 describes the results of these models. The first row in each section shows the
effects across all school levels. We see a strong positive relationship between class average
achievement and teacher value-added and the probability that a teacher remains in a tested area.
For example, the first column shows that a one standard deviation increase in students’ math test
scores predicts an 8 percent increase in the probability that a teacher remains in a tested area in
18
the following year (comparing all switchers to all non-switchers). The results are similar across
all four outcomes described above and when using teachers’ value-added and the proportion of
their students scoring proficient instead of class average achievement. These results suggest that
principals may consider both average test scores of a teacher’s students and the teacher’s value-
added, which measures students’ achievement gains adjusted for their background
characteristics, when moving teachers across grades within schools. Interestingly, the positive
relationship between the test score measures and remaining in a tested grade holds up even
among teachers who switch schools. This result lines up with those from prior (qualitative)
studies that find that many principals use information on the test performance of teachers’
students when making hiring decisions and when assigning transferring teachers (Cannata et al.,
2014; Cohen-Vogel, 2011).
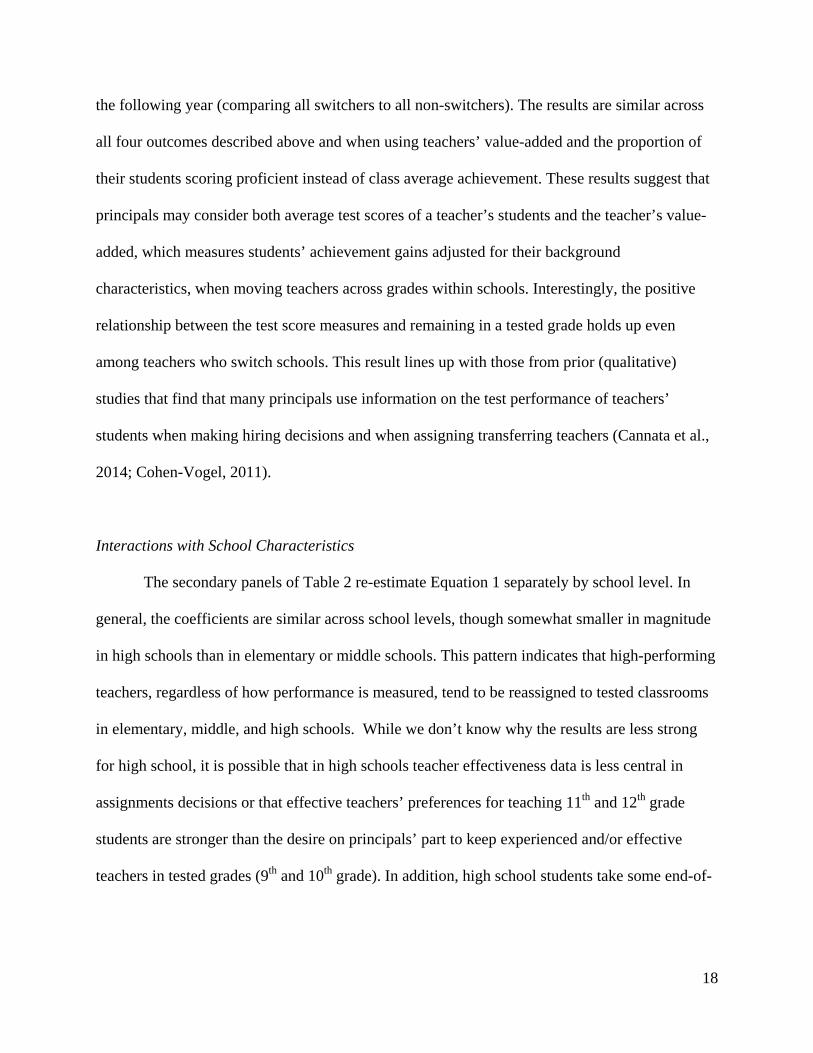
Interactions with School Characteristics
The secondary panels of Table 2 re-estimate Equation 1 separately by school level. In
general, the coefficients are similar across school levels, though somewhat smaller in magnitude
in high schools than in elementary or middle schools. This pattern indicates that high-performing
teachers, regardless of how performance is measured, tend to be reassigned to tested classrooms
in elementary, middle, and high schools. While we don’t know why the results are less strong
for high school, it is possible that in high schools teacher effectiveness data is less central in
assignments decisions or that effective teachers’ preferences for teaching 11th and 12th grade
students are stronger than the desire on principals’ part to keep experienced and/or effective
teachers in tested grades (9th and 10th grade). In addition, high school students take some end-of-

19
course exams, which, while not important for NCLB-driven accountability, may factor into
teacher assignment decisions.
In Table 3 we examine whether the relationship between student performance and staying
in a tested area varies by school accountability grades. We use two different measures of
accountability grades. First, we code the grades on a five point scale (ranging from 0 to 4) and
treat the measure as continuous. Second, we include dummy variables capturing “A” and “F”
schools and treat B/C/D schools as the reference group. While we hypothesized that these
measures might interact with assignment practices, we do not find clear evidence that they do.
We also look at the interaction between student performance, staying in a tested grade,
and school value-added, a measure of student learning adjusted for students’ background
characteristics. Here we do find that the relationship between the test scores of a teachers’
students and reassignment to a tested classroom is generally stronger in schools with higher
value-added in high-stakes subjects. The finding also holds when test performance of teachers’
students’ is measured using mean achievement and proportion proficient but not when using
teacher value-added. Principals may have a more difficult time observing value-added than the
other measures of teachers’ performance. Overall, while lower performing schools may have
more incentive to engage in strategic staffing, they do not appear to be reassigning teachers to
untested grades more than are higher performing schools.
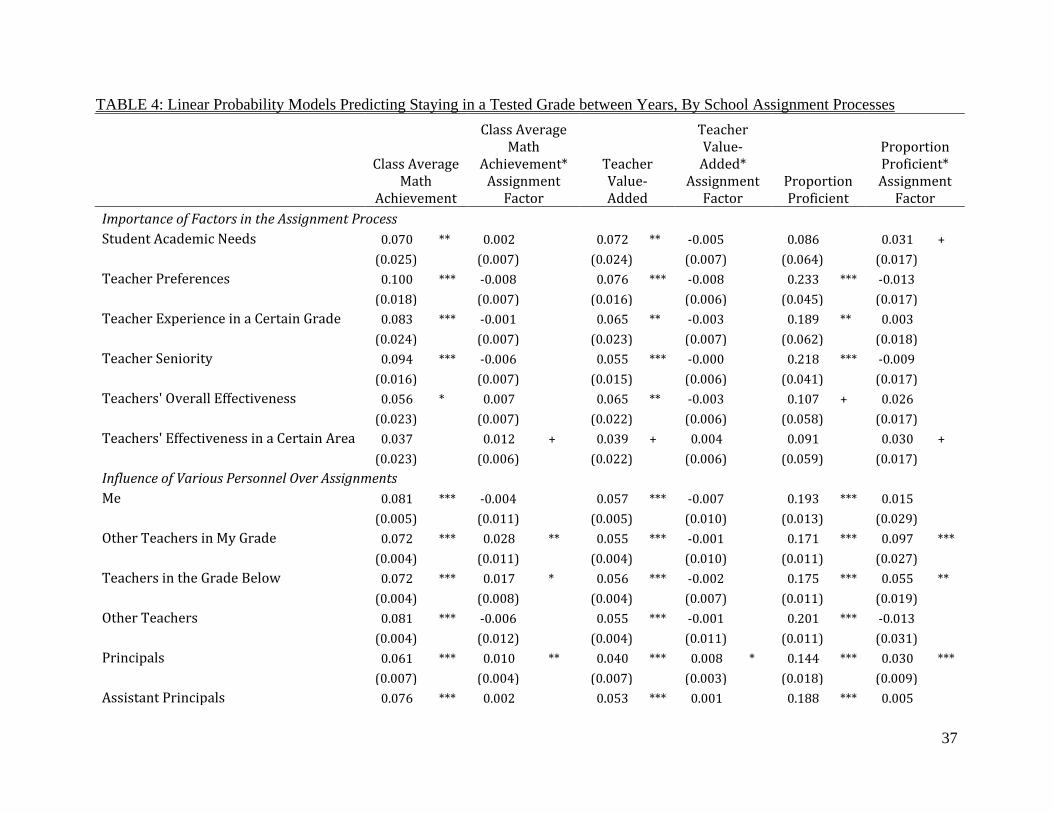
As shown in Table 4, we also find that the strength of the relationship between student
performance and remaining in a tested area varies across schools using different class assignment
policies. We are particularly interested in whether we see different patterns in schools in which
teachers report more strategic assignment practices. When teachers report that more emphasis is
put on teacher effectiveness, then, perhaps not surprisingly, the relationship between class

20
average achievement and staying in a tested grade is stronger. None of the other assignment
policy measures moderate the relationship between test performance and reassignments. We also
find that the relationship between achievement and staying in a tested area is stronger when
principals and other teachers have more involvement over assignments and weaker when parents
and students have more involvement.
Reassignments of Teachers that Switch
Our next set of analyses builds on the models in Table 2 and shows the relationship
between value-added and grade and subject assignments in the subsequent year. First, for
elementary school teachers we restrict the analysis to teachers in a tested area in year t that stay
in the same school in year t+1. We create a variable that is equal to the grade they taught next
year, for those that move. This variable can take the values of kindergarten, 1st grade, 2nd grade,
or “other” non-tested grade. We also identify teachers that teach grades 3–5 in one year and
switch to another 3–5 grade in the subsequent year. Then we do simple t-tests to compare the
value-added of teachers that move to each of these grades with those who remain in the same 3–
5 grade. Table 5 shows the results. For both reading and math value-added we find that
elementary teachers that switch to prekindergarten, kindergarten, first grade, or second grade
have lower value-added to those that stay in the same 3–5 grade. Teachers that switch among
grades 3–5 also have lower value-added than those that remain in the same grade but teachers
that switch within the 3–5 set are higher performing than teachers that switch from grades 3–5 to
grades K–2. The majority of elementary school teachers that move out of tested grades, switch to
teach second grade in the following year (63 percent).6
6 Very few teachers move to pre-kindergarten or to non-elementary school grades so those cells are omitted from the table.

21
For high school teachers we restrict the analysis to teachers in a tested area in year t that
stay in the same school in year t+1. We create a variable that takes on 4 values: (1) changes
grade but stays in same subject; (2) changes grade and switches subject; (3) stays in the same
grade, but changes to a different modal subject; or (4) continues to teach a tested subject but
switches from primarily teacher 9th graders to primarily teaching 10th graders or vice versa. The
vast majority of high school teachers that leave a tested grade/subject switch from teaching 9th or
10th grade students to teaching 11th and 12th grade students (and remain in the same subject).
High school teachers that remain in tested areas also have significantly higher value-added than
those that switch to 11th and 12th grade classrooms in the following year.
Given the stark patterns in elementary schools, we further investigate the within-school
sorting of teachers between and among high- and low- stakes K-5 classrooms by teacher
performance measures. We first use SAT-10 data to classify the average math achievement of
early grades teachers and estimate value-added for those teachers using the same approach as for
the high-stakes standardized tests. We then pool standardized values for early grades and 3–5
teachers and run models predicting where teachers work at time t+1 as a function of their
performance at time t, classifying teachers as working (a) in the same grade, (b) in a different
grade but still within the early or upper primary set (e.g., a teacher who moves from second
grade to first grade), or (c) in a different grade and not in the same early or upper primary set
(e.g., a teacher who moves from second grade to third grade). We then run three different
models, results of which are presented in Table 6. The focal variables in each model are average
math achievement (or math value-added), an indicator for whether the teacher teaches in an
early-grades (K–2) classroom, and the interaction between the two.

22
The results are generally consistent for math achievement and value added across the
models. The first column predicts the probability of teaching in the same grade next year
compared to not teaching in the same grade. Although the interaction term in the average math
achievement models is not statistically significant, the value-added model suggests that high-
performing K–2 teachers are less likely than high-performing 3–5 teachers to remain in the same
grade next year. The second column makes the binary comparison between teachers who teach a
different grade next year but still within the lower primary or upper primary set to teachers who
either remain in the same grade or switch to the opposite grade set. Here, the average math
achievement and math value-added model tell the same story, which is that high-performing K–2
teachers are less likely to move to other low-stakes grades. The final column compares teachers
who switch to the other primary grade set (i.e., switch from K–2 to 3–5 or vice versa) to those
teachers who remain in the same set, either in the same grade or in a different grade. Again, the
results for average math achievement and math value-added are consistent, demonstrating that
teachers in high-performing K–2 classrooms are more likely to be moved to the high-stakes,
upper primary grades.
A graphical illustration of the value-added results is provided in Figure 1. For both K–2
and 3–5 teachers, the probability of staying in the same grade increases and the probability of
moving to another grade in the same high- or low-stakes context decreases as teacher value-
added increases. But among grade switchers, the pattern differs. High value-added teachers in
grades 3–5 are less likely to switch to grades K–2. In contrast, high-value-added K–2 teachers
are more likely to switch to tested classrooms. Alongside our earlier results, these findings are
consistent with a general tendency of schools to reallocate effective teachers from across

23
classrooms into the high-stakes grades, concentrating relatively less effective teachers in
classrooms with the schools’ youngest students.
Unintended Consequences of Strategic Staffing
Our final analysis considers the potential impact of shifting low-performing teachers to
untested grades, given the opportunity that we have to follow elementary teachers reassigned to
first and second grade classrooms. Table 7 shows the result of estimating Equation 2 for SAT-10
math and reading, pooling first and second grade students. Student math achievement is given as
a function of whether their teacher switched grades. The coefficients show that, in both subjects,
being taught by a teacher recently reassigned from a high-stakes grade is associated with learning
gains that are .06 to .07 s.d. lower than those attained by students in classrooms with teachers
that were not reassigned. For comparison, this effect is stronger than for students taught by a
teacher that switched grades within the K–2 set, who have learning gains that are about .05 s.d.
lower than those attained by students in classrooms with teachers that were not reassigned. In
math, students taught by first year teachers have the lowest achievement gains, while in reading
students taught by teachers that switched grades do the worst.
Lastly, we consider whether the apparently negative effect of being taught by a
reassigned teacher in second grade is associated with lower FCAT achievement as of the end of
the following year, third grade, which is the first grade “counted” for accountability purposes.
The results are shown in Table 8. In the two leftmost columns, estimated from five years of data,
we find evidence of a negative effect of similar size in both math and reading. Being taught by a
reassigned teacher in second grade is associated with third grade scores that are between 0.02
and 0.03 s.d. lower than for other students (both coefficients significant at the 0.01 level). The
24
magnitude of these relationships is similar to the effect of having had a first year second grade
teacher. The rightmost columns add a control for SAT-10 score at the end of first grade to better
isolate this effect. The tradeoff, however, is that we only have enough years of SAT-10 data to
estimate the model that includes this lagged score for three cohorts of students. Despite this loss
of sample size, the coefficients remain significant and similar in magnitude with the inclusion of
controls for first grade achievement. These results suggest that reassignment of low-performing
teachers to early grades may have longer term consequences for student learning trajectories.
Discussion and Conclusions
Our analysis of strategic staffing in tested and non-tested classrooms in a large urban
school district finds that teacher effectiveness, as measured by student test score performance, in
one year is a strong predictor of whether a teacher continues to teach tested students in a
subsequent year. These patterns are particularly apparent in schools where more emphasis is
placed on teacher effectiveness in determining class assignments and where principals have more
influence. Although the association is strongest among school stayers, past performance is
predictive of subsequent assignment to a high-stakes classroom even among teachers that switch
schools. Taken together, our results suggest that principals attempt to balance their desire to
satisfy stakeholders (teachers, parents, students) with their desire to improve student
achievement when making assignment decisions. In higher stakes environments, principals may
respond more strategically to accountability pressure and make different decisions about how to
allocate teachers to students.
Gains from the strategic assignment of high-performing teachers to high-stakes grades
have limits, however. Reassignment of low-performing elementary teachers to early grades

25
results in reduced student achievement gains in those classrooms in both math and reading as
measured by a low-stakes assessment. This result is concerning from the perspectives of both
schools and families if achievement in early grades provides a foundation for later learning. In
responding to the acute pressures of the accountability system, schools may be disadvantaging
students taught by these less effective reassigned teachers over the longer term, opening up the
possibility that, by providing incentives to increase student learning by increasing teacher
effectiveness in later grades, current test-based accountability systems may also be perversely
incenting reduced investment in students’ earliest schooling years when returns on that
investment are greatest (Heckman, 2006; Hill et al., 2008).
Consistent with the idea that a student’s achievement is influenced not only by his or her
current teacher but by past teachers as well, we find some evidence that this lower performance
translates into lower achievement at the end of third grade. Being taught by a teacher moved
from the upper elementary grades in second grade is roughly equivalent to being taught by a
first-year teacher in terms of impacts on scores at the end of third grade. These results should
give pause to school leaders aiming to boost school performance in the eyes of the accountability
regime by focusing only on teacher effectiveness in high-stakes classrooms.
Follow-up research with additional years of K–2 achievement data linked to a longer
panel of student achievement scores in tested grades may allow for a fuller investigation of the
effects of reassignment of low-performing teachers to lower grades on student performance later
in school. Studies of the persistence of teacher effects suggest that effects of this kind of
systematic reassignment on later outcomes may be substantial (Konstantopoulos & Chung,
2011). In short, teachers at the earliest stages of a child’s schooling career may have a
disproportionately large impact on the child’s learning trajectory, but policymakers have

26
designed an accountability system that pushes schools to sort its best teachers away from those
grades, with potentially large long-term consequences. Unfortunately, most accountability
systems’ focus on testing beginning in third grade further means that the kind of information on
early-grades performance necessary to investigate this phenomenon is missing from most large-
scale administrative data bases. Our results underscore the importance of education researchers
bringing new data to these issues.
This study, however, faces concerns about generalizability. M-DCPS is a very large
urban district whose school settings may be very unrepresentative of those in the typical school
district. Although the accountability pressures faced by M-DCPS are similar to those faced by
other Florida school districts, Florida’s accountability system is among the nation’s most
stringent, and the pressures it applies on schools—particularly low-performing schools—may
elicit particularly strong responses from schools (Rouse et al., 2007). Assessment of assignment
practices both in general and in the context of school accountability set in other districts or states
would be useful in developing our understanding of how schools approach human capital
decision-making.
Future research might also consider whether the reassignment of low-performing teachers
to low-stakes classrooms might have implications for student outcomes beyond those associated
with moving teachers to early grades. Evidence in Table 5 suggests that high schools move many
relatively low-performing teachers to non-tested classrooms in grades 11 and 12, for example,
which may affect students’ preparation for postsecondary opportunities. Reassignment of
ineffective teachers to other kinds of untested classrooms (e.g., arts, non-core subjects) may
similarly have consequences for student learning beyond math and reading.

27
References
Aaronson, D., Barrow, L., & Sander, W. (2007). Teachers and student achievement in Chicago public high schools. Journal of Labor Economics, 25(1), 95-135.
Booher-Jennings, J. (2005). Below the bubble: “Educational triage” and the Texas accountability system. American Educational Research Journal, 42(2), 231-268.
Cannata, M., Rubin, M., Goldring, E. B., Drake, T. A., Grissom, J. A., Neumerski, C., & Schuermann, P. (2014). Using teacher effectiveness data for information rich hiring. Paper presented at the annual meeting of the American Educational Research Association, Philadelphia, PA, April 3-7, 2014.
Chingos, M. M., & West, M. R. (2011). Promotion and reassignment in public school districts: How do schools respond to differences in teacher effectiveness? Economics of Education Review, 30, 419-433.
Claessens, A., Duncan, G., & Engel, M. (2009). Kindergarten skills and fifth-grade achievement: Evidence from the ECLS-K. Economics of Education Review, 28(4), 415-427.
Clotfelter, C. T., Ladd, H. F., & Vigdor, J. L. (2006). Teacher-student matching and the assessment of teacher effectiveness. Journal of Human Resources, 41(4), 778–820.
Cohen-Vogel, L. (2011). Staffing to the test: Are today's school personnel practices evidence based? Educational Evaluation and Policy Analysis, 33(4), 483–505.
Dee, T. & Jacob, B. (2011). The impact of No Child Left Behind on student achievement. Journal of Policy Analysis and Management, 30(3), 418-446.
Dee, T., Jacob, B, & Schwartz, N. (2013). The effects of NCLB on school resources and practices. Educational Evaluation and Policy Analysis, 35(2), 252-279.
Diamond, J. B., & Spillane, J. P. (2004). High-stakes accountability in urban elementary schools: Challenging or reproducing inequality? Teachers College Record, 106, 1145-1176.
Figlio, D. N. (2006). Testing, crime, and punishment. Journal of Public Economics, 90(4-5), 837-851.
Figlio, D. N., & Getzler, L. S. (2006). Accountability, ability and disability: Gaming the system? In T. J. Gronberg (Ed.), Advances in Microeconomics: Elsevier Science
Figlio, D. N., & Winicki, J. (2005). Food for thought: The effects of school accountability plans on school nutrition. Journal of Public Economics, 89(2-3), 381-394.
Fuller, S. C., & Ladd, H. F. (2013). School-based accountability and the distribution of teacher quality across grades in elementary school. Education Finance and Policy, 8(4), 528–559.
Grissom, J. A., Loeb, S., & Nakashima, N. A. (2014). Strategic involuntary teacher transfers and teacher performance: Examining equity and efficiency. Journal of Policy Analysis and Management, 33(1), 112-140.
Guskey, T. R. (2003). How classroom assessments improve learning. Educational Leadership, 60(5), 6-11.
28
Hannaway, J., & Hamilton, L. (2008). Performance-based accountability policies: Implications for school and classroom practices. Washington: Urban Institute and RAND Corporation.
Heckman, J. J. (2006). Skill formation and the economics of investing in disadvantaged children. Science, 312(5782), 1900–1902.
Heilig, J. V., & Darling-Hammond, L. (2008). Accountability Texas-style: The progress and learning of urban minority students in a high-stakes testing context. Educational Evaluation and Policy Analysis, 30(2), 75-110.
Hill, C. J., Bloom, H. S., Black, A. R., & Lipsey, M. W. (2008). Empirical benchmarks for interpreting effect sizes in research. Child Development Perspectives, 2(3), 172–177.
Jacob, B. A. (2005). Accountability, incentives and behavior: The impact of high-stakes testing in the Chicago Public Schools. Journal of Public Economics, 89(5–6), 761–796.
Jacob, B. A. (2010). Do principals fire the worst teachers? National Bureau of Economic Research, Working Paper #15715.
Jacob, B. A., & Lefgren, L. (2004). Remedial education and student achievement: A regression-discontinuity analysis. Review of Economics and Statistics, 86(1), 226–244.
Jacob, B. A., & Lefgren, L. (2008). Can principals identify effective teachers? Evidence on subjective performance evaluation in education. Journal of Labor Economics, 26(1), 101-136.
Jacob, B.A., & Levitt, S. D. (2003). Rotten apples: An investigation of the prevalence and predictors of teacher cheating. Quarterly Journal of Economics, 118(3), 843-877.
Kalogrides, D., Loeb, S., & Béteille, T. (2013). Systematic sorting: Teacher characteristics and class assignments. Sociology of Education, 86(2), 103–123.
Kane, T. J., Rockoff, J. E., & Staiger, D. O. (2008). What does certification tell us about teacher effectiveness? Evidence from New York City. Economics of Education Review, 27(6), 615-631.
Konstantopoulos, S., & Chung, V. (2011). The persistence of teacher effects in elementary grades. American Educational Research Journal, 48(2), 361–386.
Lankford, H., Loeb, S., & Wyckoff, J. (2002). Teacher sorting and the plight of urban schools: A descriptive analysis. Educational Evaluation and Policy Analysis, 24(1), 37–62.
Loeb, S., Kalogrides, D., & Béteille, T. (2012). Effective schools: Teacher hiring, assignment, development, and retention. Education Finance and Policy, 7(3), 269–304.
McMurrer, J. (2007). Choices, changes, and challenges: Curriculum and instruction in the NCLB era. Washington, DC: Center for Education Policy
McMurrer, J. (2008). Instructional time in elementary schools: A closer look at changes for specific subjects. Washington, DC: Center for Education Policy.
Neild, R. C., & Farley-Ripple, E. (2008). Within-school variation in teacher quality: The case of ninth grade. American Journal of Education, 114, 271-305.
Nye, B., Konstantopoulos, S., & Hedges, L. V. (2004). How large are teacher effects? Educational Evaluation and Policy Analysis, 26(3), 237-257.

29
Perry, J. D., Guidubaldi, J., & Kehle, T. J. (1979). Kindergarten competencies as predictors of third-grade classroom behavior and achievement. Journal of Educational Psychology, 71(4), 443–450. d
Rivkin, S. G., Hanushek, E. A., & Kain, J. F. (2005). Teachers, schools, and academic achievement. Econometrica, 73(2), 417-458.
Rockoff, J. (2004). The impact of individual teachers on student achievement: Evidence from panel data. American Economic Review, 94, 247-252.
Rouse, C. E., Hannaway, J., Goldhaber, D., & Figlio, D. (2007). Feeling the Florida heat? How low-performing schools respond to voucher and accountability pressure. National Bureau of Economic Research.
Sanders, W., & Rivers, J. (1996). Cumulative and residual effects of teachers on future student academic achievement. Knoxville: University of Tennessee Value-Added Research and Assessment Center.
Schweinhart, L. J., Montie, J., Xiang, Z., Barnett, W. S., Belfield, C. R., & Nores, M. (2005). Lifetime effects: The HighScope Perry Preschool Study through age 40. (Monographs of the HighScope Educational Research Foundation, 14). Ypsilanti, MI: HighScope Press.
Watts, T. W., Duncan, G. J., Siegler, R. S., & Davis-Kean, P. E. (2014). What’s past is prologue: Relations between early mathematics knowledge and high school achievement. Educational Researcher, 43(7), 352–360.

30
FIGURE 1: Association between teacher value-added in math and probability of staying or switching grades

31
TABLE 1: Descriptive Statistics
Administrative Data Survey Data
Mean SD N Mean SD N Teacher Characteristics
Female 0.76
140135 0.80
7473
White 0.29
139780 0.33
Black 0.27
139780 0.26
7423
Hispanic 0.43
139780 0.40
7423
Other Race 0.02
139780 0.02
7423
MA or Higher 0.36
140139 0.46
7474
Experience in Current School 9.94 9.21 140139 8.23 7.38 7655
Teaches Tested Grade 0.40
140139 0.36
7730
Switches from Tested to Non-Tested Grade 0.17
43795 0.16
3259
Between Current and Prior Year1
Class Characteristics
Average Prior Year Math Achievement -0.09 0.71 106025 -0.16 0.75 4997
Proportion Receiving Free Lunches 0.66 0.24 140089 0.67 0.23 6873
Proportion Black 0.28 0.33 140090 0.29 0.33 6875
Proportion White 0.09 0.12 140090 0.08 0.12 6791
Elementary School 0.53 0.50 140139 0.40 0.49 7639
Involvement in Class Assignments (Yes/No)
Me
0.16 0.36 6568
Other Teachers in My grade
0.12 0.32 6568
Teachers in the Grade Below
0.16 0.36 6568
Other Teachers in My grade
0.11 0.32 6568
Principal
0.51 0.50 6568
Assistant Principals
0.64 0.48 6568
Counselors
0.38 0.48 6568
Parents
0.07 0.26 6568
Students
0.07 0.25 6568
Factors Involved in Class Assignments (1-5 Scale)
Individual students’ end-of-year state test performance
3.28 1.17 3011
Mixing disruptive and well-behaved students in a class
2.79 1.27 3024
Mixing students at different achievement levels in a class
2.89 1.25 3032
The academic needs of individual students
3.64 1.08 3057
Individual students’ prior test scores
3.43 1.09 3001
Individual teachers’ preferences or requests
2.59 1.14 3025
The test scores of a teacher’s former students 3.05 1.17 3006
1Restricted to teachers in a tested grade in year t-1.

32
TABLE 2: Linear Probability Models Predicting Staying in a Tested Grade between Years
Comparison: All Non-Switchers to All
Switchers
Non-Switchers (Same School) to
All Switchers
Non-Switchers (Same School) to Switchers
(Same School)
Non-Switchers (Different School) to Switchers (Different
School) Math Test Scores of Teachers' Current Students
Average Effects (1) (2) (3) (4)
Average Math Achievement of Teachers' 0.079 *** 0.077 *** 0.079 *** 0.065 ***
Current Students This Year (0.003) (0.003) (0.003) (0.017)
N 54705 54705 46082 3966
Effects by School Level (5) (6) (7) (8)
Average Math Achievement of Teachers' 0.089 *** 0.088 *** 0.084 *** 0.073 **
Current Students This Year (Elementary School) (0.004) (0.004) (0.003) (0.022)
Average Math Achievement of Teachers' 0.073 *** 0.072 *** 0.078 *** 0.045
Current Students This Year (Middle School) (0.007) (0.008) (0.006) (0.035)
Average Math Achievement of Teachers' 0.056 *** 0.049 *** 0.064 *** 0.064 +
Current Students This Year (High School) (0.008) (0.008) (0.008) (0.037) Teacher Value-Added in Math
Average Effects (9) (10) (11) (12)
Teacher Value-Added in Math This Year 0.054 *** 0.058 *** 0.047 *** 0.014
(0.003) (0.003) (0.003) (0.020)
N 24014 24014 20432 1590
Effects by School Level (13) (14) (15) (16)
Teacher Value-Added in Math This Year 0.058 *** 0.060 *** 0.047 *** 0.049 +
(Elementary School) (0.003) (0.004) (0.003) (0.028)
Teacher Value-Added in Math This Year 0.060 *** 0.062 *** 0.060 *** 0.029
(Middle School) (0.006) (0.007) (0.005) (0.036)
Teacher Value-Added in Math This Year 0.031 *** 0.042 *** 0.038 *** -0.102 +
(High School) (0.009) (0.010) (0.010) (0.053)

33
TABLE 2 (cont’d)
Proportion of Teachers' Current Student Scoring Proficient or Better
Average Effects (17) (18) (19) (20)
Proportion of Students Proficient or Better* 0.198 *** 0.196 *** 0.187 *** 0.169 ***
(0.008) (0.008) (0.007) (0.042)
N 54688 54688 46067 3966
Effects by School Level (21) (22) (23) (24)
Proportion of Students Proficient or Better 0.229 *** 0.227 *** 0.212 *** 0.211 ***
(Elementary School) (0.009) (0.010) (0.008) (0.054)
Proportion of Students Proficient or Better 0.157 *** 0.172 *** 0.155 *** 0.034
(Middle School) (0.018) (0.020) (0.016) (0.090)
Proportion of Students Proficient or Better 0.133 *** 0.110 *** 0.143 *** 0.170 +
(High School) (0.022) (0.022) (0.022) (0.099)
School by Year Fixed Effects X
X
X
X
Includes Controls X
X
X
X Notes: ***p<.001; **p<.01; *p<.05. The models are restricted to teachers who teach students tested in math or reading in a given year. The outcome is
whether they remain in a tested grade/subject in the following year. Column 1 compares teachers that stay in a tested grade/subject in t+1 to all those that switch out of a tested area; Column 2 compares teachers that stay in a tested grade/subject and stay in the same school to all those that switch out of a tested area; Column 3 compares teachers that stay in a tested grade/subject and stay in the same school to those that switch out of a tested area and remain in the same school; Column 4 compares those that stay in a tested grade/subject and change schools to those that switch out of a tested area and switch schools. This final outcome shows whether student performance is related to staying in a tested area among teachers that change schools.

34
TABLE 3: Linear Probability Models Predicting Staying in a Tested Grade between Years, By School Performance
Comparison: All Non-
Switchers to All Switchers
Non-Switchers (Same School) to
All Switchers
Non-Switchers (Same School) to Switchers (Same
School)
Non-Switchers (Different School) to Switchers (Different
School) Math Test Scores of Teachers' Current Students
Continuous School Accounability Grade (1) (2) (3) (4)
Average Math Achievement of Teachers' 0.086 *** 0.065 *** 0.108 *** 0.010
Current Students This Year (0.010) (0.010) (0.009) (0.040)
Average Math Achievement of Teachers' -0.002 0.004 -0.009 *** 0.025 +
Current Students This Year*School Accnt Grade (0.003) (0.003) (0.003) (0.015)
N 44168 44168 37173 3218
Categorical School Accounability Grade (B/C/D Omitted) (5) (6) (7) (8)
Average Math Achievement of Teachers' 0.081 *** 0.076 *** 0.082 *** 0.056 **
Current Students This Year (0.004) (0.004) (0.004) (0.020)
Average Math Achievement of Teachers' -0.003 0.004 -0.010 + 0.069 +
Current Students This Year* A School Accnt Grade (0.006) (0.007) (0.006) (0.040)
Average Math Achievement of Teachers' -0.014 -0.025 0.055 * -0.104
Current Students This Year* F School Accnt Grade (0.021) (0.022) (0.021) (0.067)
N 54705 54705 46082 3966
School Value-Added in Math (9) (10) (11) (12)
Average Math Achievement of Teachers' 0.076 *** 0.075 *** 0.078 *** 0.061 **
Current Students This Year (0.004) (0.004) (0.003) (0.021)
Average Math Achievement of Teachers' 0.014 *** 0.015 *** 0.015 *** -0.001
Current Students This Year* School Value-Added (0.004) (0.004) (0.003) (0.022)

35
TABLE 3 (cont’d)
Teacher Value-Added in Math
Continuous School Accounability Grade (13) (14) (15) (16)
Teacher Value-Added in Math This Year 0.049 *** 0.048 *** 0.058 *** -0.073
(0.010) (0.010) (0.009) (0.047)
Teacher Value-Added in Math This Year* 0.002 0.003 -0.003 0.039 *
School Accnt Grade (0.003) (0.003) (0.003) (0.017)
N 19438 19438 16505 1298
Categorical School Accounability Grade (B/C/D Omitted) (17) (18) (19) (20)
Teacher Value-Added in Math This Year 0.057 *** 0.058 *** 0.050 *** 0.023
(0.004) (0.004) (0.003) (0.024)
Teacher Value-Added in Math This Year* -0.004 0.000 -0.007 0.030
A School Accnt Grade (0.006) (0.006) (0.005) (0.049)
Teacher Value-Added in Math This Year* -0.023 -0.029 0.048 * -0.196 **
F School Accnt Grade (0.022) (0.024) (0.023) (0.074)
N 24014 24014 20432 1590
School Value-Added in Math (21) (22) (23) (24)
Teacher Value-Added in Math This Year 0.056 *** 0.057 *** 0.050 *** 0.026
(0.003) (0.003) (0.003) (0.024)
Teacher Value-Added in Math This Year* 0.004 0.004 0.001 0.031
School Value-Added (0.003) (0.003) (0.003) (0.027)

36
TABLE 3 (cont’d)
Proportion of Teachers' Current Student Scoring Proficient or Better
Continuous School Accounability Grade (25) (26) (27) (28)
Proportion of Students Proficient or Better* 0.171 *** 0.137 *** 0.201 *** -0.049
(0.025) (0.027) (0.024) (0.107)
Proportion of Students Proficient or Better* 0.008 0.018 * -0.005 0.087 *
School Accnt Grade (0.008) (0.008) (0.007) (0.038)
N 44152 44152 37159 3218
Categorical School Accounability Grade (B/C/D Omitted) (29) (30) (31) (32)
Proportion of Students Proficient or Better* 0.192 *** 0.185 *** 0.188 *** 0.120 *
(0.010) (0.011) (0.009) (0.050)
Proportion of Students Proficient or Better* 0.017 0.030 + -0.005 0.228 *
A School Accnt Grade (0.016) (0.017) (0.015) (0.097)
Proportion of Students Proficient or Better* -0.022 -0.056 0.136 * -0.195
F School Accnt Grade (0.065) (0.068) (0.065) (0.198)
N 54688 54688 46067 3966
School Value-Added in Math (33) (34) (35) (36)
Proportion of Students Proficient or Better* 0.196 *** 0.195 *** 0.191 *** 0.164 **
(0.009) (0.009) (0.008) (0.050)
Proportion of Students Proficient or Better* 0.039 *** 0.037 *** 0.038 *** 0.016
School Value-Added (0.009) (0.010) (0.009) (0.053)
School by Year Fixed Effects X
X
X
X
Includes Controls X
X
X
X Notes: ***p<.001; **p<.01; *p<.05. The models are restricted to teachers who teach students tested in math or reading in a given year. The outcome is
whether they remain in a tested grade/subject in the following year. Column 1 compares teachers that stay in a tested grade/subject in t+1 to all those that switch out of a tested area; Column 2 compares teachers that stay in a tested grade/subject and stay in the same school to all those that switch out of a tested area; Column 3 compares teachers that stay in a tested grade/subject and stay in the same school to those that switch out of a tested area and remain in the same school; Column 4 compares those that stay in a tested grade/subject and change schools to those that switch out of a tested area and switch schools. This final outcome shows whether student performance is related to staying in a tested area among teachers that change schools.
37
TABLE 4: Linear Probability Models Predicting Staying in a Tested Grade between Years, By School Assignment Processes
Class Average Math
Achievement
Class Average Math
Achievement* Assignment
Factor
Teacher Value-Added
Teacher Value-
Added* Assignment
Factor Proportion Proficient
Proportion Proficient* Assignment
Factor
Importance of Factors in the Assignment Process
Student Academic Needs 0.070 ** 0.002 0.072 ** -0.005 0.086 0.031 +
(0.025) (0.007) (0.024) (0.007) (0.064) (0.017)
Teacher Preferences 0.100 *** -0.008
0.076 *** -0.008
0.233 *** -0.013
(0.018) (0.007)
(0.016) (0.006)
(0.045) (0.017)
Teacher Experience in a Certain Grade 0.083 *** -0.001
0.065 ** -0.003
0.189 ** 0.003
(0.024) (0.007)
(0.023) (0.007)
(0.062) (0.018)
Teacher Seniority 0.094 *** -0.006
0.055 *** -0.000
0.218 *** -0.009
(0.016) (0.007)
(0.015) (0.006)
(0.041) (0.017)
Teachers' Overall Effectiveness 0.056 * 0.007 0.065 ** -0.003
0.107 + 0.026
(0.023) (0.007) (0.022) (0.006)
(0.058) (0.017)
Teachers' Effectiveness in a Certain Area 0.037
0.012 + 0.039 + 0.004
0.091
0.030 +
(0.023)
(0.006) (0.022) (0.006)
(0.059)
(0.017)
Influence of Various Personnel Over Assignments Me 0.081 *** -0.004
0.057 *** -0.007
0.193 *** 0.015
(0.005) (0.011)
(0.005) (0.010)
(0.013) (0.029) Other Teachers in My Grade 0.072 *** 0.028 ** 0.055 *** -0.001
0.171 *** 0.097 ***
(0.004) (0.011) (0.004) (0.010)
(0.011) (0.027)
Teachers in the Grade Below 0.072 *** 0.017 * 0.056 *** -0.002
0.175 *** 0.055 **
(0.004) (0.008) (0.004) (0.007)
(0.011) (0.019)
Other Teachers 0.081 *** -0.006
0.055 *** -0.001 0.201 *** -0.013
(0.004) (0.012)
(0.004) (0.011) (0.011) (0.031)
Principals 0.061 *** 0.010 ** 0.040 *** 0.008 * 0.144 *** 0.030 ***
(0.007) (0.004) (0.007) (0.003) (0.018) (0.009)
Assistant Principals 0.076 *** 0.002
0.053 *** 0.001
0.188 *** 0.005

38
(0.009) (0.004)
(0.008) (0.004)
(0.023) (0.011)
Counselors 0.087 *** -0.009 * 0.059 *** -0.006 + 0.225 *** -0.032 ***
(0.004) (0.004) (0.004) (0.004) (0.011) (0.009)
Parents 0.088 *** -0.055 ** 0.058 *** -0.022
0.221 *** -0.143 **
(0.004) (0.018) (0.004) (0.017)
(0.011) (0.047)
Students 0.088 *** -0.083 *** 0.060 *** -0.054 ** 0.225 *** -0.261 *** (0.004) (0.019) (0.003) (0.019) (0.009) (0.048) School by Year Fixed Effects X X X X X X Includes Demographic Controls X X X X X X Notes: ***p<.001; **p<.01; *p<.05. Each row reflects estimates from a separate model. Teacher responses to 2011 survey items on class assignments are aggregated to the school level and then treated as a time-invariant school characteristic. The outcome compares teachers who stay to those who switch in tested areas, ignoring school changers. Sample sizes for class average math achievement regressions range from 54,429 to 54,651; for teacher value-added models, sample sizes range from 23,908 to 23,993; and for proportion proficient models, sample sizes range from 54,413 to 54,634.

39
TABLE 5: Mean Value-Added Among Teachers in Tested Grades in Year t, by Status in Year t+1
Math VA Reading VA % of those who
move overall
% of those who move out
of tested grade
Elementary School Moves to K from Grades 3–5 -0.448 *** -0.464 *** 5% 13%
Moves to 1st from Grades 3–5 -0.481 *** -0.309 *** 8% 22% Moves to 2nd from Grades 3–5 -0.396 *** -0.363 *** 23% 63% Stays in 3–5, but Changes Grades -0.116 *** -0.115 *** 64%
Stays in 3–5, Same Grade 0.041
0.008 High School
Same Subject, Grade 11-12 -0.070 * -0.114 ** 51% 94% Different Subject, Grade 11-12 -0.033
-0.121
2% 4%
Different Subject, Grade 9-10 -0.584 * -0.186
1% 2% Stays in Math/ELA, Grades 9-10 but Changes Grade 0.025
-0.125 ** 46%
Stays in Math/ELA, Grades 9-10, Same Grade 0.026 0.117 *Significance tests compare the VA in a given category to the VA of teachers that remain in a tested area. The analysis is restricted to teachers that teach in tested areas in year t and that stay in the same school in year t+1.

40
TABLE 6: Achievement Gains among First and Second Grade Students
Same Grade
Next Year
Different Grade Next Year but in
the same K–2 or 3–5 Set
Different Grade Next Year and in
Different K–2 or 3–5 Set
Assignment Next Year:
Average Math Achievement of Teachers' 0.095 *** -0.021 *** -0.038 *** Current Students This Year (0.004) (0.003) (0.003) K–2 Teachers (3–5 Teachers = reference) -0.024 *** -0.060 *** 0.088 ***
(0.004) (0.003) (0.003)
Math Achievement*K–2 Teacher 0.001 -0.026 *** 0.025 ***
(0.006) (0.004) (0.004)
N (School by Year Observations) 2189 2189 2189 N (Total Observations) 72760 72760 72760
Teacher Value-Added in Math This Year 0.053 *** -0.007 ** -0.028 ***
(0.003) (0.003) (0.002)
K–2 Teachers (3–5 Teachers = reference) -0.053 *** -0.016 * 0.074 ***
(0.009) (0.006) (0.006)
Value-Added*K–2 Teacher -0.024 * -0.029 ** 0.054 ***
(0.012) (0.009) (0.008)
N (School by Year Observations) 1907 1907 1907 N (Total Observations) 21541 21541 21541
School by Year Fixed Effects X
X
X Includes Controls X X X
The model includes teachers that teach grades K–2 and 3–5.

41
TABLE 7: Achievement Gains among First and Second Grade Students Math p-value Reading p-value Student's Teacher…
Switched from Grades 3–5 in Prior Year -0.072 *** reference -0.062 *** reference
(0.008)
(0.008)
Taught Different K–2 Grade Last Year -0.050 *** 0.03 -0.051 *** 0.26
(0.008)
(0.008)
Is A First Year Teacher -0.097 *** 0.12 -0.045 ** 0.27
(0.015)
(0.015)
N (School by Year by Grade Cells) 2177
2172 N (Students) 86920 85766
Models include a control for prior year test score, controls for student race, gender, free lunch eligibility, and limited English proficiency as well as the aggregate of these student-level measures at the class-level. They also include school by year by grade fixed effects.

42
TABLE 8: Achievement among Third Grade Students, By Status of Second Grade Teacher Math p Reading p Math p Reading p Math p Reading p Student's Second Grade Teacher….
Switched from Grades 3–5 in Year -0.023*** ref -0.033*** ref -0.028* ref -0.030** ref -0.032** ref -0.031** ref Prior to Teaching Student (0.007)
(0.006)
(0.012)
(0.011)
(0.011)
(0.010)
Taught Different K–2 Grade in Year -0.014* 0.35 -0.019** 0.09 0.012 0.01 0.007 0.01 -0.015 0.24 -0.006 0.07 Prior to Teaching Student in
Year (0.007)
(0.007)
(0.013)
(0.012)
(0.012)
(0.011) Was First Year Teacher -0.036*** 0.17 -0.034*** 0.92 -0.044* 0.47 -0.035+ 0.83 -0.025 0.72 -0.020 0.57
(0.008)
(0.008)
(0.020)
(0.019)
(0.018)
(0.017)
N (School by Year by Grade Cells) 1930
1936
750
753
750
753 N (Students) 142000
136000
39732
37653
39732
37653
Restricted to Sample with 1st Grade SAT10 No
No
Yes
Yes
Yes
Yes
Control for 1st Grade SAT10 Score No
No
No
No
Yes
Yes Models include controls for student race, gender, free lunch eligibility, and limited English proficiency as well as the aggregate of these student-level
measures at the class-level. They also include school by year fixed effects. p-values result from tests of equality of coefficients, with the first row indicating the reference group.