Embed Size (px)
Citation preview

DISCLAIMER
This PDF is a section of the Unilever Annual Report and Accounts 2015. It does not contain sufficient information to allow a full understanding of the results of the Unilever Group and the state of affairs of Unilever N.V., Unilever PLC or the Unilever Group. For further information the Unilever Annual Report and Accounts 2015 should be consulted.
Certain sections of the Unilever Annual Report and Accounts 2015 have been audited. These are on pages 90 to 159, and those parts noted as audited within the Directors’ Remuneration Report on pages 66 to 83.
The maintenance and integrity of the Unilever website is the responsibility of the Directors; the work carried out by the auditors does not involve consideration of these matters. Accordingly, the auditors accept no responsibility for any changes that may have occurred to the financial statements since they were initially placed on the website.
Legislation in the United Kingdom and the Netherlands governing the preparation and dissemination of financial statements may differ from legislation in other jurisdictions.
Except where you are a shareholder, this material is provided for information purposes only and is not, in particular, intended to confer any legal rights on you.
The Annual Report and Accounts does not constitute an invitation to invest in Unilever shares. Any decisions you make in reliance on this information are solely your responsibility.
The information is given as of the dates specified, is not updated, and any forward-looking statements are made subject to the reservations specified in the cautionary statement on the inside back cover of this PDF.
Unilever accepts no responsibility for any information on other websites that may be accessed from this site by hyperlinks.

MAKING SUSTAINABLE LIVING
COMMONPLACE
ANNUAL REPORT AND ACCOUNTS 2015STRATEGIC REPORT

WE AIM TO IMPROVE HEALTH AND HYGIENE FOR 1 BILLION PEOPLE AROUND THE WORLD, THROUGH BRANDS SUCH AS LIFEBUOY.
OUR HANDWASHING PROGRAMME IS THE WORLD’S LARGEST, THANKS IN PART TO FUNDING FROM OUR EXTERNAL PARTNERS.
337 millionAlmost 337 million people have been reached by the Lifebuoy handwashing programme since it started.
LIFEBUOY – HELP A CHILD REACH 5The campaign teaches children the benefits of washing their hands at key times of the day, helping to reduce killer diseases such as diarrhoea, and saving lives at scale. In 2015 the campaign focused on hand hygiene during the crucial first 28 days after birth (the neo-natal period), the biggest barrier to children reaching five.
21The campaign was rolled out in 21 countries.
LIFEBUOY HANDWASHING PROGRAMME

OUR PURPOSEUNILEVER HAS A SIMPLE BUT CLEAR PURPOSE – TO MAKE SUSTAINABLE LIVING COMMONPLACE. WE BELIEVE THIS IS THE BEST LONG-TERM WAY FOR OUR BUSINESS TO GROW.Our distinct Purpose and our operational expertise across our business model will help realise our vision of accelerating growth in the business, while reducing our environmental footprint and increasing our positive social impact.Our Purpose and vision are ambitious but are consistent with the changing attitudes and expectations of consumers. Our unswerving commitment to sustainable living is increasingly delivering both more trust from consumers and a strong business for shareholders with lower risks and consistent, competitive and profitable long-term growth.
CONTENTSAbout us 2Chairman’s statement 4Chief Executive Officer’s review 6Our markets 10Our strategic focus 12A business model that creates value 14Our performance 16Delivering value for our stakeholders 18 – Our consumers 20 – Society 24 – Our people 28 – Our shareholders 32 – Financial review 2015 35
Our principal risks 40Summary remuneration report 42Shareholder information 44
This Strategic Report has been approved by the Boards and signed on their behalf by Tonia Lovell – Group Secretary.
OUR ANNUAL REPORT AND ACCOUNTS 2015 IS IN TWO PARTS:OUR STRATEGIC REPORTThe Strategic Report contains information about us, how we create value and how we run our business. It includes our strategy, business model, markets and Key Performance Indicators, as well as our approach to sustainability and risk.
GOVERNANCE AND FINANCIAL REPORTThe Governance and Financial Report contains detailed corporate governance information, how we mitigate risk, our Committee reports and how we remunerate our Directors, plus our Financial Statements and Notes.
ONLINEYou can find more information about Unilever online at www.unilever.com. For further information on the Unilever Sustainable Living Plan (USLP) visit www.unilever.com/sustainable-living. Our Strategic Report and Governance and Financial Report, along with other relevant documents, can be downloaded at www.unilever.com/ara2015/downloads.
POTENTIAL FOR CHANGEEvery year 6 million children die before the age of five. Hygiene, particularly handwashing with soap, is one of the most cost-effective ways to prevent these deaths. Watch and share our latest film ‘Chamki’ by director Anand Ghandi, revealing the emotional truth behind our campaign. www.youtube.com/helpachildreach5.
1Unilever Annual Report and Accounts 2015 Strategic Report

TWO BILLION PEOPLE USE UNILEVER PRODUCTS EVERY DAY TO FEEL GOOD, LOOK GOOD AND GET MORE OUT OF LIFE.
13 €1 BILLION BRANDS
1. Axe2. Dove3. Heartbrand4. Hellmann’s5. Knorr6. Lipton7. Lux8. Magnum9. Omo10. Rama11. Rexona12. Sunsilk13. Surf
OUR CATEGORIES AND BRANDSOur Personal Care, Foods, Home Care and Refreshment categories each contain a portfolio of brands that aim to deliver consistent, competitive, profitable and responsible growth supported by investment in innovation and marketing.
We have 13 brands with sales of €1 billion or above and a growing number of Sustainable Living brands, such as Dove and Knorr, that deliver strong social or environmental benefits.
We actively manage our portfolio and in 2015 added a Prestige skin care range in Personal Care through acquisition, and focused some of our Foods brands in a new Baking, Cooking and Spreads business.
13 €1 BILLION BRANDS
2 Unilever Annual Report and Accounts 2015Strategic Report
ABOUT US
1 2
3 4
5 6
7

WHERE WE OPERATEUnilever operates in more than 190 countries and is present in seven out of ten households globally. Some geographies are new, others we have been in for more than 100 years. Although we operate in some markets that are volatile, with specific risks, our size and scale provide risk diversification and consistency of returns over the long term. Our scale means we can take advantage of global manufacturing and distribution, providing efficiencies of scale and driving down costs.
2 BILLION
CONSUMERS USE OUR PRODUCTS
EVERY DAY
190WE OPERATE
IN MORE THAN 190 COUNTRIES
3Unilever Annual Report and Accounts 2015 Strategic Report
8
9 10
11 12
13

throughout my chairmanship to engage the Boards fully and actively in this process. In 2015 we were once again reassured by the robustness of the process and by the pipeline of talent available inside Unilever.
A similar emphasis has been given to the diversity of talent – and in particular to gender balance – again, with great results. The proportion of women occupying management grades now stands at 45% of the total, the highest figure in Unilever’s history and up from 38% just five years ago. I am also proud to say that Unilever continues to lead the way among its peers at Board level, with the proportion of female Non-Executive Directors in 2015 exceeding 50% for the first time.
ENGAGEMENTThroughout my chairmanship, the Boards have looked to engage fully across the Group and that was the case again in 2015. We were pleased for example to spend time at Unilever’s state-of-the-art R&D facility in Trumbull, US where we saw at first-hand the high-quality innovations being developed for the Personal Care category.
Whilst in the US, a number of Directors also visited Silicon Valley to meet with some of Unilever’s global partners and to see how we are anticipating trends and using technology to better connect with consumers. The Boards also spent time in Brussels engaging with European Union (EU) policy-makers on how to make the EU a more attractive and competitive environment in which to do business.
Over the years I have looked to engage frequently and openly with Unilever’s shareholder base and that was repeated in 2015. I met once again with principal shareholders in Europe and the US and discussed with them issues related to strategy and governance. I was also delighted to visit the Philippines and Singapore as part of Unilever’s annual investor conference, where investors were able to see some of the factors behind the strength and success of Unilever’s operations in South East Asia.
I was also pleased to meet with individual shareholders at our AGMs in April 2015. These were held for the first time at Unilever’s offices in the Netherlands and the UK. Following the success and simplicity of hosting the AGMs in-house, we will use the same venues again this year.
Information on the AGMs can be found within the NV and PLC AGM Notices which will be published in March 2016.
EVALUATIONFollowing the external Board evaluation in 2014, we used a simplified internal evaluation this year. Whilst we concluded that overall the Boards continue to operate in an effective manner, in this VUCA (volatile, uncertain, complex and ambiguous) world we set the bar even higher for ourselves for 2016 in relation to the knowledge we must acquire as a Board and the risk assessments we must conclude.
Each Board Committee also performed its own self-evaluation again and agreed on areas to enhance its effectiveness further and these are described within each Committee report.
BOARD COMPOSITION AND SUCCESSION During my tenure as your Chairman, we have sought to find people with relevant skills and experience to make a difference to the Boards’ discussions. Our thorough processes identified three new Non-Executive Directors in 2015 and I was delighted to welcome Nils Andersen, Vittorio Colao and Judith Hartmann during the year. They have further strengthened the digital expertise, financial and industry experience of the Boards. Ann Fudge became the Vice-Chairman and Senior Independent Director following Kees Storm’s retirement at the 2015 AGMs.
LOOKING AHEADEven though the tough trading conditions are likely to remain for some time to come, the Boards have full confidence in the strategy Unilever is following and in the high calibre of its executive leadership and management team. The progress Unilever has made over recent years leaves it well placed to go on delivering consistent top and bottom line growth. On behalf of the Boards I would like to thank all of Unilever’s 169,000 employees for their efforts, energy and the successes that you will read about in this Strategic Report.
Michael Treschow Chairman
CONTINUING TO DELIVER SUSTAINABLE LONG-TERM GROWTH FOR SHAREHOLDERS.
OVERVIEWDespite another year of tough economic conditions, 2015 once again saw the delivery of consistent, competitive, profitable and responsible growth, a trend that has now been firmly established at Unilever.
Over my tenure Unilever has undergone significant change. The portfolio strategy has been sharpened and adapted in order to increase Unilever’s presence in faster growing and more profitable segments of the market. Innovations have been made bigger and stronger and many more brands have been introduced successfully into new markets, most recently in 2015 with the launch of Lux in the Philippines.
The step-up in performance that has followed these changes has been founded on a much clearer operating model and a streamlining of the organisational structure, which together have helped to generate the funds for growth while also resulting in significantly higher levels of operational discipline and service delivery. Increased investments have been made in plant, product quality and information technology in order to modernise Unilever’s essential infrastructure and support growth over the longer term.
The introduction of an inspiring mission in 2010 in the form of the Unilever Sustainable Living Plan (USLP) has contributed to business success, with Unilever’s Sustainable Living brands growing at a faster rate than the rest of the Group. Employee engagement has also risen steadily since the introduction of the USLP and Unilever is now regularly recognised as one of the world’s most admired and sought-after employers.
The Boards were pleased in 2015 to see Unilever further its commitment to sustainable and equitable growth under the USLP by becoming the first ever company to publish a detailed, stand-alone Human Rights report under the framework set down by the UN Guiding Principles on Business and Human Rights.
A key element in the enhanced performance of the Group over this period has been a steady improvement in the strength and depth of Unilever’s senior management. Leadership development, talent management and succession planning have all been prioritised in pursuit of this objective and I have been pleased
4 Unilever Annual Report and Accounts 2015Strategic Report
CHAIRMAN’S STATEMENT

BOARD OF DIRECTORS1. Michael Treschow
Chairman2. Ann Fudge
Vice-Chairman and Senior Independent Director
3. Paul Polman Chief Executive Officer
4. Graeme Pitkethly Λ Chief Financial Officer
5. Nils Andersen Non-Executive Director
6. Laura Cha Non-Executive Director
7. Vittorio Colao Non-Executive Director
8. Professor Louise Fresco Non-Executive Director
9. Judith Hartmann Non-Executive Director
10. Mary Ma Non-Executive Director
11. Hixonia Nyasulu Non-Executive Director
12. John Rishton Non-Executive Director
13. Feike Sijbesma Non-Executive Director
14. Tonia LovellΛ Group Secretary
Graeme Pitkethly will be proposed for election as an Executive Director at the 2016 AGMs.
Λ Not a Board member.
For Directors’ biographies, please see page 58 of the Governance and Financial Report.
For more information on Board evaluation and shareholder engagement, see pages 46 and 49 of the Governance and Financial Report. Committee reports can be found on pages 60 to 83 of the Governance and Financial Report.
5Unilever Annual Report and Accounts 2015 Strategic Report
1 2
3 4
5 6
7 8
9 10
11 12
13 14

2.8 billionpeople live in water-stressed regions – a risk to Unilever’s growth because our products contribute significantly to domestic water usage. But there’s also a business opportunity to meet people’s needs better.
Q: What changes have there been to the external environment that more broadly impact Unilever?A: Last year saw a heightening of the kind of global challenges that have sadly become all too familiar in recent years. From climate-related disasters to the impact of mass migration, from escalating regional conflicts to the ongoing Eurozone crisis, the world remains a fragile and uncertain place. For a company like ours, operating in more than 190 countries around the world, these issues often place us on the front line in dealing with the consequences, which is why our business model calls on us to be an active contributor in finding solutions.
The trust in business generally to play its part in solving today’s challenges was undermined this year by some high-profile corporate scandals. These remind us of both the need for business models that make a positive contribution to society and of the importance of reporting impacts transparently across the value chain – only that will build trust. These are hallmarks of the USLP, which is serving us well.
On a positive note, the year saw world leaders endorse the UN Sustainable Development Goals (SDGs) and an
ambitious deal on reducing climate change at COP21 (see page 24). These provide the framework for eradicating poverty and for delivering more sustainable and equitable forms of growth. There is no business case for enduring poverty and this agenda is key to the long-term success of any company. Unilever played an important role in the process leading up to the adoption of these agreements, which align with the USLP and our vision of a fairer world for all.
Q: What went well for Unilever in 2015?A: Most pleasing was the broad-based nature of our growth – across all major categories, including Foods, which I called out as a priority last year. We are steadily reaping the benefits of having created four global categories – which bring scale to our operations and innovations – and of adopting sharper strategies for each category.
In Personal Care that has meant growing core brands, like Dove and Axe, while further building our very attractive premium business. In Home Care, the focus is on improving profitability in laundry while scaling up our fast-growing household cleaning business. In Refreshment, we committed to increase the cash contribution from ice cream, while accelerating growth in tea. And in Foods, the focus has been on accelerating growth while maintaining a healthy cash flow. Though there is more to do, we made good progress against all these strategic objectives in 2015.
UNILEVER COMPLETED YET ANOTHER YEAR OF GROWTH AHEAD OF ITS MARKETS IN 2015 AND CONTINUED TO DRIVE LONG-TERM RETURNS FOR SHAREHOLDERS.
Our leadership in making sustainable living the foundation of our business received resounding vindication from a number of political and social developments on a global scale. Paul Polman, Chief Executive Officer, answers the key questions about 2015.
Q: How would you summarise the year for Unilever?A: Our long-term ambition is to have consistent, competitive, profitable and responsible growth – year in and year out. This is increasingly difficult in today’s volatile environment, characterised by low growth, geopolitical challenges and the increasing effects of climate change. Despite this, we delivered another year of top and bottom line growth – with solid underlying sales growth of 4.1%. This consistency has been established over the last seven years and is of growing importance to investors looking for consistency in a world of escalating change and increasingly volatile markets.
The further deepening of the Unilever Sustainable Living Plan (USLP) in 2015 and its commitment to reducing our environmental footprint and increasing our positive social impact helped to ensure that growth was responsible.
GLOBAL ISSUE – SAVING WATER
WE PROVIDE LAUNDRY PRODUCTS COMBINING EXCELLENT RESULTS WITH LESS WATER. OUR USLP TARGET IS TO HALVE THE WATER ASSOCIATED WITH THE CONSUMER USE OF OUR PRODUCTS BY 2020.
We provide access to billions of litres of safe water through our Pureit and Qinyuan brands, improving the lives of millions of people.
BY 2020 WATER ABSTRACTION BY OUR FACTORIES WILL BE BELOW
2008 LEVELS
6 Unilever Annual Report and Accounts 2015Strategic Report
CHIEF EXECUTIVE OFFICER’S REVIEW

MEETING THESE GOALS WILL FUNDAMENTALLY CHANGE HOW WE DO BUSINESS.
We further enhanced our presence in the faster growing premium sectors of the market, both by premiumising our existing portfolio – with initiatives like Dove Advanced Hair Series – and by building a Prestige business in Personal Care with the acquisition of wonderful businesses like Dermalogica, REN, Murad and Kate Somerville. The addition of similarly strong acquisitions in Refreshment – Grom and Talenti – are enabling us to premiumise further our offering in ice cream.
Q: How did this translate into the financial performance of Unilever?A: Despite operating in soft markets, we sustained our growth momentum throughout the year and underlying sales growth of 4.1% represents a good performance in global markets growing at around 3%.
Our savings and efficiency programmes, combined with the efforts we have made to drive profitability in certain parts of the business, notably Home Care, and our emphasis on more margin-accretive innovations, meant that we ended the year with an improvement in core operating margin of 0.3 percentage points.
Tight control of working capital contributed to a healthy year of cash flow delivery of €4.8 billion, which – combined with the improvement in operating margin – contributed to core earnings per share growth of 14%.
Q: Where do you see the need for most improvement?A: There are three areas in particular where we need to step up performance next year.
First, with competition coming from all directions and at an ever faster pace, we need to improve our innovation cycle times and ensure we roll out innovations faster and to more markets. To that end, we have set ourselves some challenging objectives on innovation time and organisational agility.
Second, we have many wonderful brands but if they are not where the shopper wants them, when they want them, then our business will suffer. Sharpening our execution with improved distribution, customer service levels and on-shelf availability are urgent priorities.
And, finally, with growth – particularly price growth – set to remain constrained for some time to come, it is even more important that we bear down on all spending areas and ensure that our costs only reflect what the consumer is willing to pay for. We will be rolling out net revenue management and zero-based budgeting across the organisation from 2016 to keep our business competitive and ensure we have the funds to invest behind the many opportunities for growth that still exist.
We have made significant progress in each of these areas over recent years, but it is a mark of how fast the environment is evolving that, to remain agile and effective, we need to step up our efforts once again.
Q: How were you able to further your commitment to sustainable and equitable growth in 2015?A: The USLP commits us to a total value chain approach and we made further progress, including in driving the efficiency and sustainability of our own operations. We reached a milestone of 1 million tonnes of CO2 savings from energy in manufacturing – that’s a reduction of 36% since 2008; we have now avoided costs of over €600 million as a result of eco-efficiency savings in our factories and in 2015 our proportion of agricultural raw materials sourced sustainably reached a new high of 60%. While these measures are necessary, they are not sufficient; we have always said that the biggest impact we can have is in driving consumer behaviour change through our Sustainable Living brands, like Dove, Lifebuoy, Ben & Jerry’s and Comfort. In 2015, we announced findings that these purpose-driven brands were growing at twice the rate of the rest of the business.
Sustainable and equitable growth go hand in hand and in 2015 we were pleased to demonstrate our unwavering commitment to equitable growth by being the first company to produce a human rights report using the UN Guiding Principles Reporting Framework. While the report acknowledges that we still have progress to make, we believe that this kind of openness and transparency is a vital part of driving up standards across the board.
GLOBAL COLLABORATION
KNORR IS FORTIFYING BOUILLON CUBES WITH IRON TO TACKLE ANAEMIA IN NIGERIA, SUPPORTING SDG 3 ‘GOOD HEALTH AND WELL-BEING’.
17SUSTAINABLE DEVELOPMENT GOALSThe United Nations adopted 17 Sustainable Development Goals (SDGs) in 2015, providing a historic opportunity to build a better future for everyone, and aiming to ensure the health, safety and future of our planet.
OUR SUSTAINABLE
LIVING BRANDS ARE WORKING
TOWARDS MAKING THE SDGs A REALITY
7Unilever Annual Report and Accounts 2015 Strategic Report

self-esteem project
Q: Unilever has many stakeholders. How did the Group best serve them?A: We treat our relationship with the many stakeholders we serve – and rely upon – incredibly seriously. We wouldn’t have a healthy and thriving business without them.
Our first priority is to the 2 billion consumers we serve every day with products that make them feel good, look good and get more out of life, and last year we were proud to see Unilever appear as the company with the highest number of brands in the Kantar Top 50 ranking of the World’s Most Chosen Brands.
Our approach to those we work with across the value chain has always been based on collaboration and partnership and we were pleased to take that forward again under our hugely successful Partner to Win programme. We have a broad base of long-term shareholders and they benefited from a Total Shareholder Return of 15.6% in 2015. We also continued to invest heavily in our most important resource – our people – including through measures to further our commitment to gender balance. The number of women among our total population of managers rose to 45% – still short of where we want to be, but among the best record of any company of our size and up significantly over the past five years.
The USLP, as reported elsewhere, and the work of the Unilever Foundation continue to ensure that we not only serve the communities in which we operate but engage fully with them in a spirit of seeking to drive wider societal and environmental benefits.
Q: What do you see as the biggest challenge and the biggest opportunity ahead?A: Next to dealing with the effects of climate change, requiring world leaders to implement the agreements that will enable us to drive sustainable models, the biggest challenge and opportunity we face is the pace of change. Change today is exponential. Driven by advances in technology, whole industry sectors are being disrupted. Companies that have been around for decades can suddenly find themselves obsolete, while – at the other end of the spectrum – relatively young companies are being valued at billions of euros even before they start to generate much in the way of revenue.
For the fast moving consumer goods sector, these changes manifest themselves in a number of ways. They give rise, for example, to much more formidable local competitors. With their agile business models and proximity to consumers, these businesses are gaining share in many markets.
In this environment, the opportunity exists to show that we can continue to develop a portfolio of brands with the right blend of global and local presence, supported by an organisational structure that is resilient enough to withstand shocks and agile enough to respond to rapidly emerging trends.
We are doing just that and made further progress in 2015, including – as I like to put it – by ‘experimenting on the edges’ with different models that sit outside our core business and allow us to trial new approaches. The creation of our new Baking, Cooking and Spreads business is a good example of how we are doing this in a more established part of the business;
while our direct-to-consumer offerings in premium businesses like T2 and Maille, and our Unilever Foundry and the platform it provides to work collaboratively with innovators and entrepreneurs in the technology space, are great examples of how we are tapping into emerging trends.
Q: What is your outlook for 2016?A: We don’t expect to see any significant or immediate improvement in the overall health of the world economy. It is clear that the economic recovery in the developed markets of Europe and North America will remain slow and protracted, while the slowdown in the emerging markets is likely to continue for some time to come.
For all these reasons, we remain prudent in our approach and single-mindedly focused on building the resilience and the agility of our portfolio and our organisation. We made good progress on these fronts in 2015, which gives me further confidence that we can continue to deliver on our objective of consistent top and bottom line growth, to the benefit of our long-term shareholders and the many others who rely on Unilever. I want to thank them and, above all, our wonderful 169,000 employees, whose dedication, commitment and sense of purpose shone through again in 2015.
Paul Polman Chief Executive Officer
BUSINESS IMPACT OF SUSTAINABLE LIVING BRANDS
SUSTAINABLE LIVING BRANDS ACCOUNTED FOR HALF OF UNILEVER’S GROWTH IN 2014.
SUSTAINABLE LIVING BRANDS GREW AT TWICE
THE RATE OF OTHER UNILEVER BRANDS IN 2014
Consumers want responsible business and responsible brands. Our brands whose purpose and products respond to that – Sustainable Living brands – are delivering stronger and faster growth.
The Dove Self-Esteem Project is helping young people around the world build positive body confidence and self-esteem through evidence-based programmes in schools, online resources for parents and partnerships with youth organisations.
8 Unilever Annual Report and Accounts 2015Strategic Report
CHIEF EXECUTIVE OFFICER’S REVIEWCONTINUED

UNILEVER LEADERSHIP EXECUTIVE (ULE)
Paul Polman∆ Chief Executive Officer (Pictured on pages 5 and 7)
1. Doug Baillie∞ Chief Human Resources Officer
2. David Blanchard Chief R&D Officer
3. Marc EngelΩ Chief Supply Chain Officer
4. Kevin Havelock President, Refreshment
5. Alan Jope President, Personal Care
6. Kees Kruythoff President, North America
7. Leena Nair∞ Chief Human Resources Officer
8. Nitin Paranjpe President, Home Care
9. Graeme Pitkethly Chief Financial Officer
10. Ritva Sotamaa Chief Legal Officer
11. Amanda Sourry President, Foods
12. Keith Weed Chief Marketing & Communications Officer
13. Jan Zijderveld President, Europe
∆ Board member.∞ Leena Nair will join ULE on
1 March 2016 following the retirement of Doug Baillie.
Ω Marc Engel joined ULE on 1 January 2016.
Graeme Pitkethly will be proposed for election as an Executive Director at the 2016 AGMs.
For ULE biographies, please see page 59 of the Governance and Financial Report.
9Unilever Annual Report and Accounts 2015 Strategic Report
1 2
3 4
5 6
7 8
9 10
11 12
13

47%increase in people who know that Hellmann’s ketchup comes from natural sources.
The top 25 FMCG companies have combined sales of about €530 billion, competing against each other and an increasingly sophisticated set of local competitors.
CONSUMER CONFIDENCE Demand for FMCG products is affected by consumer confidence which reflects levels of economic growth.
In broad terms, consumer demand remained weak in 2015, with market growth continuing to be subdued in emerging markets while showing some signs of low-level growth in North America and Europe.
Many emerging markets were hit by local currency devaluations versus the US dollar, driving up the cost of consumer goods faster than wage growth. A number of these economies export commodities and have also been hit by slowing global demand.
In response to devaluations, interest rates in many countries remained relatively high, further squeezing incomes. Brazil, in recession, and Russia were particularly hit.
Stalling economic growth in China undermined the performance of many of its South East Asian trading partners, further weakening local currencies. However, the Chinese de-stocking of 2014 in our markets was not repeated and growth was seen in e-commerce and secondary cities.
European markets were characterised by small amounts of volume growth cancelled out by price deflation. North America achieved modest overall growth of 1%-2% in our markets.
DIGITAL AND E-COMMERCEThe impact of digital technology continues and has now become a mainstream factor determining success in everything from manufacturing to marketing. The industry is rapidly adjusting to consumers operating in a mobile, connected world, albeit through fragmented media – from basic mobile phones and PCs to smartphones, tablets and TVs.
Innovation, particularly in marketing, is a primary concern as people’s media consumption habits change. Digital marketing now drives sales through all customer channels.
E-commerce now commands 2% of industry sales, while in China it is already 5%, driven by the growth in companies such as Alibaba’s Taobao and T-Mall. In the US e-commerce is 2% of sales and in the UK it is around 6%.
Changing digital habits reflect the adoption of consumer technology. In 2000 there were 750 million mobile phones compared with 7 billion today. By 2020 there will be over 30 billion connected devices.
The boom in video – over 400 hours’ worth of video content is uploaded to YouTube every minute – is vitally important in FMCG marketing. Content is shared through social media networks and this forces greater transparency from corporations.
UNILEVER OPERATES IN THE HIGHLY COMPETITIVE FAST MOVING CONSUMER GOODS SECTOR – A SECTOR WHICH IS SUBJECT TO AN ARRAY OF GLOBAL PRESSURES AND VOLATILITY.
THE HELLMANN’S GROW WITH US DIGITAL CAMPAIGN
MORE THAN 80 MILLION
INTERACTIONS WITH CONSUMERS
IN ONLY TWO WEEKS IN MORE THAN
3,500 CITIES
Grow With Us – a digital campaign that opened a Hellmann’s ketchup tomato farm to consumers via an interactive live streaming platform so they could follow and participate in the next harvest, proving the brand’s natural qualities.
10 Unilever Annual Report and Accounts 2015Strategic Report
OUR MARKETS

EMERGING SOCIAL TRENDSFMCG companies are among the first to experience and be affected by today’s rapidly changing tastes, social norms, population shifts and wealth distribution.
The world’s economic centre of gravity is moving to the southern and eastern hemispheres. By 2025 almost half of Fortune 500 global companies will be from emerging markets.
These trends drive urbanisation. In 2010 there were 27 cities of more than 10 million people. By 2030 it is expected that there will be 41. In turn, emerging market consumers are increasingly demanding product standards common in the West where premiumisation is a dominant trend.
The West retains strong economic opportunities but wage growth is stubbornly low and unemployment high, reaching 20% among Eurozone youth. Although bilateral trade deals continue, these conflicting pressures are leading to some signs of protectionism.
The world is getting older with dependency rates rising. Between 2015 and 2050, the proportion of the world’s population aged over 60 will nearly double from 12% to 22% and in China alone there will be 330 million people over the age of 65 by 2050 compared with 110 million today.
At the same time, younger generations of millennials (18 to 34 year-olds) have new expectations, from authenticity and quality of products to standards of corporate behaviour. Their work, shopping, leisure and media habits are radically different.
Such change mirrors social upheaval with societies becoming more complex, accommodating rapidly changing ways of living. In London, 300 languages are spoken and, in the UK as a whole, almost a third of households are single occupancy. Forced and voluntary migration is happening on a scale not seen since World War II.
Other new economic forces are emerging. By 2030, 27% of the world’s 8.3 billion population will be Muslim compared with 23% in 2010. Women are an increasing force for change. In Latin America the labour participation rate for working-age females climbed from 53% in 1992 to 65% two decades later.
But pressures remain. Inequality is widening, with the 80 richest people having a combined wealth equal to the poorest 3.5 billion. The environment is under increasing stress, demanding a greater response from people and companies. The World Health Organization estimates that 7 million people die from air pollution each year. Ice caps are melting at 12% a decade, which means global warming and drought with profound implications for the FMCG sector. With the existing climate change scenario, almost half the world’s population will be living in areas of high water-stress by 2030.
COMPETITIONThe FMCG industry is characterised by global competition between large multinational corporations seeking to differentiate themselves in the eyes of consumers while accessing markets through similar channels. Some of the largest FMCG companies competing alongside Unilever include: Nestlé, Procter & Gamble, L’Oréal, Danone, KraftHeinz and Colgate-Palmolive. Many have identified emerging markets as a major growth opportunity in the years to come.
Competition continues unabated. In 2015 one notable trend in certain parts of the FMCG sector, mainly in foods in the slower-growth developed markets, was consolidation often driven by private equity investment activity.
There has also been significant deconstruction and refocusing with competitors selling brand portfolios to achieve efficiency gains.
Local competitors remain a vibrant presence with innovations and consumer offers to rival those of global players. Among customers, the relative decline of supermarkets continues in favour of local and convenience stores, discount chains – often with own label offers – and e-commerce.
For companies operating in the FMCG industry the question of what a household is in today’s society is a critical one. Our products are household goods so changes in what households demand, and why, have an important impact on our business. We are seeing rapid change in the concept of the household, which has become more diverse and unconventional over the past 50 years.
This is reflected in more fluid family roles and responsibilities within households as the working patterns
and identities of principal income earners change. The number of households is also increasing rapidly as more people live on their own or in smaller family units. Single occupant households have risen to 17.5% worldwide and 33% in Western Europe.
The change in the nature of households is linked to the changing role that women are playing in societies around the world. For many large FMCG companies, women constitute the majority of the customer base and their purchasing decisions are therefore critical to the industry’s development. There has been rapid
17.5%Single occupant households have risen to 17.5% worldwide.
HOUSEHOLDS ARE CHANGINGgrowth in educational attainment by women where, in many countries, they make up more than 50% of graduates. This has not yet, however, translated into greater labour market participation, better pay or more executive roles. However, the trends in our markets suggest this is changing and will do so at an increasing pace.
11Unilever Annual Report and Accounts 2015 Strategic Report

REDUCEENVIRONMENTAL
FOOTPRINT
DOUBLE THEBUSINESS
POSITIVESOCIAL IMPACT
TO REALISE OUR VISION WE HAVE INVESTED IN A LONG-TERM STRATEGY OF CATEGORIES AND BRANDS THAT DELIVER GROWTH TO THE BENEFIT OF ALL STAKEHOLDERS.
Long-term value comes from investing in marketing, world-class manufacturing, innovation and a workforce of the best talent available to deliver growth that is consistent, competitive, profitable and responsible.
VISION OUR LONG-TERM FOCUS ALLOWS US TO MAKE STRATEGIC CHOICES TO DRIVE VALUE FOR STAKEHOLDERS
GROWING THE BUSINESS• SALES• MARGIN• CAPITAL EFFICIENCY
REDUCING ENVIRONMENTAL IMPACT• GREENHOUSE GASES• WATER• WASTE• SUSTAINABLE SOURCING
IMPROVING HEALTH AND WELL-BEING• NUTRITION• HEALTH AND HYGIENE
ENHANCING LIVELIHOODS• FAIRNESS IN THE WORKPLACE• OPPORTUNITIES FOR WOMEN• INCLUSIVE BUSINESS
ACTIVE PORTFOLIO MANAGEMENTWe actively manage our brand portfolio to focus it on more attractive segments where we can apply global scale and local strength.
PORTFOLIO CHOICESCATEGORY CHOICESThe four categories of Personal Care, Foods, Home Care and Refreshment have clear strategic priorities to contribute to growth.
DRIVING EFFICIENCY AND MARGINSSince 2013 we have undertaken fewer but larger innovation projects with the average size 25% bigger and more than 70% of projects margin accretive.
BRANDS AND INNOVATIONA FOCUSED APPROACH TO INNOVATIONEach category has a focused research and development capability embedded within its operations, supported by a wider Strategic Science Group.
EMERGING MARKETSWe are expanding from a strong base with proven market development models to drive increased per capita usage so that emerging markets are now 58% of total sales and rising.
MARKET DEVELOPMENTROUTES TO MARKETWe lead market development by reaching up, down and wide, and growing new channels with a focus on execution through our 10 million Perfect Stores programme.
MANUFACTURING BASE AND OVERHEADSWe operate an award-winning, low-cost, flexible supply chain that delivers winning quality and reliability to our markets.
AGILITY AND COSTZERO-BASED BUDGETINGWe are taking the next steps on cost reduction to ensure competitiveness and to fuel growth with the roll-out of zero-based budgeting.
DEVELOPING TALENTIn 2015, we sharpened our learning strategy behind six core capabilities that we believe will build a winning business.
PEOPLEATTRACTING TALENTIn our target universities we are FMCG Graduate Employer of Choice in 34 countries. LinkedIn continues to be a key channel for attracting and engaging external talent.
12 Unilever Annual Report and Accounts 2015Strategic Report
OUR STRATEGIC FOCUS

GROWTHOUR LONG-TERM FOCUS ALLOWS US TO MAKE STRATEGIC CHOICES TO DRIVE VALUE FOR STAKEHOLDERS
CONSISTENTWe deliver consistency in underlying sales growth, core operating margin and free cash flow by continuously investing in our supply chain, our brands and marketing, our people and IT to provide a long-term sustainable business.
COMPETITIVEBy investing in innovation we can grow our market share while also seeking to enter new markets and new segments such as premium brands in categories like Personal Care and Refreshment.
PROFITABLEWe seek continuous improvement in our world-class manufacturing to drive cost savings and higher returns, providing extra fuel for growth as cash is redeployed in new strategic opportunities.
RESPONSIBLEGrowth that’s responsible involves having a positive social impact and reduced environmental footprint, which is the essence of the USLP and is essential in protecting and enhancing our reputation. Our Sustainable Living brands are working towards making the new UN Sustainable Development Goals a reality.
BUILDING A PRESTIGE BUSINESSThrough acquisition we have invested in the growth opportunity of Prestige skin care brands Dermalogica, Kate Somerville, REN and Murad.
INCREASED INVESTMENT IN DIGITAL MARKETINGIn a mobile-connected world our brands are supported by sophisticated digital marketing that integrates seamlessly with e-commerce and drives sales through all channels.
E-COMMERCEE-commerce grew by more than 40% in 2015 thanks to a focus on brilliant execution online where 80% of sales are made from the first page view.
LEVERAGING SCALEWe bring the benefits of scale to our operations, driving down costs while making the company more agile and simple.
VALUES-LED AND EMPOWEREDOur people are our greatest asset. We focus on their well-being, empowerment and connection with our Purpose.
13Unilever Annual Report and Accounts 2015 Strategic Report

CONSUMER INSIGHT
SALES MARKETING
COLLABORATION
UNILEVER BELIEVES PROFITABLE GROWTH SHOULD ALSO BE RESPONSIBLE GROWTH. That approach lies at the heart of our business model, driven by sustainable living and the Unilever Sustainable Living Plan (USLP). It guides our approach to how we do business and how we meet the growing consumer demand for brands that act responsibly in a world of finite resources. Our business model begins with consumer insight that informs brand innovation, often with partners in our supply chain, to create products we take to market supported by marketing and advertising across a range of distribution channels.
HOW WE DRIVE SUSTAINABLE VALUEUnilever aims for a virtuous circle of growth with the USLP at its heart. It creates profitable volume growth driven by investment in innovation and brands to deliver products to 2 billion people every day. Our scale means we can spread fixed costs and improve profitability.
Societies are dynamic. There will be 2.36 billion millennials (18 to 34 year-olds) by 2025 with diverse and very different preferences and shopping habits to other age groups. We not only need insight into these trends, through focus groups and quantitative studies, but also the ability to predict them using the latest digital research technologies in order to maintain our competitive advantage.
We work closely with retailers to win in the market place, making sure our brands are always available and properly displayed, in all channels from supermarkets to e-commerce. We have achieved supplier of choice status for 12% of markets and are in the top three suppliers for 24% of markets.
€1-2The additional spend on Unilever products in an e-commerce shop versus the equivalent basket in a physical store.
We work with governments, NGOs and other stakeholders to drive change that’s good for society and good for business, and we work with partners in our supply chain, through our Partner to Win programme, to create innovations in products and packaging. 69% of our innovations are associated with supplier-sourced technology, such as from Sonoco which provides reusable packaging for our Country Crock brand in the US.
We generate consumer-led growth through a marketing spend of about €8 billion a year. We use multiple platforms to achieve cut-through in a highly fragmented media. Effective digital marketing is essential and influences shopping at all stages of the decision-making process and through all channels. We partner with many digital start-ups through our Unilever Foundry programme to bring the most cutting edge marketing to Unilever brands.
WE PARTNER WITH CUSTOMERS TO PIONEER NEW PRODUCTS AND
CONCEPTS
2.36 billionmillennials by 2025.
14 Unilever Annual Report and Accounts 2015Strategic Report
A BUSINESS MODEL THAT CREATES VALUE
LOGISTICS
INNOVATION SOURCING
MANUFACTURING
Our R&D mission is to build brands through benefit-led innovation unlocked by science and technology. We spend about €1 billion a year on research and development, employ more than 6,000 R&D experts and have six key R&D sites. Category-specific R&D is complemented by a Strategic Science Group working on long-term science breakthroughs. Both are supported by capabilities such as regulatory, safety and environmental assurance.
This allows us to invest further, growing free cash flow and investing back into the business through innovation and marketing, to create even stronger brands. This drives profitable volume growth and the virtuous circle continues.
€1 billionspent on R&D per year.
WE EMPLOY MORE THAN 6,000 R&D
PROFESSIONALS AROUND THE
WORLD
Delivering products to our customers is the role of logistics. We are centralising our operations with a network of global UltraLogistik control towers to improve customer service, cut costs and reduce CO2 emissions which have fallen by around 21% across 14 countries since 2010. We increasingly use hybrid vehicles and rail rather than road.
We have a €35 billion annual procurement programme including agricultural raw materials, 60% of which are sustainably sourced. We are rolling out a Responsible Sourcing Policy and 170 Partner to Win suppliers met the self-assessed criteria in 2015. We reached the landmark of 100% certified and traceable palm oil sourced for our European and Australian food businesses in 2015.
60%of agricultural raw materials sustainably sourced.
Unilever has the world’s No.1 FMCG supply chain according to Gartner. We operate almost 300 factories and have invested heavily in efficiency and eco-production. Sales per factory have increased by 30% since 2009 while costs avoided through eco-production have exceeded €600 million since 2008. In 2015, the total non-hazardous waste sent to landfill was 196 tonnes, which is 0.14% of the 2008 baseline of 141,767 tonnes.
No.1FMCG supply chain according to Gartner.
15Unilever Annual Report and Accounts 2015 Strategic Report

THE BENEFITS THAT OUR VISION AND STRATEGY DELIVER TRANSLATE INTO PERFORMANCE FOR SHAREHOLDERS AND SOCIETY AT LARGE.
* Key Financial Indicators. These measures are non-GAAP measures. For further information about these measures, and the reasons why we believe they are important for an understanding of the performance of the business, please refer to our commentary on non-GAAP measures on pages 38 and 39.
FINANCIAL PERFORMANCE
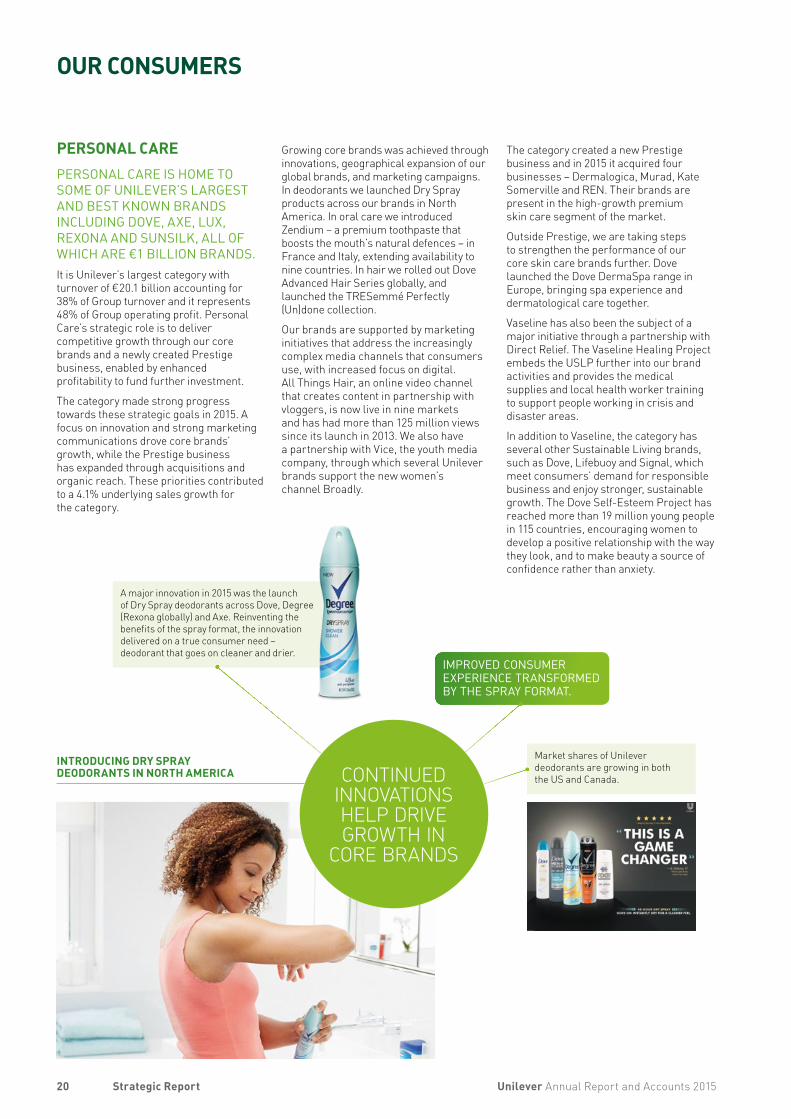
GROWING THE BUSINESS: GROUP
UNDERLYING SALES GROWTH*
2015
4.1%2014: 2.9%Underlying sales growth averaged 4.9% over five years.
UNDERLYING VOLUME GROWTH*
2015
2.1%2014: 1.0%Underlying volume growth averaged 2.1% over five years.
CORE OPERATING MARGIN*
2015
14.8%2014: 14.5%Core operating margin has steadily increased over five years from 13.5% to 14.8%.
FREE CASH FLOW*
2015
€4.8 billion2014: €3.1 billionUnilever has generated free cash flow of €19.2 billion over five years.
GROWING THE BUSINESS: CATEGORIES
PERSONAL CARETurnover
€20.1 billion2014: €17.7 billion
Underlying sales growth
4.1%2014: 3.5%
Core operating margin
18.9%2014: 18.7%
FOODSTurnover
€12.9 billion2014: €12.4 billion
Underlying sales growth
1.5%2014: (0.6)%
Core operating margin
18.2%2014: 18.6%
REFRESHMENTTurnover
€10.1 billion2014: €9.2 billion
Underlying sales growth
5.4%2014: 3.8%
Core operating margin
9.4%2014: 8.8%
HOME CARETurnover
€10.2 billion2014: €9.2 billion
Underlying sales growth
5.9%2014: 5.8%
Core operating margin
7.6%2014: 6.3%
16 Unilever Annual Report and Accounts 2015Strategic Report
OUR PERFORMANCE

UNILEVER SUSTAINABLE LIVING PLAN
By 2020 we will help more than a billion people take action to improve their health and well-being.
By 2020 we will enhance the livelihoods of millions of people as we grow our business.
By 2020 our goal is to halve the environmental footprint of the making and use of our products as we grow our business.
IMPROVING HEALTH AND WELL-BEING ENHANCING LIVELIHOODS
NUTRITIONTARGETBy 2020 we will double the proportion of our portfolio that meets the highest nutritional standards, based on globally recognised dietary guidelines. This will help hundreds of millions of people to achieve a healthier diet.
PERFORMANCE34% of our portfolio by volume met highest nutritional standards in 2015.◊
HEALTH AND HYGIENETARGETBy 2020 we will help more than a billion people to improve their health and hygiene. This will help reduce the incidence of life- threatening diseases like diarrhoea.
PERFORMANCEAround 482 million people reached by end 2015 through our programmes on handwashing, safe drinking water, oral health and self-esteem.
OPPORTUNITIES FOR WOMENTARGETBy 2020 we will empower 5 million women.
PERFORMANCEWe trained 70,000 women micro-entrepreneurs to sell our products in rural India by end 2015.Ж
The percentage of persons of each sex who were Unilever managers was 55% male and 45% female (2014: 57% male and 43% female).**
INCLUSIVE BUSINESSTARGETBy 2020 we will have a positive impact on the lives of 5.5 million people.
PERFORMANCESince 2006, in partnership with others, we enabled around 600,000Ψ smallholder farmers and 1.8 million small-scale retailers to access initiatives which aimed to improve their agricultural practices or increase their sales.Ж
FAIRNESS IN THE WORKPLACETARGETBy 2020 we will advance human rights across our operations and extended supply chain.
PERFORMANCE54% of procurement spend through suppliers meeting mandatory requirements of our Responsible Sourcing Policy.
We published our first Human Rights Report in 2015.
Our Total Recordable Frequency Rate for 2015 was 1.12 per million hours worked (2014: 1.05).**◊Φ
Engagement score among 5,000 employees surveyed in 2015 was 77% (2014: 75%).**‡
REDUCING ENVIRONMENTAL IMPACT
GREENHOUSE GASESTARGETHalve the greenhouse gas impact of our products across the lifecycle by 2020.
PERFORMANCEOUR OPERATIONSWe produced 88.49kg C02 from energy per tonne of manufacturing production (2014: 92.14kg).**◊Φθ
OUR PRODUCTS’ LIFECYCLEOur greenhouse gas impact per consumer use has increased by around 6% since 2010.◊¥
WATERTARGETHalve the water associated with the consumer use of our products by 2020.
PERFORMANCEOUR OPERATIONSWe used 1.88m3 water per tonne of manufacturing production (2014: 2.01m3).**◊Φ
OUR PRODUCTS IN USEOur water impact per consumer use has reduced by around 1% since 2010.״
WASTETARGETHalve the waste associated with the disposal of our products by 2020.
PERFORMANCEOUR OPERATIONSWe sent for disposal 0.26kg of total waste per tonne of manufacturing production (2014: 1.19kg).**◊Φ
OUR PRODUCTS AT DISPOSAL Our waste impact per consumer use has reduced by around 29% since 2010.״
SUSTAINABLE SOURCINGTARGETBy 2020 we will source 100% of our agricultural raw materials sustainably.
PERFORMANCE60% of our agricultural raw materials sustainably sourced by end 2015.
** Key Non-Financial Indicators. ◊ PricewaterhouseCoopers (PwC) assured. For details and the basis of preparation see www.unilever.com/ara2015/downloads. Φ Measured 1 October – 30 September.‡ Full Global People Survey not undertaken in 2015. Comparator is for full survey among managers in 2014.ж We are continuing to work on sharpening our metrics to understand our progress better and shape our business decisions.Ψ We have tightened the criteria for smallholder farmer initiatives, resulting in a reduction in the number reported in 2015 compared to 2014. θ Prior year restated to exclude third party site.¥ 2010 baseline as restated in December 2015.Our USLP commitments and targets are subject to internal verification. For details of the definitions and reporting periods used in the preparation of these commitments and targets see our Sustainable Living Report 2015 to be published in April 2016 at www.unilever.com/sustainable-living.
17Unilever Annual Report and Accounts 2015 Strategic Report

THE COMMITMENT OF THE BREYERS BRAND TO SUSTAINABILITY IS AN EXTENSION OF ITS DEDICATION TO QUALITY AND IS ACHIEVING RENEWED POPULARITY WITH CONSUMERS.
COMMITTED TO USING ONLY DAIRY FROM COWS NOT TREATED WITH ARTIFICIAL GROWTH HORMONES.¤
BREYERS’ VANILLA IS SUSTAINABLY SOURCED IN MADAGASCAR, HELPING SMALLHOLDERS AND THE ENVIRONMENT.
98.5%The amount of sustainable natural vanilla extract sourced from Madagascar is 98.5%.
BREYERS USING SUSTAINABLE VANILLA FROM MADAGASCAR
EXTERNAL RECOGNITIONBreyers was recognised at the annual Rainforest Alliance Gala in New York in May 2015, when it won the Sustainable Standard-Setter Award, which recognises businesses and individuals that work diligently to meet rigorous sustainability standards, protect the environment and support local communities worldwide.
¤ Suppliers of other ingredients such as cookies, candies and sauces may not be able to make this claim. The Food and Drug Administration states that no significant difference has been shown between dairy derived from rBST-treated and non-rBST-treated cows.
18 Unilever Annual Report and Accounts 2015Strategic Report

DELIVERING VALUE FOR OUR STAKEHOLDERSTHE FOLLOWING PAGES HIGHLIGHT HOW UNILEVER HAS PERFORMED FOR THE BENEFIT OF OUR CONSUMERS, WIDER SOCIETY, OUR PEOPLE AND OUR SHAREHOLDERS IN 2015.
OUR CONSUMERSThe economic uncertainties consumers have faced showed few signs of abating in 2015. But despite the tough backdrop consumers revealed more clearly than ever their growing preference for brands they can trust. Although consumption continues to be linked to some of the world’s gravest problems – deforestation, climate change, water scarcity, malnutrition or unhealthy diets – consumer tastes and preferences are clearly moving towards products that are authentic, sourced sustainably and manufactured in a responsible way.
All our categories are focused on addressing these challenges and opportunities with innovations that provide consumers with the products they want, with the benefits they need and the trust they demand.
pages 20 to 23
SOCIETY2015 witnessed major steps forward both in Unilever’s core Purpose of making sustainable living commonplace and in the transformational change at a societal level needed to tackle the world’s major social, environmental and economic problems. The Unilever Sustainable Living Plan (USLP) continued to have significant impact across all three of its core goals of improving health and well-being, reducing environmental impact and enhancing livelihoods.
All these specific activities came against the background of two significant developments on a global scale – the launch of the 17 United Nations Sustainable Development Goals and the UN Paris COP21 conference on climate change, the largest ever held.
Working in partnership with the UN, governments, NGOs, our suppliers and others, we are helping to lead the changes that society needs and that our company will benefit from in the long term.
pages 24 to 27
OUR PEOPLEOur clear Purpose is something that Unilever people can engage with and help make a reality every day. Bringing that Purpose to life and making our vision a reality requires us to recruit and retain people of the highest quality. We want to help all our people be the best they can, to realise their potential and the potential of the business. Training and development are crucial for all and we strive to create a working environment that respects the human rights and interests of all our employees and embeds gender equality as a fundamental part of our approach.
pages 28 to 31
OUR SHAREHOLDERSWe aim to deliver the best possible operational performance from the business to deliver maximum returns to our shareholders over the long term. The financial performance that results is based on growth that is consistent, competitive, responsible and profitable.
How we manage our portfolio of assets and our finances is an important contributor to shareholder returns and reflects how the business is adapting to meet changing consumer preferences and volatility more broadly in our markets.
pages 32 to 34
IMPROVED SALESBreyers has reversed five years of declining sales by completing the launch of Gelato Indulgences and a new Quality Pledge across the brand, which includes a platform of sustainable sourcing.
EDUCATION PROGRAMMESThrough our USLP we are committed to enhancing livelihoods. With our Partner to Win, Symrise, we are helping 3,300 vanilla farmers and their communities in Madagascar with secondary education and agricultural training that will secure sustainable vanilla supplies for Breyers and many other Unilever brands.
19Unilever Annual Report and Accounts 2015 Strategic Report
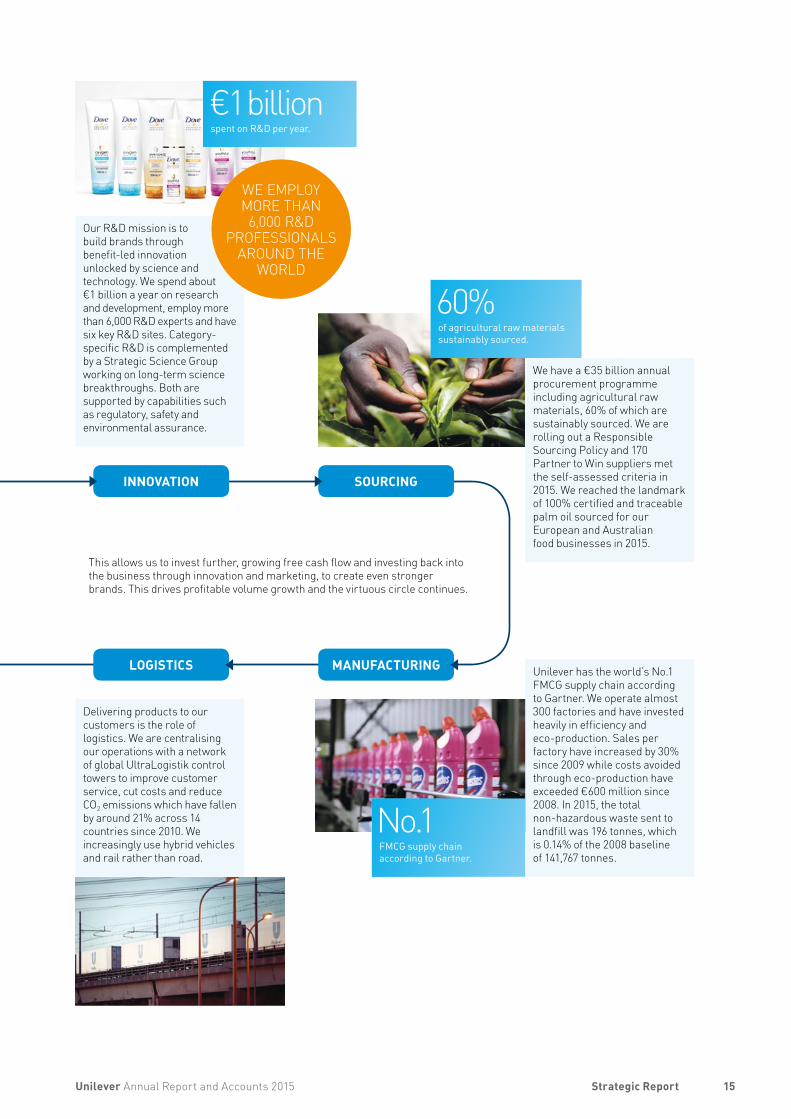
Market shares of Unilever deodorants are growing in both the US and Canada.
PERSONAL CAREPERSONAL CARE IS HOME TO SOME OF UNILEVER’S LARGEST AND BEST KNOWN BRANDS INCLUDING DOVE, AXE, LUX, REXONA AND SUNSILK, ALL OF WHICH ARE €1 BILLION BRANDS.It is Unilever’s largest category with turnover of €20.1 billion accounting for 38% of Group turnover and it represents 48% of Group operating profit. Personal Care’s strategic role is to deliver competitive growth through our core brands and a newly created Prestige business, enabled by enhanced profitability to fund further investment.
The category made strong progress towards these strategic goals in 2015. A focus on innovation and strong marketing communications drove core brands’ growth, while the Prestige business has expanded through acquisitions and organic reach. These priorities contributed to a 4.1% underlying sales growth for the category.
Growing core brands was achieved through innovations, geographical expansion of our global brands, and marketing campaigns. In deodorants we launched Dry Spray products across our brands in North America. In oral care we introduced Zendium – a premium toothpaste that boosts the mouth’s natural defences – in France and Italy, extending availability to nine countries. In hair we rolled out Dove Advanced Hair Series globally, and launched the TRESemmé Perfectly (Un)done collection.
Our brands are supported by marketing initiatives that address the increasingly complex media channels that consumers use, with increased focus on digital. All Things Hair, an online video channel that creates content in partnership with vloggers, is now live in nine markets and has had more than 125 million views since its launch in 2013. We also have a partnership with Vice, the youth media company, through which several Unilever brands support the new women’s channel Broadly.
The category created a new Prestige business and in 2015 it acquired four businesses – Dermalogica, Murad, Kate Somerville and REN. Their brands are present in the high-growth premium skin care segment of the market.
Outside Prestige, we are taking steps to strengthen the performance of our core skin care brands further. Dove launched the Dove DermaSpa range in Europe, bringing spa experience and dermatological care together.
Vaseline has also been the subject of a major initiative through a partnership with Direct Relief. The Vaseline Healing Project embeds the USLP further into our brand activities and provides the medical supplies and local health worker training to support people working in crisis and disaster areas.
In addition to Vaseline, the category has several other Sustainable Living brands, such as Dove, Lifebuoy and Signal, which meet consumers’ demand for responsible business and enjoy stronger, sustainable growth. The Dove Self-Esteem Project has reached more than 19 million young people in 115 countries, encouraging women to develop a positive relationship with the way they look, and to make beauty a source of confidence rather than anxiety.
CONTINUED INNOVATIONS HELP DRIVE GROWTH IN
CORE BRANDS
INTRODUCING DRY SPRAY DEODORANTS IN NORTH AMERICA
IMPROVED CONSUMER EXPERIENCE TRANSFORMED BY THE SPRAY FORMAT.
A major innovation in 2015 was the launch of Dry Spray deodorants across Dove, Degree (Rexona globally) and Axe. Reinventing the benefits of the spray format, the innovation delivered on a true consumer need – deodorant that goes on cleaner and drier.
20 Unilever Annual Report and Accounts 2015Strategic Report
OUR CONSUMERS

In July 2015 Knorr launched 100% natural Mealmakers in the biggest European market, Germany. This innovation was in response to changing consumer preferences and growing demand for more authentic, fresh, natural and sustainably sourced foods. Now consumers concerned with natural ingredients can cook their favourite dishes such as spaghetti bolognese more easily and faster, using Knorr Mealmakers.
FOODSFOODS IS A €12.9 BILLION CATEGORY ACCOUNTING FOR 24% OF UNILEVER’S TURNOVER AND 31% OF OPERATING PROFIT. Our portfolio consists of Knorr, Hellmann’s and Rama, our €1 billion brands, and other well-known global brands such as Becel and Maille.
The category’s strategic role is to accelerate growth while maintaining strong profitability and cash flow. In 2015, focus has been on three priorities: to accelerate growth in emerging markets; to reignite growth in Europe and North America; and to adapt the portfolio to address emerging consumer trends.
The strategy successfully delivered a return to positive underlying sales growth of 1.5% in 2015, with strong performances in savoury and dressings offsetting a further decline in spreads. We also saw continued strong growth by the global Food Solutions business, which services professional hotel, restaurant and catering customers.
Despite some market volatility, emerging markets delivered solid growth of 6.5%, driven by Latin America, India and South East Asia. Emerging markets now account for more than 40% of our sales, up from 33% in 2012, fuelled by double-digit growth in 2015 in some of our local brands, such as Maizena in Brazil, Fruco in Colombia, Kissan in India, Bango in Indonesia and Lady’s Choice in the Philippines.
Although markets in Europe and North America remain challenging overall, savoury, Foods’ largest sub-category, performed strongly, returning to growth in Europe and continuing to grow sales and market share in North America.
Dressings has also experienced broad-based growth in Europe and gained market share in the competitive US market. We benefited from the launch of new products including Hellmann’s with olive oil and Knorr 100% natural Mealmakers, responding to changing consumer preferences and growing demand for more authentic, fresh, natural and sustainably sourced foods.
The spreads business experienced another difficult year. In mélange (mix of margarine and butter), we saw strong growth ahead of the market once more. However, the
market for margarine continued to suffer, influenced by an ongoing decline in the use of spreads, compounded by a reduction in butter prices. In order to respond to this fast-changing market landscape, we have created the Baking, Cooking and Spreads business aimed at accelerating the turnaround of the business in Europe and North America.
Feeding the world sustainably is a major challenge. That is why sustainability remains at the heart of our Foods business. Our main Sustainable Living brands – Knorr, Hellmann’s and Becel/Flora – combine a clear sustainable living purpose with a long-term global growth opportunity through improving nutrition, food safety and an ever more efficient use of resources.
In 2015, Hellmann’s successfully introduced an improved squeeze bottle with new ‘Easy Out’ technology, which significantly reduces food waste, while Knorr launched the Knorr Animal Welfare programme designed to improve standards in sourcing meat ingredients. More than 90% of the vegetables most frequently used in Knorr products are sustainably sourced, already putting us on target to reach 100% by 2020.
KNORR 100% NATURAL
MEALMAKERS HAS A CLEAN LABEL WITH NATURAL INGREDIENTS
KNORR 100% NATURAL MEALMAKERS
THE LAUNCH IN GERMANY WAS FOLLOWED BY ROLL-OUTS ACROSS OTHER COUNTRIES IN EUROPE.
1 millionKnorr Mealmakers grew well ahead of the market in Germany in 2015 and attracted 1 million new households to the brand.
21Unilever Annual Report and Accounts 2015 Strategic Report

40 billionworking hours are lost each year to water collection in Sub-Saharan Africa.
HOME CARE BRANDS ARE GROWING AHEAD OF TARGET AND AHEAD OF MARKETS.
HOME CAREHOME CARE IS HOME TO POPULAR BRANDS, SUCH AS OMO AND SURF, OUR €1 BILLION BRANDS, AS WELL AS SUNLIGHT, DOMESTOS, COMFORT AND OUR WATER PURIFICATION BRAND PUREIT.Home Care had a turnover of €10.2 billion in 2015, accounting for 19% of Unilever’s turnover and 10% of operating profit. The category generates more than 80% of its sales in emerging markets and its strategic role is to grow competitively and step up profitability, while scaling up household care.
In 2015, consistent with its strategic role, the category delivered underlying sales growth of 5.9% and expanded its margins by 1.3 percentage points.
This performance was achieved as a result of sharp focus on three areas.
Firstly, developing innovations to reinforce the core attributes that address consumer needs at a time of rapidly growing urbanisation and rising employment of women. Omo had a global re-launch with an upgraded formulation delivering on the brand promise of faster stain removal. Sunlight’s proposition of five times faster degreasing was the catalyst for another year of consistent and profitable growth.
Secondly, anticipating future trends and innovating accordingly. We saw good success in the Omo range of pre and post-wash fabric cleaning additives and ancillaries launched in Brazil towards the end of 2014. We also launched Comfort Intense in 2015, a super-concentrated fabric conditioner where smaller doses result in improved freshness. The consumer reception has exceeded expectations.
Thirdly, an end-to-end management of profitability. This included a sharp focus on driving internal efficiencies, dramatic simplification and trading up consumers through premium offerings delivering better consumer value.
The success of our brands is boosted by their role in delivering the USLP. Through a partnership with UNICEF, for instance, Omo will help to provide 10 million disadvantaged children with access to quality education. In Brazil, the category led a successful education programme to save water in laundry use during one of the country’s worst water shortages, saving a potential 229 billion litres a year (see page 26).
Our Domestos brand continued its efforts to address the sanitation challenge. It committed to finding ways to provide 25 million people with improved access to toilets.
Although the category enjoyed considerable success in 2015, we remain alert to the future challenges on account of rapidly changing consumer habits and behaviours. Continuing to deliver consumer-relevant innovation and maintaining the sharp focus on our cost and simplification agenda will be key to the category delivering on its strategic role in 2016 and beyond.
OUR SUNLIGHT WATER CENTRES ARE IMPROVING
ACCESS TO CLEAN WATER
SUNLIGHT – HELPING WOMEN TO COLLECT CLEAN WATER
Sunlight partnered with NextDrop to launch a branded text service in Mysore, India, alerting women to when water will be available, saving time for earning a living or education (see page 26).
22 Unilever Annual Report and Accounts 2015Strategic Report
OUR CONSUMERSCONTINUED

REFRESHMENTREFRESHMENT IS OUR BEVERAGE AND ICE CREAM CATEGORY WHICH HAD A TURNOVER OF €10.1 BILLION IN 2015. Our largest brands are Magnum and Heartbrand (Wall’s) and Lipton tea, all of which are €1 billion brands.
The category accounts for 19% of Group turnover and 11% of operating profit and its strategic role is to enhance the Group’s profitable growth momentum through sustained growth in ice cream and growing faster in tea, while stepping up cash flows and return on invested capital.
During 2015 the category was focused on growing its core with margin-enhancing innovations and best-in-class retail execution, both through customers’ stores and through Unilever’s own retail channels, to deliver the ultimate brand experience.
This focus meant Refreshment grew underlying sales by 5.4% with a positive performance across key geographies.
Ice cream delivered very strong growth, increasing its presence in a growing and dynamic sector and helped by successful innovations behind premium brands in Europe and North America. Performance was also helped by good summer weather in Europe.
Innovations included Magnum Pink & Black and the Ben & Jerry’s Cookie Core range. In September 2015 we acquired Grom, a gelato business with 60 stores in Italy and around the world, strengthening our portfolio.
Our success came within the context of considerable consolidation among rivals and the growth of local competition. But our strong portfolio of brands and execution in markets helped us to secure our position and grow competitively.
The year also saw campaigns around sugar-related health issues and we are responding responsibly; 100% of our children’s brands have fewer than 110 calories while, by the end of 2015, 90% of our packaged ice cream products did not exceed 250 calories per portion. We are also reducing sugar in our ready-to-drink tea, consistent with our USLP commitment to help people to achieve a healthier diet.
The category strengthened its place in the premium end of the ice cream business through brands such as Talenti that offer ‘pure, real and authentic’ products, with sustainably sourced ingredients. Early results for Talenti have been promising. Meanwhile, established brands such as Ben & Jerry’s continued to deliver strong business performance while leading the charge on sustainable growth. The brand launched Save Our Swirled – a global campaign attracting 300,000 followers – to help win a strong climate change
agreement at the Paris COP21 conference at the end of 2015 (see page 24).
Beverages had a more challenging year, witnessing modest growth in highly competitive markets with South Asia as a bright spot, in particular India and Pakistan.
The second half of 2015 saw a number of premium innovations coming to market. These included the expansion of our T2 stores, the launch of tea capsules in Europe and the launch in France of T.O. by Lipton, our bespoke in-home tea machine. Another highlight was the launch of the Lipton Speciality Black range and Lipton Green Tea.
Lipton continues its journey as a Sustainable Living brand and after eight years it has reached the milestone of all the tea for its teabags being sourced from Rainforest Alliance certified estates at the end of 2015.
Our retail operations across both ice cream and tea were strengthened by the formation of a global Unilever retail organisation to improve our 1,100 stores from T2 to Ben & Jerry’s Scoop shops. Through our retail customers we also continued with our famous Aisles and Corners of Joy in-store executions.
I AM WALL’S
The I Am Wall’s programme invests in building skills such as sales, customer service and problem solving. Priorities include recruiting unskilled people who may be traditionally excluded from the workplace and providing young people with work experience as they step into the job market.
In 2015, Wall’s created employment in South and South East Asia, which are our biggest markets for mobile vendors. We also have I Am Wall’s micro-entrepreneurs in Europe. THE
I AM WALL’S PROGRAMME
CREATES JOBS SELLING OUR ICE CREAM AND PROVIDES TRAINING
FOR MICRO-ENTREPRENEURS
30%In 2015, the I Am Wall’s programme in India grew 30%, generating turnover of €18 million and contributing 20% to the Indian ice cream business. At any time during the year there were more than 4,000 self-employed vendors making their living through selling Wall’s ice cream across major Indian cities.
23Unilever Annual Report and Accounts 2015 Strategic Report

100% Close to 100% of palm oil sourced for Sei Mangkei is fully traceable.
ALL PALM OIL IN OUR EUROPEAN AND AUSTRALIAN FOOD BUSINESSES IS TRACEABLE TO
CERTIFIED PLANTATIONS
SOURCING PALM OIL SUSTAINABLY
WE NEED TRANSFORMATIONAL CHANGE FOR THE GOOD OF SOCIETY AND BUSINESS.2015 proved to be a pivotal year, with groundbreaking global agreements reached on both climate change and development. To realise the ambition ‘zero carbon, zero poverty’ will require the private sector, government and civil society to go beyond ‘business as usual’, working in partnership to achieve change at scale.
In September 2015, the United Nations adopted 17 Sustainable Development Goals (SDGs) – a roadmap to 2030 that will require concerted action and partnership between governments, civil society and business.
Unilever has been an early leader on the SDGs through both the UN High-level Panel and our engagement with the UN Global Compact LEAD group of sustainability leaders. We also partnered with Global Citizen and Project Everyone, campaigning organisations focused on motivating young people about sustainability, to raise public awareness about the SDGs. As the world looks towards the implementation of the SDGs, we are supporting the recently established Global Commission on Business and Sustainable Development which seeks to work with business leaders across sectors to broaden support for market-based solutions.
World leaders met in Paris in December 2015 for the UN Framework Convention on Climate Change’s 21st Conference of the Parties (COP21). The result was a historic agreement supported by an unprecedented movement of private sector action. The new legal agreement to tackle climate change is supported by plans from every country to reduce emissions and a range of commitments from companies, investors, cities and regions.
Unilever worked with the World Business Council for Sustainable Development (WBCSD), World Economic Forum (WEF), UN Global Compact and We Mean Business Coalition to encourage companies to step up their efforts to address climate change in their own operations. Speaking in Paris at an event hosted by the UN Secretary General and President Hollande of France, our CEO Paul Polman urged business leaders to continue to deliver positive momentum. Unilever led by example and announced ambitious targets to be carbon positive in its own operations by 2030.
The consequences of this agreement go far beyond the actions of governments alone. The impact will be felt in banks, stock exchanges, boardrooms and research centres as the world absorbs the fact that a unique project to decarbonise the global economy has begun.
Previously, in 2014 we identified four areas for action where we want to see sector-wide transformation: eliminating deforestation; sustainable agriculture and improving livelihoods; access to clean drinking water, sanitation and hygiene; and women’s empowerment. Essential to delivering change in these areas are the Unilever Sustainable Living Plan (USLP), which sits at the heart of our business model, our Sustainable Living brands that bring the USLP to life, and global coalitions and partnerships that take it to scale.
ELIMINATING DEFORESTATIONAs part of our commitment on climate change, Unilever is working to help end deforestation, which accounts for up to 15% of global greenhouse gas emissions. We have made good progress on our sustainable sourcing and deforestation agendas by working in collaboration with an increasing number of growers, traders, manufacturers and retailers who have all pledged to rid their supply chains of deforestation.
THE NEW PLANT GENERATES 400 JOBS DIRECTLY AND MANY MORE INDIRECTLY.
The Sei Mangkei palm oil processing plant in Indonesia, opened in 2015, is creating a more traceable and certified supply chain for our palm oil derivatives and reducing process steps.
24 Unilever Annual Report and Accounts 2015Strategic Report
SOCIETY

In 2015 Unilever reached the landmark of having all tea in its Lipton teabags sourced from Rainforest Alliance certified estates after an eight-year investment programme.
THE SECURITY OF OUR SUPPLY HAS INCREASED WHILE LIVELIHOODS HAVE BEEN ENHANCED.
In March 2015, we announced that all palm oil bought for our European and Australian food businesses is traceable to certified plantations, a crucial milestone towards our aim of eliminating deforestation.
Going beyond that, our new palm oil processing plant in Sei Mangkei, Indonesia, underwent testing in 2015 and started operations in January 2016. It represents a US$130 million investment and will source palm oil from known and certified sources for our global use.
In addition, we are working with the Climate Policy Institute and IDH in Indonesia to create a long-term landscape management plan to help smallholders sustainably improve their yields and livelihoods.
At the same time, almost all our paper and board across our supply chain came from certified sustainably managed forests or from recycled material by the end of 2015.
CHAMPIONING SUSTAINABLE AGRICULTURE AND IMPROVING LIVELIHOODS Our ambition is for sustainable approaches to agriculture to become mainstream and to improve the livelihoods of smallholder farmers. This supports SDG 2 ‘End Hunger’.
Smallholder farmers and family farms produce 70% of the world’s food. Working with these producers is critical for Unilever
as we strive to reach our sustainable sourcing targets and improve the livelihoods of those in our supply chain and surrounding communities. Working in global partnerships, we have identified a number of crops and countries that require targeted, integrated action to improve sustainable agricultural practices, link smallholders to our markets, address food nutrition gaps, improve business skills and provide finance.
In support of this approach, we formed a number of new partnerships. In 2015, Unilever, Acumen and the Clinton Giustra Enterprise Partnership (CGEP) launched the Enhanced Livelihoods Investment Initiative to improve the livelihoods of as many as 300,000 smallholder communities across Africa, South Asia, Latin America and the Caribbean. It is a three-year US$10 million investment plan to spur economic growth by backing private enterprises which link smallholders to Unilever’s global supply chain and distribution networks.
In 2015, Unilever and the Global Alliance for Improved Nutrition (GAIN) created a Nutrition Intervention Program which aims to improve the health and nutrition of 2.5 million rural people. Its aim is to reach smallholder farmers, from helping them to diversify their diets to providing better information on nutrition.
Addressing hunger is also about reducing food waste. A third of food calories produced are never eaten. To combat this, Unilever helped shape the Consumer Goods Forum pledge, working alongside the World Resources Institute, to halve food waste by 2025 within member company operations, and reduce food waste among consumers and through the supply chain. To help achieve this, we have a new partnership with the Global Foodbank Network allowing us to redirect food that is still fit to be consumed. Also, Unilever is supporting the ‘Champions 12.3’ coalition that seeks to tackle food loss and waste. Our CEO, Paul Polman, is a champion along with other business leaders and representatives from civil society and government.
BETTER HEALTH AND HYGIENE THROUGH HANDWASHING, CLEAN WATER AND SANITATIONWe aim to help improve the health and well-being of more than 1 billion people by 2020. As part of this ambition, we are focusing on improving access to safe drinking water, sanitation and hygiene facilities (WASH) which underpin healthy and productive lives.
AS THE WORLD’S
LARGEST TEA COMPANY WE ARE SETTING STANDARDS
LIPTON TEA – 100% RAINFOREST ALLIANCE CERTIFIED
25Unilever Annual Report and Accounts 2015 Strategic Report

26
229 billion litresThe campaign helped Brazil save a potential 229 billion litres of water.
With our global reach, portfolio of WASH-related brands and experience in changing behaviour, we are helping to deliver progress on SDG 6 ‘Ensure sustainable access to water and sanitation for all’ and develop the market solutions which will transform WASH provision. For instance, in 2015 Lifebuoy secured funding from the Children’s Investment Fund Foundation (CIFF) to roll out our Lifebuoy School of Five hygiene education programme in rural Bihar, plus funding from the UK Department for International Development (DFID) to reach children in Bangladesh and Pakistan. These partnerships have committed to reaching almost 10 million children by 2020 with life-saving education about handwashing with soap.
To extend our reach and impact, we have joined with CGEP and DFID to launch a new partnership named Transform. The initiative will identify and fund new social enterprises that help realise the SDGs, initially focusing on bringing innovative WASH solutions to market. Overall, the Transform plan aims to improve the health and well-being of 100 million people by 2025 through job creation, improving incomes and providing support to market-based solutions. We are also deepening our existing partnership. We are in the fourth year of a partnership between Domestos and UNICEF, which helps individuals gain improved access to toilets.
At the same time, in India we have launched ‘Clean India, Clean habits’. This is a mass media, behaviour change programme designed to promote the use of toilets and the importance of handwashing and safe drinking water practices. The initiative aims to reach 75 million people by 2019 in support of the Government’s Swachh Bharat Abhiyan (Clean India Mission).
EMPOWERING WOMEN Women make up a large number of our consumers and 32% of our workforce, but many still face discrimination and disadvantage globally. There is a strong human rights and business case for helping to reverse this. Empowering women could be one of the biggest levers of transformational change and SDG 5 ‘Gender Equality’ is an enabler across all the SDGs.
According to international advocacy organisation Women Deliver, women re-invest 90% of their income in their families, so including more women in the economic cycle will have a positive impact on growth and the progress of families and communities.
Unilever is committed to improving women’s rights, skills and opportunities. We aim to empower women across our value chain; from smallholder farmers and distributors to consumers. We want to leverage the full Unilever footprint to drive systemic change and achieve gender equality.
Through a range of global partnerships including the CGEP, Population Services
International (PSI), Amsterdam Initiative against Malnutrition (AIM) and Bottom of the Pyramid Institute, we are creating inclusive distribution models empowering women to improve their livelihoods, teaching them basic job skills and driving life-changing behavioural change in their communities.
A specific issue for women in many countries is the burden of collecting water, which takes an estimated 200 million hours a day. Our Sunlight brand, with WaterAid, Oxfam and NextDrop, published a major report in 2015 on the problem. It revealed why the interlinkages between water, sanitation and gender equality must be recognised by governments, civil society and businesses.
We are also supporting the UN Women HeForShe IMPACT 10x10x10 movement which engages 10 key ‘IMPACT champions’ from government, business and academia – including our CEO Paul Polman – to drive change from the top. Each IMPACT champion has pledged to make gender equality an institutional priority, committing to real change within and beyond their organisations.
In summary, the groundbreaking agreements of 2015 set a new climate and development framework that sends a signal to businesses and investors that will drive real change in the global economy. Much more needs to be done but we have now passed a tipping point as the world has recognised that delivering social and environmental benefits will provide a positive opportunity for businesses with purpose to win in the 21st century.
THE OMO BRAND GREW 15%
IN UNDERLYING SALES DURING THE WATER CAMPAIGN
PERIOD
SAVING WATER IN BRAZIL
THE CAMPAIGN DOUBLED VISITORS TO THE OMO WEBSITE WITH A 290% INCREASE IN DWELL TIME.
In 2015, Omo launched #1RinseIsEnough, a successful education campaign to help consumers save water in Brazil during the country’s worst water shortage, helping the brand grow at nearly double the market rate.
26 Unilever Annual Report and Accounts 2015Strategic Report
SOCIETYCONTINUED

FRAMEWORK OF HOW SUSTAINABILITY SUPPORTS BUSINESS SUCCESS
MORE GROWTHSustainable Living
brands grew 2x faster in 2014
LOWER COSTSOver €600m avoided costs
(2008-2015)
MORE TRUSTNo.1 employer in
34 countries
LESS RISK60% of agricultural
materials sustainably sourced
We launched the Unilever Sustainable Living Plan (USLP) in 2010. It set three ambitious goals for 2020: to help more than 1 billion people improve their health and well-being; to halve the environmental impact of our products; and to enhance the livelihoods of millions of people through all elements of the value chain.
We use a simple framework to show how sustainability is helping us deliver more growth, lower costs, less risk and more trust. It provides our people with further strategic guidance across our categories and brands.
Inspired by the USLP, we see a growing number of Sustainable Living brands in our overall portfolio. In 2014, the last full year for which complete data is available, we had 11 Sustainable Living brands. The 2015 Sustainable Living brands will be highlighted in our online Sustainable Living Report 2015 to be published in April 2016 at www.unilever.com/sustainable-living.
The definition of Sustainable Living brands is underpinned by a rigorous methodology which measures the performance of those brands contributing to positive social and environmental change. In 2014, these brands grew at double the rate of our other brands and accounted for half our growth.
We have made significant progress on our first big USLP goal of helping more than 1 billion people improve their health and well-being. By the end of 2015, we had reached 482 million people, led by the success of Sustainable Living brands such as Lifebuoy, Dove and Signal through programmes carried out since 2005.
In addition, 34% of our Foods portfolio met the highest nutritional standards.
Our manufacturing operations play a major role in our efforts to realise our second main goal of reducing our environmental impact. We have cut CO2 from energy by 36%, water abstraction by 34% and total waste disposed by 97% in our manufacturing operations since 2008. However, when it comes to reducing the environmental impact of how consumers use our products we continue to find this more difficult. Since 2010, the water impact of our products has reduced by 1%, while the waste associated with consumer
disposal of our products has reduced by rather more – 29%. This means that we are more than half way on our journey towards halving packaging waste, partly through divestments but also through our innovation projects on lightweighting, as well as infrastructural improvements in recycling and recovery. But the greenhouse gas impact of our products across the lifecycle, including consumer use, continues to edge up and has now increased by 6% since 2010.
This continues the trend we reported on last year. We remain committed, despite this, to a full value chain approach to reducing our environmental impact, since that most meaningfully reflects the true impact of our business. Over the last five years we have learned which levers we can pull on our own to effect change, and where we rely on the much slower process of system change. As a result, we are sharpening our internal strategy and will
be refining our target during 2016. We have already announced a new target to be carbon positive (ie to go beyond being carbon neutral) within our own operations by 2030.
Our third USLP goal – to enhance the livelihoods of millions of people – has seen good progress. We sourced 60% of our agricultural raw materials sustainably and 54% of procurement spend was through suppliers meeting our Responsible Sourcing Policy’s mandatory criteria. In 2015 we published our first Human Rights Report (see page 30). Since 2006, in partnership with others, we enabled around 800,000 women to access initiatives that aimed to develop their skills, made up of 70,000 micro-entrepreneurs in India and around 730,000 on tea smallholdings in Kenya and India. We also enabled around 600,000 smallholder farmers and 1.8 million small-scale retailers to access initiatives which aimed to improve their agricultural practices or increase their sales.
USLP PROGRESS
114,000women are benefiting from our Radiant programme, through detergent brands Rin in India and Brilhante in Brazil.
300,000followers of our global Ben & Jerry’s ‘Save Our Swirled’ campaign.
80%of people participating in our Flora ProActiv ‘It Takes A Village’ campaign have reduced their cholesterol.
71 millionOur Brush Day & Night oral health campaigns have reached 71 million people through brands such as Signal and Pepsodent.
SUSTAINABLE LIVING
BRANDS
27Unilever Annual Report and Accounts 2015 Strategic Report
UNILEVER SUSTAINABLE LIVING PLAN

PEOPLE PROVIDE THE ESSENTIAL TALENT AND ENERGY TO FULFIL UNILEVER’S AMBITION. Attracting, developing and retaining the very best people is critical to ensure that we succeed in our vision of accelerating growth in our business while reducing our environmental footprint and increasing our positive social impact.
We rely on our people to deliver against our USLP commitments – a challenge that requires great endeavour, expertise and energy on their part.
The fundamental priorities of our approach to developing our people haven’t changed and underpin everything we do:
• build depth of capability and leadership;• live our values and build a performance
culture; and• build an agile, flexible and diverse
organisation.
These priorities are supported by our investment in our people’s well-being and our leading-edge approach to advancing human rights, while we continue to make progress in the diversity and inclusiveness of our workforce.
ATTRACTING TALENTOur status as the No.1 Graduate Employer of Choice in the FMCG sector among our target universities was maintained in 2015 across 34 countries. This compares to just three in 2009 and 32 in 2014.
This result reflects our digital engagement with students via social media and numerous campus activities. Our flagship initiative is the Future Leaders League – an international competition among universities which send teams to our global event, and which provides the opportunity to interact with our senior management and gain first-hand insights into business and leadership.
Our status reveals our activities are successful in engaging with talented graduates who recognise Unilever as a place that is doing well by doing good and where their career potential can be realised. Our commitment to sustainability is becoming an ever more important reason why people are attracted to Unilever as a career choice.
Beyond our own FMCG sector, LinkedIn continues to be a key channel for attracting and engaging external talent. Our relationship with LinkedIn was further enhanced with the launch of LinkedIn Elevate, a new content-sharing platform which allows our people to show the world their Unilever by sharing relevant content across their own social networks.
While we work hard to ensure that we are attracting the right talent, internally we monitor attrition regularly and are committed to providing an environment in which our people can balance work and life in a way that makes sense for them. The overall attrition rate in 2015 was 8.2%, down 0.1 percentage points compared to 2014 (white collar population). At management level the attrition rate was 7.2%, down 0.1 percentage points compared to 2014.
SAFETY – MOBILE PHONES IN VEHICLESWE ARE
BUILDING A SAFETY CULTURE
ACROSS OUR ENTIRE
BUSINESS
MOMO – MOTOR ON MOBILE OFF – IS OUR CAMPAIGN PROHIBITING MOBILE PHONE USAGE WHILE DRIVING.
MOMO INCLUDES HAND-HELD AND HANDS-FREE DEVICES.
At Unilever we are committed to responsible growth and that means safe growth for our people. We are therefore committed to a vision of zero fatalities and zero workplace injuries.
28 Unilever Annual Report and Accounts 2015Strategic Report
OUR PEOPLE

LEARNINGUnilever operates in highly competitive markets so recruiting, retaining and developing skilled people are critical. Our skills need to align to our strategy so revenues grow and productivity improves while our people grow professionally.
To achieve this we improved and sharpened our learning strategy in 2015. A priority was to deliver the right learning at the right time in a form easy to use wherever and whenever needed.
Our learning material also needs to keep pace with the changing nature of working life where office-based work is a constantly changing environment while many of our people are on the move, working through mobile devices. At the same time, skills need updating ever more rapidly so our learning strategy must deliver professional education that is mobile, engaging, easy to consume and on-demand.
To achieve this we launched the Learning Hub in late 2015 which hosts all Unilever’s learning content. We want to bring together all business, leadership and functional skills in a single framework with all skills clearly aligned to our business strategy. Extensive internal and external research has identified six business skills that are crucial to Unilever in the 21st century
and will enable everyone to fulfil their potential and create important competitive advantages for the Group. The content has been refreshed, rationalised and made more relevant with user reviews supporting a renewed focus on quality.
New mobile-enabled content will be developed further during 2016. The Hub uses digital technology and collaborative tools to meet the demands of modern, multilingual working.
But we are not restricted to our own internal approach. Our leadership development includes a consortium programme where we partner with the world’s leading establishments.
The consortium programme is one way that we bring the learning outside-in, to invite our suppliers, customers and like-minded companies to learn together. We selected topics and programmes which, when learnt together with external parties, enrich the learning process. These included Women Leadership, Learning Professionals Program (IMD), Sustainability (Cambridge in 2014 and INSEAD in 2015), Asian Leaders (IMD in 2016) and developing Asian Finance Talents (TMS Academy and Wharton in 2016). We have already included some programmes in the Four Acres curriculum.
Within Unilever, our supply chain is where the bulk of Unilever’s people work and so is a big focus for our training activity. This number of people requires us to focus on self-directed learning via the use of effective systems and core skills curricula. This year we have updated the Learning Management System and all the core curricula, which cover over 1,300 individual online courses.
Our face-to-face training still plays a key role. Here we drive skills that develop deep functional understanding, with more than 15 new programmes being developed across the whole of our supply chain, including Procurement, Planning and Logistics. We use WebEx extensively and specifically on more general supply chain training, having reached more than 30% of our supply chain management team.
We also use face-to-face programmes to drive professional supply chain leadership development and have run programmes that cover the senior leadership teams in more than 60 of our factories globally.
We have further strengthened our Manufacturing Training programme with the implementation of a new system specifically to manage the driving of manufacturing skills of blue collar staff as part of our World Class Manufacturing programme.
OUR SAFETY RECORDBased on our Vision Zero strategy we updated our mission in 2015 to build an interdependent safety culture that protects the well-being of our employees, visitors, contractors and assets to help deliver responsible growth. We also rolled out our Motor On Mobile Off campaign which bans the use of mobile devices – hands-free and hand-held – while driving on company business.
In our supply chain in 2015, we began integrating our behavioural-based BeSafE safety programme and World Class Manufacturing (WCM) methodology. This provided the opportunity for the safety and manufacturing teams to work more closely in delivering continuous safety improvement in full alignment with WCM. It also allowed us to combine the best elements from both BeSafE and
WCM to create a stronger safety programme overall and ensure the highest level of safety and accountability for our manufacturing teams. We also appointed a dedicated process and construction safety director to focus on large-scale risks.
Unilever reports safety data from October to September. Our Total Recordable Frequency Rate (TRFR) from 1 October 2014 to 30 September 2015 increased to 1.12 accidents per 1 million hours worked, up from 1.05 in 2014. There are three main reasons for this increase. Firstly, safe
travel incidents, which is an area of focus for the Group following the introduction of the global Safe Travel standard. Safe travel incidents are recordable events that occur on the roads when our employees drive designated vehicles on company time or business and have a collision with other road users, animals or stationary objects. Secondly, the acquisition of new companies with different safety cultures. Thirdly, a major transformation project that involved the closing down of sites in the US.
29Unilever Annual Report and Accounts 2015 Strategic Report

FOCUSING ON HUMAN RIGHTS
ORGANISATION DEVELOPMENTPreviously we have focused on the Fit to Win programme to be leaner and more agile alongside Project Half for Growth to simplify the organisation and our processes.
In 2015 we have focused more on continuous improvement and being equipped to maximise growth opportunities. Importantly, we have looked at addressing organisational design principles as enablers to deliver a leaner structure that is organised in the most efficient and effective way, driving speed and agility.
Growth opportunities have also come through acquisitions and we welcomed several new businesses requiring different support to ensure new colleagues can integrate and benefit from Unilever’s size and scale while ensuring their growth-focused, entrepreneurial cultures are preserved.
Notable acquisitions have included four premium skin care businesses, Dermalogica, Murad, Kate Somerville
and REN, which form our new Prestige business within Personal Care. We also acquired the Camay and Zest brands, and added Grom, the premium gelato business, to our Refreshment category. All in all we welcomed more than 2,300 new employees to the Unilever Group.
Another significant project has been the formation of the Baking, Cooking and Spreads business within the Foods category, which has created a more dedicated, focused organisation to bring greater speed and agility to executing strategy.
HUMAN RIGHTSBusiness flourishes in societies where human rights are respected, upheld and advanced. People are our greatest asset and empowering them is not only the right thing to do, but also ensures a sustainable future for Unilever.
To make this a reality, in 2014 Unilever formalised its commitment to respecting human rights as part of the USLP and announced it would implement the UN Guiding Principles on Business and Human Rights, and undertake to report publicly on progress.
To that end we became the first company to adopt the UN Guiding Principles Reporting Framework and in June 2015 we were the first company to produce a detailed, stand-alone report using the Framework entitled Enhancing Livelihoods, Advancing Human Rights.
This is Unilever’s Human Rights Report, which can be read at www.unilever.com/human-rights-report-2015.
It focuses on Unilever’s eight salient human rights issues – those at risk of the most severe negative impacts through a company’s activities or business relationships.
The report highlights challenges and key areas of progress, including Unilever’s work to empower women, the fight against sexual harassment and how we are addressing health and safety issues across the supply chain. Dialogue, capacity building and, where needed, effective remedy are vital to these efforts.
WE ARE TAKING ACTION
ON HUMAN RIGHTS ACROSS OUR
SUPPLY CHAIN
In 2015 we published our first Human Rights Report which included a spotlight on our efforts, including training programmes, to end sexual harassment at the Kericho tea estate in Kenya.
860employees trained as ambassadors for human rights.
19,000people trained on ending sexual harassment and related topics.
30 Unilever Annual Report and Accounts 2015Strategic Report
OUR PEOPLECONTINUED

32%Women make up a large number of our consumers and 32% of our workforce, so are crucial to the future sustainability of Unilever as a business.
In 2015, with UN Women, we announced our commitment over the next three years to expand economic opportunities for women in our value chain, help reduce unpaid care work and improve safety for women and girls.
It also describes key areas of focus for the future. Unilever cannot succeed alone and being honest about the challenges is crucial to progress. Therefore we will continue to address human rights issues beyond first-tier suppliers, taking a commodity and geographical focus, and collaborating with other organisations in order to influence systemic change. We will also ensure that we track progress robustly, by building frameworks for improved data collection, verification and analysis.
We want to go beyond respecting to actively promoting human rights, embedding this into every part of our business.
WELL-BEINGOur work to help our people learn and contribute to our growth is underpinned by our Global Well-being programme. Each market has a comprehensive plan which incorporates physical and mental plus emotional and purposeful well-being. In 2015 we built and rolled out internationally our well-being workshop, Thrive, which is available to all. By the end of 2015, 17,000 employees across Unilever in all markets had attended a Well-being programme.
DIVERSITY AND INCLUSIONWe believe in a diverse workforce to serve our diverse consumer base. Inclusion is the foundation of a sustainable, strong culture. We want our people to feel confident, comfortable and able to reach their potential regardless of gender, age, ability, background or sexual preference.
Our attitude to diversity and inclusion also reflects our wider values as a Group, which define how we do business and how we interact with our colleagues, partners, customers and consumers. Our four core values are: integrity; responsibility; respect; and being pioneering.
On gender equality we continue to make progress, although work remains. By the end of 2015, 45% of our total management were women, up from 38% in 2010 and 25 countries have reached their gender balance targets for management.
At the most senior levels, however, the ratios are not as high. Among the top 101 executive managers, 23 (23%) were women compared with 18% in 2014. If you include employees who are statutory directors of the corporate entities whose financial information is included in the Group’s 2015 consolidated accounts in this Annual
Report and Accounts, the number increases to 536 males and 146 (21%) females. 50% (six out of 12) of the Board is female, compared with 36% in 2014.
Of our total workforce of 168,921, 114,975 (68%) were male and 53,946 (32%) were female at the end of 2015.
We will continue to work to improve these performance statistics. We are committed to creating opportunities for women and to empowering them in a way that goes beyond our own operations and into our wider stakeholder communities through our supply chain partners – particularly among smallholder farmers.
We have the clearly articulated ambition of empowering 5 million women by 2020 through our USLP, helping women and the communities in which they live and work to improve their livelihoods.
To encourage more women into management, we have partnered with INSEAD since 2013 on the INSEAD-Unilever Women Leadership Program which is delivered at our Four Acres campuses. The role of Four Acres in London and Singapore is to provide the best learning available to ensure that we develop leaders who will play an active role for Unilever and society at large.
BY 2020 WE WILL EMPOWER
5 MILLION WOMEN
EMPOWERING WOMEN
OUR KONYA ICE CREAM FACTORY IN TURKEY, WHICH PRODUCES CORNETTO, MAX AND TWISTER, IS A LEADING EXAMPLE OF HOW THE GENDER EQUALITY OF OUR WORKFORCE IS IMPROVING. 40% OF ENGINEERS EMPLOYED ARE WOMEN.
Empowering women includes access to new opportunities and better working conditions, including improved safety, training and education, career progression and better pay.
31Unilever Annual Report and Accounts 2015 Strategic Report

11%12%
9%
20152014201320122011
7%6%
OUR STRATEGY FOR LONG-TERM VALUE CREATION COMBINES CLEAR PORTFOLIO CHOICES WITH INNOVATION, MARKET DEVELOPMENT AND OPERATIONAL EFFICIENCY. This strategy is built on the foundation of our Purpose – to make sustainable living commonplace – brought to life through the USLP. This way, we deliver to our shareholders growth that is consistent, competitive, profitable and responsible.
However, a sustainable business requires a sustainable world and consumers are increasingly demanding that business plays its part. More of our brands are meeting that demand and delivering stronger and faster growth. Our Sustainable Living brands (detailed on page 27) accounted for half our growth in 2014 and grew at twice the rate of Unilever’s other brands.
During the year we continued to improve returns to shareholders with dividends rising 6% and our share price ending the year up 23% for our NV shares and 11% for our PLC shares.
Over the longer term our approach continues to deliver consistent results. Between 2011 and 2015 underlying sales grew 4.9% per year, which was ahead of
our markets, and core operating margin grew by an average of 0.26 percentage points per year. Over the same period core earnings per share grew by 7% per year on average at current exchange rates and 10% per year at constant exchange rates. We have delivered an average free cash flow of €3.8 billion and dividends have increased an average of 8% per year over this period. More detail on our financial growth model can be found on page 34.
To improve returns we have four category strategies with distinct but complementary objectives, each fulfilling a specific role across the portfolio. Personal Care now accounts for 38% of turnover – our largest category – and is growing its core while developing its premium range through acquisition (see facing page for more details).
Home Care is improving profitability and scaling its household cleaning business while Refreshment is tasked with growing ice cream cash flows and accelerating top line growth in tea. Foods’ objective is to accelerate growth and sustain strong profitability and cash flows.
Innovation is key to driving growth and margins. Research and development is embedded in each category with a focused pipeline of innovations. We are executing larger projects and since 2013 the average project size has increased by 25%. In
addition, more than 70% of our innovations are margin accretive. We have also significantly increased the application of new technologies with more than 45% of the value of our innovation portfolio based on new technologies compared with 35% in 2013.
Our brands benefit from award-winning marketing with an ever greater emphasis on digital marketing that dovetails with the growth in our e-commerce sales which are benefiting from our improving expertise in executing through online channels.
Our broader customer development programmes are targeting new channels such as drug stores for Personal Care and out-of-home for Refreshment, and our Perfect Store programme has reached almost 10 million executions across stores and categories in 2015 from 6.9 million executions in 2013.
Our growth model is enabled by a leaner, more talented and efficient organisation. Project Half for Growth has delivered around €500 million of annualised cost savings and Unilever continues to benefit from savings of more than €1 billion per year in supply chain.
EMERGING MARKETSIn 2015 emerging markets demonstrated some recovery, with our underlying sales up 7% compared with 6% in 2014. However, this is still below the 9% average since 2011 and recent years have highlighted the volatility of these markets.
However, we firmly believe these countries will deliver the best long-term growth prospects as populations and per capita consumption expand. Emerging markets now account for 58% of Unilever turnover, up from 57% in 2014.
A key element of our success is managing through volatility and a key reason is the development of our local management expertise. Of our top 20 markets, 12 are emerging markets and in those 12 markets more than 80% of the management is local. Local understanding ensures the right decisions are taken for local customers and consumers, which helps deliver our global strategy.
58%Turnover from emerging markets
Our average emerging markets growth over the period was 9%.
32 Unilever Annual Report and Accounts 2015Strategic Report
OUR SHAREHOLDERS

€400 millionThe brands are a new growth platform and have combined turnover of approaching €400 million.
DEVELOPMENTS IN 2015In previous years Unilever identified premiumising its portfolio as a key driver of growth. In 2015 we took further decisive action to execute on that priority with the acquisition of several brands, most notably in Personal Care.
We acquired four premium skin care businesses to create a Prestige business within Personal Care with annual turnover approaching €400 million. These deals are accretive to growth, margins and earnings per share.
The largest acquisition, announced in June 2015, is Dermalogica. With a strong international footprint, it is the number one salon skin care brand globally, rooted in skin health treatments. Murad, announced in July, is the first modern ‘doctor’ brand with a mission to provide proven, efficacious products. Founded in 1989 by Howard Murad, a dermatologist, pharmacist and UCLA professor, it has a product range to address a wide variety of skin care concerns.
Earlier, in March 2015, Unilever also announced the acquisition of REN, which pioneered a distinctive high-performance skin care product range now sold in around 50 countries through speciality stores and pharmacies. In May we
announced the acquisition of Kate Somerville Skincare, a niche derma-cosmetic business with a celebrity following in Hollywood, which has made inroads from the US into the fast-growing Asian beauty market.
All four are strong, differentiated brands in a large and growing market for prestige skin care products, which remains highly fragmented. The brands will be run as part of the Prestige business within Personal Care, to preserve the unique prestige expertise, with dedicated marketing and customer development. However, the brands will be able to leverage our consumer insight and research and development resources.
The acquisition of the Prestige skin care brands is a good example of how Unilever uses merger and acquisition activity to help reshape our portfolios towards more attractive segments where we can most effectively apply our global scale and local strengths. We remain alert to opportunities that will progress our strategic priorities while always observing robust financial disciplines in assessing these options. Elsewhere, we acquired Grom to strengthen our ice cream portfolio in our Refreshment category. Grom enjoys a strong position in the premium gelato
market and has 60 stores in Italy and around the world. It also shares Unilever’s commitment to sustainable sourcing of raw materials. In Foods, we created Baking, Cooking and Spreads to increase agility and accelerate growth in Europe and North America.
In line with our focus on Personal Care, Unilever was reclassified from Foods to Personal Products by the Global Industry Classification Standard (GICS) panel. This followed similar reclassifications in 2014 applying to the FTSE and Stoxx indices.
During 2015 we continued our bond issuance programme to raise competitively priced debt capital through both the European and US capital markets. In January 2015 we announced the pricing of a €750 million bond at 0.5% due February 2022. In May we issued €1.25 billion in two tranches due June 2018 and June 2023, while in July we priced a dual tranche US$1 billion bond split equally between a 2.1% fixed rate note due July 2020 and a 3.1% note due July 2025.
We also took the opportunity in 2015 to increase our equity stake in Unilever Nigeria from 50.0% to 58.5%.
WE ARE BUILDING
A PREMIUM PORTFOLIO THROUGH
ACQUISITION
A PRESTIGE BUSINESS
THE BRANDS WE ACQUIRED WERE DERMALOGICA, KATE SOMERVILLE, MURAD AND REN.
We have created a new Prestige business within Personal Care, through the acquisition of four brands, to execute the category’s strategic priority of building its premium product range.
33Unilever Annual Report and Accounts 2015 Strategic Report

€0.95€0.88€1.05
20152014201320122011
€1.19€1.12
TOTAL DIVIDENDS PER SHARE
05
1015202530354045
20152014201320122011
SHARES 2011-2015
NV shares (€)
PLC shares (£)
OUR FINANCIAL GROWTH MODELWe continued to deliver shareholder value in 2015 helped by an improvement in our markets and by applying all levers of value creation.
FREE CASH FLOWFree cash flow was €4.8 billion compared with €3.1 billion in 2014. Our cash performance was underpinned by our continued focus on capital discipline. Our net capital expenditure of €2.1 billion, or 3.9% of turnover, reflects the investment in capacity to support our growing business and was consistent with 2014.
UNDERLYING SALES GROWTHUnderlying sales grew 4.1% driven by a 2.1% increase in underlying volume and a 1.9% rise in price. This was ahead of our markets which grew at around 3%. An improvement in emerging markets offset continued weakness in Europe which continued to suffer price deflation.
CORE OPERATING MARGINOur core operating margin increased 0.3 percentage points, largely driven by improvements in efficiency which saw cost savings of more than €1 billion in supply chain in 2015. Brand and marketing investment has increased by more than €800 million.
EARNINGS PER SHAREAs a result of our operations our core earnings per share rose to €1.82, an increase of 14%. This result reflected a currency translation effect of 3%. At constant exchange rates EPS grew 11%.
RETURN ON INVESTED CAPITALReturn on invested capital increased as a result of improved core operating margin and greater capital efficiency. This was despite an increase in goodwill as a result of acquisitions and currency movements.
DIVIDENDSIn April Unilever announced an increase in the quarterly dividend to €0.3020 giving a total payout during 2015 of €1.19 per share. Dividends increased by 6% in 2015 and have increased by an average of 8% per year in the last five years.
SHARE PRICEOur NV share price closed 23% higher than the prior year while PLC shares closed 11% higher. Over the period 2011-2015 our NV share price has grown 70% while our PLC share price has grown 48%. Total shareholder return, which includes both share price and dividend increases, was 16% in 2015 and 108% over the last five years.
CAPITAL EFFICIENCYWorking capital and fixed asset efficiency both improved further during the year. Working capital as a percentage of sales is negative which means that growth in the business is intrinsically cash generative. The ratio of fixed assets to sales reduced compared with the previous year as the business grew.
VALUE DRIVERS
FINANCIAL RETURNS
SHAREHOLDER RETURNS
34 Unilever Annual Report and Accounts 2015Strategic Report
OUR SHAREHOLDERSCONTINUED

UNDERLYING SALES GROWTH*
4.3%
2.9%
4.1%
2013 2014 2015
UNDERLYING VOLUME GROWTH*
2.5%
1.0%
2.1%
2013 2014 2015
CORE OPERATING MARGIN*
14.1% 14.5% 14.8%
2013 2014 2015
FINANCIAL OVERVIEW 2015
CONSOLIDATED INCOME STATEMENTTurnover grew by 10% to €53.3 billion helped by a positive currency impact of 5.9% (2014: negative 4.6%) with a strong boost in the first half of the year due to a weaker euro. Underlying sales growth was 4.1% (2014: 2.9%) balanced between volume growth of 2.1% (2014: 1.0%) and pricing of 1.9% (2014: 1.9%). Acquisitions and disposals had a negative impact of 0.1% (2014: negative 0.9%). Emerging markets contributed 58% of total turnover (2014: 57%) with underlying sales growth of 7.1% (2014: 5.7%) of which 2.7% was volume growth. Currency devaluation continued to push up the cost of living for consumers in many of the emerging markets. Our performance in developed markets was flat with good volume growth in Europe being offset by price deflation.
Core operating margin was up 0.3 percentage points to 14.8%. Gross margin was up 0.8 percentage points to 42.2% driven by margin-accretive innovation, pricing and continued delivery from our savings programmes, which more than offset currency-related cost increases and higher costs on brand and marketing investment. Commodity costs increased by about 4%. While the price of many commodities, such as oil, in US dollars fell during 2015, commodity costs in local currencies increased as devaluing currencies imported inflation into local raw material production. Overheads increased by 0.3 percentage points reflecting an adverse currency translation impact and favourable one-off items in the prior year, such as property sales in India.
Operating profit was down 6% at €7.5 billion compared with €8.0 billion in 2014. This includes a charge of €350 million for non-core items (2014: credit of €960 million including a €1,392 million gain from business disposals).
Highlights for the year ended 31 December2015 2014 %
change
Turnover (€ million) 53,272 48,436 10Operating profit (€ million) 7,515 7,980 (6)Core operating profit (€ million)* 7,865 7,020 12Profit before tax (€ million) 7,220 7,646 (6)Net profit (€ million) 5,259 5,515 (5)Diluted earnings per share (€) 1.72 1.79 (4)Core earnings per share (€)* 1.82 1.61 14
The net cost of financing borrowings was €372 million compared with €383 million in 2014. The average interest rate on net debt improved to 3.0% (2014: 3.5%) largely as a result of higher returns on investments. Pensions financing was a charge of €121 million compared with €94 million in 2014.
The effective tax rate was 27.6% versus 28.2% in 2014 which included €0.8 billion tax relating to business disposals.
Net profit from joint ventures and associates together with other income from non-current investments was €198 million compared with €143 million in 2014. This reflects increased profit on disposal of associates and higher income from joint ventures. At €1.72, diluted EPS was down 4% as the prior year included the profit on business disposals. Core EPS increased by 14% to €1.82, including a favourable currency impact of 3%.
The independent auditors’ reports issued by KPMG Accountants N.V. and KPMG LLP, on the consolidated results of the Group, as set out in the financial statements, were unqualified and contained no exceptions or emphasis of matter. For more details see pages 85 to 89 of the Governance and Financial Report.The consolidated financial statements have been prepared in accordance with IFRS. The critical accounting policies and those that are most significant in connection with our financial reporting are set out in note 1 on pages 94 and 95 of the Governance and Financial Report and are consistent with those applied in 2014.
* Certain measures used in our reporting are not defined under IFRS. For further information about these measures, please refer to the commentary on non-GAAP measures on pages 38 and 39.
35Unilever Annual Report and Accounts 2015 Strategic Report
FINANCIAL REVIEW 2015

TURNOVER BY CATEGORY
Personal CareFoodsHome CareRefreshment
38%24%19%19%
OPERATING PROFIT BY CATEGORY
Personal CareFoodsHome CareRefreshment
48%31%10%11%
PERSONAL CARE
2015 2014 %Change
Turnover (€ million) 20,074 17,739 13.2Operating profit (€ million) 3,637 3,259 11.6Core operating profit (€ million) 3,788 3,325 13.9 Core operating margin (%) 18.9 18.7 0.2 Underlying sales growth (%) 4.1 3.5Underlying volume growth (%) 2.3 1.2Effect of price changes (%) 1.8 2.3
KEY DEVELOPMENTS• Turnover growth was 13.2% of which 7.6% was currency impact.
Underlying sales growth, while still below historical rates, improved to 4.1% compared with 3.5% in 2014. Growth benefited from innovations that boosted the core of our business including the launch of dry spray deodorants in North America, the launch of Lux Luminique in Japan and the roll-out of Dove Advanced Hair Series. 2015 also marked our entry into the prestige skin care business with the acquisitions of Dermalogica, Murad, Kate Somerville and REN.
• Core operating profit was €463 million higher than the prior year and this includes a €196 million favourable impact from exchange rate movement. Acquisitions and disposal activities contributed €105 million while underlying sales growth and margin improvement added €137 million and €25 million respectively. Operating margin improvement is principally driven by margin-accretive innovation. Gross margin was up 0.5 percentage points and brand and marketing investment was up 13%.
HOME CARE
2015 2014 %Change
Turnover (€ million) 10,159 9,164 10.9Operating profit (€ million) 740 576 28.5Core operating profit (€ million) 775 579 33.9 Core operating margin (%) 7.6 6.3 1.3 Underlying sales growth (%) 5.9 5.8Underlying volume growth (%) 4.0 2.4Effect of price changes (%) 1.9 3.4
KEY DEVELOPMENTS• Home Care turnover grew by 10.9% including a 4.5% favourable
currency impact. Underlying sales growth was 5.9%, heavily geared toward volume growth which contributed 4.0%. The category delivered broad-based growth including the roll-out of new Omo with enhanced formulation and improved cleaning technology, the success of fabric conditioners helped by the launch of Comfort Intense, and the introduction of Cif to new markets.
• Core operating profit increased by €196 million including a €22 million increase from exchange rate movement. Underlying sales growth contributed €41 million while improved margin added €133 million. Gross margin was up 2.7 percentage points as a result of improved mix, cost savings and simplification programmes. Brand and marketing investment was up 19%.
FOODS
2015 2014 %Change
Turnover (€ million) 12,919 12,361 4.5Operating profit (€ million) 2,298 3,607 (36.3)Core operating profit (€ million) 2,354 2,305 2.1 Core operating margin (%) 18.2 18.6 (0.4) Underlying sales growth (%) 1.5 (0.6)Underlying volume growth (%) 0.8 (1.1)Effect of price changes (%) 0.8 0.6
KEY DEVELOPMENTS• Turnover growth was 4.5% which included a 5.6% positive currency
impact and 2.5% negative impact from acquisitions and disposal activities. Underlying sales growth improved to 1.5% (from negative 0.6% in 2014) with both price and volume contributing 0.8%. Savoury showed good volume-driven growth led by cooking products in emerging markets and by innovations around naturalness and health. In dressings, Hellmann’s demonstrated good growth, with 7% underlying sales growth despite increased competition from new market entrants. Spreads gained market share but turnover declined 5%, reflecting market competition in developed markets.
• Core operating profit was up by €49 million despite a profit reduction of €82 million relating to acquisitions and disposal activities. Underlying sales growth added €35 million and the impact of exchange rate was a favourable €151 million. In addition, higher supply chain costs led to decline in margins and this reduced profit by €55 million. Brand and marketing investment was up 5%.
REFRESHMENT
2015 2014 %Change
Turnover (€ million) 10,120 9,172 10.3Operating profit (€ million) 840 538 56.1Core operating profit (€ million) 948 811 16.9 Core operating margin (%) 9.4 8.8 0.6 Underlying sales growth (%) 5.4 3.8Underlying volume growth (%) 1.5 2.0Effect of price changes (%) 3.9 1.8
KEY DEVELOPMENTS• Refreshment turnover grew by 10.3% including 4.1% favourable
currency impact. In ice cream both Magnum and Ben & Jerry’s delivered double-digit growth contributing to the 5.4% underlying sales growth. We continue to build our presence in the premium gelato business with the recently acquired Talenti and Grom. In tea more T2 stores have opened during the year and Lipton and PG Tips have been extended further into fruit, herbal and speciality teas where we are still under-represented.
• Core operating profit was €137 million higher compared with prior year due to exchange rate movements which added €31 million, underlying sales growth which contributed €47 million, operating margin improvement of €53 million and a €6 million increase from acquisitions and disposal activities. Gross margin was up 0.3 percentage points driven by mix and savings in ice cream. Brand and marketing investment was up 8%.
36 Unilever Annual Report and Accounts 2015Strategic Report
FINANCIAL REVIEW 2015CONTINUED

€ million
2015€ million
2014
Goodwill and intangible assets 25,059 22,174Other non-current assets 14,553 13,506Current assets 12,686 12,347
Total assets 52,298 48,027
Current liabilities 20,019 19,642Non-current liabilities 16,197 14,122
Total liabilities 36,216 33,764
Shareholders’ equity 15,439 13,651Non-controlling interest 643 612
Total equity 16,082 14,263
Total liabilities and equity 52,298 48,027
Current assets were up by €0.3 billion primarily due to an improved cash balance and an increase in the inventories balance at the end of the year. Cash and cash equivalents on the balance sheet was €2.3 billion compared with €2.2 billion at the end of 2014. Closing net debt was €11.5 billion which is €1.6 billion higher than in the prior year. The increase reflects additional borrowings to finance acquisitions and an adverse currency impact from the US dollar denominated debt.
Current liabilities were €20.0 billion compared with €19.6 billion in 2014. The increase is due to an increase in trade payables and other current liabilities as a result of business growth and improved payment terms.
Non-current liabilities were €16.2 billion, up €2.1 billion in 2015. This includes a €2.7 billion increase in non-current financial liabilities from additional borrowings and currency impact. Pension liability declined by €0.7 billion. On 27 January 2015 we issued €750 million 0.5% fixed rate notes due February 2022. On 28 May 2015 we issued €750 million floating rate notes due in June 2018 and €500 million 1.0% fixed rate notes due in June 2023. On 29 July 2015 we issued US$500 million 2.1% fixed rate notes due on 30 July 2020 and US$500 million 3.1% fixed rate notes due on 30 July 2025.
The table below shows that pension liability net of assets was reduced to €2.3 billion at the end of December 2015 versus €3.6 billion as at 31 December 2014. The decrease primarily reflects the impact of higher discount rates, investment returns and the cash contributions we have made. Cash expenditure on pensions was €0.7 billion, the same as in the prior year.
€ million2015
1 January (3,571)Current service cost (271)Employee contributions 17Actual return on plan assets (excluding interest) (254)Net interest cost (121)Actuarial gain 1,167Employer contributions 513Currency retranslation (129)Other movements(a) 32931 December (2,320)(a) Other movements relate to special termination benefits, past service costs
including losses/(gains) on curtailment, settlements and reclassification of benefits. For more detail see Governance and Financial Report note 4B on page 102.
CASH FLOW Free cash flow for the year
was particularly strong at €4.8 billion compared with €3.1 billion in 2014. Cash flow from operating activities was €9.4 billion compared with €7.9 billion in 2014. The variance is a result of strong cash flow generated from operating activities which included €0.7 billion from efficient working capital management. The prior
year was also negatively impacted by €0.8 billion tax arising on business disposals. Net capital expenditure remains flat in absolute terms at €2.1 billion, 3.9% of turnover, reflecting continued investment in capacity to support growth.
€ million
2015€ million
2014
Operating profit 7,515 7,980Depreciation, amortisation and impairment 1,370 1,432Changes in working capital 720 8Pensions and similar obligations less payments (385) (364)Provisions less payments (94) 32Elimination of (profits)/losses on disposals 26 (1,460)Non-cash charge for share-based compensation 150 188Other adjustments 49 38
Cash flow from operating activities 9,351 7,854
Income tax paid (2,021) (2,311)Net capital expenditure (2,074) (2,045)Net interest and preference dividends paid (460) (398)
Free cash flow 4,796 3,100
Net cash flow (used in)/from investing activities (3,539) (341)
Net cash flow (used in)/from financing activities (3,032) (5,190)
The net outflow from investing activities was €3.2 billion higher than in the prior year. This is a combination of current year expenditure of €1.9 billion on business acquisitions (2014: €0.3 billion) and €0.2 billion inflow received from business disposals versus €1.7 billion cash inflow in the prior year.
Net cash outflow from financing activities was €2.2 billion lower than in the prior year. The variance was principally due to higher borrowings in 2015 to finance acquisitions. Prior year also included €0.9 billion spent on the purchase of Leverhulme estate shares.
BALANCE SHEETIn the year to 31 December 2015, Unilever’s combined market capitalisation increased from €93.9 billion to €113.4 billion.
Goodwill and intangible assets increased by €2.9 billion mainly due to business acquisitions and currency movements. All material goodwill and indefinite-life intangible assets have been tested for impairment with no charge recognised during the year. The increase in other non-current assets of €1.0 billion was driven by capital expenditure, currency movements and an increase in pension asset values due to changes in discount and inflation rates.
FREE CASH FLOW € billion
3.93.1
4.8
2013 2014 2015
37Unilever Annual Report and Accounts 2015 Strategic Report
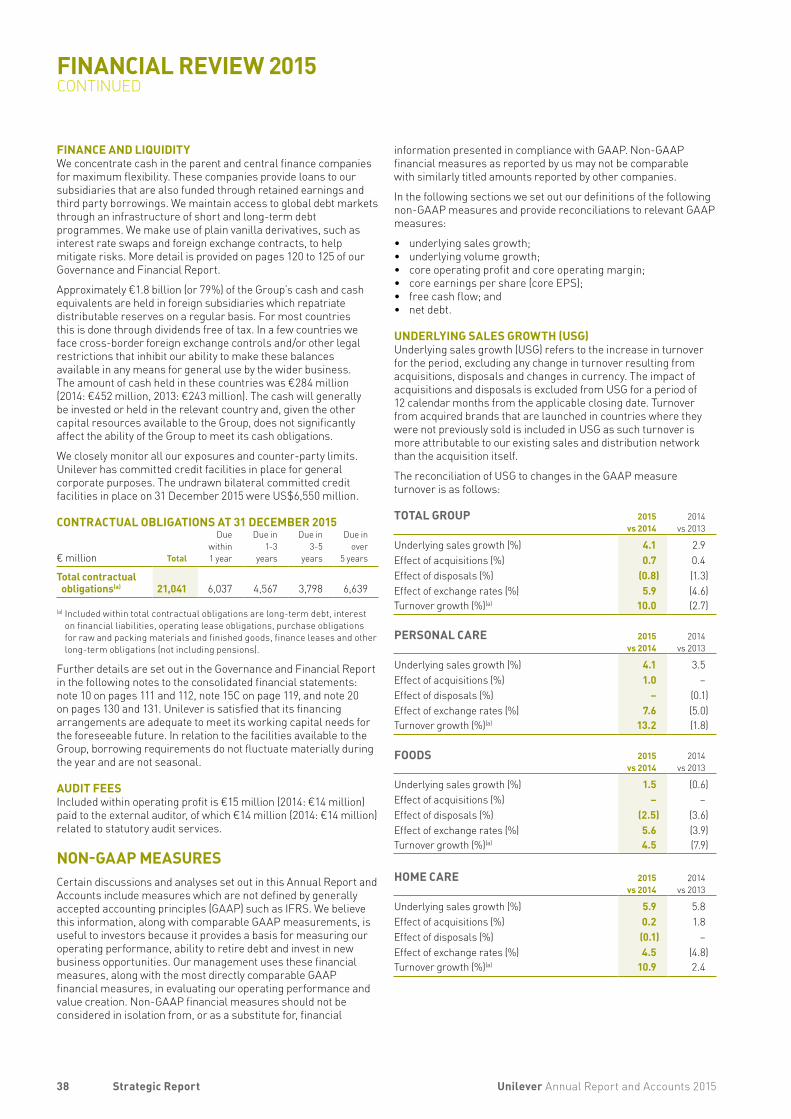
FINANCE AND LIQUIDITYWe concentrate cash in the parent and central finance companies for maximum flexibility. These companies provide loans to our subsidiaries that are also funded through retained earnings and third party borrowings. We maintain access to global debt markets through an infrastructure of short and long-term debt programmes. We make use of plain vanilla derivatives, such as interest rate swaps and foreign exchange contracts, to help mitigate risks. More detail is provided on pages 120 to 125 of our Governance and Financial Report.
Approximately €1.8 billion (or 79%) of the Group’s cash and cash equivalents are held in foreign subsidiaries which repatriate distributable reserves on a regular basis. For most countries this is done through dividends free of tax. In a few countries we face cross-border foreign exchange controls and/or other legal restrictions that inhibit our ability to make these balances available in any means for general use by the wider business. The amount of cash held in these countries was €284 million (2014: €452 million, 2013: €243 million). The cash will generally be invested or held in the relevant country and, given the other capital resources available to the Group, does not significantly affect the ability of the Group to meet its cash obligations.
We closely monitor all our exposures and counter-party limits. Unilever has committed credit facilities in place for general corporate purposes. The undrawn bilateral committed credit facilities in place on 31 December 2015 were US$6,550 million.
CONTRACTUAL OBLIGATIONS AT 31 DECEMBER 2015
€ million Total
Due within 1 year
Due in 1-3
years
Due in 3-5
years
Due in over
5 years
Total contractual obligations(a) 21,041 6,037 4,567 3,798 6,639
(a) Included within total contractual obligations are long-term debt, interest on financial liabilities, operating lease obligations, purchase obligations for raw and packing materials and finished goods, finance leases and other long-term obligations (not including pensions).
Further details are set out in the Governance and Financial Report in the following notes to the consolidated financial statements: note 10 on pages 111 and 112, note 15C on page 119, and note 20 on pages 130 and 131. Unilever is satisfied that its financing arrangements are adequate to meet its working capital needs for the foreseeable future. In relation to the facilities available to the Group, borrowing requirements do not fluctuate materially during the year and are not seasonal.
AUDIT FEESIncluded within operating profit is €15 million (2014: €14 million) paid to the external auditor, of which €14 million (2014: €14 million) related to statutory audit services.
NON-GAAP MEASURESCertain discussions and analyses set out in this Annual Report and Accounts include measures which are not defined by generally accepted accounting principles (GAAP) such as IFRS. We believe this information, along with comparable GAAP measurements, is useful to investors because it provides a basis for measuring our operating performance, ability to retire debt and invest in new business opportunities. Our management uses these financial measures, along with the most directly comparable GAAP financial measures, in evaluating our operating performance and value creation. Non-GAAP financial measures should not be considered in isolation from, or as a substitute for, financial
information presented in compliance with GAAP. Non-GAAP financial measures as reported by us may not be comparable with similarly titled amounts reported by other companies.
In the following sections we set out our definitions of the following non-GAAP measures and provide reconciliations to relevant GAAP measures:
• underlying sales growth; • underlying volume growth; • core operating profit and core operating margin; • core earnings per share (core EPS); • free cash flow; and • net debt.
UNDERLYING SALES GROWTH (USG)Underlying sales growth (USG) refers to the increase in turnover for the period, excluding any change in turnover resulting from acquisitions, disposals and changes in currency. The impact of acquisitions and disposals is excluded from USG for a period of 12 calendar months from the applicable closing date. Turnover from acquired brands that are launched in countries where they were not previously sold is included in USG as such turnover is more attributable to our existing sales and distribution network than the acquisition itself.
The reconciliation of USG to changes in the GAAP measure turnover is as follows:
TOTAL GROUP 2015vs 2014
2014vs 2013
Underlying sales growth (%) 4.1 2.9Effect of acquisitions (%) 0.7 0.4Effect of disposals (%) (0.8) (1.3)Effect of exchange rates (%) 5.9 (4.6)Turnover growth (%)(a) 10.0 (2.7)
PERSONAL CARE 2015vs 2014
2014vs 2013
Underlying sales growth (%) 4.1 3.5Effect of acquisitions (%) 1.0 –Effect of disposals (%) – (0.1)Effect of exchange rates (%) 7.6 (5.0)Turnover growth (%)(a) 13.2 (1.8)
FOODS 2015vs 2014
2014vs 2013
Underlying sales growth (%) 1.5 (0.6)Effect of acquisitions (%) – –Effect of disposals (%) (2.5) (3.6)Effect of exchange rates (%) 5.6 (3.9)Turnover growth (%)(a) 4.5 (7.9)
HOME CARE 2015vs 2014
2014vs 2013
Underlying sales growth (%) 5.9 5.8Effect of acquisitions (%) 0.2 1.8Effect of disposals (%) (0.1) –Effect of exchange rates (%) 4.5 (4.8)Turnover growth (%)(a) 10.9 2.4
38 Unilever Annual Report and Accounts 2015Strategic Report
FINANCIAL REVIEW 2015CONTINUED

FREE CASH FLOW (FCF)Within the Unilever Group, free cash flow (FCF) is defined as cash flow from operating activities, less income taxes paid, net capital expenditures and net interest payments and preference dividends paid. It does not represent residual cash flows entirely available for discretionary purposes; for example, the repayment of principal amounts borrowed is not deducted from FCF. FCF reflects an additional way of viewing our liquidity that we believe is useful to investors because it represents cash flows that could be used for distribution of dividends, repayment of debt or to fund our strategic initiatives, including acquisitions, if any.
The reconciliation of FCF to net profit is as follows:
€ million
2015€ million
2014
Net profit 5,259 5,515Taxation 1,961 2,131Share of net profit of joint ventures/associates and other income from non-current investments (198) (143)
Net finance costs 493 477Depreciation, amortisation and impairment 1,370 1,432Changes in working capital 720 8Pensions and similar obligations less payments (385) (364)Provisions less payments (94) 32Elimination of (profits)/losses on disposals 26 (1,460)Non-cash charge for share-based compensation 150 188Other adjustments 49 38
Cash flow from operating activities 9,351 7,854
Income tax paid (2,021) (2,311)Net capital expenditure (2,074) (2,045)Net interest and preference dividends paid (460) (398)
Free cash flow 4,796 3,100
Net cash flow (used in)/from investing activities (3,539) (341)Net cash flow (used in)/from financing activities (3,032) (5,190)
NET DEBTNet debt is defined as the excess of total financial liabilities, excluding trade and other payables, over cash, cash equivalents and current financial assets, excluding trade and other receivables. It is a measure that provides valuable additional information on the summary presentation of the Group’s net financial liabilities and is a measure in common use elsewhere.
The reconciliation of net debt to the GAAP measure total financial liabilities is as follows:
€ million2015
€ million2014
Total financial liabilities (14,643) (12,722)Current financial liabilities (4,789) (5,536)Non-current financial liabilities (9,854) (7,186)
Cash and cash equivalents as per balance sheet 2,302 2,151Cash and cash equivalents as per cash flow statement 2,128 1,910
Add bank overdrafts deducted therein 174 241
Other current financial assets 836 671
Net debt (11,505) (9,900)
REFRESHMENT 2015vs 2014
2014vs 2013
Underlying sales growth (%) 5.4 3.8Effect of acquisitions (%) 1.3 0.4Effect of disposals (%) (0.7) (1.6)Effect of exchange rates (%) 4.1 (4.6)Turnover growth (%)(a) 10.3 (2.1)(a) Turnover growth is made up of distinct individual growth components
namely underlying sales, currency impact, acquisitions and disposals. Turnover growth is arrived at by multiplying these individual components on a compounded basis as there is a currency impact on each of the other components. Accordingly, turnover growth is more than just the sum of the individual components.
UNDERLYING VOLUME GROWTH (UVG)Underlying volume growth (UVG) is part of USG and means, for the applicable period, the increase in turnover in such period calculated as the sum of (i) the increase in turnover attributable to the volume of products sold; and (ii) the increase in turnover attributable to the composition of products sold during such period. UVG therefore excludes any impact to USG due to changes in prices.
The relationship between the two measures is set out below:
2015vs 2014
2014vs 2013
Underlying volume growth (%) 2.1 1.0Effect of price changes (%) 1.9 1.9Underlying sales growth (%) 4.1 2.9
CORE OPERATING PROFIT AND CORE OPERATING MARGINCore operating profit and core operating margin mean operating profit and operating margin, respectively, before the impact of business disposals, acquisition and disposal related costs, impairments and other one-off items, which we collectively term non-core items, due to their nature and frequency of occurrence.
The reconciliation of core operating profit to operating profit is as follows:
€ million2015
€ million2014
Operating profit 7,515 7,980Acquisition and disposal related cost 105 97(Gain)/loss on disposal of group companies 9 (1,392)Impairments and other one-off items 236 335
Core operating profit 7,865 7,020
Turnover 53,272 48,436Operating margin 14.1% 16.5%Core operating margin 14.8% 14.5%
Further details of non-core items can be found in note 3 on page 98 of the Governance and Financial Report.
CORE EARNINGS PER SHAREThe Group also refers to core earnings per share (core EPS). In calculating core earnings, net profit attributable to shareholders’ equity is adjusted to eliminate the post tax impact of non-core items. Refer to note 7 on page 108 of the Governance and Financial Report for reconciliation of core earnings to net profit attributable to shareholders’ equity.
39Unilever Annual Report and Accounts 2015 Strategic Report

Our business is subject to risks and uncertainties. On the following pages we have identified risks that we regard as the most relevant to our business. These are the risks that we see as material to Unilever’s business and performance at this time. There may be other risks that could emerge in the future. Further details of risks and mitigating factors can be found on pages 53 to 57.
pages 53 to 57 of the Governance and Financial Report
PRINCIPAL RISK DESCRIPTION OF RISKBRAND PREFERENCEAs a branded goods business, Unilever’s success depends on the value and relevance of our brands and products to consumers around the world and on our ability to innovate and remain competitive.
Consumer tastes, preferences and behaviours are constantly changing and Unilever’s ability to anticipate and respond to these changes and to continue to differentiate our brands and products is vital to our business.
We are dependent on creating innovative products that continue to meet the needs of our consumers. If we are unable to innovate effectively, Unilever’s sales or margins could be materially adversely affected.
PORTFOLIO MANAGEMENTUnilever’s strategic investment choices will affect the long-term growth and profits of our business.
Unilever’s growth and profitability are determined by our portfolio of categories, geographies and channels and how these evolve over time. If Unilever does not make optimal strategic investment decisions then opportunities for growth and improved margin could be missed.
SUSTAINABILITYThe success of our business depends on finding sustainable solutions to support long-term growth.
Unilever’s vision to accelerate growth in the business while reducing our environmental footprint and increasing our positive social impact will require more sustainable ways of doing business. This means reducing our environmental footprint while increasing the positive social benefits of Unilever’s activities. We are dependent on the efforts of partners and various certification bodies to achieve our sustainability goals. There can be no assurance that sustainable business solutions will be developed and failure to do so could limit Unilever’s growth and profit potential and damage our corporate reputation.
CUSTOMER RELATIONSHIPSSuccessful customer relationships are vital to our business and continued growth.
Maintaining strong relationships with our existing customers and building relationships with new customers who serve changing shopper habits are necessary to ensure our brands are well presented to our consumers and available for purchase at all times.
The strength of our customer relationships also affects our ability to obtain pricing and competitive trade terms. Failure to maintain strong relationships with customers could negatively impact the terms of business with the affected customers and reduce the availability of our products to consumers.
TALENT & ORGANISATIONA skilled workforce and agile organisation are essential for the continued success of our business.
Our ability to attract, develop, organise and retain the right number of appropriately qualified people is critical if we are to compete and grow effectively.
This is especially true in our key emerging markets where there can be a high level of competition for a limited talent pool. The loss of management or other key personnel or the inability to identify, attract and retain qualified personnel could make it difficult to manage the business and could adversely affect operations and financial results.
SUPPLY CHAINOur business depends on purchasing materials, efficient manufacturing and the timely distribution of products to our customers.
Our supply chain network is exposed to potentially adverse events such as physical disruptions, environmental and industrial accidents or bankruptcy of a key supplier which could impact our ability to deliver orders to our customers.
The cost of our products can be significantly affected by the cost of the underlying commodities and materials from which they are made. Fluctuations in these costs cannot always be passed on to the consumer through pricing.
SAFE AND HIGH QUALITY PRODUCTSThe quality and safety of our products are of paramount importance for our brands and our reputation.
The risk that raw materials are accidentally or maliciously contaminated throughout the supply chain or that other product defects occur due to human error, equipment failure or other factors cannot be excluded.
SYSTEMS AND INFORMATIONUnilever’s operations are increasingly dependent on IT systems and the management of information.
Increasing digital interactions with customers, suppliers and consumers place ever greater emphasis on the need for secure and reliable IT systems and infrastructure and careful management of the information that is in our possession.
Disruption of our IT systems could inhibit our business operations in a number of ways, including disruption to sales, production and cash flows, ultimately impacting our results.
There is also a threat from unauthorised access and misuse of sensitive information. Unilever’s information systems could be subject to unauthorised access or the mistaken disclosure of information which disrupts Unilever’s business and/or leads to loss of assets.
40 Unilever Annual Report and Accounts 2015Strategic Report
OUR PRINCIPAL RISKS

PRINCIPAL RISK DESCRIPTION OF RISKBUSINESS TRANSFORMATIONSuccessful execution of business transformation projects is key to delivering their intended business benefits and avoiding disruption to other business activities.
Unilever is continually engaged in major change projects, including acquisitions and disposals and outsourcing, to drive continuous improvement in our business and to strengthen our portfolio and capabilities.
Failure to execute such transactions or change projects successfully, or performance issues with third party outsourced providers on which we are dependent, could result in under-delivery of the expected benefits. Furthermore, disruption may be caused in other parts of the business.
EXTERNAL ECONOMIC AND POLITICAL RISKS AND NATURAL DISASTERSUnilever operates around the globe and is exposed to a range of external economic and political risks and natural disasters that may affect the execution of our strategy or the running of our operations.
Adverse economic conditions may result in reduced consumer demand for our products, and may affect one or more countries within a region, or may extend globally.
Government actions such as fiscal stimulus and price controls can impact on the growth and profitability of our local operations.
Social and political upheavals and natural disasters can disrupt sales and operations.
In 2015, more than half of Unilever’s turnover came from emerging markets including Brazil, India, Indonesia, Turkey, South Africa, China, Mexico and Russia. These markets offer greater growth opportunities but also expose Unilever to related economic, political and social volatility.
TREASURY AND PENSIONSUnilever is exposed to a variety of external financial risks in relation to Treasury and Pensions.
The relative values of currencies can fluctuate widely and could have a significant impact on business results. Further, because Unilever consolidates its financial statements in euros it is subject to exchange risks associated with the translation of the underlying net assets and earnings of its foreign subsidiaries.
We are also subject to the imposition of exchange controls by individual countries which could limit our ability to import materials paid in foreign currency or to remit dividends to the parent company.
Currency rates, along with demand cycles, can also result in significant swings in the prices of the raw materials needed to produce our goods.
Unilever may face liquidity risk, ie difficulty in meeting its obligations, associated with its financial liabilities. A material and sustained shortfall in our cash flow could undermine Unilever’s credit rating, impair investor confidence and also restrict Unilever’s ability to raise funds.
We are exposed to market interest rate fluctuations on our floating rate debt. Increases in benchmark interest rates could increase the interest cost of our floating rate debt and increase the cost of future borrowings.
In times of financial market volatility, we are also potentially exposed to counter-party risks with banks, suppliers and customers.
Certain businesses have defined benefit pension plans, most now closed to new employees, which are exposed to movements in interest rates, fluctuating values of underlying investments and increased life expectancy. Changes in any or all of these inputs could potentially increase the cost to Unilever of funding the schemes and therefore have an adverse impact on profitability and cash flow.
ETHICALActing in an ethical manner, consistent with the expectations of customers, consumers and other stakeholders, is essential for the protection of the reputation of Unilever and its brands.
Unilever’s brands and reputation are valuable assets and the way in which we operate, contribute to society and engage with the world around us is always under scrutiny both internally and externally. Despite the commitment of Unilever to ethical business and the steps we take to adhere to this commitment, there remains a risk that activities or events cause us to fall short of our desired standard, resulting in damage to Unilever’s corporate reputation and business results.
LEGAL AND REGULATORYCompliance with laws and regulations is an essential part of Unilever’s business operations.
Unilever is subject to national and regional laws and regulations in such diverse areas as product safety, product claims, trademarks, copyright, patents, competition, employee health and safety, the environment, corporate governance, listing and disclosure, employment and taxes.
Failure to comply with laws and regulations could expose Unilever to civil and/or criminal actions leading to damages, fines and criminal sanctions against us and/or our employees with possible consequences for our corporate reputation.
Changes to laws and regulations could have a material impact on the cost of doing business. Tax, in particular, is a complex area where laws and their interpretation are changing regularly, leading to the risk of unexpected tax exposures. International tax reform remains a key focus of attention with the OECD’s Base Erosion & Profit Shifting project and the EU’s action plan for fair and efficient corporation taxation.
41Unilever Annual Report and Accounts 2015 Strategic Report

DEAR SHAREHOLDERS,As the new Compensation Committee Chair, I am pleased to present Unilever’s 2015 Directors’ Remuneration Report. I outline below our performance and the decisions we have made on remuneration, all of which have been made in the context of the Committee’s long-held remuneration principles, as set out on page 68 of the Governance and Financial Report.
BUSINESS PERFORMANCE AND REMUNERATION OUTCOMES FOR 2015ANNUAL BONUS – ANOTHER YEAR OF CONSISTENT PERFORMANCE DELIVERYDespite a continuing tougher external environment, 2015 saw a good delivery of our targets for financial performance, operational excellence and sustainable development. Unilever’s efforts to deliver sharper category strategies, greater focus on the core and the sustained investments we are making behind our innovations have improved growth. Despite the increasingly volatile environment, we achieved underlying sales growth of 4.1% with a step-up in volume growth and have continued to grow ahead of our markets. By challenging our costs and taking out any non-value-added activity that is not helping to build the business, we delivered core operating margin improvement of 0.3 percentage points.
In 2015 the Committee decided to focus on the importance of cash generation in view of lower global growth rates by replacing underlying volume growth with growth in free cash flow (FCF). For the purpose of the annual bonus calculations, we adjusted FCF delivery from €4.8 billion for one-offs to €4.3 billion (up €0.4 billion from last year). On a formulaic basis the outcome of Unilever’s 2015 performance was 118% of target. Adjusting for quality of results and relative performance, the Committee agreed an above-par 2015 annual bonus outcome of 110% of target. The Committee believes this represents a fair assessment of Unilever’s overall performance over 2015. Personal performance of the Executive Directors has been recognised by the Committee through the remuneration outcomes for 2015 with a bonus of 185% of salary (92% of maximum) for the CEO, Paul Polman, and a bonus of 110% of salary (73% of maximum) for the former CFO, Jean-Marc Huët.
GLOBAL SHARE INCENTIVE PLAN (GSIP) AND MANAGEMENT CO-INVESTMENT PLAN (MCIP) – SUSTAINED PERFORMANCE DELIVERYOver the past three years, Unilever has delivered consistent financial performance. Underlying sales growth during this period was 3.8% per annum and core operating margin improvement over the period was an average of 0.37 percentage points per year, demonstrating management’s drive for consistent top and bottom line growth. Unilever also generated strong operating cash in the period, with cumulative operating cash flow of €16.6 billion. Total shareholder return (TSR) over this three-year period was below the performance of many of our peers and, as such, no part of the GSIP and MCIP awards related to TSR will vest. On the basis of this performance, the Committee determined that the GSIP and MCIP awards to the end of 2015 will vest at 98% of initial award levels (ie 49% of maximum for GSIP and 65% of maximum for MCIP (which is capped at 150% for the Executive Directors)).
EXECUTIVE DIRECTOR CHANGESJean-Marc Huët stepped down from the role of CFO and Executive Director on 1 October 2015. Graeme Pitkethly became CFO on that same date and he will be proposed for election to the Boards at the AGMs in April 2016. In line with our shareholder-approved Remuneration Policy, Jean-Marc Huët was treated as a ‘good leaver’ for 2013-2015 GSIP and MCIP awards with performance conditions to be measured at the normal vesting date and awards
being pro-rated for length of service. Full details of the payment relating to Jean-Marc Huët’s cessation of employment are set out on page 78. Graeme Pitkethly’s remuneration for his role as Executive Director with effect from the 2016 AGMs is structured wholly in line with our Remuneration Policy and details are set out on page 69.
REMUNERATION FOR 2016In accordance with our Remuneration Policy, the base salary of Executive Directors is reviewed every year. The Committee undertook this review in November 2015. Based on his firmly established and sustained track record of good performance, the Committee believes further increases to the CEO’s salary would be justified. However, it agreed to Paul Polman’s request to not increase his base salary in light of his view that the CEO should be rewarded through performance-based pay rather than a salary increase. Annual bonus opportunity and GSIP and MCIP award levels will remain unchanged. The fees for the current Chairman and Non-Executive Directors will also be unchanged for 2016.
STRATEGIC LINKAGE OF REWARD TO BUSINESS PERFORMANCEIn preparation for the 2016 annual bonus and long-term incentive plan awards, the Committee has undertaken a review of the performance measures and targets that will determine vesting of these awards. Unilever’s success is driven by continued focus on delivering consistent and competitive growth in a sustainable and profitable manner. Accordingly, underlying sales growth and core operating margin improvement are key measures in our annual bonus plan and long-term executive incentive plans. Cash flow generation remains central to the success of the business in terms of both returns to shareholders and investment for future growth and therefore remains a performance measure in both our annual bonus plan (free cash flow) and long-term incentive plans (operating cash flow). The Committee therefore concluded that the performance measures for our 2016 annual bonus plan and for the 2016-2018 performance cycle of our long-term executive incentive plans should remain unchanged. For reasons of commercial sensitivity the target ranges for our performance measures will be disclosed together with the outcomes of incentive plans at the end of the respective performance periods.
REMUNERATION FRAMEWORKHaving considered various alternatives, the Committee decided not to make material changes to Unilever’s remuneration framework or Remuneration Policy for 2016. The current remuneration framework has served Unilever well and this view is endorsed generally by the majority of our largest shareholders whom Michael Treschow and I met in September 2015. Nonetheless, in advance of the renewal of Unilever’s Remuneration Policy and the GSIP in 2017, we are continuing the process with a further full review of our remuneration framework in 2016.
This will ensure that future remuneration arrangements are fully aligned with our long-term strategy to deliver value to shareholders and that performance measures for incentive plans are transparent and fully aligned with our business plans. The Committee’s views on this will be developed over the coming months and I look forward to consulting our shareholders and receiving feedback in shaping our proposals to extend, modify or replace our Remuneration Policy at the 2017 AGMs.
Ann Fudge Chair of the Compensation Committee
42 Unilever Annual Report and Accounts 2015Strategic Report
SUMMARY REMUNERATION REPORTCHAIRMAN’S LETTER

The following sets out how Unilever’s Remuneration Policy, to be found at www.unilever.com/ara2015/downloads, was implemented in 2015. Further details of remuneration can be found on pages 66 to 83 of the Governance and Financial Report.
SINGLE FIGURE OF REMUNERATION IN 2015 FOR EXECUTIVE DIRECTORS (AUDITED)The table below shows a single figure of remuneration for each of our Executive Directors, for the years 2014 and 2015.
Base salary and fixed allowance are set in sterling and remain unchanged from 2014 through 2015, please read the notes below the table for more information
Paul Polman CEO (UK)(€’000)
Jean-Marc Huët CFO (UK)(€’000)
2015 2014 2015 (a) 2014
(A) Base salary (b) 1,392 1,251 738 885(B) Fixed allowances and other benefits (c) 901 787 273 377(C) Annual bonus 2,573 1,652 812 778
Long-term incentives(D) MCIP matching shares – (required by UK law) 1,972 1,803 382 370(E) GSIP performance shares – (required by UK law) 3,404 3,923 1,820 3,022
Long-term incentives (sub-total) 5,376 5,726 2,202 3,392(F) Conditional supplemental pension (d) 161 145 n/a n/a
Total remuneration paid – (required by UK law) (A+B+C+D+E+F) 10,403 9,561 4,025 5,432
(G) Share awards (required by Dutch law) (e) 3,274 4,206 573 2,249
Total remuneration paid – (required by Dutch law) (A+B+C+F+G) 8,301 8,041 2,396 4,289
Where relevant, amounts for 2015 have been translated into euros using the average exchange rate over 2015 (€1 = £0.7254). Amounts for 2014 have been translated into euros using the average exchange rate over 2014 (€1 = £0.8071), excluding amounts in respect of MCIP and GSIP which have been translated into euros using the exchange rate at vesting date of 17 February 2015 (€1 = £0.7383).(a) The 2015 figures relate to amounts paid or payable to Jean-Marc Huët for his services between 1 January 2015 and 1 October 2015, the date that Jean-Marc Huët
ceased to be CFO and an Executive Director of Unilever. Details regarding his leaving arrangements can be found on page 78 of the Governance and Financial Report.(b) Salary set in sterling and paid in 2015: CEO – £1,010,000 and CFO – £535,500.(c) Includes the fixed allowance, medical insurance cover and actual tax return preparation costs, provision of death-in-service benefits and administration, and
payment to protect against differences between employee social security obligations in country of residence versus UK (not applicable to Jean-Marc Huët).(d) Conditional supplemental pension provision agreed with Paul Polman on hiring, which is conditional on his remaining in employment with Unilever to age 60 and
subsequently retiring from active service or his death or total disability prior to retirement. This was £117,123, based on 12% of a capped salary of £976,028 for 2015. (e) As per the Dutch requirements, these costs are non-cash costs and relate to the expenses recognised for the period following IFRS 2. This is based on share
prices on grant dates, a 98% adjustment factor for GSIP shares and MCIP matching shares awarded in 2015, 2014 and 2013.
SINGLE FIGURE OF REMUNERATION IN 2015 FOR NON-EXECUTIVE DIRECTORS (AUDITED)The table below shows a single figure of remuneration for each of our Non-Executive Directors, for the years 2014 and 2015.
2015 2014
Non-Executive DirectorFees(a)
€’000Benefits(b)
€’000
Total remuneration
€’000Fees(a)
€’000Benefits(b)
€’000
Total remuneration
€’000
Michael Treschow(c) 732 2 734 654 3 657Nils Andersen 75 4 79 n/a n/a n/aLaura Cha 122 – 122 101 – 101Vittorio Colao 57 – 57 n/a n/a n/aLouise Fresco(d) 126 – 126 113 – 113Ann Fudge(e) 149 – 149 101 11 112Charles Golden(f) n/a n/a n/a 42 – 42Byron Grote(g) 47 – 47 125 – 125Judith Hartmann 80 – 80 n/a n/a n/aMary Ma 120 – 120 107 – 107Hixonia Nyasulu 120 – 120 107 – 107Sir Malcolm Rifkind(g) 38 – 38 101 – 101John Rishton(h) 133 – 133 107 – 107Feike Sijbesma(i) 126 1 127 15 1 16Kees Storm(g) 73 – 73 196 3 199Paul Walsh(g) 42 – 42 113 2 115
Total 2,040 7 2,047 1,882 20 1,902(a) This includes fees received from NV in euros and PLC in sterling for 2014
and 2015 respectively. Includes basic Non-Executive Director fee and Committee chairmanship and/or membership.
(b) The only benefit received relates to travel by spouses or partners where they are invited by Unilever.
(c) Chairman.
(d) Chair, Corporate Responsibility Committee.(e) Vice-Chairman and Chair of the Compensation Committee. (f) Chose not to put himself forward for re-election at the May 2014 AGMs.(g) Chose not to put himself forward for re-election at the April 2015 AGMs.(h) Chair, Audit Committee.(i) Chair, Nominating and Corporate Governance Committee.
43Unilever Annual Report and Accounts 2015 Strategic Report
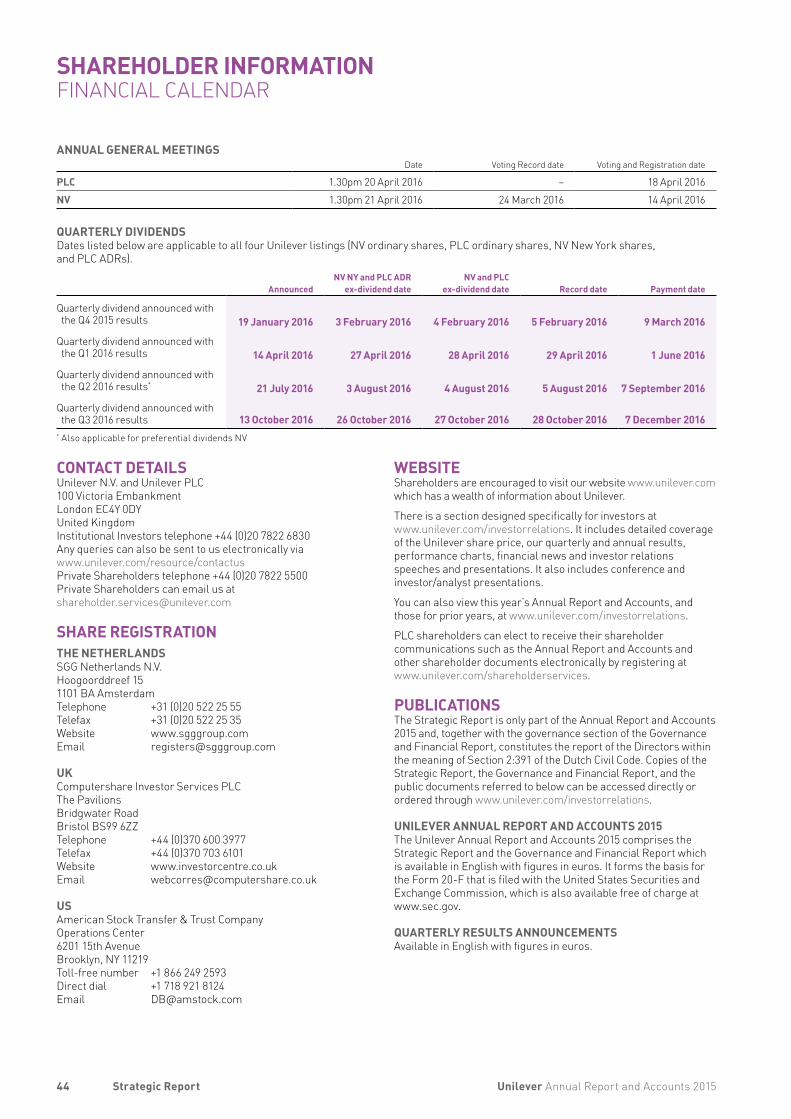
ANNUAL GENERAL MEETINGSDate Voting Record date Voting and Registration date
PLC 1.30pm 20 April 2016 – 18 April 2016 NV 1.30pm 21 April 2016 24 March 2016 14 April 2016
QUARTERLY DIVIDENDSDates listed below are applicable to all four Unilever listings (NV ordinary shares, PLC ordinary shares, NV New York shares, and PLC ADRs).
Announced NV NY and PLC ADR
ex-dividend dateNV and PLC
ex-dividend date Record date Payment date
Quarterly dividend announced with the Q4 2015 results 19 January 2016 3 February 2016 4 February 2016 5 February 2016 9 March 2016
Quarterly dividend announced with the Q1 2016 results 14 April 2016 27 April 2016 28 April 2016 29 April 2016 1 June 2016
Quarterly dividend announced with the Q2 2016 results* 21 July 2016 3 August 2016 4 August 2016 5 August 2016 7 September 2016
Quarterly dividend announced with the Q3 2016 results 13 October 2016 26 October 2016 27 October 2016 28 October 2016 7 December 2016
* Also applicable for preferential dividends NV
CONTACT DETAILSUnilever N.V. and Unilever PLC 100 Victoria Embankment London EC4Y 0DY United Kingdom Institutional Investors telephone +44 (0)20 7822 6830 Any queries can also be sent to us electronically via www.unilever.com/resource/contactus Private Shareholders telephone +44 (0)20 7822 5500 Private Shareholders can email us at [email protected]
SHARE REGISTRATIONTHE NETHERLANDSSGG Netherlands N.V. Hoogoorddreef 15 1101 BA Amsterdam Telephone +31 (0)20 522 25 55 Telefax +31 (0)20 522 25 35 Website www.sgggroup.com Email [email protected]
UKComputershare Investor Services PLC The Pavilions Bridgwater Road Bristol BS99 6ZZ Telephone +44 (0)370 600 3977 Telefax +44 (0)370 703 6101 Website www.investorcentre.co.uk Email [email protected]
USAmerican Stock Transfer & Trust Company Operations Center 6201 15th Avenue Brooklyn, NY 11219 Toll-free number +1 866 249 2593 Direct dial +1 718 921 8124 Email [email protected]
WEBSITEShareholders are encouraged to visit our website www.unilever.com which has a wealth of information about Unilever.
There is a section designed specifically for investors at www.unilever.com/investorrelations. It includes detailed coverage of the Unilever share price, our quarterly and annual results, performance charts, financial news and investor relations speeches and presentations. It also includes conference and investor/analyst presentations.
You can also view this year’s Annual Report and Accounts, and those for prior years, at www.unilever.com/investorrelations.
PLC shareholders can elect to receive their shareholder communications such as the Annual Report and Accounts and other shareholder documents electronically by registering at www.unilever.com/shareholderservices.
PUBLICATIONSThe Strategic Report is only part of the Annual Report and Accounts 2015 and, together with the governance section of the Governance and Financial Report, constitutes the report of the Directors within the meaning of Section 2:391 of the Dutch Civil Code. Copies of the Strategic Report, the Governance and Financial Report, and the public documents referred to below can be accessed directly or ordered through www.unilever.com/investorrelations.
UNILEVER ANNUAL REPORT AND ACCOUNTS 2015The Unilever Annual Report and Accounts 2015 comprises the Strategic Report and the Governance and Financial Report which is available in English with figures in euros. It forms the basis for the Form 20-F that is filed with the United States Securities and Exchange Commission, which is also available free of charge at www.sec.gov.
QUARTERLY RESULTS ANNOUNCEMENTSAvailable in English with figures in euros.
44 Unilever Annual Report and Accounts 2015Strategic Report
SHAREHOLDER INFORMATIONFINANCIAL CALENDAR

CAUTIONARY STATEMENTThis document may contain forward-looking statements, including ‘forward-looking statements’ within the meaning of the United States Private Securities Litigation Reform Act of 1995. Words such as ‘will’, ‘aim’, ‘expects’, ‘anticipates’, ‘intends’, ‘looks’, ‘believes’, ‘vision’, or the negative of these terms and other similar expressions of future performance or results, and their negatives, are intended to identify such forward-looking statements. These forward-looking statements are based upon current expectations and assumptions regarding anticipated developments and other factors affecting the Unilever Group (the “Group”). They are not historical facts, nor are they guarantees of future performance.
Because these forward-looking statements involve risks and uncertainties, there are important factors that could cause actual results to differ materially from those expressed or implied by these forward-looking statements. Among other risks and uncertainties, the material or principal factors which could cause actual results to differ materially are: Unilever’s global brands not meeting consumer preferences; Unilever’s ability to innovate and remain competitive; Unilever’s investment choices in its portfolio management; inability to find sustainable solutions to support long-term growth; customer relationships; the recruitment and retention of talented employees; disruptions in our supply chain; the cost of raw materials and commodities; the production of safe and high quality products; secure and reliable IT infrastructure; successful execution of acquisitions, divestitures and business transformation projects; economic and political risks and natural disasters; financial risks; failure to meet high and ethical standards; and managing regulatory, tax and legal matters.
These forward-looking statements speak only as of the date of this document. Except as required by any applicable law or regulation, the Group expressly disclaims any obligation or undertaking to release publicly any updates or revisions to any forward-looking statements contained herein to reflect any change in the Group’s expectations with regard thereto or any change in events, conditions or circumstances on which any such statement is based.
Further details of potential risks and uncertainties affecting the Group are described in the Group’s filings with the London Stock Exchange, Euronext Amsterdam and the US Securities and Exchange Commission, including in the Group’s Annual Report on Form 20-F for the year ended 31 December 2015 and the Annual Report and Accounts 2015.
This document is not prepared in accordance with US GAAP and should not therefore be relied upon by readers as such. The Group’s Annual Report on Form 20-F for 2015 is separately filed with the US Securities and Exchange Commission and is available on our corporate website www.unilever.com.
In addition, a printed copy of the Annual Report on Form 20-F is available, free of charge, upon request to Unilever, Investor Relations Department, 100 Victoria Embankment, London EC4Y 0DY, United Kingdom.
This report comprises regulated information within the meaning of Sections 1:1 and 5:25c of the Act on Financial Supervision (“Wet op het financieel toezicht (Wft)”) in the Netherlands.
The brand names shown in this report are trademarks owned by or licensed to companies within the Group.
References in this document to information on websites (and/or social media sites) are included as an aid to their location and such information is not incorporated in, and does not form part of, the Annual Report and Accounts 2015 or Annual Report on Form 20-F with the exception of the explanations and disclaimers which can be accessed via KPMG’s website: www.kpmg.com/uk/auditscopeukco2014b, which is incorporated into the Auditors’ Reports in the Annual Report and Accounts 2015 as if set out in full.
Designed and produced by Unilever Communications in conjunction with Addison Group at www.addison-group.net.
Photography by Frank Aiello, Liam Arthur, Namas Bhojani, Rahmat Budi, Benoît Delamare, Oliver Edwards, Igor Emmerich, Andrew Esiebo, Caio Gallucci, Philip Gatward, Michael Heffernan, Ifeanyi Iloduba, Alberto Martin, Philip Reeson, Frédéric Remouchamps, Claudio Sforza, Hazel Thompson, Rian Ardi Wakito, Jessie Watford, James Woolley, Cubo.cc, Getty, Shutterstock and from the Unilever image library.
Zero-based budgeting graphic on page 12 owned by Accenture.
Printed at Pureprint Group, ISO 14001. FSC® certified and CarbonNeutral®.
This document is printed on Amadeus 100% Recycled Silk. This paper has been exclusively supplied by Denmaur Independent Papers which has offset the carbon produced by the production and delivery of it to the printer.
This paper is 100% recycled and manufactured using de-inked post-consumer waste. All the pulp is bleached using an elemental chlorine free process (ECF). Printed in the UK by Pureprint using its alcofree® and pureprint® environmental printing technology. Vegetable inks were used throughout. Pureprint is a CarbonNeutral® company. Both the manufacturing mill and the printer are registered to the Environmental Management System ISO 14001 and are Forest Stewardship Council® (FSC) chain-of-custody certified.
If you have finished with this document and no longer wish to retain it, please pass it on to other interested readers or dispose of it in your recycled paper waste. Thank you.

UNILEVER N.V.Head Office and Registered Office Weena 455, PO Box 760 3000 DK Rotterdam The Netherlands T +31 (0)10 217 4000Commercial Register Rotterdam Number: 24051830
UNILEVER PLCHead Office 100 Victoria Embankment London EC4Y 0DY United Kingdom T +44 (0)20 7822 5252 Registered Office Unilever PLC Port Sunlight Wirral Merseyside CH62 4ZD United KingdomRegistered in England and Wales Company Number: 41424
FOR FURTHER INFORMATION ABOUT UNILEVER PLEASE VISIT OUR WEBSITE:WWW.UNILEVER.COM