Embed Size (px)
Citation preview
Eleventh USA/Europe Air Traffic Management Research and Development Seminar (ATM2015)
Strategic Planning of Efficient Oceanic Flights
Banavar Sridhar and Neil Y. Chen NASA Ames Research Center
Moffett Field, CA, USA
Olga Rodionova and Daniel Delahaye Ecole Nationale de l’Aviation Civile (ENAC)
Toulouse, France
Hok K. Ng University of California Santa Cruz, CA, USA
Florian Linke DLR Air Transportation System
Hamburg, Germany
Abstract— The efficiency of oceanic flights is low due to limited navigational and communication equipment, congestion and airspace restrictions. The availability of Automated Dependent Surveillance-Broadcast (ADS-B) and other improvements provides opportunity for better strategic planning of trajectories. Transatlantic flights between US and Europe constitute one of the busiest oceanic airspace regions in the world. This paper examines the benefits of a wind-optimal trajectory concept with a strategic de-confliction component compared to the current flight planning using the North Atlantic Tracks. The methodology generates a wind-optimal route for each aircraft and a strategic reduction in the potential conflicts between aircraft by a combination of small adjustments to departure times and rerouting. The de-confliction is achieved by optimization techniques involving simulated annealing with local gradient searching. The fuel burn for the tracks in today’s Organized Track System are compared with the corresponding quantities for the wind-optimized routes to evaluate the potential benefits of flying wind-optimal routes in North Atlantic Airspace. The analysis is based on air traffic between US and Europe during July 2012. The potential fuel savings depend on existing inefficiencies in current flight plans, atmospheric conditions and location of the city-pairs. The paper provides both aggregate results and detailed examination of some of the most popular city-pairs. Results show that strategic planning can improve the efficiency of flight trajectories by 3 to 5% depending on city-pairs and aircraft type. This translates into a potential fuel savings in the range of (420-970) kg per flight for a Boeing 767-300, the most widely used aircraft between the city-pairs in this study.
Keywords- energy efficiency; oceanic flights; air traffic simulation; wind-optimal routes; North Atlantic Track System
I. INTRODUCTION The cruise phase of the aircraft uses the majority of fuel
consumed and airline operations have focused on reducing the cost of fuel and crew time during this phase of flight. Currently, aircraft cruise along a horizontal route following a predetermined altitude and speed profile. The selection of the horizontal route, altitude and speed profiles is made to accommodate several factors like terminal area constraints, congested airspace, restricted airspace and weather disturbances. The resulting aircraft trajectory consumes more
fuel and produces more emissions than optimal four-dimensional trajectories. Several studies have described the inefficiencies of the current routing structure and benefits that can be realized by enabling technology to move towards wind-optimal routes [1-3]. A recent study using air traffic data covering flights to/from the top 34 airports in the continental United States during 2007 estimated that the routes used by aircraft were 2.9% longer than the direct routes between these city-pairs. The corresponding figure for traffic between the top 34 city-pairs in Europe was 4% [4]. The extra distance travelled over direct routes is significantly higher over US-Europe oceanic airspace due to the lack of radar surveillance, VHF radio communication coverage and general reliance on procedural separation. Similarly flights from Europe to Asia suffer large excess track distances due to large restricted airspace, strict entry/exit points and terrain.
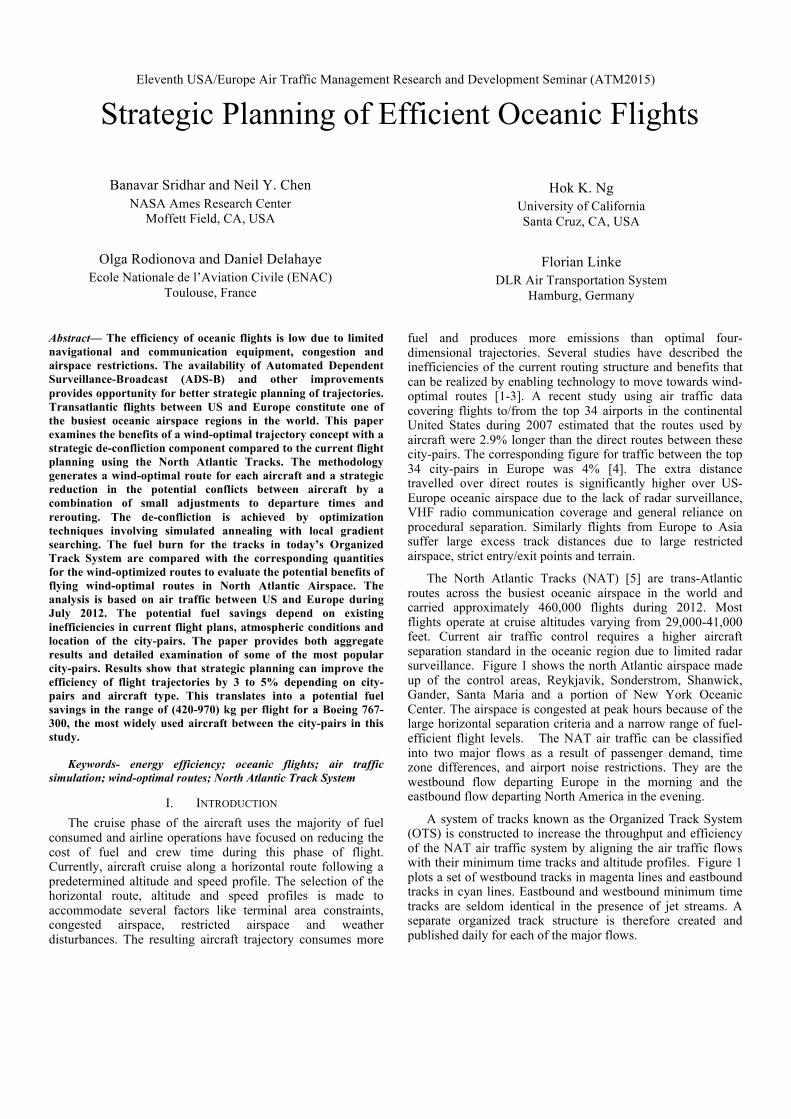
The North Atlantic Tracks (NAT) [5] are trans-Atlantic routes across the busiest oceanic airspace in the world and carried approximately 460,000 flights during 2012. Most flights operate at cruise altitudes varying from 29,000-41,000 feet. Current air traffic control requires a higher aircraft separation standard in the oceanic region due to limited radar surveillance. Figure 1 shows the north Atlantic airspace made up of the control areas, Reykjavik, Sonderstrom, Shanwick, Gander, Santa Maria and a portion of New York Oceanic Center. The airspace is congested at peak hours because of the large horizontal separation criteria and a narrow range of fuel-efficient flight levels. The NAT air traffic can be classified into two major flows as a result of passenger demand, time zone differences, and airport noise restrictions. They are the westbound flow departing Europe in the morning and the eastbound flow departing North America in the evening.
A system of tracks known as the Organized Track System (OTS) is constructed to increase the throughput and efficiency of the NAT air traffic system by aligning the air traffic flows with their minimum time tracks and altitude profiles. Figure 1 plots a set of westbound tracks in magenta lines and eastbound tracks in cyan lines. Eastbound and westbound minimum time tracks are seldom identical in the presence of jet streams. A separate organized track structure is therefore created and published daily for each of the major flows.
There is extensive literature on developing optimal trajectories for an aircraft that minimizes a cost function while satisfying constraints [6]. The aircraft models vary in complexity and the optimization is done with or without wind. Some of the cost functions used in the analysis are minimum fuel, minimum time and minimize direct operating cost. There are several methods to avoid bad weather and traffic congestion [7]. Due to computational complexity, most of the system-wide benefits analysis has been done under no wind conditions [1].
Due to lack of surveillance, the horizontal separation in the oceanic airspace depends on the avionics carried by the lowest equipped aircraft in the aircraft-pair and could be as large as 80 to 100 nmi compared to 5 nmi in the continental US. The large separation standard between aircraft prevents aircraft from climbing to their optimum cruising altitude resulting in both reduced fuel efficiency and congestion of the airspace. Several constraints affecting the current oceanic operations are being removed by the changes to the system being proposed in US and Europe [8]. Several papers have discussed relaxation of separation standards with the availability of Automated Dependent Surveillance-Broadcast (ADS-B) in the oceanic airspace [9-11]. A benefits analysis of different separation standards in US Oakland Oceanic Airspace is reported in [12]. Strategic Flow Management (SFM), dynamic weather rerouting, ADS-B based aircraft separation and tailored arrivals and departures can improve the oceanic airspace operational efficiency.
This paper evaluates the potential benefits of strategic flow management in North Atlantic Oceanic Airspace (NAOA) with respect to fuel efficiency and emissions. SFM consists of two parts. First, a trajectory optimization algorithm [7] is applied to trans-Atlantic flights in cruise to generate wind optimal trajectories. Flying wind-optimal heading minimizes aircraft
travel time, fuel burn and associated emissions during cruise. The second part removes any potential loss of separation between pairs of aircraft trajectories by small adjustments to departure times and small deviations from the optimized trajectory. These changes are realized by a combination of simulated annealing and local gradient searches [13]. The strategic conflict-free trajectories are used to evaluate the system-wide benefits analysis of wind-optimal transatlantic aircraft operations. Major contributions of the paper are the use of wind and its variations in developing and evaluating the potential benefits of strategic flow management of air traffic in NAOA. The study provides both aggregate results at the system-level and specific results for most heavily travelled city-pairs. It identifies city pairs with highest benefit potential and challenges. The paper provides groundwork for NASA research in advancing oceanic and global aircraft operations and also inputs to the impact of aviation emissions.
Section II presents an aircraft trajectories simulation for trans-Atlantic flights. Section III provides a comparison between wind-optimal routes and current aircraft trajectories for all flights for a month. Section IV describes the reduction of potential conflicts during strategic planning. Section V presents de-confliction results. Conclusions and future work are described in Section VI.
II. SIMULATION OF BASELINE AND WIND-OPTIMAL ROUTES
This section provides an overview of the simulation of the baseline trajectory and wind-optimal trajectory.
To study the optimization potential of north Atlantic flight routings with respect to fuel burn and climate impact a database has to be created that contains baseline flight route information that can be analyzed with actual weather data. Prior to takeoff airline dispatchers have to file a flight plan providing aircraft specific information, route data, as well as the mass distribution and required amount of fuel. The planned route is strategic in nature and does not contain any route deviations due to aircraft avoidance measures or weather. Possible sources for such track data are point profiles recorded by EUROCONTROL’s Network Manager (NM) and the corresponding US recorded flight tracks in FAA’s Traffic Flow Management System (TFMS). The two complementary databases were combined to form a more accurate flight track database. These tracks are referred to as merged flight track in subsequent discussions. This database can be used to assess the benefits of SFM by comparing it with the baseline trajectories.
Trajectory optimization in this analysis is conducted for fixed cruise altitudes using filed cruise speeds. The horizontal trajectory is optimized by determining the heading angle that minimizes travel time in the presence of winds and the details of the optimization approach are provided in [7]. Numerical algorithms such as collocation methods or interpolation techniques can be applied to determine the optimal initial aircraft heading. In the case where an aircraft cruises at a single altitude, the minimum-time trajectory is completely specified by integrating the aircraft dynamic equations simultaneously from the origin to the destination using the optimal initial aircraft heading. Note that the minimum-time trajectory is fuel-optimal for aircraft cruise at a constant altitude. Long flights
Figure 1. North Atlantic Airspace with OTS and Oceanic control areas.

typically change their cruise altitude en route. A practical approach to generating wind-optimal trajectories with multiple cruise altitudes is described in an earlier paper [14].
Aircraft trajectories are computed using wind-data provided by the Global Forecasting System (GFS). GFS is a global numerical weather prediction computer model run by the National Oceanic & Atmospheric Administration four times a day. It produces forecasts up to 16 days, and produces a forecast for every 3rd hour for the first 180 hours, and after that, every 12 hours. The horizontal resolution is roughly equivalent to 0.5×0.5 degree latitude/longitude. GFS data has 64 unequally spaced vertical isobaric pressure levels ranging between 0.25-1000 mb, with enhanced resolution at low and high altitude. Figure 2 shows wind-optimal trajectories for the trans-Atlantic flights on July 15, 2012. The wind-optimal trajectories across the North Atlantic ocean can be classified into two major flows due to the presence of jet streams. The westbound flow originating from Europe is located north of eastbound flow originating from North America. NATs are designed daily aiming at aligning the trans-Atlantic traffic with the wind-optimal routes for increasing the throughput and efficiency of air traffic system.
III. COMPARISON BETWEEN OF BASELINE AND WIND-OPTIMAL ROUTES
Section III. A discusses the setup for simulation and comparison of flight trajectories along the wind-optimal routes and the actual flight tracks for a trans-Atlantic flight from Newark, NJ to Frankfurt, Germany. Section III. B assesses the daily variations of potential wind-optimal savings for the westbound and the eastbound trans-Atlantic flights between Newark and Frankfurt. Section III. C presents the potential fuel benefits resulting from wind-optimal trajectories for the 10 busiest trans-Atlantic airport pairs. Section III. D ranks the top 100 airport pairs by most potential fuel savings. The estimated mean fuel burn for the trans-Atlantic flight tracks and the potential fuel burn savings for the common aircraft types are presented for the 10 busiest trans-Atlantic airport pairs.
A. Trans-Atlantic Flights from Newark to Frankfurt Flight trajectories are simulated for a trans-Atlantic flight
from Newark (KEWR) to Frankfurt (EDDF) based on the wind-optimal route and the merged flight track. The horizontal paths for the wind-optimal and the merged track are shown Figure 3. The wind-optimal trajectory is calculated at a constant cruise altitude equivalent to the filed cruise altitude for the flight. In general, a long-haul flight performs en-route step climbs to the fuel-optimal cruise altitudes due to continuous aircraft weight reduction caused by aircraft fuel consumption. The flight simulation in this paper neglects the en-route step climbs. The flight trajectories during initial takeoff, cruise and landing are simulated using the typical aircraft profiles for a Boeing 757-200 with medium takeoff weight based on Eurocontrol’s Base of Aircraft Data Revision 3.6 (BADA) [15]. The travel time for the wind-optimal trajectory is 393 minutes and the fuel burn is 21,282 kg. The wind-optimal fuel consumption is 2.3% less than that of the trajectories based on the merged track.
In addition to establishing a baseline for the current routes, a system-wide evaluation of the benefits of flying wind-optimal trajectories requires choices to be made in the selection of aircraft aerodynamic and fuel flow models. This is dictated by both the availability and accuracy of the models. The aircraft fuel flow model [15] used in this analysis performs well in cruise and later versions of the model have substantial improvements to fuel flow performance in climb and descent. The uncertainty of estimated savings resulting from simplified aircraft simulation and imperfect flight track is approximately 1% [16].
B. Potential Savings Daily between KEWR and EDDF The flight simulation is extended for all trans-Atlantic
flights from Newark (KEWR) to Frankfurt (EDDF) during July 2012 based on the wind-optimal routes and the actual flight tracks. Figure 4 plots the potential fuel savings for the wind-optimal trajectories for each day during July 2012. The fuel burns are calculated based on aircraft type for all flights operating between the airport pair in the period. The potential
Figure 2. The wind-optimal trajectories for trans-Atlantic flights on July 15, 2012.

wind-optimal savings are measured in terms of percent fuel reduction on average for the eastbound and westbound flights, respectively. The mean fuel savings for the entire month is 2.4% for the eastbound flights and 2.2% for the westbound flights. Eastbound flights have savings that varied from 0.5% to 8.1% with 1.8% standard deviation over the period. Westbound flights have a relatively narrow range between 0.5% and 4.2% with 1% standard deviation over the period. These results suggest that fewer westbound flights deviated far away from the wind-optimal routes. Note that westbound trans-Atlantic flights operate in the presence of strong head winds that are penalized with higher fuel burn for not flying optimal routes. The potential amount of fuel burn saved from a wind-optimal route depends on the aircraft type and the direction of trans-Atlantic air traffic. These results will be investigated in Section III. D.
The percent fuel savings varies depending on the air traffic and weather conditions over the period. The traffic patterns and the weather conditions for the days that have higher fuel savings identify conditions under which wind-optimal operations provide higher benefits. The next section extends the analysis to cover all trans-Atlantic flights that operated in July 2012.
C. Potential Wind-optimal Benefits for 10 Busiest Airport Pairs The wind-optimal and flight track-based trajectories are
generated for trans-Atlantic air traffic for the entire month of July 2012. The results are used to assess the potential fuel benefits resulting from wind-optimal trajectories for various airport pairs and aircraft types over this period. A total of 30,354 trans-Atlantic flights, approximately 1000 per day, are selected for this study based on all the information needed to make the wind-optimal computations. There are 15,819 eastbound and 14,535 westbound flights for this month.
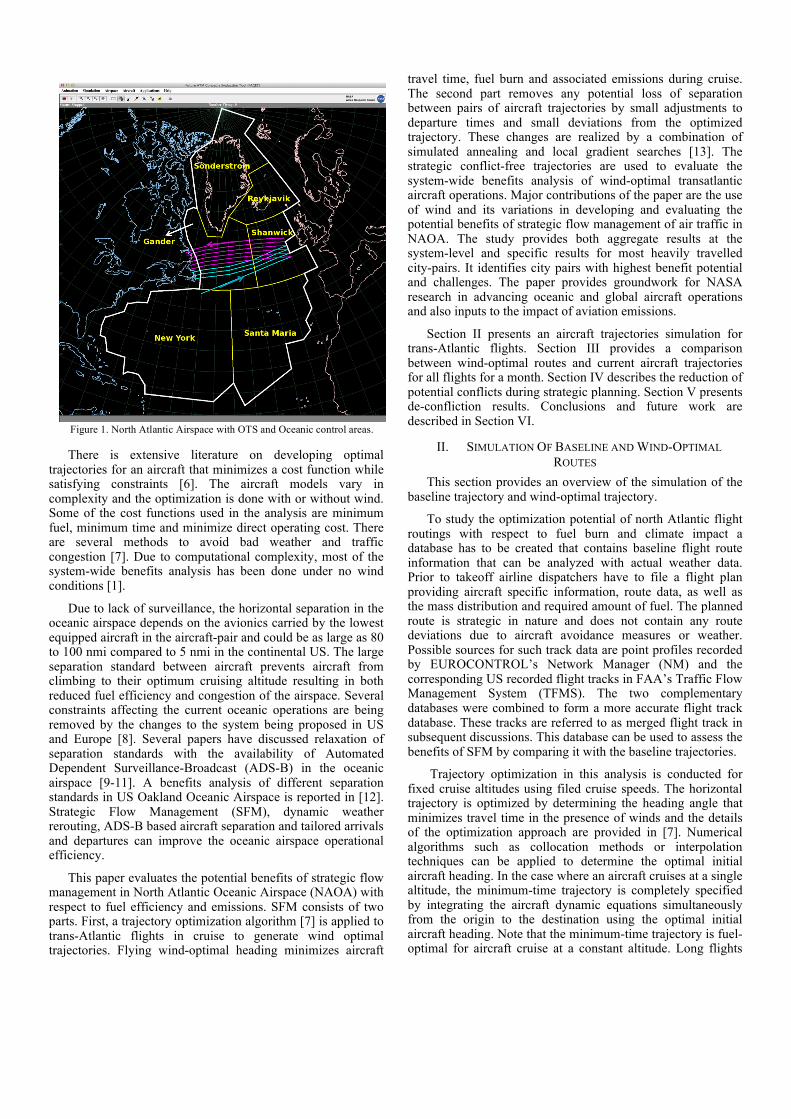
The 10 busiest airport pairs are listed in Table 1. The airports are ranked by the total number of eastbound and westbound flights. The trans-Atlantic air traffic for the 10 airport pairs includes a total of 2734 eastbound and 2759 westbound flights that constitute approximately 18% of total traffic. The aircraft types and the counts for the entire fleet are ranked and shown in the last two columns in Table 1. Note that performance parameters for Boeing 777-300ER are currently unavailable in the fuel burn model and those of Boeing 777-200 are used instead.
Figure 3. Horizontal routes based on wind-optimal trajectory and the actual flight tracks.
Figure 4. Potential fuel savings between KEWR and EDDF during July 2012.
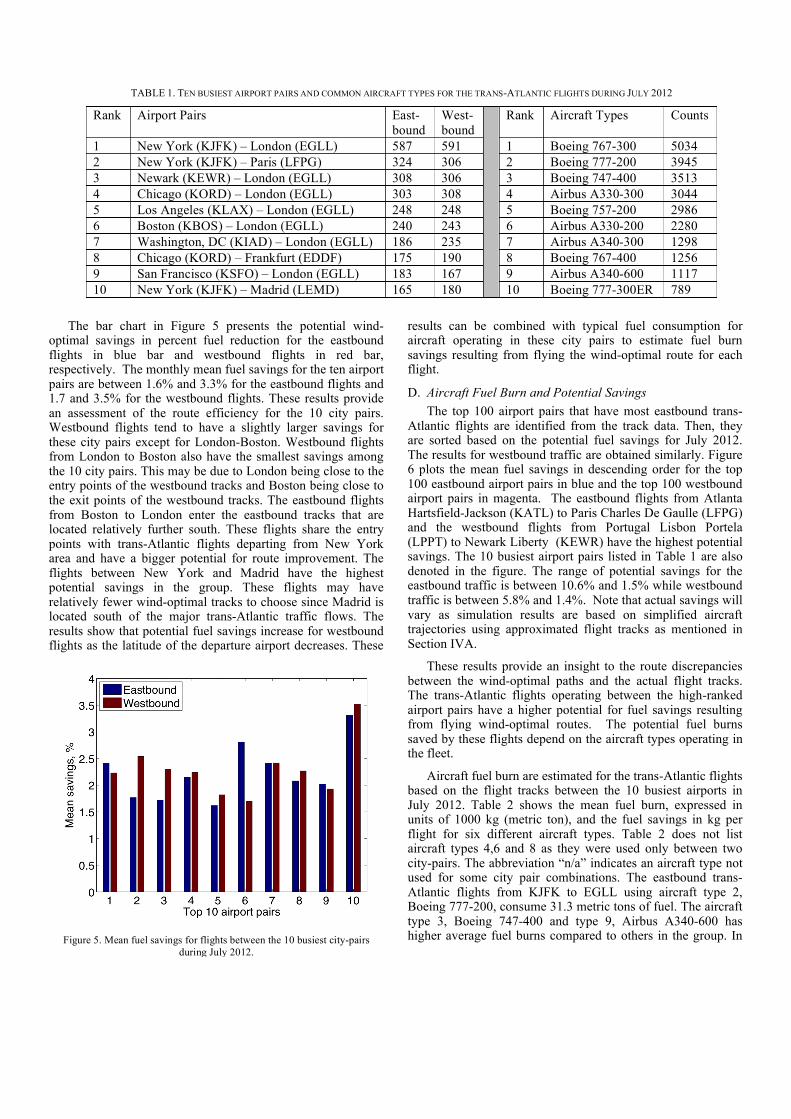
The bar chart in Figure 5 presents the potential wind-optimal savings in percent fuel reduction for the eastbound flights in blue bar and westbound flights in red bar, respectively. The monthly mean fuel savings for the ten airport pairs are between 1.6% and 3.3% for the eastbound flights and 1.7 and 3.5% for the westbound flights. These results provide an assessment of the route efficiency for the 10 city pairs. Westbound flights tend to have a slightly larger savings for these city pairs except for London-Boston. Westbound flights from London to Boston also have the smallest savings among the 10 city pairs. This may be due to London being close to the entry points of the westbound tracks and Boston being close to the exit points of the westbound tracks. The eastbound flights from Boston to London enter the eastbound tracks that are located relatively further south. These flights share the entry points with trans-Atlantic flights departing from New York area and have a bigger potential for route improvement. The flights between New York and Madrid have the highest potential savings in the group. These flights may have relatively fewer wind-optimal tracks to choose since Madrid is located south of the major trans-Atlantic traffic flows. The results show that potential fuel savings increase for westbound flights as the latitude of the departure airport decreases. These
results can be combined with typical fuel consumption for aircraft operating in these city pairs to estimate fuel burn savings resulting from flying the wind-optimal route for each flight.
D. Aircraft Fuel Burn and Potential Savings The top 100 airport pairs that have most eastbound trans-
Atlantic flights are identified from the track data. Then, they are sorted based on the potential fuel savings for July 2012. The results for westbound traffic are obtained similarly. Figure 6 plots the mean fuel savings in descending order for the top 100 eastbound airport pairs in blue and the top 100 westbound airport pairs in magenta. The eastbound flights from Atlanta Hartsfield-Jackson (KATL) to Paris Charles De Gaulle (LFPG) and the westbound flights from Portugal Lisbon Portela (LPPT) to Newark Liberty (KEWR) have the highest potential savings. The 10 busiest airport pairs listed in Table 1 are also denoted in the figure. The range of potential savings for the eastbound traffic is between 10.6% and 1.5% while westbound traffic is between 5.8% and 1.4%. Note that actual savings will vary as simulation results are based on simplified aircraft trajectories using approximated flight tracks as mentioned in Section IVA.
These results provide an insight to the route discrepancies between the wind-optimal paths and the actual flight tracks. The trans-Atlantic flights operating between the high-ranked airport pairs have a higher potential for fuel savings resulting from flying wind-optimal routes. The potential fuel burns saved by these flights depend on the aircraft types operating in the fleet.
Aircraft fuel burn are estimated for the trans-Atlantic flights based on the flight tracks between the 10 busiest airports in July 2012. Table 2 shows the mean fuel burn, expressed in units of 1000 kg (metric ton), and the fuel savings in kg per flight for six different aircraft types. Table 2 does not list aircraft types 4,6 and 8 as they were used only between two city-pairs. The abbreviation “n/a” indicates an aircraft type not used for some city pair combinations. The eastbound trans-Atlantic flights from KJFK to EGLL using aircraft type 2, Boeing 777-200, consume 31.3 metric tons of fuel. The aircraft type 3, Boeing 747-400 and type 9, Airbus A340-600 has higher average fuel burns compared to others in the group. In
TABLE 1. TEN BUSIEST AIRPORT PAIRS AND COMMON AIRCRAFT TYPES FOR THE TRANS-ATLANTIC FLIGHTS DURING JULY 2012
Rank Airport Pairs East- bound
West- bound
Rank Aircraft Types Counts
1 New York (KJFK) – London (EGLL) 587 591 1 Boeing 767-300 5034 2 New York (KJFK) – Paris (LFPG) 324 306 2 Boeing 777-200 3945 3 Newark (KEWR) – London (EGLL) 308 306 3 Boeing 747-400 3513 4 Chicago (KORD) – London (EGLL) 303 308 4 Airbus A330-300 3044 5 Los Angeles (KLAX) – London (EGLL) 248 248 5 Boeing 757-200 2986 6 Boston (KBOS) – London (EGLL) 240 243 6 Airbus A330-200 2280 7 Washington, DC (KIAD) – London (EGLL) 186 235 7 Airbus A340-300 1298 8 Chicago (KORD) – Frankfurt (EDDF) 175 190 8 Boeing 767-400 1256 9 San Francisco (KSFO) – London (EGLL) 183 167 9 Airbus A340-600 1117 10 New York (KJFK) – Madrid (LEMD) 165 180 10 Boeing 777-300ER 789
Figure 5. Mean fuel savings for flights between the 10 busiest city-pairs during July 2012.

general, the westbound flights have higher fuel consumption than the eastbound flights in the presence of winds.
The fuel burn values are applied for estimating amount of fuel saved by each aircraft type combining aforementioned percent fuel savings for each airport pair. For example, eastbound flights from KJFK to EGLL, which has an estimated savings of 2.42%, can potentially save 31,300 kg×2.42% = 760 kg fuel for aircraft type 2, Boeing 777-200. The fuel burn savings in kilograms for the busiest airports and the common aircraft types in the fleet are listed in Table 2. Westbound flights between all airport pairs except KBOS-EGLL potentially save more fuel due to higher fuel burn for the westbound traffic. The eastbound flights for KBOS-EGLL save more fuel because of a much larger percent fuel savings as
shown in Fig. 6. The high-ranked airports and the high-ranked aircraft types as presented in the upper left corner of Table 2 indicate trans-Atlantic flight operations with high frequency. Combing frequency of flights with potential fuel savings between city pairs identifies a set of flights that provide wind-optimal operations with most fuel reduction across the Atlantic Ocean.
IV. DE-CONFLICTION STRATEGY This section develops an approach to remove potential
conflicts between aircraft cruising over the NAOA using wind-optimal trajectories developed in the previous section. The section provides a definition of conflict in NAOA, the conflict detection approach implemented in the simulation and different
Figure 6. Mean fuel savings ranked for the top 100 busiest city-pairs during July 2012.
TABLE 2. MEAN FUEL BURN (IN METRIC TONS) AND FUEL BURN SAVINGS (IN KILOGRAMS) BASED ON FLIGHT TRACKS FOR THE TOP 10 BUSIEST AIRPORTS AND THE WIDELY USED AIRCRAFT TYPES DURING JULY 2012.
Rank/ Airport Pairs
Direction Aircraft Types
1 2 3 5 7 9 F(Mg) Δ(kg) F(Mg) Δ(kg) F(Mg) Δ(kg) F(Mg) Δ(kg) F(Mg) Δ(kg) F(Mg) Δ(kg)
1 KJFK- EGLL
East n/a n/a 31.3 760 44.2 1070 n/a n/a 28.9 700 37.1 900 West n/a n/a 36.5 810 50.3 1100 n/a n/a 37.0 830 44.3 990
2 KJFK- LFPG
East 23.7 420 32.4 570 n/a n/a 16.7 300 31.7 560 n/a n/a West 28.0 710 39.5 1000 n/a n/a 19.5 490 37.6 950 n/a n/a
3 KEWR- EGLL
East 22.7 390 31.2 540 42.4 730 16.0 280 n/a n/a 36.7 630 West 26.6 610 36.3 840 49.6 1100 18.5 420 n/a n/a 43.3 1000
4 KORD- EGLL
East 26.9 580 37.9 810 52.2 1120 n/a n/a 36.1 780 43.8 940 West 29.8 670 41.4 930 57.9 1300 n/a n/a 39.3 880 49.2 1100
5 KLAX- EGLL
East n/a n/a 53.8 870 72.8 1180 n/a n/a n/a n/a 62.1 1000 West n/a n/a 59.4 1080 79.6 1450 n/a n/a n/a n/a 70.3 1280
6 KBOS- EGLL
East n/a n/a 29.2 820 42.0 1180 15.2 430 29.0 810 35.1 990 West n/a n/a 33.2 560 47.3 800 17.4 300 32.5 550 41.2 700
7 KIAD- EGLL
East 24.8 600 33.6 810 47.9 1150 16.8 410 n/a n/a 40.3 970 West 27.8 670 38.9 940 53.1 1280 19.4 470 36.4 880 46.3 1120
8 KORD- EDDF
East n/a n/a 41.7 870 56.5 1180 n/a n/a 39.6 820 n/a n/a West 28.2 640 45.4 1030 61.3 1400 n/a n/a 43.3 980 n/a n/a
9 KSFO- EGLL
East n/a n/a 53.7 1080 71.6 1450 n/a n/a 48.8 990 61.1 1200 West n/a n/a 57.7 1110 77.8 1500 n/a n/a 52.6 1020 65.8 1270
10 KJFK- LEMD
East 23.5 780 n/a n/a n/a n/a 17.0 560 33.1 1100 41.0 1400 West 27.5 970 n/a n/a n/a n/a 19.3 680 37.8 1330 46.9 1650

ways used to modify trajectories in order to avoid conflicts. Finally, we describe the algorithm used to resolve most of the conflicts simultaneously for the flights in NAOA with minimum change to fuel consumption.
A. Conflict in NAOA Air traffic control in NAOA is based on large time
separation due to the lack of radar-based surveillance. In addition, aircraft must follow predefined tracks built to ensure such separation minima. Thus, aircraft crossing NAOA should maintain vertical separation of 1000 feet (flight level assignment), lateral separation of 60 NM (or 1° of latitude, insured by track assignment), and longitudinal separation of 10 minutes (for aircraft on the same track), for which track network entry times and aircraft speed are controlled.
In the current work, future modernization of ATC is considered, when aircraft are allowed to follow wind optimal routes and new generation of surveillance and broadcast technologies enable the availability of precise aircraft location to decision support systems. Under such conditions it is possible to reduce the separation standards, move away from NATS and notions of lateral and longitudinal separation. Thus, we consider in this work, a horizontal separation that is reduced to 30 NM, a time separation equal to 3 minutes when aircraft share the same piece of airspace, and with the current vertical separation of 1000 feet between flight levels.
This means that for each aircraft, we can define a protection zone as a cylinder in time (see Figure 7) with radius equal to horizontal separation norm (Nh=30NM) and half-altitude equal to vertical separation norm (Nv=1000feet). Other aircraft are not allowed to penetrate this area during the time period equal to time separation norm (Nt=3min). Thus, a potential conflict is a violation of aircraft protection zone by other aircraft during the time separation period.
This work assumes that all aircraft follow their wind optimal routes on pre-defined constant flight levels, and detection of conflicts is done independently at each flight level. Consider a point k of trajectory i, then conflicts at point Pi,k, denoted Фi,k, may be defined as the total number of times that the protection zone around point Pi,k, is violated during the time separation period. For instance, in Figure 8, Фi,k=2, meaning
that two conflicts are registered at point Pi,k in the horizontal dimension between three trajectories.
The conflicts associated with trajectory i, denoted Фi, is therefore defined by:
where Ki is the number of points on trajectory i. Finally, the total conflicts between N trajectories, φtot, for the whole traffic situation is simply defined as:
In order to compute the total number of conflicts, φtot, we need to compute the conflicts between the N aircraft trajectories. A grid-based interaction detection scheme, which is implemented in a so-called hash table, is used in order to avoid trajectory samples pairwise comparisons. First, the airspace is discretized using a 4-dimensional grid (3D space + time), as illustrated in Figure 9. The size of each cell in the 4D grid is defined by the minimum separation requirement and the discretization time step, Δt (appropriately chosen). Then, for each given 4D point, Pi,k=[xi,k,yi,k,zi,k,ti,k], of each trajectory i, where xi,k stands for the point longitude, yi,k is the point latitude, zi,k defines the point flight level and ti,k the associated time, we identify a cell, Ci,k,j,t , of the 4D grid that contains the point.
Next, for each trajectory sample we consider such a cell, Ci,k,j,t, and its surrounding cells are checked. There are nine neighboring cells in the horizontal dimension at time ti,k, including cell Ci,k,j,t itself (we do not check the vertical separation as constant flight levels are assigned to aircraft). Then, there are 9×(Tsep/∆t+1) neighboring cells for the time horizon, Tsep. If one of these neighboring cells contains another aircraft, the horizontal distance (dh) and the time interval (dt) between the corresponding aircraft coordinates are measured. A violation of the protection volume is identified when both dh<Nh and dt<Tsep.
€
φi = φi,kk=1
Ki
∑
€
φtot = φii=1
N
∑
Figure 7. Aircraft protection zone.
Figure 8. Potential conflicts in the horzontal plane.

In order not to underestimate conflicts, trajectories must be discretized with a sufficiently small sampling time step, Δt, which depends on the maximum aircraft speeds and separation norms. Thus, to ensure the detection of all possible conflicts, the time step should satisfy the condition: ∆t<min (Tsep, Nh/Vmax). Assuming that the aircraft speed is smaller than 500 kts and taking into account possible wind speed that is usually smaller than 100 kts, provides a value for Vmax = 600kts =10 NM⁄min. This results in a sampling time step: ∆t<min (3min, 30NM/(10 NM⁄min)=3 min. Thus, having trajectory data sampled every minute, assures that all potential conflicts are identified.
B. Trajectory modification Potential conflicts are resolved by modifying the wind-
optimal trajectories. There are different possibilities for such modifications: departure time, trajectory shape, flight level, air speed, or combinations of any of these criteria. In modifying the trajectories, the initial aircraft speeds and flight levels are maintained to avoid extra fuel consumption caused by these maneuvers. The conflicts are resolved first by changing their departure times, followed by a slight modification of the initial trajectory shapes for removing the remaining conflicts.
It is assumed that the departure time of each flight can be shifted by a positive time slot (delay). Let δi∈∆i be a departure time delay assigned to flight i, where ∆i is the set of acceptable time shifts for flight i. The departure time ti of flight i is, therefore, ti=ti,0+δi, where ti,0 is the initially-planned departure time of flight i. Note that assigning departure delay does not induce trajectory re-computation, only associated trajectory sample times are shifted, and we can get immediately the new point sequence: Pi,k as (xi,k, yi,k, zi,k, ti,k+δi). Moreover, this maneuver has no effect on the aircraft fuel consumption, as we consider a wind field that changes very slowly compared to the aircraft time shift. Thus, such maneuvers do not change the wind optimality of trajectories. These considerations make time shift as the initial choice for maneuvers to solve conflicts.
Nevertheless, due to the density of traffic in NAOA and especially its concentration near wind optimal routes, constrained time shifts (30 minutes maximum) alone may not resolve all potential conflicts. It may be necessary to slightly modify the aircraft trajectories in the spatial dimension. This spatial change is performed by keeping the initial NAOA entry and exit points and by changing the initial trajectory between these points. Also, a limit is placed on the curvilinear difference between the initial trajectory and the spatially
modified trajectory to minimize the additional fuel consumption. The modified trajectory can be designed in several different ways by constructing it in terms of basis functions such as trigonometric functions, orthogonal polynomials and B-splines. The choice of the basis function depends on its ability to represent a trajectory in terms of approximation quality and computational time that hold such important properties as continuity, robustness and flexibility. More details about the method are presented in [17]. The process for trajectory shape modification requires much more computational effort than the simple departure time shift. The results presented in this paper uses only small time shifts to the wind-optimal trajectories.
C. Optimization algorithm for conflict resolution problem The optimization of the conflict resolution method is both
computationally intractable (NP-complete) and the solutions are very sensitive to small variations in the problem. Many computational issues involving en route conflict resolution are described in [18]. This paper uses a simulated annealing algorithm combined with a local gradient search to speed up convergence.
The input data for the optimization algorithm are: (a) a set of N flights over NAOA, where each aircraft maintains constant air speed and flight level during the entire flight, with the given initial wind optimal trajectory discretized as a set of points Pi,k=[ xi,k, yi,k, zi,k, ti,k], (b) Wind data and (c) Maximum departure time shift for each flight, δi
max [assume equal maximum delay for all flights: δi
max=δmax=30min].
The departure delay variables define the new trajectory shape and route point passing times. This new trajectory configuration can be then again evaluated in terms of number of conflicts. During each iteration, the algorithm randomly selects whether to use the simulated annealing or the local search, or both methods consecutively. The choice is made according to user-defined probabilities in order to obtain the best convergence.
For this problem, the simulated annealing proceeds as follows. First, we evaluate the objective function using the initial configuration, ФC. Then we choose randomly one flight to be modified and generate a new trajectory for this flight according to a pre-defined neighborhood structure.
Once a neighborhood solution has been generated, the objective function of this new configuration, ФN, is evaluated. If the new solution improves the objective function value, it is accepted. Otherwise, it is accepted with a probability
€
e(φC −φ N ) /T , where T is the current “temperature” (the simulated annealing parameter). When the maximum number of iterations at a given temperature is reached, the temperature T is decreased according to the user-provided predefined schedule, and the process is repeated until the conflict free solution is found or until the pre-defined final temperature is reached.
The local search module uses a heuristic method that accepts a new solution, only if it yields a decrease in the number of potential conflicts. The process repeats until no further improvement can be found or until the maximum number of iterations is reached. The module includes three
Figure 9. 4-dimensional grid for conflict detection.

local-search strategies: (a) intensification of the search on a particular trajectory, i.e. applying a local change from the neighborhood structure only to one given flight i. (b) intensification of the search on the interacting trajectories, i.e. applying a local change to every flight that is currently interacting with a given flight i. (c) combination of the two previous methods, i.e. applying a local change to the given flight i and to every flight interacting with it.
V. DECONFLICTION RESULTS The de-confliction analysis was conducted for strategic
aircraft routes during July 2012 assuming different separation standards and aircraft departure time delays varying upto a maximum of 30 minutes. Figure 10 shows the variation in the number of flights across the Atlantic as a function of UTC time using data for July 15, 2012. Potential conflicts are computed using a separation standard of 30 nmi and 3 minutes. The number of flights (shown in blue color) and conflicts (shown in green color) vary in the range [132-370] and [8-76] respectively. Using departure delay as a strategic de-confliction methodology, the conflicts can be reduced significantly in the
range [0-53]. The remaining small number of potential conflicts can be resolved by rerouting the aircraft. Note that the variation in the number of flights during the day can be different than the actual air traffic over the NAOA since current study includes only the transatlantic flights operating between U.S. and Europe.
Figure 11 shows the total number of potential conflicts before and after the departure delay methodology during a day for the month of July 2012. The number of conflicts before (shown in blue color) and after de-conflictions (shown in red) varies in the range [471-913] and [110-528] respectively. The conflict reduction does not affect the fuel consumption due to small variations in departure times and maintains the fuel consumption computed for wind-optimal routes.
Figure 12 shows the percent of flights delayed due to de-conflictions during a day for the month of July 2012. The daily variations ranged between [51-61] percent. Figure 13 shows a mean delay per aircraft in the range [8.4-9.9] minutes for each day over July 2012. The maximum delay and the sum of mean delay and one standard deviation (SD) are also plotted in the
Figure 10. Flights and conflicts during July 15, 2012
Figure 11. Conflicts for July, 2012
Figure 12. Flights delayed during July 15, 2012
Figure 13. Delays for July, 2012
figure respectively. The sum of mean delay and one SD vary in the range [19-21] minutes. This indicates that the shifts of departure times spread out over the range of 30 minutes for each flight for a maximum reduction of potential conflicts.
VI. CONCLUDING REMARKS This paper presents an efficient strategic planning concept
for oceanic traffic in the presence of advances to navigational and communication infrastructure, aircraft equipage and better planning and monitoring software. The methodology was simulated and compared with current oceanic operations involving transatlantic flights for the month of July 2012. The results show that strategic planning can improve the efficiency of flights by 3 to 5% depending on city-pairs and aircraft type. Assuming a mean savings of 650 kg per flight and a fuel price of $676 for metric ton, the potential savings for the 460,000 flights flying annually in NAOA is approximately 200 Million Dollars. This study provides an estimate of the potential benefits of an oceanic strategic planning concept combining the reduced separation requirements resulting from the availability of ADS-B and the use of wind-optimal routes. The concept has to be supplemented with optimal climbs and departures for further evaluation. The methodology provides groundwork for future studies to realize efficient oceanic and global air traffic operations.
REFERENCES [1] T.G. Reynolds, “Analysis of Lateral Flight Inefficiency in Global Air
Traffic Management,” 8th AIAA Aviation Technology, Integration and Operations Conference, Anchorage, Alaska, 14-19 September 2008.
[2] D. Howell, M. Bennett, J. Bonn, and D. Knorr, “Estimating the En Route Efficiency Benefits Pool”, 5th USA/Europe Air Traffic Management Seminar, Budapest, 2003.
[3] T. Kettunen, J.C. Hustache, I. Fuller, D. Howell, J. Bonn, and D. Knorr, “Flight Efficiency Studies in Europe and the United States”, 6th USA/Europe Air Traffic Management Seminar, Baltimore, 2005.
[4] J. Guilding, D. Knorr, M. Rose, J. Bonn, P. Enuad, and H. Hegendoerfer, “US/Europe Comparison of ATM-related operational Performance,”8th USA/Europe Air Traffic Management Seminar, Baltimore, 2005.
[5] NAT DOC 007. Guidance concerning air navigation in and above the North Atlantic MNPS airspace. Edition 2010. World Air Ops online Library.
[6] A.E. Bryson and Y.C. Ho, Applied Optimal Control, Taylor and Francis, Levittown, PA, 1975.
[7] H. K. Ng, B. Sridhar, S. Grabbe and N. Chen,“Cross-Polar Aircraft Trajectory Optimization and the Potential Climate Impact,” IEEE/AIAA 30th Digital Avionics Systems Conference, Oct. 2011.
[8] H. Hemdal, Sea Changes, Air Traffic Technology International, pages 6-12, 2014.
[9] K.M.Jones, “Pair-Wise Trajectory Management-Oceanic (PTM-O),” NASA/TP–2014-218188, April 2014.
[10] A. Williams and I. Greenfield, “Benefits Assessment of Reduced Separations in North Atlantic Organized Track System,” 6th AIAA Aviation Technology, Integration and Operations Conference (ATIO), September 2006, Wichita, Kansas
[11] R.J. Kerczewski, I. Greenfield and B.W. Welch, “Communications, navigation and surveillance for improved oceanic air traffic operations,” IEEE Aerospace Conference, 2005.
[12] J.Post, J. Bonn and S. Shresta, “NAS-Wide simulation applied to reduced oceanic separation scenarios,”Integrated Communications, Navigation and Surveillance Conference (ICNS), Herndon, VA, April 2013.
[13] O. Rodionova, M. Sbihi, D. Delahaye, and M. Mongeau, “Optimization of aircraft trajectories in North Atlantic oceanic airspace.” 5th International Conference on Research in Air Transportation, University of California, Berkeley, CA, May 2012.
[14] H. K. Ng and B. Sridhar, “ A Practical Approach for Optimizing Aircraft Trajectories in Winds,” IEEE/AIAA 31st Digital Avionics Systems Conference, Oct. 2012.
[15] “User Manual for the Base of Aircraft Data (BADA), Revision 3.6,” Eurocontrol Experimental Center (EEC) Note No. 10/04, Project ACE-C-E2, Sept. 2004.
[16] B. Sridhar, H. K. Ng, F. Linke, N. Y. Chen, “Benefits Analysis of Wind-Optimal Operations For Trans-Atlantic Flights,” 14th AIAA Aviation Technology, Integration, and Operations Conference (ATIO), Atlanta, GA, June 2014
[17] S. Chaimatanan, D. Delahaye and M. Mongeau, “A Hybrid Metaheuristic Optimization Algorithm for Strategic Planning of 4D Aircraft Trajectories at the Continental Scale,” IEEE Computational Intelligence Magazine, Nov. 2014, Vol.9(4), pp.46-61.
[18] C. Allignol, N. Barnier, N. Durand, and J-M. Alliot, “A New Framework for Solving En-Route Conflicts,” 9th USA/Europe Air Traffic Management Seminar, Berlin, 2011.
AUTHOR BIOGRAPHY Dr. Banavar Sridhar worked at Systems Control, Inc., Palo Alto, CA and Lockheed Palo Alto Research Center before joining NASA Ames Research Center in 1986. He is NASA Senior Scientist for Air Transportation Systems. His research interests are in the application of modeling and optimization techniques to aerospace systems. Dr. Sridhar received the 2004 IEEE Control System Technology Award for his contributions to the development of modeling and simulation techniques. He led the development of traffic flow management software, Future ATM Concepts Evaluation Tool (FACET), which received the NASA Software of the Year Award in 2006. He is a Fellow of the IEEE and the AIAA. Dr. Hok K. Ng is a research scientist at University of California, Santa Cruz. He specializes in algorithm development for traffic flow management. He has worked for the past five years on Aviation related researches and applications. He earned his Ph.D. degree in Mechanical and Aerospace Engineering from University of California, Los Angeles in 2005. Dr. Neil Y. Chen is an aerospace research engineer in the Aviation Systems Division at NASA Ames Research Center. He received his Ph.D. degree in mechanical and aerospace engineering from University of California, Los Angeles, in 2001. He has been working in the area of air traffic management since 2006. His current research interests include traffic flow management and aviation induced environmental impact. Ms. Olga Rodionova received her BSc (2009) and MSc (2011) degrees in Applied Mathematics and Informatics from Saint-Petersburg State Polytechnical University (SPbSPU), Russia. From 2008 to 2011, she was working at Applied Mathematics and Mechanics laboratory, SPbSPU, on development of the software complex for AIRBUS Corporation. She is currently a PhD student at ENAC in Toulouse, France. Her research concerns aircraft trajectory optimization. Prof. Daniel Delahaye obtained his Engineer degree from French Civil Aviation ENAC School and his MSc in Signal Processing from the National Polytechnic Institute of Toulouse (1991). He obtained his PhD in Automatic Control from the Aeronautics and Space National School (1995) and did post-doctoral research in the Department of Aeronautics and Astronautics at MIT (1996). He got his tenure in Applied Mathematics from the University Paul Sabatier in 2012. He is now the head of the Optimization group of the Applied Mathematics Laboratory of ENAC and is conducting research on stochastic optimization for airspace design and large-scale traffic assignment. Mr. Florian Linke is Head of Department of “Air Traffic Infrastructures and Processes” at the DLR Air Transportation Systems, Hamburg, Germany. He received his diploma in Aeronautical Engineering from RWTH Aachen University in 2007. He has a background in Air Traffic Management and flight mechanics, guidance and control and now focuses on trajectory optimization and new operational concepts to reduce the environmental impact of aviation. He is currently doing his Ph.D. at Hamburg University of Technology.


![Working with Buffers - Seminar Efficient Programming in C · IntroductiontoCbuffersandstoragevariants Variousbuffers Variousdifferentbuffers variousbuffers.c 1 staticconstcharstaticConstBuffer[32]](https://img.dokumen.tips/doc/110x75/5b15faf47f8b9a9f098c3657/working-with-buffers-seminar-efficient-programming-in-c-introductiontocbuersandstoragevariants.jpg)