Embed Size (px)
Citation preview
Strategic Plan for the NT
Tourism Industry: Recommendations of the
AECgroup
September 2007

Northern Territory Tourism Strategic Plan 2008-2012
1
Table of Contents
TABLE OF CONTENTS...........................................................................................1
1 INTRODUCTION .......................................................................................... 3
1.1 PURPOSE OF THE STRATEGIC PLAN.......................................................................... 3 1.2 PURPOSE OF THIS DOCUMENT ............................................................................... 3 1.3 SIGNIFICANCE OF THE INDUSTRY............................................................................ 3 1.4 COMPETITIVE ENVIRONMENT................................................................................. 3 1.5 INDUSTRY PERFORMANCE .................................................................................... 4 1.6 MEASUREMENT OF SUCCESS ................................................................................. 5 1.7 STRATEGIC PLAN DEVELOPMENT PROCESS ................................................................. 5 1.8 ROLE AND STRUCTURE OF THE NT TOURISM INDUSTRY .................................................. 6
2 OPERATING ENVIRONMENT ASSESSMENT ..................................................7
2.1 MARKETS AND COMPETITION ................................................................................ 7 2.1.1 GLOBAL TOURISM TRENDS ......................................................................... 7 2.1.2 AUSTRALIAN TOURISM MARKET TRENDS.......................................................... 8 2.1.3 NT TOURISM MARKET TRENDS .................................................................. 10
2.2 DRIVERS AND INFLUENCES................................................................................. 13 2.2.1 VARIABILITY IN DEMAND ......................................................................... 13 2.2.2 GLOBAL DRIVERS AND TRENDS .................................................................. 14 2.2.3 DOMESTIC DRIVERS AND TRENDS ............................................................... 15
2.3 PERFORMANCE AND GROWTH .............................................................................. 16 2.4 LABOUR AND SKILLS ........................................................................................ 18 2.5 INVESTMENT ................................................................................................. 19
3 PLANNING FOR THE FUTURE.....................................................................22
3.1 SWOT ANALYSIS ........................................................................................... 22 3.1.1 STRENGTHS ........................................................................................ 22 3.1.2 WEAKNESSES ...................................................................................... 22 3.1.3 OPPORTUNITIES ................................................................................... 23 3.1.4 THREATS ........................................................................................... 24
3.2 KEY ISSUES.................................................................................................. 25
4 MARKETS ..................................................................................................28
4.1 STAGES OF MARKET DEVELOPMENT ....................................................................... 28 4.2 THE DOMESTIC MARKET.................................................................................... 29
4.2.1 CURRENT DOMESTIC MARKET POSITION – STAGE ASSESSMENT............................. 30 4.2.2 RESPONDING TO TRENDS IN THE DOMESTIC MARKET ......................................... 31
4.3 INTRA-TERRITORY MARKET ................................................................................ 33 4.4 THE INTERNATIONAL MARKET ............................................................................. 34
4.4.1 CURRENT FOCUS MARKETS....................................................................... 35 4.4.2 EMERGING MARKETS .............................................................................. 38 4.4.3 CHINA .............................................................................................. 41 4.4.4 INDIA ............................................................................................... 45 4.4.5 SOUTH KOREA ..................................................................................... 49 4.4.6 INDONESIA ......................................................................................... 51 4.4.7 SINGAPORE ........................................................................................ 54 4.4.8 OTHER EMERGING MARKETS ..................................................................... 56 4.4.9 POSITIONING THE NT FOR THE INTERNATIONAL MARKET ..................................... 56 4.4.10 CHANGING BACKPACKER TRAVELLER ............................................................ 58
4.5 NATURE-BASED TOURISM.................................................................................. 60 4.5.1 ECO-TOURISM ..................................................................................... 61 4.5.2 DEVELOPING NATURE-BASED TOURISM PRODUCT IN THE NT ................................ 61 4.5.3 POSITIONING THE NT FOR NATURE-BASED TOURISTS ........................................ 62
4.6 CULTURAL TOURISM ........................................................................................ 64 4.6.1 UNDERSTANDING CULTURAL TOURISTS ......................................................... 66 4.6.2 INDIGENOUS PRODUCT IN THE NT............................................................... 68 4.6.3 POSITIONING THE NT FOR CULTURAL TOURISTS............................................... 68 4.6.4 CULTURAL TOURISM DEVELOPMENT ............................................................. 69 4.6.5 SEASONALITY ...................................................................................... 72

Northern Territory Tourism Strategic Plan 2008-2012
2
4.7 BUSINESS TOURISTS ....................................................................................... 72
5 PRODUCT DEVELOPMENT ..........................................................................74
5.1 ACCESS ...................................................................................................... 74 5.1.1 DISTRIBUTION OF TRAVEL TO NT................................................................ 74 5.1.2 DISTRIBUTION OF TRAVEL WITHIN NT ......................................................... 74 5.1.3 AIR ACCESS........................................................................................ 75 5.1.4 CRUISE SHIPPING ................................................................................. 77 5.1.5 ROAD ACCESS ..................................................................................... 78 5.1.6 RAIL TRAVEL ....................................................................................... 79
5.2 INFRASTRUCTURE ........................................................................................... 80 5.2.1 ACCOMMODATION ................................................................................. 80 5.2.2 BUSINESS/CONVENTION.......................................................................... 81 5.2.3 NATIONAL PARKS.................................................................................. 81
5.3 DESTINATION DEVELOPMENT .............................................................................. 83 5.4 SKILLS ....................................................................................................... 85 5.5 INDUSTRY STANDARDS ..................................................................................... 89 5.6 PARTNERSHIPS .............................................................................................. 90
5.6.1 INDUSTRY .......................................................................................... 90 5.6.2 COMMUNITY ........................................................................................ 95 5.6.3 LOCAL GOVERNMENT .............................................................................. 95
6 MARKETING AND PROMOTION..................................................................97
6.1 MARKETING .................................................................................................. 97 6.2 WHOLESALING............................................................................................... 99
6.2.1 INCREASED USE OF INFORMATION TECHNOLOGY .............................................. 99 6.2.2 INDUSTRY CONSOLIDATION .....................................................................100 6.2.3 RATIONALISATION OF TOURISM PRODUCTS ...................................................100 6.2.4 TERRITORY DISCOVERIES .......................................................................100
6.3 CO-OPERATIVE ADVERTISING ............................................................................101 6.4 RETAIL DISTRIBUTION.....................................................................................102 6.5 ELECTRONIC DISTRIBUTION ..............................................................................104 6.6 INTRA-TERRITORY MARKETING ...........................................................................105
7 ENVIRONMENTAL SUSTAINABILITY........................................................ 107
7.1 ISSUES OF CLIMATE CHANGE .............................................................................107 7.2 REDUCING CARBON EMISSIONS ..........................................................................107 7.3 RESPONDING TO THE CHALLENGES OF CLIMATE CHANGE..............................................109
8 RESEARCH & INNOVATION ..................................................................... 110
9 BUDGETS AND TARGETS.......................................................................... 112
9.1 TOURISM NT BUDGET .....................................................................................112 9.2 PERFORMANCE MEASUREMENT............................................................................114
REFERENCES ................................................................................................... 116
Disclaimer:
Whilst all care and diligence have been exercised in the preparation of this report, the AEC Group Limited does not warrant the
accuracy of the information contained within and accepts no liability for any loss or damage that may be suffered as a result of reliance
on this information, whether or not there has been any error, omission or negligence on the part of the AEC Group Limited or their
employees. Any forecasts or projections used in the analysis can be affected by a number of unforeseen variables, and as such no
warranty is given that a particular set of results will in fact be achieved.

Northern Territory Tourism Strategic Plan 2008-2012
3
1 Introduction
1.1 Purpose of the Strategic Plan
The Northern Territory Tourism Strategic Plan 2008-2012 (the Plan) outlines the collective direction for the Northern Territory (NT) tourism industry over the coming five years. This Plan will guide Tourism NT, other levels of government and the private sector to meet current and emerging trends and associated challenges and opportunities facing the NT tourism industry. The former Plan, the Northern Territory Tourism Strategic Plan 2003-2007, was successful in providing the strategic direction for the industry to weather a number of challenges during a period of uncertainty in the global tourism industry. The 2008-2012 Plan outlines the path forward to maximise market potential over the next five years by building on the industry’s evolving product, core markets of nature, culture and indigenous based tourism and addressing constraints to growth in the areas of infrastructure, access and skills. Importantly, the Plan outlines strategies for the industry to continue to capitalise on its core European markets (including growth markets such as France and Italy) as well as benefit from the nearby fast-growing tourism markets of Asia.
1.2 Purpose of this Document
This document outlines the current approach of the AEC Group, in preparing The Northern Territory Tourism Strategic Plan 2008-2012, based on the research and industry consultation undertaken. This document is for release to the industry to obtain final feedback from industry and Government before the final Strategic Plan is prepared. It contains a number of strategic recommendations that will impact many areas of the industry. The strategies presented in this document represent the views of the consultant.
1.3 Significance of the Industry
The tourism industry contributed 7.2% of the NT’s Gross State Product (GSP) in 2003/04 and is the Territory’s largest private sector employer, directly and indirectly, accounting for nearly 13,000 jobs. Tourism is the leading industry in many rural and remote areas, including indigenous areas, where other industry opportunities are often limited. The infrastructure provided by the industry is not only utilised by visitors. The industry creates critical mass for facilities and activities that locals utilise and enjoy. It promotes culture exchange through interaction with visitors from around the world. Tourism highlights the importance of environmental assets in the Territory and channels funds to their protection and management.
The tourism industry is the largest industry employer in the
NT, contributing over 7% to GSP and plays a key role in regional and indigenous economic development.
1.4 Competitive Environment
The NT tourism industry has largely developed from globally recognised iconic natural attractions such as Uluru / Ayers Rock and Kakadu National Park. These origins have broadly led to a focus on nature-based tourism represented by the spirited traveller segment domestically and the experience seeker segment internationally.

Northern Territory Tourism Strategic Plan 2008-2012
4
These segments represent substantial and growing markets of travellers. However, the competition for these markets has intensified in recent years, with many states such as Tasmania, Western Australia, Queensland and New South Wales and overseas destinations such as New Zealand and South Africa targeting similar markets. Domestically, states such as Queensland and Western Australia are promoting similar experiences such as the ‘Real Outback’ image of the NT to eastern and western seaboard residents but marketing them as more accessible. This competition is often mixed with a greater range of experiences and products. Internationally, global tourism is expected to increase though is tempered with ongoing risks associated with war, terrorism and disease. The Asian region is forecast to continue its rapid ascendency and account for an increasing share of the world tourism market, both as a destination and a source of travellers. The success of Asia as a tourist destination is in part behind the forecast of Australian domestic tourists increasingly choosing to travel overseas. As a result, visitor nights are forecast to grow only marginally from domestic travellers and will increasingly result from more frequent, but shorter trips in the domestic market. While the recent experience in the NT is different to this, this overall trend is still a major concern for the NT tourism industry.
The competitive situation is placing increasing pressure on the NT to continue to diversify its tourism product.
Targeting the spirited traveller/experience seeker segments and promoting the Territory’s iconic natural attractions will remain a core component to the future product range, market image and promotion of the NT tourism industry. However, there is now both the opportunity and challenge to diversify and strengthen the industry’s product range and build long-term sustainable competitive advantage through continued development of the unique cultural (in particular Indigenous) tourism product. This Plan looks at further developing nature, cultural and Indigenous tourism product tailored to the spirited traveller and experience seeker segments, and targeting the high value-add fringes of experiences that much of these market segments seek. The Plan also targets the significant opportunities provided for within the emerging tourism markets of China and India. These should be considered in conjunction with the Commonwealth Government’s Department of Industry, Tourism and Resources recently released National Tourism Emerging Markets Strategy: China and India.
The Plan consolidates the core nature and culture markets,
extends Indigenous tourism product and positions for the opportunities in the emerging markets of China and India.
1.5 Industry Performance
The NT tourism industry’s performance has been sound over the past 5 years when considered in the context of global and national tourism market trends. Total visitation to the NT (not including day trip visitors) reached 1.41 million visitors in 2006, showing continued signs of recovery from the slump following 2001. In line with the Australian experience, tourism visitation to the NT has been negatively impacted by a number of significant events including war, terrorism, disease and exchange rate. The most significant of these events was the collapse of Ansett and the NT Tourism Industry has only now recovered to the levels prior to its occurrence. International visitation has grown in the NT since 2004, although not as strongly as the Australian average. However the Territory has recorded stronger growth in domestic visitors, which remain the largest source of visitor nights at 70%, despite a slowdown in domestic tourism growth across Australia. This has been mostly due to growth in holiday visits to the NT in recent years; a positive reflection on recent Tourism NT marketing efforts and the focus and distribution of Territory Discoveries.
Northern Territory Tourism Strategic Plan 2008-2012
5
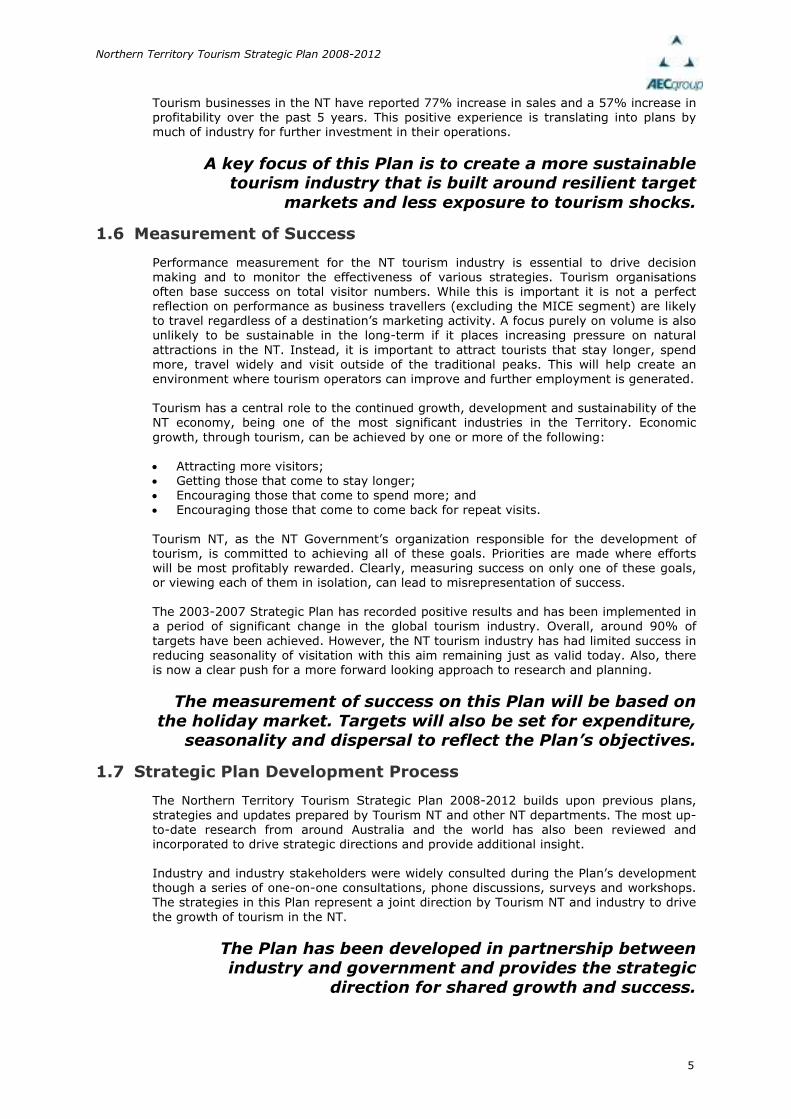
Tourism businesses in the NT have reported 77% increase in sales and a 57% increase in profitability over the past 5 years. This positive experience is translating into plans by much of industry for further investment in their operations.
A key focus of this Plan is to create a more sustainable tourism industry that is built around resilient target
markets and less exposure to tourism shocks.
1.6 Measurement of Success
Performance measurement for the NT tourism industry is essential to drive decision making and to monitor the effectiveness of various strategies. Tourism organisations often base success on total visitor numbers. While this is important it is not a perfect reflection on performance as business travellers (excluding the MICE segment) are likely to travel regardless of a destination’s marketing activity. A focus purely on volume is also unlikely to be sustainable in the long-term if it places increasing pressure on natural attractions in the NT. Instead, it is important to attract tourists that stay longer, spend more, travel widely and visit outside of the traditional peaks. This will help create an environment where tourism operators can improve and further employment is generated. Tourism has a central role to the continued growth, development and sustainability of the NT economy, being one of the most significant industries in the Territory. Economic growth, through tourism, can be achieved by one or more of the following: • Attracting more visitors; • Getting those that come to stay longer; • Encouraging those that come to spend more; and • Encouraging those that come to come back for repeat visits. Tourism NT, as the NT Government’s organization responsible for the development of tourism, is committed to achieving all of these goals. Priorities are made where efforts will be most profitably rewarded. Clearly, measuring success on only one of these goals, or viewing each of them in isolation, can lead to misrepresentation of success. The 2003-2007 Strategic Plan has recorded positive results and has been implemented in a period of significant change in the global tourism industry. Overall, around 90% of targets have been achieved. However, the NT tourism industry has had limited success in reducing seasonality of visitation with this aim remaining just as valid today. Also, there is now a clear push for a more forward looking approach to research and planning.
The measurement of success on this Plan will be based on
the holiday market. Targets will also be set for expenditure, seasonality and dispersal to reflect the Plan’s objectives.
1.7 Strategic Plan Development Process
The Northern Territory Tourism Strategic Plan 2008-2012 builds upon previous plans, strategies and updates prepared by Tourism NT and other NT departments. The most up-to-date research from around Australia and the world has also been reviewed and incorporated to drive strategic directions and provide additional insight. Industry and industry stakeholders were widely consulted during the Plan’s development though a series of one-on-one consultations, phone discussions, surveys and workshops. The strategies in this Plan represent a joint direction by Tourism NT and industry to drive the growth of tourism in the NT.
The Plan has been developed in partnership between industry and government and provides the strategic
direction for shared growth and success.

Northern Territory Tourism Strategic Plan 2008-2012
6
1.8 Role and Structure of the NT Tourism Industry
The Northern Territory Tourist Commission was legislated as Tourism NT in 2006. Whilst remaining an autonomous entity, Tourism NT falls within the portfolio of NT Department of Business, Economic and Regional Development (DBERD). This new arrangement provides greater opportunities for cooperative work on major projects and improves the ability to develop tourism in regional areas and with Indigenous communities. Tourism NT is the principal government agency responsible for marketing and facilitating the development of tourism in the NT. Tourism NT works to market the destination interstate and overseas with tourism industry partners including Tourism Australia, the Commonwealth Government and four regional tourism organisations, the travel industry that provides the necessary coordination for working with wholesalers, retail agents and airlines to facilitate the distribution of Territory travel products. Tourism NT provides policy and service delivery advice to the NT Government, through the Minister for Tourism.
Tourism NT’s role is undertaken in cooperation with other levels of government, tourism industry partners and travel
and tourism industry operators across the Territory.
Figure 1.1: Role and Structure of the NT Tourism Industry

Northern Territory Tourism Strategic Plan 2008-2012
7
2 Operating Environment Assessment
2.1 Markets and Competition
2.1.1 Global Tourism Trends
The World Tourism Organisation (WTO) estimate that there were 842 million international tourists travelling across the globe in 2006, representing an increase of approximately 150 million international tourists since 2003. International tourism growth is being driven largely by economic growth and rising living standards, along with improved information flows and more efficient coordination between business, consumer, government and tourism organisations. Tourism is a discretionary expenditure item and when economic conditions are strong, people are most willing to spend on discretionary items such as travel. As a whole, the global economic outlook is positive. Barring any unforeseen shocks, this forecast outlook will support continued growth in world tourism at least in the short to medium term. The WTO forecasts the global tourism market will grow to over 1.56 billion international travellers by 2020, with the Asia-Pacific region projected to be one of the fastest growing tourism destinations with an average annual growth rate of 6.5% to almost 400 million. China and India will be two of the fastest growing market segments within Asia. In 2004, total outbound tourism from China reached 18.8 million. According to the WTO, by 2020 this figure will grow to 100 million and China will be the world’s fourth largest source of outbound travel. Forecasts for India are more modest in the short-term, but show the beginnings of powerful growth over the longer term.
The global tourism market is forecast to almost double in
size by 2020, driven by rapid growth of the Asian tourist outbound market, particularly China and India.
Figure 2.1: Global Visitor Numbers
0
100
200
300
400
500
600
700
800
900
1000
1996 1997 1998 1999 2000 2001 2002 2003 2004 2005 2006
I NTERNATIO
NAL VISITORS
(M)
-4.0%
-2.0%
0.0%
2.0%
4.0%
6.0%
8.0%
10.0%
12.0%
14.0%
16.0% INTERNATIONAL VISITORS ANNUAL GROWTH
% ANNUAL GROWTH
Source: World Tourism Organisation (2007b)

Northern Territory Tourism Strategic Plan 2008-2012
8
2.1.2 Australian Tourism Market Trends
Approximately 5.5 million international tourists arrived in Australia in 2005-06, 1.5% more than in 2004-05. International visitation to Australia has grown at a modest average rate of 2.0% per annum over the past five years. The Tourism Forecasting Committee (TFC) estimates that the economic value of international tourism to the Australian economy for the year-ended June 2006 was $18.9 billion, with leisure visitors accounting for 60% ($11.6 billion) of the total.
Figure 2.2: International Visitation to Australia
0
1
2
3
4
5
6
1996 1997 1998 1999 2000 2001 2002 2003 2004 2005 2006
International Visitors (Millions)
-6.0%
-3.0%
0.0%
3.0%
6.0%
9.0%
12.0%
International Visitors Annual Growth
Source: Australian Bureau of Statistics (2007b)
In 2007, growth in inbound arrivals is forecast to grow at a slightly faster pace of 4% to 5.7 million. This growth is expected through forecast weakening of both the Australian dollar and world crude oil prices, along with a modest expansion in aviation capacity. Over the longer term, the continued expansion of low cost carrier routes in Asia (and the associated rapid development of rival destinations in Asia) will compete strongly for international arrivals to Australia. However, this expansion will also bring major opportunities for Asian markets to feed into Australian ports. As such, with the balance of increased aviation capacity and an anticipated lower Australian dollar and world oil prices, annual growth in inbound visitation is forecast at 5% through to 2015.

Northern Territory Tourism Strategic Plan 2008-2012
9
Figure 2.3: Forecast International Visitation to Australia
0
1
2
3
4
5
6
7
8
9
2006 2007 2008 2009 2010 2011 2012 2013 2014 2015
International Visitors (Millions)
0.0%
1.0%
2.0%
3.0%
4.0%
5.0%
6.0%
7.0%
8.0%
9.0%
International Visitors Annual Growth
Source: Tourism Forecasting Committee (2006)
In line with its close proximity and ties to Australia, New Zealand is currently the largest single country source of international visitors to Australia, accounting for around 19.4% of total visitation. However, the Asian market (excluding Japan) is expected to provide the most significant source of additional visitors to Australia over the next decade, with forecasts suggesting the region will account for an additional 8.7% of total visitation (or 1.5 million visitors) by 2015. By 2015, visitation from Asia is forecast to account for 50% of the Australian international tourist market.
Figure 2.4: Arrivals from Inbound Markets to Australia, 2006 and 2015
2006
NORTH AMERICA 10.3%
UK 12.9%
OTHER EUROPE 11.4%
NEW ZEALAND 19.4% JAPAN
12.0%
OTHER ASIA 27.9%
REST OF THE WORLD 6.1%
2015
Rest of the World
7.0%
Other Asia
36.6%
Japan
9.3%
New Zealand
14.6%
Other Europe
11.3%
UK
11.3%
North America
10.0%
Source: Tourism Forecasting Committee (2006)
The TFC has predicted China and India will be Australia’s two fastest growing tourism markets over the next decade, with average annual growth of 16.5% and 14.3%, respectively. With rapidly expanding middle classes, and a growing wealth base, the two markets offer strong potential for high yield returns.
The emerging markets of China and India are forecast to be the fastest growing markets for the Australian tourism
industry, providing strong growth potential for the NT tourism industry, the closest Australian market to Asia.
Domestic tourism was supported between 2002 and 2004 by strong job creation, rising household wealth and low interest rates, leading to a greater propensity to spend on discretionary items. However, domestic visitor nights fell 7% in 2005 in response to factors such as rising petrol prices (increasing the cost of travel or shortening the distance destinations chosen), increasing debt levels and a strong Australian dollar (increasing the attractiveness of overseas travel).

Northern Territory Tourism Strategic Plan 2008-2012
10
Domestic tourism recovered slightly in 2006 as petrol prices stabilised and is forecast to continue to grow modestly through to 2015. Even so, domestic tourism is forecast to remain below the levels recorded between 2002 and 2004. Holiday / leisure purposes accounted for the largest share of domestic visitor nights in 2006 (47%), followed by visiting friends and relatives (32%). Over the period to 2015, domestic visitation for business purposes is expected to increase marginally in significance to 15.1% of total domestic tourism.
Figure 2.5: Historic and Forecast Domestic Visitor Nights, Australia
260
265
270
275
280
285
290
295
300
305
310
1999 2001 2003 2005 2007 2009 2011 2013 2015
DOMESTIC VISITOR N
IGHTS IN M
ILLIONS
-10.0%
-8.5%
-7.0%
-5.5%
-4.0%
-2.5%
-1.0%
0.5%
2.0%
3.5%
5.0% DOMESTIC VISITOR NIGHTS ANNUAL GROWTH
ANNUAL GROWTH
Source: Tourism Forecasting Committee (2006)
The TFC estimate that the value of domestic tourism to the Australian economy was $57 billion in 2006. The contribution of domestic tourism is forecast to grow by 0.7% per annum on average in real terms through to 2015 to $59.5 billion. This relatively weak forecast is based on the assumption of continued higher fuel prices reducing the demand for driving holidays and an increased willingness of Australian’s to substitute domestic destinations for overseas travel.
Around 70% of the NT tourism industry’s visitor mix is
sourced from domestic travel, but this market is expected to grow at a relatively slow rate in the decade ahead.
2.1.3 NT Tourism Market Trends
Total holiday visitation to the NT (not including day trip visitors) increased by 7.7% in 2006 to 841,440 visitors, although lower than the 907,460 visitors recorded in 2000. In line with the Australian experience, tourism visitation to the NT was negatively impacted by a number of significant events including war, terrorism, disease and exchange rate in the period 2001-04.

Northern Territory Tourism Strategic Plan 2008-2012
11
Figure 2.6: Total NT Holiday Visitors
0
100
200
300
400
500
600
700
800
900
1000
1999 2000 2001 2002 2003 2004 2005 2006
000s
-15%
-10%
-5%
0%
5%
10%
15%
% Annual Growth
Total Holiday Visitors
Annual Growth
Source: Tourism NT (2006a)
The interstate market provides the largest source of visitors to the NT, accounting for 47.5% of the total in 2006. The reliance on this market has increased since 2001 (up 4.7 percentage points), while intra-territory travel has reduced in share by 4.9 percentage points. Overall, domestic travel accounts for 70% of visitors. International visitors currently account for 31% of visitor nights in the NT, down from 34% in 2001, partly reflective of a declining length of stay for this visitor type.
Figure 2.7: Visitors by Origin to NT, 2001 and 2006
Origin of Visitor, 2001
Intra-Territory
31.1%
Interstate
42.8%
International
26.1%
Origin of Visitor, 2006
International
26.3%
Interstate
47.5%
Intra-Territory
26.2%
Source: Tourism NT (2006a)
Figure 2.8: Visitor Nights by Origin to NT, 2001 and 2006
Visitor Nights by Origin of Visitor, 2001
International
33.9%
Interstate
52.9%
Intra-Territory
13.2%
Visitor Nights by Origin of Visitor, 2006
Intra-Territory
11.5%
Interstate
57.7%
International
30.8%
Source: Tourism NT (2006a)

Northern Territory Tourism Strategic Plan 2008-2012
12
Unlike the Australian experience, international visitation has weakened slightly in the NT. While international visitation has remained relatively stable in terms of contribution to total visitation, since 2001 the number of international visitors has declined by approximately 50,000 visitors. Since about 2003, the numbers and subsequently visitor nights spent by international visitors to the NT has stabilised and more recently grown. The Northern Territory Tourism Forecasting Panel forecasts average annual growth of 2.1% to 2009 for both international holiday visitor numbers and nights.
Figure 2.9: International Holiday Visitor Trends in NT, 1999 to 2006
0
50
100
150
200
250
300
350
400
450
1999 2000 2001 2002 2003 2004 2005 2006
Visitors ('000)
0
500
1000
1500
2000
2500
3000
3500
4000
Visitor Nights ('000)
Visitor nights
Visitors
Source: Tourism NT (2006a)
The Territory has recorded growth in domestic visitors, which remain the largest source of visitor nights at 70%, despite a slowdown in domestic tourism growth across Australia. This has been mostly due to growth in domestic holiday visits to the NT in recent years; a positive reflection on recent Tourism NT marketing efforts. The outlook for the domestic tourism market is relatively static. Despite a continued increase in the number of domestic tourism trips being forecast, shorter stays will result in marginal growth in visitor nights, with an expected annual increase of 0.3% per annum to 2015. The Northern Territory Tourism Forecasting Panel forecasts a stronger outlook for the NT, with domestic market visitor numbers forecast to grow by 1.6% to 2009 and domestic visitor nights by 0.7% over the same period.
The NT tourism industry is forecast to record growth of
1.6% and 2.1% in domestic and international visitor numbers, respectively, in 2009, comparatively faster and
slower rates compared with the Australian forecasts.

Northern Territory Tourism Strategic Plan 2008-2012
13
Figure 2.10: Domestic Holiday Visitor Trends in NT, 1999 to 2006
0
100
200
300
400
500
600
1999 2000 2001 2002 2003 2004 2005 2006
Visitors ('000)
0
500
1000
1500
2000
2500
3000
3500
4000
4500
Visitor Nights ('000)
Visitor nights
Visitors
Source: Tourism NT (2006a)
2.2 Drivers and Influences
2.2.1 Variability in Demand
The environment in which the tourism industry operates is constantly changing. Tourism demand is influenced by a substantial number of internal and external factors, including economic and social trends, broader tourism industry trends, infrastructure and access arrangements, labour and skills issues, marketing and promotion efforts, and research and innovation techniques. The introduction of low cost airlines to the Australian market and constant improvements to international air access arrangements have changed the dynamics of the tourism industry, both working for and against the NT, as have other trends such as improved information access, reduced leisure time, increased substitutability and the rise of the grey nomad market. Tourism NT has maintained an active marketing program and has developed branding tools to strengthen its marketing message. The movement of the Australian labour market toward full employment, along with a sustained commodities boom, has placed pressure on the industry to attract and retain skilled labour, particularly in regional locations, resulting in a number of acute skills shortages that threaten the viability of new and existing development. Innovation, which is essential to creating competitive advantage, currently remains limited in value-adding to core NT tourism icons. Tourism demand in the NT is subject to ongoing seasonal visitation fluctuations that parallel weather conditions. The result is a low point in visitation in the March Quarter (wet and/or hot) and a high point in the June/September Quarters (dry and cooler), with numbers fluctuating between 50,000 visitors in the low season and up to 300,000 visitors in the peak. All tourist destinations in Australia experience seasonality. However, the effect is pronounced for the NT, particularly in the Top End. Since 2000, the NT has experienced an overall decline in international visits – in line with a global reduction in international travel. This is attributed to poor traveller confidence with several years of weak global economic conditions, the commencement of large-scale terrorist activities, and world events such as the Iraq war, oil prices and the SARS outbreak. In 2005, there was a reversal of this trend, with an increase in the number of international visitors. However, the average length of stay of visitors to the Territory shortened.

Northern Territory Tourism Strategic Plan 2008-2012
14
Figure 2.11: Visitor Trends to NT by Annum, 1999 to 2006
Source: Tourism NT (2006f)
The NT tourism industry’s tourism demand is impacted by a
number of internal and external factors, including domestic, international and seasonal tourism influences.
2.2.2 Global Drivers and Trends
The following global trends are considered to be influencing travel behaviour in target international markets:
• Increased independence of the consumer: Consumers are more confident and experienced and expect information about travel destinations to be available globally. Major tools of the more confident tourist are comprehensive guide books and the Internet as an information source;
• Strengthening of the Internet: The Internet is increasingly used for holiday planning,
information and booking travel. Industry no longer has a choice in continuing to adapt to the online world – it is essential to adapt simply to hold market ground;
• Change in traditional distribution networks: The travel distribution network has lost
influence in mature markets. Online product distributors such as Travelocity.com, Expedia and ZUJI are evolving to remain relevant;
• Increasing substitutability of competitor destinations: Other Australian and
international destinations are fighting to position themselves in the market as the “owners” of the iconic outback, nature and/or culture image;
• Social attitudes: Global social attitudes show a concern for health and well being, as
well as a desire for personal fulfilment. Travellers are also concerned for the environment and are demanding socio-culturally acceptable and sensitive experiences. These should preferably involve interaction with the natural environment and indigenous cultures;
• Personalised itineraries: Personalised itineraries, once a niche market, are becoming
increasingly popular at the expense of organised travel. Through the Internet, people are more confident to make their own plans;
• Demand for high quality/standard products and services at a competitive/low cost:
Travellers are demanding better experiences at a lower cost as competition continues to raise the bar in the global tourist market. Skills shortages in the NT place additional stress on businesses competing on the international stage;

Northern Territory Tourism Strategic Plan 2008-2012
15
• Trends to more frequent, short-stay holidays: Market data displays a decline in the average length of stay for holidayers, with analysis indicating more frequent, yet shorter trips being taken. It is hypothesised that the current climate of conflicting priorities – e.g. work schedules between spouses; children; work related priorities and finances – has catalysed this trend.
• Prices: This includes the price (or cost) of travel, destination prices, the cost per
person (this is especially pertinent for family units) and other tour/travel associated costs and prices. The structuring of pricing – to reflect perceived value rather than simple cost plus, is crucial to competing with low cost destinations;
• Household income: The amount of disposable income in a family is correlated with
demand for travel. Drivers such as interest rates and cost of living impact household expenditure affecting their capacity for leisure and travel. Household incomes are rising rapidly through much of the Asian markets in close proximity to the Territory;
• Exchange rates: The strength of the source country’s and destination country’s
currency can greatly affect the cost of an international holiday. The Australian dollar is currently strong, in part due to the minerals boom, resulting in a loss of competitiveness for the NT and Australian tourism industries in some markets such as the US and Japan;
• Seasonality: Travel patterns are affected by seasonal influences such as weather,
sports, events, public holidays and other such ‘seasonal’ periods. The NT, particularly in the Top End, has a strongly seasonal climate with a clear impact on domestic tourism. Key holiday periods do not necessarily match the best times to visit a given location. The major domestic summer holiday market is poorly represented in the NT (particularly Darwin) due to this time of the year being hot, leading to a perception of being uncomfortable and difficult to travel. This is exacerbated by the key attractions being outdoor, and relatively remote. However, for the international market the low season does allow visitors to escape the northern hemisphere winter;
• World events: Events including terrorism, natural disasters, health scares and many
others can reduce the amount of trips that people travel internationally. These events are beyond control or influence and hence management can only be responsive; and
• Politics: Political factors in the source and destination country as well as the bilateral
relationship can impact on the level of demand for travel. A clear-cut example is China, which only allows its citizens to be regular tourists in ‘Approved Destination Status' countries.
2.2.3 Domestic Drivers and Trends
Demand drivers affecting domestic tourism on a continuing basis include: • Prices: The price of a holiday is the major determinate of demand. Major costs are
airfares, accommodation and fuel. The high price of oil is a major deterrent for the self-driver domestic tourist in the NT; although this sector has grown it would certainly have grown more had oil prices not have moved to such high levels. Current strong Australian exchange rates has also made overseas holidays more affordable to the domestic market;
• Air travel availability and capacity: The collapse of Ansett in 2001 was the single
largest negative impact on travel to the NT. In recent times air travel to the NT has become more readily available and economic with the introduction of airlines such as Virgin, Jetstar and Tiger (November 2007). This change in the air travel market has helped to even out the competition for tourists across Australia as distance becomes less of a consideration in customer choice as the relativity of ticket price to disposable income has reduced. However, it has also increased accessibility to competing regional tourism destinations in Australia and Asia. A further issue impacting the NT is the back of clock scheduling of flights with many occurring at inconvenient times;

Northern Territory Tourism Strategic Plan 2008-2012
16
• Information accessibility: Information technology and a suite of new popular travel guides has meant that customers can conduct extensive research and itinerary planning from home. This has further levelled the playing field between tourist destinations and reduced the power of travel agents to influence where holidays and visits are taken;
• Destination image: Negative media coverage of a destination impacts the
attractiveness of the destination in the minds of the consumer. Nowhere is this more evident than the recent negative publicity surrounding health and child welfare in the Territory’s Indigenous communities which negatively impacts the significant opportunity offered with cultural tourism;
• Household income, assets and debt: The amount of disposable income is correlated
with demand for travel. Drivers such as interest rates, asset prices and cost of living impact household expenditure affecting capacity for leisure and travel. Wages are continuing to increase rapidly in Australia, however higher interest rates and sluggish growth in property prices in the major cities is reducing consumer confidence;
• Interstate migration patterns: A large proportion of domestic tourism is associated,
at least in part, with visiting friends and relatives. Regions in Australia that have strong population growth are also experiencing strong growth in domestic visitation, with flow-on benefits for regional tourist destinations and activities;
• Seasons: The NT has a highly seasonal climate that impacts tourism. Key holiday
periods do not necessarily match the best times to visit the NT. The major domestic summer holiday market is poorly represented in the NT (particularly Darwin) due to this time of the year being hot and wet;
• Time availability: The amount of leisure time that people have away from work
impacts on whether they are able to travel. Probably the most significant factor is the increased prevalence of double income families, which makes coordinating holiday time more difficult. Time restricted holidayers demand destinations where they can step off the plane and see sights and product immediately; and
• Business/government activity: The amount of business and government investment
in a region plays a role in corporate travel demand. There is an opportunity for the NT to improve its destination image with corporate patronage generated by the current strong Territory economy and mining investment.
2.3 Performance and Growth
The NT tourism industry’s performance has been sound over the past 5 years when considered in the context of global and national tourism market trends. Performance in recent times has stuttered due to a number of global tourism shocks. These shocks have especially affected the NT tourism industry due to its 30% exposure to the international market. Slower growth in the domestic market has further compounded the international effect, being affected in particular by the collapse of Ansett in 2001-02. While low cost carriers such as Virgin Blue and Jetstar have in time replaced many of seats lost from the Ansett collapse (the NT has iust reached the capacity it had prior to the Ansett collapse), these low cost carriers are not linked into global distribution networks (such as Qantas is) and their impact has mainly been limited to the domestic market. NT’s market share of national visitor expenditure has reduced marginally to 3% of domestic spend and 7% of international spend. On the plus side, average daily expenditure and yield from visitors is the highest of any state or territory – although international visitors reduce their overall yield with relatively short periods of stay in the NT.
Northern Territory Tourism Strategic Plan 2008-2012
17
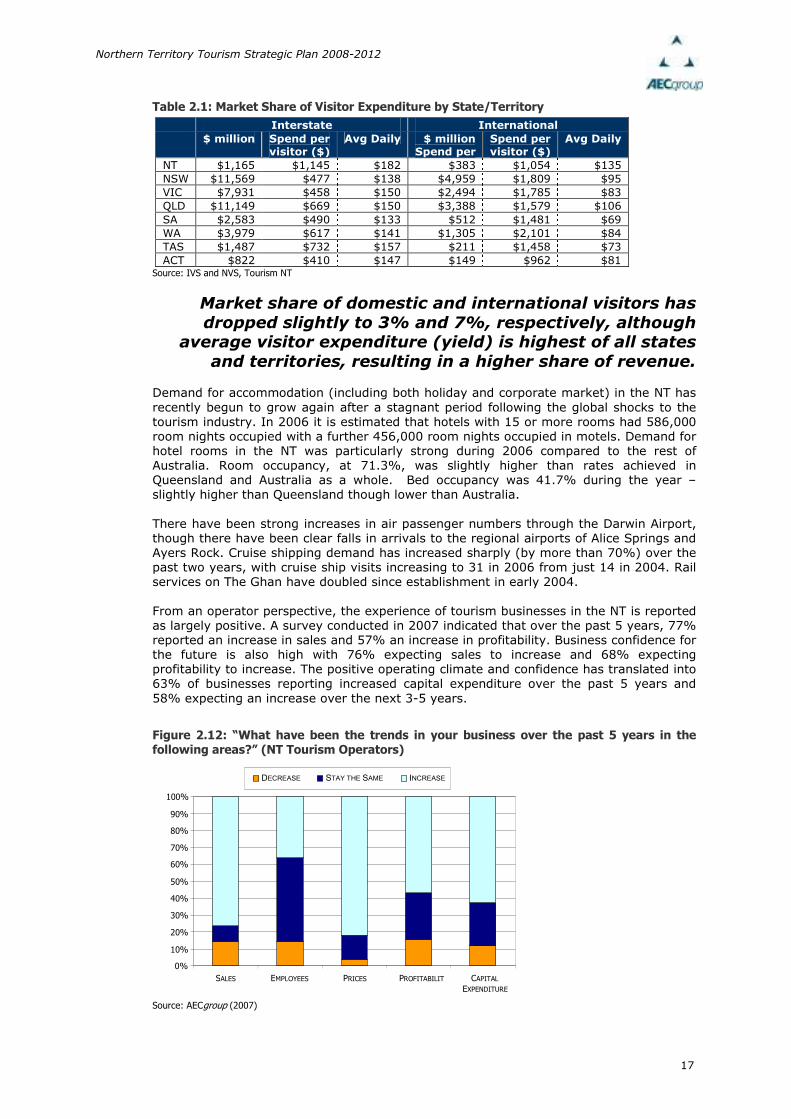
Table 2.1: Market Share of Visitor Expenditure by State/Territory
Interstate International
$ million Spend per visitor ($)
Avg Daily $ million Spend per
Spend per visitor ($)
Avg Daily
NT $1,165 $1,145 $182 $383 $1,054 $135 NSW $11,569 $477 $138 $4,959 $1,809 $95 VIC $7,931 $458 $150 $2,494 $1,785 $83 QLD $11,149 $669 $150 $3,388 $1,579 $106
SA $2,583 $490 $133 $512 $1,481 $69 WA $3,979 $617 $141 $1,305 $2,101 $84 TAS $1,487 $732 $157 $211 $1,458 $73 ACT $822 $410 $147 $149 $962 $81
Source: IVS and NVS, Tourism NT
Market share of domestic and international visitors has
dropped slightly to 3% and 7%, respectively, although average visitor expenditure (yield) is highest of all states
and territories, resulting in a higher share of revenue. Demand for accommodation (including both holiday and corporate market) in the NT has recently begun to grow again after a stagnant period following the global shocks to the tourism industry. In 2006 it is estimated that hotels with 15 or more rooms had 586,000 room nights occupied with a further 456,000 room nights occupied in motels. Demand for hotel rooms in the NT was particularly strong during 2006 compared to the rest of Australia. Room occupancy, at 71.3%, was slightly higher than rates achieved in Queensland and Australia as a whole. Bed occupancy was 41.7% during the year – slightly higher than Queensland though lower than Australia. There have been strong increases in air passenger numbers through the Darwin Airport, though there have been clear falls in arrivals to the regional airports of Alice Springs and Ayers Rock. Cruise shipping demand has increased sharply (by more than 70%) over the past two years, with cruise ship visits increasing to 31 in 2006 from just 14 in 2004. Rail services on The Ghan have doubled since establishment in early 2004. From an operator perspective, the experience of tourism businesses in the NT is reported as largely positive. A survey conducted in 2007 indicated that over the past 5 years, 77% reported an increase in sales and 57% an increase in profitability. Business confidence for the future is also high with 76% expecting sales to increase and 68% expecting profitability to increase. The positive operating climate and confidence has translated into 63% of businesses reporting increased capital expenditure over the past 5 years and 58% expecting an increase over the next 3-5 years.
Figure 2.12: “What have been the trends in your business over the past 5 years in the
following areas?” (NT Tourism Operators)
0% 10% 20% 30% 40% 50% 60% 70% 80% 90%
100%
SALES EMPLOYEES PRICES PROFITABILIT
Y CAPITAL
EXPENDITURE
DECREASE STAY THE SAME INCREASE
Source: AECgroup (2007)

Northern Territory Tourism Strategic Plan 2008-2012
18
Air passenger numbers are up, rail demand has doubled,
accommodation occupancy compares well to national benchmarks and business performance has been positive.
Figure 2.13: “Over the next 3-5 years, do you expect your business to experience an increase, decrease or stay the same for each of the following?” (NT Tourism Operators)
0%
10%
20%
30%
40%
50%
60%
70%
80%
90%
100%
Sales Employees Prices Profitability Capital
Expenditure
Decrease Stay the Same Increase
Source: AECgroup (2007)
2.4 Labour and Skills
The tourism industry is service-based and therefore labour intensive. Labour represents the most significant variable cost to operators, as such the productivity and availability of workers significantly influences the competitiveness of the tourism industry and the yield of tourism enterprises. During 2003/04 it is estimated that there were approximately 12,845 people directly employed in the NT tourism industry, equating to 8.7% of all employed people in the NT. The largest tourism related employer is the Retail Trade sector with over 2,200 employees, or 17.4% of all people employed in the NT tourism industry. Other sectors with significant employment are Air & Water Transport and Accommodation, accounting for 15.7% and 14.5% of NT tourism employment, respectively.
Table 2.2: Employment in the NT Tourism Industry, 2003-04
Industry Direct Employees
% of Tourism Employment
Retail Trade 2,235 17.4%
Air & Water Transport 2,017 15.7%
Accommodation 1,863 14.5%
Travel agency & Tour Operators 1,708 13.3%
Other Tourism Characteristic & Connected Industries 1,040 8.1%
Cafes & Restaurants 1,002 7.8%
Road Transport & Motor Vehicle Hiring 899 7.0%
All Other Industries 809 6.3%
Other Entertainment Services 758 5.9%
Clubs, Pubs, Taverns and Bars 514 4.0%
Total 12,845 100.0% Source: CRC for Sustainable Tourism (2007)
The workforce of the tourism industry is characterised by:
• Demographics: The tourism workforce is young relative to other industry sectors. Statistics from the ABS (2005) in the March Quarter 2005, indicate more than 35% of employees in the Accommodation, Cafes & Restaurants and Retail Trade sectors are

Northern Territory Tourism Strategic Plan 2008-2012
19
aged between 15 and 24 years, more than double the all-industry average. The median age of the NT is 31 years which is younger than the national average of 35;
• Employment Arrangements: Casual and part-time employment is prominent in the
tourism industry, with this type of employment increasing as a proportion of total employment over the past decade. The seasonality of the tourism industry contributes to this trend. Difficulties in attracting local labour means that backpackers are often employed during peak season to meet demand;
• Skill Levels: The tourism industry is characterised by a high proportion of occupations
requiring minimal skills and training. As expected, the tourism workforce demonstrates a lower qualification profile compared with the all-industry average;
• Labour Mobility: Research suggests high staff turnover is a feature of the tourism
industry. Tourism employees exhibit a higher tendency to switch between jobs both within and outside the industry when compared with other workers. The casual and part-time nature of many work positions, the seasonality of the industry, the competitiveness for good staff and the high share of jobs not requiring formal qualifications all contribute to this result. In 2005 over 50% of accommodation, cafes and restaurants in the NT reported rates of staff turnover of 20% or more;
• Seasonality: The profound wet and dry season in the Top End impacts heavily on
tourism and employment. During peak tourist season many jobs are filled by backpackers as they are able to provide more flexibility and are therefore more attractive to employers; and
• Training: The most common forms of training provided by employers in the tourism
industry are non-accredited on-the-job and in-house training, whereby workers learn informally from co-workers while doing their job. A large proportion of tourism firms are micro-businesses meaning that they do not have the size to be able to carry out accredited training in-house. In 2005, 6% of all training courses were involved in hospitality courses in line with the comparative size of the tourism industry in the NT.
Skills shortages are generally likely to be more prevalent during periods of strong economic growth (or economic boom times). With Australia recording relatively strong and sustained economic growth for the major part of the past decade, skills shortages in general have increased across all industry sectors, including tourism. However, the causes of skills shortages in tourism are different in nature to other service industries. The NT is experiencing labour shortages in many industries, including tourism-related sectors. The NT Department of Employment, Education and Training (DEET) have identified the following tourist related occupations as suffering from territory-wide labour shortages and recruitment difficulties in 2006 – hospitality middle and upper management, hospitality staff, chefs, pastry chefs, cooks, tour guides and sales assistants.
Skills shortages represent a major challenge for the future sustainability of the NT tourism industry, particularly
attracting and retaining labour in regional areas.
2.5 Investment
Several projects are currently being undertaken in the NT that will boost the tourism industry. Private sector and Territory Government investment, as well as partnerships, form the basis of investment in transport infrastructure, resorts and accommodation. The value of non-residential building approvals has increased significantly in the NT. The value of non-residential building approvals in 2005/06 totalled $274 million (of which $113 million was accommodation). This was over $160 million higher than 2004/05; an increase of 149.7%. Australia produced growth of 26.9% in the same period.

Northern Territory Tourism Strategic Plan 2008-2012
20
Table 2.3: Value of Non-Residential Building Approvals, 2005/06
NT Australia
Entert. & Rec Accomm
Total Non-Residential
Entert. & Rec Accomm
Total Non-Residential
2000/01 ($000) $25,508 $10,787 $96,206 $688,470 $442,560 $9,529,091
2004/05 ($000) $16,487 $7,330 $109,740 $630,017 $1,363,378 $15,807,676
2005/06 ($000) $4,853 $113,494 $273,978 $903,649 $1,243,952 $20,065,840
00/01 - 05/06 -70.6%1,448.3% 149.7% 43.4% -8.8% 26.9%
04/05 - 05/06 -28.2% 60.1% 23.3% 5.6% 23.0% 16.1% Source: ABS 8731.0
The most significant tourism related project being undertaken in the NT at present is the $1.1 billion Darwin Waterfront Development. The project includes an upgrade of both the sea freight and cruise shipping precincts. Being undertaken in several phases, the cruise shipping waterfront quarter at completion will include the Darwin Convention Centre - a 1,500 seat auditorium and 4,000 sq metres of exhibition space, suitable for international and national conventions and exhibitions, community leisure and recreation facilities including an impounded water body, sea wall, wave lagoon, safe swimming area, public promenade, children’s playground, open performance areas, parklands and picnic areas, 241 rooms spread across a hotel and serviced apartments and harbour side cafes and restaurants. In terms of transport infrastructure, the Airport Development Group has developed the Master Plan 2004-2024 for Darwin Airport and Alice Springs Airport that plans to invest in the expansion of both airports. Future investment to meet increased passenger numbers will include expansion of apron and parking facilities to cater for more aircraft and larger planes as well as redevelopment of the terminals. The rail network that connects Adelaide with Darwin via Alice Springs is used by the Ghan train and is at a current level that will only require small upgrades and investment in the medium term. The NT and Federal Governments are spending large amounts of money in completing road projects in the Territory. Major road projects that will benefit tourism include:
• $10.5 million ongoing for the Red Centre Way • $45.9 million ongoing for the Victoria Highway • ongoing upgrading of the Litchfield loop road
The Darwin Airport Resort was opened in May 2005 after the airport made land available in 2004. An investment of $9.8 million was made in constructing the 130 room resort. High demand in the first year has led to the resort expanding by an additional 70 rooms. Planning and approval has been given for the development of a tropical resort at ‘Little Mindil’ in Darwin. The NT Government has chosen the Sky City Entertainment Group (SCEG) as the preferred developer. SCEG has put forward an offer of $6.6 million for the land with a plan to build a 122 room, 5 star tropical resort and redevelop and incorporate the adjacent casino. There are number of potential resort developments that are in the early stages of planning. These resorts are intended for regional areas such as Katherine, Alice Springs and within Kakadu National Park. Many smaller projects are being undertaken throughout the Territory in an effort to build tourism infrastructure. These projects are diverse and include natural sites and new attractions. There are plans by the Territory Government to build a museum to commemorate WWII and the role that Darwin played. Still only in the early stages of planning, the museum would also likely include a WWII heritage trail passing major historical sites in Darwin. Other tourism infrastructure investments outlined in the NT Budget 2006 include $1 million to improve Nitmiluk National Park, $1.1 million to upgrade Fisherman’s Wharf, $800,000 for ongoing work for the West MacDonnell Ranges Visitor Centre and $500,000 for the Hidden Valley upgrade – the venue for the NT V8 Supercars series.

Northern Territory Tourism Strategic Plan 2008-2012
21
Investment in the NT tourism industry is increasing rapidly
in the areas of accommodation, transport and attractions, both in metropolitan and regional areas, although there
remain a number of investment challenges for the future.
Northern Territory Tourism Strategic Plan 2008-2012
22
3 Planning for the Future
3.1 SWOT Analysis
3.1.1 Strengths
• Major natural tourist attractions – The NT features a range of naturally occurring, significant and internationally recognised tourist attractions, including Uluru (Ayers Rock), and Kakadu National Park, two of Australia’s iconic landmarks.
• Recognition as a true “Outback” experience – The NT has developed a strong market
image as a true Australian “Outback” experience.
• Recent level of investment in major tourism infrastructure such as the Darwin Waterfront and Kakadu.
• Association with nature and adventure experiences – The NT has developed strong
market recognition as a nature-based and outdoor adventure tourism destination.
• Cultural aspects – The NT has a unique and long established Indigenous history and culture as well as a unique contemporary culture.
• Climate – The NT provides a relatively warm and dry climate during the winter season,
which is a welcome escape for both international and domestic tourists. The summer season is also attractive for international tourists escaping the northern winter.
3.1.2 Weaknesses
• Lack of diversity of tourist experience – The NT tourism industry is heavily reliant on nature-based and outdoor adventure tourism experiences, limiting its target market to this segment of the total tourist market. Additionally, tourism products are heavily skewed towards major attractions in a few geographic locations, with limited tourism options and experiences available in many regions of the NT. The lack of choice reduces the attractiveness of the NT in relation to alternative holiday destinations. In addition there is a distinct shortage in the luxury product category.
• Reliance on nature/natural attraction tourist destinations – Other regions, both
domestic and international, feature a range of unique natural attractions with high quality nature-based and outdoor adventure experiences that compete strongly with the NT in this tourist market segment.
• Access constraints – Air and road access to the NT is constrained both domestically
and internationally due to its geographic isolation from major source markets. Access by air is constrained by relatively few direct international flights to the NT compared to major cities along the east coast of Australia while road access is constrained by the lack of all weather roads. Additionally, the NT is widely dispersed, with relatively poor connections between major tourism destinations.
• Fragmentation of tourism industry – The NT tourism industry comprises a large
number of small businesses with minimal linkages. As a consequence, the NT lacks a critical mass of networked tourism-focussed businesses to mobilise and generate economies of scale and scope within the industry. This is in comparison to competitors such as Queensland with a large number of tourism-focussed businesses that are mobilised, specialised and locally linked.
• Seasonality of the industry – The visitor flow to the NT is concentrated in the cool
season (May to October) when conditions are cooler and roads are easier to travel. The low level of business in the wet season impacts cash flow and staffing.
• Social perceptions of the NT – Negative perceptions of the NT through the media
highlighting issues in the NT’s remote communities in particular are negatively impacting on the image of the NT as a positive destination.
Northern Territory Tourism Strategic Plan 2008-2012
23
• Indigenous engagement – Many of the NT’s Indigenous communities remain highly
disadvantaged in terms of health, education, infrastructure and general participation in the economy. An inability to engage the Indigenous community is a weakness for many sectors of the NT, including the tourism industry.
• Constraints to investment – Ensuring the quality of products, services and
infrastructure provided in the NT is important to increase visitor satisfaction and amenity. This includes, but is not limited to, safety standards, quality of information and services provided by tourist businesses, transport infrastructure, accommodation and access to icons and destinations. However, due to the fragmented nature of the tourism industry, as well as the large size and widely dispersed nature of the NT, investment to deliver these outcomes is somewhat constrained.
3.1.3 Opportunities
• Increasing inbound travel from Asia – The NT is relatively close to major source markets in Asia, which has a very large population base with increasing disposable income and is forecast to continue strong economic growth. As a result, countries such as China, India and South Korea are identified as emerging markets and are expected to be major contributors to global increases in tourist numbers.
• Opportunity to develop a reputation in the NT for innovative, unique, luxury,
indulgent, experiential product. The NT already boasts a number of unique tourism products and has developed significant experience with the spirited traveller and experience-seeker tourist. The opportunity is to take this further and better differentiate the NT from competing destinations.
• Indigenous tourism integration – The NT has a unique and long established Indigenous
history and culture. However, there is a distinct and noticeable lack of integration of Indigenous culture and involvement in the NT tourism industry. There is a significant opportunity to develop tourism with the Indigenous people, their lands, culture and art, in order to provide authentic Indigenous cultural experiences catering to the growing demand in this market segment.
• Diversification of tourism destinations – The iconic landmarks of Uluru and Kakadu
dominate consumer perceptions of tourism in the NT. There is an opportunity to expand the tourism market to other areas by building on the unique cultural, agricultural and outback characteristics of these regions. However, many areas of potential tourism attraction in the NT are currently inaccessible and improved roads and access arrangements will be required to increase the product availability in the NT. Many of these areas depend on engaging the Indigenous workforce.
• Expansion and packaging of tourism experiences – Opportunities exist to develop
alternatives to iconic tourism products and expand the range of tourism experiences, including aquatic, nature, historical, cultural, recreational and food tourism based activities. This would also provide an opportunity to enhance the link between tourism and other industries such as agriculture, manufacturing, accommodation, cafés and restaurants, and cultural and recreational services, as well as promote the NT’s unique characteristics to outside markets and broaden the identity of the NT.
• Improving transport infrastructure and linkages – Currently one of the major
constraints to growth in the tourism industry relates to access limitations. Upgrades are required to road and air transport infrastructure and services to increase tourism capacity. Potential upgrades include road infrastructure enabling all weather access to the NT, expanded road (and potentially air and rail) infrastructure enabling access to more remote areas of the NT, particularly those with cultural and nature-based tourism potential and enhanced linkages between transport modes and destinations, which will decrease travel times and improve tourism connectivity and coordination.
• Developing the summer/wet season market – The NT tourism industry is currently
highly seasonal in nature, impacting negatively on business profitability and sustainability, skilled labour attraction and retention, and investment attraction. In
Northern Territory Tourism Strategic Plan 2008-2012
24
order to smooth seasonal effects, there is an opportunity to examine strategies for extending the shoulder season and attracting visitors during non-peak periods.
• Developing business tourism – The MICE market, including out of Asia, has significant
potential for the NT as the tourism industry develops the infrastructure and skills to cater to these travellers.
• Development of the cruise ship industry – The cruise ship industry in Australia is
growing at rates of 10% per annum and given the NT’s location there is considerable growth potential for the sector. Significant investment in specialised infrastructure and facilities is underway – the challenge will now move to maximising visitation by building the attractiveness of Darwin as a port of call.
• Increasing the number of return visitors – The reliance on sightseeing icons for the NT
tourism industry can result in a low return visit rate. The industry needs to better convert patronage to icons into return visitors by providing a wider range of experiences and destinations, as well as more activity and adventure based options.
3.1.4 Threats
• Competition for the ‘Real Outback’ image – The NT has been successful with its campaign to associate the Territory with the ‘Real Outback’ experience. Other regions of Australia, such as Western Queensland, NSW and the Kimberly, are increasingly attempting to position themselves as the ‘Real Outback’, providing greater competition in this segment.
• Levelling of the global tourism market – The global tourism market has become more
open, with improved access to a larger number of destinations. This has increased competition between destinations competing in similar target market segments. Low cost carriers are operating an increasing number of services from key NT source markets to international and domestic destinations with highly competitive product. Additionally, the increasing ease of research and booking (internet) has improved the competitiveness of destinations with little collateral for market development. The new breed of tourist is becoming more adventurous and will equally seek out an experience in a relatively undiscovered part of a developing country as they will a package to the NT promoted by a travel agent.
• Skills and staff shortages – Australia, particularly regional Australia exposed to the
resources sector, is facing critical skills shortages. Combined with the seasonality of tourism, the forecast decline in backpackers and the generally lower pay of tourism jobs, the NT tourism industry is in danger of being severely constrained by skilled staff availability. This could potentially result in deteriorating service levels and could adversely impact the market reputation of the NT tourism industry.
• Increasing travel expenses – Increasing expenses such as the costs of fuel and
accommodation have resulted in travel becoming less affordable in Australia in recent years. While fuel prices are not forecast to continue to rise in the medium term, pricing carbon emissions will further increase the cost of travel.
• Continued rise of the Australian dollar – Further strength in the Australian currency
would impact key international markets, particularly those which are most likely to see their currencies fall further such as the USA and Japan.
• Carbon intensity – The NT’s core markets in Europe, North America and Australia are
increasingly concerned about the sustainability and carbon intensity of their travel decisions. With the NT a long distance from its core markets, and with large distances between attractions within the NT, increasing concerns regarding the carbon intensity of travel will hurt the NT tourism industry harder than many other destinations.
• Climate change – A warmer climate may impact on the attractiveness of many of the
NT’s iconic natural sites and also extend the off-season in summer. Kakadu is also understood to be at risk of major saltwater intrusion into its world-heritage wetlands following relatively small sea level rises.
Northern Territory Tourism Strategic Plan 2008-2012
25
• Increasing global event risk – Threats of global events such as terrorism and health scares have increased, making the outlook for international tourism more volatile.
• Rising interest rates – Recent increases in interest rates in Australia have resulted in
an increase in the cost of accessing capital and repayment of loans, decreasing domestic consumers’ disposable income and ability to access capital. This reduces consumer ability to make discretionary purchases, such as holidays.
3.2 Key Issues
The NT tourism industry continues to face significant challenges, both new and old:
• Seasonality – The NT tourism industry is highly seasonal in nature as determined by the wet and dry seasons. The highly seasonal nature of the industry impacts on long-term industry sustainability, with key issues including: o Ability of tourism operators to cope with demand during peak periods; o Business profitability and cash-flow during low demand periods; o Ability to attract and retain skilled labour due to seasonal demand effects;
and o Ability to attract investment in the industry, particularly key infrastructure.
• Business profitability and cash-flow during low demand periods impacting:
• Ability of tourism operators to cope with demand during peak periods; • Ability to attract and retain skilled labour due to seasonal demand
effects; and, • Ability to attract investment in the industry, particularly key
infrastructure.
• Engaging Indigenous people – Indigenous people present a potential long-term resource and asset to the NT tourism industry. Around 30% of the NT’s population is Indigenous and Indigenous people control nearly 50% of the NT’s land. The NT tourism industry will not develop to the its full potential without strong participation from the Indigenous population. Internationally, there is great interest in experiencing and learning about the multitude of traditional customs and lifestyles in the NT. Tourism is one of the few industries that can provide significant sustainable economic opportunities for Indigenous communities in some of the remote areas of the NT.
• Lack of collaboration – Other than for joint marketing or distribution, tourism
businesses in Australia are below average in terms of collaboration. Greater cooperation and collaboration between the NT Government, tourism associations, and businesses in the tourism industry is required in order to improve the efficiency and profitability of the NT tourism industry, as well as enhance tourism experiences and increase the attractiveness of the NT as a tourism destination.
• Climate change - The issue of climate change brings with it three main areas of
risk to the NT tourism industry. The first is that the NT already suffers from severely reduced visitation during the warmer parts of the year and an overall increase in temperatures is likely to increase the season for which many tourists chose to avoid the NT. Secondly, even relatively small rises in sea levels will impact some of the NT’s most valuable natural assets, most notably the wetlands of Kakadu. Thirdly, as consumers become more carbon conscious and carbon taxes become a reality long haul travel destinations will become less attractive. The NT tourism experience is both a relatively long distance from its major markets and involves travelling relatively long distances once within the NT.
• Growth of the learning / cultural tourist market niche – Market trends in the most
mature tourist markets is toward a stronger interest in cultural experiences and destinations that provide learning opportunities. This niche is seeking genuine experiences that provides contrast to experiences at home. The challenge for the NT is to leverage its uniqueness and differences to provide a compete for the domestic traveller who is increasingly choosing overseas destinations for their greater contrast in experiences and cultures.

Northern Territory Tourism Strategic Plan 2008-2012
26
• Accessibility – Given the NT is a widely dispersed region, significant transport
infrastructure is required to provide access to key tourism destinations in the NT and facilitate growth. Air transport is particularly important to travel the considerable distances involved, as is road infrastructure to accommodate local and intra-regional travel and the self-drive market.
• Skills availability – The tourism industry is highly labour intensive. The
productivity and availability of workers significantly influences the competitiveness of the tourism industry and the yield of tourism enterprises. With Australia currently experiencing relatively strong and sustained economic growth, skill shortages have more-or-less increased across all industry sectors, including tourism. This is impeding the industry’s ability to take advantage of demand growth. Further, the highly seasonal nature of tourism (and therefore demand for labour) is a deterrent to business to invest resources in providing training to employees to build capacity and increase efficiency. There are several factors particularly relevant to the NT that currently impede the supply of labour and skills including the spread of tourism in the regions, seasonal nature of the industry, lack of tourism training and investment and a low participation rate of the Indigenous workforce.
• International competition – The international tourism market is highly
competitive. Increasing accessibility to competing destinations and the current strong Australian dollar is providing tourists with new experiences at lower prices, particularly those in developing countries. As a result, Australia cannot generally compete on price, and therefore needs to look at other strategies to attract visitors such as high levels of product differentiation, targeting of less price sensitive market segments, and a larger investment in research and innovation, sales and marketing.
• Development of growth tourism markets – In order to position the NT as a tourist
destination of choice it is necessary to cater for the experiences that will attract visitors in key growth and emerging markets, and position the NT as a viable alternative to overseas travel for Australians. Key emerging markets that the NT is well placed to accommodate include authentic, socio-culturally acceptable and sensitive experiences, eco-tourism and nature-based holidays, rest and relaxation, and wellness and health holidays and sports and adventure holidays.
• Land-related barriers: A significant proportion of land in the NT is subject to
National Park and Native Title regulations. This leads to complex procedures in order for the land to be developed under the Aboriginal Land Rights (NT) Act 1976 and the Native Title Act 1993. There is also a lack of incentive for development occurring on Aboriginal land resulting in investment being below optimal levels. In addition the tenure arrangements on pastoral land do not encourage tourism investment. A significant portion of the NT’s major tourist attractions are National Parks and other protected regions (including pastoral leases). Yet these are also the areas where the demand for new tourist accommodation is at its highest. The length of tenure available for leasehold land in national parks and native title land is a severe impediment to investment.
• Investment in transport infrastructure – A lack of air capacity into the NT has
meant that airport expansions have not always been a priority. Heavy regulation in the industry has been damaging to the NT, such as the Australian Government determining who can fly international routes into Australia through bilateral Air Services Agreements. Encouragingly, the Federal Government is moving to relax these regulations. The extensive nature of the NT means investment in developing roads is very expensive relative to the population that it will serve. Private investment in roads is very limited with low traffic volumes making toll roads unviable. The sparse nature of the NT population makes further investment in the passenger rail network unviable. Further investment would have to be freight driven as there is insufficient passenger demand to attract additional investment;

Northern Territory Tourism Strategic Plan 2008-2012
27
• Cost or availability of finance – The cost and availability of finance is a barrier to investment by the tourism industry, particularly in regional areas, and in areas where financial institutions may have had poor experiences in the past. Some of the investment constraints are institutional-related with a lack of foreign investment into the Territory especially in the accommodation sector, tax-related arising from the lack of tax benefits to attract tourism investments in the NT and remoteness-related given a significant proportion of tourist attractions in the NT are in remote regional locations with a lack of infrastructure making investment less attractive. Overcoming this impediment will require continual lobbying for change.
• Widely dispersed industry – The tourism industry is spread across the NT with a
large proportion of businesses in regional areas. While this provides greater diversity in product choice, it also creates issues in terms of industry coordination, infrastructure and service provision, and labour attraction and retention.
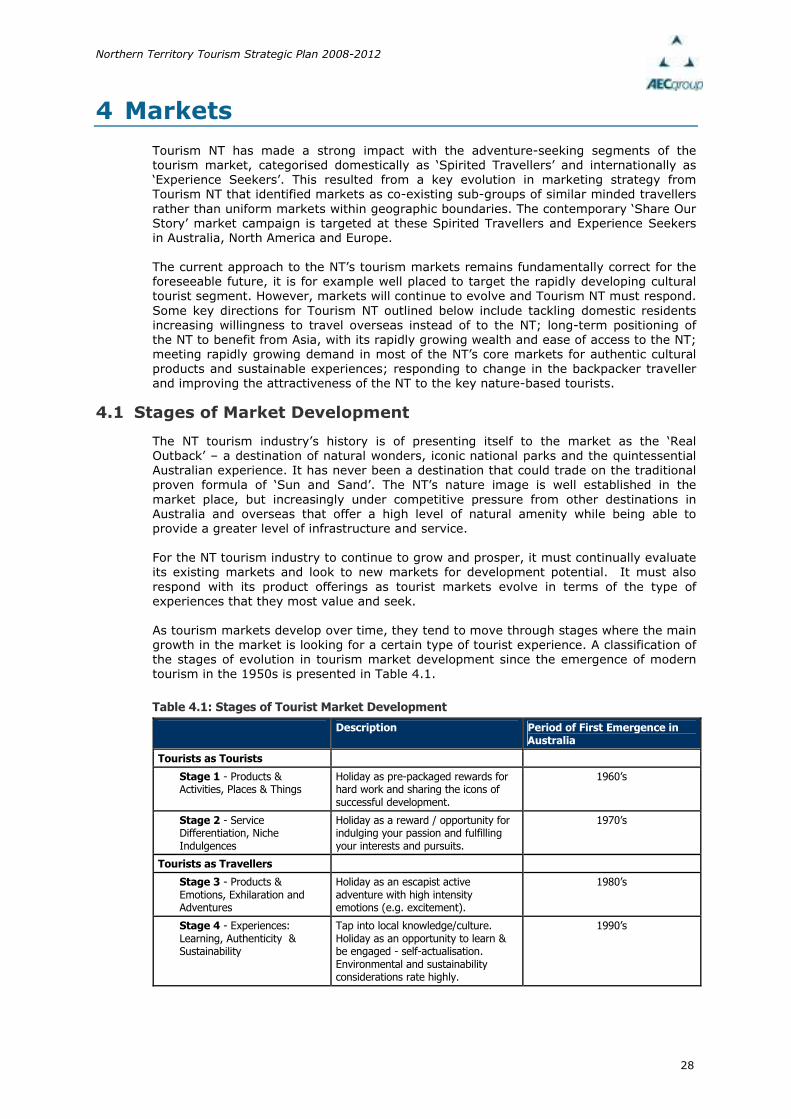
Northern Territory Tourism Strategic Plan 2008-2012
28
4 Markets
Tourism NT has made a strong impact with the adventure-seeking segments of the tourism market, categorised domestically as ‘Spirited Travellers’ and internationally as ‘Experience Seekers’. This resulted from a key evolution in marketing strategy from Tourism NT that identified markets as co-existing sub-groups of similar minded travellers rather than uniform markets within geographic boundaries. The contemporary ‘Share Our Story’ market campaign is targeted at these Spirited Travellers and Experience Seekers in Australia, North America and Europe. The current approach to the NT’s tourism markets remains fundamentally correct for the foreseeable future, it is for example well placed to target the rapidly developing cultural tourist segment. However, markets will continue to evolve and Tourism NT must respond. Some key directions for Tourism NT outlined below include tackling domestic residents increasing willingness to travel overseas instead of to the NT; long-term positioning of the NT to benefit from Asia, with its rapidly growing wealth and ease of access to the NT; meeting rapidly growing demand in most of the NT’s core markets for authentic cultural products and sustainable experiences; responding to change in the backpacker traveller and improving the attractiveness of the NT to the key nature-based tourists.
4.1 Stages of Market Development
The NT tourism industry’s history is of presenting itself to the market as the ‘Real Outback’ – a destination of natural wonders, iconic national parks and the quintessential Australian experience. It has never been a destination that could trade on the traditional proven formula of ‘Sun and Sand’. The NT’s nature image is well established in the market place, but increasingly under competitive pressure from other destinations in Australia and overseas that offer a high level of natural amenity while being able to provide a greater level of infrastructure and service. For the NT tourism industry to continue to grow and prosper, it must continually evaluate its existing markets and look to new markets for development potential. It must also respond with its product offerings as tourist markets evolve in terms of the type of experiences that they most value and seek. As tourism markets develop over time, they tend to move through stages where the main growth in the market is looking for a certain type of tourist experience. A classification of the stages of evolution in tourism market development since the emergence of modern tourism in the 1950s is presented in Table 4.1.
Table 4.1: Stages of Tourist Market Development
Description Period of First Emergence in Australia
Tourists as Tourists
Stage 1 - Products & Activities, Places & Things
Holiday as pre-packaged rewards for hard work and sharing the icons of successful development.
1960’s
Stage 2 - Service Differentiation, Niche Indulgences
Holiday as a reward / opportunity for indulging your passion and fulfilling your interests and pursuits.
1970’s
Tourists as Travellers
Stage 3 - Products & Emotions, Exhilaration and Adventures
Holiday as an escapist active adventure with high intensity emotions (e.g. excitement).
1980’s
Stage 4 - Experiences: Learning, Authenticity & Sustainability
Tap into local knowledge/culture. Holiday as an opportunity to learn & be engaged - self-actualisation. Environmental and sustainability considerations rate highly.
1990’s

Northern Territory Tourism Strategic Plan 2008-2012
29
Description Period of First Emergence in Australia
Stage 5 – Currently Unclear Increased demand for special interest needs and rarity. Increased visiting friends and relative’s travel with people better linking up across the world through better communications. Rise of Hipublicans / Southpark Generation / College Conservatives (mostly less than 18 at present): rational, somewhat selfish, seek authenticity and highly sceptical of any extreme or overly marketed position. Largely happy or accepting of the world as it is.
2000’s
Source: Adapted from McEwan (2007)
Tourist markets do not completely shift away from previous stages, rather those stages stagnate or decline somewhat as demand in the new stage develops. Hence, the early stages (Stages 1 to 3) still present significant niches in a mature market such as Australia, although they tend to be well catered for by existing developments, and offer little prospect of real growth. The early stages should not, therefore, be mistaken as being irrelevant, even for the furthest developed markets. It is typically the case that the consumer firmly seeking Stage 4 type product simply expects Stage 1 to 3 products to be in place, and will be disappointed or even surprised if they are discovered to be lacking. For example the nature driven tourist may still expect to stay in the resort on the beach. The difference is, they are selecting destinations on the basis of nature experiences and expecting the resort to also be there, rather than selecting the destination on the basis of having a good resort, and largely not caring about nature experiences. In truth, the ‘Sun and Sand’ tourism of Stage 2 is still the most reliable drawcard in the global tourism market, even if marginal growth in this segment is low compared to the newer tourism drivers. Stage 4 offers tremendous potential for the NT, with its base of authentic Indigenous knowledge and culture that is significantly unique from other products in the world. While this product will be difficult to develop, the cultural tourism segment is currently very strong, with growing demand in high yield (mostly developed country) markets. The NT has the potential to ‘own’ the Indigenous tourism reputation in a stronger way than it ‘owns’ the ‘Real Outback’. Broad tourism market trends are often difficult to clearly identify as they form. The most mature markets, including Australia are well into the 4th stage. Interest in fun and adventure holidays is stable or decreasing while interest in culture, sustainability and learning is strong. The next stage (Stage 5) is as yet not clear; although speculation on which trends will emerge as the dominant drivers of new travel patterns is widespread.
4.2 The Domestic Market
Tourism NT has previously conducted extensive market segmentation studies of the domestic market. This has resulted in the identification of the ‘Spirited Traveller’ market segment as the best fit for the NT tourism product. Spirited travellers represent the best target market for the NT because they:
• Prefer interactive travel experiences to passive holiday; • Typically seek opportunities for personal growth and transformation; • Tend to crave physical or psychological challenges; • Generally spend more than $1,600 per trip; • Usually travel without children, or with children aged over eight years; and, • Are more likely than other Australians to visit the NT.
In the market stage model spirited travellers are best represented by stage 3 and early stage 4 needs. Tourism NT has built significant experience in targeting the Spirited

Northern Territory Tourism Strategic Plan 2008-2012
30
Traveller segment and should continue to target this segment as it fits very well with the NT tourism product. However this market segment is evolving and the market stage assessment model provides an indication as to how this segments needs are evolving. The NT has considerable assets to develop product to continue to meet the needs of this segment as it evolves. TRA, in their report Changing consumer behaviour: Impact on the Australian domestic tourism market (2007) identify the following incentives as driving domestic tourists travel decisions: • The need to relax / recharge and pamper themselves (Stage 2); • To have a break from the routine of everyday life – put life into perspective (Stage
3); • To indulge a particular interest (Stage 2 and possibly, for particularly specialised
interests, Stage 5); and • To gain new and diverse experiences – to learn and grow as a person (Stage 4). The need to relax / recharge and pamper is associated with shorter holiday breaks. This is not an area where the NT currently looks to have a competitive advantage in its product offering. Although the NT is not strongly associated as a luxury / indulgence location it still requires developments that cater to this market. The have a break from the routine of everyday life – put life into perspective is a market need that the NT can target by playing on its outback / desert spirituality. The current ‘Share Our Story’ campaign plays to this need. To indulge a particular interest is an area where the NT is well recognised for several pursuits, such as fishing, hunting, bird watching, hiking and 4-wheel driving. The NT has a strong product to push for these categories, however does not appear likely to fill a wider range of special interests in the short to medium term. To gain new and diverse experiences – to learn and grow as a person – is where the NT Tourism industry has the greatest potential to differentiate itself in the domestic market. Key to this message is presenting the NT as offering experiences as different and valuable as those that can be found by travelling overseas. Looking forward to the next 5 years the following factors are thought likely to also increasingly drive domestic demand: • Sustainability: Australians are increasingly concerned about the sustainability of
their actions. This may result in reduced demand for high carbon emitting long haul travel in favour of options nearer to home. Already, destinations that are able to position themselves as eco-friendly, sustainable or carbon-neutral are more attractive to significant segments of the market;
• Carbon Pricing: It appears almost certain that Australia, in line with many other developed countries, will adopt some mechanism for pricing the environmental cost of carbon emissions in the near future. This will certainly impact the cost of travel, which is relatively carbon intensive; and
• Social Conscience: Consumers are increasingly factoring the social cost or benefit
of their choices. This may increasingly translate into choosing travel destinations where social good can be a part of the experience, such as voluntourism or spending money that flows to disadvantaged people.
4.2.1 Current Domestic Market Position – Stage Assessment
The Australian domestic market is currently firmly into Stage 4 but with significant demand and interest growth still in Stage 3 product. Stage 5 is undoubtedly developing, however the spending power of this stage is still low. The motivators for the domestic market identified by TRA (2007) and other consumer survey work indicates that interest in Stage 2 product remains strong, while Stage 1 is in decline.

Northern Territory Tourism Strategic Plan 2008-2012
31
Figure 4.1: Stage Assessment of the Australian Domestic Tourism Market (The red box
represents the NT’s core tourism product image)
Domestic
Market
Stage 1 - Products & Activities, Places & things
Stage 2 - Service Differentiation, Niche Indulgences
Stage 3 - Products & Emotions, Exhilaration and Adventures
Stage 4 - Experiences: Learning, Authenticity & Sustainability
Stage 5 – Currently Unclear
Note: This assessment is made using information from a variety of sources and is therefore only a general guide to the market. Specific research on visitors to the NT may change the assessment.
Tourism NT has previously heavily targeted the Stage 3 domestic market with its promotions and product mix and is moving to a Stage 4 market focus with the ‘Share Our Story’ promotional campaign. The progress of the Australian domestic market through the previous stages suggests that the Stage 4 market has another 10-15 years of demand growth in front of it. The Stage 3 market will probably stagnate within the next 5 years (yet will remain important as a ‘foundation’ level of product to the higher stage products as Stage 2 currently does).
4.2.2 Responding to Trends in the Domestic Market
The NT Tourism Industry must position itself to profit from the broad Stage 4 tourism market in light of the individual domestic market drivers and trends being observed.
Table 4.2: NT Tourism Drivers, Considerations and Strategic Direction
Driver/Trend NT Considerations NT Tourism Directions
Observed Trends
The need to relax / recharge and pamper themselves
Relatively little luxury product in the NT. Image of NT as adventurous rather than relaxing.
Where needed, develop and promote the NT as a ‘recharging and revitalising’ destination rather than as a ‘relaxing’ destination. Work to develop further higher service level products.
To have a break from the routine of everyday life – put life into perspective
A number of areas and cultures in the NT are a strong contrast to the majority of Australia.
The NT is already promoted as being out-of-the-ordinary. Need to increasingly promote the unique cultures in the NT, both Indigenous and contemporary, as a real contrast to east coast Australia
To indulge a particular interest
The NT can competitively compete for a number of particular interests, especially nature-based pursuits and Indigenous art and culture.
Continued moves to interest group specific marketing for key special interests that the NT has strong potential with.
Northern Territory Tourism Strategic Plan 2008-2012
32
Driver/Trend NT Considerations NT Tourism Directions
To gain new and diverse experiences – to learn and grow as a person
The vast landscapes and unique cultures offer great potential to match this need – if offered and marketed well.
Highlight the value of the NT product, the opportunity for learning, new experiences and culture that cannot be delivered by other domestic locations. Promote the value of learning about new places and culture: the real Australia.
Predicted Trends
Sustainability The NT has a strong existing image of natural assets, but not perhaps of eco or sustainable activities.
To educate operators on sustainability issues through accreditation programs.
Carbon Pricing The relatively long travel distances into and within the NT will be impacted more heavily by carbon pricing.
Need to offer ability to reduce carbon footprint of the industry.
Social Conscience The NT’s Indigenous population is well recognised as being disadvantaged.
Need to further engage the Indigenous population with the tourism sector.
In capturing the Stage 4 market, the NT needs to promote its differences from the rest of Australia, in its landscape, its culture and its climate. These differences need to be seen as worth experiencing. The NT must be seen to be accessible; that Australians can visit and immediately feel like they are in a different place, but still easily immerse themselves in the unique local culture and environment. Tourism NT will continue to develop the ‘Share Our Story’ campaign to grow visitation to the NT as a desirable alternative for Spirited Travellers to overseas holidays. Previously, Tourism NT had sent different marketing messages to each of the domestic and international markets. Research on global trends has revealed that the psychographic profiling of these markets did not require investment in two branding platforms. While slightly different flavours are required for different markets, ‘Share Our Story’ encapsulates all of these very well. This process of aligning domestic and international marketing activities will also allow investments made in marketing spend, such as collateral production, to be consolidated over time. One of the key challenges facing Tourism NT at present is defending the ownership of the outback brand within Australia to international markets where it is facing strong competition from both Queensland and Western Australia. It appears that the competition has gained a foothold though the outback image of the NT being narrowly associated in the market with the natural features and beauty of the NT. Research by TRA (2007) suggests that for the domestic market such an association is not likely to motivate travellers: “Scenic beauty is seen as a cost of entry for travel unless the offering is unique – it will not lead those who travel to choose Australia compared to overseas.” In order for the NT to recapture some of the lost outback association, the market must understand that the outback of the NT is a unique and persuasive cultural product rather than just an association with vast red landscapes and big skys. Other locations are capturing the outback image because they lacked the quality of the natural setting and hence had to develop the cultural story to their products as foremost. As the market has matured to Stage 4 needs, this has worked to their strength. The NT is not lacking in the outback cultural story, rather it needs to ensure that the market receives the message. STRATEGY
Progressively build and enhance the “Share Our Story” branding with relevant cultural overtones Continue to position the NT as a nature-based destination with iconic national parks, natural wonders and indigenous culture

Northern Territory Tourism Strategic Plan 2008-2012
33
WHAT DOES THIS MEAN FOR THE OPERATOR ON THE GROUND?
Successful domestic branding that will deliver growth in interstate visitor
markets
Combining nature and culture in markets will provide operators with a true point
of difference over interstate competitors
It is very much the responsibility of operators to capitalise on this branding and
align their marketing collateral to ensure consistency across the industry in
tourism promotion.
4.3 Intra-Territory Market
In 2006, 26.2% of visitors came from within the boundaries of the NT. Presently the role of marketing to this market segment has rested with the Regional Tourist Associations (RTA’s). The performance of this segment has declined in recent years due to:
• Inconsistent branding and marketing by RTA’s • A small population base with easy and inexpensive access to Asia • The impact of the military’s overseas commitments and subsequent migration of
family members to Southern States during overseas deployments; and • Rising fuel costs on intra-Territory travel.
As a result there is a need for Tourism NT to provide a co-ordinated approach to marketing and promotions. In addition it is essential that a common brand platform be used across all market segments. Previously, RTA’s have operated in isolation from the marketing plans implemented by Tourism NT. They have also developed their own brands and products that are exposed to a wide range of audiences including consumers, operators and wholesalers. Therefore it is imperative that the messages and branding across Tourism NT and the RTA’s is consistent so as to minimise confusion in the marketplace. It is recommended that this issue of alignment be addressed through Service Level Agreements (SLA’s) with the RTA’s where funding provided by Tourism NT is linked to specific outcomes and directions. The RTA’s also have previously marketed two specific geographic destinations – the Top End and the Centre. These regional areas do not align with the Tourism NT destination strategy and will create confusion in the marketplace. It is essential that the RTA’s approach their markets as needs-driven individuals rather than geographically segmented groups. As such, the material they produce for visitors should contain the same branding elements as the material produced for visitors by Tourism NT. At the end of the day, the consumer does not care where the material has originated, rather that it is providing information in a consistent manner. STRATEGY
Align RTA branding and promotional material to the Tourism NT branding platform and destination strategy through the use of Service Level Agreements
WHAT DOES THIS MEAN FOR THE OPERATOR ON THE GROUND?
Consistent marketing and messages of operator products and services across all
markets.
It is the responsibility of operators to ensure that RTA’s have the operators
promotional material and that all information is current.

Northern Territory Tourism Strategic Plan 2008-2012
34
4.4 The International Market
The NT has established a successful presence in a number of core international markets in Europe, North America and Japan. It is recommended that Tourism NT maintain its core focus on these markets into the future. The key developing cultural and nature-based spirited traveller segments in these markets is discussed in more detail further in this document. As a generalisation, Tourism NT has a relatively good understanding of these markets needs, their niches and how to target them. Looking further forward it is forecast that Asia will provide the strongest growth in outbound international tourists in the foreseeable future. Many of these markets are currently relatively weak and poorly understood however they are growing rapidly in wealth and are located relatively close to the NT. It is still too early for the NT to consider devoting major resources to developing most of these markets (China and Korea being exceptions). However it is suggested that over the life of this plan that Tourism NT begin to pay special attention to the development of these markets and particularly potential segments in the markets that may be attracted to the NT. Tourism NT will aim to become pre-prepared for these markets, so that it can move rapidly to attain first mover status in their developing nature and cultural based market segments when the opportunity is ripe. As such, the significant part of this section is devoted to exploring the current understanding of some of these emerging markets within the NT context. International visitation to the NT is, perhaps, more important to the future of the NT Tourism Industry then to any other state or territory in Australia. In 2006, international visitors accounted for 41% of holiday tourists in the NT and 44% of holiday tourist nights. Nationally, international tourism is forecast to have much greater growth potential than domestic tourism with forecasts of 4% per annum growth in international visitation versus 0.3% per annum growth in domestic tourism. International tourists from Asia can arrive into the NT with similar ease as travellers from other parts of Australia and their visitation patterns tend to be less seasonal than for the domestic market. The current international source markets for the NT are predominately from Europe (UK, Germany and Other Europe accounts for almost 60% of the NT’s international visitors), North America (15% of international visitors), Japan (15% of international visitors) and Other Asia (5%). These markets are wealthy, have proven segments with interest in the NT, have relatively well established distribution links and are relatively well understood in terms of marketing needs.
Figure 4.1: International Tourism Source Markets for the NT by % of Total of International Visitors, 2005-06
0.00%
5.00%
10.00%
15.00%
20.00%
25.00%
30.00%
Other Europe UK Japan North America Germany Other Asia
Source: Tourism NT (2006c)
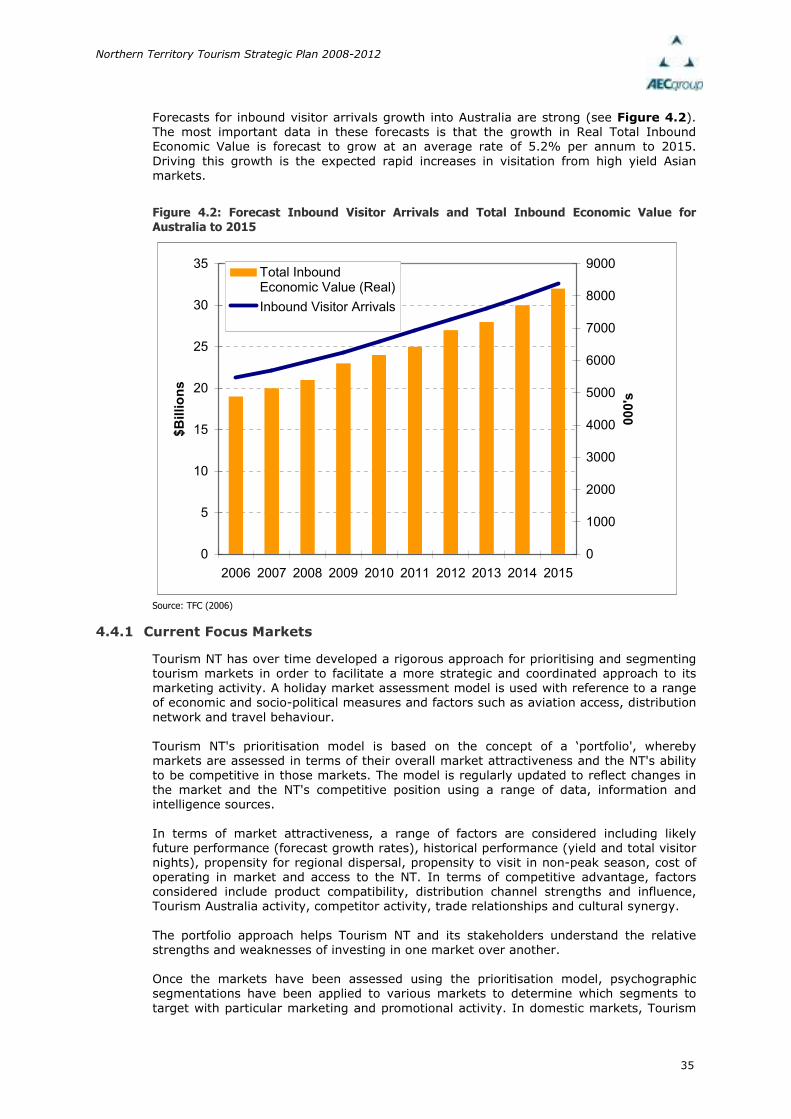
Northern Territory Tourism Strategic Plan 2008-2012
35
Forecasts for inbound visitor arrivals growth into Australia are strong (see Figure 4.2). The most important data in these forecasts is that the growth in Real Total Inbound Economic Value is forecast to grow at an average rate of 5.2% per annum to 2015. Driving this growth is the expected rapid increases in visitation from high yield Asian markets.
Figure 4.2: Forecast Inbound Visitor Arrivals and Total Inbound Economic Value for
Australia to 2015
0
5
10
15
20
25
30
35
2006 2007 2008 2009 2010 2011 2012 2013 2014 2015
$Billions
0
1000
2000
3000
4000
5000
6000
7000
8000
9000
000's
Total InboundEconomic Value (Real)
Inbound Visitor Arrivals
Source: TFC (2006)
4.4.1 Current Focus Markets
Tourism NT has over time developed a rigorous approach for prioritising and segmenting tourism markets in order to facilitate a more strategic and coordinated approach to its marketing activity. A holiday market assessment model is used with reference to a range of economic and socio-political measures and factors such as aviation access, distribution network and travel behaviour. Tourism NT's prioritisation model is based on the concept of a ‘portfolio', whereby markets are assessed in terms of their overall market attractiveness and the NT's ability to be competitive in those markets. The model is regularly updated to reflect changes in the market and the NT's competitive position using a range of data, information and intelligence sources. In terms of market attractiveness, a range of factors are considered including likely future performance (forecast growth rates), historical performance (yield and total visitor nights), propensity for regional dispersal, propensity to visit in non-peak season, cost of operating in market and access to the NT. In terms of competitive advantage, factors considered include product compatibility, distribution channel strengths and influence, Tourism Australia activity, competitor activity, trade relationships and cultural synergy. The portfolio approach helps Tourism NT and its stakeholders understand the relative strengths and weaknesses of investing in one market over another. Once the markets have been assessed using the prioritisation model, psychographic segmentations have been applied to various markets to determine which segments to target with particular marketing and promotional activity. In domestic markets, Tourism
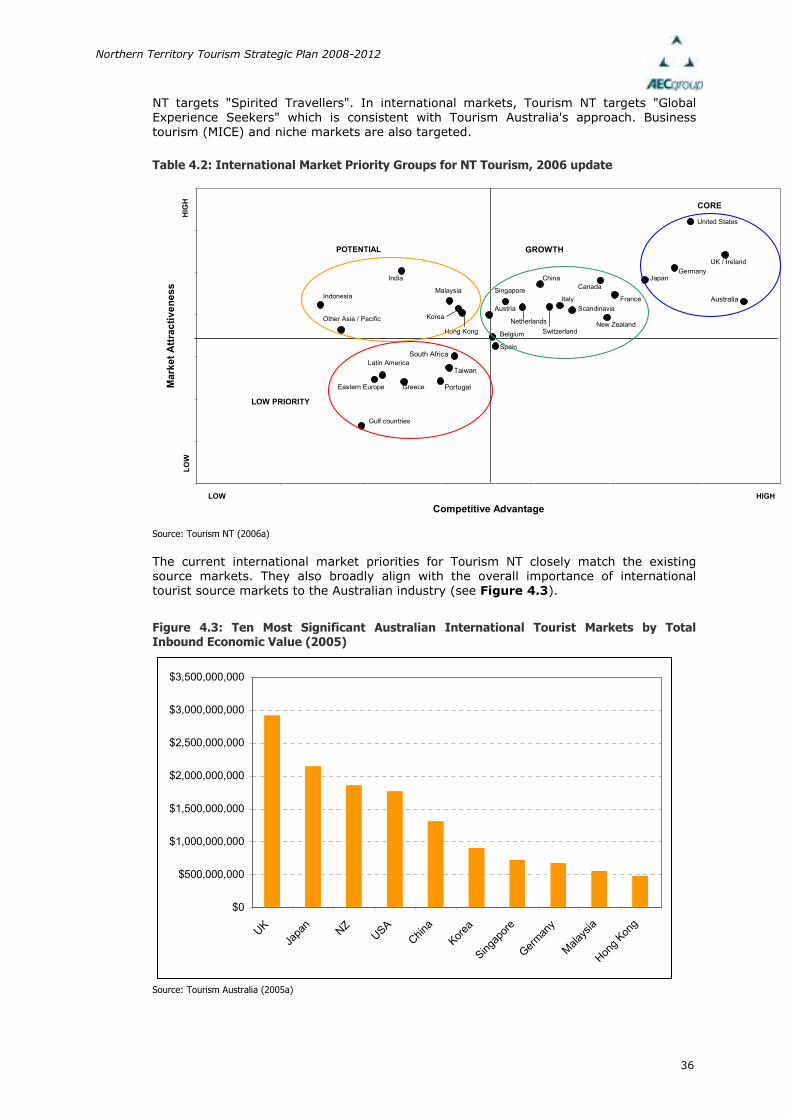
Northern Territory Tourism Strategic Plan 2008-2012
36
NT targets "Spirited Travellers". In international markets, Tourism NT targets "Global Experience Seekers" which is consistent with Tourism Australia's approach. Business tourism (MICE) and niche markets are also targeted.
Table 4.2: International Market Priority Groups for NT Tourism, 2006 update
12
34
56
78
1 2 3 4 5 6 7 8
Competitive Advantage
Market Attractiveness
LOW
LOW
HIGH
HIGH
UK / Ireland
Germany
United States
Canada
Switzerland
Japan
New Zealand
FranceItaly
ScandinaviaAustria
Netherlands
Singapore
Belgium
Spain
Hong Kong
Malaysia
China
Other Asia / Pacific
Indonesia
Eastern Europe
Korea
Gulf countries
Greece
India
Latin America
CORE
GROWTHPOTENTIAL
LOW PRIORITY
Australia
South Africa
Taiwan
Portugal
Source: Tourism NT (2006a)
The current international market priorities for Tourism NT closely match the existing source markets. They also broadly align with the overall importance of international tourist source markets to the Australian industry (see Figure 4.3).
Figure 4.3: Ten Most Significant Australian International Tourist Markets by Total Inbound Economic Value (2005)
$0
$500,000,000
$1,000,000,000
$1,500,000,000
$2,000,000,000
$2,500,000,000
$3,000,000,000
$3,500,000,000
UK
Japan
NZ
USA
China
Korea
Singapore
Germany
Malaysia
Hong Kong
Source: Tourism Australia (2005a)
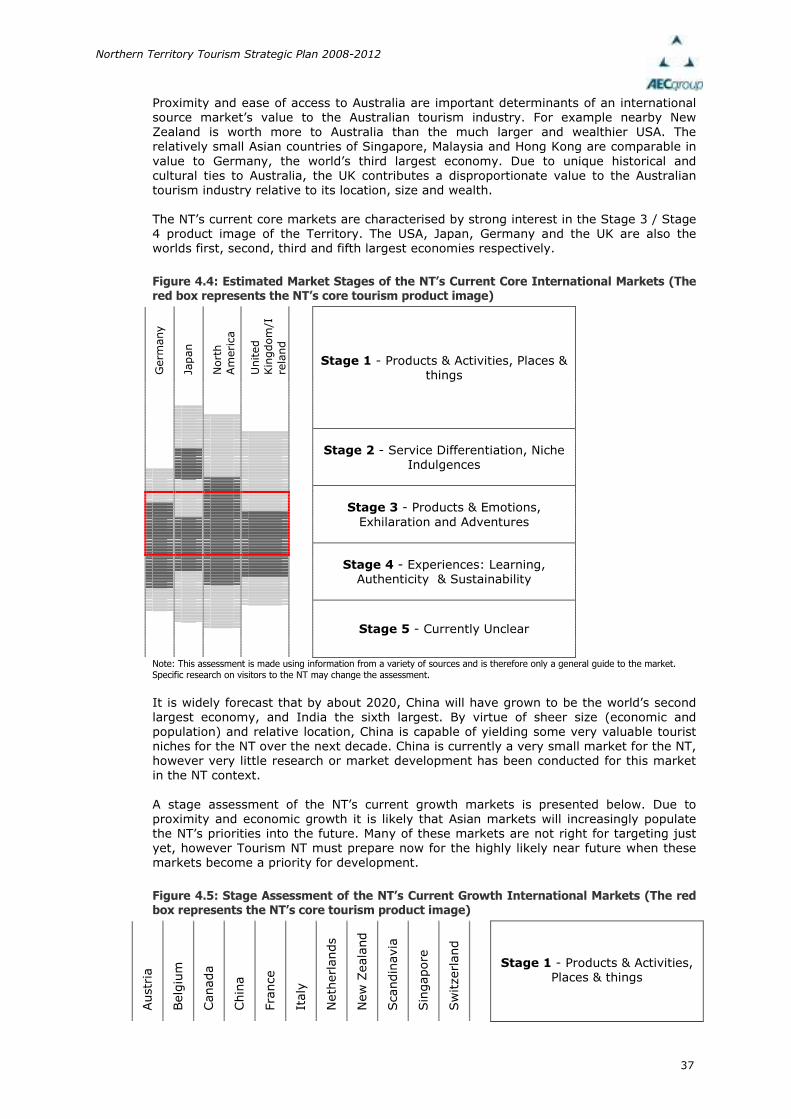
Northern Territory Tourism Strategic Plan 2008-2012
37
Proximity and ease of access to Australia are important determinants of an international source market’s value to the Australian tourism industry. For example nearby New Zealand is worth more to Australia than the much larger and wealthier USA. The relatively small Asian countries of Singapore, Malaysia and Hong Kong are comparable in value to Germany, the world’s third largest economy. Due to unique historical and cultural ties to Australia, the UK contributes a disproportionate value to the Australian tourism industry relative to its location, size and wealth. The NT’s current core markets are characterised by strong interest in the Stage 3 / Stage 4 product image of the Territory. The USA, Japan, Germany and the UK are also the worlds first, second, third and fifth largest economies respectively.
Figure 4.4: Estimated Market Stages of the NT’s Current Core International Markets (The red box represents the NT’s core tourism product image)
Germ
any
Japan
North
America
United
Kingdom/I
reland
Stage 1 - Products & Activities, Places & things
Stage 2 - Service Differentiation, Niche Indulgences
Stage 3 - Products & Emotions, Exhilaration and Adventures
Stage 4 - Experiences: Learning, Authenticity & Sustainability
Stage 5 - Currently Unclear
Note: This assessment is made using information from a variety of sources and is therefore only a general guide to the market. Specific research on visitors to the NT may change the assessment.
It is widely forecast that by about 2020, China will have grown to be the world’s second largest economy, and India the sixth largest. By virtue of sheer size (economic and population) and relative location, China is capable of yielding some very valuable tourist niches for the NT over the next decade. China is currently a very small market for the NT, however very little research or market development has been conducted for this market in the NT context. A stage assessment of the NT’s current growth markets is presented below. Due to proximity and economic growth it is likely that Asian markets will increasingly populate the NT’s priorities into the future. Many of these markets are not right for targeting just yet, however Tourism NT must prepare now for the highly likely near future when these markets become a priority for development.
Figure 4.5: Stage Assessment of the NT’s Current Growth International Markets (The red box represents the NT’s core tourism product image)
Austria
Belgium
Canada
China
France
Italy
Netherlands
New Zealand
Scandinavia
Singapore
Switzerland
Stage 1 - Products & Activities, Places & things

Northern Territory Tourism Strategic Plan 2008-2012
38
Stage 2 - Service Differentiation, Niche
Indulgences
Stage 3 - Products & Emotions, Exhilaration and Adventures
Stage 4 - Experiences: Learning, Authenticity &
Sustainability
Stage 5 - Currently Unclear
Note: This assessment is made using information from a variety of sources and is therefore only a general guide to the markets.
Specific research on visitors to the NT may yield differing results.
4.4.2 Emerging Markets
The Australian Government has recently developed emerging market strategies, released in January 2007, that target the outbound tourism markets of India and China. In the long term, China and India are forecast to grow to become the world’s first and third largest economies by the middle of the century. However these countries are already providing major, and rapidly growing, opportunities for the Australian tourism industry. Over the period between 2006 and 2015, the TFC estimate that total inbound tourist visitation to Australia will increase by just under 3 million travellers, equating to an average annual increase of 4.9% over the period. Australia’s traditional core markets of the UK, USA, New Zealand and Japan are expected to account for approximately one quarter of this growth. The strongest growth is anticipated from the emerging markets of China (20.6% of additional visitation) and India (8.3% of additional visitation), and to a lesser extent other Asian markets of South Korea (5.5%), Indonesia (3.8%) and Singapore (3.8%). In all, 57% of the growth in international visitors to Australia between 2005 and 2010 is forecast to derive from Asian markets.
Figure 4.6: Forecast Contribution to Total Increased Inbound Visitors to Australia, 2006-2015
Other North America
2.1%
Rest of the World
8.7%
Other Europe
11.0%
Other Asia
10.9%
US
7.3%UK
8.3%New Zealand
5.6%
Indonesia
3.8%
Singapore
3.7%
South Korea
5.5%
India
8.3%
China
20.6%
Japan
4.2%
Source: Tourism Forecasting Committee (2006)
At present, emerging Asian markets make up only a very small part of the NT’s tourism mix. However with strong economic growth in these markets, the forecast increase in

Northern Territory Tourism Strategic Plan 2008-2012
39
visitation to Australia and changes to the NT’s aviation industry (ensuring Asians have easier access to the NT) indications are that these markets must be closely examined. It would not be a sensible investment for Tourism NT to spend heavily on targeting these emerging markets until adequate research had been gathered. However the time is now right for the NT tourism industry to begin to research these markets and test development and marketing strategies for future development. If the NT does not begin to prepare itself for the rise of Asia now, it may miss many of the opportunities in these markets as they arise.
NT Aviation – International Prospects
The prospects for maintenance and growth of existing services to Darwin has been
enhanced significantly by the growing presence of LCCs and the broader development of
the LCC network within Southeast Asia. As a consequence, a genuine opportunity exists
for Darwin to engage more closely with Asia through the LCC system.
Tourism Futures International (2007) Northern Territory Aviation Strategy 2007-2010 As highlighted in the draft Northern Territory Aviation Strategy 2007-2010 (Tourism Futures International, 2007), Darwin’s developing role in linking to Low Cost Carriers (LCCs) into and out of Asia offers the prospect of the airport increasing its role as a gateway for NT tourism. In effect, it has the potential to “feed off” the Singapore hub that provides linkages not only to nearby Asian markets but also to long haul markets to Europe and, to a limited extent, North America.
Figure 4.7: The Darwin-Singapore Low Cost Carrier Relationship
Darwin
Singapore
Source: CAPA Consulting (not sighted), Tourism Futures International (2007) The percentages of these markets to which the NT will appeal may still be relatively small, however given the total size of the markets, relatively small percentage demand from Asian emerging markets has the potential to be translated into significant new visitors for the NT tourism industry. Again it will take a number of years to begin to develop market presence and marketing and distribution channels in Asia however the industry must begin to understand these markets now.