Embed Size (px)
Citation preview

STRATEGIC PLAN 2020
OUTSTANDING PUBLIC
TRANSPORTIN NORTH AMERICA
2010awarded by the AMERICAN PUBLIC TRANSPORTATION ASSOCIATION

The STM’s 2020 Strategic Plan was adopted by its board of directors on September 7, 2011, by Resolution CA-2011-280, by the executive committee of the City of Montréal on September 21, 2011, by Resolution CE11 1509, by the Montréal agglomeration council on October 27, 2011, by Resolution CG11 0358, and by the council of the Montréal Metropolitan Community on June 14, 2012, by Resolution CC12-017.
Sociéte de transport de Montréal
June 2012
The STM’s 2020 Strategic Plan is published in accordance with the Act Respecting Public Transit Authorities (R.S.Q. chapter S-30.01) It presents a ten-year perspective of the development of all public transit modes, equipment, and infrastructure. The plan has been filed with the City of Montréal, the Agglomeration council, the Montréal Metropolitan Community, and the Quebec Ministère des Transports and becomes effective once it has been approved by the Ville de Montréal and the Montréal Metropolitan Community. It will be reviewed annually and updated every five years.

Le Plan stratégique 2020 de la STM est publié conformément à la Loi sur les sociétés de transport (L.R.Q., chapitre S-30.01). Il présente une perspective de développement du transport collectif sur une période de dix ans pour tous les modes de transport ainsi que pour tous les équipements et toutes les infrastructures. Il est déposé auprès de la Ville de Montréal, de l’agglomération de Montréal, de la Communauté métropolitaine de Montréal et du ministère des Transports du Québec et n’entre en vigueur qu’après l’approbation de la Ville de Montréal et de la Communauté métropolitaine de Montréal. Par ailleurs, il sera revu tous les ans et mis à jour tous les cinq ans.
Sociéte de transport de MontréalSeptembre 2011
STMPLAN STRATÉGIQUE 2020 1
COMPANY PROFILE
The 14th-largest company in Québec, the STM has a workforce of more than 9,000 employees, half of whom work directly with customers. It provides approximately 1.2 million trips per day. Its 2011 budget amounted to over $1.15 billion and the replacement value of its assets totalled $14.5 billion. The STM has long been known for its careful management. Moody’s, for example, gave the STM an Aa2 rating, placing it among the best-managed transit authorities in North America.
A key player in passenger land transportation, the STM provides over 80% of public transit trips in the Montréal area and accounts for over 70% of all those made across Québec.
To support the use of public transit, the company owns, manages and develops a bus and metro network throughout the island of Montréal. In addition, it supplies paratransit service to people with functional limitations, by means of minibuses and by calling on the services of taxi companies. It also offers public transit service by taxi in low-population-density areas with a view to developing demand for future bus service.
As well as being a key driver of Montréal’s economic growth for the last 150 years, the STM plays a leading role in the city’s sustainable development. By providing safe, reliable transportation, it contributes to environmental protection and citizens’ quality of life.
Customers, employees, and institutional and business partners are all proud to be associated with the STM, which is known for delivering quality services at a fair price.
Bus network The STM operates a fleet of 1,680 buses, 8 of which are hybrid and 140, articulated. The bus network covers the island of Montréal, or nearly
500 km². It comprises 209 bus routes, 156 of which are wheelchair-accessible and 23 of which are dedicated to night service. As well, 101.4 km of reserved lanes help shorten travel times. In 2010, service provided on the bus network amounted to 81.1 million kilometres, up 15% compared with 2006. The STM also runs 10 taxi-based public transit routes.
Metro networkMontréal’s metro, which was inaugurated in 1966, is made up of four lines (71 km altogether) and 68 stations. Its fleet of rolling stock comprises
759 cars (336 MR-63s and 423 MR-73s), which travelled 76.6 million kilometres in 2010, an increase of roughly 30% over 2006.
ParatransitThe STM provides door-to-door service (by reserv-ation) for people with functional limitations. Every year, more than 21,000 customers make use of the
STM’s 86 minibuses and the services of 16 regular and wheelchair-accessible taxis for over 2.7 million trips on and around the island of Montréal.

TABLE OF CONTENTS
STM VISION ...............................................................................................................................................................................................................................................................................................................................................5
MESSAGE FROM ThE ChAIRMAN OF ThE BOARd ANd ThE ChIEF ExECUTIVE OFFICER ................................................................................................................................................................................................................................................. 7
PART I CORPORATE VISION FOR ThE YEAR 2020 ....................................................................................................................................................................................................................................9
PART II INFLUENCING FACTORS ..........................................................................................................................................................................................................................................................................................................19
PART III PRIORITIES, STRATEGIES ANd ACTIONS .......................................................................................................................................................................................................................................30
PRIORITY 1 EXPAND SERVICES ......................................................................................................................................................................................................................................................................................................................33
RENOVATE AND EXPAND THE METRO NETWORK WHILE INCREASING OVERALL SERVICE ..................................................................................35
IMPROVE OVERALL SERVICE WHILE DIVERSIFYING THE BUS NETWORK ..................................................................................................................................... 38
ROLL OUT THE FIRST TRAM ROUTE ................................................................................................................................................................................................................................................. 48
HELP IMPLEMENT ALL PUBLIC TRANSIT INITIATIVES ON THE ISLAND OF MONTRÉAL ................................................................................................49
BOLSTER OVERALL PARATRANSIT SERVICE ..............................................................................................................................................................................................................................51
PRIORITY 2 IMPROVE THE CUSTOMER EXPERIENCE AND MARKETING EFFORTS .................................................................................................................................................53
ENHANCE THE BREATHE EASIER BRAND IMAGE ...............................................................................................................................................................................................................54
IMPLEMENT A SERVICE QUALITY PROGRAM ..........................................................................................................................................................................................................................56
IMPROVE SERVICE RELIABILITY AND PUNCTUALITY ..................................................................................................................................................................................................57
IMPROVE THE QUALITY OF PASSENGER INFORMATION .........................................................................................................................................................................................58
PROVIDE A SAFE, USER-FRIENDLY AND PLEASANT ATMOSPHERE ........................................................................................................................................................59
APPLY UNIVERSAL ACCESSIBILITY MEASURES ....................................................................................................................................................................................................................61
DIVERSIFY FARE PRODUCTS .........................................................................................................................................................................................................................................................................62

PRIORITY 3
ATTRACT, DEVELOP AND MOBILIZE TALENT ....................................................................................................................................................................................................................................65
DEPLOY WAYS OF RECRUITING EMPLOYEES AND DEVELOPING THEIR SKILLS ...................................................................................................................66
CONTINUE WITH THE CURRENT EMPLOYEE AND MANAGER MOBILIZATION EFFORT .................................................................................................70
CONTINUE FOSTERING COLLABORATIVE WORK RELATIONS ..........................................................................................................................................................................72
HELP CREATE A HEALTHY, SAFE AND INCLUSIVE WORK ENVIRONMENT ......................................................................................................................................73
PRIORITY 4
OPTIMIZE INVESTMENT MANAGEMENT ....................................................................................................................................................................................................................................................77
GENERATE ADDED VALUE WHEN ASSETS ARE REPLACED ................................................................................................................................................................................ 77
OPTIMIZE PROJECT PORTFOLIO MANAGEMENT AND IMPROVE PROJECT EXECUTION ................................................................................................78
PRIORITY 5 FURTHER IMPROVE PERFORMANCE ......................................................................................................................................................................................................................................................... 85
INCREASE AND DIVERSIFY REVENUE SOURCES ................................................................................................................................................................................................................87
TIGHTLY CONTROL EXPENDITURES.................................................................................................................................................................................................................................................... 88
PRIORITY 6
PLACE SUSTAINABLE DEVELOPMENT AT THE CENTRE OF ALL OUR DECISIONS .......................................................................................................... 9 1
TAKE PART IN THE GOVERNMENT’S EFFORTS TO ELECTRIFY PUBLIC TRANSIT ................................................................................................................... 92
LESSEN THE STM’S ECOLOGICAL FOOTPRINT .......................................................................................................................................................................................................................93
PROMOTE SUSTAINABLE DEVELOPMENT ...................................................................................................................................................................................................................................97
PART IV FINANCIAL OUTLOOk ................................................................................................................................................................................................................................................................................................................97
PART V FOUR CONdITIONS FOR AChIEVING ThE STRATEGIC PLAN 2020 ANd MAkING PUBLIC TRANSIT A LASTING SUCCESS ...................................................................................................................................................................................................................................109
APPENdICES ..................................................................................................................................................................................................................................................................................................................................... 113


CORPORATE VISION
“Fulfil the public’s mobility needs by operating North America’s top public transit system
and, in so doing, contribute to the Montréal Urban Agglomeration’s renown as a prosperous
and environmentally friendly hub of economic development.
“This performance is the result of an enhanced customer experience in terms of frequency,
speed, punctuality and comfort. It is supported by major spending on equipment
maintenance and strategic expenditures, both of which are linked to growth of over 30%
in overall service and to the diversification and electrification of transit modes. As of 2025,
the STM fleet will purchase only 100% electric vehicles.
“Combined with a set of measures aimed at reducing single-occupant car use, which will
be implemented with help from the city of Montréal and the government of Québec, this
strategy will increase ridership by 40% to reach 540 million trips in 2020, while significantly
reducing the public’s reliance on cars.”
STMPLAN STRATÉGIQUE 2020

STMSTraTegic plan 2020 6
Yves Devin Michel Labrecque
Guy-Concordia metro station

STMSTRATEGIC PLAN 2020 7
MESSAGE FROM ThE ChAIRMAN OF ThE BOARd ANd ThE ChIEF ExECUTIVE OFFICERWhen the STM’s Plan d’affaires 2007−2011 (Business Plan) was published, the company enjoyed particularly strong support. The Québec government had just adopted the first Québec Public Transit Policy and the city of Montréal had unveiled its ambitious Transportation Plan. After four years, not only has the Business Plan yielded spectacular results, but the current environment remains just as promising for the implementation of the STM’s Strategic Plan 2020.
The objective of the Strategic Plan is to expand overall service so as to allow the STM to provide 540 million trips in 2020, an increase of more than 40% over current ridership. The Plan will also contribute toward achieving targets set by the Québec government and the city of Montréal in terms of reducing greenhouse gas (GHG) emissions. By 2020, the province is aiming for a decrease of 20% compared with 1990 levels, and the city, 30%.
Drawn up with input from all the STM’s managers and Board members, the Strategic Plan 2020 was developed in the wake of the Plan d’affaires 2007−2011 and is based on the same priorities. Backed by the excellent results yielded by the first four years of the Business Plan, we have agreed to stay on course while picking up the pace. Hence, our collective commitment for the next decade will be built on priorities we have already established.
Over the past months, we consulted with a hundred or so of our partners and with our customers to secure their support for the objectives and priorities laid out in the Strategic Plan 2020. We have taken their comments and suggestions into account in formulating our strategies.
Yves devinChief Executive Officer
Michel LabrecqueChairman of the Board

PARTIE I
STMPLAN STRATÉGIQUE 2020 8

PART I
CORPORATE VISION FOR ThE YEAR 2020
AIMING FOR NEW RIdERShIP RECORdSIn 2006, the Québec government launched the Québec Public Transit Policy, which aimed to increase public transit service by 16% and ridership by 8% by 2011. Then, in 2008, following extensive public consultation, the city of Montréal adopted the Montréal Transportation Plan, which made public transit a top priority.
At the same time, the STM began considering ways to improve and optimize its services, and developed detailed diagnostics for the services provided on the island of Montréal. The ensuing Plan d’affaires 2007-2011 made sustainable development a top priority.
In 2007, the STM introduced its public transit service improvement program (known as PASTEC), consisting of a set of measures taken from the fifth development program of the city of Montréal’s 2008 Transportation Plan, Réinventer Montréal. Financed in equal parts by Québec’s Ministère des Transports and the city of Montréal, the service improvement program draws its inspiration from best practices in public transit around the world. Its goal is to bring about in-depth change in overall service in the medium and long term, so as to give public transit the importance it deserves.
As a result of the STM’s efforts over the last several years, public transit use has surpassed the level it had reached prior to the Québec government’s decision to eliminate funding in 1991. With financial support since then from the Montréal Urban Agglomeration and its governments, the company has reinvigorated public transit, achieving 405 million trips in 2011, thus surpassing the record established in 1947.
EVOLUTION OF STM RIdERShIP 1945−2011
Car ownership
Urban sprawl
Metro and Expo 67
Olympic Games 1976
Creation of the monthly pass
STM service improvement program 2007-2011 Montréal 2008 Transportation Plan MTQ Plan 2007-2011 (QPTP)
Québec governmentfunding eliminatedand economic recession
Increase in highway capacity
A new record for ridership
1945 1947 1952 1956 1960 1964 1968 1972 1976 1980 1984 1988 1992 1996 2000 2004 2008 2011
In 1862-1863, the Montréal City Passenger Railway Company provided one million trips.
425
400
405 million
398 million
386 million
375
350
325
300
275
250
Mil
lio
ns
of
trip
s
STMSTRATEGIC PLAN 2020 9

STMSTRATEGIC PLAN 2020 10
ENCOURAGING RESULTSThe STM has met and even exceeded the objectives set in the 2007−2011 Business Plan and in Montréal’s 2008 Transportation Plan, Réinventer Montréal. The results for the period from 2006 to 2010 are encouraging, and indeed exceptional: ridership shot up 7%, to 388.6 million trips. By 2010, the company had achieved 99% of the Québec government’s objective by increasing service as follows:
Overall service rose 22%, to 157.7 million kilometres, while the goal was a 16% increase.
Metro service amounted to 76.6 million kilometres, a 28% increase over 2006. Of note, three new stations in Laval and new off-peak services were added.
Bus service totalled 81.1 million kilometres, up 16% from 2006. New local transportation and express bus lines were added. New Navette Or shuttles were put into service as well as new shared-taxi routes.
EVOLUTION OF METRO SERVICE, 2002−2010
55
60
65
70
75
80
20032002 2004 2005 2006 2007 2008 2009 2010 2011
Mill
ions
of
km
76.6 M KM
+ 28%
SERVICE IMPROVEMENTPROGRAM LAUNCHED (1)
EVOLUTION OF BUS SERVICE, 2002−2010
65
70
75
80
85
20032002 2004 2005 2006 2007 2008 2009 2010 2011
Mill
ions
of
km
81.1 M KM
+ 16%
SERVICE IMPROVEMENTPROGRAM LAUNCHED
(1) Programme d’amélioration de service en transport en commun

STMSTRATEGIC PLAN 2020 11
PILLARS OF ThE STRATEGIC PLAN 2020 Public transit, a preferred means of transportation
The proposals put forward in the STM’s Strategic Plan follow the course set by the Ministère des Transports’ Québec Public Transit Policy, the city of Montréal’s Transportation Plan, the Montréal Community Sustainable Development Plan and the Communauté métropolitaine de Montréal (CMM) Vision 2025, which aim to make public transit the preferred means of transportation in the greater Montréal area.
In its Master Plan, filed in 2004, the city of Montréal advocated certain strategies for improving the integration of its urban planning and development with transportation systems that provide better structure, operate more efficiently and are better integrated into the urban fabric.
The overarching objective of the Québec Public Transit Policy, published by the provincial government in 2006, was to increase the use of public transit. The target was an 8% rise in public transit ridership by 2012 in order to boost its modal share.1 To reach this target, the government offered direct financial assistance for service improvement and strengthened government assistance for capital expenditures.
The city of Montréal, for its part, released its Transportation Plan in 2008, stating its desire to meet the transportation needs of all Montrealers by providing the community with a high quality of life and ensuring its role as a prosperous and environmentally friendly economic powerhouse. The Plan specified that, to achieve this goal, Montréal must significantly reduce its dependence on cars through massive investments in various forms of public transit and active transportation, including the tramway system, the subway system, bus rapid transit service, trains, bikes and walking, and by encouraging more appropriate uses for cars such as carpooling, car-sharing and taxi service.2
The Transportation Plan contains 11 major development programs that involve the STM, most of which correspond to strategies in the Strategic Plan 2020:
Create tramways at the centre of the agglomeration.
Upgrade Montréal’s subway system.
Extend subway lines in eastern Montréal.
Upgrade STM service to boost ridership by 8% within five years.
Enhance public transit capacity in the Champlain Bridge–Bonaventure corridor
Create a bus rapid transit (BRT) network running on its own reserved lane.
Establish bus priority measures along 240 kilometres of arterial roads.
Develop local transportation plans.
Rebuild Rue Notre-Dame.
Review governance.
Acquire means equal to our aspirations.
Finally, in the CMM’s announcement of Vision 2025, it stated that in 2025, the Montréal community will have met the challenge of mass transit by developing a fast, accessible, attractive and flexible system that meets users’ needs and significantly reduces the use of automobiles.3
1 Ministère des Transports du Québec, Passenger Transportation in Québec: Better Choices for Citizens. Québec Public Transit Policy, 2006.2 Ville de Montréal, Transportation Plan 2008, Réinventer Montréal, p. 13.3 Communauté métropolitaine de Montréal, Metropolitan Land Use and Development Plan (PMAD). An Attractive, Competitive and Sustainable Greater
Montréal, April 2011.

12
The strategic role of public transit in reducing GHG emissionsIt is universally acknowledged that urgent action is needed with respect to climate change. At the 2005 United Nations Climate Change Conference, the city of Montréal signed the World Mayors and Municipal Leaders Declaration on Climate Change, thereby undertaking to reducing greenhouse gas (GHG) emissions by 30% by the year 2020; this commitment is part of the Montréal Community Sustainable Development Plan 2010 – 2015. Following the Copenhagen Conference in 2009, the Québec government set its own target, namely a 20% reduction by 2020 (compared to 1990 levels). As a committed corporation, the STM has signed the International Association of Public Transport (UITP) Charter on Sustainable Development and subscribes to the provincial and municipal objectives for GHG emission reduction and vehicle electrification.
The biggest GHG emitter in Québec is the transportation sector, which accounted for 43% of the province’s GHG emissions in 2008. Road transportation represented 77.8% of the sector’s emissions, and 33.7% of total Québec emissions. Figures from recent years show a sharp rise in GHG emissions attributable to automobiles. Despite technological advances that have improved vehicles’ energy performance, transportation-related GHG emissions grew from 27.8 to 36 million tonnes between 1990 and 2008—a 28.6% increase.
1990 ANd 2008 GhG EMISSIONS IN QUÉBEC, BY SECTOR (IN MT CO2E)
35
30
2520
15
10
5
0
1990 2008
Transportation Industry Residential,commercial and
institutional
Agriculture Waste Electricity
40
Em
issi
ons
in M
t C
O2e
Source: Inventaire québécois des émissions de gaz à effet de serre en 2008 et évolution depuis 1990 (November 2010)
In recent years, technological innovations have significantly improved vehicle performance. But as trends from the last 20 years show, these performance gains have been cancelled out by growth in car ownership and distances travelled, among other factors. To reverse the trend, it is more necessary than ever to establish systems and measures that give further structural support to carpooling, public transit and active transportation.
STMSTRATEGIC PLAN 2020

13
Aiming for all-electric public transit: A North American first!In keeping with the Québec government’s desire to promote the development of electric transportation, and with the new Electric Vehicles 2011 − 2020 Action Plan, which aims to make 95% of public transit trips electric by 2030, the STM plans to introduce new electric means of transportation, which generate low levels of GHG emissions and airborne contaminants.
In terms of environmental performance, the STM already boasts an outstanding record thanks to Montréal’s metro system, which has been all-electric since it was inaugurated in 1966 and does not produce any direct GHG emissions. In total, metro trips make up half of all public transit trips taken in Québec. The metro network provides a solid foundation for pursuing the electrification of public transit. To further improve its performance, the STM has started the process of replacing its 759 metro cars with new models that consume less electricity and have 15% greater capacity than first-generation cars. The various metro extensions, currently under study by the Agence métropolitaine de transport (AMT), will bolster Québec’s position in reaching its GHG-emission goals and reducing its dependence on oil. At the government’s request, the STM has also begun examining, in partnership with the AMT, various extension scenarios, including the eastward extension of the blue line.
The STM anticipates that all new vehicles in its fleet will be electric-powered by 2025. In 2011, it will begin the transition toward electrifying its bus network in preparation for the introduction of trolleybuses—which have greater capacity—on the busiest routes. As of 2013, it will begin testing the first hybrid buses (biodiesel-electric) using rapid charging technology and, in the medium term, will gradually integrate electric buses with rechargeable batteries into the rest of the network.
In a project led by the city of Montréal in collaboration with the STM, tramways will return to Montréal’s streets after an absence of over 50 years. An initial tram line will go into operation in 2017 on the Côte-des-Neiges – downtown corridor. Other lines are currently under study. The STM is the first transit authority in North America to unveil a plan to electrify its entire network, with a corresponding work schedule.
Between now and 2025, the STM will still have to add to its fleet and replace old buses. It will ensure that all its new buses are equipped with the most up-to-date environmental technology. Starting in 2013, all new standard buses will be diesel-electric hybrids and will consume 30% less fuel. New articulated buses delivered starting in 2013 will also be hybrids.
To be able to increase its bus fleet beyond 1,590 vehicles in 2007, the STM needed to boost the capacity of its bus garages. That is why it expanded the Legendre bus garage in 2009 and refurbished the Frontenac bus garage.
STMSTRATEGIC PLAN 2020

14
Public transit: A major driver of Québec’s economy Public transit generates significant economic activity for Québec. According to a study published in November 2010 by the Board of Trade of Metropolitan Montreal, public transit authorities in the metropolitan area alone injected $1.8 billion into the economy, generating added value of $1.1 billion, and sustained 14,110 job-years: 10,595 direct jobs, and 3,515 indirect jobs with their suppliers.1
The study also highlights other economic benefits related to public transit:
Its impact on the Québec economy is almost three times greater than that of private automobile transportation, due to the fact that Québec is a major importer of automobiles.
The unit cost per kilometre of a single passenger trip is one-third that of private automobile transportation, thus saving Montréal users almost $800 million in travel costs. These savings translate into additional household spending power that can be devoted to food, housing or entertainment, and into twice the economic spinoffs for the Montréal region.
It means an estimated gain in revenue of $217 million for the Québec government and $86 million for the Canadian government.
The overall cost of congestion in the Montréal region grew at an annual rate of 10.5% between 1995 and 2000, and is estimated at $1.4 billion of GDP.
In addition, public transit contributes to economic activity by facilitating passenger transportation and helps reduce traffic congestion and the negative effects associated with urban travel, thereby improving quality of life. It also has a positive effect both on urban development and on the property values of buildings located nearby.
Finally, public transit has been recognized as an important competitive advantage for metropolitan areas and also helps attract investment and a skilled workforce.
ThE STM ANd JOB CREATION
The STM’s operating and capital expenditures in the Montréal area translate into 12,303 direct and indirect jobs, totalling $740 million in salaries and $950 million in value added. Its capital projects have led to a sizable increase in procurement, benefiting more than 2,100 suppliers.2
Investments related to the Strategic Plan 2020 will have a considerable impact on the Québec economy. Over a 10-year period, the STM will carry out projects that will generate 4,500 direct and indirect jobs per year. Factoring in procurement, this will mean some 1,900 supplier jobs created per year.
Note: Spinoffs were calculated on the basis of $11 billion in capital projects.
1 Board of Trade of Metropolitan Montreal and SECOR, Public Transit: At the Heart of Montréal’s Economic Development, November 2010, p. 19.2 Association du transport urbain du Québec (ATUQ), Impacts économiques et contribution au développement durable de la Société de transport de Montréal (STM), 2010.
STMSTRATEGIC PLAN 2020

15
OBJECTIVES OF ThE STRATEGIC PLAN 2020540 million trips: An ambitious, sustainable targetIf only network maintenance and optimization projects are considered, the STM should reach 420 million trips per year by 2020—a target that is in line with our results since 2006. With the addition of expansion projects such as the tramway and the metro extension, this target would rise to 455 million, the same as that stated in the city’s 2008 Transportation Plan, Réinventer Montréal, representing growth of 17% over 2010 figures (or 26% between 2008 and 2021).
The STM intends to do more, however: we want to surpass the objective set out in the 2008 Transportation Plan, namely 455 million trips per year by 2020. In fact, in our Strategic Plan we are targeting 540 million trips annually—an increase of 40% over 2010. To reach our goal, we are relying on a 5% modal shift to public transit; to accomplish that, we plan to boost metro service by 26% and bus service by 32%. Expansion projects would mainly involve extending the metro lines to Anjou and Bois-Franc, rolling out the first tramway line and adding more than 400 vehicles to the bus fleet, bringing it to a total of 2,089.
MOdAL ShIFTA modal shift is what occurs when people switch from one mode of transportation to another for all or part of their daily excursions in response to conditions that make public transit use more appealing than single-occupant car use. Conditions can include improved public transit service, shorter travel times and constraints on single-occupant car use.
STMSTRATEGIC PLAN 2020

ThREE SCENARIOS FOR GROWTh IN RIdERShIP FROM 2006 TO 2020
350
400
450
500
550
202020192018201720162015201420132012201120102009200820072006
MIL
LIO
NS
OF
TRIP
S P
ER
YE
AR
5% Modal shift: 540 million trips
Service provided—Based on current trends:420 million trips
City of Montréal’s 2008 Trasportation Plan:455 million trips
2010-2020 VARIATION
40%
17%
8%
This is certainly an ambitious objective. To achieve it, the STM will be counting on the commitment of all its partners and will work with the various municipalities in the Montréal Urban Agglomeration and the Communauté métropolitaine de Montréal, as well as the Québec government, to ensure that transportation services are developed, along with accompanying measures, both to improve the competitiveness of solutions that provide an alternative for automobiles and to curb single-occupant car travel.
The STM thus supports the GHG reduction objectives of the Québec government and the city of Montréal, which are 20% and 30%, respectively (relative to 1990), by 2020. Reaching 540 million trips per year in 2020 will alleviate congestion on the Montréal road network, whose maximum capacity threshold already exceeds 160,000 vehicles, and avoid 760,000 tonnes in net GHG emissions.
The STM expects the modal share of public transit, all modes combined, to rise from 32% in 2008 to 37% in 2020.
16 STMSTRATEGIC PLAN 2020

STMSTraTegic plan 2020 17
MOdAL ShARE ON ThE ISLANd OF MONTRÉAL – 2008 – 2020
2020
2008
48% Car only
32% Public transit
15% Active transportation
5 % Other motorized modes of transportation
41% Car only
37% Public transit
18% Active transportation
4% Other motorized modes of transportation

STMSTraTegic plan 2020 18
STMSTraTegic plan 2020 19
PART II
INFLUENCING FACTORSTo achieve its objectives, the STM will have to continually adapt its services and practices to suit the various
factors that will have a decisive impact on its operations. Among the many influencing factors, this section
covers those that will have a direct effect on the make-up of transportation demand and consequently on
service provided and ridership. They include transportation market trends, urbanization of the metropolitan
area, demographics, the job market, Montréal’s own particular characteristics and potential trends in
oil prices.
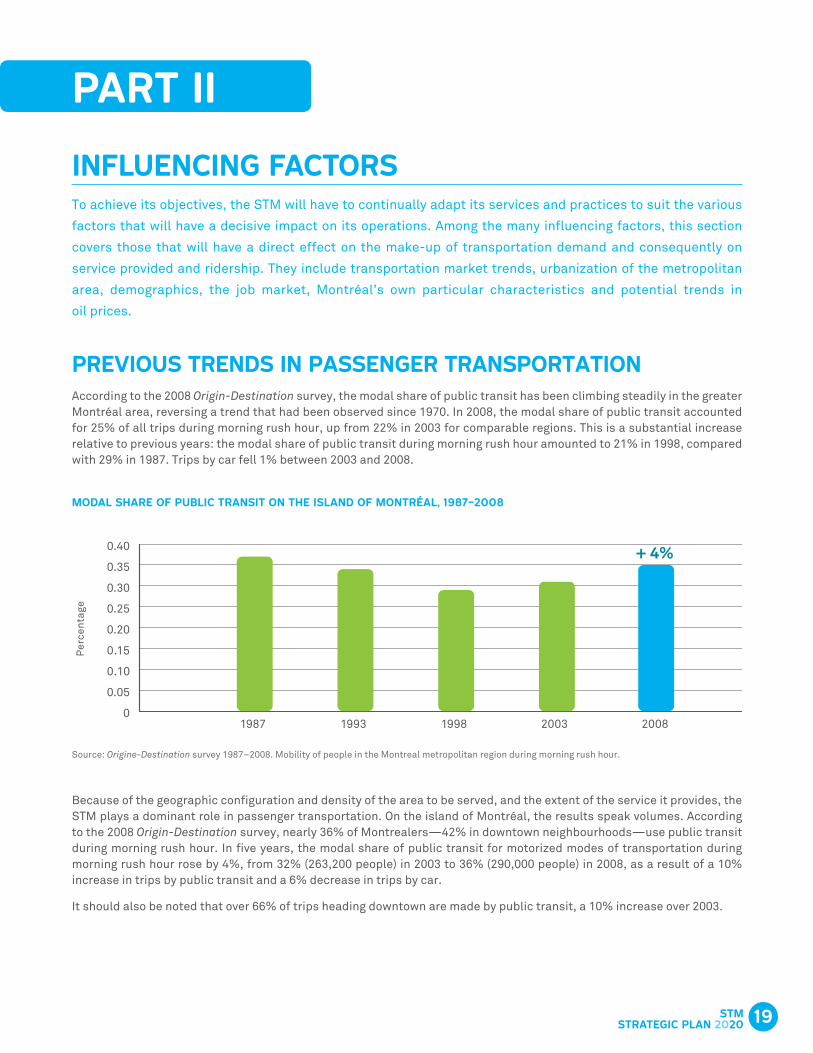
PREVIOUS TRENdS IN PASSENGER TRANSPORTATION According to the 2008 Origin-Destination survey, the modal share of public transit has been climbing steadily in the greater Montréal area, reversing a trend that had been observed since 1970. In 2008, the modal share of public transit accounted for 25% of all trips during morning rush hour, up from 22% in 2003 for comparable regions. This is a substantial increase relative to previous years: the modal share of public transit during morning rush hour amounted to 21% in 1998, compared with 29% in 1987. Trips by car fell 1% between 2003 and 2008.
MOdAL ShARE OF PUBLIC TRANSIT ON ThE ISLANd OF MONTRÉAL, 1987−2008
1987 1993 1998 2003 20080
0.05
0.10
0.15
0.20
0.25
0.30
0.35
0.40 + 4%
Per
cent
age
Source: Origine-Destination survey 1987–2008. Mobility of people in the Montreal metropolitan region during morning rush hour.
Because of the geographic configuration and density of the area to be served, and the extent of the service it provides, the STM plays a dominant role in passenger transportation. On the island of Montréal, the results speak volumes. According to the 2008 Origin-Destination survey, nearly 36% of Montrealers—42% in downtown neighbourhoods—use public transit during morning rush hour. In five years, the modal share of public transit for motorized modes of transportation during morning rush hour rose by 4%, from 32% (263,200 people) in 2003 to 36% (290,000 people) in 2008, as a result of a 10% increase in trips by public transit and a 6% decrease in trips by car.
It should also be noted that over 66% of trips heading downtown are made by public transit, a 10% increase over 2003.

STMSTraTegic plan 2020 20
MONTREALERS USING PUBLIC TRANSIT 1987 – 2008
0
50 ,000
100 ,000
150 ,000
200 ,000
250 ,000
300 ,000
350 ,000
1987 1993 1998 2003 2008
+ 10%
Num
ber
of t
rips
Source: Origin-Destination surveys 1987 – 2008. Mobility of people in the Montreal metropolitan region during morning rush hour.
CAR TRIPS BY MONTREALERS, 1987 – 2008
0
100 000
200 000
300 000
400 000
500 000
600 000
1987 1993 1998 2003 2008
- 6 %
Nom
bre
de
dépl
acem
ents
Source: Origin-Destination surveys 1987 – 2008. Mobility of people in the Montreal metropolitan region during morning rush hour.
In addition, active transportation (walking and biking) shot up by 15%, rising from 123,600 to more than 142,000 people. This reverses the trend observed since 1987, which had shown a steady decline in the modal share of public transit, and
represents a first.

STMSTraTegic plan 2020 21
URBANIZATION OF ThE MONTRÉAL AREAGreater Montréal, defined as the territory of the Communauté métropolitaine de Montréal, covers an area of 4,360 km2 and comprises 82 municipalities. It is home to nearly 3.7 million people and 1.5 million households (2006). The island of Montréal alone accounts for 52% of this population and 56% of these households. Economic activity in the greater Montréal area, which generates a gross domestic product in excess of $120 billion, makes up 49% of Québec’s total economic activity (2009).
The postwar urban sprawl seen in the Montréal region is similar to that observed in other major North American cities. This sprawl leads to heavy automobile dependency and more frequent and longer trips, and makes public transit less efficient, with lower usage and service that must cover a great many destinations spread over wide areas. Shifting households and jobs from the centre of the urban agglomeration to the periphery means increasing the number and average distance of trips that are often not easily made by public transit.
According to the data in the 2008 Origin-Destination survey, the population of the Montréal agglomeration grew at an annual rate of 0.4% between 2003 and 2008, and 0.2% between 1987 and 2003. The populations of Laval and Longueuil, in contrast, experienced annual average growth of 1.5% and 0.8%, respectively, between 2003 and 2008, and 1.4% and 0.5% between 1987 and 2003. North Shore and South Shore municipalities grew 2.0% and 2.2%, respectively, between 2003 and 2008, and 2.6% and 3.5% between 1987 and 2003.
Urban sprawl has meant an increase in average overall density of residential space in the greater Montréal area. The Montréal agglomeration has a density of 48.1 dwellings per hectare, the city of Laval, 21 dwellings per hectare, the Longueuil agglomeration, 22 dwellings per hectare, the North Shore, 12.9 dwellings per hectare and the South Shore, 10.7 dwellings per hectare.1
1 Communauté métropolitaine de Montréal, Metropolitan Land Use and Development Plan (PMAD), consultation version, April 2011.

STMSTraTegic plan 2020 22
FIVE GEOGRAPhIC AREAS OF GREATER MONTRÉAL – POPULATION ANd hOUSEhOLd dISTRIBUTION1
Sources: Institut de la statistique du Québec, Estimation de la population des municipalités du Québec au 1er juillet des années 1996 à 2009; Statistics Canada, 2006 Census. Calculations by the CMM, 2010.
1 Population and household distribution drawn from 2006 and 2009 data, respectively.
North Shore529,800 inhab.185,800 hshld. South
Shore456,200 inhab.162,000 hshld.
Laval390,900 inhab.
144,200 hshld.
399,300 inhab.159,800 hshld.
LongueuilAgglo.
1,906,800 inhab.831,500 hshld.
MontréalAgglo.

STMSTraTegic plan 2020 23
dEMOGRAPhIC OUTLOOkAccording to the Institut de la statistique du Québec, the population of the Montréal region will grow by more than 700,000 —or approximately 20%—between 2006 and 2031, to reach 4.3 million. This growth will break down as follows:
In outlying areas, it will amount to more than 480,000 inhabitants. The populations of Laval, the South Shore and the North Shore will increase by some 30%.
On the island of Montréal, the population is projected to grow by at least 225,000—or 12%.1 In 2031, Montrealers would represent less than half of the region’s population.
PROJECTEd POPULATION OF ThE CENSUS METROPOLITAN AREA (CMA)
0
500
1000
1500
2000
2500
2006 2031
Thou
sand
s of
inha
bita
nts
LongueuilMontréal Laval South Shore North Shore
This kind of population growth will necessarily mean an increase in trips, adding further pressure to major road networks, municipal arteries in Montréal and public transit systems that are already saturated in many places. For the metropolitan region, population growth, in particular that of the Montréal agglomeration, will likely be driven mainly by international immigration, according to the projections of the Institut de la statistique du Québec. The immigrant share of the population will rise from 20.7% in 2006 to over 30.3% in 2031.
PROJECTEd MIGRATORY MOVEMENTS IN ThE CENSUS METROPOLITAN AREA (CMA)2
(Nomber of people)
Natural growth
Balance of intraprovincial migration
Balance of intraprovincial migration
Balance of international migration
0- 250,000- 500,000- 750,000
Montréal Island
Laval
Longueuil Agglo.
North Shore
South Shore
750,000 1,000,000500,000250,000
1 Institut de la statistique du Québec, Perspectives démographiques du Québec et des régions, 2006 – 2056 – 2009 edition. Calculations by CMM, 2010.2 Communauté métropolitaine de Montréal, Metropolitan Land Use and Development Plan (PMAD), consultation version, April 2011.

STMSTraTegic plan 2020 24
AGEING OF ThE POPULATIONOnce again according to the Institut de la statistique du Québec, the proportion of island of Montréal residents aged 65 or older will rise from 15% in 2006 to 21% in 2031;1 in the greater Montréal area, it will increase from 13% to 22%. The 25 and under age bracket is also projected to grow. Given the effect of age on transportation patterns, the pool for typical public-transit customers would see a proportional increase. Public transit would consequently be a worthwhile alternative solution to automobile transportation in the urban setting. Transportation needs for tomorrow’s seniors will go well beyond the accessibility, ease and rapidity of public transit. Future generations of senior citizens could have more varied needs in terms of mobility and transportation, where autonomy and choice will be prime criteria.
According to the data in the 2008 Origin-Destination survey, work is the main reason for travel in the metropolitan area during morning rush hour, accounting for 51% of trips. Getting to and from school represents another 29% of trips. By 2031, the population forming the 35 – 44 and 45 –54 age brackets, which are associated with the working world, will be larger, as will the 15 –24 age group, made up largely of students..
PROJECTEd POPULATION OF GREATER MONTRÉAL BY AGE GROUP, 2006−2031
700 000
600 000
500 000
400 000
300 000
200 000
100 000
0
2006 2031
(Age group)
0-4 5-14 15-24
School Work
25-34 35-44 45-54 55-64 65-74 75-84 85+
Nom
ber
of p
eopl
e
Source: Institut de la statistique du Québec, Perspectives démographiques du Québec et des régions, 2006 – 2056 – 2009 edition. Calculations by the STM, 2010.
1 Institut de la statistique du Québec, Perspectives démographiques du Québec et des régions, 2006 – 2056 – 2009 edition. Calculations by the STM, 2010.

STMSTraTegic plan 2020 25
EMPLOYMENT PICTUREGreater Montréal has a pool of 1.7 million jobs, 1.1 million (63%) of which are concentrated on the island of Montréal. The downtown core alone represents nearly 250,000 jobs, making it the region’s prime employment hub. The area surrounding the core (Ville-Marie, Côte-des-Neiges–Notre-Dame-Grâce, Rosemont, Plateau Mont-Royal and Sud-Ouest boroughs) accounts for close to 500,000 jobs and more than 150,000 students. The number of jobs in the greater Montréal area has been growing steadily, while it has remained stable on the island of Montréal since the early 2000s. Over the same period, the North Shore, Longueuil and Laval job market has expanded continually.1
In the Montréal region, needs for transportation to and from work are very high, especially from outlying areas toward downtown. The urban morphology partially explains the high rate of the modal share of public transit in Montréal. The Communauté métropolitaine de Montréal forecasts average growth of 7,500 jobs per year, bringing the total to nearly 2 million jobs in 2031. This growth will be combined with a changed regional economy, with more activity in population-related and business support services and less in the manufacturing sector. Of the geographical areas in the region, the island of Montréal will experience the lowest growth rate between 2011 and 2031, while the North Shore will see grow the fastest, at 0.2% per year. As a consequence, the STM will have to adapt its service to better serve employment hubs on the island of Montréal.
EVOLUTION OF JOB dISTRIBUTION IN ThE CMA, 1996 – 2009
90
110
130
150
170
190
210
230
250
1 110
1 130
1 150
20011996 2002 2003 2004 2005 2006 2007 2008 2009
MontréalLaval
Num
ber
of jo
bs (t
hous
ands
)
North Shore
LongueuilSouth Shore
Source: Consortium of the Communauté métropolitaine de Montréal, L’emploi local 2009 dans la région métropolitaine Montréal.
1 Communauté métropolitaine de Montréal, Metropolitan Land Use and Development Plan (PMAD), consultation version, April 2011.

26
SPECIFIC FEATURES OF ThE MONTRÉAL URBAN ENVIRONMENTAccording to a study (2008) by the Fraser Institute, Quebecers are the biggest users of public transit in Canada. In Québec, it takes only 10.7 people to account for 1,000 public transit rides, versus 12.5 in Ontario and 17.1 in British Columbia.1 Montrealers form a large proportion of that number. They take 204 public transit rides per year, compared to Torontonians with 188 and residents of large American cities with an average of 93. However, residents of New York City, Portland, San Francisco and Washington, D.C. use public transit more than Montrealers.
Generally speaking, car use in urban areas increased between 1992 and 2005. The proportion of people aged 18 and up who travelled by car, whether as drivers or passengers, rose from 68% to 74%. For Montréal residents, however, the proportion was 65%.
Still in Montréal, within a 5-km radius from downtown, automobile dependency is much lower at 29%; between 5 km and 9 km from downtown, it climbs to 54%.2 Therefore, the closer people live to downtown, the greater their use of public transit and active transportation.
The high level of public transit use results from high residential density, i.e., the number of people per square kilometre. The population density in the region’s central city (4,458 inhabitants/km2)3 is markedly different from that of the majority of central cities in the 32 other North American metropolitan regions that are comparable to greater Montréal (2,930 inhabitants/km2 on average).4
Streets that are difficult to access, the great distances to be covered and the low population density associated with a high level of car ownership (more than three vehicles per household) are all factors that pose challenges for optimal public transit development. The increase in residential density at the various access points for Montréal’s transportation networks allows for greater accessibility and provides significant leverage in the fight against GHG emissions.
1 Fraser Institute, Studies in Transportation & Infrastructure, October 2008.2 “Dependence on cars in urban neighbourhoods – Life in metropolitan areas,” Canadian Social Trends 85 (Summer 2008). 3 Communauté métropolitaine de Montréal, Portrait of Greater Montréal, 2010 Edition.4 Communauté métropolitaine de Montréal, Metropolitan Land Use and Development Plan (PMAD), consultation version, April 2011.
STMSTRATEGIC PLAN 2020

STMSTraTegic plan 2020 27
GROWTh IN CAR OWNERShIPDuring the period from 2006 to 2010, the number of passenger vehicles (light trucks and cars) on the road in the greater Montréal area rose by 9.6% to reach over 2.4 million. The North Shore, Laval and the Montérégie (including the Longueuil agglomeration) saw respective increases of 13%, 10.25% and 10.47%. Growth on the island of Montréal was lower, at 5.5%, amounting to almost 715,000 passenger vehicles, or a little less than a third of the total for greater Montréal. In addition, light trucks continued to be popular. In the last five years, there has been a 24% to 29% increase in light trucks in the various areas of greater Montréal.
If the trend continues, at a rate of 370 vehicles per 1,000 inhabitants (2010),1 the total number of passenger vehicles on the island of Montréal would increase by over 83,000 by the year 2031. It should be noted that almost a third of Montréal households do not own a car.
In fact, the large number of cars on the road in the Montréal region puts considerable pressure on the road network, leading to significant congestion-related problems. Consequently, morning rush hour continues to start earlier and earlier.
According to Québec’s Ministère des Transports, traffic congestion costs $1.4 billion per year, $1.2 billion of which stems from lost hours directly attributable to traffic. Urban sprawl is among the causes of this congestion. Other indirect congestion costs include $114 million in vehicle use, $40 million in fuel, $15 million related to pollution emissions and $8 million, to GHG emissions. Delays caused by road work and accidents are estimated to cost $3 billion, a number that is constantly rising.
For the STM and the city of Montréal, this is a major issue, as the bus network is likely to be increasingly affected by traffic congestion. Accordingly, significant efforts must be devoted to creating reserved lanes to make public transit more efficient and appealing.
GROWTh IN CONGESTION COSTS IN ThE MONTRÉAL REGION, 1993 – 2009
1993 $550 million
2004 $780 million
2009 $1.4 billion
Source: Ministère des Transports du Québec, Évaluation des coûts de la congestion routière dans la région de Montréal pour les conditions de référence de 2003, 2009.
1 Société de l’assurance automobile du Québec, Dossier statistique, Bilan 2007 – 2010, June 2011.

28
FLUCTUATIONS IN FUEL PRICES In August 2008, the retail price of gas reached new highs in the Montréal region. Since then, prices at the pump have been extremely volatile. Factors influencing these prices on a world level include speculation in the futures market, variation in the petroleum industry’s refining capacity, global demand for petroleum products and transportation energy needs.
According to forecasts by the United States Department of Energy (DOE), worldwide energy needs (compared to 2007) could rise 10% by 2015 and 20% by 2020. By 2035, they could increase by 50%, to 740 quadrillion BTUs. Even if demand for renewable energy rises sharply, petroleum and coal will remain the main energy sources.
The DOE forecasts that the 2020 benchmark price of a barrel of oil could fluctuate between US$52 and US$186, under a US$100-per-barrel scenario. By 2035, the price could vary between US$51 and US$210 under a US$133-per-barrel scenario (constant 2008 dollars).
Regardless, the price of gas, which is high and will remain so, is a determining factor in consumers’ economic choices and in motorists’ travel habits.
For transit authorities, the high price of gas could have a twofold effect: upward pressure on the cost of service and downward pressure on revenue from the gas tax due a drop in demand for fuel. To protect itself against these risks, the STM wishes to launch its network electrification project, with a view to readiness by 2025.
STMSTRATEGIC PLAN 2020

29
WORLdWIdE ENERGY NEEdS BY ENERGY SOURCE, 2007 – 2035 (QUAdRILLIONS OF BTUS)
250 Historical Projections
Historical Projections
200
150
100
50
01990 2000 2007 2015 2025 2035
Oil CoalLFS – Natural gasRenewable energyNuclear
250
200
150
100
50
01990 2000 2009 2015 2025 2035
High-price scenario $210 Benchmark scenario $133 Low-price scenario $51
EVOLUTION OF ThE PRICE OF OIL, 1990−2035*
250 Historical Projections
Historical Projections
200
150
100
50
01990 2000 2007 2015 2025 2035
Oil CoalLFS – Natural gasRenewable energyNuclear
250
200
150
100
50
01990 2000 2009 2015 2025 2035
High-price scenario $210 Benchmark scenario $133 Low-price scenario $51
* Low-sulphur oil in 2008 US$.
STMSTRATEGIC PLAN 2020

STMSTraTegic plan 2020 30
PRIORITY 1Expand services
1. Renovate and expand the metro network while increasing overall service
2. Improve overall service while diversifying the bus network
3. Roll out the first tram route
4. Help implement all public transit initiatives on the island of Montréal
5. Bolster overall paratransit service
PRIORITY 2Improve the customer experience and marketing efforts
6. Enhance the Breathe Easier brand image
7. Implement a service quality program
8. Improve service reliability and punctuality
9. Improve the quality of passenger information
10. Provide a safe, user-friendly and pleasant atmosphere
11. Apply universal accessibility measures
12. Diversify fare products
PRIORITY 3Attract, develop and mobilize talent
13. Deploy ways of recruiting employees and developing their skills
14. Continue with the current employee and manager mobilization effort
15. Continue fostering collaborative work relations
16. Help create a healthy, safe and inclusive work environment
STRATEGIES
PART III
PRIORITIES, STRATEGIES ANd ACTIONS

STMSTraTegic plan 2020 31
PRIORITY 4Optimize investment management
17. Generate added value when assets are replaced
18. Optimize project portfolio management and improve project execution
PRIORITY 5Further improve performance
19. Increase and diversify revenue sources
20. Tightly control expenditures
PRIORITY 6Place sustainable development at the centre of all our decisions
21. Take part in the government’s efforts to electrify public transit
22. Lessen the STM’s ecological footprint
23. Promote sustainable development
STRATEGIES


33
PRIORITY 1
ExPANd SERVICES The STM’s objective is to increase public transit ridership by 40% by 2020, to reach 540 million local and regional trips per
year. To that end, the company aims to augment total bus, metro and paratransit service by 30%. More specifically, we
plan to boost transit capacity by extending the Blue and Orange metro lines, introducing the first tram route and instituting
new rapid bus services on the island of Montréal. In addition to keeping our rolling stock and real estate holdings in good
condition, we intend to acquire new vehicles and create new services. To support this growth, we will also improve the
performance and availability of our equipment.
STRATEGIES 1 RENOVATE AND EXPAND THE METRO NETWORK WHILE INCREASING OVERALL SERVICE
2 IMPROVE OVERALL SERVICE WHILE DIVERSIFYING THE BUS NETWORK
3 ROLL OUT THE FIRST TRAM ROUTE
4 HELP IMPLEMENT ALL PUBLIC TRANSIT INITIATIVES ON THE ISLAND OF MONTRÉAL
5 BOLSTER OVERALL PARATRANSIT SERVICE
PRIORITY 1 – MAIN INdICATORS
2006 2009 2010 2015 2020Indicators Actual Actual Actual Target Target
Ridership (in millions of trips) 363.3 382.8 388.6 423.3 540.0
Service provided (in millions of kilometres)
Metro 59.8 76.3 76.6 77.9 97.2
Bus 69.8 77.3 81.1 95.4 107.4
Tramway - - - - 1.6
Total 129.6 153.6 157.7 173.3 206.2
Paratransit ridership (in millions of trips) 2.0 2.4 2.7 3.4 4.3
Bus/Transit priority measures (for buses) (in kilometres) 61.6 99.0 101.6 320.0 370
Bus fleet 1,679 1,679 1,680 1,868 2,089
STMSTRATEGIC PLAN 2020

STMSTraTegic plan 2020 34
The STM’s service growth strategy is based on improving the metro and bus network and developing new systems like the tramway. The planned network development is illustrated in the following sections. In terms of the metro, the projects to extend the Blue line to Anjou and the Orange line to Bois-Franc, to be completed in 2016 and 2019, respectively, will generate an additional 20 million kilometres. The first tram route will be launched in 2017 and by 2020 will represent a further 1.6 million kilometres of capacity.
As regards the bus network, we plan to add more than 430 new buses to the fleet and the distances they cover will rise by 16 million kilometres per year. We will introduce new bus rapid transit (BRT) lines on Pie-IX and Henri-Bourassa boulevards in 2014 and 2018, respectively, for a total of about 10 million additional kilometres. Furthermore, transit priority measures (TPM) for buses will be implemented on nearly 370 kilometres in 2020.

STMSTraTegic plan 2020 35
STRATEGY 1 RENOVATE AND EXPAND THE METRO NETWORK WHILE INCREASING OVERALL SERVICE
The metro network is the backbone of public transit in Montréal. Its introduction in 1966 had several benefits: development of the downtown core, creation of one of the most extensive underground pedestrian networks in the world and establishment of a highly efficient transit system⎯at a low cost per passenger-kilometre.
In 2010, the metro provided 239.3 million trips, nearly 80% of them made by Montrealers. Despite the fact that some segments have been saturated at rush hour in recent years, the metro remains the preferred means of serving downtown and outlying areas.
The municipalities in the Communauté métropolitaine de Montréal now recognize that extending the metro beyond the Montréal agglomeration is of strategic importance for the social, economic and sustainable development of greater Montréal. That is why these municipalities have agreed to contribute directly to financing the project.
Expanding the metro system will enable the STM to provide faster, more flexible and more appealing transit service to the entire region with a view to developing or redefining certain areas on the island and, eventually, in the region. It will also help significantly reduce single-occupant car use.
Replace metro cars and increase overall passenger capacityThe metro fleet is made up of 759 cars: 336 MR-63s and 423 MR-73s. We have begun renewing our entire fleet and, starting in 2014, first-generation cars will be replaced by the new MPM-10 model. These new cars, which will allow inter-car circulation, will increase passenger capacity by 15%, improve service reliability and customer comfort, and provide customers with access to real-time information. They will also comply with universal accessibility and security criteria, and will feature better ventilation.
With the introduction of new cars and the renovation of maintenance facilities, service provided will remain at 75 million kilometres in 2012 and 77 million kilometres in 2013. Thereafter, it will gradually increase, to 77.9 million kilometres in 2015 and 97.2 million kilometres in 2020.
EVOLUTION OF METRO SERVICE 2006 – 2020
50
60
70
80
90
100
110
Mill
ions
of
km−
cars
+ 32%
120
2006 2007 2008 2009 2010 2011 2012 2013 2014 2015 2016 2017 2018 2019 2020
2006 2007 2008 2009 2010 2011 2012 2013 2014 2015 2016 2017 2018 2019 202030
40
50
60
70
80
90
100
Mill
ions
of
km
97.2 M KM
107.4 M KM
+ 26%
110

STMSTraTegic plan 2020 36
Extend the metro A memorandum of understanding was signed in 2009 by the mayors of Laval, Longueuil and Montréal asking the Québec government to complete the metropolitan metro system. It lays out the following scenario: the Blue line will be extended to Anjou, the Orange line will connect the Côte-Vertu station in Montréal to the Montmorency station in Laval, and the Yellow line will be extended to Chemin de la Savane, in Longueuil.
The STM plans to open five new stations in 2016—Provencher, Viau, Lacordaire, Langelier and Anjou—on the Blue line, totalling 6.1 kilometres. The first to be completed will be the Provencher station, strategically located at the intersection of Pie-IX and Jean-Talon for convenient transfers between current and future services, including the Pie-IX bus rapid transit (BRT) line and the Train de l’Est.
Once the metro is extended to Boulevard des Galeries-d’Anjou, the boroughs of Anjou and Saint-Léonard will be better served. In addition, the new stations will promote intermodality along eastern Montréal’s north-south corridors.
The Orange line’s extension from Côte-Vertu to Bois-Franc will provide access to the Deux-Montagnes commuter train line starting in 2019. The Borough of Saint-Laurent will thus be better served—especially important given its steady economic and population growth.
Studies for extending the Yellow line, in Longueuil, and the Orange line (Bois-Franc and Montmorency stations), in Laval, deemed a priority by the Communauté métropolitaine de Montréal, should be completed between 2011 and 2020.

STMSTraTegic plan 2020 37
PR
OJE
CTS
FO
R C
OM
PLE
TIN
G T
hE
MET
RO
PO
LITA
N M
ETR
O S
YSTE
M –
20
09 M
EMO
RA
Nd
UM
OF
UN
dER
STA
Nd
ING

STMSTraTegic plan 2020 38
STRATEGY 2 IMPROVE OVERALL SERVICE WHILE DIVERSIFYING THE BUS NETWORK
Following the example of other North American transit authorities, the STM will diversify its range of services and its modes of transportation in order to increase the competitiveness and appeal of public transit versus single-occupant car travel.
Planned surface modes of transportation
Minibus and midibus For the STM, the midibus is the ideal mode of transportation for low-density areas or to meet specific needs such as service to industrial areas, night service and services for people with functional limitations, the elderly and tourists.
Standard and articulated buses
In combination with rapid service infrastructure, the bus remains the best solution for serving medium-density neighbour-hoods and major urban corridors. It is a flexible and low-cost way of improving the quality and efficiency of public transit.
Trolleybus
The trolleybus (electric traction vehicle with overhead wires), a high-quality means of transportation, can offer frequent service on major urban corridors. Operating on reserved lanes or dedicated lanes with stations, and using articulated vehicles, the trolleybus can also be considered an intermediate mode of transport.
Tramway
The tramway (self-propelled railcar), for its part, provides more seating than a bus, is more appealing and has a greater impact. It plays a prominent role in urban development and contributes to neighbourhood revitalization. The tramway has a positive effect on public perception of transportation by creating a new image and also acts as a vector of development.
Increase bus serviceIn the wake of its network development plan 2007 – 2011, the STM undertook to redouble its efforts to meet the challenges inherent in improving bus network service and diversification. The fact that bus ridership has grown more slowly than metro ridership makes these efforts all the more important.
The STM will enhance service with respect to available vehicles (add to fleet and reduce fleet unavailability), as well as on a number of other levels, including frequency, accessibility, speed and reliability. We will also focus on friendliness, comfort, ease of use and electrification.

STMSTraTegic plan 2020 39
MO
dE O
F T
RA
NS
PO
RTA
TIO
N C
OM
PA
RIS
ON
TA
BLE
M
Od
E
LI
Gh
T
IN
TER
MEd
IATE
h
EAV
Y
M
IdIB
US
B
US
A
RTIC
ULA
TEd
BU
S
TR
OLL
EY
BU
S
BR
T
TR
AM
WA
Y
METR
O
SIT
E (L
EN
GTH
) 8
to 1
1 m
eter
s 12
met
ers
18 m
eter
s 18
met
ers
18 m
eter
s (1
uni
t =
1 c
ar)
1 tr
ain
= 9
car
s
30 t
o 40
met
ers
(Gre
en a
nd O
rang
e lin
es)
1 tr
ain
= 6
car
s
(B
lue
and
Yel
low
line
s)
SE
ATI
NG
CA
PA
CIT
Y
20
30
54
54
47
75
306
(34
per
car
)
MA
XIM
UM
CA
PA
CIT
Y
35
75
105
105
105
200
1200
PA
SS
EN
GE
R/H
OU
R/
500
to 7
50
1,00
0 to
1,5
00
1,50
0 to
2,0
00
1,50
0 to
2,0
00
2,00
0 to
3,0
00
2,00
0 to
4,0
00
20,0
00 t
o 30
,000
PE
AK
DIR
EC
TIO
N
DIS
TAN
CE
BE
TWE
EN
25
0 to
500
met
ers
250
to 5
00 m
eter
s 25
0 to
500
met
ers
250
to 5
00 m
eter
s 40
0 to
500
mèt
res
400
to 5
00 m
eter
s 95
0 m
eter
s
S
TOP
S
b
etw
een
stop
s b
etw
een
stop
s
jOU
RN
EY
SP
EE
D
10 t
o 25
km
/h
10 t
o 25
km
/h
Bet
wee
n 10
to
25 k
m/h
10
to
25 k
m/h
B
etw
een
17 t
o 25
km
/h
17 t
o 25
km
/h
35 t
o 38
km
/h
SE
RV
ICE
LIF
E
12 t
o 16
yea
rs
16 y
ears
16
yea
rs
20 t
o 25
yea
rs
16 y
ears
25
yea
rs
40 y
ears
BA
SE
UN
IT C
OS
T $5
50,0
00
$470
,000
$7
00,0
00
$1,0
00,0
00
$2,0
00,0
00
app
rox.
$2,
000,
000
$2,0
00,0
00
PE
R V
EH
ICU
LE
(d
iese
l pro
pul
sion
) (d
iese
l pro
pul
sion
)
(die
sel p
rop
ulsi
on)
to
$3,
000,
000
$670
,000
$9
00,0
00
$900
,000
$3,0
00,0
00
(h
ybri
d p
rop
ulsi
on)
(hyb
rid
pro
pul
sion
) (h
ybri
d p
rop
ulsi
on)
(h
ybri
d p
rop
ulsi
on)
GH
G E
MIS
SIO
NS
ap
pro
x. 9
00
1,45
3 (d
iese
l pro
pul
sion
) 2,
099
(die
sel p
rop
ulsi
on)
none
2,09
9 (d
iese
l pro
pul
sion
) no
ne
none
(gC
O2e/
km)
(hyb
rid
pro
pul
sion
) 1,
023(
hyb
rid
pro
pul
sion
) 1,
561
(hyb
rid
pro
pul
sion
)
1,56
1 (h
ybri
d p
rop
ulsi
on)

STMSTraTegic plan 2020 40
Moreover, the STM expects to cover 85.3 million kilometres in 2011, up 22% from 2006. We are targeting an increase of 32% by 2020, reaching 107.4 million kilometres, for annual growth of 2.6% relative to 2010.
As a result of additional capacity and a reduced rate of unavailability, the number of bus departures during morning rush hour will rise in the next 10 years to 1,820 (40-foot bus equivalent), corresponding to 6.5 million service hours per year. The bus fleet will grow from 1,705 to 2,089 vehicles, including 400 articulated buses. By the end of 2020, articulated buses will represent almost 25% of kilometres travelled.
EVOLUTION OF BUS SERVICE 2006 – 2020
50
60
70
80
90
100
110
Mill
ions
of
km−
cars
+ 32%
120
2006 2007 2008 2009 2010 2011 2012 2013 2014 2015 2016 2017 2018 2019 2020
2006 2007 2008 2009 2010 2011 2012 2013 2014 2015 2016 2017 2018 2019 202030
40
50
60
70
80
90
100
Mill
ions
of
km
97.2 M KM
107.4 M KM
+ 26%
110
Planned measures revolve around five focus areas:
Improving downtown service
Using public transit as a mitigation measure during major roadwork
Improving the competitiveness of public transit on corridors with high ridership
Adapting the network and service to the needs of developing areas
Adapting service to the needs of specific customers
Since 2007, the STM has carried out a host of projects to improve over half of its bus lines, generating an increase in ridership on those lines. To continue this improvement and enhance the appeal of travelling by bus, we will implement a series of new measures.
In addition, new bus rapid transit lines will be created parallel to the metro and a number of measures will be applied to lower the saturation of the metro system at rush hour throughout the critical period from 2012 to 2015.
The integration of sales and collection data with data from iBus, the future real-time customer information management system, will enable us to improve detailed trip planning and know exactly what fares were used. It will thus provide us with key information that can be used to fine-tune our services to Montrealers’ actual needs.

STMSTraTegic plan 2020 41
Create direct, rapid links to downtownTo improve the speed of bus service, the STM will increase the frequency of direct routes to the downtown core and in outlying areas. Line 427−Express Saint-Joseph, for example, which connects the boroughs of Rosemont–La Petite-Patrie and Plateau-Mont-Royal, was an immediate success, carrying an average of 30 passengers per trip.
Line 747–Shuttle, which provides 24-hour, year-round service between the Gare d’autocars de Montréal (Berri-UQAM station) and Montréal-Trudeau airport, is another success story, meeting the needs of both travellers and airport employees. With the collaboration of Aéroports de Montréal, the 747 transported over a million passengers in its first year.
The STM will identify other corridors on which to launch limited-stop, direct lines toward downtown. Central areas of the island of Montréal will be given priority, due to their travel potential and to the orthogonal configuration of the transport network, which makes it necessary to transfer to get downtown. In the medium term, the company will completely reexamine rapid transit in the West Island to take advantage of opportunities presented by the future shuttle between Montréal-Trudeau airport and Montréal’s central train station.
We also plan to establish other rapid links to complement the metro system. Given the saturation of the eastern branch of the Orange line (Montmorency–Berri-UQAM) and the arrival of new cars in 2014, we wish to increase bus service to be able to transport some of the customers on that section of the metro more comfortably. The creation of limited-stop bus lines on north-south arteries parallel to the Orange line or express lines on east-west corridors, taking passengers directly downtown, will allow us to offer alternatives to the metro.
The project to rebuild the Turcot interchange is a relevant example that illustrates the scope of the efforts made by the STM to offer residents of the West Island, Lachine, LaSalle and the area around the work site rapid service by means of reserved lanes.
Scheduled to run from 2012 to 2016, the Turcot interchange project will likely be followed by repairs to the Saint-Pierre interchange. Consequently, the STM plans to implement mitigation measures ahead of the work to encourage drivers, 60% of whom come from areas west of highway 13, to use public transit in order to foster a true modal shift and thereby reduce car traffic in the construction zone.
In June 2012, to alleviate the traffic problems caused by these projects while they are being carried out and to offer an alternative to single-occupant car use, the STM will launch five new express lines, over almost 100 km of reserved lanes, serving downtown from the West Island. These services will save users an average of 10 minutes over current travel times. We will also have to increase service on express lines coming from Lachine, LaSalle and Notre-Dame-de-Grâce by 10% to 20%. These improvements will translate into over 95,000 extra hours of service per year and will require additional buses.

Ex
PR
ES
S T
RA
NS
IT d
EV
ELO
PM
EN
T O
N T
hE IS
LAN
d O
F M
ON
TR
EA
L 20
11 –
20
20
Exp
ress
tra
nsi
t se
rvic
eM
etro
line
s 20
10
Met
ro s
tati
ons
2010
Met
ro e
xten
sion
(cur
rent
ly u
nder
stu
dy)
Met
ro s
tati
ons
(cur
rent
ly u
nder
stu
dy)
Met
ro e
xten
sion
(off
-isl
and)
Bus
Rap
id T
rans
it (B
RT)
Bus
Rap
id T
rans
it (B
RT)
– e
xten
sion
Cur
rent
Exp
ress
line
s to
dow
ntow
n
Pla
nned
Exp
ress
line
s to
dow
ntow
n
Exp
ress
net
wor
k

43
Roll out new Transit Priority Measures (TPM) for busesThe STM will institute transit priority measures that will make bus service more reliable, more punctual, faster and more environmentally friendly. These measures include the creation of reserved lanes, changes in traffic signals (signal priority or extended green light) and modifications in road layout and markings. We have already begun applying these measures with the collaboration of the city of Montréal, under the 2008 Transportation Plan, Réinventer Montréal.
In addition, reserved lanes will increase from 101 km to over 370 km by 2020. Priority measures are currently in effect on Saint-Joseph, Saint-Michel and Rosemont boulevards, as well as on Rue Beaubien. They will eventually be extended to other busy arteries: Sherbrooke, Saint-Jean and Pierrefonds, highway 20 (Turcot), Saint-Patrick, Notre-Dame East, Côte-de-Liesse, Jean-Talon and Viau.
STMSTRATEGIC PLAN 2020

BU
S N
ETW
OR
k d
EV
ELO
PM
EN
T
Cur
rent
TP
M c
orri
dors
Pla
nned
TP
M c
orri
dors

45
Introduce new families of servicesTo increase ridership on our bus network, we have begun reviewing our families of services to make them easier to use. Our 209 bus lines have consequently been divided into five families, each of which has been given its own identity through distinctive colours and numbers.
The process of forming families of services will be completed by the beginning of 2012. These families consist of local, express and night lines, dedicated lines (specific customers, event shuttles, tourist services, etc.) and the most popular lines that make up the 10-minutes-max network. This last network, which is within a one-kilometre walk for nearly 90% of Montrealers, complements the metro system and bus rapid transit.
SIMPLIFIEd APPROACh
FIVE TYPES OF SERVICE
Local network = Proximity: Some one hundred local bus and shared taxi routes within a 500-metre
walk of over 98% of places of residence, work or study.
10-minutes-max network = Frequency: The 31 most heavily travelled lines on the local network; it
offers a minimum of six buses per hour from 6 a.m. to 9 p.m., minimizing wait times.
All-night network = Nocturnal: Some twenty lines allowing travel throughout Montréal outside metro
operating hours.
Express network = Speed: Some thirty Express, Metrobus, Trainbus and R-Bus lines toward downtown,
the metro and the train, with limited stops, minimizing travel time.
Shuttle network = Convenience : Some twenty lines with service and schedules that meet the needs of
the elderly or tourists, or that are tailored to major cultural or sporting events in Montréal
STMSTRATEGIC PLAN 2020

STMSTraTegic plan 2020 46
Roll out the Bus Rapid Transit service on Pie-IX and Henri-Bourassa boulevards
To improve the competiveness of public transit on high-ridership corridors, the STM favours the Bus Rapid Transit (BRT) system. According to the Transport Research Board, BRT represents an excellent compromise between bus and metro or tramway, offering attractive service at a lower cost.
Generally speaking, BRT requires reserved lanes, modern stations and vehicles with a distinctive identity (customized logos and colours), and an efficient passenger information system. It also allows for the possibility of integrating other bus lines in order to reduce travel time for as many customers as possible.
The first BRT line will be rolled out on the Pie-IX corridor in 2014, connecting Laval to downtown Montréal via Boulevard Pie-IX. It will consist of two bi-directional lanes in the middle of the boulevard, two secure islands for boarding on either side of the boulevard, and some twenty stations spread out over 10 km. The route’s surroundings will be designed to reflect quality, friendliness and safety.
Between now and 2020, the STM will work to extend its BRT network. To that end, we will conduct analyses to identify arteries with the highest potential. We are planning to introduce a BRT line on the Henri-Bourassa corridor, which has daily ridership of over 70,000 passengers, in 2018. It should be noted that all new BRT lines will be plied first by hybrid vehicles and ultimately by all-electric vehicles.
Set new service standards In 2011, the STM will institute new service standards, including maximum number of people per vehicle, so as to offer our customers greater comfort, both for standard service and for rapid service on longer trips.
Over the period covered by the Strategic Plan, we will also establish new capacity standards for every category of new vehicle—minibus, midibus, trolleybus, tram—in addition to adapting each category to the area it serves.
Launch the midibusTo serve low-density neighbourhoods or neighbourhoods with narrow roads, the STM wants to augment its fleet with midibuses, which have a lower capacity than traditional buses and are better suited to certain situations.
The midibus measures between 8 and 11 metres in length and carries about 20 passengers. Among other advantages, it can serve residential or industrial areas not accessible to traditional buses. The midibus also offers greater comfort as well as personalized, user-friendly service to the elderly and to parents travelling with children.
This type of vehicle will enable us to offer better service to users of paratransit, night service and Navette Or shuttles, as well as to riders on tourist, cultural or heritage routes. The midibus could also be used on lines with lower ridership. Alongside our efforts to electrify transit, we will launch a pilot project made up seven electric midibuses on the Vieux-Montréal–Vieux-Port line.
PIE-Ix BRT ROUTE

STMSTraTegic plan 2020 47
Redesign the nighttime networkWe have reviewed our nighttime network in order to improve service for the growing number of customers with travel needs at atypical hours. We plan to minimize transfers and better locate terminals. These improvements began in 2011.
Every night of the week, the STM offers increased bus frequency after the metro closes. The nighttime network provides more direct service between the far ends of the island and downtown.
Develop the neighbourhood shuttle networkThe STM wants to offer service that is better suited to the elderly. In 2008, we launched the Navette Or service, which we now aim to improve in several ways: accessibility, security, comfort, user-friendliness and service quality.
Navette Or service means that older customers who have difficulty using the bus and metro network can increase their mobility. For example, they can take the shuttle to health, shopping and community centres. Among other benefits, this type of service helps combat the social isolation of the elderly by making it easier to participate in local life.
Currently, there are 11 Navette Or lines in operation: Montréal-Nord, Saint-Michel, Rosemont, Rivière-des-Prairies, Mercier-Ouest, Hochelaga-Maisonneuve, LaSalle, Cartierville-Bordeaux, Côte-Saint-Luc, Anjou and Baie D’Urfé.
Improve intermodality and promote the transportation cocktailThe STM intends to bolster the intermodality of its transportation network. To achieve this goal, we plan to combine various measures, including park-and-ride lots and multimodal terminals, in order to encourage the switch from single-occupant car travel to public transit. We have already begun synchronizing our bus schedules with those of commuter trains.
By offering a mix of public transit modes, the STM allows customers to use various modes during the same trip. Public transit trips will therefore become more direct and fluid, making them more competitive with cars in terms of travel time. We consider other means of transportation, such as bicycles, taxis, carpooling and car-sharing, to be complementary to the services we provide. We intend to promote them and develop combined offers in cooperation with different partners like BIXI, Communauto, Vélo-Québec, travel management centres in greater Montréal and the taxi industry. Our goal is to offer customers a wide array of options, including taxi, for their travel.
As the main provider of public transit in Montréal, the STM can, in close collaboration with the city of Montréal, play a major role in planning networks (bus, metro and taxi) and promoting all public transit. This allows for better planning and coordination of transportation services, while respecting our own mission as well as that of the taxi industry. Linking public transit with taxi travel would offer Montrealers an attractive combination of modes of transportation while providing the taxi industry with an opportunity to increase its revenues and its visibility.

STMSTraTegic plan 2020 48
STRATEGY 3 ROLL OUT THE FIRST TRAM ROUTE
During the period covered by the Strategic Plan 2020, the STM will promote public transit so as to reduce single-occupant car use, especially in Montréal’s busiest areas.
In its 2008 Transportation Plan, Réinventer Montréal, the city proposed investing heavily in the development of new modes of public transit. The STM, for its part, would like to be given responsibility for operating the new tram line, which would make it easier to integrate with the bus and metro networks.
The tramway is an efficient means of transportation, an instrument of urban renewal and a source of beautification and improvement of the quality of life in the neighbourhoods it serves. It is also an important lever for development in the city centre.
Among other advantages, the tramway offers the safety and comfort of a railcar, universal accessibility, a large passenger capacity, as well as a modern, sustainable image. It is particularly well suited to high-density neighbourhoods with a wide variety of activities that generate travel needs throughout the day. The launch of a tram route will also lead to a reorganization of the roadway (removal of traffic lanes or parking spaces) and significant urban revitalization.
Developing a tramway on the island is a major project. The initial network, as proposed in the Transportation Plan, would run an estimated 22 km and attract annual ridership of 32 million passengers. Upon completion of the first phase, Montréal’s tramway would rank third in size in North America, behind Boston and Calgary. The original network plan calls for three lines:
Côte-des-Neiges corridor, continuing along Boulevard René-Lévesque in the downtown core
downtown loop, connecting downtown with Old Montréal
Avenue du Parc, continuing along Boulevard René-Lévesque
In addition to serving large corridors, these lines travel through strategic sectors: the business district, the harbour front, Old Montréal, the entertainment district and the international district.
Launch a first tram line linking downtown to chemin côte-des-neigesThe plan for the first tram line, linking downtown to Chemin Côte-des-Neiges, was developed by the city of Montréal and Hydro-Québec.
For the initial rollout of the tramway, the studies recommend merging the Côte-des-Neiges and downtown lines, for a route comprising some thirty stops. This new line would start at Jean-Talon, follow Côte-des-Neiges down to René-Lévesque and then head eastward. After turning south on Berri, the tram would head west along De la Commune toward the Old Port, then go up Peel to René-Lévesque, thus terminating the loop.
Estimated frequency of service would be every 4 minutes during rush hours (morning and afternoon), every 8 minutes during off-peak periods and every 10 minutes during other periods and at night. The tramway would have a journey speed of 18 km/hour. Because Boulevard René-Lévesque is a work destination and downtown is a destination for leisure activities, services and work, we estimate that this first 12.5-kilometre line would draw 70,000 passengers per day, for an annual total of 27 million trips. This high ridership level is due to the large number of points of interest along the route. North of Mount Royal, there is the Université de Montréal, the HEC Montréal business school, the Jewish General Hospital, St. Mary’s Hospital Center and CHU Sainte-Justine. To the south lie downtown, Old Montréal, the Centre hospitalier de l’Université de Montréal, the health district, the Old Port, the Cité du multimédia and Griffintown. The first tram line will contribute to the city’s development by creating a transit route of key importance for the economic, social, cultural, technological and medical future of Montréal.

STMSTraTegic plan 2020 49
In addition, the line will travel through areas with excellent development potential, including 220 hectares of vacant or underused lots, representing 30,000 potential residential units and 1.6 million square metres of commercial or office space and a prospective pool of least 100,000 residents and 320,000 jobs.
The downtown–Côte-des-Neiges line would allow transfers with the Blue, Orange and Green metro lines and with several commuter train stations.
Completed at the beginning of 2011, the second phase of studies dealt with the line’s route, the definition of planning principles and infrastructure design, and included financial and economic analyses. Infrastructure work is scheduled to get under way in 2013, with a view to commissioning in 2017.
STRATEGY 4 HELP IMPLEMENT ALL PUBLIC TRANSIT INITIATIVES ON THE ISLAND OF MONTRÉAL
Take part in all public and active transit improvement and development projects We will continue working with our partners on public transit projects that do not come under our own responsibility. These include the creation of the Dalhousie corridor, reserved bus lanes on Montréal’s highway network, the shuttle between Montréal-Trudeau airport and the central train station, the new Train de l’Est line and improved commuter train service to the western part of the territory served by the STM.
The company could also forge partnerships with other public transit authorities that travel into Montréal. Furthermore, the STM and the city of Montréal are working in close collaboration to meet public transit needs related to major projects between now and 2020.

Tran
sit
serv
ice
2010
met
ro li
nes
Met
ro s
tati
ons
Met
ro e
xten
sion
s (u
nder
stu
dy)
Met
ro s
tati
ons
(und
er s
tudy
)
Met
ro e
xten
sion
s (o
ff is
land
)
Com
mut
er t
rain
net
wor
k
Tram
way
Bus
Rap
id T
rans
it (B
RT)
Bus
Rap
id T
rans
it (B
RT)
– e
xten
sion
10-m
in m
ax b
us n
etw
ork
MA
JOR
PR
OJE
CTS
IN
Th
E C
ITY
OF M
ON
TR
ÉA
L
Maj
or
pro
ject
s in
the
cit
y of
Montr
éal
(20
20
)1
- Q
uart
ier
Bon
aven
ture
2 -
Gri
ffint
own
3 -
Bas
sin
du n
ouve
au H
avre
4 -
Sai
nt-L
aure
nt m
etro
5 -
Hea
lth
dist
rict
6 -
Poi
nte-
Sai
nt-C
harl
es ra
ilway
yar
d (C
N s
hops
)7
- C
BC
com
plex
8 -
Nor
ther
n ti
p of
Île
des
Sœ
urs
9 -
MU
HC
(McG
ill U
nive
rsit
y H
ealt
h C
entr
e)10
- S
aint
-Via
teur
eas
t (M
agui
re)
11 -
Out
rem
ont
cam
pus
12 -
CH
U S
aint
e-Ju
stin
e13
- N
amur
/ Jea
n-Ta
lon
14 -
Hip
podr
ome
15 -
St-
Mic
hel q
uarr
y16
- E
aste
rn L
achi
ne17
- C
ontr
ecoe
ur18
- F
aubo
urg
Poi
nte
aux
Pra
irie
s19
- W
este
rn P
ierr
efon
ds
Maj
or
work
pla
nned
by
the
ci
ty o
f M
ontr
éal
(20
20
)A
-
Dor
val i
nter
chan
geB
- E
xten
sion
of B
oule
vard
Cav
endi
sh
C
- Li
nkag
e of
Cav
endi
sh a
nd H
enri
-Bou
rass
a D
- R
edev
elop
men
t of
the
Tur
cot
inte
rcha
nge
E
- B
onav
entu
re h
ighw
ayF
- U
pgra
de o
f Rue
Not
re-D
ame
G -
Red
evel
opm
ent o
f the
Pie
IX / H
enri-
Bou
rass
a in
terc
hang
eH
- E
xten
sion
of B
oule
vard
Mau
rice
-Dup
less
is
I -
Côt
e-de
s-N
eige
s / R
emem
bran
ce

51
STRATEGY 5 BOLSTER OVERALL PARATRANSIT SERVICE
Intended for people with significant functional limitations, paratransit provides regularly scheduled, occasional and off-island travel, as well as group transportation. The STM offers this door-to-door service, upon reservation, in part using its own minibuses as well as in cooperation with the taxi industry. Nearly 2.68 million paratransit trips were made in 2010, serving some 21,000 customers. In recent years, we have seen a considerable increase in the number of paratransit customers and trips (average annual growth of 8%).
From a financial standpoint, productivity has improved markedly, with the cost per trip decreasing by 18% over 10 years. Given trends in demographics, mobility, customer habits and urban development, demand for this type of transportation should rise at an annual rate of 6.3% to reach 4.3 million trips in 2020. To meet demand, the STM plans to maintain the current business model while seeking greater partnership with the taxi industry. In order to keep up with the expected growth in demand, we are counting on improvements in technology and aiming to encourage intermodality between our integrated bus and metro network and our paratransit service.
Introduce technologies that help optimize trips and absorb a portion of growthThe use of technology has so far proven to be the best way of enhancing paratransit service quality and customer satisfaction. To improve performance, the STM will have to put efforts into technologies related to planning and distribution of door-to-door transportation, vehicle location, electronic dispatching and real-time information. These tools are already being introduced in the taxi industry and will allow us to absorb part of the growth in demand while improving service quality.
Evaluate the service supplier base while maintaining flexibility with enough vehicles to provide service
To provide paratransit service and handle growth in demand, the STM must constantly adapt its service on the basis of its vehicular resources. In order to maintain priority service that meets the needs of a particular category of customer, we would like to keep a fleet of vehicles that we ourselves would operate. In addition, since the STM works so closely with the taxi industry, we intend to continue this partnership and cooperate with stakeholders so as to ensure that a sufficient number of taxi permits are issued to meet transit needs.
Develop intermodality to meet the needs of certain customersImproving the accessibility of the bus and metro networks allows people with functional limitations to get around more freely. By its very nature, paratransit will contribute to universal accessibility initiatives throughout the bus network.
The STM aims to make it easier to transfer between the standard and paratransit networks. In addition to satisfying part of the growth in demand, intermodality will provide greater flexibility and a variety of means of transportation, thus improving service for travel across the metropolitan region.
Maj
or
pro
ject
s in
the
cit
y of
Montr
éal
(20
20
)1
- Q
uart
ier
Bon
aven
ture
2 -
Gri
ffint
own
3 -
Bas
sin
du n
ouve
au H
avre
4 -
Sai
nt-L
aure
nt m
etro
5 -
Hea
lth
dist
rict
6 -
Poi
nte-
Sai
nt-C
harl
es ra
ilway
yar
d (C
N s
hops
)7
- C
BC
com
plex
8 -
Nor
ther
n ti
p of
Île
des
Sœ
urs
9 -
MU
HC
(McG
ill U
nive
rsit
y H
ealt
h C
entr
e)10
- S
aint
-Via
teur
eas
t (M
agui
re)
11 -
Out
rem
ont
cam
pus
12 -
CH
U S
aint
e-Ju
stin
e13
- N
amur
/ Jea
n-Ta
lon
14 -
Hip
podr
ome
15 -
St-
Mic
hel q
uarr
y16
- E
aste
rn L
achi
ne17
- C
ontr
ecoe
ur18
- F
aubo
urg
Poi
nte
aux
Pra
irie
s19
- W
este
rn P
ierr
efon
ds
Maj
or
work
pla
nned
by
the
ci
ty o
f M
ontr
éal
(20
20
)A
-
Dor
val i
nter
chan
geB
- E
xten
sion
of B
oule
vard
Cav
endi
sh
C
- Li
nkag
e of
Cav
endi
sh a
nd H
enri
-Bou
rass
a D
- R
edev
elop
men
t of
the
Tur
cot
inte
rcha
nge
E
- B
onav
entu
re h
ighw
ayF
- U
pgra
de o
f Rue
Not
re-D
ame
G -
Red
evel
opm
ent o
f the
Pie
IX / H
enri-
Bou
rass
a in
terc
hang
eH
- E
xten
sion
of B
oule
vard
Mau
rice
-Dup
less
is
I -
Côt
e-de
s-N
eige
s / R
emem
bran
ce
STMSTRATEGIC PLAN 2020

P

53
PRIORITY 2IMPROVE ThE CUSTOMER ExPERIENCE ANd MARkETING EFFORTSIn recent years, the STM has implemented a number of measures with respect to quality of both service and information in order to create a user-friendly travel environment for customers. We have also diversified our fare structure to meet the needs of our various customer categories. We will continue our efforts by adopting a series of new strategies and actions to secure the loyalty of current customers and attract new ones.
According to a survey carried out in 2009, the main customer expectations for the metro are reliability and frequency of service, as well as dissemination of information during service interruptions. For the bus, the main expectations were punctuality and frequency of service, as well as the friendliness and driving skill of our drivers.
We are consequently committed to better understanding our customers and their needs, improving service quality and optimizing service. Customers will then be able to count on services that are more comfortable, reliable, punctual and safe.
STRATEGIES 6 ENHANCE THE BREATHE EASIER BRAND IMAGE
7 IMPLEMENT A SERVICE QUALITY PROGRAM
8 IMPROVE SERVICE RELIABILITY AND PUNCTUALITY
9 IMPROVE THE QUALITY OF PASSENGER INFORMATION
10 PROVIDE A SAFE, USER-FRIENDLY AND PLEASANT ATMOSPHERE
11 APPLY UNIVERSAL ACCESSIBILITY MEASURES
12 DIVERSIFY FARE PRODUCTS
PRIORITY 2 – MAIN INdICATORS
2006 2009 2010 2015 2020
Indicators Actual Actual Actual Target Target
Overall satisfaction with STM ( %) 84 86 87 88 90
Metro customers on time1 ( %) 97.8 97.9 97.9 97.5 98.1
Bus punctuality2 ( %) 83.8 83.6 83.3 88.0 90.0
Rate of unavailability − metro ( %) 17.1 13.4 13.5 16.0 12.0
Rate of unavailability – bus ( %) 23.7 20.4 17.5 17.3 17.5
Rate of unavailability – paratransit ( %) 10.9 21.4 27.0 18.0 15.0
1 Service standard: + 5 minutes.2 Service standard: - 1 minute + 3 minutes.
STMSTRATEGIC PLAN 2020

STMSTraTegic plan 2020 54
STRATEGY 6ENHANCE THE BREATHE EASIER BRAND IMAGE
To meet its 40% growth target, the STM must convince a certain number of motorists to change their travel habits by choosing public transit more often. To that end, we intend to position ourselves as an environmentally beneficial choice. Combined with improvements in service speed, reliability and punctuality, environmental benefits make public transit not just an affordable and efficient form of transportation, but a choice that gives users a sense of doing their part for the planet.
The 2009 launch of the Breathe Easier brand image provided the STM with an opportunity to review the way we communicate with our customers. We wish to be seen not only as honest and responsible, but also as a socially engaged company. The same year, we launched Society in Motion, designed to rally citizens and our various partners to the cause of public transit and the environment.
STM’s positioningThe promise of the Breathe Easier brand is to make public transit one of the prime steps anyone can take for the environment. This positioning defines the STM’s commitment and actions as well as the character and tone of our communications.
I breathe easier because I’m doing my part for the environment by taking the STM
It’s a well-known fact: one bus is equivalent to 50 fewer cars on the road, and three buses eliminate 1 km of traffic. The environmental impact of a single person’s use of public transit is considerable and represents, on its own, a sufficient argument to encourage a larger number of Montrealers to relinquish their cars for more environmentally friendly modes of transportation.
I breathe easier because I know that the STM is acting responsibly
Environment and sustainable development form the basis for all the STM’s actions, projects and day-to-day operations. Meanwhile, the citizens’ message is clear: they want to do their part for the environment, but they don’t want to be the only ones to act. The STM must therefore make its environmental progress known. Indeed, we have made this a priority.
I breathe easier because the STM provides a stress-free, predictable, safe and efficient way to travel, as well a clean and welcoming environment
To travel with complete peace of mind, customers must feel safe, be provided with a clean, welcoming environment and be able to depend on the punctuality of the service, without feeling the stress of city driving. That is why the STM wants to optimize all levels of customer experience: predictability, safety, efficiency, cleanliness and user-friendliness.
To achieve this, we will improve service, make new technological tools available to customers, increase travel efficiency and ensure that facilities are kept clean. We will also establish a close relationship with our customers.
In addition, the STM will work to maintain its excellent satisfaction rate. By adopting a new approach centred around service quality, we intend to steadily improve our service at the same time as we continue to measure our performance, notably with respect to bus punc-tuality, metro reliability, interaction with customers and passenger information.

STMSTraTegic plan 2020 55
Continue with motivational campaigns promoting the use of public transitTo convince a larger number of Montrealers to use public transit on a regular basis, the STM will keep up its motivational campaigns and offer incentives to occasional customers and non-users. These campaigns, conducted through various media (STM network, daily newspapers, billboards, television, radio, Internet, social media, etc.), will help us remain in constant contact with Montrealers.
We will also present our new services and improvements to both current and potential customers. We will promote the environmental advantages of public transit and alternatives to single-occupant car travel.
Increase recognition of the STM as an environmental leaderThe STM is resolutely focused on the environment and aims to be known for making sustainable development the cornerstone of the Strategic Plan 2020. We intend to extend our many partnerships, particularly in the environmental sphere.
Establish direct contact with target clientelesThe STM will continue to expand opportunities to make direct contact with target markets in order to offer transportation solutions based on their needs.
To better understand our customers and be able to address them personally, we started developing a social marketing strategy in 2010. A customer database and targeted activities, varying from electronic communications to door-to-door canvassing, will be among the preferred methods used to communicate with our customers.
In addition, the STM will maintain its presence at some fifty artistic, cultural and sporting events in Montréal that create travel needs, such as Nuit blanche, the Salon de l’environnement and the Rogers Cup. These events are all opportunities to be in contact with people when they go out.
Rally partners and the populace around the Society in Motion campaignThe STM wants to rally as many Montrealers as possible to the public transit solution. We encourage businesses and social groups to join Society in Motion. Through our Web site, www.mouvementcollectif.org, our activity on social networks and our programs targeting merchants, we invite all Montrealers to show their commitment.

STMSTraTegic plan 2020 56
STRATEGY 7IMPLEMENT A SERVICE QUALITY PROGRAM
Service quality is the focus of constant attention from employees and is central to decisions made by the company’s management. In 2010, the STM implemented a service quality program, demonstrating that service quality will be of crucial importance in management decision making over the next decade. Now more than ever, we intend to offer our customers safe, reliable, fast, clean and welcoming service. Employees from the company’s different sectors are committed to continually improving service, in accordance with customers’ concerns.
Monitor the deployment of Phase I of the service quality programThe program’s main objective is to improve customer perception and satisfaction. It is made up of standards covering, first of all, four aspects of our service: bus punctuality, metro reliability, customer relations and passenger information. It is inspired by an international approach currently used in several European countries. We thus developed 18 standards for Phase I and set performance goals which are now monitored and measured.
Performance is measured continuously by means of operational indicators and surveys filled out by mystery customers who observe various aspects of bus and metro service.
Publish the resultsStarting in 2011, the STM will share information relating to the Together for Quality program with customers. Various communication tools will be used to explain the process, specify which aspects of service are examined during each phase of the program and share the results. Promotional and behavioural campaigns will also be rolled out to support the process.
Continue with the service quality programNew standards will be developed over the next few years for other aspects of service such as cleanliness, safety and security, reliability of equipment (escalators, elevators, etc.), driving, real-time information and signage. In 2011, the company will examine the issue of cleanliness, and our paratransit service will review the process used in order to apply that notion to its activity sector.
The objective of the STM’s continuous service improvement process is to achieve daily operational excellence for all customers and make public transit the transportation mode of choice in the minds of Montrealers.
STMSTraTegic plan 2020 57
STRATEGY 8IMPROVE SERVICE RELIABILITY ANd PUNCTUALITY
Continue with efforts to improve equipment availability and service reliability For their travel needs, our customers need reliable, punctual service. That is why the availability of buses and paratransit vehicles, as well as metro reliability, are of paramount importance to the STM.
To increase the reliability of buses and paratransit vehicles, the STM is relying on its maintenance programs, new programs for sharing performance gains and new technologies used in operating systems and real-time passenger information systems. These new systems, which will be implemented starting in 2015, will improve service regularity and the quality of passenger information as well as the safety of customers and drivers, in addition to reducing maintenance costs.
Improving the reliability of the metro system, with its ageing equipment, remains a significant challenge at a time when we are working to increase service. Maintenance programs will therefore be continued over the next few years. The arrival of new metro cars will also bolster improvement efforts. However, the renovation work involved in adapting our shops to this new rolling stock will affect the company’s maintenance capacity.
Continue with efforts to improve service punctuality
Under new programs dealing with service quality and punctuality, employees and customers will be kept informed of bus and paratransit punctuality targets and results. Furthermore, employees will undergo training and awareness activities regarding various aspects of their work, including attendance, punctuality, customer service and reducing road accidents.
In addition, the gradual replacement of first-generation low-floor buses will help cut unavailability and maintenance costs. The targeted rate of unavailability for 2018 is 17% for 12-metre buses and 20% for 18-metre buses.
Until the new metro cars arrive, the main challenge will be to maintain the current rate of unavailability, which is affected by the make-up and age of the fleet. The arrival of new cars will have a positive impact on availability, since the second-generation MR-73 cars are getting old and, as of 2016, will be approaching the end of their useful lives.

STMSTraTegic plan 2020 58
STRATEGY 9IMPROVE THE QUALITY OF PASSENGER INFORMATION
With the emergence of new information technologies, users want to have access to real-time data in order to make the most informed travel decisions. To meet these new expectations, the STM intends to make use of new technologies and modify the way it communicates with its customers. When armed with real-time information about service availability, customers will be able to plan their travel better. Our goal is consequently to keep up with new technologies.
Improve and develop the delivery of real-time passenger informationSince 2009, metro service interruptions lasting over 20 minutes have been communicated via social media (Twitter and Facebook), via Internet and by telephone. In 2011, the STM will launch a free SMS information service to inform customers of metro disruptions.
Develop mobile apps for smartphonesTo help customers plan their travel, the STM will develop mobile applications providing access to a trip planner, among other functions. As of April 2011, these applications offered customers a visual overview of the starting point and destination of their trip, as well as the bus stops or metro stations along the route.
Implement the iBus system and continue developing the passenger information systems
The implementation of a new real-time passenger information management system (iBus) on buses and paratransit vehicles will add to customer and driver safety. It will also improve vehicle management and coordination, as well as service regularity and our response to various events.
The iBus project is the cornerstone of the STM’s real-time information systems. As a result of this project, information will be disseminated by means of information points in some bus shelters, in-bus displays, SMS, a mobile portal, a telephone system and the Internet. Eventually, customers will be able to receive personalized information based on their travel habits.
Increase the STM’s social media presenceAs part of our desire to foster communication with our customers, we will intensify our social media presence on Facebook and Twitter. This will enable us to have a finger on the pulse of our customers, and adapt our service and initiatives according to the comments and suggestions we receive. We will also be able to explain our actions and offer valuable information to our customers.
Launch a new Web siteThe STM will launch a second-generation Web site in 2012 and gradually add new features to it through 2013. Customers will be able to carry out transactions (such as buying tickets), subscribe to a newsletter, have their own personal page on the site, access improved information they can use to optimize their travel, and see the state of the network in real time.

STMSTraTegic plan 2020 59
STRATEGY 10 PROVIDE A SAFE, USER-FRIENDLY AND PLEASANT ATMOSPHERE
For the STM, customers are the central focus of its considerations and its improvement projects. In order to provide a safe, user-friendly and pleasant atmosphere, we will carry out initiatives related to vehicle cleanliness, facility safety, intermodality of transportation modes and vehicle comfort for specific customer segments.
In terms of bus comfort, we will review our capacity standards so that we may offer a greater number of seats and reduce crowding on board. This step is all the more important because bus travel distances are much higher, on average, than metro travel distances.
In the short and medium terms, we will introduce other initiatives to improve user-friendliness and comfort on board our vehicles.
Improve cleanliness To improve facility and vehicle cleanliness, the STM will set up a program to make cleaning and maintenance more frequent. The maintenance interval for bus shelters will be reduced, and teams dedicated to upkeep around stations will be created. The program will also address prevention and will present solutions to vandalism.
Improve courtesy and customer relations From the moment they are hired and throughout their employment, STM staff are offered training programs aimed at improving courtesy and customer relations. The company also makes tools for managing difficult situations available to employees. In addition, we closely monitor service quality and regularly carry out campaigns targeted at customers regarding appropriate behaviour.
Improve safety With respect to travel safety, the STM has established a safety and security plan, called Sécurité et Sûreté Exploitation, in addition to adopting standards from Transport Canada’s Transit-Secure program. Furthermore, Montréal’s police force constantly patrols our facilities and vehicles. As regards paratransit, we will ensure that our drivers drive safely and properly accompany our customers.
Improve signageA study carried out in 2010 reviewed signage from the standpoint of our customers’ various needs. The new static and dynamic signage, to be rolled out in 2011, will respect the principle of universal accessibility and incorporate the company’s new brand image.

STMSTraTegic plan 2020 60
Install new bus shelters In the next few years, over 850 new bus shelters will be erected on the island of Montréal. They will be clear, well lit and better integrated into the urban environment. This new model of bus shelter, which arose out of a competition held in cooperation with Design Montréal, includes Wi-Fi technology. It also has an interactive digital interface that allows users to ask the system questions or to get in touch with security personnel in the event of an emergency.
Install a cellular communications network throughout the metro networkThe STM plans to install cell phone equipment in metro cars and stations. Customers will therefore be able to make and receive calls and use text messaging. Feasibility studies on the infrastructure required are currently being carried out. This system could be operational in 2012.
Roll out the Vélo-BUS serviceIn June 2011, the STM launched a pilot project on the installation of bike racks on buses in order to evaluate their effect on equipment maintenance and use, as well as on customer and employee safety. We plan to install racks in the medium term on a number of buses that ply lines that would suit this kind of intermodal transport, and to add bike stands near terminals and metro stations.
Bike racks improve complementarity between the public transit system and the bike path network. They enable cyclists to travel long distances more easily and bypass obstacles or connect two discontinuous sections of the bike path.
Improve paratransit vehicle comfortRegarding paratransit vehicle comfort, the STM will conduct a showcase project to identify which type of vehicle would offer a level of comfort equal to or greater than that of our standard buses. To improve the customer experience before this new vehicle arrives, we will acquire conventional minibuses equipped with a quieter engine and rear air suspension, which should increase customer comfort.
Improve bus comfortIn addition to reviewing capacity standards, the STM will conduct trials in 2011 and 2012 to determine the value of installing air-conditioning on some or all of our buses.

STMSTraTegic plan 2020 61
STRATEGY 11APPLY UNIVERSAL ACCESSIBILITY MEASURES
The STM favours measures aimed at making its facilities and equipment accessible in accordance with the needs of customers with functional limitations.
In 2009, the STM established a policy intended to increase overall service accessibility. The company wants to remain at the leading edge of universal accessibility in transportation and provide the entire population with efficient public transit. To the extent allowed by our resources, we are committed to systematically integrating universal accessibility into all new projects and to developing specific accommodations as a transit service provider, employer and social stakeholder.
In partnership with all the various associations representing people with functional limitations, the company has embarked upon a project to improve customer information on the 467 Saint-Michel Express line through the addition of screens and the announcement of upcoming stops. We have also redesigned the MR-63 cars to increase their capacity and the number of seats reserved for people with limited mobility, and improve the visibility of grab bars.
The MPM-10 cars that will start arriving in 2014 will represent another step toward achieving the STM’s universal accessibility goals, notably through their interior layout, inter-car circulation and a platform modification project that would provide wheelchair access. At each stage of the project, the associations are consulted and their universal accessibility concerns are taken into consideration.
In 2010, four elevators went into service at Henri-Bourassa station. This brings the number of stations accessible to people with functional limitations on the Orange line to seven, after Montmorency, de la Concorde, Cartier, Berri-UQAM, Bonaventure and Lionel-Groulx. The STM is committed to adding elevators to more metro stations in the coming years. A working committee has been tasked with prioritizing the stations to be equipped with elevators. Additionally, we have installed warning tiles along the edge of platforms in metro stations. Continued effort is being made with respect to universal accessibility in both the standard transit and paratransit networks.
UNIVERSAL ACCESSIBILITY POLICY
STATEMENT
In conducting its daily activities, the STM integrates those elements that promote and encourage universal accessibility in all areas of its operations, whether these involve infrastructure, vehicles or any other equipment and installations, as well as in the services it provides to the public, while respecting the resources at its disposal.
GUIdING PRINCIPLES
To ensure that all considerations regarding universal accessibility are included in all stages of the decision-making process, the STM adheres to the following principles:
Plan, design and implement all of its activities and disseminate its programs and services by ensuring that all applicable elements of universal accessibility are integrated in its processes, following achievable courses of action that respect the resources entrusted to the STM.
Ensure that universal accessibility is a corporate concern shared by all employees.
Promote and develop any initiatives aimed at universal accessibility.
Be proactive in providing leadership and involving its partners in the development of universal accessibility as it relates to the STM’s role and mission, from a perspective of continuous improvement.

STMSTraTegic plan 2020 62
STRATEGY 12DIVERSIFY FARE PRODUCTS
The STM will embark on a new path with respect to fares. Through new sales and collection technologies, the company will explore various avenues for improving its fare products and facilitating the purchase and use of tickets.
Introduce new flexible and customized fare products The introduction of the smart card system greatly expanded the possibilities for fare innovation. For example, it is now possible to create special fares that are only valid outside rush hours, such as the Unlimited Evening pass, designed to promote growth in ridership during off-peak periods. In addition, monthly and weekly passes as we currently know them could be replaced by 30-day and 7-day passes activated on the date chosen by the customers themselves, in this way better meeting their needs by providing more flexible use. As for single fares, the introduction of the “2-trip” ticket, aimed at encouraging the purchase of return fares and reducing cash payments on the bus, will lead to a complete reassessment of this type of product (2 trips, 6 trips or 10 trips) based on customers’ buying habits.
With the launch of the occasional smart card, it will now be easier to create tickets for use on particular occasions—for example, for tourists and special events.
Develop a loyalty programIn the coming years, the STM intends to launch a customer loyalty program. The first step will be to collect data on customers’ travel habits in exchange for various incentives, and to mount a promotional campaign.
Promote and enhance the OPUS subscription programThe annual OPUS card program already has over 2,000 subscribers who are happy they no longer have to worry about reloading their cards. To increase the number of subscribers, fare reductions could be offered, supported by an extensive promotional campaign.
Introduce a CAMPUS-style universal fare system for universities In 2011, the STM launched a universal-fare pilot project for students at the Université de Montréal. In light of the results obtained, we are planning to extend the program to other post-secondary educational institutions. Under this program, the cost of public transit may be incorporated into student tuition for a term, at a lower cost for all eligible students. This initiative could ultimately increase the number of trips students make by bus or metro, alter their travel habits and retain their loyalty once they join the workforce.
Use new technologies as transactional mediums and for reloading The STM will examine various technologies for managing and reloading cards remotely, so that customers may purchase fares without having to travel. In August 2011, we consequently began testing a remote reloading machine that will be tried out by a few hundred actual customers. The technology will subsequently be offered to all interested customers. This is just one example of the technological innovation that will help improve access to fares for all customers, particularly those who use the paratransit system.

STMSTraTegic plan 2020 63
dIVERSIFIEd FARE OFFERINGS
ThE OPUS CARdWith the launch of the OPUS card, the STM introduced several fare promotions that addressed the specific needs
of our various customer categories.
ThE FAMILY OUTINGS PROGRAM Since 2008, the Family Outings program has allowed up to five children under the age of 12 to travel for free on
weekends and holidays if they are accompanied by one adult with a valid fare card. In 2010, the program generated
over a million additional trips.
1-dAY ANd 3-dAY PASSESThe 1-day pass is now valid for a period of 24 hours, which makes it much more flexible. The STM adopted
this change in large part to serve new customers of the 747 airport shuttle, which accounted for a million trips
in one year.
ANNUAL OPUS SUBSCRIPTIONThe annual OPUS program offers a subscription to the monthly pass at the regular fare for a period of
12 consecutive months. Since the beginning of 2010, the STM has allowed customers to sign up online, sparing
them from having to reload their cards every month.
REdUCEd-FARE FOUR-MONTh PASSTo meet the needs of students who use public transit to get to school, the STM introduced a prepaid, reduced-fare
four-month pass (at the previous year’s rate). Customers need only reload their cards once a term.
GROUP PASSTo fill the travel needs of school groups on field trips as well as those of day camp groups, the STM has offered a
group pass since 2010. The pass allows up to 10 children aged 13 and under, accompanied by an adult, to travel
using a single pass. This made it much easier for the adult to manage the tickets and also simplified boarding.


65
PRIORITY 3ATTRACT, dEVELOP ANd MOBILIZE TALENTOur employees are integral to the success of our mission. That is why the STM does all it can to allow each of its 9,000 employees to contribute to the success of the Strategic Plan 2020. We have defined four strategies with respect to our workforce: recruiting and developing talent, mobilizing employees and managers, labour relations, and workplace health and safety, to which employee intake and integration may also be added.
dISTRIBUTION OF JOBS IN 2010
45.7%
27.2%
Drivers, operators and others
Maintenance staff
9.3% Managers, entry-level managers – transportation and maintenance
8.9% Unionized administrative and support staff
3.4% Unionized professionals
2.3% Divisional clerks and others
1.9% Inspectors
1.3% Non-unionized professionals and office staff
STRATEGIES 13 DEPLOY WAYS OF RECRUITING EMPLOYEES AND DEVELOPING THEIR SKILLS
14 CONTINUE WITH THE CURRENT EMPLOYEE AND MANAGER MOBILIZATION EFFORT
15 CONTINUE FOSTERING COLLABORATIVE WORK RELATIONS
16 HELP CREATE A HEALTHY, SAFE AND INCLUSIVE WORK ENVIRONMENT
PRIORITY 3 – MAIN INdICATORS 2006 2009 2010 2015 2020
Indicators Actual Actual Actual Target Target
Organizational Mobilization Index* -4 +23 – +30 +40
Number of hours of training / employee 24 27 29 29 30
Number of work-related accidents** 11,0 7,7 7,0 6,0 5,50
* Every three years, the firm Secor conducts a survey of STM employees that measures the state of the work environment (barometer) and level of employee commitment to the organization, using the Organizational Mobilization Index.
** (Cumulative number of accidents with loss of time / Cumulative number of work hours) x 200,000.
STMSTRATEGIC PLAN 2020

STMSTraTegic plan 2020 66
STRATEGY 13 DEPLOY WAYS OF RECRUITING EMPLOYEES AND DEVELOPING THEIR SKILLS
At a time of labour shortage and mass retirements, recruitment is a major challenge for the STM. As is the case for many other Montréal-area companies, hiring specialized employees is of particular concern, as the number of graduates is limited and employers compete vigorously to attract them. To deal with this situation, the STM has adopted a number of recruitment strategies.
In 2010, the STM had nearly 9,000 employees. Since 2006, we have welcomed more than 4,480 new employees. Over 37% of these hires were to replace some 1,660 retiring employees, while new graduates accounted for 19%. In 2010 alone, nearly 1,050 new employees were hired.
NUMBER OF hIRES BETWEEN 2006 ANd 20101
0
200
400
600
800
1000
1200
2006 2007 2008 2009 2010
822
646
1078
892
1044
Num
ber
of h
ires
1 Including student hires.
The total workforce has grown by more than 1,000 employees since 2006 and has consequently undergone significant change, particularly with respect to average age and average years of service. In fact, the average age and years of service, which now stand at 44.5 years and 11.3 years respectively, are steadily declining. Close to 35% of employees now have under four years of service.
dISTRIBUTION OF EMPLOYEES BY AGE GROUP
0
500
1000
1500
2000
2500
3000
3500
2 2
551 681
1565
2233
3065 3099
2524 2592
222369
2006 2010
20 to 29Under 20 30 to 39 40 to 49 50 to 59 60 and over
Num
ber
of e
mpl
oyee
s

STMSTraTegic plan 2020 67
Develop a visibility plan positioning the STM as an employer of choiceThrough its embrace of sustainable development and its many development projects, the STM has proved itself to be a forward-thinking, modern and dynamic company. By promoting ourselves as an employer of choice, we aim to attract competent, skilled workers.
We will use communication tools and new technologies to achieve this objective. We plan to create new communication tools for specific positions and to revamp all of our publications, as well as the design of our job information booths. With these new tools, we will present a wide variety of jobs, new technologies used and various projects that are under way or soon to come. Our recruitment Web site will be reorganized so that applicants can find information that is pertinent to the jobs offered and useful documents for preparing for interviews and exams. In addition, a section intended specifically for students and interns will be put online.
The STM will continue to participate in various job fairs and visit community organizations and schools to publicize job opportunities and career paths with the company. We have already implemented a number of recruitment strategies and evaluate nearly 8,000 applicants per year in the process of filling job vacancies. These activities represent opportunities to connect with the next generation of employees. In addition, the STM will continue to welcome a large number of interns every year, in various disciplines.
Review selection strategiesIn order to recruit the best candidates, the STM must continually adjust its selection strategies. We will review the skill profiles for some positions to ensure the right fit between applicants and the organization’s needs. We will also review and adapt our selection tools in order to best evaluate applicants.
Furthermore, the STM will add certain steps to the selection process, such as drug testing for positions at risk and certification of driving schools for those applying to be drivers. The goal is to hire competent, skilled workers who meet customer needs and STM objectives. We will use performance indicators to measure the effectiveness of our selection strategies.

STMSTraTegic plan 2020 68
Optimize the new employee intake and integration processAn employee’s integration into the workplace is essential to his or her success. That is why the STM will improve its intake and integration process. We will do everything possible at each step in a new hire’s intake to foster a thorough understanding of the company, its history, its culture and its many projects. The STM supports its managers during the intake process by providing the necessary tools and guidance for smooth integration into the company.
We will survey new employees regularly on the intake and integration process to ensure a high rate of satisfaction. By seeing to the quality of this process, we will strengthen the feeling of belonging and pride among new hires.
Formulate and implement skills development and maintenance strategies To ensure that skills are properly developed, the STM will establish customized, ongoing training programs. Training activities will be offered in different forms: traditional, coaching and online learning.
The STM plans to adapt its basic and ongoing training programs according to its strategic objectives and service quality standards. We also aim to develop new training approaches following an in-depth analysis of our various business sectors’ needs.
In addition, we will establish performance indicators, notably to measure employees’ mastery of new skills. To better manage planning and training, we will develop appropriate electronic tools.
Implement a new bus maintenance training strategyThe STM has carried out an analysis of the gaps between employee training and bus maintenance training needs. Through exercises and workshops, employees and managers created a training process adapted to bus maintenance and based on the coaching system.
The training curriculum is divided into different modules to allow it to be delivered at the right moment (just in time) and on the right content (just enough). Starting in April 2011, a pilot project was gradually rolled out at all our bus garages. This new training strategy will allow us to optimize training activities while having a positive impact on employee mobilization.
To follow up this new bus maintenance training approach, new training optimization projects will also be launched for metro system maintenance.
Promote the use of online learning resources A team of content and development experts was formed for the project surrounding the new MPM-10 metro cars. The team designed a technological solution using a new educational technique, online learning. More specifically, it reviewed the training programs for the MR-63 and MR-73 cars, which were presented in a traditional way, and converted them to e-learning mode. This new educational technique reduces the usual training time by six days. The company plans to adapt other training activities to an online learning environment, in view of the scope of future projects and the emergence of new technologies.
Use compensation plans to attract and retain employeesOverall STM employee compensation represents almost 60% of the company’s total budget. Compensation strategies remain an essential element for attracting and retaining the best resources, and the STM must ensure that its total compensation plan allows it to differentiate itself in a highly competitive market.
We will closely monitor the job market in order to evaluate our compensation and benefits programs and keep them competitive. We will develop and implement tools for positioning and structuring our overall compensation package. Detailed analyses will be conducted to review and standardize compensation policies.
Improve learning strategies and performance support strategiesAt the STM, continuing development supports employee performance. We will therefore introduce innovative learning and knowledge transfer strategies that are better suited to the needs of our various business sectors. We will also set up training programs to meet specific needs. The Sécuribus program, for example, is intended to prevent assaults and manage stress.

STMSTraTegic plan 2020 69
The number of training hours has gone up by nearly 50,000 since 2006 as a result of the implementation of ongoing bus and metro training activities, and the institution of the coaching system. This new learning technique meant that the number of full-time bus maintenance coaches had to increase from 4 to 16.
EVOLUTION OF TRAINING hOURS 2006−2010
Year 2006 2009 2010
Training hours 180,187 215,861 248,846
Variation relative to 2006 (%) – 20 38
The STM estimates that annual training per employee will rise from 26.7 to 29.5 hours between 2009 and 2020.
Optimize organizational performance by developing the skills of managers and professionals
The STM aims to optimize action learning through a training program for managers and professionals. This program will be based on career paths as well as competency and knowledge management.
In addition, the STM will continue to improve manager training in interpersonal communication and employee recognition. In the short term, innovative training programs that favour action learning will be developed.
Structured coaching programs designed by the STM will be used to further the development of managers and profess-ionals. We will partner with specialist firms to speed up implementation of these programs.

STMSTraTegic plan 2020 70
STRATEGY 14 CONTINUE WITH THE CURRENT EMPLOYEE AND MANAGER MOBILIZATION EFFORT
The STM relies on all its employees to fulfil its mission. Consequently, many different activities and tools are used to rally our employees and managers around our business objectives. Communication, engagement and recognition are the preferred means of mobilizing employees.
According to Secor’s Organizational Mobilization Index, employee mobilization grew substantially between 2006 and 2009, rising from – 4 to + 23, an increase of 27 points in three years.
Enhance the management style Management style is an important element in the mobilization of employees. In 2007, the STM adopted a management style based on communication, engagement and employee recognition.
In the short term, we will provide managers with tools that are suited to their needs and to those of the organization. Managers will receive coaching to help them improve their communication skills, become engaged and recognize employees’ work.
Improve employee recognitionThe STM will institute company-wide initiatives to recognize the effort, skills and results of individuals and teams. In particular, we will continue organizing corporate recognition activities to highlight employee achievements (acts of bravery, safe driving, etc.) and career milestones (25 years of service, retirement, etc.). These activities will provide opportunities to underline the expertise and skills of our employees as well as their contribution to carrying out the Strategic Plan 2020.
We will continue to encourage social involvement and philanthropy on the part of employees and will underscore the benefits of volunteerism. We will ensure that the tradition of employee altruism endures by supporting the annual generosity campaign and associated fundraising activities. Furthermore, the STM will continue to organize social events for employees, retirees and their families (birthdays, visits to La Ronde, contests). Holding these events strengthens employees’ sense of company pride and belonging.
EVOLUTION OF ThE MOBILIZATION INdEx (SECOR’S OMI)
In 2009, the OMI was in the acceleration zone, with an increase of 27 points over 2006.
ZONED’EXCELLENCE
2006
ZONED’ACCÉLÉRATION
ZONEDE DÉMARRAGE
ZONED’URGENCE
ZONED’EXCELLENCE
2009
ZONED’ACCÉLÉRATION
ZONEDE DÉMARRAGE
ZONED’URGENCE

STMSTraTegic plan 2020 71
Improve communication with employeesWe will see that the Strategic Plan 2020 is distributed to all our personnel. We will also monitor the plan’s success and inform all employees of its progress, results achieved and important changes to be made. We will continue to highlight the expertise of our workers, recognize individual and team achievements in internal communication tools, and acknowledge successes as well as challenges to be met.
Managers will be asked to get involved and to become better at relaying information. Links will be clearly established between the objectives of the Strategic Plan and those of each administrative unit. In addition, the relevance and quality of the information to be conveyed to employees will be reviewed. As well, information relating to customer expectations, satisfaction and comments will be passed on to employees so that they can take it into account in their own improvement plans.
We will also optimize operational communications with the service delivery unit in order to enhance our commitment to the customer. The company will maintain its support to managers in their role as communicators by providing them with the right information so that they can take fast action and properly respond to their employees’ questions.
The STM will continue to survey employees’ interest and understanding with respect changes and projects that concern them, to ensure that their expectations and informational needs are clearly understood. We will remain attentive and adopt new methods so as to facilitate communication and dialogue between different levels of authority and different business sectors.
Design and implement mobilization action plans for each business sectorAn analysis of the results of a business sector survey conducted in 2009 will allow managers to meet the challenge of mobilization and identify the issues involved, priority actions, means used and expected results.
To help managers meet their mobilization goals and carry out their action plans, the STM will provide them with the appropriate tools and resources. In addition, the results will be measured periodically so as to evaluate the progress and effectiveness of targeted actions.

STMSTraTegic plan 2020 72
STRATEGY 15 CONTINUE FOSTERING COLLABORATIVE WORK RELATIONS
Promote cooperation and collective problem-solving The STM will continue to improve its methods with respect to managing labour relations. We advocate harmonious labour relations based on the search for innovative, collective solutions. Furthermore, we emphasize open, honest and respectful communication between managers, employees and unions.
To preserve a peaceful working environment, we encourage ongoing discussion and dialogue with unions, and regularly hold information and consultation meetings. In addition, we promote employee consultation and engagement in order to maintain and improve the working environment.
Foster the stability of collective agreements Over 8,000 STM employees are governed by six collective agreements. Five of these agreements expire in January 2012, and the sixth in January 2013.
A great many people from various units are involved in drawing up employment contracts and holding negotiations. They make a tremendous effort to do this job well.
Institute gainsharing programs based on performance improvements The STM plans to roll out company-wide gainsharing programs based on performance improvements. The results of a program that was tested with the bus system maintenance team were conclusive for the company and its employees, as well as for customers. Indeed, bus availability went up, the maintenance cost per kilometre travelled went down and service improved. These results meant enhanced wage conditions for employees, while remaining within the financial framework, and allowed the STM to reduce its costs and offer customers better service.
Furthermore, these programs foster the development of a performance-based culture wherein the contribution of employees is tied to results, and performance gains benefit the organization, its personnel and its customers.

STMSTraTegic plan 2020 73
STRATEGY 16 HELP CREATE A HEALTHY, SAFE AND INCLUSIVE WORK ENVIRONMENT
The number of work-related accidents per year and the degree of severity have decreased significantly over the last five years. Between 2005 and 2009, the number of accidents involving lost time fell from 725 to 558, while the degree of severity declined from an average of 36.4 days lost per accident to 28.1 days. To keep up these results, the STM will launch new activities related to workplace health and safety management, inspired by recognized global practices and designed to reduce the risk of accidents at source.
NUMBER ANd FREQUENCY OF WORk-RELATEd ACCIdENTS, 2005 – 2009
0
100
200
300
400
500
600
700
800
2005 2006 2007 2008 2009
725 715 673 666 558
Number of major accidentsFrequency2010 Targeted frequency 2015 Targeted frequency2020 Targeted frequency
0123456789
101112
7.2 7.2 7.2 7.27.2
5.5 5.5 5.5 5.5 5.5
6 6 6 66
11.1 10.810
9.5
7.7
Freq
uenc
y
Num
ber
of m
ajor
acc
iden
ts
Major accident: accident with lost time accepted by the CSST or with decision pending
Frequency: number of major accidents divided by hours worked and multiplied by 200,000 hours.
SEVERITY OF WORk-RELATEd ACCIdENTS ANd NUMBER OF dAYS LOST, 2005−2009
18 000
19 000
20 000
21 000
22 000
23 000
24 000
25 000
2005 2006 2007 2008 2009
21 057 20 892 22 899 23849 20 2740
50
100
150
200
250
300
350
400
267.1 267.1 267.1 267.1 267.1
322.8 315.6341.5 339.7
281.2
Number of days lostDegree of severity 2010 Target degree of severity
Deg
ree
of s
ever
ity
Num
ber
of d
ays
lost
Degree of severity: number of days lost multiplied by 200,000 hours and divided by the number of hours worked.

STMSTraTegic plan 2020 74
Develop a workplace health and safety culture For the STM, employee health and safety is of paramount importance. Investing in health and safety fosters a safe working environment and helps mobilize employees. By continuing these efforts, the company aims to develop a three-faceted culture:
MANAGEMENT LEADERSHIP
• A health and safety policy defining roles and responsibilities will be distributed to managers at all levels as well as to all employees.
• Additional training will be given to managers on health and safety leadership, presenting the roles and responsibilities, as well as workplace intervention techniques (influence and accountability).
WORKPLACE ACCOUNTABILITY
In terms of prevention, the STM will set up a program of mandatory health and safety activities to improve the company’s performance. Actions will be identified based on the realities of each business sector and their associated risks:
• An information tracking system will allow us to properly evaluate prevention efforts.
• Health and safety performance is directly related to employee participation in prevention activities. Success factors include consultative management, mechanisms adapted to different working environments and manager accountability.
PROGRAMS AND STRUCTURES
• The criteria and programs related to serious injury risks will be reviewed.
• Training programs that help employees recognize danger and practise accident avoidance will be updated.
• A health and safety recognition and innovation program will be created.
• An analysis of the value of implementing an ISO-type system to assess danger will be carried out.
The STM will encourage cooperation among all parties involved in the health and safety field, including joint committees, Québec’s Commission de la santé et de la sécurité du travail, union representatives and organizations that could help establish such a culture in the workplace.
In addition, the management of work-related injuries and absenteeism will be reviewed with an eye toward continuous improvement, using measurable outcomes. The management of claims will be audited to guide these efforts. We will implement a continuous-improvement process with clear objectives that adhere to the company’s values.
Manage with attention to diversityThe STM recognizes the importance of workforce diversity, whether based on culture, generation, gender or functional limitation. Through an ambitious equal opportunity program, the company has been able to achieve growing diversity among its employees over the years.
EVOLUTION OF WORkFORCE PROFILE, 2006 – 2015
Year 2006 2007 2010 2015Percentage of visible and
11,7 17 19 22,5 ethnic minorities

STMSTraTegic plan 2020 75
Continue with efforts to manage diversity, co-development and mentoringThe STM considers the gender and functional limitations of its employees, and the generational status and intercultural nature of its working environment. We are committed to offering our employees an inclusive environment, where teamwork and respect are encouraged, as well as the sharing of points of view, experience and skills.
The company will continue to develop awareness and training tools related to diversity, inclusiveness, prejudice and discrimination. We will ensure that managers and work teams receive guidance in performing diagnostics aimed at making the workplace more inclusive. We will also see that a measurement tool is developed to perfect the diagnostic process.
An intake and integration guide will be written that describes the organizational culture to new employees. Learning techniques such as co-development and mentoring will be used to facilitate the acquisition of skills and knowledge. In addition, diversity management will be integrated into the manager skills profile.
Moreover, the STM will produce an annual review of activities that will allow it to analyze employee needs. We will also benchmark practices used by innovative companies to ensure the quality of tools and intervention methods developed internally.
Continue with and improve employee assistance servicesThe STM attaches particular importance to the mental health of its employees and their loved ones. The employee assistance program allows those interested to get support in a setting that is professional, personalized and confidential. In addition, the success of Les aidants EMR (maintenance and rolling stock support group) will encourage the creation of similar groups in other areas of the company. This practice of listening and sharing among colleagues provides support in dealing with personal and professional issues.
In order to help managers and counsellors faced with crisis situations, the employee assistance program will continue to provide various support tools in addition to offering customized service.
Maintain personal protection effortsIn 2010, the STM reviewed its policy regarding the protection of a person’s physical and psychological integrity by making changes to the handling of conflict situations and employee complaints. The company reasserted its desire to maintain a healthy and respectful working environment, free of all forms of harassment, violence and discrimination.
In addition to preserving the usual conflict resolution, mediation and advisory services, the STM offers a confidential personal protection service. We also provide the opportunity to assist managers and work teams in identifying sources of tension and in establishing an action plan. The objective is to restore a lasting, harmonious work environment while equipping all parties with the ability to handle future conflicts.

STMSTraTegic plan 2020 76

STMSTraTegic plan 2020 77
PRIORITY 4OPTIMIZE INVESTMENT MANAGEMENTThe STM is responsible for managing, operating and maintaining a sizable asset base made up of vehicles, infrastructures, facilities, equipment and operating systems. In the coming decade, a substantial portion of these assets will be replaced or updated. The company plans to take advantage of this work to generate added value, optimize its portfolio management and improve project execution.
STRATEGIES 17 GENERATE ADDED VALUE WHEN ASSETS ARE REPLACED
18 OPTIMIZE PROjECT PORTFOLIO MANAGEMENT AND IMPROVE PROjECT EXECUTION
PRIORITY 4 – INdICATOR
2006 2009 2010 2015 2020
Indicator Actual Actual Actual Target Target
Rate of completion of capital 65.5 57.9 63.0 69.0 70.0expenditure ( %)
STRATEGY 17GENERATE ADDED VALUE WHEN ASSETS ARE REPLACEDBetween now and 2020, the STM will invest approximately $6.2 billion in asset replacement, or nearly 43% of the established asset value of $14.5 billion. The new assets, which will be equipped with the latest technologies, will ensure the long-term operability of our bus, metro and paratransit networks. The company has developed a project management approach to carry out this work, and has a well-established work organization.
Improve knowledge of assets in need of replacement and design a capital programAfter taking an inventory of its assets, the STM has drawn up an overall capital program, setting intervention priorities according to the degree of obsolescence and critical nature of the assets. The market introduction of new products, materials and technological innovations has been factored in.
For each priority project, a risk assessment will be performed. Working with the business sectors affected, we will be able to clearly determine the action required to keep our assets in good condition and plan their timely replacement. All the departments concerned will be able to coordinate the execution of their maintenance projects so as to ensure the reliability and safety of all the company’s assets.
Maintain and develop property assetsThe Montréal metro is also an art gallery. A hundred or so murals, stained-glass windows and sculptures have been installed over the years in 54 of our 68 stations. The STM is responsible for maintaining and enhancing this artistic property, and recently formed a Board committee on arts and artistic heritage.

STMSTraTegic plan 2020 78
STRATEGY 18 OPTIMIZE PROJECT PORTFOLIO MANAGEMENT AND IMPROVE PROJECT EXECUTION
Using its knowledge of the state of its assets, the STM applies a portfolio management approach to prioritize its projects, while taking financial and human constraints into account.
Bolster project portfolio management mechanisms Through project portfolio management, the STM is able to apply mechanisms that are both rigorous and innovative. Portfolio management offers the following advantages:
Standardized project presentation.
Clear indications that projects remain in line with strategic objectives.
Optimized resource allocation.
Better coordination and improved synergy between projects.
By optimizing its portfolio management, the STM can prioritize its capital projects and optimize their anticipated benefits.
Additionally, the company plans, designs and executes its projects from a sustainable development perspective, with due consideration for their social, environmental and economic impacts. For example, it acts to generate economic spinoffs for the greater Montréal area and ensure the energy efficiency of its assets.
Carry out metro, bus, paratransit and tramway projectsOver the period covered by the Strategic Plan, the STM plans to invest $11.5 billion: $6.2 billion to maintain the long-term operability of our networks, $4.2 billion to develop new services and $1.1 billion to build the first tram line.
It should be noted that the $1.6-billion cost of metro extensions on the island of Montréal, the costs of the Longueuil and Laval extensions, and those for the infrastructures required to introduce bus rapid transit (BRT) on the Pie-IX corridor will be assumed by the Agence métropolitaine de transport under its three-year capital program. The costs quoted are extrapolations of previous costs.

STMSTraTegic plan 2020 79
METRO NETWORk
The metro network represents an asset base with an estimated replacement value of $12.8 billion; investment expenditures planned for 2011−2020 total $7.3 billion.
ROLLING STOCK
During the Strategic Plan, the principal maintenance operations will involve replacing the 363 MR-63 metro cars and some of the 436 MR-73 models. This replacement operation and the necessary alterations to shops and equipment total over $2.7 billion, or nearly 37% of all planned metro investments.
STATIONARY EQUIPMENT
Most of our stationary equipment has reached the end of its service life, and problems due to obsolescence of equipment or systems are increasingly frequent. To upgrade systems related to customer service and safety, the STM will continue its Réno-Systèmes programs, which will total over $1.1 billion by 2020.
INFRASTRUCTURE
Metro stations and auxiliary structures, including ventilation stations, garages and tunnels, belong to a category of assets whose replacement value represents more than $6.1 billion. Various structural and architectural elements and building sys-tem components have reached the end of their service life. In addition, water infiltration and de-icing salt are accelerating the deterioration of concrete structures and their reinforcement. To ensure the long-term operability of these assets, which calls for nearly $704 million, the STM will continue its Réno-Stations II programs and launch phases I and II of the Réno-In-frastructures program.
INVESTMENTS IN ThE METRO NETWORk – 2020 TIME hORIZON
in M$ Maintenance Development Total % of Total
ROLLING STOCk
New MPM-10 cars and alterations to shops 1,775 557 2,332 31.8
Replacement of MR-73 metro cars 917 917 12.5
Additions to shop capacity and equipment 0 654 654 8.9
2,692 1,211 3,903 53.1
STATIONARY EQUIPMENT
Réno-Systèmes – Phases I and II and other projects 129 129 1.8
Réno-Systèmes – Phase III 488 488 6.6
Réno-Systèmes – Phase IV 500 500 6.8
1,117 1,117 15.2
INFRASTRUCTURES
Other sector-related projects 60 60 0.8
Refurbishment of Berri-UQAM metro station
– Phase IA 86 86 1.2
Réno-Infrastructures – Phase I 250 250 3.4
Réno-Infrastructures – Phase II 250 250 3.4
Information technology 58 10 68 0.9
704 10 714 9.7
METRO ExTENSIONS1 1,610 1,610 21.9
TOTAL ExPENdITURES 4,513 2,831 7,344 100
1 Not including the cost of metro cars.

STMSTraTegic plan 2020 80
BUS NETWORk
The $1.7-billion bus network consists mainly of three categories of assets: 1,680 buses, seven bus garages, and the related equipment and infrastructure. Between now and 2020, service provided will increase by 32%, to 6.5 million hours and over 107 million kilometres travelled.
To meet the demand while achieving its environmental targets, the STM will have to upgrade its bus fleet and change its composition. We will therefore invest close to $3 billion in various projects, such as the replacement and addition of vehicles, construction or upgrade of bus garages, and establishment of BRT systems, bus priority measures, information systems, terminals and bus shelters.
ROLLING STOCK
In the coming years, the total number of buses in the fleet will grow from 1,680 to 2,089, in part through the addition of 262 articulated buses, bringing their number from 140 to 402. As of 2011, the fleet will consist exclusively of low-floor buses. Investments in maintenance and development will amount to $1.3 billion.
Three-quarters of the fleet is currently equipped with access ramps, and all new buses acquired since 2009 have front ramps, which are more efficient. In addition, in keeping with a public-transit-mix approach, 350 buses will be equipped with bicycle racks on lines that suit this type of modal complementarity. The number of minibuses will also rise to meet growing needs for Navette Or, a shuttle service for senior citizens.
BUS GARAGES
To increase its bus fleet beyond 1,590 vehicles (the 2007 garage capacity), the STM must add capacity to its seven bus garages. That is the rationale behind the projects to expand the Legendre bus garage in 2009 and refurbish the Frontenac bus garage in 2010.
As well, two new bus garages will be inaugurated in 2013 and 2016, boosting capacity from 1,705 buses to a total of 2,089. In addition, the Saint-Denis bus garage will be rebuilt in 2015 on an adjacent site and the Crémazie body shop will remain in operation until 2017. The Mont-Royal bus garage will be either modified or relocated nearby in order to accommodate electric buses or trolleybuses under the bus electrification program. Investments will total $700 million.
EQUIPMENT AND INFRASTRUCTURE
The STM will invest $900 million in various maintenance and development projects, such as establishing transit priority measures, particularly reserved bus lanes and detectors at traffic lights, and instituting BRT systems on Pie-IX and Henri-Bourassa boulevards, scheduled for 2013 and 2018, respectively.

STMSTraTegic plan 2020 81
IINVESTMENTS IN ThE BUS NETWORk – 2020
in M$ Maintenance Development Total % of total
ROLLING STOCk
Articulated buses 2008 − 2012 38 18 56 1.9
Replacement of APS-1 buses 107 107 3.6
12-metre and 18-metre buses 570 546 1,116 37.4
Service vehicles, minibuses and midibuses 32 4 36 1.2
747 568 1,315 44.1
EQUIPMENT ANd INFRASTRUCTURE
BRT – Henri-Bourassa corridor 307 307 10.3
iBus project 199 199 6.7
Terminal renovations 61 61 2.0
Transit priority measures for buses 153 153 5.1
Acquisition of bus shelters 7 15 22 0.7
Machinery and equipment 25 25 0.8
Information technology 0 12 12 0.4
Other projects 165 165 5.5
457 487 944 31.7
BUS GARAGES
Reconstruction of Crémazie shop 252 252 8.5
New bus garages phases I and II 278 278 9.3
Reconstruction of Saint-Denis bus garage 192 192 6.4
444 278 722 24.2
TOTAL ExPENdITURES 1,648 1,333 2,981 100

STMSTraTegic plan 2020 82
PARATRANSIT NETWORkOver the next 10 years, investments in the paratransit network will total $35 million. Of this amount, $20 million will go to replacing the minibus fleet.
To meet continuing growth in demand, the STM intends to introduce new vehicles to improve both transportation capacity and customer comfort. We are currently examining whether paratransit buses should be air-conditioned. We are also counting on new technologies, such as vehicle terminals, to optimize paratransit trips, help customers plan their trips better, reduce wait time and provide real-time customer information.
IINVESTMENTS IN ThE PARATRANSIT NETWORk – 2020
in M$
Maintenance Development Total % of Total
ROLLING STOCk
Minibuses 22 22 59.5
INFRASTRUCTURE
Operating systems 15 15 40.5
TOTAL ExPENdITURES 37 0 37 100

STMSTraTegic plan 2020 83
TRAMWAY LINEMontréal’s first tramway line represents a $1.1-billion investment. This inaugural line consists of 12.5 kilometres of new infrastructure, a fleet of 26 sets of trams, a bus garage measuring 7.5 hectares and a 300-spot park-and-ride lot.
IINVESTMENTS IN ThE TRAMWAY LINE – 20201
in M$ Maintien Développement Total % Total
ROLLING STOCk ANd INFRASTRUCTURE
Côte-des-Neiges line including 0 1,122 1,122 100
downtown loop
TOTAL ExPENdITURES 0 1,122 1,122 100
1 Project cost based on a cost per kilometre of $85 million (in 2010 dollars, including contingencies and taxes).


85
PRIORITY 5FURThER IMPROVE PERFORMANCEUnder-funding is a critical issue for the STM. The 1.5¢ per litre increase in gas tax applied to the greater Montréal area enabled the company to achieve financial equilibrium in 2010.
Passenger revenue, the main source of funding, has risen by 59% since the early 2000s, while the contribution of the Montréal agglomeration has increased by 64% since hitting a historic low in 2000. Subsidies from the Québec government are also up, and should soon exceed those of 1992, the year funding for public transit operations was eliminated. Considering the $12 billion in investments needed to maintain and develop service, all these increases will not be enough to cover operating costs and investment requirements in the year 2020. To achieve financial equilibrium, the STM must optimize its revenue sources and exercise tight control over its expenditures.
STM – EVOLUTION OF REVENUE SOURCES, 1988 − 2011
Évolution des différentes sources de revenu, 1998-2011
Passenger revenueContribution of theMontréal agglomeration
500
450
400
350
300
250
200
150
100
50
1988
0
1989
1990
(in m
illio
ns o
f $)
1991
1992
1993
1994
1995
1996
1997
1998
1999
2000
2001
2002
2003
2004
2005
2006
2007
2008
2009
2010
2011
Regional contributionsNew financial framework
Québec government subsidiesOther operating revenue
Municipalreform
Québec public transit policy
City of Montréaltransportation plan
$30 registration fee(regional funding)
Municipalcompensation
1.5¢/litre gas tax(regional funding)
STMSTRATEGIC PLAN 2020

86
STRATEGIES 19 INCREASE AND DIVERSIFY REVENUE SOURCES
20 TIGHTLY CONTROL EXPENDITURES
PRIORITY 5 – MAIN INdICATORS
2006 2009 2010 2015 2020
Indicators Actual Actual Actual Target Target
Self-financing ratio %1 59.9 58.5 58.2 56.6 58.2
Revenue share – passengers % 2 47.4 46.3 45.9 45.57 47.77
Operating costs / trip $ 3 1.91 2.18 2.28 2.66 2.83
Operating costs / kilometre $ 4 5.34 5.44 5.62 6.71 7.25
Net commercial revenue 5 14.8 15.3 17.1 28.0 35.0
Net debt service / netoperating expenses 6 – 7.7 8.74 9.9 11.8
1 Self-financing ratio: Management indicator measuring the ability to self-generate revenue from passengers and commercial activities to cover operating expenses (operating revenue / operating expenses).
2 Revenue share – passengers: Management indicator measuring the share of passenger revenue relative to total revenue. 3 Operating costs / trip: Performance indicator measuring the operating cost of each trip made.4 Operating costs / kilometre: Performance indicator measuring the operating cost for each kilometre travelled in the bus and metro networks. 5 Net commercial revenue: Management indicator measuring commercial revenue generated other than the company’s passenger revenue.6 Net debt service / net operating expenses: Management indicator measuring annual costs attributable to the STM that are devoted to investments relative
to overall operating expenses.7 Before new funding sources.
STMSTRATEGIC PLAN 2020

87
STRATEGY 19 INCREASE AND DIVERSIFY REVENUE SOURCES
To achieve financial equilibrium, the STM must optimize all its revenue sources: passengers and commercial activities as well as municipal, provincial and federal government partners.
Maintain passengers’ contribution Passenger revenues, the STM’s primary source of income, have risen steadily and, after weighting, accounted for 44% of total revenues in 2010. To increase revenues, we will develop a long-term fare strategy based on the following criteria: general and petroleum-linked inflation indices, fare product rebates, improvements in service and impact on ridership. These revenues, included in net commercial revenues, should amount to 50% of total revenues.
Thanks to the implementation of a fare sales and collection system and the launch of the OPUS card, the STM is much better poised to control fare collection and so reduce the incidence of fraud.
Develop a fare strategy for paratransit trips within the metropolitan area In terms of paratransit, the STM will establish a new fare schedule for all off-island trips originating on the island of Montréal. To that end, it will enter into discussions with the region’s other public transit authorities starting in 2011.
Increase net commercial revenueIn 2003, the STM created Transgesco s.e.c., tasking it with developing the STM’s commercial potential (advertising in metro stations, buses and bus shelters, free newspapers, electronic displays on platforms, mobile phone and Wi-Fi, promotional partnerships and sustainable development).
A benchmarking study by the Imperial College of London recently confirmed that the low level of commercial revenue generated by the STM was less than that of other comparable public transit authorities. The company therefore plans to pursue its partnerships with the private sector to maximize the spinoffs of new development projects so as to double its net commercial revenue by 2020.
STMSTRATEGIC PLAN 2020

STMSTraTegic plan 2020 88
Propose a new government funding model for paratransitParatransit demand will rise considerably in the next 10 years, under the effect of such factors as the ageing of the population and community efforts to combat social exclusion. It should be noted that paratransit already underwent substantial growth between 2000 and 2011.
Accordingly, the STM will review its customer approach, service standards and the technical and technological tools for supporting this service. We will rethink our different modes of transportation and adapt them to this new reality.
As regards vehicle purchase and operation, 70% of the cost is funded by Québec’s Ministère des Transports under that department’s assistance program. Given 6.3% annual growth in paratransit trips in the next 10 years, compared to 7.8% (annualized growth rate) for the previous decade, the STM intends to propose new funding methods to the department so that it can better meet the ever growing needs of its customers.
Increase the Montréal agglomeration’s contribution and subsidies from the Québec government
Since 2005, passenger revenue has risen by $102.5 million, or 27%, as a result of an increase in both the number of trips and fares. The contribution of the Montréal agglomeration has grown by more than $84 million—an increase of nearly 30%—to reach historical highs. Subsidies from the Ministère des Transports, for their part, have risen by over $92 million, an increase of 106%. This major financial support has enabled the STM to play a part in the upsurge in public transit across Québec and in the Montréal region, as is demonstrated by the results of the 2008 Origin-Destination survey.
Regional funding provided by the Agence métropolitaine de transport, which accrues mainly from contributions by drivers (1.5¢ per litre gas tax and $30 in registration fees collected in the Montréal region), stagnated between 1996 and 2005. After 2005, it fell 8% to $51 million. In contrast, the consumer price index for the Montréal region rose at an annualized average of 1.8% between 1996 and 2010.
The Québec government’s 2010−2011 budget acted to correct this situation of regional under-funding with the 1.5¢ per litre gas tax increase in the Montréal region effective May 1, 2010.
The budget also announced the establishment of the Road Infrastructure and Public Transit Fund (FORT), provided with, among other things, a dedicated source of funding that could include an increase of 4¢ per litre of gasoline over four years across Québec, allowing us to anticipate new funding sources.
In view of the substantial increase in service and the obligation to maintain the STM’s assets and develop new services and systems, additional financial efforts will be required of all partners, and new, direct, indexed and recurring revenue sources will have to be found.
STRATEGY 20TIGHTLY CONTROL EXPENDITURES
The Strategic Plan 2020 contains major financial challenges. Carrying out this strategy will entail improving productivity and establishing a culture of continuous improvement, while keeping operating expenses at an optimum level. In the last few years, the STM has optimized its operational performance considerably, as is illustrated by the results of the different benchmarking studies and credit rating agency reports. These agencies make much of our careful business management and tight cost control, and give the company excellent credit ratings.

STMSTraTegic plan 2020 89
Improve productivity and institute a culture of continuous improvementFor several years, the STM has earned recognition from various international bodies for the efforts it has invested in improving its operational and financial performance. The Imperial College of London has, moreover, ranked the STM as the most productive subway system in the world.
BENChMARkING STUdY: PROdUCTIVITY PER CAR – kILOMETRE (2008 OR MORE RECENT)
0,6
0,5
0,4
0,3
0,2
0,1
0c d a h g l e j i b k f STM
Impe
rial
Col
lege
of L
ondo
n
Minimize operating expenses The STM will continue to exercise tight control over its operating costs. To bolster these efforts, we have given priority to improving our financial performance and optimizing the management of each of our business sectors. For example, when we acquire goods and services, we call on supply and industry consolidation groups in order to obtain substantial savings.
With the goal of continuous improvement, we recently established a new corporate unit responsible for budget controls which will be in charge of achieving further reductions in operating costs per trip and per kilometre in the coming years.
Optimize the organization’s administrative and decision-making processes To reduce administrative time frames, we have also decided to streamline our decision-making process. Reevaluating our processes, activities and methods should enable us to optimize the performance of each of our business sectors by mobilizing employees around such issues as workforce requirement planning, management information and availability of equipment.
Raise employee awareness about ethical issuesAt the beginning of 2011, the STM amended its code of ethics to include new measures that reinforce certain provisions. These changes are meant to better equip our employees and initiate ongoing dialogue with them about ethical issues.
Improve performance monitoring in all areas of activity To monitor their performance and facilitate decision making, the STM will provide all its business sectors with management tools such as trend charts and indicators.
Manage risks In order to meet the objectives laid out in the Strategic Plan, we have established a new administrative unit whose primary mission will be to sensitize the company’s various entities and secure their commitment to risk management and to strengthening their performance vis-à-vis the targets set for the coming years.


STMSTraTegic plan 2020 91
PRIORITY 6PLACE SUSTAINABLE dEVELOPMENT AT ThE CENTRE OF ALL OUR dECISIONS A host of analyses, impact assessments and reports published worldwide in the past several years have recognized the benefits of public transit on quality of life. Governments and most social and economic stakeholders acknowledge that public transit contributes to rational energy use and reduced emissions of GHGs and airborne contaminants. In addition, public transit is seen as a valuable tool in combating social exclusion by virtue of the fact that it offers a valid transportation option in urban centres, in particular for non-car-owning households, senior citizens and people with functional limitations.
At the STM, sustainable development is central to our concerns and decisions. We aim to reduce our ecological footprint and contribute to Montréal’s sustainable development. We also plan to invest in our vehicles and infrastructures in order to help the Québec government and the city of Montréal reach their targets for reducing GHG emissions and oil consumption.
STRATEGIES 21 TAKE PART IN THE GOVERNMENTS EFFORTS TO ELECTRIFY PUBLIC TRANSIT
22 LESSEN THE STM’S ECOLOGICAL FOOTPRINT
23 PROMOTE SUSTAINABLE DEVELOPMENT
PRIORITY 6 – MAIN INdICATORS
2006 2009 2010 2015 2020
Indicators Actual Actual Actual Target Target
GHG emissions intensity (g CO2e/passenger-km) 52 49 49 42 39
Non-hazardous residual materials recovery rate % 41 59 59 70 80
Percentage of projects undergoing a sustainabledevelopment assessment % – 27 30 100 100

STMSTraTegic plan 2020 92
STRATEGY 21TAKE PART IN THE GOVERNMENTS EFFORTS TO ELECTRIFY PUBLIC TRANSIT
As of 2025, the STM plans to acquire only silent, zero-emission buses. In terms of sustainable development, this represents:
A substantial reduction in emissions of GHGs and other airborne contaminants.
Use of a renewable energy source, hydroelectricity.
Improved energy efficiency.
In its 2010 − 2011 budget, the Québec government laid out a financial measure aimed at developing an all-electric city bus in the province by 2013. This measure backed its GHG emissions reduction target for 2020. In addition to that, Hydro-Québec included in its Strategic Plan 2009 − 2013 an action plan for electric transportation which provides for financial support for the development of electrical infrastructure for public transit.
In recent years, the STM has continually shown an innovative approach by investing in showcase projects involving new technologies. We want to continue in this direction in order to support the government in its specific project to electrify public transit. For example, we will acquire only hybrid buses (diesel-electric) between 2013 and 2017, and will carry out an electric bus showcase project at the same time. Additionally, starting in 2025, all new vehicles will feature an all-electric propulsion system.
Gradually phase out diesel busesTo ensure that our transportation system is all-electric as of 2025, the STM has begun to acquire hybrid buses (diesel- electric). This transition technology, used in the automotive industry, yields fuel savings of 30%, with a corresponding reduction in emissions of GHGs and airborne contaminants. Adding electric cooling fans to these buses would even make it possible to achieve fuel savings of over 40% and a corresponding reduction in GHG emissions.
Conduct showcase projects for electric busesThe STM is especially interested in rapid charging technology, which involves supplying buses with electricity by means of devices installed at certain stops. These devices would allow the buses to cover greater distances before their batteries would need complete recharging. The company plans to carry out a showcase project for this technology starting in 2012, in cooperation with Transports Québec, the city of Montréal, our fellow members of the Association du transport urbain du Québec (ATUQ), the Société de gestion et d’acquisition de véhicules de transport (AVT), Hydro-Québec, BC Transit and Novabus.
The use of hybrid buses and rapid charging technology, and the introduction of the first tram line and, eventually, of trolleybuses, will enable the STM to make the move toward electrifying its surface network.
Study the creation of a trolleybus networkIn partnership with the city of Montréal, Hydro-Québec and the AMT, the STM plans to establish an initial network consisting of some one hundred trolleybuses on the island of Montréal by 2016 − 2017. We will identify and define the best introduction scenarios for customers while also evaluating the operating and maintenance costs of such a network.

STMSTraTegic plan 2020 93
STRATEGY 22 LESSEN THE STM’S ECOLOGICAL FOOTPRINT
The STM adopted a sustainable development policy in 2010. In addition to contributing to Montréal’s first Strategic Plan for Sustainable Development 2005 − 2009 and its second such plan, for 2010 − 2015, we plan to step up our efforts to reduce the company’s ecological footprint.
To achieve this goal, we will take action on every front: airborne emissions from our buses and facilities, energy consumption from non-renewable sources, contaminated sites, and residual materials—both hazardous and non-hazardous. Throughout the period of the Strategic Plan, we must cut discharges into the air, water and soil, as well as production of residual materials. We must also manage our environmental liabilities, some of which date back as much as 150 years.
Reduce emissions of greenhouse gases and key airborne contaminantsThe STM’s activities generate only 0.2% of GHG emissions in Québec, at the same time avoiding emissions of more than 660,000 tonnes per year for public transit users. Even though its operations are growing continually, the company is committed to reducing its GHG emissions considerably. On the basis of the 2010 results, namely an emissions intensity of 49 g CO2e/passenger-kilometre, we have set a target of 39 g CO2e/passenger-kilometre for 2020, while factoring in a 30% increase in service.
With a target of 540 million trips in 2020, the STM will contribute to achieving the Québec and Montréal objectives by avoiding the associated GHG emissions. The city’s objective is based on a 1.2 – million-tonne reduction in GHG emissions in the land transportation sector by 2020. The net gain of 241,000 tonnes is equivalent to 20% of the municipal objective—clear proof of the importance of public transit in the fight against climate change.
STM CONTRIBUTION TO ThE CITY OF MONTRÉAL’S GhG EMISSIONS REdUCTION OBJECTIVE
2008 Trending toward Target of Strategic Plan 2020
Trips (millions) 383.5 420 540
Equivalent of emissions 666,000 731,000 940,000generated by automobiles (tonnes)
STM emissions (tonnes) 147,000 172,000 180,000
Net emissions avoided (tonnes) 519,000 559,000 760,000
Net gain relative to 2008 (tonnes) n. a. 40,000 241,000
Furthermore, Québec’s Ministère du Développement durable, de l’Environnement et des Parcs is drawing up its next action plan on climate change for 2013 − 2020. To reach its target, the government will continue to establish conditions conducive to the development of renewable energies and new technologies aimed at reducing GHG emissions. The land transportation sector will be the focus of particular attention in this process.
Through various measures, the STM, together with its customers, will be able to reduce its carbon footprint. During the initial phase (2012 − 2017), we will implement a number of actions: equipping our vehicles with transmissions with optimized programming (TopoDyn), electric fans and hybrid engines, encouraging our drivers to adopt green driving practices, carrying out the iBus project, which is based on a new real-time management system, etc. In the second phase (2016 − 2020), we will introduce all-electric vehicles, such as trolleybuses, rapid-charge buses and tramways, into the system. As well, all new buses are equipped with particle filters and comply with the 2010 U.S. EPA standard on airborne contaminants.

94
Manage contaminated soilThe STM owns and manages a large number of sites used for maintenance (some of them built in the early 20th century), storage, and cleaning and refuelling vehicles. Realizing the environmental liabilities represented by certain sites, we conducted an inventory of contaminated properties in 2009; the 27 properties considered at risk will undergo an environmental characterization program by 2013. A register of the environmental liabilities posed by contaminated soil will be produced, and the contaminated sites will be rehabilitated.
Improve the company’s environmental management practicesThe STM has had an environmental protection policy since 2000. In 2010, we adopted our Sustainable Development Policy. An internal prioritization exercise, conducted at the end of 2009 with the collaboration of several administrative units, brought out the need to improve the company’s environmental management. We will therefore begin the process of instituting a stricter management framework in 2011 in order to better share responsibilities among the different units, improve legal compliance and provide integrated management of environmental aspects inspired by best practices in the field.
Once the Strategic Plan comes into effect, we will start by improving our environmental management system, drawing inspiration from the ISO 14001 standard.
Increase waste matter recyclingThe Québec government and the city of Montréal have set ambitious objectives for waste matter recycling. The Québec Residual Materials Management Policy includes an overall recycling goal of 70% by the end of 2015, while the city’s objective is 80% by 2019.
In 2009, the STM and its users achieved a non-hazardous residual materials recovery rate of 59%—a 40% improvement since 2007. The STM is aiming for the same objectives as the Québec government and the city of Montréal. To reach these targets, we will improve our measurement systems and our at-source reduction, reuse, recycling and reclamation (4R) practices. In 2011, we began installing multi-material recycling bins throughout the Montréal metro system.
Carry out sustainable projects The Strategic Plan 2020 calls for carrying out a large number of projects that affect the company’s growth, acquisition of rolling stock and asset maintenance. The STM will see that its projects are planned, designed and implemented in keeping with sustainable development, drawing inspiration from best practices, particularly in the areas of environment and energy efficiency.
In the future, we plan to construct buildings to LEED1 standards. This means buildings that are efficient according to the following criteria: sustainable site development, water efficiency, energy and atmosphere, materials and resources, and indoor environmental quality.
On the environmental level, the STM will cut fuel consumption with the introduction of new, more energy efficient hybrid vehicles. In addition, establishing new priority measures, in particular reserved lanes, will increase bus journey speed, thereby generating additional fuel savings as illustrated in the following graph. By increasing the journey speed to 18 km/h, the STM would cut fuel consumption by 30%.
1 Leadership in Energy and Environmental Design.
STMSTRATEGIC PLAN 2020
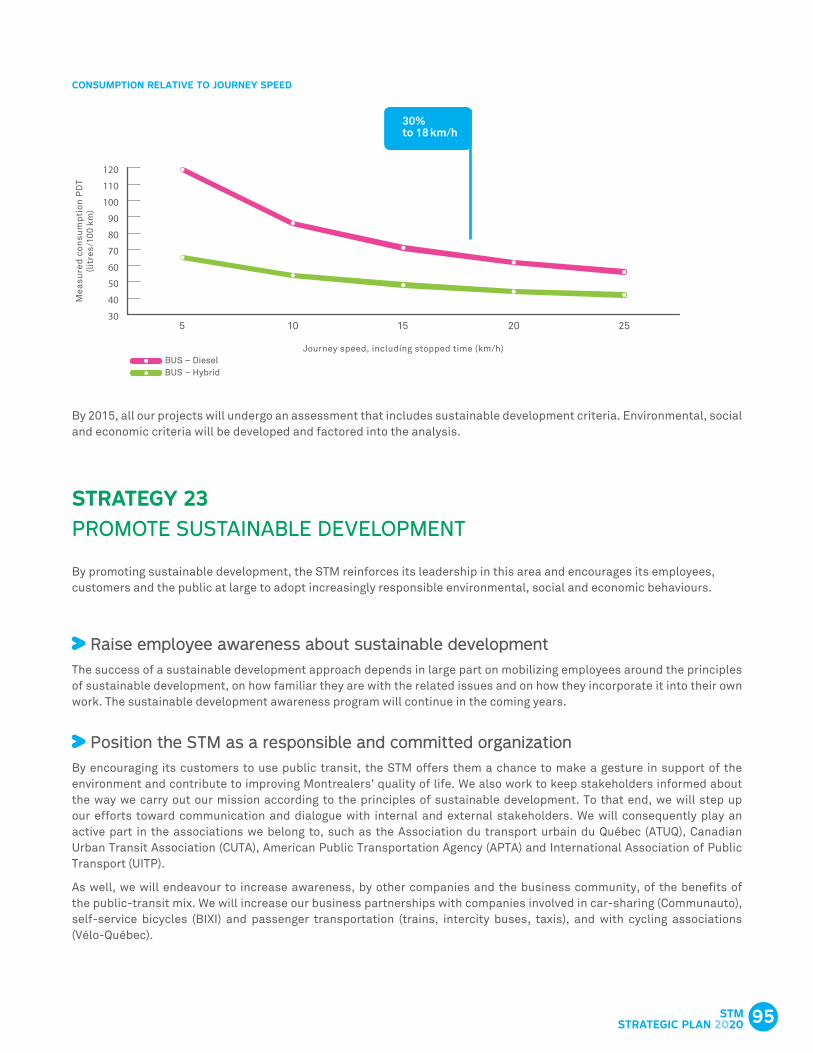
95
CONSUMPTION RELATIVE TO JOURNEY SPEEd
30
40
50
60
70
80
90
100
110
120
5 10 15 20 25
BUS – Diesel BUS – Hybrid
Mea
sure
d c
onsu
mp
tion
PD
T(l
itre
s/10
0 km
)
Journey speed, including stopped time (km/h)
By 2015, all our projects will undergo an assessment that includes sustainable development criteria. Environmental, social and economic criteria will be developed and factored into the analysis.
STRATEGY 23PROMOTE SUSTAINABLE DEVELOPMENT
By promoting sustainable development, the STM reinforces its leadership in this area and encourages its employees, customers and the public at large to adopt increasingly responsible environmental, social and economic behaviours.
Raise employee awareness about sustainable developmentThe success of a sustainable development approach depends in large part on mobilizing employees around the principles of sustainable development, on how familiar they are with the related issues and on how they incorporate it into their own work. The sustainable development awareness program will continue in the coming years.
Position the STM as a responsible and committed organizationBy encouraging its customers to use public transit, the STM offers them a chance to make a gesture in support of the environment and contribute to improving Montrealers’ quality of life. We also work to keep stakeholders informed about the way we carry out our mission according to the principles of sustainable development. To that end, we will step up our efforts toward communication and dialogue with internal and external stakeholders. We will consequently play an active part in the associations we belong to, such as the Association du transport urbain du Québec (ATUQ), Canadian Urban Transit Association (CUTA), American Public Transportation Agency (APTA) and International Association of Public Transport (UITP).
As well, we will endeavour to increase awareness, by other companies and the business community, of the benefits of the public-transit mix. We will increase our business partnerships with companies involved in car-sharing (Communauto), self-service bicycles (BIXI) and passenger transportation (trains, intercity buses, taxis), and with cycling associations (Vélo-Québec).
30%to 18 km/h
STMSTRATEGIC PLAN 2020

STMSTraTegic plan 2020 96 STM
PLAN STRATÉGIQUE 2020 96

STMSTraTegic plan 2020 97
PART IV
FINANCIAL OUTLOOk To achieve the objectives of the Strategic Plan 2020, the STM is counting on financial support from its partners: the Québec
and Canadian governments, the city of Montréal, the Montréal agglomeration and the Communauté métropolitaine de
Montréal (CMM).
FINANCIAL PARTNERS
ThE QUÉBEC GOVERNMENT (CONTRIBUTIONS OF $184 MILLION IN 2011)The Québec government has always been a key figure in sustainable development, particularly as regards environ-mental protection. Through its energy choices and environmental orientations, it has quickly become a source of inspiration for many other governments.
Société de financement des infrastructures locales du Québec (SOFIL)
SOFIL, the program for financing local infrastructure, derives 81% of its funding from federal gasoline tax revenues and 19%, from the provincial government and Québec’s municipalities as a whole. It acts to reduce asset maintenance investment costs for public transit authorities, which share 23% of the total amount, on the basis of ridership.
Québec Public Transit Policy
With the adoption of the Québec Public Transit Policy (QPTP), the Québec government recognized the contribution made by public transit and active transportation to the fight against global warming, and reinforced this contribution by targeting an 8% increase in ridership and a 16% increase in service between 2007 and 2011.
To follow up the QPTP, the provincial government introduced the government assistance program for the improvement of public transit services (PAGAST). This program provides an annual subsidy of $100 million, which comes from the Green Fund financed by the hydrocarbon tax of $0.008 per litre of gas ($0.00938 per litre of diesel) sold in Québec. It funds 50% of the costs related to increasing service. The balance is funded by contributions from the municipalities and/or increased passenger revenue.
Government assistance program for public transit
In addition to its paratransit program, the Québec government has also enhanced its capital asset assistance program by expanding the eligibility criteria of new categories of assets, such as information technologies, building roofs, bus shelters and service vehicles.
The Québec government introduced measures making transportation passes deductible for employers in order to stimulate demand for public transit, and reimbursing the diesel excise tax in order to reduce transit authorities’ fuel supply costs.
Road Infrastructure and Public Transit Fund
Financial assistance also comes from the Government Assistance Program for Improving Energy Efficiency in Road Transportation, and the Road Infrastructure and Public Transit Fund (FORT). The latter is to be funded by various sources, including a gas tax of up to $0.04 per litre charged throughout the island of Montréal.

STMSTraTegic plan 2020 98
CITY OF MONTRÉAL ANd MONTRÉAL AGGLOMERATION (CONTRIBUTIONS OF $390 MILLION IN 2011)The city of Montréal has set itself the challenge of providing solutions for meeting the mobility needs of people and goods that incorporate the issues related to sustainable development, including preservation of the environment and of residents’ quality of life. To meet this challenge, it developed a vision which it inscribed in its 2008 Transportation Plan, Réinventer Montréal, and which represents a first.
Since the Québec government withdrew from funding public transit operations (except paratransit service) in 1992, the city of Montréal and the Montréal agglomeration have become major financial partners for the STM. Municipalities on the island of Montréal have increased their basic annual contributions by nearly 60%—from $244 million to $388 million —since 2002.
The city of Montréal was able to boost its support, in part as a result of powers it was granted in June 2008 by Bill 22. In 2010, the city imposed a new tax on parking in downtown Montréal. Continuing its efforts to maintain and develop public transit, it will collect revenue of $45 per year from the tax on vehicles registered within its territory, effective July 2011.
The municipalities on the island of Montréal are also major financial backers of activities related to developing and operating the metro and commuter train systems and for developing and operating metropolitan installations.
COMMUNAUTÉ MÉTROPOLITAINE dE MONTRÉAL (CONTRIBUTIONS OF $90 MILLION IN 2011)In 2007, the CMM and Québec’s Ministère des Transports signed a five-year agreement, scheduled to run until the end 2011, to finance the operating and investment losses of Montréal’s metro system.
This agreement recognizes Montréal’s metro as a facility that serves the entire metropolitan region. It also acknowledges the existence of a financial imbalance between the Montréal agglomeration and the metropolitan region.
Once public transit was made a priority issue, the elected representatives of the CMM continued their deliberation on the governance and funding of all metropolitan means of public transit.
As well, the CMM set the following objectives: establish metropolitan equity in the division of costs of metropolitan means of transportation, draw up a similar funding approach that is consistent and ongoing, and apply the user-pay principle to all means and equipment classified as metropolitan. It developed new formulas for sharing losses incurred by all applicable equipment, thereby defining a new financial framework.
The CMM’s activities dealing with the governance and funding of metropolitan public transit entered an important stage with the signing, by the mayors of Laval, Longueuil and Montréal, of an agreement to complete the metro system, as well as with fare adjustments at off-island metro stations and with certain advances in metropolitan governance.
The Québec government’s decision to raise the gas tax by $0.015 per litre effective May 1, 2010, which came at the request of the CMM’s elected representatives, gave tangible form to the establishment of the new metropolitan financial framework.
However, this new framework calls for a complete overhaul of the legislation establishing the Agence métropolitaine de transport, if it is to take full effect by January 1, 2012.

STMSTraTegic plan 2020 99
ThE CANAdIAN GOVERNMENT (CONTRIBUTIONS OF $73 MILLION IN 2011)The new pact for cities and other municipalities, which was signed in 2005 and consisted of bilateral agreements between the Canadian government and the provinces, for the first time ensured the allocation of a specific amount for public transit infrastructures over five years (2005−2010). In 2008, the Canadian government made this $2 billion in annual revenue from the Gas Tax Fund a permanent revenue source. As a result, Québec’s Société de financement des infrastructures locales (SOFIL) receives its share every year, based on the relative weight of its population, to support the renewal of municipal infrastructures, including public transit infrastructure.
Over the years, the Canadian government has initiated various direct or indirect measures that enable the country’s transit authorities to stimulate demand for public transit, to innovate or to ease the financial burden of their investments. The Urban Transportation Showcase Program (UTSP), the Canada-Québec Infrastructure Program and the program to improve transportation security (Transit-Secure) are a few examples of federal initiatives.


101
FINANCIAL FRAMEWORk 2011−2020
INVESTMENTS
To reach our service improvement objectives in the coming years, the Strategic Plan 2020 calls for a total investment of $11.5 billion in the metro, bus and tramway sectors, broken down as follows: $6.2 billion for asset maintenance, $3.7 billion for development and $1.6 billion for metro extensions.
SUMMARY OF MAINTENANCE ANd dEVELOPMENT INVESTMENTS FOR 2011 − 2020*
IN M$ MAINTENANCE dEVELOPMENT TOTAL
METRO 4,513 1,221 5,734Replacement of metro cars (MPM-10)Alterations to shops and equipment (MPM-10)Replacement of metro cars (MPM-73)Réno-Systèmes, phases I to IVRéno-Infrastructures, phases I and IIBerri-UQAM station – Major refurbishment, Phase I
BUS 1,685 1,333 3,018Henri-Bourassa reserved laneBus acquisition (1,222)New bus garages (2)Reconstruction of Saint-Denis bus garageRefurbishment of Crémazie building iBusTransit Priority Measures (TPM) for buses
TRAMWAYa – 1,122 1,122
SUBTOTAL 6,198 3,676 9,874
METRO ExTENSIONSb 1,610 1,610
TOTAL 6,198 5,286 11,484 (54%) (46%) (100%)
* On February 2, 2012, the STM Board of Directors approved the priority ranking of asset maintenance, optimization and development projects for 2011 − 2020. This priority ranking is available on the STM Web site as a supplement to our Strategic Plan 2020.
a Estimate based on a cost per kilometre of $85 million (in constant 2010 dollars), including taxes and 30% for contingencies.b Estimate based on a cost per kilometre of $150 million (in constant 2006 dollars).
Metro network To ensure the long-term reliability of metro assets, the STM plans to invest $4.5 billion over the next 10 years. Of this amount, $2.7 billion will be earmarked for replacing cars and making the necessary modifications to the infrastructure, mainly preparing the maintenance shops for the arrival of the MPM-10.
As regards network development, building seven stations on the island of Montréal will cost an estimated $1.6 billion. To meet demand during this period, 126 additional new cars are planned, for a total of more than $600 million.
Bus network Investments in the bus network total $3.0 billion, broken down as follows: purchase of 1,198 buses—788 of them as replacements; construction of two new bus garages to accommodate 300 12-metre buses; upgrading of eight bus garages; and improvements to the 370-km surface network to allow faster, more efficient real-time management.
STMSTRATEGIC PLAN 2020

102
CONTRIBUTION OF ThE QUÉBEC GOVERNMENT – dEBT SERVICE FOR ASSET MAINTENANCE ANd dEVELOPMENT
0
100
200
300
400
500
600
700
800
2011 2012 2013
Maintenance
Development
In m
illio
ns o
f $
2014 2015 2016 2017 2018 2019 2020
For the STM, the net cost of servicing the debt related to investments will increase from $77 million in 2011 to $199 mil-lion in 2020, as the following graph illustrates.
CONTRIBUTION OF ThE STM – dEBT SERVICE FOR ASSET MAINTENANCE ANd dEVELOPMENT
0
25
50
75
100
125
150
175
200
2011 2012 2013
Maintenance
Development
In m
illio
ns o
f $
2014 2015 2016 2017 2018 2019 2020
STMSTRATEGIC PLAN 2020

103
Tramway line The introduction of the tramway calls for $1.1 billion in investments, covering the acquisition of tram cars, start-up of an initial tram line and construction of a maintenance centre.
Given the extent of the investments required, the city of Montréal recently commissioned a working group to evaluate the most appropriate way to fund this new transit mode. Tramway funding will thus be considered an item outside the framework of the financial strategy of the STM’s Strategic Plan 2020.
FUNdING OF INVESTMENTS
The investments required for the metro, bus and tramway networks total $11.5 billion. Taking existing programs as a basis, the funding would come from the Canadian government ($0.86 billion or 7%), the Québec government ($7.5 billion or 65%) and the city of Montréal and the STM ($3.2 billion or 28%).
SOURCES OF INVESTMENT FUNdING FOR 2011−2020
In M$ Government funding Montréal New sources
Sectors Investments Federal Provincial City STM Others
Cash Dept Cash Cash/Dept Metro 5,735 18 4,355 4 1,359
Bus and 3,017 792 1,527 240 458 paratransit
Tramway 1,122 – – – – 1,122
Metro extensions 1,610 – 1,610 – –
Total 11,484 810 7,491 244 1,816 1,122
In 2020, the Québec government’s contribution will amount to $792 million in debt service under the assistance programs currently in effect. Debt service related to maintenance would represent close to $418 million, or 53%. For development projects, it would come to $374 million, or 47% of annual contributions. With the addition of $1.61 billion for metro extensions on the island of Montréal, the debt service borne by the Québec government should rise by a further $146 million to reach an annual cost of $938 million.
STMSTRATEGIC PLAN 2020

104
OPERATIONS
Over the period of the Strategic Plan, the STM’s financial position will shift from a balanced budget in 2011 to a shortfall of nearly $262 million in 2020. The following hypotheses were considered in making these forecasts.
Revenue sources To estimate passenger revenue, the STM took into account growth in ridership, the impacts of disincentive measures for single-occupant car travel and annual fare increases based on the parameters of the new fare strategy. We plan to set our fares according to inflation indices linked to consumption and transportation, discounts offered and improvements in service. Between now and 2020, passenger revenue will consequently rise from $506 million to over $850 million—a 75% increase—due to the combined effect of growth in ridership and the weighted increase in fares. Other operating revenue will rise by $39 million, to reach $46 million during that period.
Provincial and municipal contributions We have worked from the assumption that subsidy programs, such as that of SOFIL, the government assistance program for the improvement of public transit services, the public transit assistance program and the paratransit assistance program would be maintained in their entirety, in terms of both conditions and contributions. Payments of subsidies are evaluated according to the investment expenditures described in the preceding sections and are an integral part of this financial framework (see Priority 4 and table hereafter).
We have also assumed that the Montréal agglomeration’s contribution would be maintained for 2011 and 2012, and increased and indexed thereafter, rising to $475 million in 2020. In addition, the new CMM agreement on the governance and funding of metropolitan public transit will come into effect in 2012.
Operating expenses and debt serviceOperating expenses take into account steady growth in service, totalling 49 million kilometres, and a 2.4% annual increase in the cost of goods and services. Compensation will go up 2% per year after the current collective agreements expire. Forecasts for paratransit service factor in average demand growth of 6.3%. The projections include the increase in provincial sales tax, as per the 2010 − 2011 Québec budget.
The operating costs of the first line in the tramway network and of the metro extensions, but not their annual investment cost, will be taken into consideration starting in 2017. The projections include non-recurring costs of commissioning new metro cars and other major projects.
STMSTRATEGIC PLAN 2020

105
FINANCIAL FRAMEWORk 2011 − 2020: FORECASTS BASEd ON CURRENT FUNdING SOURCES (IN MILLIONS OF $)
2011 2012 2013 2014 2015 2016 2017 2018 2019 2020
Revenue sources Passengers 514 533 549 564 607 643 709 754 802 850
Others 39 36 37 38 38 40 41 43 45 46
Governments 229 257 298 363 472 611 732 798 872 909
Montréal agglomeration 390 395 405 415 425 435 445 455 465 475
Vehicle registration tax 19 25 30 30 30 30 30 30 30 30
Parking lot tax 19 19 19 19 19 19 19 19 19 19
Indexed proportionate 352 351 356 366 376 386 396 406 416 426
Regional 90 88 88 88 88 88 88 88 89 89
Required additional funding 0 64 106 145 162 196 236 254 265 262
1,262 1,373 1,483 1,613 1,792 2,013 2,251 2,392 2,538 2,631
Expenses
Salaries, goods and services 1,024 1,103 1,157 1,213 1,267 1,329 1,425 1,489 1,552 1,604
Investments 238 270 326 400 525 684 826 903 986 1,027
1,262 1,373 1,483 1,613 1,792 2,013 2,251 2,392 2,538 2,631
Additional funding requiredIn 2011, the Montréal agglomeration’s contributions to public transit in the region (in constant 2010 dollars) equal the historic level of 1992, the year following the Québec government’s withdrawal from funding the operating losses of public transit. Since 2009, the agglomeration’s financial contribution to the STM has risen nearly 17%, to $390 million, not including its contribution to the SOFIL program. The additional contribution comes mainly from the establishment of new sources of funding, such as the parking lot tax in 2010 and the vehicle registration tax in 2011. The introduction of such fiscal measures also indicates that Montrealers’ funding capacity has been reached and means the end of the use of property taxes as the sole source of funding for public transit.
Carrying out the Strategic Plan 2020 calls for additional funding in the coming years. In 2020, this funding will amount to $262 million: $68 million for current operations and for development of bus, metro, tramway and paratransit services, and $194 million for maintenance and development investment programs. The forecasts of the 2011−2020 financial framework were based on the maintaining and renewal of the financial parameters of government programs and initiatives, as well as the direct and indirect contributions of the Montréal agglomeration and those dedicated to metro funding.
A number of comparison exercises on funding sources indicate that Canada’s provinces ask more of drivers than municipalities to fund public transit. In the United States, public transit authorities are funded through sales taxes, gasoline taxes and tolls. However, these revenue sources are also used to build or maintain road networks. In line with the target of a 5% modal shift of drivers to public transit, the STM instead advocates increased participation by drivers in the greater Montréal area, mainly through the gas tax, parking tax and vehicle registration fees, or tolls throughout the metropolitan region.
STMSTRATEGIC PLAN 2020

106
Funding: A key issueNumerous requests have been made for years now, mainly asking the Québec government to maintain its infrastructure assistance program, update its contribution to operations, contribute a portion of the excise tax to funding public transit development projects and grant municipalities new taxable areas from dedicated sources.
In that time, the government has taken several steps. It has improved its assistance programs and established new ones to increase funding for asset maintenance and growth costs, and for the creation of new services.
The economic and environmental benefits of public transit are universally acknowledged. To achieve the objectives laid out in the Strategic Plan 2020, various avenues are to be explored, while others are already in effect, and balanced funding solu-tions are to be developed to obtain financial support from all our partners. The basic elements necessary for establishing a stable, adequate financial framework are currently in place.
POSSIBLE SOLUTIONS
Société de financement des infrastructures locales (SOFIL)With $2.0 billion in annual funding from the Canadian government, and with funding from the Québec government, SOFIL devoted 23% of its funds to public transit in its first phase, which concluded in 2010. Contributions from the municipalities represented 15.5% of the total cost of the STM’s investment projects.
The renewal of the initial conditions for 2011 − 2015 is the first step in the financial framework sought. Thereafter, the STM would like to count on inflation adjustments of the actual amounts and on an increase in the share dedicated to public transit.
Québec Public Transit PolicyThe Québec government is relying on the QPTP, a dedicated revenue source, to achieve its GHG emissions reduction objective for 2020. Out of an annual budget of $130 million, $100 million is earmarked for public transit, to fund 50% of development costs. The current rules of allocation are to be reviewed in 2011.
The QPTP was such a success in its first four years that the STM hopes that the government will increase the Green Fund in the coming years. This measure is essential for it to continue improving the service it provides.
Gas Tax Fund Like the Montréal agglomeration and the Québec government, the federal government has made recent efforts to support public transit, including the Public Transit Capital Trusts of 2006 and 2008, the Building Canada Fund, the Gas Tax Fund, the Urban Transportation Showcase Program and the Transit-Secure program. These have had a significant positive impact on the STM’s activities and customer service. To ensure continuity of its current funding sources, the STM would like the $2-billion annual investment earmarked for the Gas Tax Fund to be indexed, at the very least. It would also like to be eligible for any eventual long-term public infrastructure program and to see the establishment of a national public transit fund in keeping with its objective of having access to direct, indexed, permanent funding sources.
Passengers’ contribution To carry out its Strategic Plan, the STM is also counting on passengers. The company advocates a socially responsible fare structure that limits the contribution of passenger revenue to a maximum of 50% of total revenue.
STMSTRATEGIC PLAN 2020

107
A NEW METROPOLITAN FINANCIAL FRAMEWORk
A 1.5¢ per litre increase in the gas tax was introduced in May 2010 in the Montréal region to remedy the historical financial imbalance in the division of metropolitan revenue. However, it could not support continued improvement in service and the establishment of new transit modes in the region. For the coming years, the STM and the Montréal agglomeration would like to see further increases in the gas tax.
Municipal contributionThe contribution of the Montréal agglomeration remains essential in funding asset maintenance and the expansion of public transit. To balance its financial framework, the STM would like the Montréal agglomeration to keep up its efforts to support the networks’ operations and the improvement in services provided.
STMSTRATEGIC PLAN 2020

STMPLAN STRATÉGIQUE 2020 108

109
PART V
FOUR CONdITIONS FOR AChIEVING ThE STRATEGIC PLAN 2020 ANd MAkING PUBLIC TRANSIT A LASTING SUCCESSA number of points argue in favour of increasing public transit use in Montréal:
The city’s economic development and the consolidation of employment hubs.
The importance of taking action to combat climate change and fulfilling our international commitments.
The reduction in our dependence on oil, whose price fluctuations can strain and erode household savings.
The growing traffic congestion problems in the Montréal area, which mean measurable economic losses as well as increasing and costly delays in the delivery of goods.
The reevaluation of the role and place of the automobile—more specifically, single-occupant vehicles —in urban settings, as regards road infrastructure space and supply.
The desire of citizens, elected representatives and municipal administrations to move in the direction of better quality of life.
In the Strategic Plan 2020, the STM forecasts a 5% modal shift from automobiles to public transit, which would allow it to reach 540 million trips by the end of 2020; this, in turn, translates into 780,000 tonnes of GHG emissions avoided (equivalent to the emissions from 156,000 cars). In addition, the new services introduced and new rolling stock acquired will be able to sustain an increased service level for the 2020s.
It should be recalled that, without the major investments made in metro infrastructure in the decade between 1966 and 1976, Montréal’s downtown core and public transit service would not be what they are today.
ThE FOUR WINNING CONdITIONS
Dedicated, indexed, recurring financing In the coming years, factoring in the ongoing contributions made by passengers, the Montréal agglomeration and the other cities and towns in the metropolitan region, financial resources will still be inadequate for achieving the objectives of the Strategic Plan 2020. The STM must therefore be able to count on an increase in its current sources, or indeed the establishment of new funding sources that are dedicated, indexed and recurring to finance the expansion of its service and introduce new means of transportation.
In this context, the continuity and enhancement of existing policies and programs instituted by the Québec government, such as the Québec Public Transit Policy, government assistance program for the improvement of public transit services, the public transit assistance program and paratransit assistance program, and the Société de financement des infrastructures locales, take on strategic importance. The creation of the FORT fund is consequently good news for public transit funding in Québec, but the amounts budgeted should be increased.
STMSTRATEGIC PLAN 2020

STMSTraTegic plan 2020 110
New revenue sourcesIn terms of municipal authorities, measures affecting the STM involve the allocation of new financial tools and new powers to Montréal. Among the funding sources most used elsewhere in North America are taxes explicitly related to automobile use, such as an escalating fuel tax that would fluctuate with prices, a specific tax on fuel, the creation of new taxable areas, a payroll tax, a tax on off-street parking, an increase in registration fees and the introduction of tolls in the metropolitan region.
To achieve the Strategic Plan, which will allow it both to provide high-quality public transit and to contribute to the GHG emissions reduction targets set by the province and the city, the STM must be able to count on additional revenue sources. Whatever options are adopted, they will have to cover all maintenance costs as well as development costs.
Governance of public transit Governance of metropolitan public transit has also been a matter of concern for municipal elected officials in the Montréal region for many years, particularly since the establishment of the CMM in 2001. This organization was given similar powers with regard to public transit as those of the Agence métropolitaine de transport, although the AMT’s mission did not change.
Governance of public transit must adapt to the changing market reality and fit in with urban development, as well as with more intensive and strategic land use. One objective is to rely more on public transit for its effects on social and economic development, and especially on environmental protection, which has become essential in the current context. While governance has to take into account a decrease in automobile use and its corollary, an increase in public transit and active transportation, it must also consider changes in people’s behaviour, the environmental efficiency of private and commercial vehicles, and carpooling, as well as broader factors, such as land use and residential density.
The large number of stakeholders in the area of transportation, the willingness of municipal elected representatives to be more accountable and the chronic lack of financial resources to meet the public’s expectations all act to create situations of tension. The various Montréal authorities consider that the metropolitan region needs a governance model that allows municipal elected officials to fully and effectively exercise their responsibilities with regard to regional public transit planning. Moreover, that is the subject of one of the development programs in the city’s 2008 Transportation Plan, Réinventer Montréal.
To develop the urban territory in a sustainable fashion—in other words, promote urbanization in a way that limits the environmental, economic and social costs and impacts—and to improve the mobility of people and goods, a strategy that integrates urban development and transportation on a metropolitan level must be adopted.
The STM would like to see a review of public transit governance in the Montréal region so as to facilitate decision making and project execution. Like the city of Montréal, it wants the CMM to be able to play a stronger role in transportation and be given all the powers it needs to pursue a strategy designed to improve the metropolitan region’s competitive edge, particularly on an economic level.
In a broader planning context, the STM wishes to discuss potential solutions for improving the quality of public transit service with island of Montréal boroughs and municipalities. Examples include sharing the road—with taxis and active modes of transportation, among others—and the interrelation between urban development and transportation on the municipal road network, ranging from traffic calming measures and a parking policy to the development of green neighbourhoods.

STMSTraTegic plan 2020 111
Urban development favourable to public transit By taking appropriate measures, local and regional authorities can achieve a better balance in the way we share public space. They can enhance the attractiveness of downtown neighbourhoods through high-quality urban designs and developments, encourage a road-sharing approach that is more favourable to public transit on metropolitan arterial roads, based on the number of people they carry rather than the number of vehicles using them, and promote the development of public transit and other alternatives to single-occupant car travel.
As part of a review of the city of Montréal’s Master Plan, the STM believes that more room should be provided for public transit and active transportation within the public space. More generally, the city’s development should take into account the interconnection between mobility and accessibility, and so integrate different approaches to support the development of public transit and active transportation. In 2004, in fact, the Master Plan proposed intensifying urban activities around metro stations. This proposal was then taken up in the Transportation Plan and the Montréal Community Sustainable Development Plan.
As was emphasized at the many public consultations held in recent years, the questions of urban development and transportation are closely linked and represent a strategic issue for the Montréal agglomeration. The STM will play an active part in drawing up the city’s urban development plan, as it did for the 2008 Transportation Plan, Réinventer Montréal.
Finally, the STM intends work with its various metropolitan partners and Québec’s Ministère des Transports to see that public transit is integrated into the planning of all major road and property development projects: residential, commercial and industrial.
In connection with the consultation carried out by the CMM on the preliminary version of the Metropolitan Land Use and Development Plan (PMAD), the STM submitted a brief in which its recommendations included:
Set up an incentive program to support the development of TOD (transit-oriented development) areas.
Systematically integrate a travel-planning component in development and transportation planning for TOD areas.
Integrate TOD areas along the 62 lines that make up the 10-minutes-max network and the express bus network; this would significantly increase the capacity of TOD areas throughout the Montréal agglomeration and, consequently, help reach the 40% target across the metropolitan region.
Manage parking spaces better in order to limit their number.
Institute an incentive program to support the revitalization and increased density of existing urban space in non-TOD areas.
Encourage regional and municipal partners to adopt policies ensuring that developers demonstrate that their projects promote the use of public transit and active transportation.
Draw up a complete picture, backed by figures, of all road and public transit projects.
Prioritize infrastructure maintenance projects before any development projects.
Ensure that, with respect to the development of new infrastructures, public transit projects take priority over the development of new highway corridors or highway extensions.
Establish a comprehensive portrait of transportation funding, including public funding of the road network and public transit.
Initiate an examination of new sources of funding for transportation infrastructure operation and maintenance.
Institute robust measures promoting public transit whenever major road refurbishment projects are undertaken.
Rethink the position of public transit in road rights-of-way whenever road refurbishment projects are undertaken.
See that projects enabling public transit to improve its competitive edge are carried out.
Expand the crucial metropolitan public transit system to include the 62 lines that form the express network (31 lines in 2012) and the high-frequency 10-minutes-max network (31 lines since 2010).
Clearly establish that the bus corridors that make up the crucial metropolitan public transit system should, as a matter of priority, be the subject of Transit Priority Measures (TPM).

STMSTraTegic plan 2020 112
Review the question of public transit governance in the Montréal region to facilitate decision making and project execution.
Consolidate the role of the CMM so that it acquires all the necessary powers to pursue a strategy designed to improve the Montréal region’s competitive edge.
Make the road work coordinating committee, in charge of liaising between the different municipalities, the CMM and the two other levels of government, a permanent body; its mandate should be broadened to ensure proactive—rather than reactive—planning of mitigation measures involving public transit.
Set up a Québec – Metropolitan Montréal Table to encourage better coordination and consultation; the STM recommends that an in-depth examination of the action plan and means of implementing it be launched without delay.
Management of single-occupant car trips To achieve a 5% modal shift and a 40% increase in ridership by 2020, the STM is counting on the municipalities in the Montréal agglomeration and the Québec government to institute measures that will prompt a number of drivers to change their travel habits. We believe that increasing road and highway capacity on and around the island of Montréal is to be avoided in order to make public transit more competitive. Similarly, management of parking spaces should be reviewed so as to foster increased demand for public transit.
To curb the increase in costs related to traffic congestion, the STM proposes demand-management measures in the short term:
Achieve a better balance in the sharing of public space, favouring reserved bus lanes and carpooling.
Make downtown neighbourhoods more attractive to live in and visit.
Find a new way of sharing the metropolitan road network that is conducive to public transit.
Pursue urban development that is more open to public transit and to alternatives to single-occupant vehicles.
These measures would be accompanied by disincentive measures associated with the cost of vehicle use, such as a gas tax, registration fees and the introduction of a toll system. Altogether, the measures adopted by the city of Montréal and the Québec government must represent sufficient constraints to prompt a modal shift of 5%, a target that is considered realistic.

STMSTraTegic plan 2020 113
APPENdICES

BOARd OF dIRECTORS
Michel LabrecqueChairman of the Board of Directors and Transit Users’ Representative
John W. MeaneyMayor of Kirkland (City of DDO, Mayor)
Marvin RotrandVice-Chair Ville de Montréal Councillor Côte-des-Neiges − Notre-Dame- de-Grâce Borough
dominic PerriVille de Montréal Councillor Saint-Léonard Borough
Bernard BlanchetVille de Montréal Councillor Lachine Borough
Monica RicourtBorough CouncillorOvide-Clermont DistrictBorough of Montréal-Nord
Francesco MieleVille de Montréal CouncillorCôte-de-Liesse DistrictSaint-Laurent Borough
Marie TurcotteParatransit Users’ Representative
Claudia Lacroix PerronPublic Transit Users’ Representative (member under the age of 35)

MANAGEMENT COMMITTEE
Chief Executive OfficerYves Devin
Executive DirectorMajor Projects Management
Pierre Dauphinais
Executive DirectorPlanning, Marketing and Communications
Denise Vaillancourt
Executive DirectorOperations
Executive Director Human Resources and Shared Services
Alain Brière
Odile Paradis
Secretary General and Executive DirectorLegal Affairs
Sylvie Tremblay
Executive DirectorFinance and Control
Luc Tremblay
Executive DirectorBusiness Operations (subsidiaries)
Michel Lafrance
Senior DirectorPublic Affairs
Pierre Rocray
Carl Desrosiers
Deputy DirectorGeneral
John W. MeaneyMayor of Kirkland (City of DDO, Mayor)
dominic PerriVille de Montréal Councillor Saint-Léonard Borough
Monica RicourtBorough CouncillorOvide-Clermont DistrictBorough of Montréal-Nord
Marie TurcotteParatransit Users’ Representative

In accordance with the Act respecting public transit authorities, the STM undertook to develop a 10-year Strategic Plan. This plan, which continues from the Plan d’affaires 2007 − 2011 (Business Plan), was the subject of extensive analysis and discussion, both internally and externally. On December 2, 2010, the STM unveiled the draft version of its plan at a luncheon seminar at the Board of Trade of Metropolitan Montreal. Following this launch, the STM held over 40 meetings with more than 150 people and set up a blog to receive comments and suggestions regarding its Strategic Plan 2020.
List of organizations met with during the consultations• Eleven environmental groups
• Three municipal parties (Union Montréal, Vision Montréal, Projet Montréal)
• One cultural organization
• Three university representatives
• Five economic stakeholders
• One representative of the trucking industry
• One representative of motorists
• Two youth representatives
• Eight provincial ministers
• Three provincial parties (QLP, PQ, QS)
• One federal party
• One organization representing paratransit
• Two transit operating authorities
• Communauté métropolitaine de Montréal
• One public-health organization

MOST PRODUCTIVE ACCORDINGTO THE IMPERIAL COLLEGE LONDONMontréal’s metro system is the most productive in the world according
to the latest study of 27 subway systems around the world conducted
by the Imperial College London. More specifically, the STM’s labour
productivity is highest in terms of the number of car kilometers produced
and, although our system is one of the oldest in the world, its operating
costs are among the lowest.
BEST Of THE BESTACCORDING TO APTA
In 2010, the STM was named the best public transportation system
in North America at the annual meeting of the American Public
Transportation Association. This prestigious award highlights the
company’s excellent results between 2007 and 2009 in terms of
efficiency and effectiveness.

stm.info