Embed Size (px)
Citation preview
Board of Regents’
Montana University System
SSttrraatteeggiicc PPllaann
22001100
Approved: July 2006 Updated: June 2010
Found on-line at:
http://mus.edu/data/strategic plan.asp
O f f i c e o f t h e C o m m i s s i o n e r o f H i g h e r E d u c a t i o n
MMOONNTTAANNAA UUNNIIVVEERRSSIITTYY SSYYSSTTEEMM
SSttrraatteeggiicc PPllaann 22001100
TABLE OF CONTENTS
Page
Introduction ........................................................................................................................................... 1
Goal 1: Access & Affordability ............................................................................................................ 2-8
College Participation ............................................................................................................................................ 2
Retention & Completion .................................................................................................................................... 3
Financial Aid ......................................................................................................................................................... 4
Affordability .......................................................................................................................................................... 5
K-20 Collaboration .............................................................................................................................................. 6
Two-year Education ............................................................................................................................................ 7
Distance Learning ................................................................................................................................................ 8
Goal 2: Workforce & Economic Development .................................................................................. 9-12
Workforce Development ............................................................................................................................... 9-10
Research & Development ................................................................................................................................. 11
Graduate Education .......................................................................................................................................... 12
Goal 3: Workforce & Economic Development ................................................................................ 13-16
Information Technology ................................................................................................................................... 13
Efficiency ............................................................................................................................................................ 14
Transferability ..................................................................................................................................................... 15
Budget Allocation .............................................................................................................................................. 16

O f f i c e o f t h e C o m m i s s i o n e r o f H i g h e r E d u c a t i o n 1
MMOONNTTAANNAA UUNNIIVVEERRSSIITTYY SSYYSSTTEEMM
SSttrraatteeggiicc PPllaann 22001100
INTRODUCTION
The Montana University System Strategic Plan is the primary planning document of the Board of Regents. The Plan sets forth an agenda for higher education in Montana by delineating the strategic directions, goals, and objectives that guide the Montana University System (MUS). History In July 2006, after several years of study, public dialogue, and internal deliberations, the Board of Regents approved the Strategic Plan. Since then, updates have occurred annually, including revisions to strategic initiatives as well as a refreshing of the data within each goal. The development of the Strategic Plan began with two primary initiatives. The first was to work more closely with the interim legislature to develop a set of mutually agreed upon accountability measures that would guide the MUS and evaluate progress. Working with the Postsecondary Education Policy and Budget (PEPB) subcommittee of the 57th Legislature, the Board of Regents did develop this set of accountability measures in July 2002. Subsequently, the PEPB subcommittee has updated the accountability measures. This latest set of agreed-upon measures evolved into “shared policy goals” and work to form one base for this strategic plan. The second initiative was to work with the PEPB Subcommittee to explore new ways for the MUS take a more direct leadership role in the state’s economic development. This overall effort, called “Shared Leadership for a Stronger Montana Economy”, engaged a broad range of Montanans to prioritize specific initiatives that would help establish a new role for the MUS in strengthening the state’s economy. The Governor’s Office and several legislative interim committees were included in the effort. In July 2004, the Board of Regents and the PEPB subcommittee met jointly and agreed on three priority initiatives for immediate implementation:
Develop stronger business-university system partnerships for workforce training; Remove barriers to access for postsecondary education; and Expand distance learning programs and training.
Goals The Strategic Plan is comprised of three primary goals that contain a series of sub-goal statements and objectives within each area.
Goal 1: Access & Affordability Increase the overall educational attainment of Montanans through increased participation, retention and completion rates in the Montana University System Goal 2: Workforce & Economic Development Assist in the expansion and improvement of the state’s economy through the development of high value jobs and the diversification of the economic base Goal 3: Efficiency & Effectiveness Improve institutional and system efficiency and effectiveness
Maintaining the high quality of our institutions and the education provided to our students is not listed as an explicit goal. This is because it is THE MOST IMPORTANT consideration for every goal and initiative of the Montana University System and is considered to be an integral part of every component of this strategic plan.
O f f i c e o f t h e C o m m i s s i o n e r o f H i g h e r E d u c a t i o n 2
MMUUSS SSttrraatteeggiicc PPllaann
CCooll lleeggee PPaarrttiicciippaattiioonn
Prepare students for success in life through quality higher education
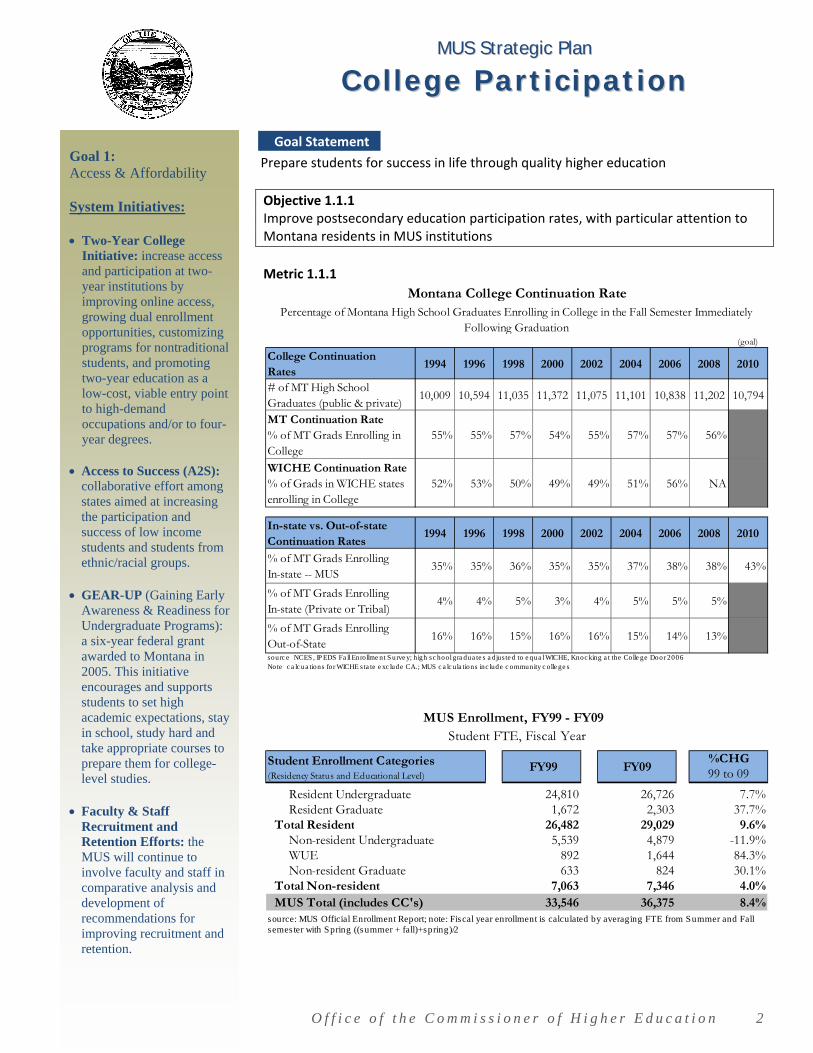
Objective 1.1.1 Improve postsecondary education participation rates, with particular attention to Montana residents in MUS institutions
Metric 1.1.1
(goal)
College Continuation Rates
1994 1996 1998 2000 2002 2004 2006 2008 2010
# of MT High School Graduates (public & private)
10,009 10,594 11,035 11,372 11,075 11,101 10,838 11,202 10,794
MT Continuation Rate % of MT Grads Enrolling in College
55% 55% 57% 54% 55% 57% 57% 56%
WICHE Continuation Rate % of Grads in WICHE states enrolling in College
52% 53% 50% 49% 49% 51% 56% NA
In-state vs. Out-of-state Continuation Rates
1994 1996 1998 2000 2002 2004 2006 2008 2010
% of MT Grads Enrolling In-state -- MUS
35% 35% 36% 35% 35% 37% 38% 38% 43%
% of MT Grads Enrolling In-state (Private or Tribal)
4% 4% 5% 3% 4% 5% 5% 5%
% of MT Grads Enrolling Out-of-State
16% 16% 15% 16% 16% 15% 14% 13%
sourc e NCES , IP EDS Fa ll Enrollme nt S urve y; h igh sc hool gra dua te s a djus te d to e qua l WICHE, Knoc king a t the Colle ge Door 2006Note c a lc ua tions for WICHE s ta te e xc lude CA.; MUS c a lc ula tions inc lude c ommunity c olle ge s
Percentage of Montana High School Graduates Enrolling in College in the Fall Semester Immediately Following Graduation
Montana College Continuation Rate
%CHG99 to 09
Resident Undergraduate 24,810 26,726 7.7%Resident Graduate 1,672 2,303 37.7%
Total Resident 26,482 29,029 9.6%Non-resident Undergraduate 5,539 4,879 -11.9%WUE 892 1,644 84.3%Non-resident Graduate 633 824 30.1%
Total Non-resident 7,063 7,346 4.0%MUS Total (includes CC's) 33,546 36,375 8.4%
FY09
source: MUS Official Enrollment Report; note: Fiscal year enrollment is calculated by averaging FTE from Summer and Fall semes ter with Spring ((summer + fall)+spring)/2
MUS Enrollment, FY99 - FY09 Student FTE, Fiscal Year
Student Enrollment Categories (Residency Status and Educational Level)
FY99
Goal Statement
Goal 1: Access & Affordability System Initiatives: Two-Year College
Initiative: increase access and participation at two-year institutions by improving online access, growing dual enrollment opportunities, customizing programs for nontraditional students, and promoting two-year education as a low-cost, viable entry point to high-demand occupations and/or to four-year degrees.
Access to Success (A2S):
collaborative effort among states aimed at increasing the participation and success of low income students and students from ethnic/racial groups.
GEAR-UP (Gaining Early Awareness & Readiness for Undergraduate Programs): a six-year federal grant awarded to Montana in 2005. This initiative encourages and supports students to set high academic expectations, stay in school, study hard and take appropriate courses to prepare them for college-level studies.
Faculty & Staff Recruitment and Retention Efforts: the MUS will continue to involve faculty and staff in comparative analysis and development of recommendations for improving recruitment and retention.
O f f i c e o f t h e C o m m i s s i o n e r o f H i g h e r E d u c a t i o n 3
MMUUSS SSttrraatteeggiicc PPllaann
RReetteennttiioonn && CCoommpplleettiioonn
Prepare students for success in life through quality higher education
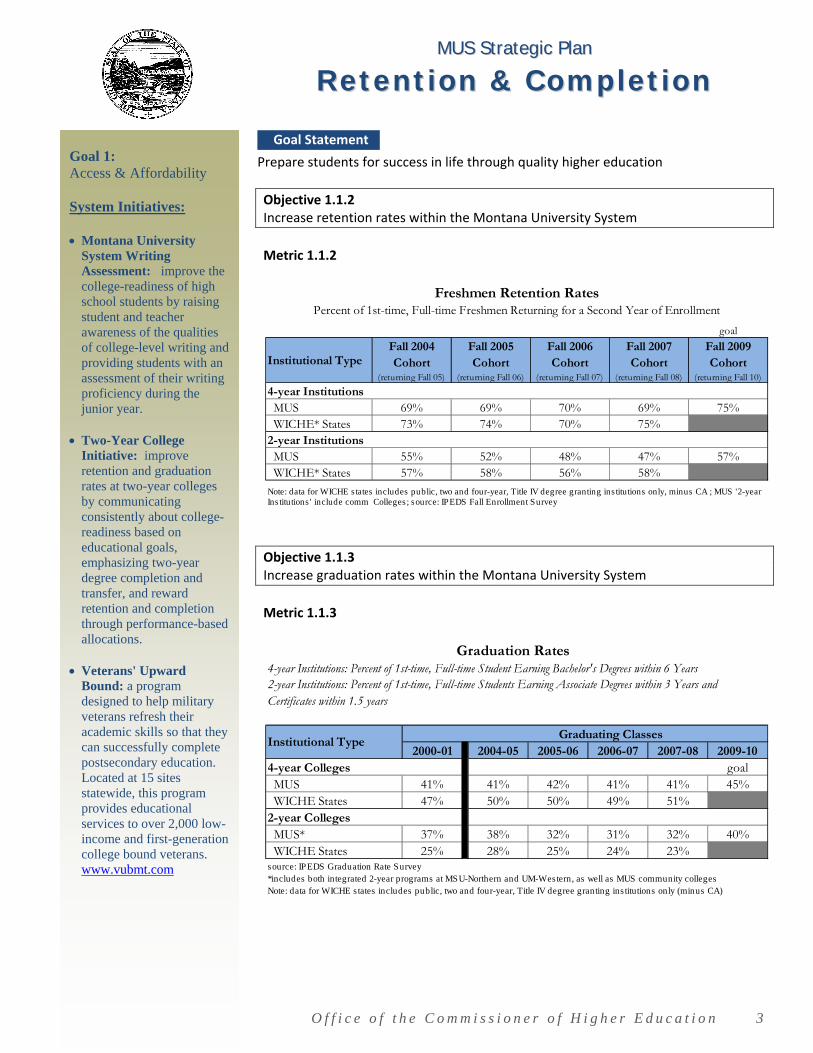
Objective 1.1.2 Increase retention rates within the Montana University System
Metric 1.1.2
Objective 1.1.3 Increase graduation rates within the Montana University System
Metric 1.1.3
goal
Institutional TypeFall 2004 Cohort
(returning Fall 05)
Fall 2005 Cohort
(returning Fall 06)
Fall 2006 Cohort
(returning Fall 07)
Fall 2007 Cohort
(returning Fall 08)
Fall 2009 Cohort
(returning Fall 10)
MUS 69% 69% 70% 69% 75% WICHE* States 73% 74% 70% 75%
MUS 55% 52% 48% 47% 57% WICHE* States 57% 58% 56% 58%
4-year Institutions
2-year Institutions
Note: data for WICHE s tates includes public, two and four-year, Title IV degree granting ins titutions only, minus CA ; MUS '2-year Ins titutions ' include comm Colleges ; source: IPEDS Fall Enrollment Survey
Freshmen Retention RatesPercent of 1st-time, Full-time Freshmen Returning for a Second Year of Enrollment
4-year Institutions: Percent of 1st-time, Full-time Student Earning Bachelor's Degrees within 6 Years
2000-01 2004-05 2005-06 2006-07 2007-08 2009-10 4-year Colleges goal MUS 41% 41% 42% 41% 41% 45% WICHE States 47% 50% 50% 49% 51%2-year Colleges MUS* 37% 38% 32% 31% 32% 40% WICHE States 25% 28% 25% 24% 23%source: IPEDS Graduation Rate Survey*includes both integrated 2-year programs at MSU-Northern and UM-Western, as well as MUS community collegesNote: data for WICHE s tates includes public, two and four-year, Title IV degree granting ins titutions only (minus CA)
2-year Institutions: Percent of 1st-time, Full-time Students Earning Associate Degrees within 3 Years and Certificates within 1.5 years
Institutional Type Graduating Classes
Graduation Rates
Goal Statement
Goal 1: Access & Affordability System Initiatives: Montana University
System Writing Assessment: improve the college-readiness of high school students by raising student and teacher awareness of the qualities of college-level writing and providing students with an assessment of their writing proficiency during the junior year.
Two-Year College
Initiative: improve retention and graduation rates at two-year colleges by communicating consistently about college-readiness based on educational goals, emphasizing two-year degree completion and transfer, and reward retention and completion through performance-based allocations.
Veterans' Upward
Bound: a program designed to help military veterans refresh their academic skills so that they can successfully complete postsecondary education. Located at 15 sites statewide, this program provides educational services to over 2,000 low-income and first-generation college bound veterans. www.vubmt.com

O f f i c e o f t h e C o m m i s s i o n e r o f H i g h e r E d u c a t i o n 4
MMUUSS SSttrraatteeggiicc PPllaann
FFiinnaanncciiaall AAiidd
Make higher education more affordable by offering more need‐based financial aid and scholarships
Objective 1.2.1 Reduce the amount of unmet student need for financial aid
Metric 1.2.1
Objective 1.2.2 Increase the percentage of students who receive financial aid or scholarships
Metric 1.2.2
Objective 1.2.3 Increase the average aid/scholarship award amount
Metric 1.2.3
2006-07 2008-09
Cost of Attendance 15,500 16,398 - (minus)Expected Family Contritution + (plus) 924 944Average Aid Awarded 4,380 3,824 = (equals)Unmet Need (remaining costs) 10,197 11,630
# of Pell recipients 6,859 6,638Total Unment Need $69,937,794 $77,196,704
Unmet Need of Students Receiving Pell GrantsMSU & UM Figures (averaged)
(note: Pell serves as low-income, need-based indicator)
MUS Region Avg MUS Region Avg MUS Region Avg
2003-04 36% 29% 23% 22% 31% 31%
2007-08 31% 27% 22% 26% 30% 35%
Federal Grants & Scholarships
State & Local Grants & Scholarships
Institutional Grants & Scholarships
Percentage of First-time, Full-time Students Receiving Financial Aid
Academic Year
MUS Region Avg MUS Region Avg MUS Region Avg
2003-04 $2,983 $2,865 $1,683 $1,345 $1,837 $1,500
2007-08 $3,230 $3,189 $1,900 $1,692 $2,896 $1,844source: IPEDS S tudent Financial Aid; note: regional average = WICHE s tates minus CA
Average Aid Awarded to First-time, Full-time Students
Academic Year
Federal Grants & Scholarships
State & Local Grants & Scholarships
Institutional Grants & Scholarships
Goal Statement
Goal 1: Access & Affordability
State Funded Need-based Aid Programs:
Montana Tuition Assistance Program (MTAP) – Baker Grants Program consists of State
and Federal (SLEAP) dollars
Allocations based on FTE MUS, Community
Colleges, and Tribal Colleges receive funds
SLEAP program requires minimum of $2 state match for every $1 Federal.
Montana Higher Education Grant (MHEG) Program consists of State
and Federal (LEAP) dollars Allocations based on FTE MUS, Community
Colleges, and Tribal Colleges receive funds
LEAP program requires minimum of $1 state match for every $1 Federal.
State Work Study Allocations based on FTE
(adjustments made depending on campuses ability to use funds)
MUS and Community Colleges receive funds
State SEOG Match Allocations based on
campuses Federal SEOG allocations
$1 State for every $3 Federal
MUS and Community Colleges receive funds
Perkins Loan Allocations based on
former Federal matching requirements
UM-Missoula, MSU-Bozeman, MSU-Billings, and MT Tech receive funds
O f f i c e o f t h e C o m m i s s i o n e r o f H i g h e r E d u c a t i o n 5
MMUUSS SSttrraatteeggiicc PPllaann
AAffffoorrddaabbii ll ii ttyy
Promote postsecondary education affordability
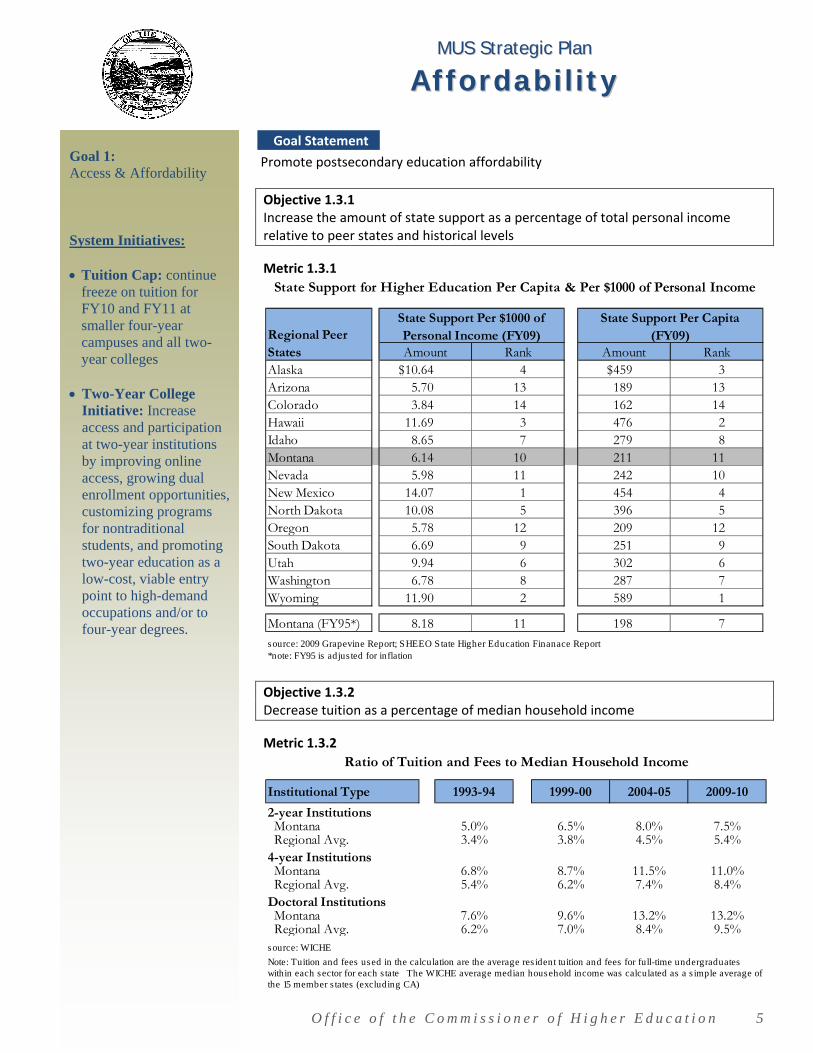
Objective 1.3.1 Increase the amount of state support as a percentage of total personal income relative to peer states and historical levels
Metric 1.3.1
Objective 1.3.2 Decrease tuition as a percentage of median household income
Metric 1.3.2
Amount Rank Amount RankAlaska $10.64 4 $459 3Arizona 5.70 13 189 13Colorado 3.84 14 162 14Hawaii 11.69 3 476 2Idaho 8.65 7 279 8Montana 6.14 10 211 11Nevada 5.98 11 242 10New Mexico 14.07 1 454 4North Dakota 10.08 5 396 5Oregon 5.78 12 209 12South Dakota 6.69 9 251 9Utah 9.94 6 302 6Washington 6.78 8 287 7Wyoming 11.90 2 589 1 Montana (FY95*) 8.18 11 198 7
source: 2009 Grapevine Report; SHEEO State Higher Education Finanace Report *note: FY95 is adjus ted for inflation
Regional Peer States
State Support Per Capita (FY09)
State Support Per $1000 of Personal Income (FY09)
State Support for Higher Education Per Capita & Per $1000 of Personal Income
Institutional Type 1993-94 1999-00 2004-05 2009-10
Montana 5.0% 6.5% 8.0% 7.5% Regional Avg. 3.4% 3.8% 4.5% 5.4%
Montana 6.8% 8.7% 11.5% 11.0% Regional Avg. 5.4% 6.2% 7.4% 8.4%
Montana 7.6% 9.6% 13.2% 13.2% Regional Avg. 6.2% 7.0% 8.4% 9.5%source: WICHE
2-year Institutions
4-year Institutions
Doctoral Institutions
Note: Tuition and fees used in the calculation are the average res ident tuition and fees for full-time undergraduates within each sector for each s tate The WICHE average median household income was calculated as a s imple average of the 15 member s tates (excluding CA)
Ratio of Tuition and Fees to Median Household Income
Goal Statement
Goal 1: Access & Affordability System Initiatives: Tuition Cap: continue
freeze on tuition for FY10 and FY11 at smaller four-year campuses and all two-year colleges
Two-Year College
Initiative: Increase access and participation at two-year institutions by improving online access, growing dual enrollment opportunities, customizing programs for nontraditional students, and promoting two-year education as a low-cost, viable entry point to high-demand occupations and/or to four-year degrees.

O f f i c e o f t h e C o m m i s s i o n e r o f H i g h e r E d u c a t i o n 6
MMUUSS SSttrraatteeggiicc PPllaann
KK--2200 CCooll llaabboorraattiioonn
Work collaboratively with the K‐12 education system to increase high school academic preparedness, completion, and concurrent enrollment programs
Objective 1.4.1 Expand outreach to at‐risk and disadvantaged students as to the importance and accessibility of postsecondary education and the quality of the MUS
Metric 1.4.1
Objective 1.4.2 Expand outreach to top academic achievers graduating from Montana high schools
Metric 1.4.2
Objective 1.4.3 Increase dual enrollment and advanced placement programs
Metric 1.4.3
At-Risk & Disadvantaged Students
Fall 2003
Fall 2004
Fall 2005
Fall 2006
Fall 2007
Fall 2008
Fall 2009
% of Freshmen, Racial/Ethnic Minorities
5.7% 6.1% 6.0% 6.5% 7.8% 7.5% 8.1%
% of Freshmen from Low-Income Families*source: MUS High School Follow-up Report
*s tudents receiving Pell grants
At-risk & Disadvantaged Student Enrollment in the MUS% of MT High School Graduates Entering the MUS from Low-income Families/Minorities
ACT Test TakersFall 2003
Fall 2004
Fall 2005
Fall 2006
Fall 2007
Fall 2008
Fall 2009
% of Freshmen scoring in top quartile*
28% 28% 29% 29% 30% 29% 29%
*score between 25-36source: MUS High School Follow-up Report, does not include CC's
Top Performing Students in the MUS% of MT High School Graduates Entering the MUS with ACT Scores in the Top Quartile*
MT High School Students2004-05 (Fall 04)
2005-06 (Fall 05)
2006-07 (Fall 06)
2007-08 (Fall 07)
2008-09 (Fall 08)
# taking AP Exam 2,189 2,204 2,469 2,623 2,650
# enrolled in at least one college course in MUS*
439 616 576 613 746
source: College Board, S tate Report; MUS Data Warehouse (does not include CC enrollments )*freshmen early admits , admit_code = 'FE', includes CC's (execpt DCC)
Advance Placement Testing and Early College Enrollment# of MT High School Students Taking AP Exams and Colleges Courses
Goal Statement
Goal 1: Access & Affordability System Initiatives:
Perkins/Tech Prep: in collaboration with OPI, K-12 school districts, two-year colleges, and business and industry, develop and promote sequential curriculum providing high school students with a clear, non-duplicative pathway from high school to two-year colleges and/or careers.
Montana University System Writing Assessment: improve the college-readiness of high school students by raising student and teacher awareness of the qualities of college-level writing and providing students with an assessment of their writing proficiency during the junior year.
Montana Education Talent Search: offers services to ensure that students complete high school and successfully enter college or vocational school. Talent Search is one of the federal TRIO programs (Talent Search, Upward Bound, Student Support Services) funded by the U.S. Department of Education and administered by the Commissioner of Higher Education since 1979. The program director at OCHE supervises coordinators who provide educational outreach to over 1,200, primarily American Indian, students at 32 junior and senior high schools in five target areas throughout Montana.
Data coming soon
O f f i c e o f t h e C o m m i s s i o n e r o f H i g h e r E d u c a t i o n 7
MMUUSS SSttrraatteeggiicc PPllaann
TTwwoo--YYeeaarr EEdduuccaattiioonn
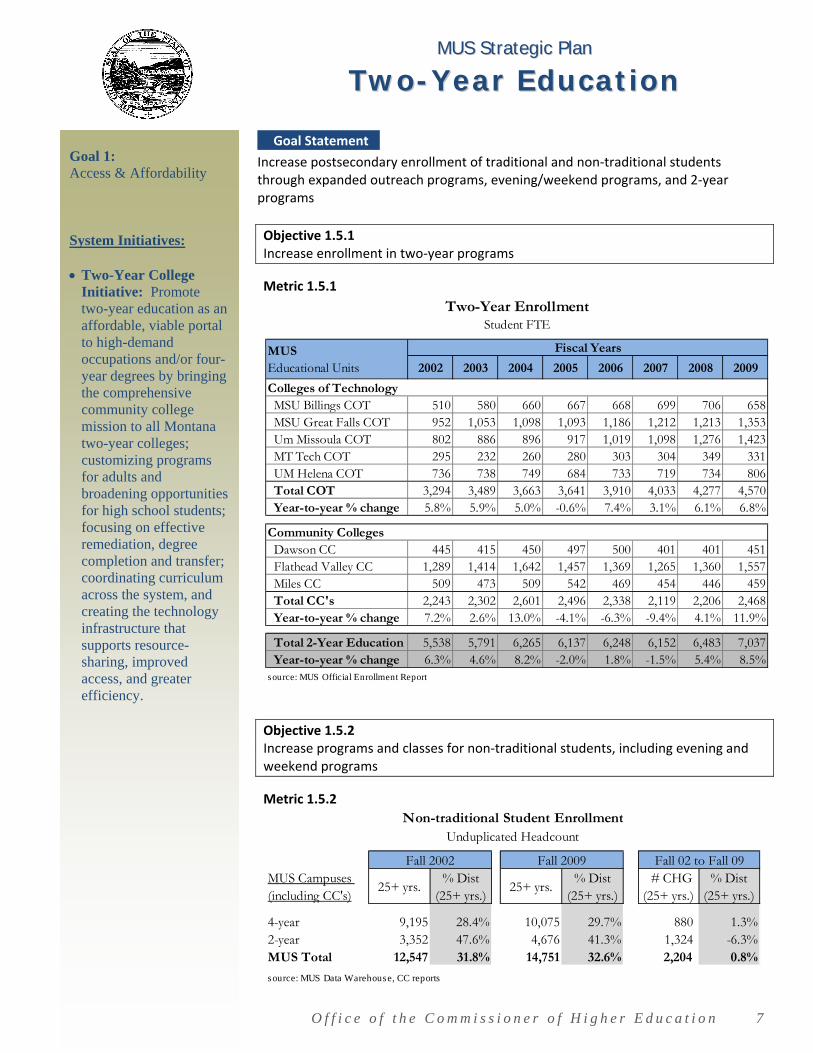
Increase postsecondary enrollment of traditional and non‐traditional students through expanded outreach programs, evening/weekend programs, and 2‐year programs
Objective 1.5.1 Increase enrollment in two‐year programs
Metric 1.5.1
Objective 1.5.2 Increase programs and classes for non‐traditional students, including evening and weekend programs
Metric 1.5.2
2002 2003 2004 2005 2006 2007 2008 2009
MSU Billings COT 510 580 660 667 668 699 706 658 MSU Great Falls COT 952 1,053 1,098 1,093 1,186 1,212 1,213 1,353 Um Missoula COT 802 886 896 917 1,019 1,098 1,276 1,423 MT Tech COT 295 232 260 280 303 304 349 331 UM Helena COT 736 738 749 684 733 719 734 806 Total COT 3,294 3,489 3,663 3,641 3,910 4,033 4,277 4,570 Year-to-year % change 5.8% 5.9% 5.0% -0.6% 7.4% 3.1% 6.1% 6.8%
Dawson CC 445 415 450 497 500 401 401 451 Flathead Valley CC 1,289 1,414 1,642 1,457 1,369 1,265 1,360 1,557 Miles CC 509 473 509 542 469 454 446 459 Total CC's 2,243 2,302 2,601 2,496 2,338 2,119 2,206 2,468 Year-to-year % change 7.2% 2.6% 13.0% -4.1% -6.3% -9.4% 4.1% 11.9%
Total 2-Year Education 5,538 5,791 6,265 6,137 6,248 6,152 6,483 7,037 Year-to-year % change 6.3% 4.6% 8.2% -2.0% 1.8% -1.5% 5.4% 8.5%source: MUS Official Enrollment Report
MUS Educational Units
Fiscal Years
Colleges of Technology
Community Colleges
Two-Year EnrollmentStudent FTE
25+ yrs.% Dist
(25+ yrs.)25+ yrs.
% Dist (25+ yrs.)
# CHG (25+ yrs.)
% Dist (25+ yrs.)
4-year 9,195 28.4% 10,075 29.7% 880 1.3%2-year 3,352 47.6% 4,676 41.3% 1,324 -6.3%MUS Total 12,547 31.8% 14,751 32.6% 2,204 0.8%
source: MUS Data Warehouse, CC reports
Fall 2002 Fall 2009 Fall 02 to Fall 09MUS Campuses (including CC's)
Non-traditional Student EnrollmentUnduplicated Headcount
Goal Statement
Goal 1: Access & Affordability System Initiatives: Two-Year College
Initiative: Promote two-year education as an affordable, viable portal to high-demand occupations and/or four-year degrees by bringing the comprehensive community college mission to all Montana two-year colleges; customizing programs for adults and broadening opportunities for high school students; focusing on effective remediation, degree completion and transfer; coordinating curriculum across the system, and creating the technology infrastructure that supports resource-sharing, improved access, and greater efficiency.

O f f i c e o f t h e C o m m i s s i o n e r o f H i g h e r E d u c a t i o n 8
MMUUSS SSttrraatteeggiicc PPllaann
DDiissttaannccee LLeeaarrnniinngg
Improve distance and on‐line learning by coordinating online delivery of education across the entire Montana University System
Objective 1.6.1 Increase student enrollment in online courses
Metric 1.6.1
Objective 1.6.2 Increase the number of online courses and degrees
Metric 1.6.2
2,1312,789
3,6124,030 3,947
4,602
5,7786,609
7,242
6%
17%
0%
5%
10%
15%
20%
25%
30%
0
1000
2000
3000
4000
5000
6000
7000
8000
Fall 2001
Fall 2002
Fall 2003
Fall 2004
Fall 2005
Fall 2006
Fall 2007
Fall 2008
Fall 2009
MUS Enrollment in Distance Learning* Courses Unduplicated Headcount - enrollment in at least one distance learning course
Distance Learning Headcount
% of Total MUS Headcount
Goal Statement
Goal 1: Access & Affordability System Initiatives: MMUUSS DDiissttaannccee LLeeaarrnniinngg IInnitiiaatiivee:
In the 2005 and 2007 legislative sessions, the Montana Legislature appropriated funds specifically aimed at increasing the availability of distance learning in the Montana University System. With these funds ($300,000 in 2005, $900,000 in 2007) the university system invested in distance learning resources, faculty, and infrastructure. As a result, Montana universities and colleges now offer more than 70 online degrees and nearly 500 internet classes. MUS.edu/online is a central location for students, faculty, and the public to find information on distance education opportunities and topics in the MUS.
MUS On-line Degree & Certificate Programs: www.mus.edu/online/Degrees/index.asp Faculty development webinars for on-line teaching: www.mus.edu/online/webinars.asp
MUS CampusFall 2001
Fall 2002
Fall 2003
Fall 2004
Fall 2005
Fall 2006
Fall 2007
Fall 2008
Fall 2009
2-year 39 58 82 95 103 143 156 165 1774-year 93 153 208 243 239 254 315 328 359MUS Total 132 211 290 338 342 397 471 493 536Annual % Chg 59.8% 37.4% 16.6% 1.2% 16.1% 18.6% 4.7% 8.7%source: MUS Data Warehouse, does not include CC's
Number of Distance Learning Courses OfferedFall 2001 - Fall 2009, Unduplicated Number of Courses Offered
source: MUS Data Warehouse, does not include CC’s *courses where instruction is delivered entirely outside of the traditional classroom setting and there is no “in-person” contact between student and teacher; source: MUS data warehouse
O f f i c e o f t h e C o m m i s s i o n e r o f H i g h e r E d u c a t i o n 9
MMUUSS SSttrraatteeggiicc PPllaann
WWoorrkkffoorrccee DDeevveellooppmmeenntt
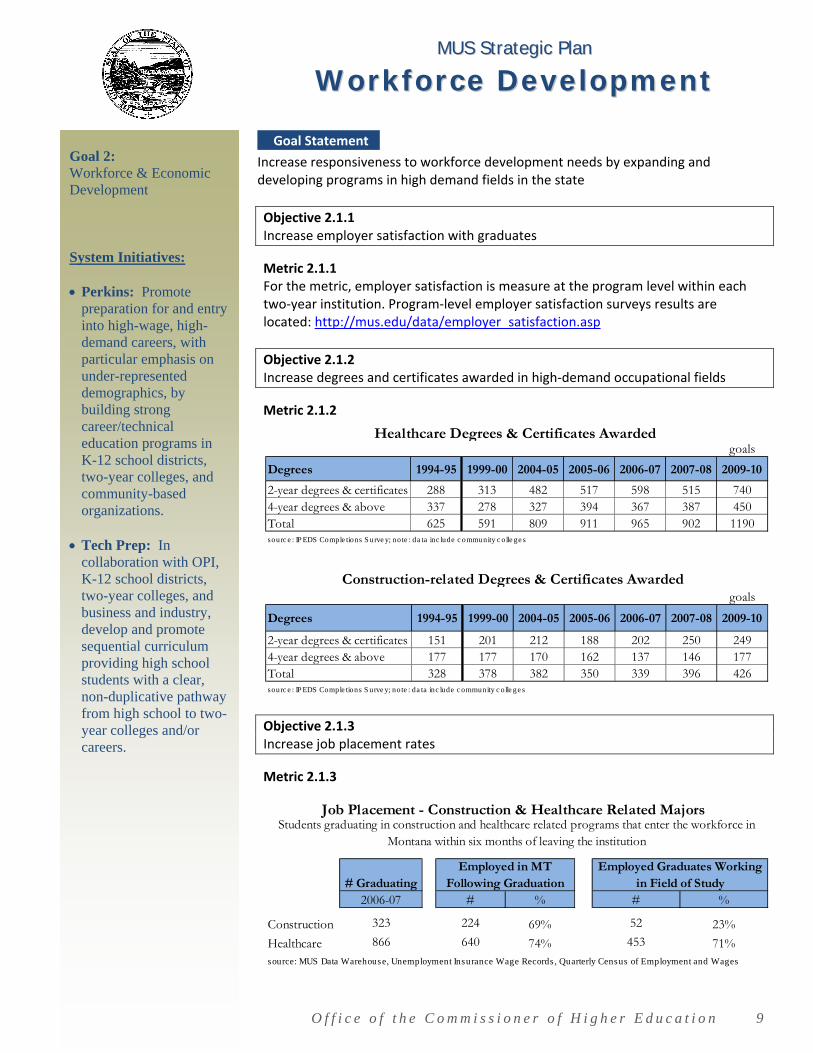
Increase responsiveness to workforce development needs by expanding and developing programs in high demand fields in the state
Objective 2.1.1 Increase employer satisfaction with graduates
Metric 2.1.1 For the metric, employer satisfaction is measure at the program level within each two‐year institution. Program‐level employer satisfaction surveys results are located: http://mus.edu/data/employer satisfaction.asp
Objective 2.1.2 Increase degrees and certificates awarded in high‐demand occupational fields
Metric 2.1.2
Objective 2.1.3 Increase job placement rates
Metric 2.1.3
goals
Degrees 1994-95 1999-00 2004-05 2005-06 2006-07 2007-08 2009-10
2-year degrees & certificates 288 313 482 517 598 515 7404-year degrees & above 337 278 327 394 367 387 450Total 625 591 809 911 965 902 1190sourc e : IP EDS Comple tions S urve y; note : da ta inc lude c ommunity c olle ge s
Healthcare Degrees & Certificates Awarded
goals
Degrees 1994-95 1999-00 2004-05 2005-06 2006-07 2007-08 2009-10
2-year degrees & certificates 151 201 212 188 202 250 2494-year degrees & above 177 177 170 162 137 146 177Total 328 378 382 350 339 396 426sourc e : IP EDS Comple tions S urve y; note : da ta inc lude c ommunity c olle ge s
Construction-related Degrees & Certificates Awarded
# Graduating2006-07 # % # %
Construction 323 224 69% 52 23%
Healthcare 866 640 74% 453 71%source: MUS Data Warehouse, Unemployment Insurance Wage Records , Quarterly Census of Employment and Wages
Employed in MT Following Graduation
Employed Graduates Working in Field of Study
Job Placement - Construction & Healthcare Related Majors Students graduating in construction and healthcare related programs that enter the workforce in
Montana within six months of leaving the institution
Goal Statement
Goal 2: Workforce & Economic Development System Initiatives: Perkins: Promote
preparation for and entry into high-wage, high-demand careers, with particular emphasis on under-represented demographics, by building strong career/technical education programs in K-12 school districts, two-year colleges, and community-based organizations.
Tech Prep: In
collaboration with OPI, K-12 school districts, two-year colleges, and business and industry, develop and promote sequential curriculum providing high school students with a clear, non-duplicative pathway from high school to two-year colleges and/or careers.

O f f i c e o f t h e C o m m i s s i o n e r o f H i g h e r E d u c a t i o n 1 0
MMUUSS SSttrraatteeggiicc PPllaann
WWoorrkkffoorrccee DDeevveellooppmmeenntt (Continued)
Increase responsiveness to workforce development needs by expanding and developing programs in high demand fields in the state
Objective 2.1.4 Increase the number of certificates and degrees conferred in 2‐year programs
Metric 2.1.4
goal Institutional Type
1999-00
2000-01
2001-02
2002-03
2003-04
2004-05
2005-06
2006-07
2007-08
2009-10
Colleges of
Technology1 632 674 687 764 800 772 782 837 832
Community Colleges
450 392 408 448 511 523 497 345 355
Integrated 2-year
Programs2 153 145 148 188 175 166 148 139 122
Total 1235 1211 1243 1400 1486 1461 1427 1321 1309 1570
% Change (annual) -1.9% 2.6% 12.6% 6.1% -1.7% -2.3% -7.4% -0.9%
goal Institutional Type
1999-00
2000-01
2001-02
2002-03
2003-04
2004-05
2005-06
2006-07
2007-08
2009-10
Colleges of
Technology1 239 168 127 140 122 138 167 266 281
Community Colleges 33 18 20 36 132 54 107 49 64
Integrated 2-year
Programs2 - - - - - - 2 6 9
Total 272 186 147 176 254 192 276 321 354 304
% Change (annual) -31.6% -21.0% 19.7% 44.3% -24.4% 43.8% 16.3% 10.3%
Notes
source: IPEDS Completions Survey
Associate Degrees ConferredAssociate of Applied Science, Associate of Arts, & Associate of Science, 1999-00 to 2007-08
Certificates ConferredCertificates of Achievement Below the Baccalaureate Level, 1999-00 to 2007-08
1) includes associate degrees conferred at MT Tech & MSUB2) UM-Western & MSU-Northern
Goal Statement
Goal 2: Workforce & Economic Development System Initiatives: Montana Career
Information System: In collaboration with the Student Assistance Foundation, OPI, and the Department of Labor, raise career awareness and promote career/technical education for both traditional and nontraditional students through a dynamic, online program depicting job opportunities in Montana, assessing skills and interest, and providing curriculum counseling.
Two-Year College Initiative: Promote two-year education as a cost-effective, high-quality portal to high-demand, high-wage careers by establishing regional workforce response teams comprised of business and industry leaders, economic development organizations, K-12 school districts and local two-year colleges.
O f f i c e o f t h e C o m m i s s i o n e r o f H i g h e r E d u c a t i o n 1 1
MMUUSS SSttrraatteeggiicc PPllaann
RReesseeaarrcchh && DDeevveellooppmmeenntt
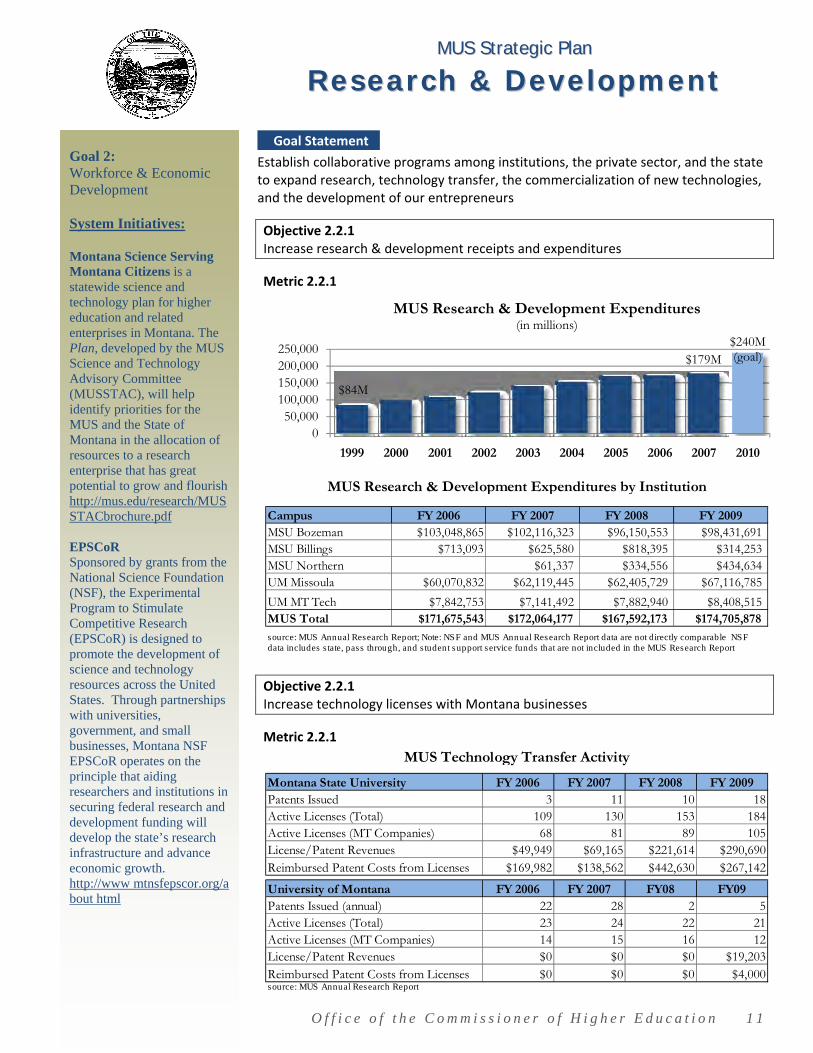
Establish collaborative programs among institutions, the private sector, and the state to expand research, technology transfer, the commercialization of new technologies, and the development of our entrepreneurs
Objective 2.2.1 Increase research & development receipts and expenditures
Metric 2.2.1
Objective 2.2.1 Increase technology licenses with Montana businesses
Metric 2.2.1
$84M
$179M$240M(goal)
050,000
100,000150,000200,000250,000
1999 2000 2001 2002 2003 2004 2005 2006 2007 2010
MUS Research & Development Expenditures(in millions)
Campus FY 2006 FY 2007 FY 2008 FY 2009MSU Bozeman $103,048,865 $102,116,323 $96,150,553 $98,431,691MSU Billings $713,093 $625,580 $818,395 $314,253MSU Northern $61,337 $334,556 $434,634UM Missoula $60,070,832 $62,119,445 $62,405,729 $67,116,785
UM MT Tech $7,842,753 $7,141,492 $7,882,940 $8,408,515MUS Total $171,675,543 $172,064,177 $167,592,173 $174,705,878
MUS Research & Development Expenditures by Institution
source: MUS Annual Research Report; Note: NSF and MUS Annual Research Report data are not directly comparable NSF data includes s tate, pass through, and s tudent support service funds that are not included in the MUS Research Report
Montana State University FY 2006 FY 2007 FY 2008 FY 2009Patents Issued 3 11 10 18Active Licenses (Total) 109 130 153 184Active Licenses (MT Companies) 68 81 89 105License/Patent Revenues $49,949 $69,165 $221,614 $290,690 Reimbursed Patent Costs from Licenses $169,982 $138,562 $442,630 $267,142
University of Montana FY 2006 FY 2007 FY08 FY09Patents Issued (annual) 22 28 2 5Active Licenses (Total) 23 24 22 21Active Licenses (MT Companies) 14 15 16 12License/Patent Revenues $0 $0 $0 $19,203 Reimbursed Patent Costs from Licenses $0 $0 $0 $4,000 source: MUS Annual Research Report
MUS Technology Transfer Activity
Goal Statement
Goal 2: Workforce & Economic Development System Initiatives: Montana Science Serving Montana Citizens is a statewide science and technology plan for higher education and related enterprises in Montana. The Plan, developed by the MUS Science and Technology Advisory Committee (MUSSTAC), will help identify priorities for the MUS and the State of Montana in the allocation of resources to a research enterprise that has great potential to grow and flourish http://mus.edu/research/MUSSTACbrochure.pdf EPSCoR Sponsored by grants from the National Science Foundation (NSF), the Experimental Program to Stimulate Competitive Research (EPSCoR) is designed to promote the development of science and technology resources across the United States. Through partnerships with universities, government, and small businesses, Montana NSF EPSCoR operates on the principle that aiding researchers and institutions in securing federal research and development funding will develop the state’s research infrastructure and advance economic growth. http://www mtnsfepscor.org/about html
O f f i c e o f t h e C o m m i s s i o n e r o f H i g h e r E d u c a t i o n 1 2
MMUUSS SSttrraatteeggiicc PPllaann
GGrraadduuaattee EEdduuccaattiioonn
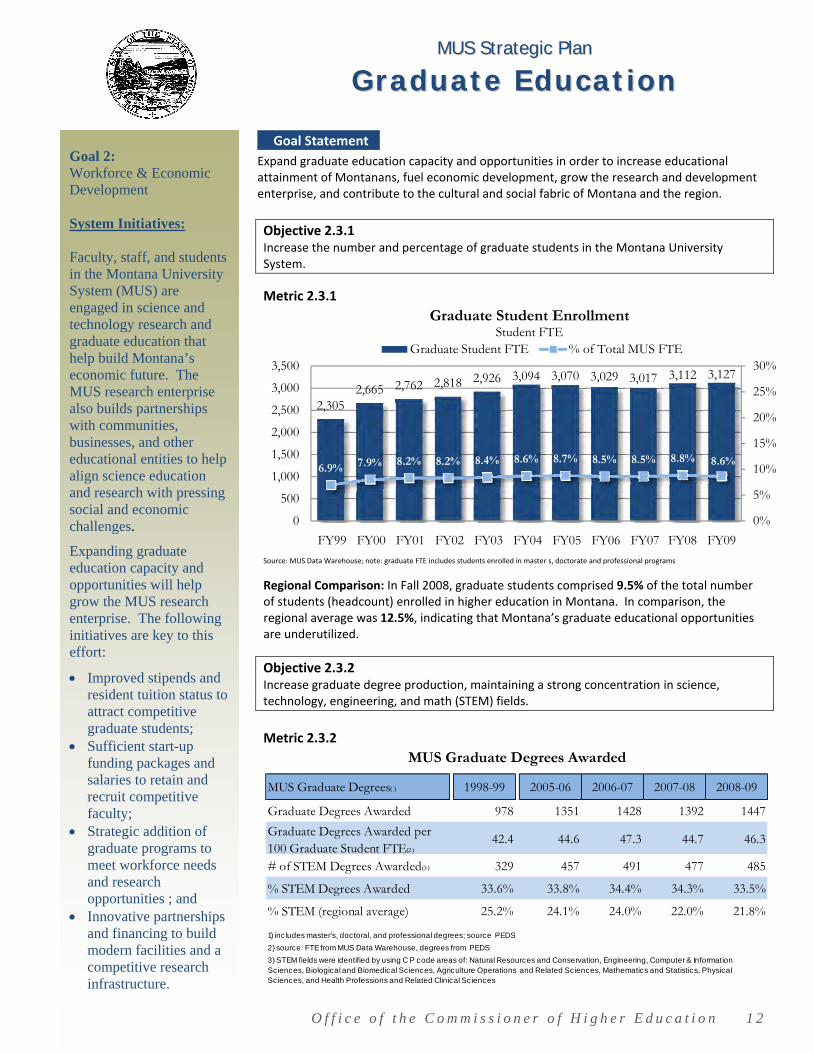
Expand graduate education capacity and opportunities in order to increase educational attainment of Montanans, fuel economic development, grow the research and development enterprise, and contribute to the cultural and social fabric of Montana and the region.
Objective 2.3.1 Increase the number and percentage of graduate students in the Montana University System.
Metric 2.3.1
Source: MUS Data Warehouse; note: graduate FTE includes students enrolled in master s, doctorate and professional programs
Regional Comparison: In Fall 2008, graduate students comprised 9.5% of the total number of students (headcount) enrolled in higher education in Montana. In comparison, the regional average was 12.5%, indicating that Montana’s graduate educational opportunities are underutilized.
Objective 2.3.2 Increase graduate degree production, maintaining a strong concentration in science, technology, engineering, and math (STEM) fields.
Metric 2.3.2
2,3052,665 2,762 2,818 2,926 3,094 3,070 3,029 3,017 3,112 3,127
6.9% 7.9% 8.2% 8.2% 8.4% 8.6% 8.7% 8.5% 8.5% 8.8% 8.6%
0%
5%
10%
15%
20%
25%
30%
0
500
1,000
1,500
2,000
2,500
3,000
3,500
FY99 FY00 FY01 FY02 FY03 FY04 FY05 FY06 FY07 FY08 FY09
Graduate Student Enrollment Student FTE
Graduate Student FTE % of Total MUS FTE
MUS Graduate Degrees( ) 1998-99 2005-06 2006-07 2007-08 2008-09
Graduate Degrees Awarded 978 1351 1428 1392 1447
Graduate Degrees Awarded per 100 Graduate Student FTE(2 )
42.4 44.6 47.3 44.7 46.3
# of STEM Degrees Awarded(3 ) 329 457 491 477 485
% STEM Degrees Awarded 33.6% 33.8% 34.4% 34.3% 33.5%
% STEM (regional average) 25.2% 24.1% 24.0% 22.0% 21.8%
1) inc ludes master's, doctoral, and professional degrees; source PEDS
2) source: FTE from MUS Data Warehouse, degrees from PEDS
MUS Graduate Degrees Awarded
3) STEM fields were identified by using C P code areas of: Natural Resources and Conservation, Engineering, Computer & Information Sciences, Biological and Biomedical Sciences, Agriculture Operations and Related Sciences, Mathematics and Statistics, Physical Sciences, and Health Professions and Related Clinical Sciences
Goal Statement
Goal 2: Workforce & Economic Development System Initiatives: Faculty, staff, and students in the Montana University System (MUS) are engaged in science and technology research and graduate education that help build Montana’s economic future. The MUS research enterprise also builds partnerships with communities, businesses, and other educational entities to help align science education and research with pressing social and economic challenges.
Expanding graduate education capacity and opportunities will help grow the MUS research enterprise. The following initiatives are key to this effort:
Improved stipends and resident tuition status to attract competitive graduate students;
Sufficient start-up funding packages and salaries to retain and recruit competitive faculty;
Strategic addition of graduate programs to meet workforce needs and research opportunities ; and
Innovative partnerships and financing to build modern facilities and a competitive research infrastructure.
O f f i c e o f t h e C o m m i s s i o n e r o f H i g h e r E d u c a t i o n 1 3
MMUUSS SSttrraatteeggiicc PPllaann
IInnffoorrmmaattiioonn TTeecchhnnoollooggyy
Improve the accuracy, consistency and accessibility of system data, including the continued development of a comprehensive data warehouse
IT Strategic Directions In order to meet the three primary goals outlined in the Board of Regents’ Strategic Plan, the Montana University System will strive to implement the following Information Technology Strategic Directions:
1. Enterprise Information Systems
Develop an integrated information system with the goal of maximizing administrative efficiencies, allowing for seamless student enrollment between campuses, and promoting consistent business practices across all institutions.
Assumptions: The MUS will continue to make incremental steps toward developing a single
integrated information system. Incremental steps include, but are not limited to, the following:
o Utilizing a single instance of the administrative information software that is hosted and managed by the main campus on each side of the system (i.e. UM and MSU host a single instance of Banner for their affiliated campuses, with the potential for including the community colleges, as well as tribal colleges).
o Allowing for multi-institutional functionality to enable (for example): enrollments from more than one campus on students’ schedules and transcripts, financial aid based on combined enrollment at more than one institution, centralized administrative services, such as, a single source for payroll generation.
o Standardizing codes and data elements, as well as aligning business rules and practices.
2. Network Connectivity
Continue to develop and improve an education network that provides high speed telecommunication capabilities that link MUS institutions, provide connectivity to national research and education networks, and expand the reach of the MUS to remote areas of Montana.
3. Data Warehousing
Maintain and work to improve a system-wide data warehouse for the purpose of measuring the goals in Board of Regents’ Strategic Plan, collecting and reporting official enrollment, developing linkages with K-12 and workforce data, and producing and monitoring the MUS Operating Budget.
Goal Statement
Goal 3: Efficiency & Effectiveness System Initiatives: CC Banner
Integration: integrate Dawson Community College and Miles Community College into University of Montana hosted instance of Banner
MSU Unified
Information System Project: establish a single, unified and standardized information system, based on standardized policies, procedures, data elements and calendars for all campuses and agencies of MSU
Northern Tier
Network: operate and maintain a state-of-the-art network which provides high speed connections between campuses, as well as connections to national research and education networks.
K-20 Data Linkage:
develop linkages between K-12, postsecondary, and labor information in order to produce a method for annually tracking student cohorts from high school to college to the workforce.
O f f i c e o f t h e C o m m i s s i o n e r o f H i g h e r E d u c a t i o n 1 4
MMUUSS SSttrraatteeggiicc PPllaann
EEffff iicciieennccyy
Deliver efficient and coordinated services
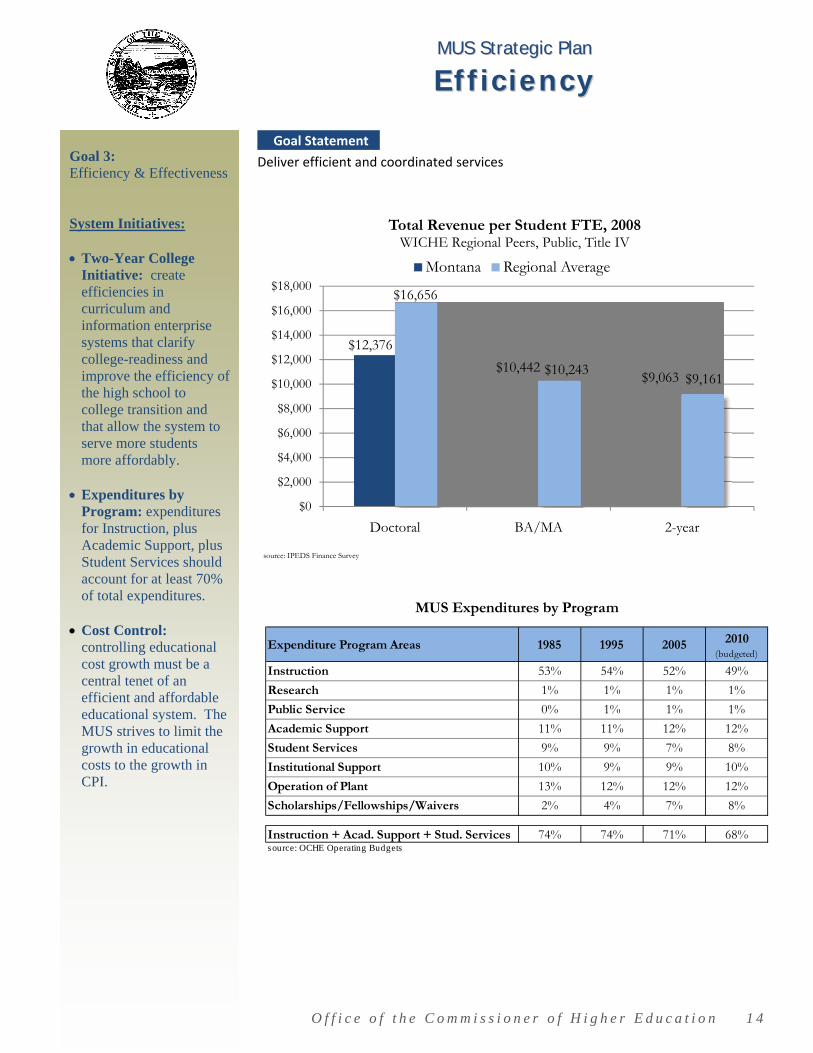
source: IPEDS Finance Survey
$12,376
$10,442$9,063
$16,656
$10,243$9,161
$0
$2,000
$4,000
$6,000
$8,000
$10,000
$12,000
$14,000
$16,000
$18,000
Doctoral BA/MA 2-year
Total Revenue per Student FTE, 2008 WICHE Regional Peers, Public, Title IV
Montana Regional Average
Expenditure Program Areas 1985 1995 2005 2010 (budgeted)
Instruction 53% 54% 52% 49%
Research 1% 1% 1% 1%
Public Service 0% 1% 1% 1%
Academic Support 11% 11% 12% 12%
Student Services 9% 9% 7% 8%
Institutional Support 10% 9% 9% 10%
Operation of Plant 13% 12% 12% 12%
Scholarships/Fellowships/Waivers 2% 4% 7% 8%
Instruction + Acad. Support + Stud. Services 74% 74% 71% 68%source: OCHE Operating Budgets
MUS Expenditures by Program
Goal Statement
Goal 3: Efficiency & Effectiveness System Initiatives: Two-Year College
Initiative: create efficiencies in curriculum and information enterprise systems that clarify college-readiness and improve the efficiency of the high school to college transition and that allow the system to serve more students more affordably.
Expenditures by
Program: expenditures for Instruction, plus Academic Support, plus Student Services should account for at least 70% of total expenditures.
Cost Control:
controlling educational cost growth must be a central tenet of an efficient and affordable educational system. The MUS strives to limit the growth in educational costs to the growth in CPI.
O f f i c e o f t h e C o m m i s s i o n e r o f H i g h e r E d u c a t i o n 1 5
MMUUSS SSttrraatteeggiicc PPllaann
TTrraannssffeerraabbii ll iittyy
Work collaboratively with the K‐12 education system to increase high school academic preparedness, completion, and concurrent enrollment programs
Objective 3.3.1 Improve articulation and transferability among all 2‐year and 4‐ year institutions, including community colleges and tribal colleges
Metric 3.3.1 MUS Transferability Initiative – Common Course Numbering
a. All undergraduate courses in the Montana University System will go through the process of common course numbering
Benchmarks:
• 12 disciplines completed by January 1, 2009 • 10 additional disciplines completed by June 30, 2009 • All disciplines completed by June 30, 2011
b. All courses deemed to be significantly similar must possess the same prefix,
course number, title and credits; and directly transfer on a one-to-one basis
See BOR Policy 301.5.5 – Equivalent Course Identification and Numbering
c. Common course numbering will result in a transparent computerized program that demonstrates transferable courses across the university system Benchmark: Link to Common Course Numbering Transfer Guide
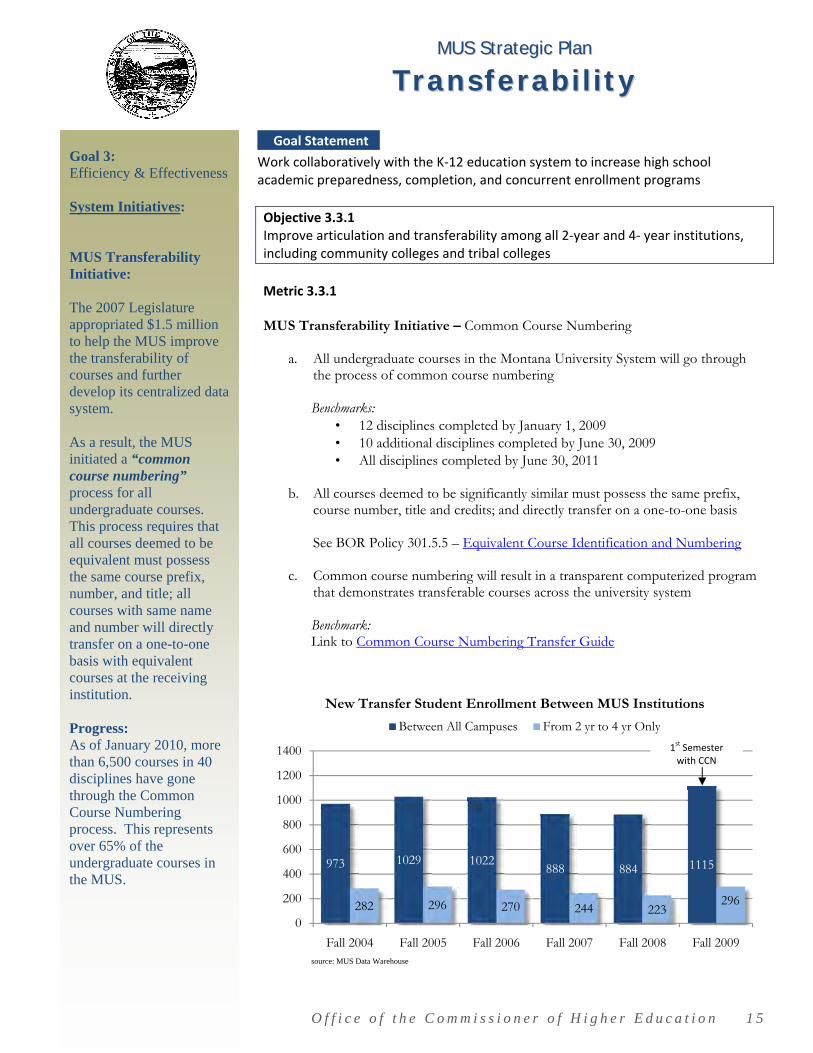
source: MUS Data Warehouse
973 1029 1022888 884 1115
282 296 270 244 223296
0
200
400
600
800
1000
1200
1400
Fall 2004 Fall 2005 Fall 2006 Fall 2007 Fall 2008 Fall 2009
New Transfer Student Enrollment Between MUS Institutions
Between All Campuses From 2 yr to 4 yr Only
Goal Statement
Goal 3: Efficiency & Effectiveness System Initiatives: MMUUSS TTrraannssffeerraabbiilliittyy IInnitiiaativee: The 2007 Legislature appropriated $1.5 million to help the MUS improve the transferability of courses and further develop its centralized data system. As a result, the MUS initiated a “common course numbering” process for all undergraduate courses. This process requires that all courses deemed to be equivalent must possess the same course prefix, number, and title; all courses with same name and number will directly transfer on a one-to-one basis with equivalent courses at the receiving institution. Progress: As of January 2010, more than 6,500 courses in 40 disciplines have gone through the Common Course Numbering process. This represents over 65% of the undergraduate courses in the MUS.
1stSemester
with CCN
O f f i c e o f t h e C o m m i s s i o n e r o f H i g h e r E d u c a t i o n 1 6
MMUUSS SSttrraatteeggiicc PPllaann
BBuuddggeett AAll llooccaattiioonn
Biennial review/update of the budget allocation model consistent with state and system policy goals and objectives Background The Montana Legislature allocates the vast majority of funding for our education units in a “lump sum” that is then allocated by the Regents to the individual institutions within the system. How these funds are allocated is central to every strategic objective of the Board. In order to achieve the goals and objectives in this strategic plan, the basic funding allocation model must be continually analyzed. To be an effective tool for achieving our strategic goals, the allocation model should, at a minimum:
Focus on financing for the state system, not only funding for the individual campuses;
Be transparent as to the policy choices of the Regents, Legislature, and executive branch;
Provide a framework for dealing with allocations to institutions, tuition revenues, financial aid, and mandatory fee waivers;
Have a specific fund dedicated to furthering Regents’ priorities;
Protect institutional viability by moderating the short-term effects of enrollment changes;
Provide incentives for institutions to collaborate as a system;
Ensure equity of funding among all institutions;
Maintain an adequate base of funding and education quality for all institutions;
Maintain a differential between 2-year and 4-year tuition.
Goal Statement
Goal 3: Efficiency & Effectiveness System Initiatives: Allocation Model
Review: the present “base plus” allocation model requires a comprehensive review/update. System goals, Regents’ priorities, enrollment changes, performance/ outcomes and incentive funding are a few of the critical issues requiring study and analysis, as we move toward a revised allocation model.