Embed Size (px)
Citation preview

Digital Village

Digital Village
“Throughout eternity, all that is of like form will come around again – everything that is the same must always return in its
own everlasting cycle.....”
• Marcus Aurelius – Emperor of Rome •
Many Economists and Economic Planners have arrived at the same conclusion - that most organisations have not yet widely adopted sophisticated Digital Technology – let alone integrated
Horizon Scanning and “Big Data Analytics” into their core Strategic Planning and Financial Management processes.....


Strategic Foresight Platform – Training & Education Modules (TEM)
Many of the challenges encountered in managing Strategic Foresight Programmes result from attempts to integrate the
multiple, divergent Future Narratives from lots of different stakeholders in the Enterprise – all with different viewpoints,
desired outcomes, goals and objectives. This may be overcome by developing a shared, common Vision of the
future state of the Digital Enterprise – along with a Roadmap to help us to plan and realise the achievement of that Vision.
Digital Village - Strategic Enterprise Management (SEM) Framework ©


• Marcus Aurelius • Emperor of Rome
• “Throughout eternity, all
that is of like form will
come around again –
everything that is the same
must always return in its
own everlasting cycle.....”
• “Look back over time, with
past empires that in their
turn rise and fall – through
changing history you may
also see the future.....”
• Marcus Aurelius followed
• Stoic Philosophy •

Stoicism – Motivation for Human Actions
Reason – logic
Human Actions
chance
reason
obsession
passion
habit
nature
delusion
desire
Human Nature – (good and evil)
altruism, heroism
curiosity, inquiry,
ignorance, malice
Desire – need, want
Passion – love, fixation
Obsession – compulsion Serendipity – randomness, chaos
Ritual, ceremony, repetition Primal Instinct–
anxiety, fear, anger, hate
Stochastic
Emotional Deterministic
Reactionary


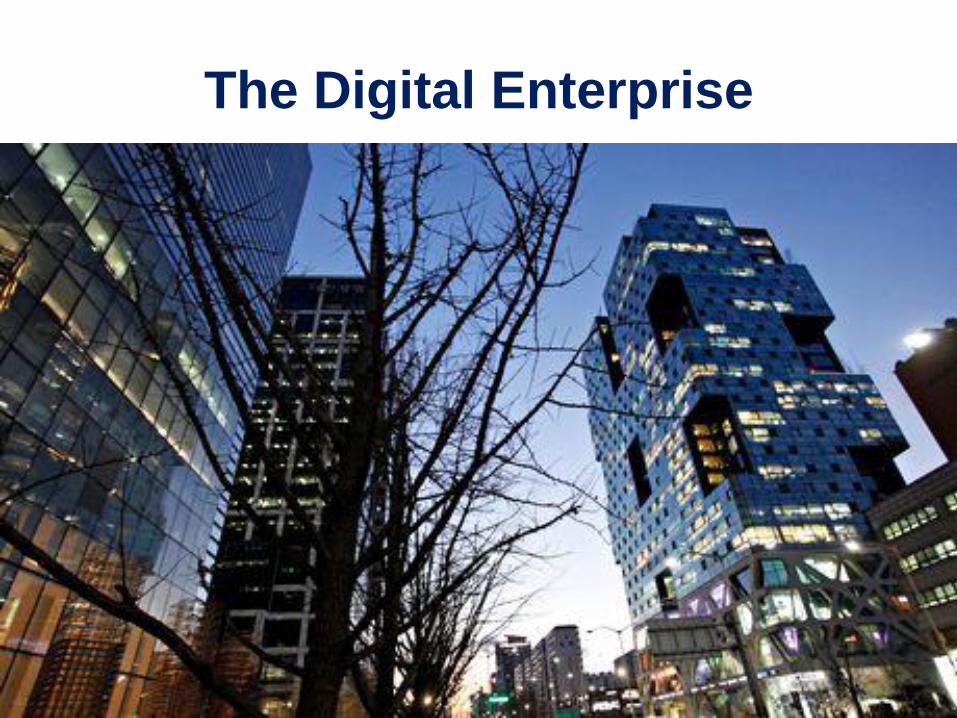
The Digital Enterprise
The Digital Enterprise • The Digital Enterprise is all about doing things better today in order to design and
build a better tomorrow - for all of our stakeholders. The Digital Enterprise is driven by
the need for rapid response to changing conditions so that we can create and
maintain a brighter future for all our stakeholders to enjoy. The Digital Enterprise
evolves from analysis, research and development into long-term Forecasting, Strategy
and Planning – ranging in scale from the formulation and shaping of Public-sector
Political, Economic and Social Policies to Private-sector Business Programmes, Work-
streams and Digital Projects for organisational change and business transformation –
enabling us to envision and achieve our desired future outcomes, goals and objectives
• Many of the challenges encountered in managing Digital Enterprise Transformation
Programmes result from attempts to integrate the multiple, divergent Future
Narratives from lots of different stakeholders in the Enterprise – all with different
viewpoints, drivers, concerns, interests and needs. This may be overcome by
developing a shared, common Vision of the future state of the Digital Enterprise –
along with a Roadmap to help us to plan and realise the achievement of that Vision.
The Digital Enterprise

The Digital Enterprise Methodology
Evaluate
Foresight
Platform
Performance
Foresight
Platform
Design
Foresight
Platform
Launch
Foresight
Enterprise
Planning
Review
Foresight
Strategy
Foresight
Platform
Growth
Enhance
Foresight
Platform
Foresight
Platform
Maturity
Foresight
Digital
Platform
Early Adopters
Migrate “Data
Consumers”
over to new
Digital Platform
Review
Foresight
Strategy
Foresight
Technology
Innovation
Digital Research and Development
Prototype / Pilot / Proof-of-concept
Benefits Realisation – Rising Star Benefits Realisation - Cash Cow
Foresight
Platform
Lifecycle
PLAN
PREPARE
EXECUTE
REVIEW

The Digital Enterprise Methodology
Foresight Planning Methodology: - • Understand business and technology environment – Business Outcomes, Goals Objectives and Needs
• Understand business and technology challenges / opportunities – Business Drivers and Requirements
• Gather the evidence to quantify the impact of those opportunities – Business Case
• Quantify the business benefits of resolving the opportunities – Benefits Realisation
• Quantify the changes need to resolve the opportunities – Business Transformation
• Understand Stakeholder Management issues – Communication Strategy
• Understand organisational constraints – Organisational Impact Analysis
• Understand technology constraints – Technology Strategy and Architecture
Foresight Delivery Methodology: - • Understand success management – Scope, Budget, Resources, Dependencies, Milestones, Timeline
• Understand achievement measures – Critical Success Factors / Key Performance Indicators / ROI
• Produce the outline supporting planning documentation - Business and Technology Roadmaps
• Complete the detailed supporting planning documentation – Programme and Project Plans
• Design the solution options to solve the challenges – Business and Solution Architectures
• Execute the preferred solution implementation – using Lean / Digital delivery techniques
• Report Actual Cost, Progress, Issues, Risks and Changes against Budget / Plan / Forecast
• Lean / Agile Delivery, Implementation and Go-live !

Advisory and Training Objectives - Plan
Digital Foresight Business Transformation
• The Digital Enterprise is all about doing things better today in order to design and build a better
tomorrow – for all of our stakeholders. The Digital Enterprise is driven by rapid response to
changing conditions so that we can create and maintain a brighter future for our stakeholders to
enjoy. The Digital Enterprise evolves from analysis, research and development into long-term
Strategy and Planning – ranging in scale from the formulation and shaping of Public-sector
Political, Economic and Social Policies to Private-sector Business Programmes, Work-streams
and Projects for organisational change and business transformation – enabling us to envision
and achieve all of our desired future outcomes, goals and objectives
Digital Foresight Planning / Preparation Methodology: -
• Understand business and technology environment – Business Outcomes, Goals, Objectives & Needs
• Understand business and technology challenges / opportunities – Business Drivers and Requirements
• Gather the evidence to quantify the impact of those opportunities – Business Case
• Quantify the business benefits of resolving the opportunities – Benefits Realisation
• Quantify the changes need to resolve the opportunities – Business Transformation
• Understand Stakeholder Management issues – Communication Strategy
• Understand organisational constraints – Organisational Impact Analysis
• Understand technology constraints – Technology Strategy and Architecture

Advisory and Training Objectives - Plan
1. Provide and Train the client Strategy and Planning Team with a comprehensive, consistent
and complete Strategic Foresight Framework which focuses on the capability to create and
maintain a useful and detailed Future Perspective and Forward View. This is supported by a
Digital Enterprise Architecture Method in order to design, deliver and support a Digital
Strategic Foresight Platform - which is illustrated and described by Architecture Models, and
documented and defined by a Reference Architecture (both Business and Technology),
Business Process Catalogue, Business Services Library and Technology Services Inventory.
2. Plan, Prepare and Deliver a series of client-focused Disruptive Technology Strategy
Discovery Workshops in order to gather and analyse high-level Business and Technology
Vision, Mission and Strategy Statements – which can be further decomposed and elaborated
into Strategy Themes, Outcomes, Goals, Objectives and Strategic (high-level) Functional
Requirement Groups. In parallel, also Plan, Prepare and Deliver a further series of Digital
Technology Innovation Workshops which catalogues and defines the high-level functional
and non-functional requirements (NFR’s) for the Digital Strategic Foresight Platform – thus
articulates the outline architecture of the Digital Technology Stack.
3. Mentor, advise and support the Strategy and Planning Team to finalise and agree the
Business Transformation Programme and Project Plans and Digital Platform Solution
Architecture, in order to ensure that the future Strategic Foresight development tools and
Digital Platform software architecture framework delivers industry-leading business agility /
competitiveness and technology flexibility / effectiveness.

Advisory and Training Objectives - Prepare
6. Act as the Digital Architecture Design Authority in order to guide, influence and mentor
the Digital Product Portfolio Team as they deliver the strategic architecture through agile
development improve maintenance capability and efficiency - responsible for the Digital
Platform cooperative resource information collection, analysis, transformation.
4. Train, advise and support the Strategy and Planning Team to design the Digital
Architecture and Technology R&D Pilot Project / Proof-of-Concept (PoC) through all
of the stages of prototype design, development, testing, verification and validation and
plan the phases of implementation for the dominant architecture prototype with the delivery
of Golden Standard artefacts into the Digital Product Portfolio – ensuring that future Digital
Development Tools / Digital Framework and Strategic Foresight Architectures deliver
industry-leading business agility / competitiveness and technology flexibility / impact.
5. Mentor, advise and support the Strategy and Planning Team to build and test the Digital
Architecture and Technology R&D Pilot Project / Proof-of-Concept (PoC). Establish a
Lean and Agile Strategic Foresight Epics and Stories Catalogue - that is both flexible and
adaptive to radical technology change and platform replacement across all of the
Technology Domains – along with a detailed and complete Technology Mapping to the
client evaluation stack / strategic Digital Technology Platform Components (Social Media
/User Content Analysis, Big Data Analytics, Mobile Platforms, Geospatial Data Science)

Advisory and Training Objectives - Prepare
7. Responsible for all Strategy and Planning Team group activities – team building, training,
development, mentoring, cooperative resource information collection, analysis and
transformation – through to planning and organising Executive Briefings, Technology
Forums, Special Interest Groups, Workshops, Seminars and Conferences – including
selecting the speakers / representative / delegates to attend regional, national and
international Strategic Foresight and Lean / Agile Digital Technology conferences.
8. Train the delivery team in Digital Technology Platform Architecture Model envisioning,
design, development and maintenance - from architecture vision to agile implementation –
including CASE Tool architecture design and the Standard Digital Retail Reference Model.
9. Train and develop the Strategy and Planning Team in Digital Technology Platform
Architecture and Components –so as to be able to design, development and
maintenance, from lean architecture vision to agile implementation in a collaborative
communication and benefits management strategy in order to drive out / resolve Strategic
Foresight, Digital Strategy, Architecture and Design problems, issues or threats – leading
team education and training, coaching, mentoring and development.

Advisory and Training Objectives - Execute
Digital Foresight Solution Delivery: -
• Many of the challenges encountered in managing Digital Enterprise Programmes result from
attempts to integrate the multiple, divergent Future Narratives gathered from lots of different
stakeholders in the Enterprise – all with different viewpoints, drivers, concerns, interests and
needs. This may be overcome by developing a shared, collaborative, common Business and
Architecture Vision describing the future state of the Digital Retail Enterprise – along with a
Business and Architecture Roadmap to help plan and realise the achievement of that Vision.
Digital Foresight Delivery Methodology: -
• Understand success management – Scope, Budget, Resources, Dependencies, Milestones, Timeline
• Understand achievement measures – Critical Success Factors / Key Performance Indicators / ROI
• Produce the outline supporting planning documentation - Business and Technology Roadmaps
• Complete the detailed supporting planning documentation – Programme and Project Plans
• Design the solution options to solve the challenges – Business and Solution Architectures
• Execute the preferred solution implementation – using Lean / Digital delivery techniques
• Report Actual Costs Progress, Issues, Risks and Changes against Budget / Plan / Forecast
• Lean / Agile Delivery, Implementation and Go-live !

Advisory and Training Objectives - Execute
10. Deliver an industry-leading and future-proof Strategic Foresight Digital Enterprise
Architecture (EA) Model based on the client’s requirements for Digital Strategic Foresight
performance, efficiency, impact and quality across Business (people and process) /
Technology (SMACT / 4D) Domains
11. Establish a Lean Retail 2.0 / Perfect Store Digital Business Architecture (BA) to achieve
Digital Transformation via end-to-end Retail 2.0 / Perfect Store Business Processes.
12. Drive out a Digital Strategic Foresight Business Operating Model (BOM) through the
investigation, discovery, analysis and design of a Digital Retail Process and Business
Services Portfolio, consisting of Architecture Model and Description consisting of Strategic
Foresight documents, data stores, scenarios and use cases .
13. Guide the Strategy and Planning Team to create the Digital Strategic Foresight
Solution Architecture (SA) Model – designing a Lean / Agile Strategic Foresight
Software Architecture using Digital Strategic Foresight Epics and Stories from the
strategic architecture prototype - which adapts to radical technology change / platform
replacement across all the Digital Technology Domains - through all of the stages of
design, development, testing, verification and validation and iterative phases of
implementation and the delivery of artefacts into the Digital Portfolio.

Advisory and Training Objectives - Review
14. Deliver comprehensive process change / continuous process improvement capability
across all Strategic Foresight Domains – Horizon Scanning, Tracking and Monitoring,
Business Cycles, Patterns and Trends, Economic Modelling and Econometric Analysis,
Monte Carlo Simulation, Scenario Planning and Impact Analysis, Reporting and Analytics.
15. Review Digital Solution Model business performance – Functional Requirements met ?
16. Review Digital Platform technical performance – Non-functional Requirements met by the
Digital Technology Platform Components (e.g. Internet Social Media and User Content
Analysis, Big Data Analytics, Mobile Platforms, 4D Geospatial Data Science) ?
17. Review Digital Strategy outcomes, goals and objectives – Strategic Requirements met ?
18. Plan / Scope next iteration of the Digital Strategy / Architecture / Technology Platform.
Digital Village - Strategic Enterprise Management (SEM) Framework ©

Pathway Benefit Business Transformation Use Case
1 Achieve
Strategic
Requirements
Achieve Strategic outcomes, goals and
objectives through delivering a Digital
Business Transformation Programme
Strategy outcomes, goals and objectives achieved: – CSFs /
KPIs / Financial Targets / Value Chain Management achieved
through delivering a Digital Business Transformation Programme
2 Reduce
Establishment
Costs
Reduce Establishment – Fixed Assets
(Buildings, Office and DCT Equipment)
and Staff (Direct and Indirect costs)
Establishment Costs Reduced: – Fixed Assets and Staff costs
reduced by delivering Organisational Change through a Digital
Business Transformation Programme
3 Improve
Business
Operational
Performance
Improve Business Operational
Performance by introducing a Digital
Business Operating Model
Business Operating Model: – Functional Requirements met by
introducing a Digital Business Operating Model – supporting
Organisation Change / Process Improvement Management /
Strategic Vendor Management / Inventory Management
4 Simplify
Organisation
Structure
Improve Business Process Execution
by introducing a Digital Organisation
Structure
Organisation Hierarchy Model: – People Requirements met
by introducing a Digital Business Operating Model – supporting
Organisation Change and Process Improvement Management
5 Simplify
Business
Processes
Improve Business Process Execution
by introducing a Digital Business
Process Hierarchy
Digital Business Process Model: – Process Requirements met
by introducing a Digital Business Operating Model – supporting
Organisation Change and Process Improvement Management
6 Reduce Costs Deliver efficiency, cost-effectiveness
performance, and future-proofing by
deploying a Digital Business Model
Digital Business Model: – Migrating customers, products and
services from a traditional bricks-and-mortar Business Model
(F2F High Street presence and Call Centres / Contact Centres)
to a Digital Business Model will reduce overheads by up to 40%
7 Increase
Revenue
Drive Sales Performance by deploying a
Digital Business Model
Digital Business Model: – Migrating customers, products and
services from a traditional bricks-and-mortar Business Model
(F2F High Street presence and Call Centres / Contact Centres)
to a Digital Business Model increases sales revenue up to 40%
CASE STUDY 1: – Medical Analytics Digital Business Transformation - Value Pathways

Pathway Benefit Business / Enterprise Architecture Model Use Case
8 Business
Performance –
Functional
Requirements
Deliver efficiency, cost-effectiveness
performance, and future-proofing by
deploying a Digital Solution Model and
SMACT/4D Digital Technology Platform
Digital Solution Model: – Migrating customers, products and
services from a traditional Technology Platform (EPOS / Call
Centres / Contact Centres) onto a SMACT/4D Digital Technology
Platform will reduce costs by 40% (annual repeatable benefits).
9 Increase Social
Media and
Internet Traffic
Stakeholders can build increased digital
presence, market share, financial
value, reputational value and good will
through massively increasing Internet
Traffic and Social Media Conversations.
Digital Presence: – Social Media Conversations and Internet
Traffic volume is increased, generating incremental stakeholder
value by yielding Actionable Insights for campaigns, offers and
promotions revenue Analysis of Internet data allows Product
Managers to support marketing strategies and campaigns that
consistently out-perform competitor product / service offerings.
10 Increase Sales
Units / Volume
Implementing SalesForce.com could
increase Sales Volume by an average of
40% in the first year. Mining Actionable
Commercial Insights using AWS EMR
Big Data Analytics may yield a further
increase in Sales Volume by up to 40%.
Internet Traffic Analysis: – SalesForce.com and AWS EMR Big
Data Analytics reduces the cost to process Sales Data, yielding
increased data processing rates to support marketing decisions.
Analysis of this information allows Digital Marketing Managers to
promote sales and marketing strategies that consistently achieve
market-leading retail outcomes and financial results / outcomes.
11 Increase Sales
Revenue and
Contribution
Drive increased cost-effectiveness,
efficiency, sales performance, and
Market Presence from the Digital
Business Model and Technology Stack
Digital Business Architecture – Lean Scenarios / Use Cases
and Agile Epics / Stories are delivered via the Digital Technology
Stack (e.g. Internet Social Media and User Content Analysis, Big
Data Analytics, Mobile Platforms, 4D Geospatial Data Science)
12 Increase EBIT
Profitability –
enhance ROI
Ensure efficiency, accuracy and cost-
effectiveness of Market and Financial
Analysis – both routine / ad-hoc tasks.
Financial / Market Data Analysis: AWS EMR Cloud Big Data
Analytics reduces the cost to store Customer, Market, Financial
Transactional Data, allowing longer retention of data to support
offers / promotions and campaign management / analysis upsell /
cross-sell campaigns and rise in Market Sentiment, Good Will,
Reputational Value and Stock Market Valuation scenarios
CASE STUDY 1: – Medical Analytics Digital Business / Enterprise Model - Value Pathways

Pathway Benefit “SMACT/4D Digital Technology Stack” Use Case
13 Real-time Data
Streaming and
Monitoring
Stakeholders get the most timely and
appropriate alarms and alerts of any
emerging disruptive market, technology,
political, social and economic events.
Horizon Scanning, Tracking and Monitoring: Global Internet
Content, Social Intelligence, News Feeds and Market Data are
mined as sources for early warning of disruptive Weak Signals
predicating possible future Wild Card and Black Swan events.
14 Predictive
Analytics
Stakeholders can build financial value
by taking an active role in self-service
management of their own Enterprise
Risk Management, Market Sentiment /
Price Curve Forecast Data and Models.
Scenario Planning and Impact Analysis : - Social Intelligence
and Market Data is mined for early warning of emerging trends
and Actionable Insights in Market Sentiment / Price Movement.
Monte Carlo Simulation generates Business Scenario clusters /
Bayesian Analysis of the probability of each scenario occurring.
15 Technical
(Quantitative)
Analysis
Financial Technology capabilities and
resources matched to the nature and
complexity of the Analytics assignment
– the evaluation and selection of those
future options that provide the best
possible fit with target future outcomes.
Financial Portfolio Management: - Buy-Hold-Sell decisions -
Big Data reduces the cost to analyse Market Data, allowing
faster processing of data to support investment decisions and
model financial outcomes. Analysis of this data allows Portfolio
Managers to support appraisal practices and investment fund
strategies that consistently out-perform their Financial Markets.
16 Financial
Analysis and
Economic
Modelling
Ensure efficiency, accuracy and cost-
effectiveness of Economic Modelling
Econometric Analysis and Financial
Planning tasks.
Historical Market Data Analysis: Business Cycles, Patterns
and Trends - Big Data reduces the cost to store Market Data,
allowing longer retention of data to support investment decisions
and model financial outcomes. Analysis of this data allows Fund
Managers to promote appraisal practices and investment
strategies that consistently achieve market-leading results.
17 SMACT/4D
Digital
Technology
Platform
Deliver efficiency, cost-effectiveness
performance, and future-proofing by
investing in a SMACT/4D Digital
Technology Architecture and Platform
Analytics Platform – Functional / Non-functional Requirements
delivered via the Digital Technology Platform Components (e.g.
Internet Content, Social Media and User Content Analysis, Big
Data Analytics, Mobile Platforms, 4D Geospatial Data Science)
CASE STUDY 1: – Medical Analytics SMACT/4D Digital Technology Stack - Value Pathways

Big Data – Processes
The MapReduce technique has spilled over into many other disciplines that process vast
quantities of information including science, industry, and systems management. The Apache
Hadoop Library has become the most popular implementation of MapReduce – with other
framework implementations from Hortonworks, Cloudera, MAPR and Pivotal

Big Data – Process Overview
Big Data Analytics
Big Data Management
Big Data Provisioning
Big Data Platform
Big Data Consumption
Data Stream
Data Scientists Data Architects
Data Analysts
Big Data Administration
Revenue Stream
Data Administrators
Data Managers
Hadoop Platform Team
Insights

Split-Map-Shuffle-Reduce Process
Big Data Consumers
Split Map Shuffle Reduce
Key / Value Pairs Actionable Insights Data Provisioning Raw Data

Horizon Scanning
Publish and
Socialise
Investigate and
Research
Scan and Identify
Track and Monitor
Communicate Discover
Understand Evaluate
Horizon Scanning – Human Activity
Environment Scanning – Natural Phenomena
Hadoop *Big Data*
Collect, Load, Stage,
Map and Reduce

Strategic Foresight as Knowledge Management

Horizon Scanning • Horizon Scanning is an important technique for establishing a sound knowledge
base for planning and decision-making. Anticipating and preparing for the future – uncertainty, threats, challenges, opportunities, patterns, trends and extrapolations – is an essential core component of any organisation's long-term sustainability strategy.
• What is Horizon Scanning ?
Horizon Scanning is defined by the UK Government Office for Science as: -
“the systematic examination of potential threats, opportunities and likely future developments, including (but not restricted to) those at the margins
of current thinking and planning”.
• Horizon Scanning may explore novel and unexpected issues as well as persistent problems or trends. The government's Chief Scientific Adviser is encouraging Departments to undertake horizon scanning in a structured and auditable manner.
• Horizon Scanning enables organisations to anticipate and prepare for new risks and opportunities by looking at trends and information in the medium- to long-term future.
• The government's Horizon Scanning Centre of Excellence, part of the Foresight Directorate in the Department for Business, Innovation and Skills, has the role of supporting Departmental activities and facilitating cross-departmental collaboration.

Horizon Scanning, Tracking and Monitoring - Domains
Ill Moments: – Disease / Pandemics
Horizon Scanning
Geo-political Shock Wave
Socio-Demographic Shock Wave
Economic Shock Wave
Technology Shock Wave
Ecological Shock Wave
Biomedical Shock Wave
Environment Shock Wave
Climate Shock Wave
Culture Change
Climate Change
Disruptive Innovation
Economic Events: - Money Supply /
Commodity Price / Sovereign Default
Kill Moments: – War, Terrorism, Revolution
Ecological Events: – Population Curves / Extinction Events
Human Activity / Natural Disasters
Horizon Scanning
Environment Scanning
Human Activity
Natural Phenomena
Data Science
- Big Data
Analytics
Weak Signal
Processing

Horizon Scanning, Tracking and Monitoring Processes
• Horizon Scanning, Tracking and Monitoring is a systematic search and examination of
global internet content – “BIG DATA” – information which is gathered, processed and
used to identify potential threats, risks, emerging issues and opportunities in the Human
World - allowing for the incorporation of mitigation and exploitation into in policy making
process - as well as improved preparation for contingency planning and disaster response.
• Horizon Scanning is used as an overall term for discovering and analysing the future of
the Human World – Politics, Economics, Sociology, Religion Culture and War –
considering how emerging trends and developments might potentially affect current policy
and practice. This helps policy makers in government to take a longer-term strategic
approach, and makes present policy more resilient to future uncertainty. In developing
policy, Horizon Scanning can help policy makers to develop new insights and to think
about “outside of the box” solutions to human threats – and opportunities.
• In contingency planning and disaster response, Horizon Scanning helps to manage risk
by discovering and planning ahead for the emergence of unlikely, but potentially high
impact Black Swan events. There are a range of Futures Studies philosophical
paradigms, and technological approaches – which are all supported by numerous
methods, tools and techniques for developing and analysing possible, probable and
alternative future scenarios.

Horizon Scanning, Tracking and Monitoring - Subjects
Biomedical Shocks – 1. Famine 2. Disease 3. Pandemics
Horizon Scanning
Geo-political Shock Wave
Socio-Demographic Shock Wave
Economic Shock Wave
Technology Shock Wave
Ecological Shock Wave
Biomedical Shock Wave
Environment Shock Wave
Climate Shock Wave
Human Activity and Global Massive Change 1. Industrialisation 2. Urbanisation 3. Globalisation
Climate Change – 1. Solar Forcing 2. Oceanic Forcing 3. Atmospheric Forcing
Technology Innovation Waves – 1. Stone , Bronze 2. Iron, Steam, 3. Nuclear, Digital
Economic Shock Waves – 1. Money Supply 2. Commodity Price 3. Sovereign Debt Default
Geopolitical Shock Waves – 1. Invasion / War 2. Security / Civil Unrest 3. Terrorism / Revolution
Ecological Shocks – 1. Population Curves – Growth / Collapse 2. Extinction-level Events
Environment Shocks – 1. Natural Disasters 2. Global Catastrophes
Horizon Scanning
Environment Scanning
Human Actions
Natural Phenomena
Big Data
Analytics

Horizon Scanning, Tracking and
Monitoring Processes • HORIZON SCANNING, MONITORING and TRACKING •
• Data Set Mashing and “Big Data” Global Content Analysis – supports Horizon
Scanning, Monitoring and Tracking processes by taking numerous, apparently un-related
RSS and Data Feeds, along with other Information Streams, capturing unstructured Data
and Information – Numeric Data, Text and Images – loading this structured / unstructured
data into Document and Content Database Management Systems and Very Large Scale
(VLS) Dimension / Fact / Event Database Structures to support both Historic and Future
time-series Data Warehouse for interrogation using Real-time / Predictive Analytics.
• These processes use “Big Data” to construct a Temporal View (4D Geospatial Timeline) –
including Predictive Analytics, Geospatial Analysis, Propensity Modelling and Future
Management.– that search for and identify Weak Signals, which are signs of possible
hidden relationships in the data to discover and interpret previously unknown Random
Events - “Wild Cards” or “Black Swans”. “Weak Signals” are messages originating from
these Random Events which may indicate global transformations unfolding as the future
Temporal View (4D Geospatial Timeline) approaches - in turn predicating possible,
probable and alternative Future Scenarios, Outcomes, Cycles Patterns and Trends. Big
Data Hadoop Clusters support Horizon Scanning, Monitoring and Tracking trough
Hadoop *Big Data* Collect, Load, Stage, Map Reduce and Publish process steps.

Scenario Planning and Impact Analysis
Published Scenarios
Evaluated Scenarios
Numerical Modelling
Discovered Scenarios
Communicate Discover
Understand Evaluate
Non-linear Models
Bayesian Analysis
Profile Analysis
Reporting and Analytics
SCENARIOS and USE CASES
Monte Carlo Simulation
Cluster Analysis
Impact Analysis
Possible,
Probable
& Alternative
Futures
Probable
Scenarios

Scenario Planning and Impact Analysis
• Scenario Planning and Impact Analysis is the archetypical method for futures studies
because it embodies the central principles of the discipline:
– The future is uncertain - so we must prepare for a wide range of possible, probable
and alternative futures, not just the future that we desire (or hope) will happen.....
– It is vitally important that we think deeply and creatively about the future, else we run
the risk of being surprised, unprepared for, or overcome by events – or all of these.....
• Scenarios contain the stories of these multiple futures - from the Utopian to the Dystopian,
from the preferred to the expected, from the Wild Card to the Black Swan - in forms which
are analytically coherent and imaginatively engaging. A good scenario grabs our attention
and says, ‘‘Take a good look at this future. This could be your future - are you prepared ?’’
• As consultants and organizations have come to recognize the value of scenarios, they
have also latched onto one scenario technique – a very good one in fact – as the default
for all their scenario work. That technique is the Royal Dutch Shell / Global Business
Network (GBN) matrix approach, created by Pierre Wack in the 1970s and popularized by
Schwartz (1991) in the Art of the Long View and Van der Heijden (1996) in Scenarios: The
Art of Strategic Conversations. In fact, Millett (2003, p. 18) calls it the ‘‘gold standard of
corporate scenario generation.’’

Strategic Foresight
• STRATEGIC FORESIGHT •
• Strategic Foresight is a planning-oriented subset of foresight (futurology,
futures studies), the study of the future. Strategy is a high level plan to achieve
one or more outcomes, goals or objectives under unknown, estimated, calculated
or known conditions of system randomness – chaos, uncertainty and disruption.
• Strategic Foresight gives us the ability to create and maintain a high-quality,
coherent and functional forward view, and to utilise Future Insights in order to
gain Competitive Advantage - for example to identify and understand emerging
opportunities and threats, to manage risk, to inform planning and forecasting and
to shape strategy development. Strategic Foresight is a fusion of Foresight
techniques with Strategy Analysis methods – and so is of great value in
detecting adverse conditions, threat assessment, guiding policy and strategic
decision-modelling, in identifying and exploring novel opportunities presented by
emerging technologies, in evaluating new markets, products and services and in
driving transformation and change.

Strategy and Foresight Process
Communicate
Discover
Understand
Evaluate
Scan and Identify
Track and Monitor Investigate and Research
Publish and Socialise
Desired Outcomes, Goals and Objectives
Vision and Mission
Strategy / Foresight Epics and Stories,
Scenarios and Use Cases
Strategy / Foresight Themes and Categories

Strategic Foresight Development

Strategic Foresight Development
Disruptive Innovation and Digital Technologies
Throughout eternity, all that is of like form comes around again –
everything that is the same must return again in its own
everlasting cycle.....
• Marcus Aurelius – Emperor of Rome •

Strategic Foresight Development
Forecasting.
Planning
and
Strategy
Models
3.
FUTURES
STUDIES
10.
COMPLEX
SYSTEMS
and
CHAOS
THEORY
4.
NARRATIVE
METHODS
11.
DISRUPTIVE
FUTURISM
2.
FORESIGHT
5.
NUMERICAL
METHODS
Stakeholder
Management
Qualitative Techniques
– Scenario Planning
– Risk Management
Human Impact on Global Weather, Climate,
Environment & Ecology Support Systems
Foresight Research and
Development - Prototype
/ Pilot / Proof-of-concept
Quantitative Techniques
– Technical Analysis and
– Monte Carlo Simulation Business Waves, Cycles, Patterns, Trends –
Economic Modelling and Econometric Analysis
STRATEGIC
FORESIGHT –
STUDY INPUTS
STRATEGY
ANALYSIS
PLANNING
DISRUPTION
12.
GLOBAL
MASSIVE
CHANGE
9.
ECONOMIC
MODELLING
8.
SCENARIO
PLANNING
and IMACT
ANALYSIS
7.
WEAK
SIGNALS
and WILD
CARDS
1.
STRATEGY
ANALYSIS
6.
HORIZON
SCANNING.
Strategic Foresight
– Study Definition
Disruptive
Technology
– Platform
Deployment
R&D + Strategy Discovery Workshops
– Tech. Convergence and Innovation Data Load and Model Trials –
Tuning and History Matching
Horizon Scanning,
Tracking and Monitoring

Strategic Foresight - Methods Digital Futures Studies Method
Description Pioneers and Leading Figures
Creative
Destruction
(Technology
Disruption)
"the process of
creative destruction
is the essence of
capitalism”
Austrian School
Capital Theory –
Disruptive Economic
Change is driven by
Creative Destruction
• Joseph Schumpeter
– “Austrian School”
Political Economist •
Creative Destruction (Technology Disruption)
describes a "process of industrial mutation that
constantly replaces the economic structure from
within, incessantly destroying the old economy,
incessantly creating a new economy in its place.“
'Creative Destruction‘ (Disruption) is a term coined
by Joseph Schumpeter in his Capital Theory work
entitled "Capitalism, Socialism and Democracy"
(1942) in which he stated that "the process of
creative destruction is the essence of capitalism”.
'Creative Destruction‘ occurs when the arrival and
adoption of new methods of production effectively kills
off older, established industries. An example of this is
the introduction of personal computers in the 1980's.
This new industry, founded by Microsoft and Intel,
destroyed many mainframe computer companies. In
doing so, technology entrepreneurs created one of
the most important technologies of the last century.
Microsoft and Nokia are today, in their turn, now being
destroyed as personal computers and laptops are
replaced by smart phones and tablets from agile and
innovative companies such as Apple and Samsung.
Joseph Schumpeter – “Austrian
School” Economist – Capital Theory,
the flow of capital from older declining
industries (“cash cows”) into new and
emerging industries (“rising stars”).
Joseph Alois Schumpeter was an
Austro-American economist and
political scientist and a member of the
Austrian (Real) School of Economics.
Joseph Schumpeter – briefly served
as Finance Minister of Austria during
1919. In 1932 he became a visiting
professor at Harvard University
where he remained until the end of
his career. In1942 Schumpeter
famously wrote in "Capitalism,
Socialism and Democracy" : -
"the harsh winds of creative
destruction – which is the essence
of all capitalism - are blown in on
the gales of economic change” ..

Strategic Foresight - Methods Digital Futures Studies Method
Description Pioneers and Leading Figures
Disruptive Futurism Disruptive Futurism is an ongoing forward analysis of
the impact of novel and emerging factors of Disruptive
Change on the Environment, Politics, Economy, Society,
Industry, Agronomy and Technology, and how Business
and Technology Innovation is driving Disruptive Change.
Thus understanding how current patterns, trends and
extrapolations along with emerging agents and catalysts
of change interact with chaos, disruption and uncertainty
(Random Events) create novel opportunities – as well as
posing clear and present dangers that threaten the very
status quo of the world as we know it today.....
The purpose of the “Disruptive Futurist” role is to provide
future analysis and strategic direction to support those
senior client stakeholders who are charged by their
organisations with thinking about the future. This
involves enabling clients to anticipate, prepare for and
manage the future by helping them to understanding
how the future might unfold - thus realising the
Stakeholder Strategic Vision and Communications /
Benefits Realisation Strategies. This may achieved by
scoping, influencing and shaping client organisational
change and driving technology innovation to enable
rapid business transformation.
Disruptive Futurists
Prof Peter Cochrane, Iain
Pearson, Jonathan Mitchner,
David Brown, Ian Neild – BT
Futures Laboratories

Strategic Foresight - Methods Digital Futures Studies Method
Description Pioneers and Leading Figures
Disruptive Futurism FUTURE THREATS – DISRUPTIVE FUTURISM –
Disruptive Futurists analyse and interpret the "gales
of creative destruction" that were forecast by Austrian
economist Joseph Schumpeter in the 1940s – which
are blowing so much harder today than ever they were
before. The twin disruptive forces of a rapidly
changing economic environment and technology-
driven innovation are giving birth to novel products and
services, new digital markets and innovative
commercial opportunities – which at the same time
threatens older technologies with destruction and
challenges the very existence of many established
companies operating in older mainstream
industries.....
Disruptive Futurism is a Future Studies Framework
for understanding the dual nature of Schumpeter's
Creative Destruction which is manifested through
Technology Convergence and Innovation, causing
Digital Technology Disruption – now driving Digital
Platform and Service convergence – a process which,
since the year 2000, has severely impacted on the
financial performance of 52% of the Fortune 500
companies listed in the New York Stock Exchange…
Disruptive Futurists
Prof Peter Cochrane, Iain Pearson,
Jonathan Mitchner, David Brown,
Ian Neild – BT Futures Laboratories

Strategic Foresight - Methods Digital Futures Studies Method
Description Pioneers and Leading Figures
Disruptive
Technology -
Innovation and
Convergence
Novel and Emerging Technology Innovation and
Convergence (Technology Disruption) is simply the
result of combining existing economic resources – Raw
Materials, Labour, Land, Machinery and Capital – in
novel and inventive ways in order to create new and
innovative Products and Services. Understanding the
impact of Technology Disruption is the major factor in
driving Product Innovation. Numerous common and
familiar objects in use today exist only as a result of a
series of fortuitous technology convergence events…..
The strategic value of understanding how Technology
Disruption - and other innovation processes - work
together, is demonstrated in the great wealth that may
be generated from successful product launches, which
are the result of innovative technology development
strategies along with incisive and cutting-edge design.
The corollary of this is to be found in the huge costs
and lost opportunities of the innumerable abandoned
technology innovation strategies, cancelled Research
and Development programmes and failed product
launches. Under-achievement by managers may be
attributed to a lack of understanding of the dynamics,
impact and effects of digital technology disruption…..
Joseph Schumpeter – “Austrian
School” Economist
Steve Jobs – Apple
Bill Gates – Microsoft
Shannon and Moore – Intel Corp.
Sir Clive Sinclair
Sir Alan Sugar – Amstrad

Strategic Foresight - Methods Digital Futures Studies Method
Description Pioneers and Leading Figures
Futures Studies Futures Studies, Foresight, or Futurology is the
science, practice and art of postulating possible,
probable, alternative and preferable futures. Futures
Studies (colloquially called "Futures" by many of the
field's practitioners) seeks to understand what is likely
to continue, what is likely to change, and what is a
novel and emerging pattern or trend. In some part,
this discipline seeks a systematic pattern, cycle and
trend analysis – a foreword extrapolation-based
understanding of both past and present events - in
order to determine the probability and impact of
unfolding future events, patterns and trends, and how
they may be altered by chaos introducing, disruption,
randomness and uncertainty into future outcomes.
Futures is an interdisciplinary curriculum, studying
yesterday's and today's changes, and aggregating
and analysing public, professional and academic
content and publications, beliefs and opinions, views
and strategies, forecasts and predictions - with
respect to shaping tomorrow. This includes analysing
the sources and agents, causes and catalysts, cycles,
patterns and trends of both change and stability - in
an attempt to develop foresight and to map possible,
probable and alternative future outcomes.
Prof. Kies van der Hijden – Said
Business School, University of
Oxford, author of “The Sixth Sense” –
Richard Slaughter, Pero Micic, Peter
Bishop, Andy Hines, Wendy Schultz,
John Smart, Jennifer Gidley, Marie
Conway, Karen Marie Arvidsson,

Strategic Foresight - Methods Digital Futures
Studies Method
Description Pioneers and Leading
Figures
Futures Studies PROBABLISTIC FUTURES – RATIONAL FUTURISM –
Rational Futurists believe that the future is, to a large
extent, both unknown and unknowable. Reality is non-
liner – that is, chaotic – and therefore it is impossible to
predict the future because of uncertainty. With chaos
comes the potential for disruption. Possible, Probable
and Alternative Futures emerge from the interaction of
chaos and uncertainty amongst the interplay of current
trends and emerging factors of change – presenting an
inexorable mixture of challenges and opportunities.
Probable future outcomes and events may be
synthesised and implied via an intuitive assimilation and
cognitive filtering of Weak Signals, inexorable trends,
random and chaotic actions and disruptive Wild Card
and Black Swan events. Just as the future remains
uncertain, indeterminate and unpredictable, so it will be
volatile and enigmatic – but it may also be subject to
intervention and synthesis by man.....
Peter Bishop, Andy Hines, John
Smart, Pero Micic, Wendy Schultz

Strategic Foresight - Methods Digital Futures Studies Method
Description Pioneers and Leading Figures
Foresight Foresight draws on traditions of work in long-range
forecasting and strategic planning, horizontal
policymaking and democratic planning, horizon
scanning and futures studies (Aguillar-Milan, Ansoff,
Feather, van der Hijden, Slaughter et all) - but was also
highly influenced by systemic approaches to innovation
studies, disruptive futurism, global design, massive
change, science and technology futures, economic,
social and demographic policy, fashion and design - and
the analysis of "future trends“, "critical technologies“
and “cultural evolution“ via the study of "weak signals“,
“strong signals”, "wild cards“ and “Black Swan” events.
Frank Feather, Kies van der Hijden,
Richard Slaughter, Peter Bishop,
Andy Hines, Wendy Schultz, Pero
Micic, Kaat Exterbille, Karen Marie
Arvidsson, Jennifer Gidley, Marie
Conway, Begnt-Arne Vedin, Henrik
Blomgren, Stephen Aguillar-Milan
Long-range
Forecasting
Long-range Forecasting – long-term future timelines
and outlooks are usually over10 years and up to as
many as 50 years (though there are some exceptions to
this, especially in its use in private business). Since
Foresight is an action-oriented discipline (via the action
planning link) it will rarely be applied to perspectives
beyond a few decades out. Where major infrastructure
decisions such as petrology reservoir exploitation,
aircraft design, power station construction, transport
hubs and town master planning decisions are made -
then the planning horizon may well be half a century.
Derek Armshaw

Strategic Foresight - Methods Digital Futures
Studies Method
Description Pioneers and Leading
Figures
Strategic Foresight Strategic Foresight techniques are drawn from emerging
Foresight and traditional Strategy Analysis methods - and is
defined as the ability to create and maintain a high-quality,
coherent and functional forward view, and to use actionable
insights arising in ways which are useful to the organisation.
For example to detect adverse conditions, guide policy,
shape strategy, and to explore new markets, products and
services. It represents a fusion of futures methods with
those of strategic management - Slaughter (1999), p.287.
Kies van der Hijden, Richard
Slaughter, Peter Bishop, Andy
Hines, Wendy Schultz, Pero
Micic, Kaat Exterbille, Karen
Marie Arvidsson, Jennifer
Gidley, Marie Conway, Begnt-
Arne Vedin, Henrik Blomgren,
Stephen Aguillar-Milan
GOAL ANALYSTS DESIGNED and PLANNED VISION of the FUTURE –
GOAL ANALYSTS believe that the future will be governed
by the orchestrated vision, beliefs, goals and objectives of
various influential and well connected Global Leaders,
working with other stakeholders - movers, shakers and
influencers such as the good and the great in Industry,
Economics, Politics and Government, along with other well
integrated and highly coordinated individuals from
Academia, Media and Society in general – and realised
through the plans and actions of global and influential
organizations, institutions and groups to which they belong.
The shape of the future may thus be discerned by Goal
Analysis and interpretation of the policies, behaviours and
actions of such individuals and of the think-tanks and policy
groups which they follow, subscribe to or are members.
Frank Feather – in just 30
years , Frank Feather guided
Deng Xiaoping and the
Chinese Pollitt Bureau in the
transformation of China from a
Communal Agronomy, little
changed since the Han / Chin
Dynastic Feudal periods - into
a world-leading industrial
society where Central Planning
co-exists with Capitalism under
”one country – two systems”.

Strategic Foresight - Methods Digital Futures Studies Method
Description Pioneers and Leading Figures
Strategic Foresight Possible, Probable and Alternative futures: it is helpful
to examine alternative paths of development, not just
what is currently believed to be most likely or “business
as usual” – but a wide range of Utopian and Dystopian
scenario. Strategic Foresight will often construct
multiple scenarios. These may be an interim step on
the way to creating what may be known as positive
visions, success scenarios or aspirational futures.
Sometimes alternative scenarios will be a major part of
the output of a Foresight study, with the decision about
what preferred future to build being left to other
mechanisms (Forecasting, Planning and Strategy).
Kies van der Hijden, Richard
Slaughter, Peter Bishop, Andy
Hines, Pero Micic, Wendy Schultz
Future Envisioning Future Envisioning – Future outcomes, goals and
objectives are discovered via the Strategic Foresight
analysis process - determined by design, planning and
management - so that the future becomes realistic and
achievable. Possible futures may comply with our
preferred options - and therefore our vision of an ideal
future and desired outcomes could thus be fulfilled.
Peter Bishop, Andy Hines, John
Smart, Pero Micic, Wendy Schultz
Strategic Positivism Strategic Positivism – articulating a single, desired
and preferred vision of the future. The future will
conform to our preferred options - thus our vision of an
ideal future and desired outcomes will be fulfilled.
Frank Feather

Strategic Foresight - Methods Digital Futures Studies Method
Description Pioneers and Leading Figures
Scenario Planning
& Impact Analysis
Game Theory and
Lanchester Theory
The construction and evaluation of possible, probable
and alternative Future Scenarios using Game Theory /
Lanchester Theory with data from Linear / Complex
Systems populating Monte Carlo Simulation Models.
Scenario Panning and Impact Analysis in Enterprise
Risk Management: - in every Opportunity / Threat
Assessment Scenario, a prioritization process ranks
those risks with the greatest potential loss and the
greatest probability of occurring to be handled first -
subsequent risks with lower probability of occurrence
and lower consequential losses are then handled in
descending order. As a foresight concept, Wild Card or
Black Swan events refer to those events which have a
low probability of occurrence - but an inordinately high
impact when they do occur.
Scenario Planning & Impact Analysis – along with
Risk Assessment and Horizon Scanning – are now key
tools in policy making and strategic planning for both
governments and global commercial enterprises. We
are now living in an uncertain world of increasingly
complex and interwoven global events at a time of
unprecedented accelerating change – driven by novel
and emerging Disruptive Digital Technology Innovation.
Hermann Khan – Monte Carlo
Simulation (numeric models) are
explored via Scenario Planning and
Impact Analysis (narrative text).

Strategic Foresight - Methods Digital Futures
Studies Method Description Pioneers and Leading
Figures Scenario Planning
& Impact Analysis
Game Theory and
Lanchester Theory
Scenario Planning and Impact Analysis have served us
well as a strategic planning tools for the last 25 years
or so - but there are also limitations to this technique in
this period of unprecedented complexity and change.
In support of Scenario Planning and Impact Analysis
new risk discovery and evaluation approaches have to
be explored and integrated into our risk management
and strategic planning processes.
Hermann Khan – Monte Carlo
Simulation (numeric models ) are
explained using Scenario Planning
and Impact Analysis (narrative text).
Horizon Scanning,
Tracking and
Monitoring for
Future Events
In order to anticipate a wide range of Future business.
economic, social and political Events – from micro-
economic Market phenomena such as forecasting
Market Sentiment and Price Curve movements, to
large-scale macro-economic Fiscal phenomena – we
can use Weak Signal processing to predict future Wild
Card and Black Swan Events – such as Commodity
Price, Monetary System and Debt Default shocks.
Cycle, Pattern and Trend Analysis methods
combined with Horizon Scanning, Tracking and
Monitoring techniques create Propensity Models for
Future Event Forecasting and Predictive Analytics.
Weak Signals and Wildcards -
Stephen Aguilar-Milan (1968), later
popularised by Ansoff (1990)

Strategic Foresight - Methods Digital Futures Studies Method
Description Pioneers and Leading
Figures
Back-casting and
Back-sight
Back-casting and Back-sight: - “Wild Card” or “Black
Swan” events are ultra-extreme manifestations with a
very low probability of, occurrence - but an inordinately
high impact when they do occur.
In any post-apocalyptic “Black Swan Event” Scenario
Analysis (e.g. the recent Monetary Crisis), we can use
Causal Layer Analysis (CLA) techniques in order to
analyse and review our Risk Management Strategies –
with a view to identifying those Weak Signals which
may have predicated subsequent appearances of
unexpected Wild Card or Black Swan events.
Kaat Exterbille, Marie Conway
Complexity
Paradigm
Related: -
Chaos Theory
Linear Systems
Complex Systems
Adaptive Systems
Simplexity Paradigm
Academic, scientific, social, economic, political and
professional disciplines all have to address the
problem of System Complexity in their fields – the
behaviour of Complex Systems and Chaos Theory.
The Complexity Paradigm is based on the science of
turbulence, strange attractors, emergence and fractals
– modelling complex behaviour using self-organisation
and critical system complexity via non-linear equations
with variable starting conditions , in the rich conceptual
world of Complex Systems and Chaos Theory.
Edward Lorenz, John Henry
Holland, Edgar Morin, Jennifer
Gidley, Karen Marie Arvidsson,

Strategic Foresight - Methods Digital Futures
Studies Method
Description Pioneers and Leading
Figures
Global Massive
Change
Global Massive Change is an evaluation of global
capacities and limitations. It includes both utopian and
dystopian views of the emerging world future state, in
which climate, the environment and ecology are dominated
by human population growth and manipulation of nature: –
1. Human impact is now the major factor in climate
change and environmental degradation.
2. Extinction rate is currently greater than in the
Permian-Triassic boundary extinction event
3. Man now moves more rock and earth than do natural
geological processes.
In the past, many complex human societies (Clovis,
Mayan, Easter Island) have failed, died out or just simply
disappeared - often as a result of either climate change or
their own growth-associated impacts on ecological and
environmental support systems. Thus there is a clear
precedent for modern industrial societies - which continue
to grow unchecked in terms of globalisation complexity and
scale, population growth and drift, urbanisation and
environmental impact – societies which are ultimately
unsustainable, and so in turn must also be destined for
sudden and catastrophic instability, failure and collapse.
Adam Smith, Thomas Malthus

Thinking about the Future…..

Thinking about the Future Framework
Professors Peter Bishop and Andy Hines of the University of Texas Futures Studies School @ the
Houston Clear Lake site have developed a definitive Strategic Management Framework –
Thinking About the Future

Thinking about the Future…..
Forecasting
and Strategy
Models
Stakeholder
Management
Review Strategic
Foresight Program
Foresight Research and
Development - Prototype
/ Pilot / Proof-of-concept
Benefits Realisation
– Risk Management
Benefits Realisation
– Value Chain Analysis
STRATEGIC
FORESIGHT –
DIGITAL
PLATFORM
LIFECYCLE
PLAN
PREPARE
EXECUTE
REVIEW
3.
RESEARCH
10.
ACTION
PLANNING
4.
STRATEGY
DISCOVERY
9.
STRATEGIC
FORESIGHT
11.
PLATFORM
DELIVERY
8.
FORECAST
&
STRATEGY
2.
ENGAGE
5.
THREAT
ANALYSIS
12.
REVIEW
7.
VALUE
CHAIN
1.
FRAMING
AND
SCOPING
6.
RISK
Strategic Foresight
– Study Definition
Disruptive
Technology
– Platform
Deployment
R&D + Strategy Discovery Workshops
– Tech. Convergence and Innovation Data Load and Model Trials –
Tuning and History Matching
13.
CRYSTAL
BALL
REPORT

Thinking about the Future Professors Peter Bishop and Andy Hines at the University of Texas Futures Studies School at
the Houston Clear Lake site have developed a definitive Strategic Foresight Framework –
Thinking About the Future
1. FRAMING and SCOPING •
• This important first step enables public and private sector organisations to define their Strategic Foresight Study and supportinhg SMACT/4D Digital Business Transformation purpose. focus, scope and boundaries – across all of those Political, Legal, Economic, Cultural, Business and Technology problem / opportunity domains requiring resolution.
• Taking time at the outset of a project, the Strategic Foresight Digital Transformation Team defines the Digital Study domain, discovers the principle strategy themes, outcomes, goals and objectives and determines how we might best achieve them. •
• Strategic Foresight Study Definition – Problem / Opportunity Domains: - – Definition - Focus, Scope, Purpose and Boundaries – Approach - Who – What – When– Why – Where – How ? – Justification - Cost, Duration and Resources v. Future Benefits and Cash Flows – Digital Technology Platform – Disruptive Features and Functions – Digital Market Value Proposition – Problem / Opportunity Domains – Customer Experience and Journey – Customer Loyalty and Brand Affinity

Thinking about the Future 2. ENGAGING •
• This second phase is about stakeholder management – developing agendas and
engagement plans for mobilising the Digital Programme and opening stakeholder communications channels, soliciting collaborative participation and input.
• This may involve staging a wide range of Digital Strategy Programme launch and SMACT/4D Project kick-off initiatives - organising events for Strategy Discovery, Communications Channels, Target-setting and Stakeholder engagement planning, establishing mechanisms for reporting actual achievement against targets – so as the Strategic Foresight Team engage a wide range of stakeholders, presents a future-oriented, customer-focussed approach and enables the efficient delivery of Digital Strategy Study artefacts & benefits in planned / managed work streams. •
• Strategic Foresight Study Mobilisation – Stakeholder Engagement: - – Communication Strategy – Benefits Realisation Strategy – Digital Strategy Study Programme Plan – Digital Strategy Study Terms of Reference – Stakeholder, SME and TDA Digital Strategy Study Launch Events – Digital Technology Platform – Desired Features and Functions Catalogue – Digital Market Value Proposition – Key Stakeholder Engagement Plan – Customer Experience and Journey Customer Surveys / Panels / Feedback

Thinking about the Future 3. RESEARCH – Horizon Scanning, Monitoring and Tracking •
• Once the Digital Strategic Foresight Team is clear about the Strategic Foresight engagement boundaries, purpose, problem / opportunity domains and scope of the SMACT/4D Digital Technology Study - they can begin to scan both internal and external sources for any relevant Disruptive Digital content – information describing Digital case studies– or sources indicating Digital transformations, emerging and developing factors and global catalysts of Disruptive change, extrapolations, patterns and trends – and Horizon Scanning, Tracking and Monitoring to search for, seek out and identify any Weak Signals for Disruptive Digital Technology indicating potential disruptive Wild Card / Black Swan events. •
• Strategic Foresight Investigation – Content Capture: -
– Disruption - Factors and Catalysts of Business and Technology Change
– Digital Market Value Proposition - Extrapolations, Patterns and Trends
– Horizon Scanning, Monitoring and Tracking Systems and Infrastructure
– Internal and External Disruptive Digital Technology Content, Information and Data
– Digital Technology Platform – Required Features and Functions Catalogue
– Digital Market Value Proposition - Disruptive Digital Technology Analysis
– Customer Experience and Journey – Digital Proposition and Customer Offer

Thinking about the Future 4. STRATEGY DISCOVERY – Stakeholder Events and Strategy Themes •
• Here we begin to identify and extract useful information from the mass of the Digital Research Content that we have searched for and collected. Critical Success Factors, Strategy Themes and Value Propositions begin to emerge from Data Set “mashing”, Data Mining and Analytics against the massed Research Data – which is all supplemented via the very human process of Cognitive Filtering and Intuitive Assimilation of selected information - through Discovery Workshops, Strategy Theme Forums, Digital Value Chain Seminars, SMACT/4D Special Interest Group Events and one-to-one Key Stakeholder Interviews. •
• Strategic Foresight Discovery – Content Analysis: -
– Research – Global Content Data Set “mashing”, Data Mining and Analytics
– Discovered Assumptions, Critical Success Factors, Strategy Themes, Outcomes, Goals, Objectives and Draft Digital Market Value Proposition
– Stakeholder, SME and TDA Strategy Discovery Events and Communications
– Outline Digital Technology Platform – Features and Functions Analysis
– Outline Digital Market Value Proposition – Outcomes, Goals, Objectives
– Outline Digital Customer Experience and Journey – Customer Profiling / Streaming / Segmentation / Propensity Modelling / Cost & Revenue Streams

Thinking about the Future 5. STRATEGIC THREAT ANALYSIS and RISK IDENTIFICATION •
• Enterprise Risk Management is the evaluation and management of uncertainty. The underlying premise of Strategic Risk Management is that every enterprise exists to provide value for its stakeholders. All entities face digital technology disruption and the potential for chaos and uncertainty – which introduces the possibility of risk.
• The challenge is to determine how much risk we are able to accept as we strive to grow sustainable stakeholder value. Uncertainty presents both opportunity and risk with the possibility of either erosion or enhancement of value. Strategic Foresight enables stakeholders to deal effectively with uncertainty and associated risk and opportunity - thus enhancing the capability of the Enterprise to build long-term economic value. •
• Strategic Risk Management – Disruptive Digital Technology Threat Analysis: -
– Weak Signals, Wild Cards and Black Swan Events
– Business and Economic Cycles, Patterns and Trends
– Digital Technology Disruption – analysis of Schumpeter’s “Creative Destruction”
– Digital Business Transformation – Disruptive Factors and Catalysts of Change
– Identified Assumptions, Critical Success Factors, Key Performance Indicators, Strategy Themes, Outcomes, Goals, Objectives, Business Architecture
– Identified Digital Technology Platform – SMACT/4D Features and Functions
– Identified Digital Market Value Proposition – Opportunities / Threats
– Identified Digital Customer Experience and Journey – Strengths / Weaknesses

Strategic Risk Management
• Systemic Risk (external threats)
– Political Risk – Political Science, Futures Studies and Strategic Foresight
– Economic Risk – Fiscal Policy, Economic Analysis, Modelling and Forecasting
– Wild Card Events – Horizon Scanning, Tracking and Monitoring – Weak Signals
– Black Swan Events – Future Management – Digital Scenario Planning and Impact Analysis
• Market Risk (macro-economic threats)
– Equity Risk – Traded Instrument Product Analysis and Financial Management
– Currency Risk – FX Curves and Forecasting
– Commodity Risk – Price Curves and Forecasting
– Interest Rate Risk – Interest Rate Curves and Forecasting
• Trade Risk (micro-economic threats)
– Credit Risk – Debtor Analysis and Management
– Liquidity Risk – Solvency Analysis and Management
– Insurance Risk – Underwriting Due Diligence and Compliance
– Counter-Party Risk – Counter-Party Analysis and Management

Strategic Risk Management
• Operational Risk (internal threats)
– Legal Risk – Contractual Due Diligence and Compliance
– Statutory Risk – Legislative Due Diligence and Compliance
– Regulatory Risk – Regulatory Due Diligence and Compliance
– Competitor Risk – Competitor Analysis, Defection Detection / Churn Management
– Reputational Risk – Internet Content Scanning, Intervention / Threat Management
– Corporate Responsibility – Enterprise Governance, Reporting and Controls
– Digital Communications and Technology Stack Risk
• Stakeholder Risk – Digital Programme Planning and Delivery Management Risk,
Benefits Realisation Strategy and Stakeholder Communications Management Risk
• Business Transformation Risk – Business Strategy and Enterprise Architecture Risk
• Business Continuity Risk – Programme Roadmap / Digital Cut-over Risk
• Process Risk – Digital Business Operating Model Risk
• Security Risk – Security Principles, Policies and Security Architecture Model Risk
• Information Risk – Information Strategy and Data Architecture Risk
• Technology Risk – Technology Strategy and Platform Architecture Risk
• Vendor / 3rd Party Risk – Supply Chain Management / Strategic Vendor Analysis
• Digital Technology Platform – Vendor / Technology Risk
• Digital Market Value Proposition – Opportunities / Threats
• Digital Customer Experience and Journey – Strengths / Weaknesses

Thinking about the Future 6. STRATEGIC RISK MANAGEMENT and THREAT MITIGATION •
• In most organizations, many stakeholders will, if unchallenged, tend to believe that threat scenarios - as discovered in various SWOT / PEST Analyses - are going to play out pretty much the same way as they have always done in the past.
• When the Digital Transformation Team probes an organization’s view of the future, they usually discover an array of untested, unexamined, unexplained and potentially misleading assumptions – all tending to either maintain the current status quo, or converging around discrete clusters of small, linear, incremental future changes •
• It is the role of the Digital Transformation Team to challenge the organization’s view of the future where it tends to either maintain the current status quo, or converge around discrete clusters of small, linear, incremental future changes – in order to test, validate and verify the realistic potential impact of the anticipated future conditions •
• Strategic Risk Management – Disruptive Digital Technology Risk Mitigation: - – Risk Planning, Mitigation and Management
– Threat Analysis, Assessment and Prioritisation
– Detailed / Analysed Assumptions, Critical Success Factors, Strategy Themes and Digital Market Value Propositions, Detailed / Analysed Digital Customer Experience and Journey
– Detailed Digital Technology Platform – Vendor / Technology Risk and Cost / Benefits
– Detailed Digital Market Value Proposition – Digital Value Chain / Opportunities / Threats
– Detailed / Analysed Digital Customer Experience and Journey – Consumer Strengths / Weaknesses / Sales Volume / Margin Analysis / Revenue Contribution / Cash-flow / ROI

Enterprise Risk Management
• Enterprise Risk Management (ERM) is a structured approach to managing uncertainty through foresight, strategy and planning. A risk is related to a specific threat (or group of related threats) which is managed through a sequence of activities using various Enterprise resources: -
Risk Research – Risk Identification – Scenario Planning & Impact Analysis – Risk Assessment – Risk Prioritization – Risk Management Strategies – Risk Planning –
Risk Mitigation
• Risk Management strategies may include: -
– Transferring the risk to another party
– Avoiding the risk
– Reducing the negative effect of the risk
– Accepting part or all of the consequences of a particular risk .
• For any given set of Risk Management Scenarios, a prioritization process ranks those risks with the greatest potential loss and the greatest probability of occurrence to be handled first – and those risks with a lower probability of occurrence and lower consequential losses are then handled subsequently in descending order of impact. In practice this prioritization can be challenging. Comparing and balancing the overall threat of risks with a high probability of occurrence but lower loss -versus risks with higher potential loss but lower probability of occurrence -can often be misleading.

Enterprise Risk Management • Scenario Panning and Impact Analysis: - In any Opportunity / Threat Assessment
Scenario, a prioritization process ranks those risks with the greatest potential loss and the greatest probability of occurring to be handled first - subsequent risks with lower probability of occurrence and lower consequential losses are then handled in descending order. As a foresight concept, Wild Card or Black Swan events refer to those events which have a low probability of occurrence - but an inordinately high impact when they do occur.
– Risk Assessment and Horizon Scanning have become key tools in policy making and strategic planning for many governments and global enterprises. We are now moving into a period of time impacted by unprecedented and accelerating transformation by rapidly evolving catalysts and agents of change in a world of increasingly uncertain, complex and interwoven global events.
– Scenario Planning and Impact Analysis have served us well as a strategic planning tools for the last 15 years or so - but there are also limitations to this technique in this period of unprecedented complexity and change. In support of Scenario Planning and Impact Analysis new approaches have to be explored and integrated into our risk management and strategic planning processes.
• Back-casting and Back-sight: - “Wild Card” or “Black Swan” events are ultra-extreme manifestations with a very low probability of, occurrence - but an inordinately high impact when they do occur. In any post-apocalyptic “Black Swan Event” Scenario Analysis, we can use Causal Layer Analysis (CLA) techniques in order to analyse and review our Risk Management Strategies – with a view to identifying those Weak Signals which may have predicated subsequent appearances of unexpected Wild Card or Black Swan events.

Thinking about the Future 7. DIGITAL VALUE CHAIN MANAGEMENT •
• The prime activity in the Value Chain Management Process is, therefore, is to challenge the status quo view and provoke the organisation into thinking seriously about the possibility that future conditions may not continue exactly as they have always unfolded before - and in fact, future conditions very seldom do not change.
• The Strategic Foresight processes should therefore include searching for and identifying any potential Weak Signals predicating potential future Wild Card and Black Swan events – in doing so, revealing previously hidden factors and catalysts of change – thus exposing a much wider range of challenges, issues, problems, threats, opportunities and risks than may previously have been considered. •
• Digital Value Chain Management: - – Digital Value Chain Element Research and Identification
– Digital Value Chain Analysis – who / why / where Business Value is created / destroyed
– Digital Value Chain Modelling - where / when / how Business Value is created / destroyed
– Digital Value Chain Management – Managing the Digital Business Value Chain
– Managed Assumptions, Critical Success Factors, Strategy Themes, Outcomes, Goals, Objectives, Digital Market Value Proposition, Branding, Products and Services
– Managed Digital Technology Platform – Cost / Benefits
– Managed Digital Market Value Proposition – Revenue Streams
– Managed Digital Customer Experience & Journey – Digital Value Chain Management

Thinking about the Future 8. SCENARIO FORECASTING •
• Scenarios are stories about how the future may unfold – and how that future will impact on the way that we work and do business with our staff, business partners, customers and suppliers. The Digital Strategy Study considers a broad spectrum of possible scenarios as the only sure-fire way to develop a Digital Technology Platform that will securely position the Digital Transformation Programme with a robust strategic response for every opportunity / threat scenario that may transpire.
• The discovery of multiple scenarios and their associated opportunity / threat impact assessments – along with the probability of each one materialising – covers a wide range of possible and probable Opportunity / Threat situations – describing a broad spectrum, rich variety of POSSIBLE, PROBABLE and ALTERNATIVE FUTURES •
• Scenario Forecasting – Impact Analysis: - – Possible, Probable, Alternative Future Digital Business Scenarios / Impact Analysis
– Cluster Analysis – Grouped Assumptions, Critical Success Factors, Strategy Themes
– Proposed / Preferred Future Business Models / Digital Market Value Propositions, Branding, Products and Services and Digital Technology Platform Architecture
– Proposed Digital Technology Platform – Component Architecture / Catalogue
– Proposed / Preferred Digital Market Value Proposition – Epics and Stories
– Proposed Digital Customer Experience and Journey – Scenarios and Use Cases

Thinking about the Future 9. DIGITAL STRATEGY VISIONING, FORMULATION AND DEVELOPMENT •
• After Scenario Forecasting has laid out a range of potential Future Digital Business
Scenarios, Strategy and Architecture envisioning comes into play – generating a pragmatic and useful Forward View of our “preferred” Future Business Environment and Digital Technology Platform – thus starting to suggest a range of “stretch goals” for moving us forwards towards our “ideal” Digital Forecasting and Strategy Models – utilising the Digital Strategic Principles and Policies to drive out the “desired” Vision, Missions, Outcomes, Goals and Objectives – all cross-referenced / mapped to the proposed Digital Business Architecture Scenarios and Use Cases and Digital Technology Platform Epics and Stories, Solution Architecture and Component Catalogue •
• Strategy Visioning, Formulation and Development: -
– Strategic Foresight Principles and Policies, Guidelines and Best Practices
– Business Strategy and Digital Platform Models and desired Vision, Missions, Digital Strategy Themes, Outcomes, Goals and Objectives
– Forecasting and Strategic Planning Models - Data Load and Model Testing, Data Verification, Model Validation, Tuning, Synchronisation and History Matching Runs
– Proposed Future Digital Business Models and Market Value Propositions, Digital Branding, Products and Services
– Planned Digital Technology Platform – Component Architecture / Catalogue
– Planned Digital Market Value Proposition – Epics and Stories
– Planned Digital Customer Experience and Journey – Scenarios / Use Cases

Thinking about the Future 10. PLANNING: the bridge between the VISION and the ACTION – “ACTION LINK” •
• Finally, the Digital Strategy and Business Transformation team migrates and transforms the desired Vision, Missions, Digital Strategy Themes, Outcomes, Goals and Objectives into the Strategic Digital Transformation Master Plan, Enterprise Landscape Models, Strategic Roadmaps and Transition Plans for organisational readiness, mobilisation and training – maintaining Strategic Foresight mechanisms (Digital Horizon Scanning, Monitoring and Tracking) to preserve our capacity and capability to respond quickly to fluctuations in internal and external environments •
• Strategy Enablement and Delivery Planning: - – Digital Horizon Scanning, Monitoring and Tracking Systems and Infrastructure
– Digital Economic Modelling and Econometric Analysis Systems and Infrastructure
– Digital Business Models / Value Chain Propositions Systems and Infrastructure
– Strategic Digital Master Plan, Enterprise Landscape Models, Roadmaps and Transition Plans
– Planned Future (2B) Digital Business Models and Market Value Propositions, Branding, Products and Services
– Designed Digital Technology Platform – Digital Solution Architecture
– Designed Digital Market Value Proposition – Epics and Stories
– Designed Digital Customer Experience and Journey – Scenarios and Use Cases

Thinking about the Future 11. STRATEGIC FORESIGHT – Digital Platform Delivery •
• This penultimate phase is about communicating results and developing action agendas for mobilising strategy delivery – through launching Business Programmes that will drive forwards towards the realisation of Strategic Master Plans and Future Business Models through Digital Business Transformation, Enterprise Portfolio Management, Technology Refreshment and Service Management – using Cultural Change, innovative multi-tier and collaborative Business Operating Models, Emerging Digital Technologies (IoT, Smart Devices, Smart Grid and Cloud Services) Business Process Re-engineering and Process Outsource - Onshore / Offshore. •
• Strategy Enablement and Delivery Programmes: -
– Launched Digital Customer Experience and Journey, Digital Business Operating Models and Market Value Propositions, Digital Branding, Products and Services
– Enterprise Portfolio Management - Technology Refreshment • System Management •
– Business Transformation – Organisational Re-structuring • Cultural Change • Business Process Management • Operating Models • Programme Planning & Control
– DCT Models - Demand / Supply Models • Shared Services.• BPO - Business Process Outsource and Onsite / Onshore / Nearshore / Offshore Digital Platform Cloud Hosting •
– Emerging Technologies – Social Media • Mobile Computing / Smart Devices • Smart Grid • Real-time Analytics • Cloud Services • Telemetry / Internet of Things • Geospatial •
– Digital Service Management - Service Information • Service Access • Service Brokering • Service Provisioning • Service Delivery • Service Quality Management •
– Launched Digital Technology Platform – Solution Architecture / Component Catalogue
– Launched Digital Market Value Proposition – Epics and Stories
– Launched Digital Customer Experience and Journey – Scenarios and Use Cases

Thinking about the Future 12. STRATEGIC FORESIGHT and DIGITAL PLATFORM REVIEW •
• In this final phase, we can now focus on Key Lessons Learned and maintaining the flow
of useful information from the Digital Strategic Foresight mechanisms and infrastructure into the Strategy and Planning Team – our new “Digital Village” – in order to support an ongoing lean and agile capability to continually and successfully respond to the volatile and dynamic internal and external business and technology environment – continuing Disruptive Futures Studies, Digital Strategy Reviews, Horizon Scanning, Economic Modelling and Econometric Analysis, long-range Forecasting and Business Planning. •
We can now also prepare for the launch of the next iteration of the Digital Strategy Cycle, beginning again with re-launching Phase 1 – Digital Strategy Study Framing & Scoping.
• Strategy Review: - – Revised Digital Strategy Themes, Outcomes, Goals, Objectives and Requirements
– Disruptive Business and Technology Futures Studies and Digital Strategy Reviews
– Horizon Scanning, Monitoring and Tracking Systems – Reviewed Models
– Economic Modelling and Econometric Analysis Systems – Reviewed Models
– Business Planning and long-range Economic Forecasting – Reviewed Models – Reviewed Digital Business Models and Value Propositions, Products and Services – Reviewed Digital Technology Platform – Solution / Component Architecture – Reviewed Digital Market Value Proposition – Epics and Stories – Reviewed Digital Customer Experience and Journey – Scenarios and Use Cases
Peter Bishop and Andy Hines – University of Houston

Thinking about the Future
13.The Crystal Ball Report The Crystal Ball Report is a comprehensive document that aggregates the results from all of
the phases of strategic analysis. The findings from the technical analysis of SWAT, PEST and
5 Forces elements – along with an assessment of Business and Technical (non-functional)
Drivers / Requirements – taking into account your desired outcomes, goals and objectives.
Recommendations for Strategy Implementation – Organisational Change and Business
Transformation – is contained in the Strategic Roadmap are grouped together in The Crystal
Ball Report. SWAT, PEST and 5 Forces elements are highlighted. Stakeholder Groups, roles
and responsibilities are defined, a Strategy Programme Plan is generated and an Architecture
Roadmap is produced and elaborated. The Crystal Ball Report includes a detailed System
Dependency Map – outlining application system and platform candidates for Technology
Refreshment – COTS integration, Application Consolidation, Application Re-hosting in the
Cloud – or complete Application Renovation and Renewal based on new Enterprise Platforms.
The Crystal Ball Report is designed to become the “shared vision” reference point, where all
stakeholders can see how their needs and functions are both addressed and add value to the
overall corporate plan, keeping everyone “in the boat, and rowing in the same direction.”

Horizon Scanning
Publish and
Socialise
Investigate and
Research
Scan and Identify
Track and Monitor
Communicate Discover
Understand Evaluate
Horizon Scanning – Human Activity
Environment Scanning – Natural Phenomena
Hadoop *Big Data*
Collect, Load, Stage,
Map and Reduce

Horizon Scanning • Horizon Scanning is an important technique for establishing a sound knowledge
base for planning and decision-making. Anticipating and preparing for the future – uncertainty, threats, challenges, opportunities, patterns, trends and extrapolations – is an essential core component of any organisation's long-term sustainability strategy.
• What is Horizon Scanning ?
Horizon Scanning is defined by the UK Government Office for Science as: -
“the systematic examination of potential threats, opportunities and likely future developments, including (but not restricted to) those at the margins
of current thinking and planning”.
• Horizon Scanning may explore novel and unexpected issues as well as persistent problems or trends. The government's Chief Scientific Adviser is encouraging Departments to undertake horizon scanning in a structured and auditable manner.
• Horizon Scanning enables organisations to anticipate and prepare for new risks and opportunities by looking at trends and information in the medium- to long-term future.
• The government's Horizon Scanning Centre of Excellence, part of the Foresight Directorate in the Department for Business, Innovation and Skills, has the role of supporting Departmental activities and facilitating cross-departmental collaboration.

Horizon Scanning, Tracking and Monitoring - Domains
Ill Moments: – Disease / Pandemics
Horizon Scanning
Geo-political Shock Wave
Socio-Demographic Shock Wave
Economic Shock Wave
Technology Shock Wave
Ecological Shock Wave
Biomedical Shock Wave
Environment Shock Wave
Climate Shock Wave
Culture Change
Climate Change
Disruptive Innovation
Economic Events: - Money Supply /
Commodity Price / Sovereign Default
Kill Moments: – War, Terrorism, Revolution
Ecological Events: – Population Curves / Extinction Events
Human Activity / Natural Disasters
Horizon Scanning
Environment Scanning
Human Activity
Natural Phenomena
Data Science
- Big Data
Analytics
Weak Signal
Processing

Horizon Scanning, Tracking and Monitoring Processes
• Horizon Scanning, Tracking and Monitoring is a systematic search and examination of
global internet content – “BIG DATA” – information which is gathered, processed and
used to identify potential threats, risks, emerging issues and opportunities in the Human
World - allowing for the incorporation of mitigation and exploitation into in policy making
process - as well as improved preparation for contingency planning and disaster response.
• Horizon Scanning is used as an overall term for discovering and analysing the future of
the Human World – Politics, Economics, Sociology, Religion Culture and War –
considering how emerging trends and developments might potentially affect current policy
and practice. This helps policy makers in government to take a longer-term strategic
approach, and makes present policy more resilient to future uncertainty. In developing
policy, Horizon Scanning can help policy makers to develop new insights and to think
about “outside of the box” solutions to human threats – and opportunities.
• In contingency planning and disaster response, Horizon Scanning helps to manage risk
by discovering and planning ahead for the emergence of unlikely, but potentially high
impact Black Swan events. There are a range of Futures Studies philosophical
paradigms, and technological approaches – which are all supported by numerous
methods, tools and techniques for developing and analysing possible, probable and
alternative future scenarios.

Horizon Scanning, Tracking and Monitoring - Subjects
Biomedical Shocks – 1. Famine 2. Disease 3. Pandemics
Horizon Scanning
Geo-political Shock Wave
Socio-Demographic Shock Wave
Economic Shock Wave
Technology Shock Wave
Ecological Shock Wave
Biomedical Shock Wave
Environment Shock Wave
Climate Shock Wave
Human Activity and Global Massive Change 1. Industrialisation 2. Urbanisation 3. Globalisation
Climate Change – 1. Solar Forcing 2. Oceanic Forcing 3. Atmospheric Forcing
Technology Innovation Waves – 1. Stone , Bronze 2. Iron, Steam, 3. Nuclear, Digital
Economic Shock Waves – 1. Money Supply 2. Commodity Price 3. Sovereign Debt Default
Geopolitical Shock Waves – 1. Invasion / War 2. Security / Civil Unrest 3. Terrorism / Revolution
Ecological Shocks – 1. Population Curves – Growth / Collapse 2. Extinction-level Events
Environment Shocks – 1. Natural Disasters 2. Global Catastrophes
Horizon Scanning
Environment Scanning
Human Actions
Natural Phenomena
Big Data
Analytics

Horizon Scanning, Tracking and
Monitoring Processes • HORIZON SCANNING, MONITORING and TRACKING •
• Data Set Mashing and “Big Data” Global Content Analysis – supports Horizon
Scanning, Monitoring and Tracking processes by taking numerous, apparently un-related
RSS and Data Feeds, along with other Information Streams, capturing unstructured Data
and Information – Numeric Data, Text and Images – loading this structured / unstructured
data into Document and Content Database Management Systems and Very Large Scale
(VLS) Dimension / Fact / Event Database Structures to support both Historic and Future
time-series Data Warehouse for interrogation using Real-time / Predictive Analytics.
• These processes use “Big Data” to construct a Temporal View (4D Geospatial Timeline) –
including Predictive Analytics, Geospatial Analysis, Propensity Modelling and Future
Management.– that search for and identify Weak Signals, which are signs of possible
hidden relationships in the data to discover and interpret previously unknown Random
Events - “Wild Cards” or “Black Swans”. “Weak Signals” are messages originating from
these Random Events which may indicate global transformations unfolding as the future
Temporal View (4D Geospatial Timeline) approaches - in turn predicating possible,
probable and alternative Future Scenarios, Outcomes, Cycles Patterns and Trends. Big
Data Hadoop Clusters support Horizon Scanning, Monitoring and Tracking trough
Hadoop *Big Data* Collect, Load, Stage, Map Reduce and Publish process steps.

Horizon Scanning

Horizon Scanning
Publish and
Socialise
Investigate and
Research
Scan and Identify
Track and Monitor
Communicate Discover
Understand Evaluate
Horizon Scanning – Human Activity
Environment Scanning – Natural Phenomena
Hadoop *Big Data*
Collect, Load, Stage,
Map and Reduce

Horizon Scanning • Horizon Scanning is an important technique for establishing a sound knowledge
base for planning and decision-making. Anticipating and preparing for the future – uncertainty, threats, challenges, opportunities, patterns, trends and extrapolations – is an essential core component of any organisation's long-term sustainability strategy.
• What is Horizon Scanning ?
Horizon Scanning is defined by the UK Government Office for Science as: -
“the systematic examination of potential threats, opportunities and likely future developments, including (but not restricted to) those at the margins
of current thinking and planning”.
• Horizon Scanning may explore novel and unexpected issues as well as persistent problems or trends. The government's Chief Scientific Adviser is encouraging Departments to undertake horizon scanning in a structured and auditable manner.
• Horizon Scanning enables organisations to anticipate and prepare for new risks and opportunities by looking at trends and information in the medium- to long-term future.
• The government's Horizon Scanning Centre of Excellence, part of the Foresight Directorate in the Department for Business, Innovation and Skills, has the role of supporting Departmental activities and facilitating cross-departmental collaboration.

Horizon Scanning, Tracking and Monitoring Methods & Techniques
• Are you all at sea over your future.....?

Horizon Scanning, Tracking and Monitoring - Domains
Ill Moments: – Disease / Pandemics
Horizon Scanning
Geo-political Shock Wave
Socio-Demographic Shock Wave
Economic Shock Wave
Technology Shock Wave
Ecological Shock Wave
Biomedical Shock Wave
Environment Shock Wave
Climate Shock Wave
Culture Change
Climate Change
Disruptive Innovation
Economic Events: - Money Supply /
Commodity Price / Sovereign Default
Kill Moments: – War, Terrorism, Revolution
Ecological Events: – Population Curves / Extinction Events
Human Activity / Natural Disasters
Horizon Scanning
Environment Scanning
Human Activity
Natural Phenomena
Data Science
- Big Data
Analytics
Weak Signal
Processing

Horizon Scanning, Tracking and Monitoring Processes
• Horizon Scanning, Tracking and Monitoring is a systematic search and examination of
global internet content – “BIG DATA” – information which is gathered, processed and
used to identify potential threats, risks, emerging issues and opportunities in the Human
World - allowing for the incorporation of mitigation and exploitation into in policy making
process - as well as improved preparation for contingency planning and disaster response.
• Horizon Scanning is used as an overall term for discovering and analysing the future of
the Human World – Politics, Economics, Sociology, Religion Culture and War –
considering how emerging trends and developments might potentially affect current policy
and practice. This helps policy makers in government to take a longer-term strategic
approach, and makes present policy more resilient to future uncertainty. In developing
policy, Horizon Scanning can help policy makers to develop new insights and to think
about “outside of the box” solutions to human threats – and opportunities.
• In contingency planning and disaster response, Horizon Scanning helps to manage risk
by discovering and planning ahead for the emergence of unlikely, but potentially high
impact Black Swan events. There are a range of Futures Studies philosophical
paradigms, and technological approaches – which are all supported by numerous
methods, tools and techniques for developing and analysing possible, probable and
alternative future scenarios.

Horizon Scanning, Tracking and Monitoring - Subjects
Biomedical Shocks – 1. Famine 2. Disease 3. Pandemics
Horizon Scanning
Geo-political Shock Wave
Socio-Demographic Shock Wave
Economic Shock Wave
Technology Shock Wave
Ecological Shock Wave
Biomedical Shock Wave
Environment Shock Wave
Climate Shock Wave
Human Activity and Global Massive Change 1. Industrialisation 2. Urbanisation 3. Globalisation
Climate Change – 1. Solar Forcing 2. Oceanic Forcing 3. Atmospheric Forcing
Technology Innovation Waves – 1. Stone , Bronze 2. Iron, Steam, 3. Nuclear, Digital
Economic Shock Waves – 1. Money Supply 2. Commodity Price 3. Sovereign Debt Default
Geopolitical Shock Waves – 1. Invasion / War 2. Security / Civil Unrest 3. Terrorism / Revolution
Ecological Shocks – 1. Population Curves – Growth / Collapse 2. Extinction-level Events
Environment Shocks – 1. Natural Disasters 2. Global Catastrophes
Horizon Scanning
Environment Scanning
Human Actions
Natural Phenomena
Big Data
Analytics

Horizon Scanning, Tracking and
Monitoring Processes • HORIZON SCANNING, MONITORING and TRACKING •
• Data Set Mashing and “Big Data” Global Content Analysis – supports Horizon
Scanning, Monitoring and Tracking processes by taking numerous, apparently un-related
RSS and Data Feeds, along with other Information Streams, capturing unstructured Data
and Information – Numeric Data, Text and Images – loading this structured / unstructured
data into Document and Content Database Management Systems and Very Large Scale
(VLS) Dimension / Fact / Event Database Structures to support both Historic and Future
time-series Data Warehouse for interrogation using Real-time / Predictive Analytics.
• These processes use “Big Data” to construct a Temporal View (4D Geospatial Timeline) –
including Predictive Analytics, Geospatial Analysis, Propensity Modelling and Future
Management.– that search for and identify Weak Signals, which are signs of possible
hidden relationships in the data to discover and interpret previously unknown Random
Events - “Wild Cards” or “Black Swans”. “Weak Signals” are messages originating from
these Random Events which may indicate global transformations unfolding as the future
Temporal View (4D Geospatial Timeline) approaches - in turn predicating possible,
probable and alternative Future Scenarios, Outcomes, Cycles Patterns and Trends. Big
Data Hadoop Clusters support Horizon Scanning, Monitoring and Tracking trough
Hadoop *Big Data* Collect, Load, Stage, Map Reduce and Publish process steps.

deterministic stochastic

Scenario Planning and Impact Analysis
Published Scenarios
Evaluated Scenarios
Numerical Modelling
Discovered Scenarios
Communicate Discover
Understand Evaluate
Non-linear Models
Bayesian Analysis
Profile Analysis
Reporting and Analytics
SCENARIOS and USE CASES
Monte Carlo Simulation
Cluster Analysis
Impact Analysis
Possible,
Probable
& Alternative
Futures
Probable
Scenarios

Scenario Planning and Impact Analysis
• Scenario Planning and Impact Analysis is the archetypical method for futures studies
because it embodies the central principles of the discipline:
– The future is uncertain - so we must prepare for a wide range of possible, probable
and alternative futures, not just the future that we desire (or hope) will happen.....
– It is vitally important that we think deeply and creatively about the future, else we run
the risk of being surprised, unprepared for, or overcome by events – or all of these.....
• Scenarios contain the stories of these multiple futures - from the Utopian to the Dystopian,
from the preferred to the expected, from the Wild Card to the Black Swan - in forms which
are analytically coherent and imaginatively engaging. A good scenario grabs our attention
and says, ‘‘Take a good look at this future. This could be your future - are you prepared ?’’
• As consultants and organizations have come to recognize the value of scenarios, they
have also latched onto one scenario technique – a very good one in fact – as the default
for all their scenario work. That technique is the Royal Dutch Shell / Global Business
Network (GBN) matrix approach, created by Pierre Wack in the 1970s and popularized by
Schwartz (1991) in the Art of the Long View and Van der Heijden (1996) in Scenarios: The
Art of Strategic Conversations. In fact, Millett (2003, p. 18) calls it the ‘‘gold standard of
corporate scenario generation.’’

Weak Signals and Wild Cards
Publish and
Socialise
Investigate and
Research
Scan and Identify
Track and Monitor
Communicate Discover
Understand Evaluate
Random Event
Strong Signal
Weak Signal
Wild Card
Random Events – Weak Signal / Wild Card Signal Processing
Signal Processing

Weak Signals and Wild Cards
• “Wild Card” or "Black Swan" manifestations are extreme and unexpected events which have a very low probability of occurrence, but an inordinately high impact when they do happen. Trend-making and Trend-breaking agents or catalysts of change may predicate, influence or cause wild card events which are very hard - or even impossible - to anticipate, forecast or predict.
• In any chaotic, fast-evolving and highly complex global environment, as is currently developing and unfolding across the world today, the possibility of any such “Wild Card” or "Black Swan" events arising may, nevertheless, be suspected - or even expected. "Weak Signals" are subliminal indicators or signs which may be detected amongst the background noise - that in turn point us towards any "Wild Card” or "Black Swan" random, chaotic, disruptive and / or catastrophic events which may be on the horizon, or just beyond......
• Weak Signals – refer to Weak Future Signals in Horizon and Environment Scanning - any unforeseen, sudden and extreme Global-level transformation or change Future Events in either the military, political, social, economic or the environmental landscape – some having an inordinately low probability of occurrence - coupled with an extraordinarily high impact when they do occur.

Weak Signals Wild Cards, Black Swans
Wild Card
Strong Signal
Random Event
Weak Signal
Communicate Discover
Understand Evaluate
Random Event
Strong Signal
Weak Signal
Wild Card
Black Swan
“Black Swan” Events are Runaway Wild Card Scenarios
Signal Processing

Weak Signals and Wild Cards
Publish and
Socialise
Investigate and
Research
Scan and Identify
Track and Monitor
Communicate Discover
Understand Evaluate
Random Event
Strong Signal
Weak Signal
Wild Card
Random Events – Weak Signal / Wild Card Signal Processing
Signal Processing

Weak Signals and Wild Cards
• “Wild Card” or "Black Swan" manifestations are extreme and unexpected events which have a very low probability of occurrence, but an inordinately high impact when they do happen. Trend-making and Trend-breaking agents or catalysts of change may predicate, influence or cause wild card events which are very hard - or even impossible - to anticipate, forecast or predict.
• In any chaotic, fast-evolving and highly complex global environment, as is currently developing and unfolding across the world today, the possibility of any such “Wild Card” or "Black Swan" events arising may, nevertheless, be suspected - or even expected. "Weak Signals" are subliminal indicators or signs which may be detected amongst the background noise - that in turn point us towards any "Wild Card” or "Black Swan" random, chaotic, disruptive and / or catastrophic events which may be on the horizon, or just beyond......
• Weak Signals – refer to Weak Future Signals in Horizon and Environment Scanning - any unforeseen, sudden and extreme Global-level transformation or change Future Events in either the military, political, social, economic or the environmental landscape – some having an inordinately low probability of occurrence - coupled with an extraordinarily high impact when they do occur.

Weak Signals Wild Cards, Black Swans
Wild Card
Strong Signal
Random Event
Weak Signal
Communicate Discover
Understand Evaluate
Random Event
Strong Signal
Weak Signal
Wild Card
Black Swan
“Black Swan” Events are Runaway Wild Card Scenarios
Signal Processing

Scenario Planning and Impact Analysis
Published Scenarios
Evaluated Scenarios
Numerical Modelling
Discovered Scenarios
Communicate Discover
Understand Evaluate
Non-linear Models
Bayesian Analysis
Profile Analysis
Reporting and Analytics
SCENARIOS and USE CASES
Monte Carlo Simulation
Cluster Analysis
Impact Analysis
Possible,
Probable
& Alternative
Futures
Probable
Scenarios

Scenario Planning and Impact Analysis
• Scenario Planning and Impact Analysis is the archetypical method for futures studies
because it embodies the central principles of the discipline:
– The future is uncertain - so we must prepare for a wide range of possible, probable
and alternative futures, not just the future that we desire (or hope) will happen.....
– It is vitally important that we think deeply and creatively about the future, else we run
the risk of being surprised, unprepared for, or overcome by events – or all of these.....
• Scenarios contain the stories of these multiple futures - from the Utopian to the Dystopian,
from the preferred to the expected, from the Wild Card to the Black Swan - in forms which
are analytically coherent and imaginatively engaging. A good scenario grabs our attention
and says, ‘‘Take a good look at this future. This could be your future - are you prepared ?’’
• As consultants and organizations have come to recognize the value of scenarios, they
have also latched onto one scenario technique – a very good one in fact – as the default
for all their scenario work. That technique is the Royal Dutch Shell / Global Business
Network (GBN) matrix approach, created by Pierre Wack in the 1970s and popularized by
Schwartz (1991) in the Art of the Long View and Van der Heijden (1996) in Scenarios: The
Art of Strategic Conversations. In fact, Millett (2003, p. 18) calls it the ‘‘gold standard of
corporate scenario generation.’’

Scenario Planning and Impact Analysis

Outsights "21 Drivers for the 21st Century"
• Scenarios are specially constructed stories about the future - each one portraying
a distinct, challenging and plausible world in which we might one day live and work - and for which we need to anticipate, plan and prepare.
• The Outsights Technique emphasises collaborative scenario building with internal clients and stakeholders. Embedding a new way of thinking about the future in the organisation is essential if full value is to be achieved – a fundamental principle of the “enabling, not dictating” approach
• The Outsights Technique promotes the development and execution of purposeful action plans so that the valuable learning experience from “outside-in” scenario planning enables building profitable business change.
• The Outsights Technique develops scenarios at the geographical level; at the business segment, unit and product level, and for specific threats, risks and challenges facing organisations. Scenarios add value to organisations in many ways: - future management, business strategy, managing change, managing risk and communicating strategy initiatives throughout an organisation.

Outsights "21 Drivers for the 21st Century"
1. War, terrorism and insecurity 2. Layers of power 3. Economic and financial stability 4. BRICs and emerging powers • Brazil • Russia • India • China
5. The Five Flows of Globalisation • Ideas • Goods • People • Capital • Services
6. Intellectual Property and Knowledge 7. Health, Wealth and Wellbeing 8. Transhumanism – Geo-demographics,
Ethnographics and Social Anthropology 9. Population Drift, Migration and Mobility 10. Market Sentiment, Trust and Reputation 11. Human Morals, Ethics, Values and Beliefs
12. History, Culture, Religion and Human Identity 13. Consumerism and the rise of the Middle Classes 14. Social Media, Networks and Connectivity 15. Space - the final frontier
• The Cosmology Revolution - String Theory
16. Science and Technology Futures • The Nano Revolution • The Quantum Revolution • The Information Revolution • The Bio-Technology Revolution • The Energy Revolution • Oil Shale Fracking • • Kerogen • Tar Sands • Methane Hydrate • • The Hydrogen Economy • Nuclear Fusion •
17. Science and Society – the Social Impact of Disruptive Technology and Convergence
18. Natural Resources – availability, scarcity and control – Food, Energy and Water (FEW) crisis
19. Climate Change • Global Massive Change – the Climate Revolution
20. Environmental Degradation & Mass Extinction 21. Urbanisation and the Smart Cities of the Future

Outsights "21 Drivers for the 21st Century"
• Outsights Strategy Scenarios create a shared context, clarity and vision over challenging issues shaping the future in which decision makers can take better informed decisions on opportunity exploitation and risk management strategies.
• Managing Change Scenario thinking can compel a wide range of people to open up to new options and change their own images of reality by sharing and discussing assumptions on what is shaping the world.
• The Outsights Technique translates what is learnt into action in the following ways to achieve sustainable change and risk management : -
– Providing the content and insight needed to understand changes in the outside world (Drivers of Change, Scenario Building, Risk Categories)
– Designing and executing processes to devolve organisational change, business transformation and risk management down from the segment and business unit level to the individual responsible manager level – delivering personal accountability for Strategy & Planning, Budgeting & Forecasting, Change Management, Risk Management, Performance Management and Standards Compliance with Enterprise Governance, Reporting and Controls

Outsights "21 Drivers for the 21st Century"
• Outsights Strategy Scenarios supports a shared resource pool covering those issues shaping the future in which decision makers can make difficult choices about opportunity exploitation and risk management strategies.
• The Outsights Technique helps stakeholders stand back, take stock and seek fresh points of view: -
– Facilitation of the internal debate exploring stakeholder value, opportunity exploitation and risk management
– Sounding board for business innovation and strategy
– Stakeholder engagement and the communication of the process with the wider partner, stakeholder and employee community
– Review of specific opportunity exploitation and risk management agendas
– Surfacing diverse opinions from internal and external stakeholders to identify needs for strategic content, clarity, perspective and action

Scenario Planning and Impact Analysis
• The insights discovered by Scenario Planning and Impact Analysis can provide the basis
for prioritising research and development programmes, gathering business intelligence,
designing organisational scorecard objectives and establishing visions and strategies.
Steps
1. Participants are given a scope, focus and time horizon for the exercise.
2. Horizon Scanning, Monitoring and Tracking and Monte Carlo Simulations provide
sources of information. These data sets can come from internal or external sources
– Data Scientists, Domain Experts and Researchers, “Big Data” Analysts, the project
team, or from prior studies and data collection exercises from the individual team
participants. These should cover a broad external analysis, such as STEEP.
3. Individuals review the sources and spot items that cause personal insights on the
focus given. These insights and their sources are captured in the form of abstracts.
4. Abstracts are discussed and themed to indicate wave-forms over the time horizon
concerned. Scenarios are stacked, racked and prioritised by impact and probability.
5. The participants agree on how to address the resulting Scenarios, Waves, Cycles,
Patterns and Trends with supporting information for further futures analysis.
• More information about tools and uses of horizon scanning in Central Government can be
found on the Foresight Horizon Scanning Centre website.

Seeing in Multiple Horizons: - Connecting Strategy to the Future
• THE THREE HORIZONS MODEL describes a Strategic Foresight method called “Seeing in Multiple Horizons: - Connecting Strategy to the Futures " The current THREE HORIZONS MODEL differs significantly from the original version first described in management literature over a decade ago. This model enables a range of Futures Studies techniques to be integrated with Strategy Analysis methods in order to reveal powerful and compelling future insights – and may be deployed in various combinations, whenever or wherever the Futures Studies techniques and Strategy Analysis methods are deemed to support the futures domains, subjects, applications and data in the current study.
• THE THREE HORIZONS MODEL method connects the Present Timeline with deterministic (desired or proposed) futures, and also helps us to identify probabilistic (forecast or predicted) future scenarios which may emerge as a result of interaction between embedded present-day factors and emerging catalysts of change – thus presenting us with a range of divergent possible futures. The “Three Horizons” method connects to models of change developed within the “Social Shaping” Strategy Development Framework via the Action Link to Strategy Execution. Finally, it summarises a number of futures applications where this evolving technique has been successfully deployed.
• The new approach to “Seeing in Multiple Horizons: - Connecting Strategy to the Future” has several unique features. It can relate change drivers and trends-based futures analysis to emerging issues. It enables policy or strategy implications of futures to be identified – and links futures work to processes of change. In doing so this enables Foresight to be connected to existing and proposed underlying system domains and data structures, with different rates of change propagation impacting across different parts of the system, and also to integrate seamlessly with tools and processes which facilitate Strategic Analysis. This approach is especially helpful where there are complex transformations which are likely to be radically disruptive in nature - rather than simple incremental transitions.

Andrew Curry Henley Centre HeadlightVision
United Kingdom
Anthony Hodgson Decision Integrity United Kingdom
Seeing in Multiple Horizons: - Connecting Strategy to the Future
The Three Horizons

Horizon and Environment Scanning, Tracking and Monitoring Processes
• Horizon and Environment Scanning, Tracking and Monitoring processes exploit the
presence and properties of Weak Signals – their discovery, analysis and interpretation
were first described by Stephen Aguilar Milllan in the 1960’s, and later popularised by
Ansoff in the 1970’s. Horizon Scanning is defined as “a set of information discovery
processes which data scientists, environment scanners, researchers and analysts use
to prospect, discover and mine the truly massive amounts of internet global content -
innumerable news and data feeds - along with the vast quantities of information stored
in public and private document libraries, archives and databases.”
• All of this external data is found widely distributed across the internet as Global Content
– RSS News Feeds and Data Streams, Academic Research Papers and Datasets - is
processed in order to detect and identify the possibility of unfolding random events and
clusters – “to systematically reduce the level of exposure to uncertainty, to reduce risk
and gain future insights in order to prepare for adverse future conditions – or to exploit
novel and unexpected opportunities for innovation" (LESCA, 1994). As a management
support tool for strategic decision-making, horizon and environment scanning process
have some very special challenges that need to be taken into account by environment /
horizon scanners, researchers, data scientists and analysts - as well as stakeholders.

Horizon and Environment Scanning, Tracking and Monitoring Processes
• Horizon Scanning (Human Activity Phenomena) and Environment Scanning (Natural
Phenomena) are the broad processes of capturing input data to drive futures projects and
programmes - but they also refer to specific futures studies tool sets, as described below.
• Horizon Scanning, Tracking and Monitoring is a highly structured evidence-gathering
process which engages participants by asking them to consider a broad range of input
information sources and data sets - typically outside the scope of their specific expertise.
This may be summarised as looking back for historic Wave-forms which may extend into
the future (back-casting), looking further ahead than normal strategic timescales for wave,
cycle, pattern and trend extrapolations (forecasting), and looking wider across and beyond
the usual strategic resources (cross-casting). A STEEP structure, or variant, is often used.
• Individuals use sources to draw insights and create abstracts of the source, then share
these with other participants. Horizon scanning lays a platform for further futures activities
such as scenarios or roadmaps. This builds strategic analysis capabilities and informs
strategy development priorities. Once uncovered, such insights can be themed as key
trends, assessed as drivers or used as contextual information within a scenario narrative.
• The graphic image below illustrates how horizon scanning is useful in driving Strategy
Analysis and Development: -

Strategy versus Horizon Scanning

Horizon and Environment Scanning, Tracking and Monitoring Processes
• Horizon Scanning, Tracking and Monitoring is the major input for unstructured “Big Data” to
be introduced into the Scenario Planning and Impact Analysis process (along with Monte
Carlo Simulation and other probabilistic models providing structured data inputs). In this
regard, Scenario Planning and Impact Analysis helps to create a conducive team working
environment. It allows consideration of a broad spectrum of input data – beyond the usual
timescales and sources – drawing information together in order to identify future challenges,
opportunities and trends. It looks for evidence at the margins of current thinking as well as in
more established trends. This allows the collective insights of the group to be integrated -
demonstrating the many differing ways which diverse sources contribute to these insights.
• Horizon Scanning, Tracking and Monitoring is ideal as an initial activity for collecting Weak
Signal data input into the Horizon Scanning, Tracking and Monitoring process to kick-off
major futures studies projects and future management programmes. Scenario Planning and
Impact Analysis is also useful as a sense-making and interaction tool for an integrated
future-focused team. Horizon Scanning, Tracking and Monitoring combined with Scenario
Planning and Impact Analysis works best if people external to the organisation are included
in the team - and are encouraged to help bring together new and incisive perspectives.
• The graphic image below illustrates how horizon scanning is useful in spotting weak signals
that might be otherwise difficult to see – and so risk being overlooked: -

Seeing in Multiple Horizons

Horizon Scanning, Tracking and Monitoring Processes
• Horizon Scanning, Tracking and Monitoring is a systematic search and examination
of global internet content – “BIG DATA” – information which is gathered, processed and
used to identify potential threats, risks, emerging issues and opportunities as a result of
Human Activity - allowing for the incorporation of mitigation and exploitation themes into
in the policy making process – as well as improved preparation for business continuity,
contingency planning and disaster response, and enterprise risk management events.
• Horizon Scanning is used as an overall term for discovering and analysing the unfolding
future of the Human World – Politics, Economics, Sociology, Religion Culture and War –
considering how emerging trends and developments might potentially affect current policy
and practice. This helps policy makers in government to take a longer-term strategic
approach, and makes present policy more resilient to future uncertainty. In developing
policy, Horizon Scanning can help policy makers to develop new insights and to think
about “outside of the box” solutions to human activity threats – and opportunities.
• In contingency planning and disaster response, Horizon Scanning helps to manage risk
by discovering and planning ahead for the emergence of unlikely, but potentially high
impact Black Swan events. There is a wide range of Futures Studies philosophical
paradigms, and technology approaches – which are all supported by numerous methods,
tools and techniques for exploring possible, probable and alternative future scenarios.

Horizon and Environment Scanning, Tracking and Monitoring Processes
• Horizon and Environment Scanning Event Types – refer to Weak Signals of any unforeseen,
sudden and extreme Global-level transformation or change Future Events in either the military,
political, social, economic or environmental landscape - having an inordinately low probability of
occurrence - coupled with an extraordinarily high impact when they do occur (Nassim Taleb).
• Horizon Scanning Event Types
– Technology Shock Waves
– Supply / Demand Shock Waves
– Political, Economic and Social Waves
– Religion, Culture and Human Identity Waves
– Art, Architecture, Design and Fashion Waves
– Global Conflict – War, Terrorism, and Insecurity Waves
• Environment Scanning Event Types
– Natural Disasters and Catastrophes
– Human Activity Impact on the Environment - Global Massive Change Events
• Weak Signals – are messages, subliminal temporal indicators of ideas, patterns, trends or
random events coming to meet us from the future – or signs of novel and emerging desires,
thoughts, ideas and influences which may interact with both current and pre-existing patterns
and trends to predicate impact or effect some change in our present or future environment.

Scenario Planning and Impact Analysis

Scenario Planning and Impact Analysis
• Scenario Planning and Impact Analysis is the archetypical method for futures studies
because it embodies the central principles of the discipline:
– It is vitally important that we think deeply and creatively about the future, or else we run
the risk of being either unprepared or surprised – or both......
– At the same time, the future is uncertain - so we must prepare for a range of multiple
possible and plausible futures, not just the one we expect to happen.
• Scenarios contain the stories of these multiple futures, from the expected to the
wildcard, in forms that are analytically coherent and imaginatively engaging. A good
scenario grabs us by the collar and says, ‘‘Take a good look at this future. This could be
your future. Are you going to be ready?’’
• As consultants and organizations have come to recognize the value of scenarios, they
have also latched onto one scenario technique – a very good one in fact – as the
default for all their scenario work. That technique is the Royal Dutch Shell/Global
Business Network (GBN) matrix approach, created by Pierre Wack in the 1970s and
popularized by Schwartz (1991) in the Art of the Long View and Van der Heijden (1996)
in Scenarios: The Art of Strategic Conversations. In fact, Millett (2003, p. 18) calls it the
‘‘gold standard of corporate scenario generation.’’

Outsights "21 Drivers for the 21st Century"
1. War, terrorism and insecurity 2. Layers of power 3. Economic and financial stability 4. BRICs and emerging powers • Brazil • Russia • India • China
5. The Five Flows of Globalisation • Ideas • Goods • People • Capital • Services
6. Intellectual Property and Knowledge 7. Health, Wealth and Wellbeing 8. Demographics, Ethnographics and Social
Anthropology - Transhumanism 9. Population Drift, Migration and Mobility 10. Trust and Reputation 11. Human Values and Beliefs
12. History, Culture and Human Identity 13. Consumerism and the rise of the Middle
Classes 14. Networks and Social Connectivity 15. Space - the final frontier
• The Cosmology Revolution
16. Science and Technology Futures • The Nano Revolution • The Quantum Revolution • The Information Revolution • The Bio-Technology Revolution • The Energy Revolution • Oil Shale Kerogen • Tar
Sands • Methane Hydrate • Nuclear Fusion •
17. Science and Society - Social Impact of Technology
18. Natural Resources – availability, scarcity and control
19. Climate Change • Global Massive Change – the Climate Revolution
20. Environmental Degradation & Mass Extinction 21. Urbanisation

Outsights "21 Drivers for the 21st Century"
• Scenarios are specially constructed stories about the future - each one portraying
a distinct, challenging and plausible world in which we might one day live and work - and for which we need to anticipate, plan and prepare.
• The Outsights Technique emphasises collaborative scenario building with internal clients and stakeholders. Embedding a new way of thinking about the future in the organisation is essential if full value is to be achieved – a fundamental principle of the “enabling, not dictating” approach
• The Outsights Technique promotes the development and execution of purposeful action plans so that the valuable learning experience from “outside-in” scenario planning enables building profitable business change.
• The Outsights Technique develops scenarios at the geographical level; at the business segment, unit and product level, and for specific threats, risks and challenges facing organisations. Scenarios add value to organisations in many ways: - future management, business strategy, managing change, managing risk and communicating strategy initiatives throughout an organisation.

Seeing in Multiple Horizons: - Connecting Strategy to the Future
• THE THREE HORIZONS MODEL describes a Strategic Foresight method called “Seeing in Multiple Horizons: - Connecting Strategy to the Futures " The current THREE HORIZONS MODEL differs significantly from the original version first described in management literature over a decade ago. This model enables a range of Futures Studies techniques to be integrated with Strategy Analysis methods in order to reveal powerful and compelling future insights – and may be deployed in various combinations, whenever or wherever the Futures Studies techniques and Strategy Analysis methods are deemed to support the futures domains, subjects, applications and data in the current study.
• THE THREE HORIZONS MODEL method connects the Present Timeline with deterministic (desired or proposed) futures, and also helps us to identify probabilistic (forecast or predicted) future scenarios which may emerge as a result of interaction between embedded present-day factors and emerging catalysts of change – thus presenting us with a range of divergent possible futures. The “Three Horizons” method connects to models of change developed within the “Social Shaping” Strategy Development Framework via the Action Link to Strategy Execution. Finally, it summarises a number of futures applications where this evolving technique has been successfully deployed.
• The new approach to “Seeing in Multiple Horizons: - Connecting Strategy to the Future” has several unique features. It can relate change drivers and trends-based futures analysis to emerging issues. It enables policy or strategy implications of futures to be identified – and links futures work to processes of change. In doing so this enables Foresight to be connected to existing and proposed underlying system domains and data structures, with different rates of change propagation impacting across different parts of the system, and also to integrate seamlessly with tools and processes which facilitate Strategic Analysis. This approach is especially helpful where there are complex transformations which are likely to be radically disruptive in nature - rather than simple incremental transitions.

Andrew Curry
Henley Centre HeadlightVision
United Kingdom
Anthony Hodgson
Decision Integrity
United Kingdom
Seeing in Multiple Horizons: - Connecting Strategy to the Future
The Three Horizons

THE ELTVILLE MODEL

SIX VISIONS OF THE FUTURE – THE ELTVILLE MODEL
There are six viewpoints or lenses from which we may understand the future: - 1. BLUE lenses are for PROBABLISTIC FUTURE – RATIONAL FUTURISTS
2. RED lenses are for FUTURE THREATS – DISRUPTIVE FUTURISTS
3. GREEN lenses are for FUTURE OPPORTUNISTIIES – EVOLUTIONARY FUTURISTS
4. GOLD lenses are for DESIRED FUTURE VISION – GOAL ANALYSTS
5. INDIGO lenses are for STEADY STATE FUTURES – EXTRAPOLATION / PATTERN ANALYSTS
6. The VIOLET lenses are for a DETERMINISITC FUTURE – STRATEGIC POSITIVISTS

SIX VISIONS OF THE FUTURE – THE ELTVILLE MODEL
The Eltville Model
BEGIN STUDY – Scope
and Engage
1. PROBABLE FUTURES – RATIONAL FUTURISTS
END STUDY – Publish
and Report
6. PRE-ORDAINED FUTURES – STRATEGIC
POSITIVISTS
3. FUTURE OPTIONS – EVOLUTION FUTURISTS
2. FUTURE THREATS –
DISRUPTIVE FUTURISTS
4. FUTURE VISIONS –
GOAL ANALYSTS
5. FUTURE STATES –
PATTERN and TREND
ANALYSTS Money Supply /
Commodity Price / Sovereign Debt Default
War, Terrorism, Revolution
Population Curves / Human Migration
Human Activity / Natural Disasters
BLUE LENS
RED LENS
GREEN LENS GOLD LENS
INDIGO LENS
VIOLET LENS
Pero Mićić
Extrapolation Analysts – Waves and Cycles
Deterministic Futurists – Strategic Positivists
Leadership Studies and Stakeholder Analysis – Creatable Futures
Rational Futurists – Probable Futures
Evolutionary Futurism – Opportunistic Futures

• Many of the issues that we encounter in Future Management Studies – from driving
Private-sector strategic management to formulating Government Political, Economic and
Social Policies - result from attempts to integrate multiple viewpoints from different
people. Everybody subconsciously believes that every other person thinks about,
articulates and understands the Future Narrative in exactly the same way as they do.
Stakeholders often tend to assume that everyone else is looking through the same
”futures lenses” - which may lead to misunderstanding, conflict, frustration or failure.
• The Eltville Model consists of a process model that explores and describes in turn, six
different viewpoints or perspectives of the future (the “six futures lenses") – in a sequence
of analytical steps for exploration and discovery in a workshop environment - as a futures
outputs model, or framework, which captures the results generated as "thought objects“.
The SIX futures lenses below make it easier to analyse and understand the future: -
1. BLUE lenses are for PROBABLISTIC FUTURE – RATIONAL FUTURISTS
2. RED lenses are for FUTURE THREATS – DISRUPTIVE FUTURISTS
3. GREEN lenses are for FUTURE OPPORTUNISTIIES – EVOLUTIONARY FUTURISTS
4. GOLD lenses are for DESIRED FUTURE VISION – GOAL ANALYSTS
5. INDIGO lenses are for STEADY STATE FUTURE – EXTRAPOLATION and PATTERN ANALYSTS
6. VIOLET lenses are for DETERMINISITC FUTURE – STRATEGIC POSITIVISTS
THE ELTVILLE MODEL by Pero Mićić

THE ELTVILLE MODEL by Pero Mićić
• The Eltville Model serves as a holistic "cognitive map" for terms such as scenario,
vision, trend, wild card, assumption etc, - which may frequently be used in varying
context in different ways by diverse stakeholders. The terms used in the Eltville
Model are unambiguously defined and semantically related to each other - and are
further based on wide futures phenomenological analysis,.
– The ELTVILLE MODEL helps us all to structure our future scenarios and thoughts
about future outcomes to formulate future strategy in a coherent way without omitting
any important determining factors or neglecting any essential viewpoints.
– The ELTVILLE MODEL helps us to obtain some clarity on the most important Future
Management outcomes, goals and objectives and communicate in a clear narrative
about the future of our market and our companies place in that market.
– The ELTVILLE MODEL guides us to implement Strategy Analysis and Future
Management methods and tools in the areas where they are most effective.
• The Eltville Model is a result of observation and phenomenological analysis of more
than 800 workshops with management teams. It was developed by Pero Mićić and is
now being developed further by the Future Management Group consultants

THE ELTVILLE MODEL by Pero Mićić
• The SIX futures lenses and the resulting "ELTVILLE MODEL" bridges the gap between strategic management and corporate planning and futures studies - research for creating a better everyday way of life .
• Using phenomenon-based scenario planning and impact analysis, the ELTVILLE FUTURE MANAGEMENT! MODEL is proven in more than a thousand projects. Future Management Group have defined the essential meaning of Future Management terms and their key application to deliver a cognitive model and a cognitive map from them.
• The ELTVILLE MODEL helps us all to apply the common Strategy Analysis and Strategic Foresight tools much more effectively within a comprehensive Futures Framework. This model also provides participants with a road map for thinking and communicating about the future with your stakeholders and an integrated future-oriented structure for managing strategy delivery projects.
The SIX futures lenses below make it easier to analyse and understand the future: -
1. BLUE lenses are for PROBABLISTIC FUTURE – RATIONAL FUTURISTS 2. RED lenses are for FUTURE THREATS – DISRUPTIVE FUTURISTS 3. GREEN lenses are for FUTURE OPPORTUNISTIIES – EVOLUTIONARY FUTURISTS 4. GOLD lenses are for DESIRED FUTURE VISION – GOAL ANALYSTS 5. INDIGO lenses are for STEADY STATE FUTURE – EXTRAPOLATION and PATTERN ANALYSTS 6. VIOLET lenses are for DETERMINISITC FUTURE – STRATEGIC POSITIVISTS

• The Eltville Model of Future Management is used by companies and public institutions to
support thinking and communicating about future environmental changes, the early
recognition of future markets, the development of future strategies and the building up of
future competence with a sound system of terms. The Eltville Model provides a
comprehensive and integrated terminology. It links the requirements on scientific future
management with the necessities of a company’s day-to-day business.
• The ELTVILLE MODEL has been developed through futures research in more than a
thousand workshops and projects with governmental and non-profit organizations – as well
as with major corporations around the world, - including BOSCH, Microsoft, BAYER,
AstraZeneca, Roche, Ernst+Young, Ford, Vodafone, EADS and Nestle.
The SIX futures lenses below make it easier to analyse and understand the future: -
1. BLUE lenses are for PROBABLISTIC FUTURE – RATIONAL FUTURISTS
2. RED lenses are for FUTURE THREATS – DISRUPTIVE FUTURISTS
3. GREEN lenses are for FUTURE OPPORTUNISTIIES – EVOLUTIONARY FUTURISTS
4. GOLD lenses are for DESIRED FUTURE VISION – GOAL ANALYSTS
5. INDIGO lenses are for STEADY STATE FUTURE – EXTRAPOLATION / PATTERN ANALYSTS
6. VIOLET lenses are for DETERMINISITC FUTURE – STRATEGIC POSITIVISTS
THE ELTVILLE MODEL by Pero Mićić

The Eltville Model – Rational Futurism
1. The ELTVILLE MODEL BLUE lenses are for a PROBABLISTIC FUTURE – RATIONAL FUTURISM – Rational Futurists believe that the future is, to a large extent, both unknown and unknowable. Reality is non-liner – that is, chaotic – and therefore it is impossible to predict the future. With chaos comes the potential for disruption. Possible and Alternative Futures emerge from the interaction of chaos and uncertainty amongst the interplay of current trends and emerging factors of change – presenting an inexorable mixture of challenges and opportunities.
• Probable future outcomes and events may be synthesised and implied via an intuitive assimilation and cognitive filtering of Weak Signals, inexorable trends, random and chaotic actions and disruptive Wild Card and Black Swan events. Just as the future remains uncertain, indeterminate and unpredictable, so it will be volatile and enigmatic – but it may also be subject to synthesis by man.....
The Probabilistic Future – Synthesis: - – Rational Futurism
– Weak Signals and Wild Cards
– Complex Systems and Chaos Theory
– Cognitive Filtering and Intuitive Assimilation
– Nominal Group Conferences and Delphi Surveys
– Horizon Scanning, Tracking and Monitoring for emerging catalysts of Global Change

The Eltville Model – Disruptive Futurism
2. The ELTVILLE MODEL RED lenses are for FUTURE THREATS – DISRUPTIVE FUTURISM – Disruptive Futurism is an ongoing forward analysis of the impact of new and emerging factors of Disruptive Change on Environmental, Political, Economic, Social, Industrial, Agronomy and Technology and how Disruptive Change is driving Business and Technology Innovation. Understanding how current patterns, trends and extrapolations along with emerging agents and catalysts of change interact with chaos, disruption and uncertainty (Random Events) - to create novel opportunities – as well as posing clear and present dangers that threaten the status quo of the world as we know it today.....
• The purpose of the “Disruptive Futurist” role is to provide future analysis and strategic direction to support senior client stakeholders who are charged by their organisations with thinking about the future. This involves enabling clients to anticipate, prepare for and manage the future by helping them to understanding how the future might unfold - thus realising the Stakeholder Strategic Vision and Communications / Benefits Realisation Strategies. This is achieved by scoping, influencing and shaping client organisational change and driving technology innovation to enable rapid business transformation.
• Future Threats and Chaos – Disruptive Futurism -
– Risk Management – Disruptive Change – Weak Signals and Wild cards – Black Swan (Random) Events – Complex Systems and Chaos Theory – Horizon Scanning, Monitoring and Tracking for Weak Signals

The Eltville Model – Evolutionary Futurism
3. In the ELTVILLE MODEL GREEN lenses represent FUTURE OPPORTUNISTIIES – EVOLUTIONARY FUTURISM – Evolutionists believe that the geological, ecological and climatic systems interact with human activity to behave as a self-regulating collection of loosely coupled forces and systems – the Gaia Theory. Global Massive Change is driven by climatic, geological, biosphere, anthropologic and geo-political systems dominate at the macro-level – and at the micro-level local weather, ecology and environmental, social and economic sub-systems prevail.
4. The future will evolve from a series of actions and events which emerge, unfold and develop – and then plateau, decline and collapse. These actions and events are essentially natural responses to human impact on ecological and environmental support systems - creating massive global change through population growth, environmental degradation and scarcity of natural resources. Over the long term, global stability and sustainability of those systems will be preserved – at the expense of world-wide human population levels.
• The Evolutionary Future – Future Opportunities: - – Complex Adaptive Systems (CAS)
– Evolution - Opportunities and Adaptation
– Geological Cycles and Biological Systems
– Social Anthropology and Human Behaviour
– Global Massive Change and Human Impact
– Climatic Studies and Environmental Science
– Population Curves and Growth Limit Analysis

The Eltville Model – Goal Analysts
4. In the ELTVILLE MODEL GOLD lenses stand for our PREFERED and DESIRED FUTURE VISION – GOAL ANALYSTS believe that the future will be governed by the orchestrated vision, beliefs, goals and objectives of various influential and well connected Global Leaders, working with other stakeholders - movers, shakers and influencers such as the good and the great in Industry, Economics, Politics and Government, along with other well integrated and highly coordinated individuals from Academia, Media and Society in general – and realised through the plans and actions of global and influential organizations, institutions and groups to which they belong.
• The shape of the future may thus be created by the powerful and influential - “the good and the great” - and may be discovered via Goal Analysis and interpretation of the policies, behaviours and actions of such individuals, along with those think-tanks, policy groups and political institutions to which they belong, subscribe to and follow.
The Preferred Vision – Creatable Futures: -
– Goal Analysis
– Causal Layer Analysis (CLA)
– Value Models and Roadmaps
– Political Science and Policy Studies
– Religious Studies and Future Beliefs
– Peace and Conflict Studies, Military Science
– Leadership Studies and Stakeholder Analysis

The Eltville Model – Extrapolation Analysis
5. In the ELTVILLE MODEL – INDIGO lenses are for EXTRAPOLATION – PATTERN and TREND ANALYSIS. Extrapolation, Pattern and Trend Analysts believe that the past is the key to the future-present. The future-present is therefore just a logical extrapolation, extension and continuum of past events, carried foreword on historic waves, cycles, patterns and trends.....
• Throughout eternity, all that is of like form comes around again – everything that is the
same must return again in its own everlasting cycle.....
• Marcus Aurelius – Emperor of Rome •
• As the future-present develops and unfolds – it does so as a continuum of time past, time present and time future – and so eternally perpetuating the eternally unfolding, extension, replication and preservation of those historic cycles, patterns and trends that have shaped and influenced actions and events throughout time.
The Probable Future – Assumptions: -
– Patent and Content Analysis
– Causal Layer Analysis (CLA)
– Fisher-Pry and Gompertz Analysis
– Pattern Analysis and Extrapolation
– Technology and Precursor Trend Analysis
– Morphological Matrices and Analogy Analysis

The Eltville Model - Strategic Positivism
6. The ELTVILLE MODEL VIOLET lenses are for STRATEGIC POSITIVISM – STRATEGIC POSITIVISTS are deterministic, optimistic and somewhat Utopian in nature – they believe that their future outcomes, goals and objectives can be determined using Strategic Foresight and the future designed via Future Management – strategy planning, and delivery through the action link – to be delivered through Business Transformation – organisational change, process improvement and technology refreshment – so that their desired future becomes both realistic and achievable.
• The future may develop and unfold so as to comply with our positive vision of an ideal future – and thus fulfil all of our desired outcomes, goals and objectives – in order that the planned future becomes attainable and our preferred future options may ultimately be realised.
• The Planned Future – Strategy: -
– Linear Systems and Game Theory
– Scenario Planning and Impact Analysis
– Future Landscape Modelling and Terrain Mapping
– Threat Assessment and Risk Management
– Economic Modelling and Financial Analysis
– Strategic Foresight and Future Management

Geo-spatial Data Science

GIS Mapping and Spatial Analysis
• GIS MAPPING and SPATIAL DATA ANALYSIS •
• A Geographic Information System (GIS) integrates hardware, software and digital data capture devices for acquiring, managing, analysing, distributing and displaying all forms of geographically dependant location data – including machine generated data such as Computer-aided Design (CAD) data from land and building surveys, Global Positioning System (GPS) terrestrial location data - as well as all kinds of data streams - HDCCTV, aerial and satellite image data.....
• Spatial Data Analysis is a set of techniques for analysing 3-dimensional spatial (Geographic) data and location (Positional) object data overlays. Software that implements spatial analysis techniques requires access to both the locations of objects and their physical attributes. Spatial statistics extends traditional statistics to support the analysis of geographic data. Spatial Data Analysis provides techniques to describe the distribution of data in the geographic space (descriptive spatial statistics), analyse the spatial patterns of the data (spatial pattern or cluster analysis), identify and measure spatial relationships (spatial regression), and create a surface from sampled data (spatial interpolation, usually categorized as geo-statistics).
• The results of spatial data analysis are largely dependent upon the type, quantity, distribution and data quality of the spatial objects under analysis.

Minkowski
Space-Time continuum
• During 1907, in an attempt to understand the previous works of Lorentz and Einstein - a radical four-dimensional view of the Universe (space-time continuum) was designed by German Mathematician Hermann Minkowski .
• Classical (Newtonian) physics, describes a three-dimensional vector co-ordinate system defining Space (position) - and the flow of Time (history) the other universal dimension – were considered to exist independently until the synthesis of Minkowski space-time continuum, .

Complex Systems and Chaos Theory
• Complex Systems and Chaos Theory has been used extensively in the field
of Futures Studies, Strategic Management, Natural Sciences and Behavioural
Science. It is applied in these domains to understand how individuals within
populations, societies, economies and states act as a collection of loosely
coupled interacting systems which adapt to changing environmental factors
and random events – bio-ecological, socio-economic or geo-political.
• Complex Systems and Chaos Theory treats individuals, crowds and
populations as a collective of pervasive social structures which are influenced
by random individual behaviours – such as flocks of birds moving together in
flight to avoid collision, shoals of fish forming a “bait ball” in response to
predation, or groups of individuals coordinating their behaviour in order to
respond to external stimuli – the threat of predation or aggression – or in order
to exploit novel and unexpected opportunities which have been discovered or
presented to them.

Complexity Paradigms
• System Complexity is typically characterised and measured by the number of elements in a
system, the number of interactions between elements and the nature (type) of interactions.
• One of the problems in addressing complexity issues has always been distinguishing between
the large number of elements (components) and relationships (interactions) evident in chaotic
(unconstrained) systems - Chaos Theory - and the still large, but significantly smaller number
of both and elements and interactions found in ordered (constrained) Complex Systems.
• Orderly System Frameworks tend to dramatically reduce the total number of elements and
interactions – with fewer and smaller classes of more uniform elements – and with reduced,
sparser regimes of more restricted relationships featuring more highly-ordered, better internally
correlated and constrained interactions – as compared with Disorderly System Frameworks.
Unconstrained
Complexity
Non-linear
Systems
Constrained
Complexity
Complex Adaptive
Systems (CAS)
Linear
Systems
Simplexity Complexity decreasing element density and interaction
the “arrow of time” Order
Enthalpy Entropy Increasing Chaos
Disorder
Void
Uncertainty Certainty Hawking Paradox

Minkowski
Space-Time continuum
• Space (position) and
Time (history) flow
inextricably together in
one direction – always
towards the future.
• In order to exploit the
principle properties of
the Minkowski space-
time continuum, any
type of Spatial and
Temporal coupling
must be able to
demonstrate that the
History of a particle
or the Transformation
of a process over time
is fully dependent on
both its spatial and
historical components.

4D Geospatial Analytics Geo-spatial and geodemographic
techniques are frequently used to
profile, stream and segment human
populations using ‘natural’ groupings
such as shared or common
behavioural traits – Medical, Clinical
Trial, Morbidity or Actuarial outcomes
– along with many other common
factors and shared characteristics.....
The profiling and analysis of large
aggregated datasets in order to
determine a ‘natural’ structure of
clusters or groupings, provides an
important basic technique for many
statistical and analytic applications.
Based on geographic distribution or
profile similarities – Geospatial
Clustering is a statistical method
whereby no prior assumptions are
made concerning the nature of
internal data structures (the number
and type of groups and hierarchies).

4D Geospatial Analytics
• A Geographic Information System (GIS) integrates hardware, software, and data capture devices for acquiring, managing, analysing, distributing and displaying all forms of geographically dependant location data – including machine generated data such as Computer-aided Design (CAD) data from land and building surveys, Global Positioning System (GPS) terrestrial location data - as well as all kinds of aerial and satellite image data.
• Geospatial Analytics is a set of techniques for analysing spatial (geographic) and temporal (timeline) data. Software which implements spatial data analysis requires access to the location of spatial objects and their physical attributes.
• Spatial statistics extends conventional statistical techniques to support the analysis of spatial (geographic) and temporal (timeline) data. Spatial Data Analysis supports mathematical techniques to describe the distribution of data across geographic space and time (descriptive spatial statistics), analyse the spatial patterns of the data (spatial pattern or cluster analysis), identify and measure spatial relationships (spatial regression), and create a surface morphology (landform) or sub-surface model (geological section) from the sampled data (spatial interpolation, usually categorised as geo-statistics).
The results of geospatial analytics are fully dependent on the type, location, data sample size - and data quality of the geospatial objects being studied.
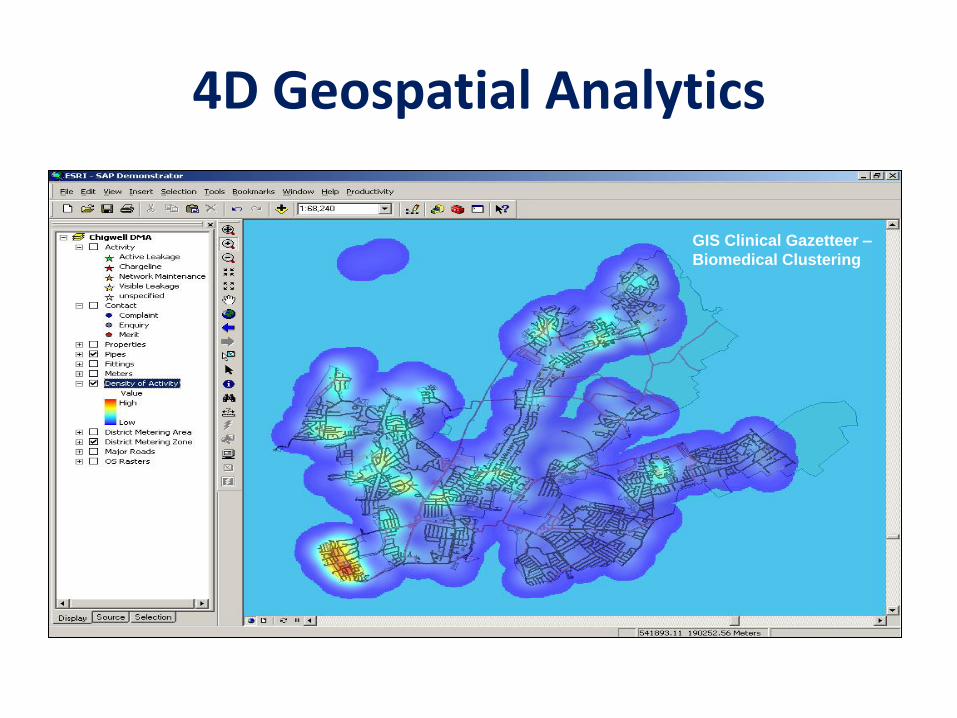
4D Geospatial Analytics
GIS Clinical Gazetteer –
Biomedical Clustering

4D Geospatial Analytics – The Temporal Wave
• The Temporal Wave is a novel and innovative method for Visual Modelling and Exploration
of Geospatial “Big Data” - simultaneously within a Time (history) and Space (geographic)
context. The problems encountered in exploring and analysing vast volumes of spatial–
temporal information in today's data-rich landscape – are becoming increasingly difficult to
manage effectively. In order to overcome the problem of data volume and scale in a Time
(history) and Space (location) context requires not only traditional location–space and
attribute–space analysis common in GIS Mapping and Spatial Analysis - but now with the
additional dimension of time–space analysis. The Temporal Wave supports a new method
of Visual Exploration for Geospatial (location) data within a Temporal (timeline) context.
• This time-visualisation approach integrates Geospatial (location) data within a Temporal
(timeline) data along with data visualisation techniques - thus improving accessibility,
exploration and analysis of the huge amounts of geo-spatial data used to support geo-visual
“Big Data” analytics. The Temporal Wave combines the strengths of both linear timeline
and cyclical wave-form analysis – and is able to represent data both within a Space
(geographic) and Time (history) context simultaneously – and even at different levels of
granularity. Linear and cyclic trends in space-time data may be represented in combination
with other graphic representations typical for location–space and attribute–space data-
types. The Temporal Wave can be used in multiple roles for exploring very large scale
datasets containing Geospatial (location) data within a Temporal (timeline) context - as an
integrated Space-Time data reference system, as a Space-Time continuum representation
and animation tool, and as Space-Time interaction, simulation and analysis tool.

4D Geospatial Analytics – The Temporal Wave
Temporal Wave - Event Timeline
Probable Future
Preferred Future
Possible Future
Desired Outcomes, Goals and Objectives
Past
4D Geospatial Analytics – The Temporal Wave

4D Geospatial Analytics – The Temporal Wave
• The problems encountered in exploring, analysing and extracting insights from the vast
volumes of spatial–temporal information in today's data-rich landscape are becoming
increasingly difficult to manage effectively. In order to overcome the problem of data
volume and scale in an integrated Time (history) and Space (location) context requires
not only traditional location–space and attribute–space analysis common in GIS Mapping
and Spatial Analysis - but now with the additional dimension of Space-Time analysis. The
Temporal Wave supports a new method of Visual Exploration for Geospatial (location)
data within a Temporal (timeline) context. The Temporal Wave is a novel and innovative
method for Visual Modelling, Exploration and Analysis of the Space-Time dimension
fundamental to understanding Geospatial “Big Data” – through simultaneously visualising
and displaying complex data within a Time (history) and Space (geographic) context.
Ordered
Complexity
Non-linear
Systems
Disordered
Complexity
Complex Adaptive
Systems (CAS)
Linear
Systems
Simplexity Complexity decreasing element density and interaction
the “arrow of time”
Order
Enthalpy Entropy Increasing Chaos
Disorder
Void

4D Geospatial Analytics – The Temporal Wave
Space-time Cube (STC)

4D Geospatial Analytics – The Temporal Wave
• The Temporal Wave time-visualisation approach integrates Geospatial (location) data
within a Temporal (timeline) dataset - along with other data visualisation techniques - thus
improving accessibility, exploration and analysis of the huge amounts of geo-spatial data
used to support geo-visual “Big Data” analytics. The Temporal Wave combines the
strengths of both linear timeline and cyclical wave-form analysis – and is able to represent
complex data both within a Time (history) and Space (geographic) context simultaneously
– even at different levels of granularity. Linear and cyclic trends in space-time data may be
represented in combination with other graphic representations typical for location–space
and attribute–space data-types. The Temporal Wave can be deployed and used in roles
as diverse as a Space-Time data reference system, as a Space-Time continuum
representation tool, and as Space-Time display / interaction / simulation / analysis tool.
Ordered
Complexity
Non-linear
Systems
Disordered
Complexity
Complex Adaptive
Systems (CAS)
Linear
Systems
Simplexity Complexity decreasing element density and interaction
the “arrow of time”
Order
Enthalpy Entropy Increasing Chaos
Disorder
Void

Geo-demographics - “Big Data”
The profiling and analysis of very large scale
(VLS) aggregated datasets in order to
determine a ‘natural’ structure of groupings
provides an important technique for many
statistical and analytic applications.
Cluster analysis on the basis of profile
similarities or geographic location is a
method where internal data structures alone
drive both the nature or number of “Clusters”
or natural groups and hierarchies. Clusters
are therefore entirely probabilistic – that is,
no pre-determinations or prior assumptions
are made as to their nature and content.....
Geo-demographic techniques are frequently
used in order to profile and segment human
populations along with their lifestyle events
into natural groupings or “Clusters” – which
are governed by geographical distribution,
common behavioural traits, Morbidity,
Actuarial, Epidemiology or Clinical Trial
outcomes - along with numerous other
shared events, common characteristics or
other natural factors and features.....
Geo-demographics - “Big Data”

The Flow of Information through Time
• String Theory predicates that Space-Time exists in discrete packages, with
Time Present always in some way inextricably woven into both Time Past and
Time Future. This yields the intriguing possibility of insights through the mists of
time into the outcome of future events – as any item of Data or Information
(Global Content) may contain faint traces which offer glimpses into the future
trajectory of Clusters of linked Past, Present and Future Events.
• If all future timeline were linear, then every event would unfold in an unerringly
predictable manner towards a known and certain conclusion. The future is,
however, both unknown and unknowable (Hawking Paradox) . Future outcomes
are uncertain – future timelines are non-linear (branched) with a multitude of
possible alternative futures. Chaos Theory suggests that even the most
subliminal inputs, originating from unknown forces so minute as to be
undetectable, might become amplified through numerous system cycles to grow
in influence and impact over time – deviating Space-Time trajectories far away
from their original predicted path – so fundamentally altering the outcome of
future events.

The Flow of Information through Time
• Space-Time is a four-dimensional (4D) Cluster consisting of the three Spatial
dimensions (x, y and z axes) plus Time (the fourth dimension - t). The “arrow of
time” governs the flow of Space-Time which can only flows relentlessly in a
single direction – towards the future. Every item of Global Content in the Present
is somehow connected with both Past and Future temporal planes in a timeline
composed of a sequence of temporal planes stacked one on top of another.
• Space-Time does not flow uniformly – the “arrow of time” may be warped or
deflected by various factors – gravitational fields, dark matter, dark energy, dark
flow, hidden dimensions or unknown Membranes in Hyperspace. There may
exist “hidden external forces” (unseen interactions) that create disturbance in the
temporal plane stack which marks the passage of time - with the potential to
create eddies, vortices and whirlpools along the trajectory of Time (chaos,
disorder and uncertainty) – which in turn posses the capacity to generate ripples
and waves (randomness and disruption) – thus changing the course of the
Space-Time continuum. “Weak Signals” are “Ghosts in the Machine” –
echoes of these subliminal temporal interactions – that may contain within
insights or clues about possible future “Wild card” or “Black Swan” random
events

4D Geospatial Analytics – The Temporal Wave
• The Temporal Wave is a novel and innovative method for Visual Modelling and
Exploration of Geospatial “Big Data” - simultaneously within a Time (history) and
Space (geographic) context. The problems encountered in exploring and analysing
vast volumes of spatial–temporal information in today's data-rich landscape – are
becoming increasingly difficult to manage effectively. In order to overcome the
problem of data volume and scale in a Time (history) and Space (location) context
requires not only traditional location–space and attribute–space analysis common
in GIS Mapping and Spatial Analysis - but now with the additional dimension of
time–space analysis. The Temporal Wave supports a new method of Visual
Exploration for Geospatial (location) data within a Temporal (timeline) context.
Ordered
Complexity
Non-linear
Systems
Disordered
Complexity
Complex Adaptive
Systems (CAS)
Linear
Systems
Simplexity Complexity decreasing element density and interaction
the “arrow of time”
Order
Enthalpy Entropy Increasing Chaos
Disorder
Void

4D Geospatial Analytics – The Temporal Wave
• This time-visualisation approach integrates Geospatial (location) data within a Temporal
(timeline) dataset - along with data visualisation techniques - thus improving accessibility,
exploration and analysis of the huge amounts of geo-spatial data used to support geo-
visual “Big Data” analytics. The temporal wave combines the strengths of both linear
timeline and cyclical wave-form analysis – and is able to represent data both within a Time
(history) and Space (geographic) context simultaneously – and even at different levels of
granularity. Linear and cyclic trends in space-time data may be represented in combination
with other graphic representations typical for location–space and attribute–space data-
types. The Temporal Wave can be used in roles as a time–space data reference system,
as a time–space continuum representation tool, and as time–space interaction tool.
Ordered
Complexity
Non-linear
Systems
Disordered
Complexity
Complex Adaptive
Systems (CAS)
Linear
Systems
Simplexity Complexity decreasing element density and interaction
the “arrow of time”
Order
Enthalpy Entropy Increasing Chaos
Disorder
Void

GIS MAPPING and SPATIAL DATA ANALYSIS
• A Geographic Information System (GIS) integrates hardware, software, and data capture devices for acquiring, managing, analysing, distributing and displaying all forms of geographically dependant location data – including machine generated data such as Computer-aided Design (CAD) data from land and building surveys, Global Positioning System (GPS) terrestrial location data - as well as all kinds of aerial and satellite image data.....

Geo-Demographic Profile Data GEODEMOGRAPHIC INFORMATION – PEOPLE and PLACES
Age Dwelling Location / Postcode
Income Dwelling Owner / Occupier Status
Education Dwelling Number-of-rooms
Social Status Dwelling Type
Marital Status Financial Status
Gender / Sexual Preference Politically Active Indicator
Vulnerable / At Risk Indicator Security / Threat Indicator
Physical / Mental Health Status Security Vetting / Criminal Record Indicator
Immigration Status Profession / Occupation
Home / First language Professional Training / Qualifications
Race / ethnicity / country of origin Employment Status
Household structure and family members Employer SIC
Leisure Activities / Destinations Place of work / commuting journey
Mode of travel to / from Leisure Activities Mode of travel to / from work

Temporal Wave – 4D Geospatial Analytics
• "Big Data” Analytics – Profiling, Clustering and 4D Geospatial Analysis •
• The profiling and analysis of large aggregated datasets in order to determine a ‘natural’
structure of data relationships or groupings, is an important starting point forming the
basis of many mapping, statistical and analytic applications. Cluster analysis of implicit
similarities - such as time-series demographic or geographic distribution - is a critical
technique where no prior assumptions are made concerning the number or type of
groups that may be found, or their relationships, hierarchies or internal data structures.
Geospatial and demographic techniques are frequently used in order to profile and
segment populations by ‘natural’ groupings. Shared characteristics or common factors
such as Behaviour / Propensity or Epidemiology, Clinical, Morbidity and Actuarial
outcomes – allow us to discover and explore previously unknown, unrecognised or
concealed insights, patterns, trends or data relationships. "Big Data" sources include: -
– SCADA and Environmental Control Data from Smart Buildings
– Vehicle Telemetry Data from Passenger and Transport Vehicles
– Market Data Streams – Financial, Energy and Commodities Markets
– Geospatial Exploration / Production Data created in from Surveys and Images
– Machine-generated / Automatically-captured Biomedical and Scientific Data Sets

4D Geospatial Analytics – London Timeline

Space-Time Analytics – London Timeline
• How did London evolve from its creation as a Roman city in 43AD into the crowded, chaotic
cosmopolitan megacity we see today? What will London look like in the future? The London
Evolution Animation takes a holistic view of what has been constructed in the capital over
different historical periods – what has been lost, what is saved and what will be protected.
• Greater London covers 600 square miles. Up until the 17th century, however, the capital city
was crammed largely into a single square mile which today is marked by the skyscrapers which
are a feature of the financial district of the City. Unlike other historical cities such as Athens or
Rome, with an obvious patchwork of districts from different periods, London's individual
structures scheduled sites and listed buildings are in many cases constructed gradually by parts
assembled during different periods. Researchers who have tried previously to locate and
document archaeological structures and research historic references will know that these
features, when plotted, appear scrambled up like pieces of different jigsaw puzzles – all
scattered across the contemporary London cityscape.
• This visualisation, originally created for the Almost Lost exhibition by the Bartlett Centre for
Advanced Spatial Analysis (CASA), explores the historic evolution of the city by plotting a
timeline of the development of the road network - along with documented buildings and other
features – through 4D geospatial analysis of a vast number of diverse geographic,
archaeological and historic data sets.

4D Geospatial Analytics Geo-spatial and geodemographic
techniques are frequently used to
profile, stream and segment human
populations using ‘natural’ groupings
such as shared or common
behavioural traits – Medical, Clinical
Trial, Morbidity or Actuarial outcomes
– along with many other common
factors and shared characteristics.....
The profiling and analysis of large
aggregated datasets in order to
determine a ‘natural’ structure of
clusters or groupings, provides an
important basic technique for many
statistical and analytic applications.
Based on geographic distribution or
profile similarities – Geospatial
Clustering is a statistical method
whereby no prior assumptions are
made concerning the nature of
internal data structures (the number
and type of groups and hierarchies).

4D Geospatial Analytics
GIS
Gazetteer

Social Intelligence – Lifestyle Understanding
Pyramid STREAMING and SEGMENTATION
• Multiple Pyramids can be created and cross-referenced using Social Intelligence and Brand
Interaction / Fan-base Profiling and Segmentation in order to deliver actionable insights for any
genre of Brand Loyalty and Lifestyle Understanding – as well as for other Geo-demographic
Analytics purposes – e.g. Digital Healthcare, Clinical Trials, Morbidity and Actuarial Outcomes: -
– Music (e.g. BBC and Sony Music)
– Broadcasting (e.g. Radio 1 / American Idol)
– Digital Media Content (e.g. Sony Films / Netflix)
– Sports Franchises (e.g. Manchester City / New York City)
– Sport Footwear and Apparel (e.g. Nike, Puma, Adidas, Reebok)
– Fast Fashion Retailers (e.g. ASOS, Next, New Look, Primark)
– Luxury Brands / Aggregators (e.g. Armani, Burberry, Versace / LVMH, PPR, Richemont)
– Multi-channel Retailers – Brand Affinity / Loyalty Marketing + Product Campaigns, Offers & Promotions
– Financial Services Companies – Brand Protection and Reputation Management
– Financial Services Sector – Wealth Management, Retail Banking and Financial Services
– Travel, Leisure and Entertainment Organisations - Destination Events and Resorts
– MVNO / CSPs - OTT Business Partner Analytics (Sky Go, Netflix, iPlayer via Firebrand / Apigee)
– Telco, Media and Communications - Churn Management / Conquest / Up-sell / Cross-sell Campaigns
– Digital Healthcare – Private / Public Healthcare Service Provisioning: - Geo-demographic Clustering and
Propensity Modelling (Patient Monitoring, Wellbeing, Clinical Trials, Morbidity and Actuarial Outcomes)

Social Intelligence – Fan-base Understanding

Social Intelligence – Fan-base Understanding
PROFILE SEGMENTS - Social Intelligence – Fan-base Understanding
• Social Intelligence drives Brand Loyalty Understanding - Fan-base Profiling, Streaming and Segmentation – expressed in the creation and maintenance of a detailed History and Balanced Scorecard for every individual in the Pyramid, allowing summation by Stream / Segment: -
1. Fanatics – demonstrate total Commitment / Dedication / Loyalty for all aspects of the Brand / Product / Media
2. Supporters– show strong need, desire and propensity to support Brand / Product / Media consumption
3. Enthusiasts – engaged with the Brand, participate in Brand / Product / Media events and merchandising
4. Followers – follow the Brand, engage with social media and consume brand communications
5. Casuals – exhibit Brand awareness and interest
6. Disconnected – need to re-engage with the Brand
7. Indifferent – need to educate them about core Brand Values
8. Unconnected – need to draw their attention towards the Brand
PROPENSITY – Balanced Scorecard
• Balanced Scorecard – is a summary of all the data-points for an Individual / Stream / Segment
• Propensity Score – In the statistical analysis of observational data, Propensity Score Matching (PSM) is a statistical matching technique that attempts to estimate the effect of a Campaign / Offer / Promotion or other intervention by calculating the impact of factors that predict the outcome of the Campaign / Offer / Promotion.
• Propensity Model – is the Baysian probability of the outcome of an event in an Individual / Stream / Segment
• Predictive Analytics - an area of data mining that deals with extracting information from data and using it to predict trends and behaviour patterns. Often the unknown event of interest is in the future, however, Predictive Analytics can be applied to any type of event with an unknown outcome - in the past, present or future.

Social Intelligence – Fan-base Understanding Social Intelligence – Fan-base Understanding

Social Intelligence – Social Interaction
Social Interaction Pyramid Rules
1. Promiscuous – Open Networker – virtual Social Network across all categories- will connect with anybody
2. Networker – Social Network clustered around shared, common interests – Sport. Music and Fashion etc.
3. Friends and Family – Social Network clustered around physical social contacts - Friends and Family
4. Workplace – Social Network clustered around Work and Colleagues (e.g. City Brokers, Traders)
5. Eternal Student – Social Network clustered around School / College / University Alumni
6. Home Boy – Social Network clustered around Home Location Postcodes (Gang Culture)
7. Lone Wolf – sparse / thin social network - may share negative information (Trolling)
8. Inactive – not engaged – low evidence / low affinity / low interest in Social Media
Number of Segments
• With anonymous data (e.g polls) then the number of initial Segments is 4 (Matt Hart). With named individuals
we can discover much richer internal and external data sources (Social Media / User Content / Experian) - and
therefore segment the population with greater granularity
Individuals Qualifying for Multiple Segments.
• When individuals qualify for multiple segments - we can either add these deviant individuals to the Segment
that they have the greatest affinity with - or kick out any such deviants into an Outlying / Outcast /
Miscellaneous Segment for further processing or manual profiling / intervention

Social Interaction
How consumers use social media (e.g., Facebook, Twitter) to address and/or engage with companies around social and environmental issues.


Observing, Understanding and Predicting Human Actions
Economic Analysis – Human Actions Economist Ludwig von Mises, explains that complex market phenomena are
simply "the outcomes of endless conscious, purposeful individual actions, by countless individuals exercising personal choices and preferences - each of whom is trying as best they can to optimise their circumstances in order to achieve various needs and desires. Individuals, through economic activity
strive to attain their preferred outcomes - whilst at the same time attempting to avoid any unintended consequences leading to unforeseen outcomes." s

Understanding Human Actions

Summary
• In his foreword to Human Action: A Treatise on Economics, the great Austrian School Economist, Ludwig von Mises, explains that complex market phenomena are simply "the outcomes of endless conscious, purposeful individual actions, by countless individuals exercising personal choices and preferences - each of whom is trying as best they can to optimise their circumstances in order to achieve various needs and desires. Individuals, through economic activity strive to attain their preferred outcomes - whilst at the same time attempting to avoid any unintended consequences leading to unforeseen outcomes."
• Thus von Mises lucidly presents the basis of economics as the science of observing, analysing, understanding and predicting intimate human behaviour (human actions – micro-economics) – which when aggregated together in a Market creates the flow of goods, services, people and capital (market phenomena – macro-economy).
• Human actions - individual choices in response to subjective personal value judgments ultimately determine all market phenomena - patterns of supply and demand, production and consumption, costs and prices, and even levels of profits and losses.....


• In his foreword to Human Action: A Treatise on Economics, the great Austrian School Economist, Ludwig von Mises, explains that complex market phenomena are simply "the outcomes of endless conscious, purposeful individual actions, by countless individuals exercising personal choices and preferences - each of whom is trying as best they can to optimise their circumstances in order to achieve various needs and desires. Individuals, through economic activity strive to attain their preferred outcomes - whilst at the same time attempting to avoid any unwanted outcomes leading to unintended consequences."
• Thus von Mises lucidly presents the basis of economics as the science of observing, analysing, understanding and predicting intimate human behaviour (human actions – or micro-economics) – which when aggregated creates the flow of goods, services, people and capital (market phenomena - or the macro-economy). Individual choices in response to subjective personal value judgments ultimately determine all market phenomena - patterns of supply and demand, production and consumption, costs and prices, and even profits and losses. Although commodity prices may appear to be set by economic planners in central banks under strict government control - it is, in fact, the actions of individual consumers living in communities and participating in their local economy who actually determine what the Real Economic value of commodity prices really are. As a result of the individual choices and collective actions exercised by producers and consumers through competitive bidding in markets for capital and labour, goods and materials, products and services throughout all global markets – ultimately the global economy is both driven by, and is the product of - the sum of all individual human actions.
Austrian School of Real Economics

Joseph Schumpeter
• Joseph Schumpeter studied under the great Austrian economist Bohm-Bawerk, - but he was
far too independent in his thinking to be a part of any formal political movement or economic
school. The publication of his book the Theory of Economic Development was effectively
Schumpeter’s declaration of independence from the formal Austrian School “Real” Economic
Theory of capital transfer and disruptive economic change.
• In this book, Schumpeter introduces the Business Cycle Theory as the driving force behind
Economic Development – a theory of Capital Transfer which shocked many of his more
orthodox and conventional colleagues. Economic development, Schumpeter argues, involves
transferring capital from old businesses (cash cows) with their established methods of goods
production – to emerging businesses (rising stars) using new, innovative methods of production.
• Schumpeter’s special insight comes in trying to explain how the transfer of capital from old
industries (cash cows) into new and emerging industries (rising stars) takes place. Schumpeter
argued that capital transfer takes place through credit expansion. Through the fractional reserve
system, banks are able to create credit (print money.....), quite literally out of thin air. This money
is lent to businesses pioneering new methods of production, who then bid up the price of
production goods and consumer products in their effort to pay for the production goods they
require. Thus a form of inflationary spoliation takes place at the expense of established
businesses and consumers. Although Schumpeter does not draw attention specifically to the spoliation inference from his theory, it is nonetheless, still there in the text for all to see.....

Econometrics

Value Creation vs. Value Consumption
• We live in a natural world which, at the birth of civilisation, once was brimming to the full with innumerable and diverse natural resources. It is important to realise that Wealth was never bestowed on us “for free“ simply as a result of that abundant feedstock of natural resources.
• Throughout History, Wealth was always extracted or created through Human Actions – the result of countless men executing primary Value Creation Processes throughout the last 10,000 years- -such as Hunting and Gathering, Fishing and Forestry, Agriculture and Livestock, Mining and Quarrying, Refining and Manufacturing. Secondary Added Value Processes - such as Transport and Trading, Shipping and Mercantilism – serve only to Add Value to primary Wealth which was originally created by the labour of others executing primary Value Chain Processes.
• The Economic Wealth that we enjoy today as an advanced globalised society is not generated “magically” through intellectual discovery and technology innovation, nor through market phenomena created by the efforts of brokers and traders - or even by monetarist intervention from economic planners or central bankers. Economic Wealth is as a result of the effort of man - Human Actions and primary Value Chain Processes generating Utility or Exchange Value
• Vast amounts of Wealth can also be created (and destroyed.....) via Market Phenomena - the “Boom” and “Bust” Business Cycles of Economic Growth and Recession which act to influence the Demand / Supply Models and Price Curves of Commodities, Bonds, Stocks and Shares in Global Markets. Market Phenomena are simply the sum of all Human Actions – the aggregated activity of Traders and Brokers, Buyers and Sellers participating in that particular marketplace.

Value Creation in Business
• As an introduction to this special topic of the Value Chain - we have defined value
creation in terms of: “Utility Value” which is contrasted with “Exchange Value” -
1. “Utility Value” – skills, learning, know-how, intellectual property and acquired knowledge
2. “Exchange Value” – land, property, capital, goods, traded instruments, commodities and
accumulated wealth.
• Some of the key issues related to the study of Value are discussed - including the
topics of value creation, capture and consumption. All Utility and Exchange Value is
derived from fundamental Human Actions. Although this definition of value creation is
common across multiple levels of activity and analysis, the process of value creation
will differ based on its origination or source - whether that economic value is created
by an individual, a community, an enterprise - or due to Market Phenomena.
• We explore the concepts of Human Actions, competition for scarce resources and
market isolating mechanisms which drive Business Cycles and Market Phenomena in
the Global Economy - using Value Chain analysis in order to explain how value may
be created, exchanged and captured – or consumed, dissipated and lost – as a result
of different activities using different processes at various levels within the Value Chain

Value Creation in Business
• In order to develop a theory of value creation by enterprises, it is useful to first characterise the value creation process. In the next two sections of this document we develop a framework that builds upon Schumpeter's arguments to show: -
1. In any economy, the Creation of Value is solely as a consequence of Human Actions
2. As a result of Human Actions, Value may be created, captured, stockpiled or consumed
3. Also, in any economy, every Individual and Organisation competes with each other for the sole use of scare resources – land, property, capital, labour, machinery, traded instruments and commodities – which may be either raw materials or finished goods
4. New and innovative combinations of resources gives the potential to create new value
5. Mercantilism – shipping, transport, sales, trading, battering and exchange of these new combinations of resources - accounts for the actual realization of this potential value
• In other words - resource combination and exchange lie at the heart of the value creation process and in sections II and III we both describe how this process functions - and also identify the conditions that facilitate and encourage, or slow down and impede, each of these five elements of the Value Creation process.

Value Creation in Business
• This framework establishes the theoretical infrastructure for the analysis of the roles firms play in this value creation process and of how both firms and markets collectively influence the process of economic development – which is derived from Human Actions: -
1. Value Creation – primary Wealth Creation Processes
2. Value Capture – the Acquisition of Wealth by means other than Value Creation
3. Value Stockpiling – the Accumulation of Wealth
4. Value-added Services – Mercantilism, shipping, transport, sales, trading, battering , exchange
5. Value Consumption – the depletion of Resources or the exhaustion of Wealth
• As our analysis of the requirements for effective resource combination and exchange reveals, global market phenomena alone are able to create only a very small fraction of the total value that can be created out of the stock of resources available in economies. The very different institutional nature and context of enterprises, operating in a state of creative tension within global markets, substantially enhance the fraction of the total potential value that can be obtained out of nature’s resources. We describe this process of value creation by firms and, in section V, we integrate the firm's role with that of markets to explain why both firms and markets are needed to ensure that economies develop and progress in a way that achieves what Douglass North (1990) has described as "adaptive efficiency."'

Value Creation vs. Value Consumption
• There are five major roles for people in society: those who create wealth – Primary Value
Creators (Agriculture and Manufacturing) , those who Capture Value from others (through
Taxation, War, Plunder or Theft) those who stockpile Wealth (Savers) and those who
merely consume the wealth generated by others – Value Consumers.. Somewhere in the
middle are the Added Value Providers – those who create secondary value by executing
value-added processes to commodities and goods created by primary Value Creators.
1. Value Creators – primary Wealth Creators working in Agriculture and Manufacturing
2. Value Acquirers – those who capture Wealth generated by others e.g. via Inheritance, Taxation by City, State and Federal Government , or through war, plunder and theft
3. Value Accumulators – those who aggregate, stockpile and hoard Wealth e.g. Savers
4. Value-adders – Secondary Wealth Creators who add value to basic commodities through the human actions of mercantilism, shipping, transport, sales, trading, and retailing
5. Value Consumers – Everyone consumes resources and depletes wealth to some degree by spending their earnings on Food, Housing, Utilities, Clothes, Entertainment and so on.
• About half of society – Children, Students, Invalid and Sick, Unemployed and Government
Workers – consume much of the wealth generated by Primary and Secondary Wealth
Creators – offsetting only little of their depletion of Resources or consumption of Wealth.

Wave-form Analytics in Econometrics

WAVE THEORY – NATURAL CYCLES
Milankovitch Astronomic Cycles
• Milankovitch Cycles are a Composite Harmonic Wave Series built up from individual wave-forms with
periodicity of 20-100 thousand years - exhibiting multiple wave harmonics, resonance and interference
patterns. Over very long periods of astronomic time Milankovitch Cycles and Sub-cycles have been
beating out precise periodic waves, acting in concert together, like a vast celestial metronome.
• From the numerous geological examples found in Nature including ice-cores, marine sediments and
calcite deposits, we know that Composite Wave Models such as Milankovitch Cycles behave as a
Composite Wave Series with automatic, self-regulating control mechanisms - and demonstrate
Harmonic. Resonance and Interference Patters with extraordinary stability in periodicity through
many system cycles over durations measured in tens of millions of years.
• Climatic Change and the fundamental astronomical and climatic cyclic variation frequencies are
coherent, strongly aligned and phase-locked with the predictable orbital variation of 20-100 k.y
Milankovitch Climatic Cycles – which have been modeled and measured for many iterations, over a
prolonged period of time, and across many levels of temporal tiers - each tier hosting different types of
geological processes, which in turn influence different layers of Human Activity.
• Milankovitch Cycles - are precise astronomical cycles with periodicities of 22, 41, 100 and 400 k.y
– Precession (Polar Wandering) - 22,000 year cycle
– Eccentricity (Orbital Ellipse) 100,000 and 400,000 year cycles
– Obliquity (Axial Tilt) - 41,000-year cycle

WAVE THEORY – NATURAL CYCLES
Sub-Milankovitch Climatic Cycles
• Sub-Milankovitch Climatic Cycles are less well understood – varying from Sun Cycles of 11 years
to Climatic Variation Trends of up to 1470 years intervals, may also impact on Human Activity –
short-term Economic Patterns, Cycles and Innovation Trends – to long-term Technology Waves and
the rise and fall of Civilizations. A possible explanation might be found in Resonance Harmonics of
Milankovitch-Cycles 20-100 ky / sub-Cycle Periodicity - resulting in Interference Phenomenon from
periodic waves being re-enforced and cancelled. Dansgaard-Oeschger (D/O) events – with precise
1470 years intervals - occurred repeatedly throughout much of the late Quaternary Period.
Dansgaard-Oeschger (D/O) events were first reported in Greenland ice cores by scientists Willi
Dansgaard and Hans Oeschger. Each of the 25 observed D/O events in the Quaternary Glaciation
Time Series consist of an abrupt warming to near-interglacial conditions that occurred in a matter of
decades - followed by a long period of gradual cooling down again over thousands of years
• Sub-Milankovitch Climatic Cycles - Harmonic. Resonance and Interference Wave Series
– Solar Forcing Climatic Cycle at 300-Year, 36 and 11 years
• Grand Solar Cycle at 300 years with 36 and 11 year Harmonics
• Sunspot Cycle at 11years
– Oceanic Forcing Climatic Cycles at 1470 years (and at 490 / 735 / 980 years ?)
• Dansgaard-Oeschger Cycles – Quaternary
• Bond Cycles - Pleistocene
– Atmospheric Forcing Climatic Cycles at 117, 64, 57 and 11 years
• North Atlantic Climate Anomalies
• Southern Oscillation - El Nino / La Nina

WAVE THEORY – NATURAL CYCLES and HUMAN ACTIVITY
Dr. Nicola Scafetta - solar-lunar cycle climate forecast -v- global temperature
• In his recent publications Dr. Nicola Scafetta proposed an harmonic wave model of the global
climate, comprised of four major decadal and multi-decadal cycles (periodicity 9.1, 10.4, 20 and 60
years) - which are not only consistent with four major solar/lunar/astronomical cycles - plus a
corrected anthropogenic net warming contribution – but they are also approximately coincident with
Business Cycles taken from Joseph Schumpter’s Economic Wave Series . The model was not only
able to reconstruct the historic decadal patterns of the temperature since 1850 better than any
general circulation model (GCM) adopted by the IPCC in 2007, but it is apparently able to better
forecast the actual temperature pattern observed since 2000. Note that since 2000 the proposed
model is a full forecast. Will the forecast hold, or is the proposed model is just another failed
attempt to forecast climate change? Only time will tell.....
• Randomness. Neither data-driven nor model-driven macro-cyclic Natural or micro-cyclic Human
Activity Composite Wave Series models are alone able to deal with the concept of randomness
(uncertainty) – we therefore need to consider and factor in further novel and disruptive (systemic)
approaches which offer us the possibility to manage uncertainty by searching for, detecting and
identifying Weak Signals - which in turn may predicate possible future chaotic, and radically
disruptive Wild Card or Black Swan events. Random Events can then be factored into Complex
Systems Modelling – so that a Composite Wave Series may be considered and modeled
successfully as an Ordered (Constrained) Complex System – with a clear set of rules (Harmonic.
Resonance and Interference Patters) and exhibiting ordered (restricted) numbers of elements and
classes, relationships and types interacting with randomness, uncertainty, chaos and disruption.
Scafetta on his latest paper: Harmonic climate model versus the IPCC general circulation climate models


WAVE THEORY – NATURAL CYCLES and HUMAN ACTIVITY
• Infinitesimally small differences may be imperceptible to the point of invisibility - how tiny can
influences be to have any effect ? Such influences may take time to manifest themselves –
perhaps not appearing as a measurable effect until many system cycle iterations have been
completed – such is the nature of the "strange attractor." effect. This phenomenon is captured in
the Climate Change “butterfly scenario” example, which is described below.
• Climate change is not uniform – some areas of the globe (Arctic and Antarctica) have seen a
dramatic rise in average annual temperature whilst other areas have seen lower temperature
gains. The original published temperature record for Climate Change is in red, while the updated
version is in blue. The black curve is the proposed harmonic component plus the proposed
corrected anthropogenic warming trend. The figure shows in yellow the harmonic component
alone made of the four cycles, which may be interpreted as a lower boundary limit for the natural
variability. The green area represents the range of the IPCC 2007 GCM projections.
• The astronomical / harmonic model forecast since 2000 looks in good agreement with the data
gathered up to now, whilst the IPCC model projection is not in agreement with the steady
temperature observed since 2000. This may be due to other effects, such as cooling due to
increased water evaporation (humidity has increased about 4% since measurements began in the
18th centaury) or cloud seeded by jet aircraft condensation trails – which reduce solar forcing by
reflecting energy back into space. Both short-term solar-lunar cycle climate forecasting and
long-term Milankovitch solar forcing cycles point towards a natural cyclic phase of gradual
cooling - which partially off-sets those Climate Change factors (Co2 etc.) due to Human Actions.
Scafetta on his latest paper: Harmonic climate model versus the IPCC general circulation climate models


Wave-form Analytics in Econometrics • Wave-form Analytics – characterised as periodic sequences of regular, recurring high
and low activity resulting in cyclic phases of increased and reduced periodic trends –
supports an integrated study of complex, compound wave forms – which can be
used in order to identify hidden Cycles, Patterns and Trends in Economic Big Data.
• The challenge found everywhere in business cycle theory is how to interpret
interacting large scale, long period, compound wave-form (polyphonic) temporal data
sets which are variable (dynamic) in nature – the Schumpter Economic Wave Series.

Wave-form Analytics in Econometrics
• Biological, Sociological, Economic and Political systems all tend to demonstrate
Complex Adaptive System (CAS) behaviour - which appears to be more similar
in nature to biological behaviour in a living organism than to Disorderly, Chaotic,
Stochastic Systems (“Random” Systems). For example, the remarkable
adaptability, stability and resilience of market economies may be demonstrated by
the impact of Black Swan Events causing stock market crashes - such as oil price
shocks (1970-72) and credit supply shocks (1927- 1929 and 2008 onwards).
Unexpected and surprising Cycle Pattern changes have historically occurred
during regional and global conflicts being fuelled by technology innovation-driven
arms races - and also during US Republican administrations (Reagan and Bush -
why?). Just as advances in electron microscopy have revolutionised biology -
non-stationary time series wave-form analysis has opened up a new space for
Biological, Sociological, Economic and Political system studies and diagnostics.
• The Wigner-Gabor-Qian (WGQ) spectrogram method demonstrates a distinct
capability for identifying revealing multiple and complex superimposed cycles or
waves within dynamic, noisy and chaotic time-series data sets – without the need
for using repetitive individual wave-form estimation and elimination techniques.

Wave-form Analytics
Track and Monitor
Investigate and
Analyse
Scan and Identify
Separate and Isolate
Communicate Discover
Verify and Validate Disaggregate
Background Noise
Individual Wave
Composite Waves
Wave-form Characteristics

Wave-form Analytics in Econometrics
Schumpter Economic Wave series: -
1. Kitchen Inventory Cycle - 1.5 - 3 years
2. Juglar Business Cycle - 7 - 11 years
3. Kusnets Technology Innovation Cycle - 20-25 years
4. Kondriatev Infrastructure Investment cycle - 40-50 years
Strauss / Howe Generation Waves
1. Generation Waves - 18-25 years
2. The Saeculum - 80-100 years
Black Swan Event Types – Fiscal Shock Waves
1. Money Supply Shock Waves
2. Commodity Price Shock Waves
3. Sovereign Debt Default Shock Waves

Wave-form Analytics in Econometrics
• • WAVE-FORM ANALYTICS • is a method which utilises wave frequency and time
symmetry principles “borrowed” from spectral wave frequency analysis in Physics. In
the study of complex cyclic phenomena where multiple (compound) dynamic wave-
form models compete in a large array of interacting and inter-dependant cyclic
systems, trend-cycle decomposition is a critical technique for testing the validity of
waves driven by both deterministic (human actions) and stochastic (random, chaotic)
paradigms. When we deploy the Wigner-Gabor-Qian (WGQ) spectrogram in Wave-
form Analytics – an analytical tool based on Wave-form and Time-frequency – we
demonstrate distinct trend forecasting and analysis capability.
• WAVE-FORM ANALYTICS in BIG DATA • supports an integrated study of complex,
compound wave forms to identify hidden Cycles, Patterns and Trends in Big Data –
typically characterised as periodic sequences of regular, recurring increased–reduced
time-series activity, resulting in cyclic phases of high–low periodic trends. Exploration
of the characteristic frequencies found in very large scale time-series Economic data
sets (Big Data) reveals strong evidence and valuable insights into the inherent stable
and enduring fundamental wave structure of Business Cycles.
The challenge found everywhere in business cycle theory is understanding how to
interpret interacting large scale, long period, compound wave-form (polyphonic)
temporal data sets which are variable (dynamic) in nature : -

Wave-form Analytics in Econometrics The generational interpretation of the post-depression era
• The generational model holds that the Kondriatev Infrastructure Investment Cycle (K-cycle ) has
shifted from one-half to a full saeculum in length as a result of industrialization and is now about 72
years long. The cause of this lengthening is the emergence of government economic management,
which itself is a direct effect of industrialization as mediated through the generational saeculum
cycle.

Wave-form Analytics in Econometrics
• Wave-form Analytics – characterised as periodic sequences of regular, recurring
high and low activity resulting in cyclic phases of increased and reduced periodic
trends – supports an integrated study of complex, compound wave forms in
order to identify hidden Cycles, Patterns and Trends in Economic Big Data.
• The existence of fundamental stable characteristic frequencies found within large
aggregations of time-series economic data sets (“Big Data”) provides us with
strong evidence and valuable insights about the inherent structure of Business
Cycles. The challenge found everywhere in business cycle theory is how to
interpret very large scale / long period compound-wave (polyphonic) time series
data sets which are in nature dynamic (non-stationary) such as the Schumpter
Economic Wave series - Kitchen, Juglar, Kusnets, Kondriatev - along with other
geo-political and economic waves - the Saeculum Century Wave and Strauss /
Howe Generation Waves.
• The challenge found everywhere in business cycle theory is how to interpret
interacting large scale, long period, compound wave-form (polyphonic) temporal
data sets which are variable (dynamic) in nature – which is beset with numerous
perplexities and many ambiguities: -


Wave-form Analytics in Econometrics
The generational interpretation of economics in the post-depression era
• The Strauss-Howe model holds that the Kondriatev Infrastructure Investment Cycle
(K-cycle ) has shifted from one-half to a full saeculum in length - as a result of global
industrialization - and is now about 72 years long. The cause of this lengthening is
the emergence of government economic management, which itself is a direct effect
of industrialization as mediated through the generational saeculum cycle. The
rise of the industrial economy did more than simply introduce the Kitchen cycle. It
also increased the intensity in the Strauss-Howe model of Kitchen, Kuznets and
Kondratiev cycles - all of which had already been part of the pre-industrial economy.
• Whilst the Kuznets-related Panic of 1819 was the first stock market panic to make it
into the history books, it was a pretty mild bear market. The Panic of 1837 was worse
and the one in 1857 worse still. The Panic of 1873 ushered in the second worst bear
market of all time. The depression following the Panic of 1893 was the worst up to
that time. This depression was the first to take place with a majority of the population
involved in non-agricultural occupations. Although hard times on the farm were a
frequent occurrence, depressions did not usually mean hunger. Yet for the large
numbers of urban workers thrown onto "the industrial scrap heap" the depression of
the 1890's produced a level of suffering unprecedented by a business fluctuation.

Figure 1. Economic Wave Series – Joseph Schumpeter Business Cycles
Figure 2. Geo-political Wave Series – Strauss-Howe Generation Waves
Cycle Pre-industrial (before 1860) Modern (post 1929)
Kitchen Inventory Cycle (KI-cycle) Stock-turn Cycle (3-5 years) One KI-cycle = 5 years
Juglar Fixed Investment Cycle (J-cycle) Business Cycle (7-11 years) One J-cycle = 10 years
Kuznets Infrastructure Cycle (KU-cycle) Property Cycle (15-25 years) One KU-cycle = 20 years
Kondratiev Cycle (KO-cycle) Technology Cycle (45-60 years) One KO-cycle = 40 years
Grand-cycle / Super-cycle (GS-cycle) Saeculum (70 years +) Two KO-cycles = 80 years
Cycle Pre-industrial (before 1860) Modern (post 1929)
Juglar Fixed Investment Cycle (J-cycle) Business Cycle (8-11 years) Economic Wave - 9 years
Kuznets Infrastructure Cycle (KU-cycle) Asset Cycle (20-25 years) Investment Wave - 18 years
Strauss-Howe Cycle (SH-cycle) Population Cycle (20-30 years) Generation Wave – 20-25 years
Kondratiev Cycle (KO-cycle) Industry Cycle (45-60 years) Innovation Wave – 30-45 years
Grand-cycle / Super-cycle (GS-cycle) Saeculum (70 years +) Century Wave – 60-90 years
Wave-form Analytics in Econometrics

Wave-form Analytics in Econometrics
Business Cycles
2. ANNUAL – Publish Annual Report
3. Kitchen
Inventory Cycle
(KI-cycle)
1. QUARTER –
Publish Quarterly Forecasts
8. Grand-cycle / Super-cycle (GS-cycle)
5. Kuznets
Fixed Asset Cycle
(KU-cycle)
4. Juglar Fixed Investment
Cycle (J-cycle)
6. Strauss-Howe
Generation Wave
(SH-cycle)
7. Kondratiev
Cycle (KO-cycle) Money Supply /
Commodity Price / Sovereign Default
War, Terrorism, Revolution
Population Curves / Human Migration
Human Activity / Natural Disasters
Stock-turn Cycle
(3-5 years)
Business Cycle
(7-11 years)
Infrastructure
Investment Cycle (15-25 years)
Strauss-Howe
Generation Wave
(15-25 years)
Technology
Cycle
(35-60 years)
Saeculum
Century Wave
(75-120 years)
Quarterly Profit Forecasts
Annual Financial Report
Disruptive Change – Technology Innovation
Infrastructure Investment
Programmes
Geo-political Rivalry and Arms Races
Inventory Refreshment


Economic Modelling and Long-range Forecasting
• The way that we think about the future must mirror how the future actually unfolds. We have learned from recent experience, that the future is not a straightforward extrapolation of simple, single-domain trends. We now have to consider ways in which random, chaotic and radically disruptive events may be factored into enterprise threat assessment and risk management frameworks - and incorporated into enterprise decision-making structures and processes.
• Economic Modelling and Long-range Forecasting is driven by Data Warehouse Structures and Economic Models containing both Historic (up to 20 years daily closing prices for LNG and all grades of crude) and Future values (daily forecast and weekly projected price curves, monthly and quarterly movement predictions, and so on for up to 20 years into the future – giving a total timeline of 40-year (+ / - 20 years Historic and Future trends summary, outline movements and highlights). Forecast results are obtained using Economic Models - Quantitative (Technical) Analysis (Monte Carlo Simulation, Pattern and Trend Analysis - Economic growth . contraction and Recession / Depression shapes along with Commodity Price Curve Data Sets) – in turn driving Qualitative (Narrative) Scenario Planning and Impact Analysis techniques.

• Many Economists and Economic Planners have widely arrived at the consensus that a large
majority of organizations have yet to develop sophisticated Economic Modelling systems and
integrated their outputs into the strategic planning process. The objective of this paper is to
shed some light into the current state of the business and economic environmental scanning,
tracking, monitoring and forecasting function in organizations Impacted by Business Cycles.
• Major periodic changes in business activity are due to recurring cyclic phases in economic
expansion and contraction - classical “bear” and “bull” markets, or “boom and bust” cycles.
The time series decomposition necessary to explain this complex phenomenon presents us
with many interpretive difficulties – due to background “noise” and interference as multiple
business cycles, patterns and trends interact and impact upon each other. We are now able
to compare cyclical movements in output levels, deviations from trend, and smoothed growth
rates of the principal measures of aggregate economic activity - the quarterly Real (Austrian)
GDP and the monthly U.S. Coincident Index - using the phase average trend (PAT).
• This paper provides a study of business cycles - which are defined as periodic sequences of
expansion and contraction in the general level of economic activity. The proposed Wave-
form Analytics approach helps us to identify Cycles, Patterns and Trends in Big Data. This
approach may be characterised as periodic sequences of high and low business activity
resulting in cyclic phases of increased and reduced output trends – supporting an integrated
study of disaggregated economic cycles that does not require repeated multiple and iterative
processes of trend estimation and elimination for every possible business cycle duration..
Economic Modelling and Long-range Forecasting

Business Cycles, Patterns and
Trends • The purpose of this section is to examine the nature and content of Clement Juglar’s
contribution to Business Cycle Theory and then to compare and contrast it with that of Joseph
Schumpeter’s analysis of cyclical economic fluctuations. There are many similarities evident -
but there are also some important differences between the two authorities theories.
Schumpeter’s classical Business Cycle is driven by a series of multiple co-dependent
technology innovations of low to medium impact - whereas according to Juglar the trigger for
a runaway boom is market speculation fuelled by over-supply of credit. A deeper examination
of Juglar’s business cycles can reveal the richness of Juglar’s original and very interesting
approach. Indeed Juglar, without having proposed a complete theory of business cycles,
nevertheless provides us with an original theory supporting a more detailed comparison and
benchmarking between these two co-existing and compatible business cycle theories.
• In a specific economic context characterised by the rapid development of both industry and
trade, Juglar's theory interconnects the development of new markets with credit availability,
speculative investments and the bank’s behaviours in response to the various phases of the
Business Cycle – Crisis, Liquidation, Recovery, Growth and Prosperity, . The way that the
money supply, credit availability and industrial development interact to create business cycles
is quite different in Juglar’s viewpoint than that expressed by Schumpeter in his theory of
economic development – but does not necessarily express any fundamental contradiction.
Compared and contrasted, the two different approaches refer to market phenomena which
are both separate and different – but still entirely compatible and co-existent.

Waves, Cycles, Patterns and Trends
• Business Cycles were once thought to be an economic phenomenon due to periodic fluctuations in economic activity. These mid-term economic cycle fluctuations are usually measured using Real (Austrian) Gross Domestic Product (rGDP). Business Cycles take place against a long-term background trend in Economic Output – growth, stagnation or recession – which affects Money Supply as well as the relative availability and consumption (Demand v. Supply and Value v. Price) of other Economic Commodities. Any excess of Money Supply may lead to an economic expansion or “boom”, conversely shortage of Money Supply may lead to economic contraction or “bust”. Business Cycles are recurring, fluctuating levels of economic activity experiences in an economy over a significant timeline (decades or centuries).
• The five stages of Business Cycles are growth (expansion), peak, recession (contraction), trough and recovery. Business Cycles were once widely thought to be extremely regular, with predictable durations, but today’s Global Market Business Cycles are now thought to be unstable and appear to behave in irregular, random and even chaotic patterns – varying in frequency, range, magnitude and duration. Many leading economists now also suspect that Business Cycles may be influenced by fiscal policy as much as market phenomena - even that Global Economic “Wild Card” and “Black Swan” events are actually triggered by Economic Planners in Government Treasury Departments and in Central Banks as a result of manipulating the Money Supply under the interventionalist Fiscal Policies adopted by some Western Nations.

• Real (Austrian) business cycle theory assigns a central role to shock waves as the primary source of economic fluctuations or disturbances. As King and Rebelo (1999) discuss in .Resuscitating Real Business Cycles, when persistent technology shocks are fed through a standard real business cycle model – then the simulated economy displays impact patterns which are similar to those exhibited by actual business cycles. While the last decade has seen the addition of other types of shocks in these models - such as monetary policy and government spending - none has been shown to be a central impulse to business cycles.
• A trio of recent papers has called into question the theory that technology shocks have anything to do with the fundamental shape of business cycles. Although they use very different methods, Galí (1999), Shea (1998) and Basu, Kimball, and Fernald (1999) all present the same result: positive technology shocks appear to lead to declines in labour input.1 Galí identifies technology shocks using long-run restrictions in a structural VAR; Shea uses data on patents and R&D; and Basu, Kimball and Fernald identify technology shocks by estimating Hall-style regressions with proxies for utilization.
• In all cases, they find significant negative correlations of hours with the technology shock waves, Gail's paper also studies the effects of the non-technology shocks – such as Terrorism, Insecurity and Military Conflicts, as well as Monetary Supply and Commodity-price Shocks - which he suggests might be interpreted as demand / supply shocks. These shocks produce the typical business cycle co-movement between output and hours. In response to a positive shock, both output and hours show a rise in the typical hump-shaped pattern. Productivity also rises - but with only temporarily economic effect – modifying Business Cycles rather than radically altering them.
Economic Waves, Cycles, Patterns and Trends

Wave Theory Of Human Activity
• It seems that many Human Activity Cycles - Business, Social, Political, Economic, Historic and Pre-historic (Archaeology) Cycles -
may be compatible with, and map onto - one or more of the Natural Cycles.: -
• Earth and Lunar Natural Cycles - Diurnal to Annual (1 day to 1 year)
– Tidal Deposition Lamellae in Deltas, Estuaries and Salt Marshes – Diurnal
– Seasonal Growth rings in Stromatolites, Stalagmites and Trees - Annual / Biannual
– Lamellae in Ice Cores, Calcite Deposits, Lake and Marine Sediments – Annual / Biannual
• Human Activity Waves – Seasonal, Trading and Fiscal Cycles – Diurnal to Annual (1 day to 1 year)
• Natural Resonance / Harmonic / Interference Waves - Southern Oscillation / Solar Activity @ 3, 5, 7,11 years
• Schumpeter Composite Wave Series - Resonance / Harmonic Wave Cycles @ 3, 5, 7,11 & 15, 20, 25 years
– Kitchin inventory cycle of 3–5 years (after Joseph Kitchin);
– Juglar fixed investment cycle of 7–11 years (often referred to as 'the business cycle’);
– Kuznets infrastructural investment cycle of 15–25 years (after Simon Kuznets);
• Industrial / Technology Arms Race Cycles – 25 years
– American Civil War 1863
– Anglo-Chinese Opium War - 1888
– The Great War - 1914
– The Second World War - 1939
• Geo-political Rivalry and Conflict – 20 years (World Cup years - odd decades)
– Korean War - 1950
– Vietnam War - 1970
– 1st Gulf War - 1990
– “Arab Spring” Uprisings - 2010
– Culminating in a future Arabian Gulf Conflict in 2030 ?
• Geo-political Rivalry and Conflict – 20 years (Olympics Years - even decades)
– The Second World War - 1940
– Malayan Emergency - 1960
– Russian War in Afghanistan - 1980
– Balkan Conflict - 2000
– Culminating in a future Trade War between USA and China in 2020 ?

Wave Theory Of Human Activity
• It also seems that many Human Activity Cycles - Business, Social, Political, Economic, Historic and Pre-historic (Archaeology) Cycles - may be compatible with, and map onto - one or more of Minor Bond Climatic Cycles with periodicity at 117, 64 and 57 years
– Kondratiev wave or long technological cycle of 45–60 years (after Nikolai Kondratiev)
– Industry Cycles
– Generation Waves
– Technology Shock Waves
• Major Bond Climatic Cycles - 800 to 1000 and 1470 years – duration of Civilisations – Western Roman Empire (300 BC – 500 AD
– Eastern Roman Empire (500 – 1300 AD)
– Vikings and Normans - Nordic Ascendency (700-1500 AD)
– Anglo-French Rivalry – Norman Conquest to Entente Cordial (1066 -1911)
– Mayan Civilisation
– Khmer Civilisation (Amkor)
– Greenland Vikings (Medieval “mini Ice Age”)
– Pueblo Indians (Anastasia) – drought in South-Western USA
– Easter Islanders
• Milankovitch Climatic Cycles – Insolation for Quaternary Ice Ages (Pluvial / Inter-pluvial) – Clovis Culture, Soloutrean Culture, Neanderthal Culture
• Major Extinction-level Events (Kill Moments) – Pre-Cambrian and Cambrian Extinction Events – 1000-542 million years ago
– Permian-Triassic Boundary (PTB) Event – 251.4 million years ago
– Cretaceous – Tertiary Boundary Event – 65 million years agp
– Global Massive Change – 20 ky ago to present day (ongoing)

Wave-form Analytics in Cyclic Business Studies
• Trend-cycle decomposition is a critical technique for testing multiple competing dynamic models In the study of complex cyclic business phenomena - including both deterministic and stochastic (probabilistic) paradigms. A fundamental challenge found everywhere in business cycle theory is how to interpret compound (polyphonic) time series which are both complex and dynamic (non-stationary) in nature. Wave-form Analytics is a new analytical too based on Time-frequency analysis – a technique which exploits the wave frequency and time symmetry principle ,– which is introduced here or the first time in the field of study of business cycles, patterns and trends,.
• The Wigner-Gabor-Qian (WGQ) spectrogram demonstrated a strong capability for revealing complex cycles from noisy and non-stationary time series. Various competing deterministic and stochastic methods, including the first difference (FD) and Hodrick-Prescott (HP) filter, are tested with the mixed case of cycles and noise. The FD filter does not produce a consistent picture of business cycles. HP filter provides a good window for pattern recognition of business cycles. Existence of stable characteristic frequencies from economic aggregates provide strong evidence of endogenous cycles and valuable information about structural changes.
• Economic systems demonstrate Complex Adaptive System (CAS) behaviour - more similar to an organism than chaotic “Random Walks”. The remarkable stability and resilience of market economies can be seen from the impact of Black Swan Events causing stock market crashes - such as oil price shocks and credit crises. Surprising pattern changes occurred during wars, arm races, and during the Reagan administration. Like microscopy for biology, non-stationary time series analysis opens up a new space for business cycle studies and policy diagnostics.
• The role of time scale and preferred reference from economic observation is discussed. Fundamental constraints for Friedman's rational arbitrageurs are re examined from the view of information ambiguity and dynamic instability.

Quantitative and Qualitative Analysis Techniques
TECHNICAL (QUANTITATIVE) METHODS TECHNICAL (QUANTITATIVE) METHODS (cont.)
Asymptotic Methods and Perturbation Theory Statistical Arbitrage
“Big Data” - Statistical analysis of very large scale (VLS) datasets Technical (Quant) Analysis
Capital Adequacy – Liquidity Risk Modelling – Basle / Solvency II Trading Strategies - neutral, HFT, pairs, macro; derivatives;
Convex analysis Trade Risk Modelling: – Risk = Market Sentiment – Actual Results
Credit Risk Modelling (PD, LGD) Value-at-Risk (VaR)
Data Audit, Data Profiling. Data Mining and CHAID Analysis Volatility modelling (ARMA, GARCH)
Derivatives (vanilla and exotics)
Dynamic systems behaviour and bifurcation theory NARRATIVE (QUALITATIVE) METHODS
Dynamic systems complexity mapping and network reduction
Differential equations (stochastic, parabolic) “Big Data” -, Clinical Trials ,Morbidity and Actuarial Outcomes
Extreme value theory Business Strategy, Planning, Forecasting Simulation and Consolidation
Economic Growth / Recession Patterns (Boom / Bust Cycles) Causal Layer Analysis (CLA)
Economic Planning and Long-range Forecasting Chaos Theory
Economic Wave and Business Cycle Analysis Cluster Theory
Financial econometrics (economic factors and macro models) Complexity Theory
Financial time series analysis Complex (non-linear) Systems
Game Theory and Lanchester Theory Complex Adaptive Systems (CAS)
Integral equations Computational Theory (Turing)
Interest rates derivatives Delphi Oracle /Expert Panel / Social Media Survey
Ordered (Linear) Systems (simple linear multi-factor equations) Economic Wave Theory – Business Cycles (Austrian School)
Market Risk Modelling (Greeks; VaR) Fisher-Pry Analysis and Gomperttz Analysis
Markov Processes Forensic “Big Data” – Social Mapping and Fraud Detection
Monte Carlo Simulations and Cluster Analysis Geo-demographic Profiling and Cluster Analysis
Non-linear (quadratic) equations Horizon Scanning, Monitoring and Tracking
Neural networks, Machine Learning and Computerised Trading Information Theory (Shannon)
Numerical analysis & computational methods Monetary Theory – Money Supply (Neo-liberal and Neo-classical)
Optimal Goal-seeking, System Control and Optimisation Pattern, Cycle and Trend Analysis
Options pricing (Black-Scholes; binomial tree; extensions) Scenario Planning and Impact Analysis
Price Curves – Support / Resistance Price Levels - micro models Social Media – market sentiment forecasting and analysis
Quantitative (Technical) Analysis Value Chain Analysis – Wealth Creation and Consumption
Statistical Analysis and Graph Theory Weak Signals, Wild Cards and Black Swan Event Forecasting

Quantitative Analysis Techniques
• Quantitative (Technical) Analysis involves studying detailed micro-
economic models which process vast quantities of Market Data (commodity
price data sets). This method utilises a form of historic data analysis
technique which smoothes or profiles market trends into more predictable
short-term price curves - which will vary over time within a specific market.
• Quantitative (Technical) Analysts can initiate specific market responses
when prices reach support and resistance levels – via manual information
feeds to human Traders or by tripping buying or selling triggers where
autonomous Computer Trading is deployed. Technical Analysis is data-
driven (experiential), not model-driven (empirical) because our current
economic models do not support the observed market data. The key to both
approaches, however, is in identifying, analysing, and anticipating subtle
changes in the average direction of movement for Price Curves – which in
turn reflect relatively short-term Market Trends.

Quantitative Analysis Techniques
• Quantitative (Technical) Analysis – Techniques such as Monte Carlo
Simulation cycle numerous macro-economic model runs repeatedly through
thousands of iterations – minutely varying the values of starting conditions
for each and every individual run cycle. The Probability of each of these
results occurring can be determined using Bayesian Analysis.
• Monte Carlo Simulation result sets appear as a scatter diagram consisting
of thousands of individual points for commodity prices over a given time line.
Instead of a random distribution – we discover clusters of closely related
results in a background of a few scattered outliers. Each of these clusters
represents a Scenario – which is analysed using Cluster Analysis methods -
Causal Layer Analysis (CLA), Scenario Planning and Impact Analysis–
where numeric results are explained as a narrative story about a possible
future outcome – along with the probability of that scenario materialising.
• Qualitative (Narrative) Analysis involves a further stage of narrative
scenario planning and impact analysis which explains the clustered results
which were generated previously using Monte Carlo Simulation.

Juglar Business Cycle
• The first scholarly authority to seriously explore Economic Cycles as periodically
recurring market phenomena – was the French physician and statistician Clément
Juglar, who in 1860 identified the Juglar Cycle – a Business Cycle based on a
periodicity range of roughly 8 to 11 years. Later economic authorities, such as
Austrian School Economist Joseph Schumpeter, further developed Juglar’s
approach – by distinguishing up to five phases, or stages, which are found in a
typical Juglar Business Cycle – Crisis, Liquidation, Recovery, Growth and
Prosperity. At the same time, Malthus also noted a similar phenomenon in
nature – Population Dynamics demonstrated by Biological Systems –
Ecological Stress, Population Crash, Recovery, Growth and Stability.
• The Juglar Business Cycle is now widely regarded by many leading Economists
as the fundamental, “real” or true interpretation of the classic “boom-and-bust”
Sock Market Cycle. Subsequent analysis designated the years 1825, 1836,
1847, 1857, 1866, 1873, 1882, 1890, 1900, 1907, 1913, 1920, and 1929 as the
initial years of an “Economic Recession” or “Market re-adjustment” (fiscal down-
swing - i.e., the beginning of a Juglar Business Cycle “crisis” phase).

Juglar Business Cycle

Joseph Schumpeter
• The source of Joseph Schumpeter's dynamic, change-oriented, and innovation-based economics was the Historical School of economics. Although Schumpeter’s writings could be critical of the School, Schumpeter's work on the role of innovation and entrepreneurship can be seen as a continuation of ideas originated by the Historical School – especially from the work of Gustav von Schmoller and Werner Sombart. Schumpeter's scholarly learning is readily apparent in his posthumous publication of the History of Economic Analysis - although many of his judgments now seem to be somewhat idiosyncratic – and some even appear to be downright cavalier......
• Schumpeter thought that the greatest 18th century economist was Turgot, not Adam Smith, as many economists believe today, and he considered Léon Walras to be the "greatest of all economists", beside whom other economists' theories were "like inadequate attempts to catch some particular aspects of the Walrasian truth".
• Schumpeter criticized John Maynard Keynes and David Ricardo for the "Ricardian vice." Ricardo and Keynes often reasoned in terms of abstract economic models, where they could isolate, freeze or ignore all but a few major variables. According to Schumpeter, they were then free to argue that one factor impacted on another in a simple monotonic cause-and-effect fashion. This has led to the mistaken belief in economics that anyone could easily deduce effective real-world economic policy conclusions directly from a highly abstract and simplistic theoretical economic model.

Joseph Schumpeter
• Schumpeter's relationships with the ideas of other economists were quite complex -
following neither Walras nor Keynes, There was actually some considerable professional
rivalry between Schumpeter and Kuznets. Schumpeter starts his most important
contributions to economic analysis – the theory of business cycles and economic
development The Theory of Economic Development[ – with a treatise on circular flow in
which he postulates a stationary economy is created whenever economic input is starved
of entrepreneurial activities - disruptive innovation and technology wave stimulation. This
economic stagnation is, according to Schumpeter, described by Walrasian equilibrium.
• In developing the Economic Wave theory, Schumpeter postulated the idea that the
entrepreneur is the primary catalyst of industrial activity which develops along several
discrete and interacting time periods in a cyclic fashion – connecting the development of
innovation, technology and generation waves with economic investment and stock-market
cycles. This disruptive process acts to disturb the otherwise stationary economic status-
quo or equilibrium Thus the true hero of his story is the entrepreneur.. Schumpeter also
kept alive the Russian Nikolai Kondratiev's thoughts and ideas of economic cycles with 50-
year periodicity - Kondratiev waves.

Joseph Schumpeter
• Schumpeter suggested an integrated Economic Model in which the four main cycles,
Kondratiev (54 years), Kuznets (18 years), Juglar (9 years) and Kitchin (about 4
years) can be aggregated together to form a composite economic waveform. The
wave form suggested here did not include the Kuznets Cycle simply because
Schumpeter did not recognize it as a valid cycle (see "Business Cycle" for further
information). There was actually some considerable professional rivalry between
Schumpeter and Kuznets. As far as the segmentation of the Kondratiev Wave,
Schumpeter further postulated that a single Kondratiev wave may well be consistent
with the aggregation of three lower-order Kuznets waves
• Each Kuznets wave could, itself, be made up of two Juglar waves. Similarly two or
three Kitchin waves could form a higher-order Juglar wave. If each of these were in
harmonic phase, more importantly if the downward arc of each was simultaneous so
that the nadir of each was coincident - it could explain disastrous slumps and
consequential recessions and depressions. Schumpeter never proposed a rigid,
fixed-periodicity model. He saw that these cycles could vary in length over time -
impacted upon by various random, chaotic and radically disruptive “Wild Card” and
“Black Swan” events - catastrophes such as War, Famine and Disease, Commodity
Price Shocks, Money Supply Shocks and Sovereign Debt Default Shocks - .events
which are all too common in the economy of today…..

Business Cycles, Patterns and
Trends
Cycle Pre-industrial (before 1860) Modern (post 1929)
Kitchen Inventory Cycle (KI-cycle) Stock-turn Cycle (3-5 years) One KI-cycle – 5 years
Juglar Fixed Investment Cycle (J-cycle) Business Cycle (7-11 years) One J-cycle - 10 years
Kuznets Infrastructure Cycle (KU-cycle) Property Cycle (15-25 years) One KU-cycle - 20 years
Kondratiev Cycle (KO-cycle) Technology Cycle (45-60 years) One KO-cycle – 40 years
Grand-cycle / Super-cycle (GS-cycle) Saeculum (70 years +) Two KO-cycles - 80 years
Cycle Pre-industrial (before 1860) Modern (post 1929)
Juglar Fixed Investment Cycle (J-cycle) Business Cycle (7-11 years) Economic Wave - 9 years
Kuznets Infrastructure Cycle (KU-cycle) Asset Cycle (20-25 years) Investment Wave - 18 years
Strauss-Howe Cycle (SH-cycle) Population Cycle (20-30 years) Generation Wave – 20-25 years
Kondratiev Cycle (KO-cycle) Technology Cycle (45-60 years) Innovation Wave – 30-45 years
Grand-cycle / Super-cycle (GS-cycle) Saeculum (70 years +) Century Wave – 60-90 years
Figure 1. Economic Wave Series – Joseph Schumpter Business Cycles
Figure 2. Economic Wave Series – Strauss-Howe Generation Waves

Strauss–Howe Generation Waves
• The Strauss–Howe Generation Wave theory, created by authors William Strauss and
Neil Howe, identifies a recurring generational cycle in American history. Strauss and
Howe lay the groundwork for the theory in their 1991 book Generations, which retells
the history of America as a series of generational biographies going back to 1584.[1] In
their 1997 book The Fourth Turning, the authors expand the theory to focus on a
fourfold cycle of generational types and recurring mood eras in American history.[2] Their
consultancy, Life Course Associates, has expanded on the concept in a variety of
publications since then.
• The Strauss–Howe Generation Wave theory was developed to describe the history of
the United States, including the 13 colonies and their Anglo-Saxon antecedents, and
this is where the most detailed research has been done. However, the authors have
also examined generational trends elsewhere in the world and identified similar cycles
in several developed countries.[ The books are best-sellers and the theory has been
widely influential and acclaimed. Eric Hoover has called the authors pioneers in a
burgeoning industry of consultants, speakers and researchers focused on generations.

Strauss–Howe Generation Waves
• Arthurian Generation (1433–1460) (H)
• Humanist Generation (1461–1482) (A)
• Reformation Generation (1483–1511) (P)
• Reprisal Generation (1512–1540) (N)
• Elizabethan Generation (1541–1565) (H)
• Parliamentary Generation (1566–1587) (A)
• Puritan Generation (1588–1617) (P)
• Cavalier Generation (1618–1647) (N)
• Glorious Generation (1648–1673) (H)
• Enlightenment Generation (1674–1700) (A)
• Awakening Generation (1701–1723) (P)
• Liberty Generation (1724–1741) (N)
• Republican Generation (1742–1766) (H)
• Compromise Generation (1767–1791) (A)
• Transcendental Generation (1792–1821) (P)
• Gilded Generation (1822–1842) (N)
• Progressive Generation (1843–1859) (A)
• Missionary Generation (1860–1882) (P)
• Lost Generation (1883–1900) (N)
• G.I. Generation (1901–1924) (H)
• Silent Generation (1925–1942) (A)
• Baby Boom Generation (1943–1960) (P)
• Generation X (Gen X) (1961–1981) (N)
• Millennial Generation (Gen Y) (1982–2004) (H)
• Homeland Generation (Gen Z) (2005-present) (A)
Strauss–Howe
Generation Waves
Academic reception and reaction to the
Strauss–Howe Generation Wave
theory has been somewhat mixed – with
various authorities (mostly North
American) applauding Strauss and
Howe for their "bold and imaginative
thesis" – and other authorities (mostly
Western European) criticising the theory.
Criticism has focused on the lack of
rigorous empirical evidence for their
claims, and a certain perception that
aspects of the argument gloss over very
real and apparent differences within the
population pool of each generation.

Business Cycles, Patterns and
Trend - Introduction • Prior to widespread international industrialisation and mercantilism (Globalisation), the
Kondratiev Cycle (KO-cycle) represented successive phases of industrialisation – emerging
waves of incremental development in the fields of Geopolitical Rivalry driving Arms Races and
feeding Disruptive Technology Innovation – which, in turn, mapped on to a further series of
nested Population Cycles (human Generation Waves - Strauss and Howe). The economic
impact of Generation Waves was at least partially influenced by the generational war cycle,
with its impact on National Fiscal Policy (government finances). Shorter economic cycles
appeared to fit into the longer KO-cycle, rather existing independently - possibly harmonic in
nature. Hence financial panics followed a real estate cycle of about 18 years, denoted as the
Kuznets Cycle (KU-cycle) . Slumps occurring in between the Kuznets cycle at a half-cycle that
were of similar length to the “Boom-Bust” Business Cycles first identified by Clement Juglar.
• Business Cycles – the intervals between Stock Market “Boom-and-Bust” were apparently of
random length up to a full Juglar Business Cycle in the range of 8 to 11 years. With the arrival
of industrialisation, then ordinary Business Cycle was now joined by a new Economic
phenomenon – the Inventory Cycle, or Kitchen Cycle (KI-cycle) with a range of 3-5 years
duration – which was later replaced by a new, decreased and lower, more uniform length
(average 40 months). The Kuznets Cycle (KU-cycle) and Kondratiev Cycles carried on much
as before. From the changes induced by industrialisation, the Robert Bronson SMECT
structure emerged, in which sixteen 40 month Kitchen cycles "fit" into a standard Kondratiev
cycle – and the KO-cycle subdivided into 1/2, 1/4 and 1/8-length sub-cycles.

Innovation Waves

Business Cycles, Patterns and
Trend - Introduction • In his recent book on the Kondratiev cycle, Generations and Business Cycles - Part I -
Michael A. Alexander further developed the idea first postulated by Strauss and Howe - that the
Kondratiev Cycle (KO-cycle) is fundamentally generational in nature. Although it had been 28
years since the last real estate peak in 1980, property valuations had yet to reach previous peak
levels when the Sub-Prime Crisis began in 2006. Just as it had done in 1988 and 1998, the
property boom spawned by the Federal Bank's rate cuts continued to drive an upward spiral of
increasing real estate valuations for a couple of more years -- until the Toxic Debt Crisis began
with a trickle of sub-prime mortgage defaults in 2006, and continued with the Financial Service
sector collapses triggering the Credit Crunch / Sovereign Debt Defaults – which arrived in 2008.
• From late Medieval times up until the early 19th century, the Kondratiev Cycle (KO-cycle) was
thought to be roughly equal in length to two human generation intervals – around 50 years in
duration. Thus two Kondratiev cycles in turn form one saeculum, a generational cycle described
by American authors William Strauss and Neil Howe. The KO-cycle was closely aligned with
wars, and a possible mechanism for the cycle was alternating periods (of generational length) of
government debt growth and decline associated with war finance. After the world economy
became widely industrialised in the late 19th century – and the relationship between the
compound cycles seem to have changed. Instead of two KO-cycles per saeculum - there was
now only appears to be multiple KO-cycles – possibly driven by Geopolitical Rivalry and Arms
Races. In the Saeculum from 1914 – 2014 we experienced WWI, WWII, the Cold War and its
spawning of numerous Regional Conflicts – Korea, Vietnam, Malaysia, the Arab-Israeli Wars, the
break up of Yugoslavia, the Gulf Wars and Afghan Conflicts – culminating in the Arab Spring.

Innovation Waves

Business Cycles, Patterns and
Trends Figure 3. Robert Bronson's SMECT System
Figure 4. Michael Alexander - Business cycle length and bear market spacing over time
Cycle Pre-industrial (before 1860) Modern (post 1929)
Juglar Cycle (J-cycle) Business Cycle (8-11 years) Economic Wave - 9 years
K0-trend / Infrastructure Wave Property Cycle (20-25 years) Infrastructure Wave - 18 years
K0-wave / Generation Wave Population Cycle (20-30 years) Generation Wave - 36 years
K0-cycle / Innovation Wave Technology Cycle (45-60 years) Innovation Wave - 72 years
Grand-cycle / Super-cycle (GS-cycle) Saeculum (70 years +) Century Wave - 108 years
Cycle Pre-industrial (before 1860) Modern (post 1929)
Kitchen Cycle (KI-cycle) Production Cycle (3-5 years) Inventory Wave- 40 months (av.)
Juglar Cycle (J-cycle) Business Cycle (8-11 years) Economic Wave - 9 years
Kuznets Cycle (KU-cycle) Property Cycle (20-25 years) Infrastructure Wave -18 years
Strauss-Howe Cycle (SH-cycle) Population Cycle (20-30 years) Generation Wave - 36 years
Kondratiev Cycle (KO-cycle) Technology Cycle (45-60 years) Innovation Wave - 72 years


Business Cycles, Patterns and
Trends • Economic Periodicity appears less metronomic and more irregular from 1860 to 1929 (and
from 2000 onwards). Strauss and Howe claim that these changes in Economic Periodicity
were created by a shift in economic cycle dynamics caused by industrialisation around the
time of the American Civil War – hinting towards Schumpter’s view that Innovation and
Black Swan events can impact on Economic Cycle periodicity. Michael Alexander claims
that this new pattern only emerged after1929 – when the Kondratiev Cycle (KO-cycle)
appeared lengthened and at the same time the Saeculum shortened - to the point where
they both became roughly equal, and merged with a Periodicity of about 72 years long.....
• Michael Alexander further maintains that each Kondratiev wave can be subdivided into two
Kondratiev seasons, each associated with a secular market trend. Table 1 shows how
these cycles were related to each other before and after industrialization. The Kondratiev
cycle itself consists of two Kondratiev waves, each of which is associated with sixteen
occurrences or iterations of the Stock Cycle. The Juglar cycle was first noted by Clement
Juglar in 1860’s and existed in pre-industrial economies. The other two cycles were
identified much later (Kitchen in 1923). The Kuznets real-estate cycle, proposed in 1930,
still persists and this might be thought of as a periodic infrastructure investment cycle
which is typical of industrialised economies after the 1929 Depression. Shorter economic
cycles also exist, such as the Kuznets cycle of 15-20 years (related to building/real estate
valuation cycles), along with the Juglar cycle of 7-11 years (related to Stock Market
activity) and the Kitchen cycle of about 40 months (related to Stock or Inventory Cycles).


Robert Bronson's SMECT Forecasting Model
Each thing is of like form from everlasting and comes round again in its cycle - Marcus Aurelius
Alongside Joseph Schumpter’s Economic Wave Series and Strauss and Howe’s Generation Waves - is Robert
Bronson's SMECT Forecasting Model - which integrates both multiple Business and Stock-Market
Cycles into its structure.....

Robert Bronson SMECT System
• Alongside Joseph Schumpter’s Economic Wave Series and Strauss and Howe’s Generation Waves is Robert Bronson's SMECT Forecasting Model - which Integrates Multiple Business and Stock-Market Cycles in its structure.. After 1933, the Kondratiev cycle, representing Technology and Innovation Waves still persisted - but its length gradually increased to about 72 years - as it remains today. The Kuznets real estate cycle continued, but was much weaker for about 40 years until the 1970's when something like the old cycle was reactivated again in the economy.
• A number of ears ago, Bob Bronson, principal of Bronson Capital Markets Research, developed a useful model for predicting certain aspects of the occurrence characteristics of both Business cycles (stock-market price curves) and Economic cycles (Fiscal Policies). The template for this model graphically illustrates that the model not only explains the interrelationship of these past cycles with a high degree of accuracy - a minimum condition for any meaningful modelling tool, but it also has been, and should continue to be, a reasonably accurate forecasting mechanism.
• Robert Bronson's SMECT System is a Forecasting Model that integrates multiple Business (Stock-Market Movement) and Economic Cycles. Since there is an obvious interrelationship between short-term business cycles and short-term stock-market cycles, it is useful to be able to discover and understand their common elements - in order to develop an economic theory that explains the underlying connections between them and, in our case, to form meaningful, differentiating forecasts - especially over longer-term horizons. By pulling back from the close-up differences and viewing the cycles from a longer-term perspective, their common features become more apparent , Business Cycles are also subject to unexpected impact from external or “unknown” forces - Random Events – which are analogous to Uncertainty Theory in the way that they become manifest - but subject to different interactions and feedback mechanisms.

Wholesale Price Index – 1790-1640

Robert Bronson SMECT System
• It is a well-know and widely recognised phenomenon that stock market movements are the single best leading (short-term) economic indicator, which anticipates short-term business cycles. Although there have been bear markets that were not followed by recessions, there has never been a U.S. recession that was not preceded by a bear market. Since 1854, there have been 33 recessions, as determined by the National Bureau of Economic Research (NBER) - each economic contraction always preceded by a bear stock market "anticipating" it. Most relevant for our purposes, the stock market also anticipated the end of each recession with bear-market lows, or troughs – occuring on average six months before economic growth in consecutive quarters signalled the official end of those recessions.
• An alternative thesis proposed Strauss and Howe has also noted the discontinuous behaviour of their Generation Waves at the same time – the so-called “War Anomaly”. What is happening here ? Strauss and Howe attribute these changes to a skipped generation caused by losses in the American Civil War (and later, the Great War). The unusually poor economic outcomes after these conflicts is due to massive War Debts and the absence of stimulation from a “lost generation”.

Geo-spatial Data Science

Geo-demographics - “Big Data”
The profiling and analysis of very large scale
(VLS) aggregated datasets in order to
determine a ‘natural’ structure of groupings
provides an important technique for many
statistical and analytic applications.
Cluster analysis on the basis of profile
similarities or geographic location is a
method where internal data structures alone
drive both the nature or number of “Clusters”
or natural groups and hierarchies. Clusters
are therefore entirely probabilistic – that is,
no pre-determinations or prior assumptions
are made as to their nature and content.....
Geo-demographic techniques are frequently
used in order to profile and segment human
populations along with their lifestyle events
into natural groupings or “Clusters” – which
are governed by geographical distribution,
common behavioural traits, Morbidity,
Actuarial, Epidemiology or Clinical Trial
outcomes - along with numerous other
shared events, common characteristics or
other natural factors and features.....
Geo-demographics - “Big Data”

Geo-Demographic Profile Data GEODEMOGRAPHIC INFORMATION – PEOPLE and PLACES
Age Dwelling Location / Postcode
Income Dwelling Owner / Occupier Status
Education Dwelling Number-of-rooms
Social Status Dwelling Type
Marital Status Financial Status
Gender / Sexual Preference Politically Active Indicator
Vulnerable / At Risk Indicator Security / Threat Indicator
Physical / Mental Health Status Security Vetting / Criminal Record Indicator
Immigration Status Profession / Occupation
Home / First language Professional Training / Qualifications
Race / ethnicity / country of origin Employment Status
Household structure and family members Employer SIC
Leisure Activities / Destinations Place of work / commuting journey
Mode of travel to / from Leisure Activities Mode of travel to / from work

GIS MAPPING and SPATIAL DATA ANALYSIS
• A Geographic Information System (GIS) integrates hardware, software, and data capture devices for acquiring, managing, analysing, distributing and displaying all forms of geographically dependant location data – including machine generated data such as Computer-aided Design (CAD) data from land and building surveys, Global Positioning System (GPS) terrestrial location data - as well as all kinds of aerial and satellite image data.....

GIS MAPPING and SPATIAL DATA ANALYSIS
• A Geographic Information System (GIS) integrates hardware, software, and data capture devices for acquiring, managing, analysing, distributing and displaying all forms of geographically dependant location data – including machine generated data such as Computer-aided Design (CAD) data from land and building surveys, Global Positioning System (GPS) terrestrial location data - as well as all kinds of aerial and satellite image data.
• Spatial Data Analysis is a set of techniques for analysing spatial (Geographic) location data. The results of spatial analysis are dependent on the locations of the objects being analysed. Software that implements spatial analysis techniques requires access to both the locations of objects and their physical attributes.
• Spatial statistics extends traditional statistics to support the analysis of geographic data. Spatial Data Analysis provides techniques to describe the distribution of data in the geographic space (descriptive spatial statistics), analyse the spatial patterns of the data (spatial pattern or cluster analysis), identify and measure spatial relationships (spatial regression), and create a surface from sampled data (spatial interpolation, usually categorized as geo-statistics).

World-wide Visitor Count – GIS Mapping


BTSA Induction Cluster Map

Geo-Demographic Profile Clusters


Cerca Trova

Uncertainty The Nature of Randomness
The Nature of Randomness – Uncertainty, Disorder and Chaos
Mechanical Processes: –
Thermodynamics (Complexity and Chaos Theory) – governs the behaviour of Systems Classical Mechanics (Newtonian Physics) – governs the behaviour of all everyday objects Quantum Mechanics – governs the behaviour of unimaginably small sub-atomic particles Relativity Theory – governs the behaviour of impossibly super-massive cosmic structures
Wave Mechanics (String Theory) – integrates the behaviour of every size and type of object


Stochastic Processes –
Random Events
The Nature of Randomness – Uncertainty, Disorder and Chaos
Classical (Newtonian) Physics – apparent randomness is as a result of Unknown Forces Thermodynamics – randomness is a direct result of Entropy (Disorder and Chaos)
Relativity Theory – any apparent randomness or asymmetry is as a result of Quantum effects Quantum Mechanics – all events are truly and intrinsically both symmetrical and random
Wave (String) Theory –apparent randomness and asymmetry is as a result of Unknown Forces

Randomness
Stochastic Processes – Random Events
• When we examine the heavens above there appears to be order in the movement
and appearance of the celestial bodies - galaxies, stars, planets, asteroids, etc.
• Since the dawn of our species, humans have speculated on how these bodies were
formed and on the meaning of their ordered movement. Most observations of natural
phenomena support the contention that nature is mostly orderly and predictable. The
origin of that force which brought about this order differs depending upon the source
of the historic explanation of how this order came to be. For much of human history,
super-natural forces were mostly credited with the imposition of order upon nature.
• In a tradition that begins with the classical Greek natural philosophers (circa 600 -
200 BC) and continues today through contemporary philosophy and science – it has
long been held that the order of nature is the result of universal laws which govern
the forces of nature. So what is the role of sudden and unexpected radical change
and the cause of chaos and disruption created by random, stochastic processes at
the heart of a universe which otherwise exhibits such a high degree of order ?

Randomness
• There are many kinds of Stochastic or Random processes that impact on every area
of Nature and Human Activity. Randomness can be found in Science and Technology
and in Humanities and the Arts. Random events are taking place almost everywhere
we look – for example from Complex Systems and Chaos Theory to Cosmology and
the distribution and flow of energy and matter in the Universe, from Brownian motion
and quantum theory to fractal branching and linear transformations. There are further
examples – atmospheric turbulence in Weather Systems and Climatology, and system
dependence influencing complex orbital and solar cycles. Other examples include
sequences of Random Events, Weak Signals, Wild Cards and Black Swan Events
occurring in every aspect of Nature and Human Activity – from the Environment and
Ecology - to Politics, Economics and Human Behaviour and in the outcomes of current
and historic wars, campaigns, battles and skirmishes - and much, much more.
• These Stochastic or Random processes are agents of change that may precipitate
global impact-level events which either threaten the very survival of the organisation -
or present novel and unexpected opportunities for expansion and growth. The ability to
include Weak Signals and peripheral vision into the strategy and planning process may
therefore be critical in contributing towards the continued growth, success, wellbeing
and survival of both individuals and organisations at the micro-level – as well as cities,
states and federations at the macro-level - as witnessed in the rise and fall of empires.

Randomness
Stochastic Processes – Random Events
• It has long been recognized that one of the most important competitive factors for any
organization to master is Randomness, Disorder and Chaos - its Nature, Behaviour and
Cause. Uncertainty is the major intangible factor contributing towards the risk of failure in
every process, at every level, in every type of business. The way that we think about the
future must mirror how the future actually unfolds. As we have learned from recent
experience, the future is not a straightforward extrapolation of simple, single-domain
trends. We now have to consider ways in which the possibility of random, chaotic and
radically disruptive events may be factored into enterprise threat assessment and risk
management frameworks and incorporated into decision-making structures and processes.
• Managers and organisations often aim to “stay focused” and maintain concentration on a
narrow range of perspectives in dealing with key business issues, challenges and targets.
Any concentration of focus or narrow outlook may in turn risk overlooking Weak Signals
indicating potential issues and events, agents and catalysts of change. Any such Weak
Signals – along with their resultant Strong Indicators, Wild Card and Black Swan
Events - represent an early warning of radically disruptive future global transformations –
which are even now taking shape at the very periphery and horizon of corporate insight,
awareness, perception and vision – or just beyond.

The Nature of Randomness
• There are many kinds of Stochastic or Random processes that impact on every area
of Nature and Human Activity. Randomness can be found in Science and Technology
and in Humanities and the Arts. Random events are taking place almost everywhere
we look – for example from Complex Systems and Chaos Theory to Cosmology and
the distribution and flow of energy and matter in the Universe, from Brownian motion
and quantum theory to fractal branching and linear transformations. There are further
examples – atmospheric turbulence in Weather Systems and Climatology, and system
dependence influencing complex orbital and solar cycles. Other examples include
sequences of Random Events, Weak Signals, Wild Cards and Black Swan Events
occurring in every aspect of Nature and Human Activity – from the Environment and
Ecology - to Politics, Economics and Human Behaviour and in the outcomes of current
and historic wars, campaigns, battles and skirmishes - and much, much more.
• These Stochastic or Random processes are agents of change that may precipitate
global impact-level events which either threaten the very survival of the organisation -
or present novel and unexpected opportunities for expansion and growth. The ability to
include Weak Signals and peripheral vision into the strategy and planning process may
therefore be critical in contributing towards the continued growth, success, wellbeing
and survival of both individuals and organisations at the micro-level – as well as cities,
states and federations at the macro-level - as witnessed in the rise and fall of empires.

The Nature of Randomness • Randomness makes precise prediction of future outcomes impossible. We are unable to predict any
outcome with any significant degree of confidence or accuracy – due to the inherent presence of
randomness and uncertainty associated with Complex Systems. Randomness in Complex Systems
introduces chaos and disorder – causing disruption. Events no longer continue along a predictable linear
course leading towards an inevitable outcome – instead, we experience surprises.
• What we can do, however, is to identify the degree of uncertainty present in those Systems, based on
known, objective measures of System Order and Complexity - the number and nature of elements
present in the system, and the number and nature of relationships which exist between those System
elements. This in turn enables us to describe the risk associated with possible, probable and alternative
Scenarios, and thus equips us to be able to forecast risk and the probability of each of those future
Scenarios materialising.
• If true randomness exists and future outcomes cannot be predicted – then what is the origin of
that randomness? For example, are unexpected outcomes simply apparent as a result of sub-
atomic nano-randomness existing at the quantum level – such as uncertainty phenomena etc…..?
• The Stephen Hawking Paradox postulates that uncertainty dominates complex and chaotic systems to
such an extent that future outcomes are both unknown - and unknowable. The working context of this
paradox is restricted, however, to the realm of Quantum Mechanics – where each and every natural event
that occurs at the sub-atomic level is truly intrinsically and completely both symmetrical and random.

The Nature of Randomness
• What is the explanation for randomness evident in all high-order phenomena
found in nature…?
• In order to obtain realistic glimpses into the Future, - then the major paradigm
differences between the Actual Reality that we experience every day and our
limited Systemic Models which attempt to simplify, abstract and simulate reality -
must be clearly distinguished between and understood.
• When we design our Systemic Models representing Actual Reality – such as the
Economy, Geo-political systems, Climate Change, Weather and so on - if we are
lucky enough, then some high-order phenomena found in nature may be captured
by a random rule; and with even more luck, by a deterministic rule (which can be
regarded as a special case of randomness) - but if we are unlucky - then those
rules might not be no captured at all. Regarding the nature of reality - it still
remains unclear what factors distinguish truly random phenomenon found in
nature at the Quantum level (e.g. radioactive decay?) from Random Events which
are triggered by unseen forces.

The Nature of Randomness
• Can we accept that these natural phenomena are not truly random at all – that is, given sufficient
information such as complete event data sets - it is possible to predict random events? If so,
are all random events the result of the same natural phenomenon - unseen or hidden forces ? “
• Classical (Newtonian) Physics describe the laws which govern all of the systems and objects that we are
familiar with in our everyday routine lives. Relativity Theory, on the other hand, describes unimaginably
large things, whilst Quantum Mechanics describes impossibly small things – and Wave Theory (String
Theory) attempts to describe everything. True randomness does not really exist in Classical (Newtonian)
Physics – the laws which control Chaos and Complex Systems that govern every aspect of our life on Earth
today – from Natural Systems such as Cosmology, Astronomy, Climatology, Geology and Biology through to
Human Activity Systems such as Political, Economic and Sociological Complex Adaptive Systems (CAS).
Randomness is simply the results of those forces which are not known, not recognised, not understood, are
not under the control of the observer or simply occur outside of the known boundaries of observable system
components – but, nevertheless, must still exist and exert influence over the system. Over many System
Cycles, immeasurably small inputs interacting with Complex System components and relationships - may
be amplified into extremely significant outputs.....
1. Classical (Newtonian) Physics – apparent randomness is as a result of Unknown Forces
2. Relativity Theory – any apparent randomness or asymmetry is as a result of Quantum effects
3. Quantum Mechanics – all events are truly and intrinsically both symmetrical and random
4. Wave (String) Theory – apparent randomness and asymmetry is as a result of Unknown Forces -
which may in turn have their origination in Quantum Mechanics effects

The Nature of Randomness
Weak Signals, Wild Cards and Black Swan Events
• Economic systems tend to demonstrate Complex Adaptive System (CAS) behaviour – rather than a simple series of chaotic “Random Events” – very similar to the behaviour of living organisms. The remarkable long-term stability and resilience of market economies is demonstrated by the impact and subsequent recovery from Wild Card and Black Swan Events. Surprising pattern changes occur during wars, arm races, and during Republican administrations, causing unexpected stock market crashes - such as oil price shocks and credit crises. Wave-form Analytics for non-stationary time series analysis opens up a new and remarkable opportunity for business cycle studies and economic policy diagnostics.
• The role of time scale and preferred reference from economic observation is explored in detail. For example - fundamental constraints for Friedman's rational arbitrageurs are re examined from the view of information ambiguity and dynamic instability. Alongside Joseph Schumpter’s Economic Wave Series and Strauss and Howe’s Generation Waves, we also discuss Robert Bronson's SMECT Forecasting Model - which integrates both Business and multiple Stock-Market Cycles into its structure.....
• Composite Economic Wave Series
– Saeculum - Century Waves
– Generation Waves (Strauss and Howe)
– Joseph Schumpter’s Economic Wave Series
– Robert Bronson’s SMECT Forecasting Model

The Nature of Randomness
• Randomness may be somewhat difficult to demonstrate, as Randomness in chaotic system behaviour is not always readily or easily distinguishable from any other “noise” that we may find in Complex Systems – such as foreground and background wave harmonics, resonance and interference patterns. Complex Systems may be influenced by both internal and external factors which remain hidden - unrecognised or unknown. These unknown and hidden factors may lie far beyond our ability to detect them. The existence of weak internal or external forces simply may not be visible to the observer – the subliminal temporal forces which nevertheless can influence Complex System behaviour in such a way that the presence of imperceptibly tiny inputs, propagated and amplified over many system cycles - are able to create massive observable changes to outcomes in complex system behaviourr.
• Randomness. Neither data-driven nor model-driven macro-economic or micro-economic models currently available to us today - seem able to deal with the concept or impact of Random Events (uncertainty). We therefore need to consider and factor in further novel and disruptive (systemic) approaches which offer us the possibility to manage uncertainty. We can do this by searching for, detecting and identifying Weak Signals – small, unexpected variations or disturbances in System outputs indicating hidden data within the general background System “noise” - which in turn may predicate the possible future existence or presence of emerging chaotic, and radically disruptive Wild Card or Black Swan events beginning to form on the detectable Horizon – or even just beyond. Random Events can then be factored into Complex Systems Modelling. Complex Systems interact with unseen forces – which in turn act to inject disorder, randomness, uncertainty, chaos and disruption. The Global Economy, and other Complex Adaptive Systems, may in future be considered and modelled successfully as a very large set of multiple interacting Ordered (Constrained) Complex Systems - each individual System loosely coupled with all of the others, and every System with its own clear set of rules and an ordered (restricted) number of elements and classes, relationships and types.

Random Events
Stochastic Processes – Random Events
• A tradition that begins with the classical Greek natural philosophers (circa 600 -
200 BC) and continues through contemporary science - holds that change and
the order of nature are the result of natural forces. What is the role of random,
stochastic processes in a universe that exhibits such order? When we examine
the heavens there seems to be a great deal of order to the appearance and
movement of the celestial bodies - galaxies, stars, planets, asteroids, etc.
• Since the dawn of our species, humans have speculated on how these bodies
were formed and on the meaning of their movements. Most observations of
natural phenomena support the contention that nature is ordered. The force
that brought about this order differs depending upon the source of the historic
explanation of how this order came to be. For most of human history, super-
natural forces were credited with the imposition of order on nature.

Random Events
Random Processes
• Random Processes may act upon or influence any natural and human phenomena: -
– Lifecycles - the history of an object
– Probability - the outcome of an event
– Transformation - the execution of a process
• Randomness may be somewhat difficult to demonstrate, as true Randomness in chaotic
system behaviour is not always readily or easily distinguishable from any of the “noise”
that we may find in Complex Systems – such as foreground and background wave
harmonics, resonance and interference. Complex Systems may be influenced by both
internal and external factors which remain hidden – either unrecognised or unknown.
These hidden and unknown factors may exist far beyond our ability to detect them – but
nevertheless, still exert influence. The existence of weak internal or external forces acting
on systems may not be visible to the observer – these subliminal temporal forces can
influence Complex System behaviour in such a way that the presence of imperceptibly tiny
inputs, acting on a system, amplified in effect over many system cycles - are ultimately
able to create massive observable changes to outcomes in complex system behaviour.

Random Events
• It has long been recognized that one of the most important competitive factors for any
organization to master is Chaos and Randomness - its Nature, Behaviour and Cause.
Uncertainty is the major intangible factor contributing towards the risk of failure in every
process, at every level, in every type of business. The way that we think about the future
must mirror how the future actually unfolds. As we have learned from recent experience,
the future is not a straightforward extrapolation of simple, single-domain trends. We now
have to consider ways in which the possibility of random, chaotic and radically disruptive
events may be factored into enterprise threat assessment and risk management
frameworks and incorporated into decision-making structures and processes.
1. Philosophy - Random behaviour is a result of irrational thoughts, emotions and actions
2. Politics – Any random behaviour is a result of irrational thoughts, emotions and actions
3. Economics - Random behaviour is a result of irrational thoughts, emotions and actions
4. Sociology - All random behaviour is a result of irrational thoughts, emotions and actions
5. Psychology - Random behaviour is a result of irrational thoughts, emotions and actions

The Nature of Randomness
Domain Scope / Scale Randomness Examples
Philosophy Human Knowledge – the
Moral and Ethical basis of
Human Understanding,
Thoughts and Actions
Any apparent random behaviour
is as a result of irrational human
thoughts, emotions and actions.
Hellenic Philosophy -
Aristotle, Ptolemy
Politics Human Governance – the
Political basis of Human
Actions and Behaviour
The dual human
emotions of “Fear and
Greed” drives Politics,
Society and Economics
– Market Sentiment &
Commodity / Financial
Product Price Curves
Sociology The Human Condition – the
Social basis of Human
Actions and Behaviour
Economics The Human Condition – the
Economic basis of Human
Actions and Behaviour
Psychology The Human Condition – the
Biological basis of Human
Understanding, Thought,
Actions and Behaviour
Dementia, Psychosis,
Mania, Melancholia,

The Nature of Randomness
• Philosophy – the condition of Human Knowledge, Rationality, Logic and Wisdom
– Human Knowledge – the Moral / Ethical basis of Human Understanding, Thought , Actions
– Apparent randomness is a direct result of irrational human thoughts, emotions and actions.
• Politics – the condition of Human Governance, Rule and Regulation
– Human Governance – the Political basis of Human Understanding, Thought and Actions
– Apparent randomness is a direct result of irrational human thoughts, emotions and actions
• Sociology – the condition of Human Identity, Living, Culture and Society
– Human Living and Society – the Social basis of Human Understanding, Thought , Actions
– Apparent randomness is a direct result of irrational human thoughts, emotions and actions
• Economics – the condition of Human Manufacturing, Shipping, Trade and Commerce
– Human Trade & Commerce – Monetary basis of Human Understanding, Thought , Actions
– Apparent randomness is a direct result of irrational human thoughts, emotions and actions
• Psychology – the condition of the Human Mind
– the Biological basis of Human Thought, Understanding, Actions and Behaviour
– Apparent randomness is a direct result of irrational human thoughts, emotions and actions

The Nature of Randomness
• Uncertainty is the outcome of the disruptive effect that chaos and randomness
introduces into our daily lives. Research into stochastic (random) processes looks
towards how we might anticipate, prepare for and manage the chaos and uncertainty
which acts on complex systems – including natural systems such as Cosmology and
Climate, as well as human systems such as Politics and the Economy – so that we may
anticipate future change and prepare for it…..
6. Classical Mechanics - Any apparent randomness is as a result of Unknown Forces
7. Thermodynamics - Randomness, chaos and uncertainty is directly a result of Entropy
8. Biology - Any apparent randomness is as a result of Unknown Forces
9. Chemistry - Any apparent randomness is as a result of Unknown Forces
10. Atomic Theory - All events are utterly and unerringly predictable (Dirac Equation)
11. Quantum Mechanics - Every event is both symmetrical and random (Hawking Paradox)
12. Geology - Any randomness or disturbance is a result of hidden or unrecognised Forces
13. Astronomy - Any randomness or disturbance is a result of hidden or unknown Forces
14. Cosmology - Randomness or asymmetry is a result of Dark Matter / Energy / Flow
15. Relativity Theory - Randomness or asymmetry may be a result of Quantum effects
16. Wave Mechanics - Any randomness or asymmetry is a result of Unknown Dimensions

The Nature of Randomness
Domain Scope / Scale Randomness Pioneers
Classical Mechanics
(Newtonian Physics)
Everyday objects Any apparent randomness is as
a result of Unknown Forces -
internal or external - acting upon
the System under observation
Sir Isaac Newton
Thermodynamics Energy Systems -
Entropy, Enthalpy
Newcomen, Trevithick,
Watt, Stephenson
Biology Evolution Darwin, Banks, Huxley,
Krebs, Crick, Watson
Chemistry Molecules Lavoisier, Priestley
Atomic Theory Atoms Atomic events are intrinsically
truly, utterly and unerringly fully
predictable (Dirac Equation).
Max Plank, Niels Bohr,
Bragg, Paul Dirac,
Richard Feynman
Quantum Mechanics Sub-atomic particles Each and every Quantum event
is truly, intrinsically, absolutely
and totally random / symmetrical
(Hawking Paradox)
Erwin Schrodinger ,
Werner Heisenberg,
Albert Einstein,
Hermann Minkowsky

The Nature of Randomness
• Classical Mechanics (Newtonian Physics)
– Classical Mechanics (Newtonian Physics) governs the behaviour of everyday objects
– any apparent randomness is as a result of unimaginably small, unobservable and
unmeasurable Unknown Forces - either internal or external - acting upon a System.
• Thermodynamics
– governs the flow of energy and the transformation (change in state) of systems
– randomness, chaos and uncertainty is the result of the effects of Enthalpy and Entropy
• Chemistry
– Chemistry (Transformation) governs the change in state of atoms and molecules
– any apparent randomness is as a result of unimaginably small, unobservable and
unmeasurable Unknown Forces - either internal or external - acting upon a System.
• Biology
– Biology (Ecology ) governs Evolution - the life and death of all living Organisms
– any apparent randomness is as a result of unimaginably small, unobservable and
unmeasurable Unknown Forces - either internal or external - acting upon a System.

The Nature of Randomness
Domain Scope / Scale Randomness Pioneers
Geology The Earth, Planets,
Planetoids, Asteroids,
Meteors / Meteorites
Any apparent randomness is as
a result of Unknown Forces
Hutton, Lyell, Wagner
Astronomy Common, familiar and
Observable nearby
Celestial Objects
Any apparent randomness or
asymmetry may be as a result of
Quantum effects or other
Unknown Forces acting early in
the history of Space-Time
Galileo, Copernicus,
Kepler, Lovell, Hubble
Cosmology Distant, super-massive
Celestial Objects in the
observable Universe
Any apparent randomness or
asymmetry may be as a result of
interaction with Dark Matter,
Dark Energy or Dark Flow
Hoyle, Ryall, Rees,
Penrose, Bell-Burnell
Relativity Theory The Universe Any apparent randomness or
asymmetry is as a result of
Unknown Forces / Dimensions
Albert Einstein,
Hermann Minkowski,
Stephen Hawking
Wave Mechanics
(String Theory or
Quantum Dynamics)
The Multiverse,
Membranes and
Hyperspace
Any apparent randomness or
asymmetry is as a result of the
presence of nearby unknown
Universes / Forces / Dimensions
Prof. Michael Green,
Prof. Michio Kaku,
Dr. Laura Mersini-
Houghton

The Nature of Randomness
• Atomic Theory
– governs the behaviour of unimaginably small objects (atoms and sub-atomic particles)
– all events are truly and intrinsically, utterly and unerringly predictable (Dirac Equation).
• Quantum Mechanics
– governs the behaviour of unimaginably tiny objects (fundamental sub-atomic particles)
– all events are truly and intrinsically both symmetrical and random (Hawking Paradox).
• Geology
– Geology governs the behaviour of local Solar System Objects (such as The Earth, Planets,
Planetoids, Asteroids, Meteors / Meteorites) which populate the Solar System
– any apparent randomness is as a result of unimaginably small, unobservable and
unmeasurable Unknown Forces - either internal or external - acting upon a System
• Astronomy
– Astronomy governs the behaviour of Common, Observable Celestial Objects (such as
Asteroids, Planets, Stars and Stellar Clusters) which populate and structure Galaxies
– any apparent randomness or asymmetry is as a result of Quantum Effects, Unknown
Forces or Unknown Dimensions acting very early in the history of Universal Space-Time

The Nature of Randomness
• Cosmology
– Cosmology governs the behaviour of impossibly super-massive cosmic building blocks
(such as Galaxies and Galactic Clusters) which populate and structure the Universe
– any apparent randomness or asymmetry is due to the influence of Quantum Effects,
Unknown Forces (Dark Matter, Dark Flow and Dark Energy) or Unknown Dimensions
• Relativity Theory
– Relativity Theory governs the behaviour of impossibly super-massive cosmic structures
(such as Galaxies and Galactic Clusters) which populate and structure the Universe
– any apparent randomness or asymmetry is as a result of Quantum Effects, Unknown
Forces or Unknown Dimensions acting very early in the history of Universal Space-Time
• Wave Mechanics (String Theory or Quantum Dynamics)
– Wave Mechanics integrates the behaviour of every size and type of physical object
– any apparent randomness or asymmetry is as a result of Quantum Effects, Unknown
Forces or Unknown Dimensions acting on the Universe, Membranes or in Hyperspace

• 4D Geospatial Analytics is the
profiling and analysis of large
aggregated datasets in order to
determine a ‘natural’ structure of
groupings provides an important
technique for many statistical and
analytic applications.
• Environmental and Demographic
Geospatial Cluster Analysis - on the
basis of profile similarities or
geographic distribution - is a statistical
method whereby no prior assumptions
are made concerning the number of
groups or group hierarchies and
internal structure. Geo-spatial and
geodemographic techniques are
frequently used in order to profile and
segment populations by ‘natural’
groupings - such as common
behavioural traits, Clinical Trial,
Morbidity or Actuarial outcomes - along
with many other shared characteristics
and common factors.....
The Nature of Randomness

• The Temporal Wave is a novel and innovative method for Visual Modelling and Exploration of
Geospatial “Big Data” – Geospatial Analytics simultaneously within a Time (history) and Space
(geographic) context. The problems encountered in exploring and analysing vast volumes of
spatial–temporal information in today's data-rich landscape – are becoming increasingly
difficult to manage effectively. In order to overcome the problem of data volume and scale in a
Time (history) and Space (location) context requires not only traditional location–space and
attribute–space analysis common in GIS Mapping and Spatial Analysis - but now with the
additional dimension of time–space analysis. The Temporal Wave supports a new method of
Visual Exploration for Geospatial (location) data within a Temporal (timeline) context.
• This time-visualisation approach integrates Geospatial (location) data within a Temporal
(timeline) framework which is communicated via data visualisation and animation techniques
used to support geo-visual “Big Data” analytics - thus improving the accessibility, exploration
and analysis of the huge amounts of time-variant geo-spatial data, such as the history of an
object or location, or the outcome of a process (evolution of the universe). Temporal Wave
combines the strengths of both linear timeline and cyclical wave-form analysis . Both linear
and cyclic trends in space-time data may be represented in combination with other graphic
representations typical for location–space and attribute–space data-types. The Temporal
Wave can be used in various roles as a time–space data reference system, as a time–space
continuum representation tool, and as time–space interaction tool– and so is able to represent
data within both a Time (history) and Space (geographic) context simultaneously – therefore
pan across Space-time layers or even zoom between different levels of detail or granularity.
The Nature of Randomness

The Nature of Randomness
• Time Present is always in some way inextricably woven into both Time Past and Time Future –
with the potential, therefore, to give us notice of future random events – subliminal indications
of future events before they actually occur. Chaos Theory suggests that even the most tiny of
inputs, so minute as to be undetectable, may ultimately be amplified over many system cycles
– to grow in influence and effect to trigger dramatic changes in future outcomes. So any given
item of Information or Data (Global Content) may contain faint traces which hold hints or clues
about the outcomes of linked Clusters of Past, Present and Future Events.
• Every item of Global Content that we find in the Present is somehow connected with both the
Past and the Future. Space-Time is a Dimension – which flows in a single direction, as does a
River. Space-Time, like water diverted along an alternative river channel, does not flow
uniformly – outside of the main channel there could well be “submerged objects” (random
events) that disturb the passage of time, and may possess the potential capability of creating
unforeseen eddies, whirlpools and currents in the flow of Time (disorder and uncertainty) –
which in turn posses the capacity to generate ripples, and waves (chaos and disruption) – thus
changing the course of the Space-Time continuum. “Weak Signals” are “Ghosts in the
Machine” of these subliminal temporal interactions – with the capability to contain information
about future “Wild card” or “Black Swan” random events.

The Nature of Randomness
• Weak Signals, Strong Signals, Wild Cards and Black Swan Events – are a sequence of
waves that have a common source or origin and are linked and integrated in ascending order
of magnitude – which emanate either from a single Random Event instance or arise from a
linked series of chaotic and disruptive Random Events - an Event Storm. Signals from these
Random Events propagate through the space-time continuum as an integrated and related
series of waves with an ascending order of magnitude and impact – the first wave to arrive is
the fastest travelling - Weak Signals - something like a faint echo of a Random Event which
may in turn be followed in turn by a ripple (Strong Signals) then possibly by a wave (Wild
Card) - which may predicate a further increase in magnitude and intensity which finally arrives
as a catastrophically unfolding mega-wave - something like a tsunami (Black Swan Event).
Sequence of Events - Emerging Waves Stage View of Wave Series Development
1. Random Event 1. Discovery 2. Weak Signals 1.1 Establishment 3. Strong Signals 1.2 Development 4. Wild Cards 2. Growth
5. Black Swan Event 3. Plateau
4. Decline
5. Collapse
5.1 Renewal
5.2 Replacement

The Nature of Randomness
Black Swan – Nassim Taleb
• Black Swan by Nassim Taleb was first published in 2007 and quickly sold out, with close
to 3 million copies purchased by February 2011. Fooled by Randomness and the Black
Swan seized the public imagination, and quickly generated mass-market interest in Chaos
and Uncertainty to create a new, niche market segment for Disruptive Management
publications - which cross-over General Interest, Professional and Academic sectors.
Taleb's non-technical writing style mixes a narrative text (often semi-autobiographical) and
whimsical home-spun tales backed up by some historical and scientific content. The
success of Taleb's first two books (Fooled by Randomness and the Black Swan) gained
him an advance on Royalties of $4 million for his follow-up book – the Blank Swan.
The Drunkard's Walk:- How Randomness Rules Our Lives - Leonard Mlodinow
• The Drunkard's Walk dives much deeper into the Nature of Randomness. This book is
different - it is natural for scientific books to discuss science – but unusual for them to
contain highly readable prose and good humour, not to mention useful and practical
insights which help to live your life with a greater understanding of chaotic effects in the
world about you. The book's major weakness is that it comes up short on fundamental
explanations of Chaos, Disruption, Complexity and Randomness. Mlodinow simply
advises readers to "be aware" and "conscious" of how important randomness is.

deterministic stochastic

Stochastic Processes –
Random Event Sequences
The Nature of Randomness – Uncertainty, Disorder and Chaos
Physical Systems and Mechanical Processes
Classical (Newtonian) Physics – apparent randomness is as a result of Unknown Forces Thermodynamics – randomness is a direct result of Enthalpy (Disorder and Chaos)
Relativity Theory – any apparent randomness or asymmetry is as a result of Quantum effects Quantum Mechanics – all events are truly and intrinsically both symmetrical and random Quantum Dynamics – randomness and asymmetry is as a result of Unknown Dimensions
Wave (String) Theory – randomness and asymmetry is as a result of Unknown Membranes


Random Event Clustering Patterns in the Chaos
The Nature of Uncertainty – Randomness
Physical and Mechanical Processes: –
Thermodynamics (Complexity + Chaos Theory) – governs the behaviour of Energetic Systems Classical Mechanics (Newtonian Physics) – governs the behaviour of all everyday objects Quantum Mechanics – governs the behaviour of unimaginably small sub-atomic particles Relativity Theory – governs the behaviour of impossibly super-massive cosmic structures
Quantum Dynamics (String Theory) – governs the interaction of Membranes in Hyperspace Wave Mechanics (String Theory) – integrates the behaviour of every size and type of object

Random Event Clustering – Patterns in the Chaos.....
Order out of Chaos – Patterns in the Randomness
• There is an interesting phenomenon called Phase Locking where two loosely coupled systems with slightly
different frequencies show a tendency to move into resonance – in order to harmonise with one another. We
also know that the opposite of system convergence - system divergence - is also possible with phase-locked
systems, which can also diverge with only very tiny inputs - especially if we run those systems in reverse.
• Thus phase locking draws two nearly harmonic systems into resonance and gives us the appearance of a
“coincidence”. There are, however, no coincidences in Physics. Sensitive Dependence in Complexity Theory
also tells us that minute, imperceptible changes to inputs at the initial state of a system, at the beginning of a
cycle, are sufficient to dramatically alter the final state after even only a few iterations of the system cycle.
Multiple Random process also occur in clusters
• The occurrences of rare, multiple related and similar chaotic events tend to form clusters due to the nature of
random processes. At the more local level, we see stochastic processes at work when we experience the
myriad of phenomena that make up our experiences. Almost without exception, we hear of events by type
occurring close together in temporal and spatial proximity. The saying that bad or good news comes in groups
has some validity based upon the nature of event clustering. Plane, train or bus crashes come in groups
spaced close together in time, separated by long periods of no such events. Weather extremes follow a similar
stochastic pattern. Everyone is familiar with "When it rains, it pours" meaning that trouble comes in bunches
and the work load comes all at once, interspersed with quiet periods and calm where one is forced to look busy
to justify their continued employment to the boss. During the busy period when it all happens it once, it's a
tough go just to keep everything acceptably together. In the anarchy of the capitalist market, we see this trend
at work in the economy with booms and busts of all sizes occurring in a combined and unequal fashion.

Random Event Clustering – Patterns in the Chaos.....
• The defining concept for understanding the effects of Chaos Theory on Complex Systems is that with
any vanishingly small differences in the initial conditions at the onset of a chaotic system cycle – those
minute and imperceptible differences which create slightly different starting points result in massively
different outcomes between two otherwise identical systems, both operating within the same time frame.
• The discovery of Chaos and Complexity has increased our understanding of the Cosmos and its effect
on us. If you surf the chaos content regions of the internet, you will invariably encounter terms such as: -
• These influences can take some time to manifest themselves, but that is the nature of the phenomena
identified as a "strange attractor." Such differences could be small to the point of invisibility - how tiny
can influences be to have any effect? This is captured in the “butterfly scenario” described below.
1. Chaos 2. Clustering 3. Complexity 4. Butterfly effect 5. Disruption 6. Dependence 7. Feedback loops 8. Fractal patterns and dimensions 9. Harmonic Resonance 10. Horizon of predictability 11. Interference patterns 12. Massively diverse outcomes
13. Phase space and locking 14. Randomness 15. Sensitivity to initial conditions 16. Self similarity (self affinity) 17. Starting conditions 18. Stochastic events 19. Strange attractors 20. System cycles (iterations) 21. Time-series Events 22. Turbulence 23. Uncertainty 24. Vanishingly small differences

Complex Systems and Chaos Theory
• Weaver (Complexity Theory) along with Gleick and Lorenzo (Chaos Theory) have given us some of the tools that we need to understand these complex, interrelated chaotic and radically disruptive political, economic and social events such as the collapse of Global markets – and the various protests against this - using Event Decomposition, Complexity Mapping, and Statistical Analysis to help us identify patterns, extrapolations, scenarios and trends unfolding as seemingly unrelated, random and chaotic events. The Hawking Paradox, however, challenges this view of Complex Systems by postulating that uncertainty dominates complex, chaotic systems to such an extent that future outcomes are both unknown - and unknowable.
• System Complexity is typically characterised by the number of elements in a system, the number of interactions between those elements and the nature (type) of interactions. One of the problems in addressing complexity issues has always been distinguishing between the large number of elements and relationships, or interactions evident in chaotic (disruptive, unconstrained) systems - and the still large, but significantly smaller number of elements and interactions found in ordered (constrained) systems. Orderly (constrained) System Frameworks tend to act to both reduce the total number of more-uniform elements and interactions with fewer regimes and of reduced size – and feature explicit rules which govern less random and chaotic, but more highly-ordered, internally correlated and constrained interactions – as compared with the massively increased random, chaotic and disruptive behaviour exhibited by Disorderly (unconstrained) System Frameworks.

Complex Systems and Chaos Theory
• There are many kinds of stochastic or random processes that impacts on every area of
Nature and Human Activity. Randomness can be found in Science and Technology and in
Humanities and the Arts. Random events are taking place almost everywhere we look – for
example from Complex Systems and Chaos Theory to Cosmology and the distribution and
flow of energy and matter in the Universe, from Brownian motion and quantum theory to
Fractal Branching and linear transformations. Further examples include Random Events,
Weak Signals and Wild Cards occurring in each aspect of Nature and Human Activity – from
Ecology and the Environment to Weather Systems and Climatology in Economics and
Behaviour. And then there are the examples of atmospheric turbulence, and the complex
orbital and solar cycles – and much, much more.
• There is an interesting phenomenon called Phase Locking where two loosely coupled
systems with slightly different frequencies show a tendency to move into resonance – in order
to harmonise with one another. We also know that the opposite of system convergence -
system divergence - is also possible with phase-locked systems, which can also diverge with
only very tiny inputs - especially if we run those systems in reverse. Thus phase locking
draws two nearly harmonic systems into resonance and gives us the appearance of a
“coincidence”. There are, however, no coincidences in Physics. Sensitive Dependence in
Complexity Theory also tells us that minute, imperceptible changes to inputs at the initial state
of a system, at the beginning of a cycle, are sufficient to dramatically alter the final state after
even only a few iterations of the system cycle.

Complex Systems and Chaos Theory
• Complex Systems and Chaos Theory has been used extensively in the field of Futures Studies, Strategic
Management, Natural Sciences and Behavioural Science. It is applied in these domains to understand how
individuals or populations, societies and states act as a collection of systems which adapt to changing
environments – bio-ecological, socio-economic or geo-political. The theory treats individuals, crowds and
populations as a collective of pervasive social structures which are influenced by random individual
behaviours – such as flocks of birds moving together in flight to avoid collision, shoals of fish forming a “bait
ball” in response to predation, or groups of individuals coordinating their behaviour in order to exploit novel
and unexpected opportunities which have been discovered or presented to them.
• When Systems demonstrate properties of Complex Adaptive Systems (CAS) - which is often defined as
consisting of a small number of relatively simple and loosely connected systems - then they are much more
likely to adapt to their environment and, thus, survive the impact of change and random events. Complexity
Theory thinking has been present in strategic and organisational studies since the first inception of Complex
Adaptive Systems (CAS) as an academic discipline.
• Complex Adaptive Systems are further contrasted compared with other ordered and chaotic systems by
the relationship that exists between the system and the agents and catalysts of change which act upon it. In
an ordered system the level of constraint means that all agent behaviour is limited to the rules of the system.
In a chaotic system these agents are unconstrained and are capable of random events, uncertainty and
disruption. In a CAS, both the system and the agents co-evolve together; the system acting to lightly
constrain the agents behaviour - the agents of change, however, modify the system by their interaction. CAS
approaches to behavioural science seek to understand both the nature of system constraints and change
agent interactions and generally takes an evolutionary or naturalistic approach to crowd scenario planning
and impact analysis.


Hertzsprung Russell
• The Hertzsprung
Russell diagram is a
scatter plot Cluster
Diagram which shows
the Main Sequence
Stellar Lifecycles.
• A Hertzsprung Russell
diagram is a scatter
plot Stellar Cluster
Diagram which
demonstrates the
relationship between a
stars temperature and
luminosity over time –
using red to blue colour
to indicate the mean
temperature at the
surface of the star.

Star Clusters
• New and
improved
understanding
of star cluster
physics brings
us within reach
of answering a
number of
fundamental
questions in
astrophysics,
ranging from
the formation
and evolution
of galaxies –
to intimate
details of the
star formation
process itself.

Star
Clusters • The Physics of star
clustering leads us
to new questions
related to the
make-up of stellar
clusters and
galaxies, stellar
populations in
different types of
galaxy, and the
relationships
between high-
stellar populations
and local clusters –
overall, resolved
and unresolved –
the implications
for their relative
formation times
and galactic star-
formation histories.

Hertzsprung Russell
• The Hertzsprung Russell
diagram is a scatter plot
Cluster Diagram which
shows Stellar Lifecycles
along the Main Sequence
• A Hertzsprung Russell
diagram is a scatter plot
Stellar Cluster Diagram
which demonstrates the
relationship between a
stars temperature and
luminosity over time –
using a red to blue colour
code to indicate the
surface temperature
through the stars lifecycle
.


Saunders et al, (2009)

Qualitative and Quantitative Methods
Research Study Roles and Responsibilities
• Supervisor – authorises and directs the Futures Research Study.
• Project Manager – plans and leads the Futures Research Study.
• Moderator – reviews and mentors the Futures Research Study.
• Researcher – undertakes the detailed Futures Research Tasks.
• Research Aggregator – examines hundreds of related Research
papers - looking for hidden or missed Findings and Extrapolations.
• Author – compiles, documents and edits the Research Findings.

Quantitative v. Qualitative Domains Quantitative (Technical)
Qualitative (Narrative)
Futures Studies
Numeric Definitive
Quantitative
(Technical) Analysis
Investigative
Descriptive
Analytic
Social Sciences
Sociology
Economics
Business Studies / Administration / Strategy
Psychology / Psychiatry / Medicine / Surgery
Behavioural Research Domains
Arts and the Humanities
Life Sciences
History Arts Literature Religion
Law Philosophy Politics
Biological basis of Behaviour
Biology Ecology
Climate Change
“Goal-seeking” Empirical Research Domains Formulaic
Applied (Experimental) Science
Earth Sciences
Classical Mechanics (Newtonian Physics)
Applied mathematics
Future Management
Environmental Sciences
Complex and Chaotic Research Domains
Narrative (Interpretive) Science
Weather Forecasting
Particle Physics
String Theory
Statistics
Strategic Foresight
Complex Systems – Chaos Theory
Predictive Analytics
Anthropology and Pre-history
Clinical Trials / Morbidity / Actuarial Science
“Blue Sky” – Pure Research Domains
Pure (Theoretical) Science
Astronomy
Cosmology
Relativity
Astrophysics
Quantitative Analysis Pure mathematics
Geography
Geology
Archaeology
Economic Analysis
Computational Theory / Information Theory
Chemistry
Engineering
Astrology
Geo-physics
Data Mining “Big Data” Analytics
Palaeontology
Cluster Theory
Interpretive
Qualitative
(Narrative) Analysis
Quantum Mechanics
Taxonomy and Classification

Qualitative and Quantitative Methods
Qualitative and Quantitative Methods
Qualitative Methods - tend to be deterministic, interpretive and subjective in nature. • When we wish to design a research project to investigate large volumes of unstructured data
producing and analysing graphical image and text data sets with a very large sample or set of information – “Big Data” – then the quantitative method is preferred. As soon as subjectivity - what people think or feel about the world - enters into the scope (e.g. discovering Market Sentiment via Social Media postings), then the adoption of a qualitative research method is vital. If your aim is to understand and interpret people’s subjective experience and the broad range of meanings that attach to it, then interviewing, observation and surveying a range of non-numerical data (which may be textual, visual, aural) are key strategies you will consider. Research approaches such as using focus groups, producing case studies, undertaking narrative or content analysis, participant observation and ethnographic research are all important qualitative methods. You will also want to understand the relationship of qualitative data to numerical research. Any qualitative methods pose their own problems with ensuring the research produces valid and reliable results (see also: Analytics - Working with “Big Data”).
Quantitative Methods - tend to be probabilistic, analytic and objective in nature. • When we want to design a research project to tests a hypothesis objectively by capturing and
analysing numerical data sets with a large sample or set of information – then the quantitative method is preferred. There are many key issues to consider when you are designing an experiment or other research project using quantitative methods, such as randomisation and sampling. Also, quantitative research uses mathematical and statistical means extensively to produce reliable analysis of its results (see also: Cluster Analysis and Wave-form methods).

Random Events
• If the movement of an object resulted from the operation of stochastic
processes, a repeating pattern of motion would not occur - and we would not
be able to predict with any accuracy the next location of the object as it move
down its path. Examples of stochastic processes include: - the translational
motion of atomic or molecular substances, such as the hydrogen ions in the
core of the sun; the outcomes from flipping a coin; etc. Stochastic processes
govern the outcome of games of chance – unless those games are “fixed”.
• Disruptive Future paradigms in Future Studies, when considered along with
Wave (String) Theory in Physics – alert us to the possibility of chaotic and
radically disruptive Random Events that generate ripples which propagate
outwards from the causal event like a wave – to flow across Space-Time.
Different waves might travel through the Time-Space continuum at slightly
different speeds due to the “viscosity” (granularity) in the substance of the
Space-Time Continuum (dark energy and dark matter).

Random Events
• Some types of Wave may thus be able to travel faster than others – either
because those types of Wave can propagate through Time-Space more rapidly
than other Wave types – or because certain types of Wave form can take
advantage of a “short cut” across a “warp” in the Time-Space continuum.
• A “warp” brings two discrete points from different Hyperspace Planes close
enough together to allow a Hyperspace Jump. Over any given time interval -
multiple Hyperspace Planes stack up on top of each other to create a time-line
which extends along the temporal axis of the Minkowski Space-Time Continuum.
• As we have discussed previously - Space (position) and Time (history) flow
inextricably together in a single direction – towards the future. In order to
demonstrate the principle properties of the Minkowski Space-Time continuum,
any type of Spatial and Temporal coupling in a Model or System must be able to
show over time that the History of a particle or the Transformation of a
process are fully and totally dependent on both its Spatial (positional) and
Temporal (historic) components acting together in unison.
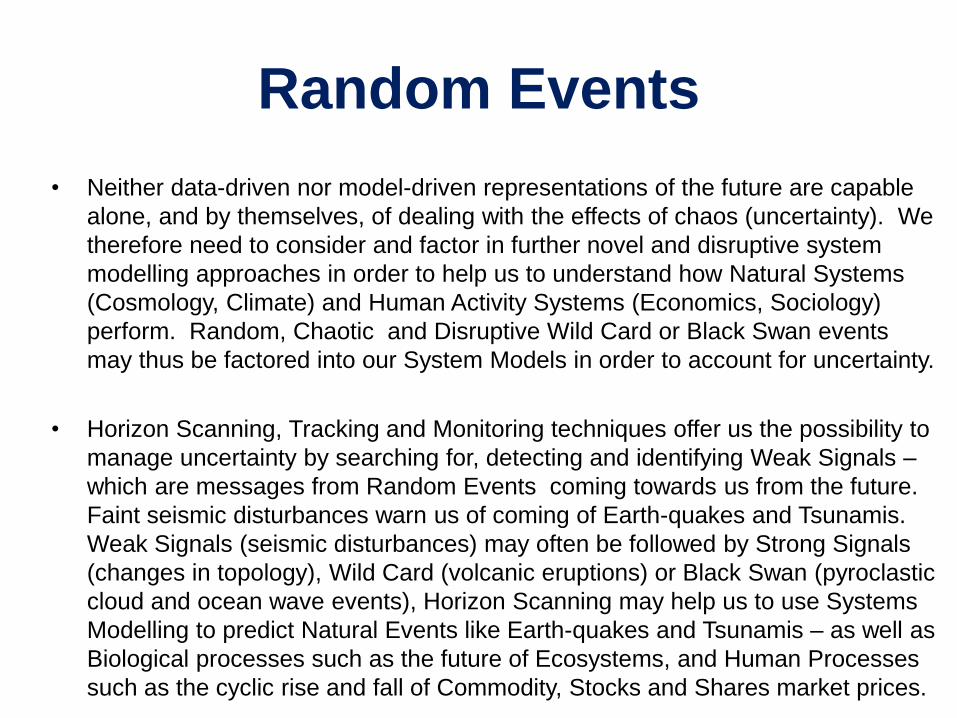
Random Events
• Neither data-driven nor model-driven representations of the future are capable
alone, and by themselves, of dealing with the effects of chaos (uncertainty). We
therefore need to consider and factor in further novel and disruptive system
modelling approaches in order to help us to understand how Natural Systems
(Cosmology, Climate) and Human Activity Systems (Economics, Sociology)
perform. Random, Chaotic and Disruptive Wild Card or Black Swan events
may thus be factored into our System Models in order to account for uncertainty.
• Horizon Scanning, Tracking and Monitoring techniques offer us the possibility to
manage uncertainty by searching for, detecting and identifying Weak Signals –
which are messages from Random Events coming towards us from the future.
Faint seismic disturbances warn us of coming of Earth-quakes and Tsunamis.
Weak Signals (seismic disturbances) may often be followed by Strong Signals
(changes in topology), Wild Card (volcanic eruptions) or Black Swan (pyroclastic
cloud and ocean wave events), Horizon Scanning may help us to use Systems
Modelling to predict Natural Events like Earth-quakes and Tsunamis – as well as
Biological processes such as the future of Ecosystems, and Human Processes
such as the cyclic rise and fall of Commodity, Stocks and Shares market prices.

Data-driven v. Model-driven Domains Model-driven
Data-driven Rationalism
Positivism Gnosticism, Sophism
Reaction
Scepticism
Dogma
Enlightenment
Pragmatism
Realism
Social Sciences
Sociology
Economics
Business Studies / Administration / Strategy
Psychology / Psychiatry / Medicine / Surgery
Behavioural Research Domains
Arts and the Humanities
Life Sciences
History Arts Literature Religion
Law Philosophy Politics
Biological basis of Behaviour
Biology Ecology Anthropology and Pre-history
Clinical Trials / Morbidity / Actuarial Science
“Goal-seeking” Empirical Research Domains
Applied (Experimental) Science
Earth Sciences
Economic Analysis
Classical Mechanics (Newtonian Physics)
Applied mathematics
Geography
Geology
Chemistry
Engineering
Geo-physics Environmental Sciences
Archaeology
Palaeontology
“Blue Sky” – Pure Research Domains
Future Management
Pure (Theoretical) Science
Quantitative Analysis
Computational Theory / Information Theory
Astronomy
Cosmology
Relativity
Astrophysics
Astrology
Taxonomy and Classification
Climate Change
Complex and Chaotic Research Domains
Narrative (Interpretive) Science
Statistics
Strategic Foresight
Data Mining “Big Data” Analytics
Cluster Theory
Pure mathematics
Particle Physics
String Theory
Quantum Mechanics
Complex Systems – Chaos Theory
Futures Studies
Weather Forecasting Predictive Analytics

Random Events • Randomness makes any precise prediction of future outcomes impossible.
We are unable to predict any future outcome with any significant degree of
confidence or accuracy – due to the inherent presence of uncertainty
associated with Complex Systems. Randomness in Complex Systems
introduces chaos and disorder – causing disruption. Events no longer continue
to unfold along a smooth, predictable linear course leading towards an
inevitable outcome – instead, we experience surprises.
• What we can do, however, is to identify the degree of uncertainty present in
those Systems, based on known, objective measures of System Order and
Complexity - the number and nature of elements present in the system, and the
number and nature of relationships which exist between those System
elements. This in turn enables us to describe the risk associated with possible,
probable and alternative Scenarios, and thus equips us to be able to forecast
risk and the probability of each of those future Scenarios materialising.

Random Events • If true randomness exists and future outcomes cannot be predicted –
then what is the origin of that randomness? For example, are unexpected
outcomes simply apparent as a result of sub-atomic nano-randomness
existing at the quantum level – such as uncertainty phenomena etc…..?
• The Stephen Hawking Paradox postulates that uncertainty dominates complex
and chaotic systems to such an extent that future outcomes are both unknown -
and unknowable. The working context of this paradox is however, largely
restricted to the realm of Quantum Mechanics – where each and every natural
event that occurs at the sub-atomic level is truly completely and intrinsically –
both symmetrical and random.
Ordered
Complexity
Non-linear
Systems
Disordered
Complexity
Complex Adaptive
Systems (CAS)
Linear
Systems
Simplexity Complexity decreasing element density and interaction
the “arrow of time”
Order
Enthalpy Entropy Increasing Chaos
Disorder
Void

Random Events
• What is the explanation for randomness evident in all high-order
phenomena found in nature…?
• In order to obtain realistic glimpses into the Future, then the major paradigm
differences between our limited Systemic Models which attempt to simplify,
abstract and simulate reality - and the Actual Reality that we experience every
day - must be clearly distinguished between, differentiated and understood.
That difference is Randomness – bringing Uncertainty, Disorder and Chaos…..
• When we design our Systemic Models representing Actual Reality – such as
the Economy, Geo-political systems, Climate Change, Weather and so on - if
we are lucky enough, then some high-order phenomena found in nature may
be captured by a random rule; and with even more luck, by a deterministic rule
(which can be regarded as a special case of randomness) - but if we are
unlucky - then none of those rules might be captured at all. Regarding the
nature of reality - it still remains unclear what factors distinguish those truly
random phenomenon found in nature at the Quantum level (e.g. radioactive
decay?) from other Random Events - which are triggered by unseen forces.

Random Events
• Can we accept that these natural phenomena are not truly random at all
– that is, given sufficient information such as complete event data sets -
it is possible to predict random events? If so, are all random events the
result of the same natural phenomenon - unseen or hidden forces ? “
• Classical Mechanics (Newtonian Physics) describe the laws which govern all
of the systems and objects that we are familiar with in our everyday routine
lives. Relativity Theory, on the other hand, describes unimaginably large
things, whilst Quantum Mechanics describes impossibly small things – and
Wave Mechanics (String Theory) attempts to describe everything. True
randomness does not really exist in Classical (Newtonian) Physics – the laws
which control Chaos and Complex Systems that govern every aspect of our
life on Earth today – from Natural Systems such as Cosmology, Astronomy,
Climatology, Geology and Biology through to Human Activity Systems such
as Political, Economic and Sociological Complex Adaptive Systems (CAS).

Random Events
• Randomness is simply the results of those forces which are not known, not recognised, not understood, are not under the control of the observer or simply occur outside of the known boundaries of observable system components – but, nevertheless, must still exist and exert influence over the system. Over many System Cycles, immeasurably small inputs interacting with Complex System components and relationships - may be amplified into extremely significant outputs.....
1. Classical (Newtonian) Physics – which governs all of the everyday events around us – where apparent randomness is as a result of Unknown Forces
2. Relativity Theory – which governs the events of impossibly large objects – any apparent randomness or asymmetry is as a result of Quantum effects
3. Quantum Mechanics – which governs the events of unimaginably small objects – all events are truly and intrinsically both symmetrical and random
4. Wave (String) Theory – which attempts to integrate the behaviour of every object – from impossibly large objects to unimaginably small objects – here apparent randomness and asymmetry is as a result of Unknown Forces – which may have their true origin in Quantum Dynamics effects – Membranes

Randomness –The Drunkards Walk
• Randomness The
Drunkards Walk – is
the motion of a moving
body subject to random
changes in direction
• This pattern is
sometimes referred to
as “the drunkard's walk”.
The intersecting lines at
the top and the right of
the picture are
Cartesian coordinates
and mark the origin
where X=0 and Y=0.
• The actual random walk
is long and torturous,
but the actual vector
distance travelled from
the point of origin cross
hairs (0,0) is very short.

Temporal Disturbances in the Space–Time Continuum
• Disruptive Future paradigms in Future Studies along with Wave Theory (String
Theory) in Physics - alert us to the phenomenon of chaotic and radically disruptive
Random Events which can generate Temporal Disturbances in the Space–Time
Continuum – waves which propagate out like a ripple and travel outwards from
that Random Event - through the Space-Time Continuum.
• Weak Signals, Strong Signals, Wild Cards and Black Swan Events – are a
sequence of linked and integrated waves in ascending order of magnitude, which
have a common source or origin - either a single Random Event instance or
arising from a linked series of chaotic and disruptive Random Events - an Event
Storm. These Random Events propagate through the space-time continuum as a
related and integrated series of waves with an ascending order of magnitude and
impact – the first wave to arrive is the fastest travelling,- Weak Signals - something
like a faint echo of the causal Random Event, This may in turn be followed in turn
by a ripple (Strong Signals) then possibly by a wave (Wild Card) - which could
indicate the unfolding a further increase in magnitude and intensity which suddenly
and catastrophically arrives - something like a tsunami (Black Swan Event).

Temporal Disturbances in the Space–Time Continuum
• Weak Signals, Strong Signals, Wild Cards and Black Swan Events – are a sequence of
waves that have a common source or origin and are linked and integrated in ascending order
of magnitude – which emanate either from a single Random Event instance or arise from a
linked series of chaotic and disruptive Random Events - an Event Storm. Signals from these
Random Events propagate through the space-time continuum as an integrated and related
series of waves with an ascending order of magnitude and impact – the first wave to arrive is
the fastest travelling - Weak Signals - something like a faint echo of a Random Event which
may in turn be followed in turn by a ripple (Strong Signals) then possibly by a wave (Wild
Card) - which may predicate a further increase in magnitude and intensity which finally arrives
as a catastrophically unfolding mega-wave - something like a tsunami (Black Swan Event).
Sequence of Events - Emerging Waves Stage View of Wave Series Development
1. Random Event 1. Discovery 2. Weak Signals 1.1 Establishment 3. Strong Signals 1.2 Development 4. Wild Cards 2. Growth
5. Black Swan Event 3. Plateau
4. Decline
5. Collapse
5.1 Renewal
5.2 Replacement

Temporal Disturbances in the Space–Time Continuum
• Randomness. Weak Signals, Wild Cards and Black Swan Events – may be
evidence of a chain of radically disruptive and chaotic Random Events which are
due to the action of unseen forces – that propagate through the Space-Time
Continuum in the same way as a ripple becomes a wave and crosses the ocean.
• Perhaps some of the different Wave Types - Weak Signals, Wild Cards and
Black Swan Events can travel faster or take a different route compared with
some of the other types – perhaps because their Wave forms can propagate
through the Space- Time Matrix (which is made up of dark matter, dark energy
and dark flow) more rapidly than the other Wave forms - or perhaps they are
different types of Wave – and specific Wave Types may able to take a “short-cut”
between two points on different Hyperspace Planes – and so arrive sooner.
• It is possible that certain types of Random Event may be able to “bend” the Time-
Space continuum – to bring two discrete points on different Hyperspace Planes
closer together and so take a short-cut over a time interval extended through a
time-line flowing along the Time axis of the Minkowski Space-Time Continuum.

Temporal Disturbances in the Space–Time Continuum
• Every item of Global Content that we find in the Present is somehow
connected with both the Past and the Future. Space-Time is a Dimension –
which flows in a single direction, as does a River – towards the Future.
• Space-Time, like water diverted along an alternative river channel, does not
always flow uniformly – outside of the main channel there could well be
“submerged objects” (random events) that disturb the passage of time, and
may possess the potential capability of creating unforeseen eddies, whirlpools
and currents in the flow of Time (disorder and uncertainty) – which in turn
posses the capacity to generate ripples, and waves (chaos and disruption) –
thus changing the course of the Time-Space continuum. “Weak Signals” are
“Ghosts in the Machine” of these subliminal temporal interactions – with the
capability to contain information about future “Wild card” or “Black Swan”
random events.

Temporal Disturbances in the Space–Time Continuum
• Biological, Sociological, Economic and Political systems all tend to demonstrate
Complex Adaptive System (CAS) behaviour - which appears to be more similar
in nature to biological behaviour in an population than to truly Disorderly, Chaotic,
Stochastic Systems (“Random” Systems). For example, the remarkable long-term
adaptability, stability and resilience of market economies may be demonstrated by
the impact of Black Swan Events causing stock market crashes - such as oil price
shocks (1970-72) and credit supply shocks (1927- 1929 and 2008 onwards) – by
the ability of Financial markets to rapidly absorb and recover from these events.
• Unexpected and surprising Cycle Pattern changes have historically occurred during
regional and global conflicts being fuelled by technology innovation-driven arms
races - and also during US Republican administrations (Reagan and Bush - why?).
Just as advances in electron microscopy have revolutionised the science of biology
- non-stationary time series wave-form analysis has opened up a new space for
Biological, Sociological, Economic and Political system studies and diagnostics.

Temporal Disturbances in the Space–Time Continuum
• In any crowd of human beings or a swarm of animals, individuals are so closely connected that they share the same mood and emotions (fear, greed, rage) and demonstrate the same or very similar behaviour (fight, flee or feeding frenzy). Only the first few individuals exposed to the Causal Event or incident may at first respond strongly and directly to the initial “trigger” stimulus, causal event or incident (opportunity or threat – such as external predation, aggression or discovery of a novel or unexpected opportunity to satisfy a basic need – such as feeding, reproduction or territorialism).
• Those individuals who have been directly exposed to the initial “trigger” event or incident - the system input or causal event that initiated a specific outbreak of behaviour in a crowd or swarm – quickly communicate and propagate their swarm response mechanism and share with all the other individuals – those members of the Crowd immediately next to them – so that modified Crowd behaviour quickly spreads from the periphery or edge of the Crowd.
• Peripheral Crowd members in turn adopt the Crowd response behaviour without having been directly exposed to the “trigger”. Most members of the crowd or swarm may be totally oblivious as to the initial source or nature of the trigger stimulus - nonetheless, the common Crowd behaviour response quickly spreads to all of the individuals in or around that crowd or swarm.

Weak Signals

Weak Signals
Weak Signals are subtle indicators of novel and emerging ideas, patterns and
trends which may give us a glimpse over the current horizon and allow us to
peer through the mists of time into the future.....
Weak Signals indicate possible future transformations and changes which are
happening right now, on or even just beyond the visible horizon, predicating
changes in how we do business, what business we do, and the future
environment in which we will all live and work.
Weak Signals – are messages from the future, subliminal temporal indicators
of change (Random Events) coming to meet us from the distant horizon –
perhaps indicators of novel and emerging desires, thoughts, ideas, influences,
patterns and trends – which may arrive to interact with both current and historic
waves, patterns and trends to alter, enhance, impact or effect future outcomes
and events, or simply some future change taking place in the current
environment in which we all share our life experiences.....

Weak Signals and Wild Cards
Publish and
Socialise
Investigate and
Research
Scan and Identify
Track and Monitor
Communicate Discover
Understand Evaluate
Random Event
Strong Signal
Weak Signal
Wild Card
Random Events – Weak Signal / Wild Card Signal Processing
Signal Processing

Weak Signals Wild Cards, Black Swans
Wild Card
Strong Signal
Random Event
Weak Signal
Communicate Discover
Understand Evaluate
Random Event
Strong Signal
Weak Signal
Wild Card
Black Swan
“Black Swan” Events are Runaway Wild Card Scenarios
Signal Processing

Weak Signals
• Weak Signal is a descriptor for an unusual and unexpected message from the future –
faint and subliminal – predicating a forthcoming Random Event. Weak Signal is sign
indicating either a possible future outcome or random event which has not been forecast
or anticipated (either because it seemed unlikely - or because no-one had even thought
about it) - but which may indicate some future extreme and far-reaching impact or effect.
1. SURPRISE – Weak Signals are a sudden and unexpected surprise to the observer.
2. SIGNIFICANCE - Weak Signals have significance as a message of a future random event,
predicating renewal or transformation – or signaling a new beginning or fresh chapter.
3. SPEED - Weak Signals appear out of nowhere – then either disperse or become stronger.
4. DUALITY OF NATURE - Weak Signals may indicate a possible future serious challenge or
threat – or reveal to the observer a future novel and unexpected window of opportunity.
5. PARADOX - Weak Signals at their first appearance could or should have been picked up
and recognised – if the Weak Signal is detected against the overwhelming foreground and
background noise - then identified, analysed and correctly accounted for.

Weak Signals
• Weak Signals – are messages, subliminal temporal indicators of ideas, patterns or trends
coming to meet us from the future – or perhaps indicators of novel and emerging, ideas,
influences and messages which may interact with both current and pre-existing patterns
and trends to impact or affect some change taking place in our current environment – even
an early warning or sign of impending random events, disasters or catastrophes which, at
some point, time or place in the Future, may predicate, influence or impact on future
events, objects or processes – to effect subtle, minor or major changes in how we live,
work and play – or even threaten the very existence of the world as we know it today.....
• A Weak Signal is an early warning or sign of change, which typically becomes stronger by
combining with other signals. The significance of a weak future signal is determined by the
nature and content of the message it contains – predicating positive or negative change –
and the scope and objectives of its recipient. Finding Weak Signals typically requires
systematic searching through “Big Data” - internet content, news feeds, data streams,
academic papers and scientific research data sets. A weak future signal requires: i)
support, ii) critical mass, iii) growth of its influence space, and dedicated actors, i.e. ‘the
champions’, in order to become a strong future signal - else Weak Signals evaporate or
disappear into the ether. A Weak Future Signal is usually first recognised by research
pioneers, think tanks or special interest groups (amateur astronomers and comets) – but
very often missed or dismissed by acknowledged “main-stream” subject matter experts.

Weak Signals
• Weak Signals – refer to Weak Future Signals in Horizon and Environment Scanning for any
unforeseen, sudden and extreme Global-level transformation or change Future Events in either
the military, political, social, economic or environmental landscape – some having an inordinately
low probability of occurrence - coupled with an extraordinarily high impact when they do occur.
• Weak Signal Types in Horizon Scanning
– Technology Shock Waves
– Supply / Demand Shock Waves
– Political, Economic and Social Waves
– Religion, Culture and Human Identity Waves
– Art, Architecture, Design and Fashion Waves
– Global Conflict – War, Terrorism, and Insecurity Waves
• Weak Signal Types in Environment Scanning
– Natural Disasters and Catastrophes
– Impact of Human Activity on the Environment - Global Massive Change Events

Weak Signals
1. Weak Signals are initially vague in their nature and difficult to interpret at the beginning of a new
Random Event, Weak Signal, Strong Signal, Wild Card and Black Swan Wave Series, so that
their future course and outcomes often remains unclear (ANSOFF, 1990) ;
2. The nature of the early information which can be assimilated from Random Events - Weak
Signals, Strong Signals, Wild Cards and Black Swan Events - arrive in an integrated Wave
Series (ANSOFF, 1975) and has little internal structure or reference, so cannot be described or
defined in advance of receiving those very first Weak Signals (MARCH and FELDMAN, 1981),
3. The Stochastic hybrid and cross-functional and Probabilistic nature of Weak Signals limits the
impact, relevance and application of Deterministic prescriptive methods and approaches, and
precludes rigid, inflexible algorithm-based expert systems approaches (GOSHAL and KIM, 1986).
4. In strategic decision making, the uniqueness in the form and function of Weak Signals, Strong
Signals, Wild Cards and Black Swan Events - implies the use of flexible approaches and
solutions based on Probabilistic Methods – including cognitive filtering, bounded rationality,
“fuzzy” logic, approximate reasoning, neural networks and adaptive systems (SIMON, 1983);
5. The random and ethereal nature of the Horizon and Environment Scanning, Tracking and
Monitoring process involves dependence - strange actors, clustering, numerous elements and
complex interactions - and requires very large scale (VLS) computing and “BIG DATA” Analytics
techniques to reliably and accurately discover, identify, classify and interpret Weak Signals.

Weak Signals
6. Neural Networks and Complex / Adaptive / Learning System Models combined with “BIG DATA”
methods are therefore likely to be the most successful and appropriate technology approaches for
executing both Horizon and Environment Scanning, Tracking and Monitoring studies.
7. A major component of the process of Horizon and Environment Scanning, Tracking and
Monitoring is achieved either by horizon or environmental scanners who capture weak signals
hidden within massive amounts of external raw data, and data scientists using “BIG DATA” content
techniques for data analysis - “washing and mashing” and “racking and stacking”
8. A Weak Future Signal is an early warning of change, which typically becomes stronger by combining
with other signals. The significance of a weak future signal is determined by the objectives of its
recipient, and finding it typically requires systematic searching. A weak future signal requires: i)
support, ii) critical mass, iii) growth of its influence space, and dedicated actors, i.e. ‘the champions’,
in order to become a strong future signal, or to prevent itself from becoming a strong negative signal.
A Weak Future Signal is often recognised by pioneers or special groups - not by acknowledged
subject matter experts
9. The Weak Future Signal Event Types – refer to subliminal indications of future unforeseen,
sudden and extreme Global-level transformation or change. Weak Signal Event Types in either the
military, political, social, economic or environmental landscape - having an inordinately low probability
of occurrence - coupled with an extraordinarily high impact when they do occur.

Weak Signals Weak Signal Property Different views and viewpoints
1 Nature Weak Signals are subtle indicators of ideas, patterns or
trends that give us a glimpse into the future – predicating
possible future transformations and changes which are
happening on or even just over the visible horizon, changes
in how we do business, what business we do, and the future
environment in which we will all live and work.
2 Quality
Weak Signals may be novel and surprising from the signal
analyst's vantage point - although many other signal
analyst's may have already, failed to recognise,
misinterpreted or dismissed the same Weak Signals
3 Purpose Weak Signals are used for Horizon Scanning, Tracking
and Monitoring and for Future Analysis and Management
4 Source Weak Signals, Strong Signals, Wild Cards and Black
Swan Events – are a sequence of waves linked and
integrated in ascending order of magnitude, which have a
common source or origin - either a single Random Event
instance or arising from a linked series of chaotic and
disruptive Random Events – generating Weak Signals from
a Random Event Cluster or Random Event Storm.

Weak Signals Weak Signal Property Different views and viewpoints
5 Wave-form Analytics and “Big Data” Global Internet Content
Wave-form Analytics may be used with “Big Data” to analyse how Random Events propagate through the space-time continuum in a related and integrated series of waves with an ascending order of magnitude and impact – the first wave to arrive is the fastest travelling - Weak Signals - something like a faint echo of a Random Event which may be followed in turn by a ripple (Strong Signals) then possibly by a wave (Wild Card) - which may indicate the unfolding a further increase in magnitude and intensity which finally arrives catastrophically - something like a tsunami (Black Swan Event).
6 Identification Weak Signals are sometimes difficult to track down, receive, tune in, identify, amplify and analyse amid the overwhelming volume of “white noise” from stronger signals and other foreground and background noise sources
7 Principle of Dual Nature (possibility of either an Opportunity or Threat)
Weak Signals may indicate the possibility of either a potential future threat or opportunity to yourself or your organization - or foretell the pending arrival of a future advantage or reversal – a “Wild card” or Black Swan” event

Weak Signals and Wild Cards
• “Wild Card” or "Black Swan" manifestations are extreme and unexpected events which have a very low probability of occurrence, but an inordinately high impact when they do happen. Trend-making and Trend-breaking agents or catalysts of change may predicate, influence or cause wild card events which are very hard - or even impossible - to anticipate, forecast or predict.
• In any chaotic, fast-evolving and highly complex global environment, as is currently developing and unfolding across the world today, the possibility of any such “Wild Card” or "Black Swan" events arising may, nevertheless, be suspected - or even expected. "Weak Signals" are subliminal indicators or signs which may be detected amongst the background noise - that in turn point us towards any "Wild Card” or "Black Swan" random, chaotic, disruptive and / or catastrophic events which may be on the horizon, or just beyond......
• Weak Signals – refer to Weak Future Signals in Horizon and Environment Scanning - any unforeseen, sudden and extreme Global-level transformation or change Future Events in either the military, political, social, economic or the environmental landscape – some having an inordinately low probability of occurrence - coupled with an extraordinarily high impact when they do occur.

Weak Signals Weak Signal Property Different views and viewpoints
8 Perception Weak Signals are often missed, dismissed or scoffed at by
other Subject Matter Experts
9 Opportunity Weak Signals contain novel and emerging ideas, influences
and messages - therefore they represent an early window of
potential opportunity.
10 Impact Weak Signals arrive, become established, develop, grow
and mature - then peak, plateau decline and collapse – or
interact with current and pre-existing extrapolations,
patterns or trends to transform or change the landscape
11 Receipt / Observation Every Weak Future Signal requires –
1. a Receiver / Observer / Analyst (which could be
automated by deploying “Big Data” Analytics)
2. Subject mater experts, special interest groups etc. and
Empowered Stakeholders to achieve critical
momentum
3. growth of its support, championship and influence space
4. dedicated actors, e.g. “supporters and champions”

Weak Signals
Weak Signal Property Different views and viewpoints
12 Duration Weak signals only last for a brief period: – Transient Signal
1. Weak signals are seen as a sign that lasts for a moment,
but indicate a phenomenon (Random Event) behind it that
lasts longer – there may be a following Strong Signal
2. Weak signals are phenomena that last for a short period of
time (succeeded by strong signals and wild cards?)
Weak signal lasts longer:– it now becomes a Strong Signal
3. A weak signal is a cause for a change in the future
4. A weak signal is itself a change phenomenon
13 Transition phenomenon 1. A weak signal is created as a result of a spontaneous
Random Event phenomenon or Random Event Cluster
2. A weak signal is a sign of a future disruptive changes or
Individual / Local / Regional / Global Transformations
3. A weak signal may be an early indicator - and member of -
an integrated Wave Series
4. The transition phenomenon of a weak signal is that in the
future it will either get stronger (becomes a Strong Signal)
or weaker (attenuate and disappear from view)

Weak Signals
Weak Signal Property Different views and viewpoints
14 Objectivity v. Subjectivity 1. Weak signals exist independently of their receiver.
2. “Weak signals float in the phenomena space and
wait for someone to find them” – automation via
“Big Data” Analytics can address this issue.....
3. A weak signal does not exist without reception /
interpretation by a receiver / observer (which may
mitigated by automated via “Big Data” Analytics)
15 Interpretation The interpretation of a same signal can be different
from the viewpoint of different receivers of the signal.
Human Interpretation adds subjectivity to the signal –
even though it is thought to be objective – “Big Data”
Analytics may be used for the Validation process
16 Signal Strength over Time 1. The weak signal (as an indicator) is strengthening
2. A phenomenon, interpreted as weak signal, is
strengthening – it now becomes a Strong Signal
3. A phenomenon whose status is in question, is
strengthening – it now becomes a Strong Signal

Weak Signals
Weak Signal Property Different views and viewpoints
17 Roles and Responsibilities –
Receivers /Observers /
Analysts of the weak signal
(who receives, identifies,
observes and classifies)
1. Difficulties in defining the concept of Weak
Signals to Empowered Stakeholders – subject
mater experts, special interest groups, etc. –
explaining how they arrive from a single instance
or linked series of Random Events – or Event
Cluster / Storm
2. Differences in opinion on signal content between
signal Receiver, Observer and Analysts :-
resolved by special interest groups, subject mater
experts
18 Roles and Responsibilities –
Analysts / Interpreters /
Stakeholders in the signal
(who analyses and draws
useful valid conclusions)
1. Who is drawing the conclusions on the cause-
effect relationship? – the Receiver and the
Observer
2. Who is defining the credibility and significance of
weak signal? – the Observer and the Analyst
3. Who is the one that can affect important decisions
concerning the future? – Empowered
Stakeholders

Strong Signals
Strong Signals – represent the first clear and visible presence of a Random Event – the secondary arrival of stronger but slower-travelling waves containing more information of possible, probable and alternative future events – random events, future catastrophes, or indications o novel and emerging, ideas, influences and messages
Strong Signals

Strong Signals
• Strong Signal is a descriptor for an unusual and unexpected - but very real and apparent
- signal indicating a possible outcome or random event which has not been forecast or
anticipated (either because it seemed unlikely - or because no-one had even thought
about it) - but which may have some future extreme and far-reaching impact or effect.
1. SURPRISE – Strong Signals are a complete and unexpected surprise to the observer.
2. SIGNIFICANCE - Strong Signals have a significance as an indicator of change - or as an
signal for renewal or transformation – or signify a new beginning or fresh chapter.
3. SPEED - Strong Signals appear out of nowhere – then either disperse or magnify.
4. DUALITY OF NATURE - Strong Signals may indicate a possible serious challenge or
threat – or reveal to the observer a future novel and unexpected window of opportunity.
5. PARADOX - Strong Signals are rationalised by hindsight, as at their first appearance they
could or should have been foreseen had the relevant Weak Signals been available and
detected in the background noise, identified correctly, analysed and accounted for.

Strong Signals
• Strong Signals – represent the first clear and visible presence of a Random Event – the
secondary arrival of stronger but slower-travelling waves containing more information of
possible, probable and alternative future events – random events, future catastrophes, or
indications o novel and emerging, ideas, influences and messages which may interact with
both current and pre-existing patterns and trends to impact or affect some change taking
place in our environment - at some point, time or place in the future – for example, what
future climatic and ecological environment will live , work and play in what political, social
and economic environment will live , work and play in, how we live, work and play, what
business we do, how we do business and who we do Business with......
1. Strong Signals may demonstrate a substantial lag time before they follow their
preceding indicators, prior Weak Signals
2. Strong Signals may contain confirmation about future events – random events,
catastrophes, or indications o novel and emerging, ideas, influences and messages.
They therefore present a second potential window of opportunity if the first Weak Signals
in the series were undetected, overlooked or dismissed
3. Strong Signals arrive, become established, develop, grow and mature - then peak,
plateau decline and collapse or interact with current and pre-existing extrapolations,
patterns or trends which act to transform or change the current outlook or landscape.

Strong Signals
Property Different Views and Viewpoints
1 Nature Strong Signals follow Weak Signals – to give a more clear and apparent
indication of ideas, patterns or trends that provide us with a stronger and
more lasting glimpse into the future – predicating probable future
transformations and changes which are happening on or even just over
the visible horizon, changes in how we do business, what business we
do, and the future environment in which we will all live and work.
2 Purpose Strong Signals are used in Horizon Scanning, Tracking and Monitoring -
for Strategy Analysis and Strategy Management, Future Analysis and
Future Management
3 Source Weak Signals, Strong Signals (which are second in the sequence), Wild
Cards and Black Swan Events – are a linked sequence of integrated
waves in a timeline and ascending order of magnitude, which have a
common source or origin - either a single Random Event instance – or
arising from a linked series of chaotic and disruptive Random Events –
creating a Random Event Cluster or Random Event Storm.

Strong Signals
Property Different Views and Viewpoints
4 Identification Strong Signals are easier to recognise than Weak Signals,
receive, tune in, identify, amplify and analyse amid the
overwhelming volume of “white noise” from stronger signals and
other foreground and background noise sources
5 Perception Whereas Weak Signals are often missed, dismissed or scoffed at by
other Subject Matter Experts - Strong Signals are more widely
recognised and accepted
6 Opportunity Strong Signals bring confirmation of novel and emerging ideas,
influences and messages - therefore they represent an second
window of potential opportunity.
7 Quality Whereas Weak Signals may be novel and surprising from the signal
analyst's vantage point - Strong Signals are not as easily
dismissed as Weak Signals. Many other signal analyst's may now
confirm and support the content of such Strong Signals
9 Timing Strong Signals may demonstrate a substantial lag time before they
follow their preceding indicators, prior Weak Signals

Wild Cards

Wild Cards
• Wild Card is a descriptor for an unusual and unexpected outcome or event which has not
been forecast or anticipated (either because it seemed unlikely - or because no-one had
even thought about it) - but which has extreme impact and far-reaching and effect. This
term is also often used as a descriptive adjective - as in the expression wild-card event.
1. SURPRISE – Wild Card Events are a complete and totally unexpected surprise to the
observer - the scale of the event falling well outside the realm of previous experience.
2. SIGNIFICANCE - Wild Card Events have a significant impact as a catalyst of change - or
as an agent of renewal or transformation – or even signify a new beginning or fresh chapter.
3. SPEED - Wild Card Events appear out of nowhere – then unfold with speed and rapidity.
4. DUALITY OF NATURE - Wild Card Events may represent either a potentially serious
challenge or threat – or present the observer with a novel and unexpected opportunity.
5. PARADOX - Wild Card Events are rationalised by hindsight, as at their first appearance
they could or should have been foreseen had the relevant Weak Signals been available
and detected in the background noise, identified correctly, analysed and accounted for.

Wild Card Events
Definition of “Wild card” Event
• A “Wild card” Event is a surprise - an event or occurrence that deviates outside of what
would normally be expected of any given situation or set of circumstances, and which therefore
would be difficult to anticipate or predict. This term was coined by Stephen Aguilar-Milan in the
1960’s and popularised by Ansoff in the 1970’s. Wild card Events – are any unforeseen,
sudden and unexpected change events or transformation scenarios which occur within the
military, political, social, economic or environmental landscape - having a low probability of
occurrence, coupled with an high impact when they do occur (Stephen Aguilar-Milan): -
• Horizon Scanning – Wild card Event Types
– Technology Shock Waves
– Religion, Culture and Human Identity Shock Waves
– Art, Architecture, Design and Fashion Shock Waves
– Epidemics – outbreaks of contagious diseases
• Environment Scanning - Wild card Event Types
– Natural disasters – flooding, drought, earthquakes, volcanic activity
– Human Activity Impact on the Environment – Climate Change Events

Wild Cards
1. Wild Card Events have been defined, for example, by Rockfellow (1994), who speculated that a
wild card is "an event having a low probability of occurrence, but an inordinately high impact if it
does occur."
2. Wild Cards represents the appearance, materialisation or manifestation of a RANDOM EVENT
- either a potential threat or perceived opportunity to yourself and / or your organization - and
may contain within them, the seeds of a possible major future global advantage or reversal – a
forthcoming “Black Swan” event
3. Listing examples of specific 21st Century Wild Cards in 1994, Rockfellow defined three wild
cards principles: -
1. 21st Century Wild Cards manifest themselves at the beginning of the Business Cycle– or
act to bring to an end the current the Business Cycle (i.e. within 11 years of a prior cycle)
2. 21st Century Wild Cards have a probability of re-occurring again at a rate of less than 1 in
10 years – but reappear with increased speed, frequency, severity and impact over time
3. 21st Century Wild Cards events will likely have high impact on international businesses
4. Wild Cards are "low-probability, hi-impact events that happen quickly" and "they have huge
sweeping consequences." Wild cards, according to Petersen, generally surprise everyone,
because they materialize so quickly that the underlying social systems cannot effectively
anticipate or respond to them (Petersen 1999).
5. According to Cornish (2003: 19), a Wild Card is an unexpected, surprising or even startling
event that has sudden impact, important outcomes and far-reaching consequences. He
continues: "Wild cards have the power to radically change many processes and events and to
entirely overturn people's thinking, planning and actions."

Wild Cards
Property Different Views and Viewpoints
1 Nature Wild cards follow in the sequence of Random Events, Weak Signals and
Strong Signals – to give the first exposure to novel and emerging events
and event clusters, ideas, patterns or trends that arrive from the future –
beginning transformations and changes which now have a very real
presence and effect – impacting on how we do business, what business
we do, and the future environment in which we will all live, work and play.
2 Purpose Wild cards are used in Horizon Scanning, Tracking and Monitoring –
providing information for the purposes of Future Analysis and Future
Management, Strategy Analysis and Strategy Management,
3 Source Random Events, Weak Signals, Strong Signals and Wild cards and
Black Swan Events – are a linked sequence of integrated waves in a
timeline and ascending order of magnitude and impact, which have a
common source or origin - either a single Random Event instance – or
arising from a linked and integrated series of chaotic and disruptive
related Random Events – as part of a Random Event Cluster or
Random Event Storm.

Wild Cards
Property Different Views and Viewpoints
4 Identification Wild cards are much easier to recognise than Weak Signals and
Strong Signals, above the background of “white noise” from and
other signals from foreground and background noise sources
5 Perception Whereas Weak Signals and even Strong Signals are often missed,
dismissed or scoffed at by other Subject Matter Experts – Wild
cards events are almost universally recognised and accepted
6 Opportunity Wild cards bring realisation of startling new events, novel and
emerging ideas, influences and messages - therefore they represent
an third and final window of potential opportunity.
7 Quality Weak Signals and even Strong Signals may be novel and surprising
from the signal analyst's vantage point - Wild cards, however,
cannot be so easily dismissed. Many other signal analyst's may
now join in to confirm and support the content of such Wild cards.
9 Timing Wild cards may demonstrate a substantial lag time before they
follow their preceding indicators, those prior Weak Signals and their
followers, the Strong Signals

Wild Cards
• Climate and Environmental Agents & Catalysts of Change impact on Human Futures •
• For most of human existence our ancestors led precarious lives as scavengers, hunters,
and gatherers, and there were fewer than 10 million human beings on Earth at any one
time. Today, many of our cities have more than 10 million inhabitants each - as global
human populations continue to grow unchecked. The total global human population
stands today at 7 billion - with as many as three billion more people on the planet by 2050.
• Human Activity Cycles - Business, Social, Political, Economic, Historic and Pre-historic
(Archaeology) Waves - may be compatible with, and map onto - one or more Natural
Cycles – Orbital, Climate and so on. Current trends in Human Population Growth are
unsustainable – we are already beginning to run out of Food, Energy and Water (FEW) –
which will first limit, then reverse human population growth – falling below 1bn by 2060 ?
• Over the long term, ecological stability and sustainability will be preserved – but at the
expense of the continued, unchecked growth of human populations. Global population will
rise to 10 billion by 2040 – followed by a massive population collapse to under 1 billion -
recovering to 1 billion by the end of the 21st century. There are eight major threats to
Human Society, which are “Chill”, “Grill”, “Ill”, “Kill”, “Nil”, “Spill”, “Thrill” and “Till”.

Environmental Wild Card Event Types
Event Type Force Environmental Black Swan Event
1 Natural
Disasters &
Catastrophe
Natural
Forces
Natural disasters occur when extreme magnitude events of stochastic
natural processes cause severe damage to human society. "Catastrophe" is
used about an extreme disaster, although originally both referred only to
extreme events (disaster is from the Latin, catastrophe from Ancient Greek).
Human Activity Cycles - Business, Social, Political, Economic, Historic and
Pre-historic (Archaeology) Waves - may be compatible with, and map onto -
one or more Natural Cycles. Current trends in Human Population Growth
are unsustainable – we are already beginning to run out of Food, Energy
and Water (FEW) – which will first limit, then reverse human population
growth. Ecological stability and sustainability will be preserved – but only at
the expense of the continued, unchecked growth of human populations.
2 Global
Massive
Change
Events
Human
Activity
Anthropogenic Impact (Human Activity) on the natural Environment - Global
Massive Change Events. In their starkest warning yet, following nearly
seven years of new research on the climate, the Intergovernmental Panel on
Climate Change (IPCC) said it was "unequivocal" and that even if the world
begins to moderate greenhouse gas emissions, warming is likely to cross
the critical threshold of 2C by the end of this century. That would have
serious consequences, including sea level rises, heat-waves and changes to
rainfall meaning dry regions get less and already wet areas receive more.

Wild Card Event Types
Type Force Technology Shock Wave Event
3 Technology
Shock Waves
Innovation Technology Shock Waves – Disruptive Technologies: -
Stone – Tools for Hunting, Crafting Artefacts and making Fire
Fire – for Warmth, Cooking and managing the Environment
Agriculture – Neolithic Age Human Settlements
Bronze – Bronze Age Cities and Urbanisation
Ship Building – Communication, Culture and Trade
Iron – Iron Age Empires, Armies and Warfare
Gun-powder – Global Imperialism and Colonisation
Coal – Mining, Manufacturing and Mercantilism
Engineering – Bridges, Boats and Buildings
Steam Power – Industrialisation and Transport
Chemistry – Dyestuff, Drugs, Explosives and Agrochemicals
Internal Combustion – Fossil Fuel dependency
Physics – Satellites and Space Technology
Nuclear Fission – Globalisation and Urbanisation
Digital Communications – The Information Age
Smart Cities of the Future – The Solar Age - Renewable
Energy and Sustainable Societies
Nuclear Fusion – The Hydrogen Age - energy independence -
Inter-planetary travel and discovery, Human Settlements
Space-craft Building – The Exploration Age - Inter-stellar
travel & discovery, Galactic Colonisation, Cities & Urbanisation

Wild Card Event Types Type Force Wild card Event
4 Impact
Event
Gravity Asteroid or comet impact – the odds of an asteroid or comet impact on the
Earth depend on the size of the Object. An Object approximately 15 feet in
diameter hits the Earth once every several months; 35 feet every 10 years; 60
feet every 100 years; 200 feet, or size of the Tunguska impact, every 200
years; 350 feet every several thousand years; 1,000 feet every 50,000 years;
six tenths of a mile every 500,000 years; and 5 to 6 miles across every 100
million years.
5 Thermal
Process
Geo-
Thermal
Energy
“Spill Moments” - Local and Regional Natural Disasters e.g. Andesitic volcanic
eruption at tectonic plate margins – for example, the Vesuvius eruption and ash
cloud destroying the Roman cities of Herculaneum and Pompeii, and Volcanic
eruption / collapse causing Landslides and Tsunamis - Stromboli eruption /
collapse fatally weakening the Minoan Civilisation on Crete, Krakatau eruption
in the 19th Century causing Indonesian Tsunamis, ocean-floor sediment slips
causing in recent years the recent Pacific / Indian Oceanic, and Japanese
Tsunamis – resulting in coastal flooding, inundation and widespread destruction
“Thrill Moments” - Continental or Global Natural Disasters – Extinction-level
Events (ELE) such as the Deccan and Siberian Traps Basaltic Flood Volcanic
Events, Asteroid and Meteorite Impacts, Gamma-ray Bursts from nearby
collapsing stars dying and going Supernova – which have all variously
contributed towards the late Pre-Cambrian “Frozen Globe”, Permian-Triassic
and Cretaceous-Tertiary boundary global mass extinction events.

Wild card Events Type Force Extinction-level Black Swan Event
6 Climate
Change
Human
Activity
Melting of the polar ice-caps, rising sea levels – combined with increased
severity and frequency of extreme weather events – El Nino and La Nina
have already begun to threaten these low-lying coastal cities (New Orleans,
Brisbane). By 2040, a combination of rising sea levels, storm surges of
increased intensity and duration and flash floods – will flood much more
often. Coast, Deltas, Estuaries & River Valleys will flood up to 90km inland
up to 90 km into the interior from the present coast – frequently drowning
many of the major cities along with much of our most productive agricultural
land – and washing away homes and soil in the process. Human Population
Drift to Cities and Urbanisation also drives the destruction of prime arable
land – as it is gobbled up by developers to build even more cities.
Liquid water melted by warm air at the surface of a glacier, runs down sink-
holes to the glacier base where it lubricates the rock / glacier interface –
causing glacier flow surges up to 20 times the normal flow-rate. Increased
glacial flow-rate is usually further aided and by the loss of sea pack ice –
which acts to moderate Glacier flow during cold periods - due to oceanic
temperature rise (oceanic climate forcing). This scenario does satisfy not
the timing requirements of climate change events which occur at the
culmination of a next Bond Cycles – believed to be oceanic climate forcing
phenomena. It does fit in well with the rapid rise in temperature that occurs
at the beginning of the next Bond Cycle – which takes only a few decades
after the culmination of the previous Bond Cycle.

Wild card Events
Type Force Black Swan Event
7 Climate
Change
Event
Solar
Forcing
Climate Change – Dansgaard-Oetcher and Bond Cycles - oceanic climate forcing
cycles consisting of episodes of rapid warming followed by slow cooling have been
traced and plotted over the last 26 cycles – 40,000 years - with metronomic precision
of exact 1,490-years periodicity. Solar orbital cycle variations with periodicities from
20,000 to 400,000-years have also been traced and plotted over many cycles – tens of
millions of years – again with metronomic regularity. These longer-scale Milankovich
Cycles are responsible for Pluvial and Inter-pluvial episodes (Ice Ages) during the
Quaternary period - due to orbital variation causing changes to solar climate forcing.
Global warming—Human Activity has been largely held responsible for the Earth
getting warmer every decade for the last two hundred years – and the rate of warming
has accelerated over the last few decades. The Earth could eventually wind up like its
greenhouse sister, Venus. “Grill” - rapidly rising temperatures such as found in Ice
Age Inter-Glacial episodes (Inter-pluvial Periods) – precipitating environmental and
ecological change under heat stress and drought – causing the disappearance of the
Neanderthal, Soloutrean and Clovis cultures with deforestation, desertification and
drying driving the migration or disappearance of the Anastasia in SW America - along
with the Sahara Desert migrating south and impacting on Sub-Saharan cultures.
.Global cooling— The Earth has dramatically cooled and plunged into Ice Ages on
many occasions throughout Geological History, Earth might eventually change to
resemble its frozen sister, Mars. “Chill” – rapid cooling, e.g. Ice Age Glaciations
(Pluvial Periods) causing the depopulation of Northern Europe in early hominid Eolithic
times and impact of the medieval “mini Ice Age” on Danish settlers in Greenland.

Wild Card Event Types
Type Force Wild card Event
5 Global
Massive
Change
Event
Human
Impact
on Eco-
system
FEW - Food, Energy, Water Crisis - as scarcity of Natural Resources (FEW -
Food, Energy, Water) and increased competition to obtain those scarce
resources begins to limit and then reverse population growth, global population
levels will continue expansion towards an estimated 8 or 9 billion human beings
by the middle of this century – then collapse catastrophically to below 1 billion –
slowly recovering and stabilising out again at a sustainable population of about 1
billion human beings by the end of this century.
“Till Moments” - Society’s growth-associated impacts on its own ecological and
environmental support systems, for example intensive agriculture causing
exhaustion of natural resources by the Mayan and Khmer cultures, de-
forestation and over-grazing causing catastrophic ecological damage and
resulting in climatic change – for example, the Easter Island culture, the de-
population of upland moors and highlands in Britain from the Iron Age onwards –
including the Iron Age retreat from northern and southern English uplands, the
Scottish Highland Clearances and replacement of subsistence crofting by deer
and grouse for hunting and sheep for wool on major Scottish Highland Estates
and the current sub-Saharan de-forestation and subsequent desertification by
semi-nomadic pastoralists. Like Samson, will we use our strength to bring down
the temple? Or, like Solomon, will we have the wisdom to match our technology?

Wild Card Event Types
Type Force Wild card Event
8 Alien
Contact
Event
Biological
Disease
“Ill Moments” - Contact with a foreign population or alien civilization and their
bio-cloud – bringing along with them their own parasite burden and contagious
diseases (viruses and bacteria) - leading to pandemics to which the exposed
human population has developed little or no immunity or treatment. Examples
include the Bubonic Plague - Black Death - arriving in Europe in ships from Asia,
Spanish Explorers sailing up the Amazon and spreading Smallpox to Amazonian
Basin Indians from the Dark Earth - Terra Prate - Culture and Columbian Sailors
returning to Europe introducing Syphilis from the New World, the Spanish Flu
Pandemic carried home by returning soldiers at the end of the Great War - which
killed more people than did all the military action during the whole of WWI).
9 Alien
Contact
Event
Biological
Predation
“Kill Moments” – Invasion, conquest and genocide by a civilisation with
superior technology, e.g. Roman conquest of Celtic Tribes in Western Europe,
William the Conquerors’ “Harrying of the North” in England, Spanish
conquistadores meet Aztecs and Amazonian Indians in Central and South
America, Cowboys v. Indians across the plains of North America…..
10 Hyper-
space
Event
Quantum
Dynamics
“Nil Moments” – Singularity or Hyperspace Events where the Earth and Solar
System are swallowed up by a rogue Black Hole – or the dimensional fabric of
the whole Universe is ripped apart when two Membranes (Universes) collide in
hyperspace and one dimension set is subsumed into the other – they merge into
a large multi-dimensional Membrane – and split up into two new Membranes?

Recent Historic Wild card Events Wild card Events Surprise Impact Type Trigger
Tay Bridge disaster (1879) – railway bridge collapsed during a
violent storm whilst a passenger train was passing across
High Medium Bridge
Design
Wind
Tacoma Narrows bridge collapse (1940) – road bridge
collapsed in a moderate wind due to “aeroelastic flutter”
High Low Bridge
Design
Wind
Flixborough Chemical Works Disaster (1974) – cyclo-hexane
chemical leak resulting in a hydrocarbon vapour cloud explosion
High Medium Health &
Safety
Equipment
Failure
Chernobyl nuclear disaster (1986) – safety systems shut down
for a technical exercise on the turbine generator – core meltdown
High High Health &
Safety
Human
Error
World Trade Centre (1990) – Wahid terrorist group activity High Medium Security Terrorism
World Trade Centre (2001) – Al Qaida terrorist group activity High High Security Terrorism
Buncefield storage depot (2005) – undetected oil fuel leak
ignited resulting in a hydrocarbon vapour cloud explosion
High Medium Health &
Safety
Equipment
Failure
Texas City oil refinery explosion (2005) – hydrocarbon cloud
accumulation from a fuel leak - resulting in a vapour explosion
High Medium Health &
Safety
Equipment
Failure
Gulf of Mexico oil rig explosion (2009) – high pressure methane
blow-back during deep water drilling - resulting in a explosion
High High Health &
Safety
Human
Error
Mumbai Taj Mahal Hotel (2012) – Taliban terrorist group activity High Medium Security Terrorism
Nairobi Shopping Mall (2013) – Al Shabab terrorist group activity High Medium Security Terrorism

Black Swan Events

Trigger D
USA Sub-Prime Mortgage Crisis
Trigger F
CDO Toxic Asset Crisis
K
E Trigger
K Sovereign
Debt Crisis
B Trigger
I
Money
Supply
Shock
C Trigger
H
Financial
Services
Sector
Collapse
D Trigger
G
L
A Trigger
J
Credit
Crisis
Global
Recession
Black Swan Events
Definition of a “Black Swan” Event
• A “Black Swan” Event is an event or
occurrence that deviates beyond what is
normally expected of any given situation
and that would be extremely difficult to
predict. This term was popularised by
Nassim Nicholas Taleb, a finance
professor and former Investment Fund
Manager and Wall Street trader.
• Black Swan Events – are unforeseen,
sudden and extreme or change events or
Global-level transformation in either the
military, political, social, economic or
environmental landscape. Black Swan
Events have an inordinately low
probability of occurrence - coupled with an
extraordinarily high impact when they do
occur (Nassim Taleb). “Black Swan” Event Cluster or “Storm”

Black Swan Events

Black Swan Events
• The phrase Black Swan is a metaphor describing an unusual and rare random event
which is totally unanticipated (perhaps because it seemed impossible or because no-one
had considered it before) - which has extreme and far-reaching consequences. This term
is also often used as a descriptive adjective - as in the expression black-swan event.
1. SHOCK - Black Swan Events are a complete and totally unexpected shock to the observer
- the scale of the event falling well outside the bounds of any prior expectations.
2. SEVERE - Black Swan Events have a severe impact, even a historical significance, as a
catalyst of massive change - or as an agent bringing severe global transformation.
3. SUDDEN - Black Swan Events appear suddenly and unfold with an extraordinary pace.
4. DUALITY OF NATURE - Black Swan Events may represent either a potentially
catastrophic threat – or challenge the observer with novel and unexpected opportunities.
5. PARADOX - Black Swan Events are rationalised by hindsight, as at their first appearance
they could or should have been foreseen had the relevant Weak Signals been available
and detected in the background noise, identified correctly, analysed and accounted for.

Black Swan Events
Definition of “Black Swan” Event
• Black Swan Events are any unforeseen, sudden and extreme random events –
agent and catalysts of massive change, or Global-level transformation scenarios
which occur within the military, political, social, economic, cultural or environmental
landscape, having an inordinately low probability of occurrence - coupled with an
extraordinarily high impact when they do occur (Nassim Taleb).
• A “Black Swan” Event is a surprise - a random event or occurrence that deviates
well beyond the bounds of what is usually expected from the anticipated situation
or predicted outcome, under any normal set of circumstances. Given our current
knowledge, any “Black Swan” Event may be extremely difficult or impossible to
anticipate, forecast or predict. The term “Black Swan” Event was popularised by
Nassim Nicholas Taleb, a global investment fund manager and later New York City
University Professor, in his popular book entitled "Black Swan".

Black Swan Events
Types of “Black Swan” Event
• A Black Swan event is an occurrence in human history that was unprecedented
and unexpected at the point in time when it took place. However, after evaluating
the surrounding context, domain experts (and in certain cases even laymen) may
often conclude: “it was bound to happen”. Black Swan events are so named
because, until the discovery of the Black Swan (Cygnus atratus) in Australasia -
the sighting of a Black Swan was a vanishingly improbable occurrence.....
• Horizon Scanning - Black Swan Event Types
– Pandemics - global outbreaks of Disease
– Political, Economic and Social Shock Waves
– Market Supply / Demand and Price Shock Waves
– Global Conflict – War, Terrorism, and Insecurity Shock Waves
• Environment Scanning - Black Swan Event Types
– Natural Disasters and Catastrophes
– Human Activity Impact on the Environment – Global Massive Change Events

Weak Signals Wild Cards, Black Swans
Wild Card
Strong Signal
Random Event
Weak Signal
Communicate Discover
Understand Evaluate
Random Event
Strong Signal
Weak Signal
Wild Card
Black Swan
“Black Swan” Events are Runaway Wild Card Scenarios
Signal Processing

Black Swan Events
• Black Swan events are typically random and unexpected - characterized by
three main criteria: first, they are surprising, falling outside the realm of usual
expectation; second, they have a major effect (sometimes of historical or
geopolitical significance); and third, with the benefit of hindsight they are often
rationalized as something that could, should or would have been foreseen -
had all of the facts been available and examined carefully enough.
1. Black Swan events are surprising, falling well outside the realm of usual
experience or expectation.
2. Black Swan events have a sudden and severe impact (sometimes of far-
reaching and historic global significance).
3. Black Swan events might have been foreseen - as viewed through the
retrospective hindsight of Causal Layer Analysis (CLA) processes , back-
casting and back-sight (the reverse of forecasting and foresight).
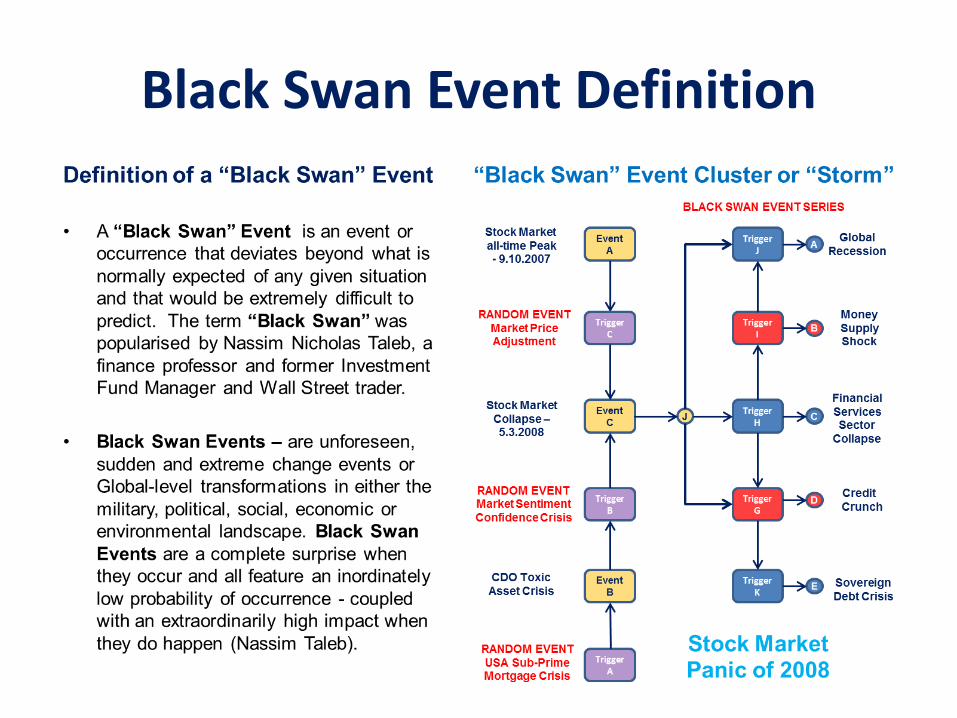
Black Swan Event Definition

Black Swan Event Features
• “Black Swan Event” is a common expression or metaphor describing an extraordinarily
rare and unusual random event which is totally unanticipated (perhaps because it
seemed impossible or because no-one had ever considered it before) –and which has
extreme and far-reaching impact, consequences and effects. This term is also often used
as a descriptive adjective - as in the phrase “Black Swan”. The Black Swan metaphor
refers to those extreme events which are so chaotic that they are both “unknown and
unknowable” (Hawking Paradox) – the “unknown unknowns” – those events which are
impossible to anticipate from any analysis of recognised threats and existing risk factors.
1. SUDDEN - Black Swan Events appear suddenly and unfold at an extraordinarily rapid
pace – the impact, scale and consequences of the event falling well outside the bounds
of any prior expectations.
2. SEVERE - Black Swan Events have a massively severe impact, even a historical
significance, as both a catalyst and agent of extreme and far-reaching impact - bringing
massive global transformation and change.
3. SHOCK – Black Swan Events are extraordinarily unusual and rare random and chaotic
phenomenon - which comes as a complete and totally unforeseen shock to the observer.
4. SURPRISE – A “Black Swan Event” - is a totally unexpected and unanticipated surprise
to the observer

Black Swan Event Characteristics
1. DICHOTOMY – If all the relevant knowledge in the period leading up to the Black Swan
Event had been readily available, and if all of those Weak Signals, Strong Signals and
Wild Cards in the background noise had been detected at their first appearance, then
subsequently identified, analysed and interpreted – then that Black Swan Event could,
should or would have been anticipated or foreseen and correctly accounted for…..
2. PARADOX – Any further Black Swan Events which are subsequently experienced – still
remain as totally unexpected shocks and surprises – despite the recent deep impact of
the previous Black Swan cluster…..
3. RATIONALISATION - With the benefit of hindsight, Black Swan Events may be
rationalised by back-casting, back-sight and Causal Layer Analysis (CLA) – to the effect
that had the relevant facts been available and examined carefully enough then the Black
Swan Event could, should or would have been predicted.
4. DUALITY OF NATURE - Black Swan Events represent a potentially catastrophic threat to
some spectators – whilst at the same time, providing other spectators with novel and
unexpected opportunities.

Black Swan Events
• The Hawking Paradox states that the future is both “unknown and unknowable”.
Curiously, Theologians may also recognise much of this Black Swan terminology
– for example, the dual nature of God as being both a kind and beneficial father
(Protestant viewpoint) and at the same time as a vengeful master (traditional
Judaic Midrash and Catholic teachings). To the early Mystic, Gnostic, Arian and
Cathartic Jews and Christians, as well as Sufi Moslems, God was deemed to be
both “unknown and unknowable” – the origin of the much later secular and legal
classification of any totally unanticipated, extraordinarily rare and unusual random
event defined as being an “act of God” – much as a Black Swan is viewed today.
• In recent years, war, terrorism and insecurity and its resultant global economic
instability is the major Human Impact context in which the term “Black Swan Event”
occurs - especially in reference to the resulting geopolitical chaos, social disorder,
economic disruption and financial turmoil. In their stated aim to “drain the kefirs
(infidels) of blood and treasure” – as well as attracting disenfranchised Moslems
with the dream of establishing a Kalifate – fundamentalist Sunni Wahid terrorist
groups such as the Taliban, al Qaeda, al Shahab and ISIS have been surprisingly
successful.

Extinction-level Black Swan Event Types

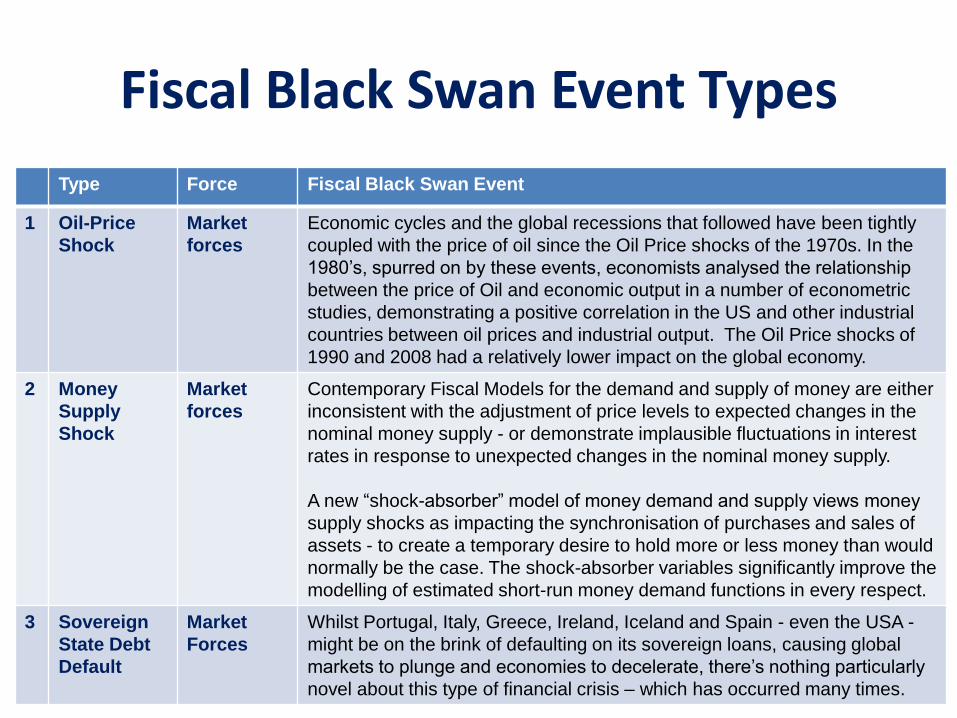
Fiscal Black Swan Event Types
Type Force Fiscal Black Swan Event
1 Oil-Price
Shock
Market
forces
Economic cycles and the global recessions that followed have been tightly
coupled with the price of oil since the Oil Price shocks of the 1970s. In the
1980’s, spurred on by these events, economists analysed the relationship
between the price of Oil and economic output in a number of econometric
studies, demonstrating a positive correlation in the US and other industrial
countries between oil prices and industrial output. The Oil Price shocks of
1990 and 2008 had a relatively lower impact on the global economy.
2 Money
Supply
Shock
Market
forces
Contemporary Fiscal Models for the demand and supply of money are either
inconsistent with the adjustment of price levels to expected changes in the
nominal money supply - or demonstrate implausible fluctuations in interest
rates in response to unexpected changes in the nominal money supply.
A new “shock-absorber” model of money demand and supply views money
supply shocks as impacting the synchronisation of purchases and sales of
assets - to create a temporary desire to hold more or less money than would
normally be the case. The shock-absorber variables significantly improve the
modelling of estimated short-run money demand functions in every respect.
3 Sovereign
State Debt
Default
Market
Forces
Whilst Portugal, Italy, Greece, Ireland, Iceland and Spain - even the USA -
might be on the brink of defaulting on its sovereign loans, causing global
markets to plunge and economies to decelerate, there’s nothing particularly
novel about this type of financial crisis – which has occurred many times.

Historic Financial Black Swan Events
Black Swan Events Surprise Impact Trigger Event
The Wall Street Crash (1927) High High Market Forces
The Great Depression (1929-1931) High High Market Forces
Oil Price Shock (1970) High High Arab-Israeli War
Global Recession (1970-1971) High High Market Forces
Oil Price Shock (1978) High High Market Forces
Global Recession (1978-1980) High High Market Forces
Global Recession (1990-1992) High High Market Forces
USA Sub-Prime Mortgage Crisis (2008) High High Market Forces
CDO Toxic Asset Crisis (2008) High High Market Forces
Financial Services Sector Collapse (2008) High High Market Forces
Credit Crisis (2008) High High Market Forces
Sovereign Debt Crisis (2008-2015) High High Market Forces
Money Supply Shock (2008) High High Market Forces
Global Recession (2008-2014) High High Market Forces

Black Swan Event Storm
• “Black Swan” Events may be modelled as runaway Wild Card Scenarios.
Any Black Swan Event - such as a Terrorist Incident - may occur as a
random, isolated incident – or as part of an inter-collated, linked sequence or
cluster of events with a common trigger, origin or cause - a Black Swan Event
Storm. Weak Signals, Strong Signals, Wild Cards and Black Swan Events –
may be modelled as a a sequence of linked events in a wave-form series of
ascending order of magnitude, and arising from a common source or origin –
either a single Random Event instance or from an interlinked series of chaotic
and disruptive sequence of Random Events - an Event Storm.
• These Random Events propagate through the Space-time continuum as a
related and integrated series of waves with an ascending order of magnitude
and impact – the first wave to arrive is the fastest travelling,- Weak Signals -
something like a faint echo of a Random Event which may in turn be followed
in turn by a ripple (Strong Signals) then possibly by a wave (Wild Card) -
which may indicate the unfolding a further increase in magnitude / intensity
which finally arrives as a catastrophic event - something like a tsunami (Black
Swan Event).

Fiscal Black Swan Event Storm
Fiscal Black Swan Events
• One of the contexts in which the term Black Swan currently occurs is in economic
and financial, especially in reference to the global economic turmoil of recent years.
Financial analysts have also extended the Black Swan metaphor to talk
about grey swans, events which are possible or known-about, and are potentially
extremely significant, but which are considered by some to be unlikely.
• A group of recently identified grey swans in the financial domain is the so-
called fiscal cliff, , a cocktail of tax increases and spending cuts disastrous for
Western economies against a background of growing demand for increased
spending on education, social security, healthcare, law and order, national security
and defence – combat the activities of the influence of the “enemy within” as well
as the “enemy without” – which could be disastrous for the US geopolitical status
quo, the economy and society in general.
• As an example, the previously highly successful hedge fund Long Term Capital
Management (LTCM) was forced into bankruptcy as a result of the ripple effect
caused by the Russian government's debt default. The Russian government's
default represents a Black Swan Event - because none of LTCM's Risk managers
or their computer models could have reasonably predicted this event , nor any of
the Events subsequent unforeseen impacts, consequences and effects.

Natural Black Swan Event Types
Environment Scanning for Natural Black Swan Event Types
• The other major global context in which the term “Black Swan Event” has
been strongly linked in recent times is that of Natural Disasters – as an
example, drought, flooding, earthquakes, extreme storms, tsunamis and
volcanic eruption: -
• Natural Physical Disasters and Catastrophes
– Local Ecological Shock Waves – flooding and droughts
– Regional Environmental Shock Waves – el Niño / la Nina
– Climate-change Shock Waves – ice retreat, sea-level rising
– Global Extinction-level Black Swan Events – over fishing,
deforestation


Natural Black Swan Event Storm


Natural Black Swan Event Storm


4D Geospatial Analytics • The profiling and analysis of
large aggregated datasets in
order to determine a ‘natural’
structure of groupings provides
an important technique for many
statistical and analytic
applications. Cluster analysis
on the basis of profile similarities
or geographic distribution is a
method where no prior
assumptions are made
concerning the number of
groups or group hierarchies and
internal structure. Geo-
demographic techniques are
frequently used in order to
profile and segment populations
by ‘natural’ groupings - such as
common behavioural traits,
Clinical Trial, Morbidity or
Actuarial outcomes - along with
many other shared
characteristics and common
factors.....

4D Geospatial Analytics – The Temporal Wave
• The Temporal Wave is a novel and innovative method for Visual Modelling and Exploration
of Geospatial “Big Data” - simultaneously within a Time (history) and Space (geographic)
context. The problems encountered in exploring and analysing vast volumes of spatial–
temporal information in today's data-rich landscape – are becoming increasingly difficult to
manage effectively. In order to overcome the problem of data volume and scale in a Time
(history) and Space (location) context requires not only traditional location–space and
attribute–space analysis common in GIS Mapping and Spatial Analysis - but now with the
additional dimension of time–space analysis. The Temporal Wave supports a new method
of Visual Exploration for Geospatial (location) data within a Temporal (timeline) context.
• This time-visualisation approach integrates Geospatial (location) data within a Temporal
(timeline) data along with data visualisation techniques - thus improving accessibility,
exploration and analysis of the huge amounts of geo-spatial data used to support geo-
visual “Big Data” analytics. The temporal wave combines the strengths of both linear
timeline and cyclical wave-form analysis – and is able to represent data both within a Time
(history) and Space (geographic) context simultaneously – and even at different levels of
granularity. Linear and cyclic trends in space-time data may be represented in combination
with other graphic representations typical for location–space and attribute–space data-
types. The Temporal Wave can be used in roles as a time–space data reference system,
as a time–space continuum representation tool, and as time–space interaction tool.

4D Geospatial Analytics – London Timeline

4D Geospatial Analytics – London Timeline
• How did London evolve from its creation as a Roman city in 43AD into the crowded, chaotic cosmopolitan megacity we see today? The London Evolution Animation takes a holistic view of what has been constructed in the capital over different historical periods – what has been lost, what saved and what protected.
• Greater London covers 600 square miles. Up until the 17th century, however, the capital city was crammed largely into a single square mile which today is marked by the skyscrapers which are a feature of the financial district of the City.
• This visualisation, originally created for the Almost Lost exhibition by the Bartlett Centre for Advanced Spatial Analysis (CASA), explores the historic evolution of the city by plotting a timeline of the development of the road network - along with documented buildings and other features – through 4D geospatial analysis of a vast number of diverse geographic, archaeological and historic data sets.
• Unlike other historical cities such as Athens or Rome, with an obvious patchwork of districts from different periods, London's individual structures scheduled sites and listed buildings are in many cases constructed gradually by parts assembled during different periods. Researchers who have tried previously to locate and document archaeological structures and research historic references will know that these features, when plotted, appear scrambled up like pieces of different jigsaw puzzles – all scattered across the contemporary London cityscape.

History of Digital Epidemiology
• Doctor John Snow (15 March 1813 – 16
June 1858) was an English physician and a
leading figure in the adoption of anaesthesia
and medical hygiene. John Snow is largely
credited with sparking and pursuing a total
transformation in Public Health and epidemic
disease management and is considered one
of the fathers of modern epidemiology in part
because of his work in tracing the source of
a cholera outbreak in Soho, London, in 1854.
• John Snows’ investigation and findings into
the Broad Street cholera outbreak - which
occurred in 1854 near Broad Street in the
London district of Soho in England - inspired
fundamental changes in both the clean and
waste water systems of London, which led to
further similar changes in other cities, and a
significant improvement in understanding of
Public Health around the whole of the world.

History of Digital Epidemiology
• The Broad Street cholera outbreak of
1854 was a major cholera epidemic or
severe outbreak of cholera which
occurred in 1854 near Broad Street in
the London district of Soho in England .
• This cholera outbreak is best known for
statistical analysis and study of the
epidemic by the physician John Snow
and his discovery that cholera is spread
by contaminated water. This knowledge
drove improvement in Public Health with
mass construction of sanitation facilities
from the middle of the19th century.
• Later, the term "focus of infection" would
be used to describe factors such as the
Broad Street pump – where Social and
Environmental conditions may result in the outbreak of local infectious diseases.

History of Digital Epidemiology • It was the study of
cholera epidemics, particularly in Victorian England during the middle of the 19th century, which laid the foundation for epidemiology - the applied observation and surveillance of epidemics and the statistical analysis of public health data.
• This discovery came at a time when the miasma theory of disease transmission by noxious “foul air” prevailed in the medical community.

History of Digital Epidemiology
Modern epidemiology has its origin with the study of Cholera
Broad Street cholera outbreak of 1854

History of Digital Epidemiology
Modern epidemiology has its origin with the study of Cholera.
• It was the study of cholera epidemics, particularly in Victorian England
during the middle of the 19th century, that laid the foundation for the science
of epidemiology - the applied observation and surveillance of epidemics and
the statistical analysis of public health data. It was during a time when the
miasma theory of disease transmission prevailed in the medical community.
• John Snow is largely credited with sparking and pursuing a transformation in
Public Health and epidemic disease management from the extant paradigm
in which communicable illnesses were thought to have been carried by
bad, malodorous airs, or "miasmas“ - towards a new paradigm which would
begin to recognize that virulent contagious and infectious diseases are
communicated by various other means – such as water being polluted by
human sewage. This new approach to disease management recognised that
contagious diseases were either directly communicable through contact with
infected individuals - or via vectors of infection (water, in the case of cholera)
which are susceptible to contamination by viral and bacterial agents.

History of Digital Epidemiology • This map is John Snow’s
famous plot of the 1854 Broad Street Cholera Outbreak in London. By plotting epidemic data on a map like this, John Snow was able to identify that the outbreak was centred on a specific water pump.
• Interviews confirmed that outlying cases were from people who would regularly walk past the pump and take a drink. He removed the handle off the water pump and the outbreak ended almost overnight.
• The cause of cholera (bacteria Vibria cholerae) was unknown at the time, and Snow’s important work with cholera in London during the 1850s is considered the beginning of modern epidemiology. Some have even gone so far as to describe Snow’s Broad Street Map as the world’s first GIS.

History of Digital Epidemiology
Broad Street cholera outbreak of 1854

Clinical Risk Types
Clinical Risk Types
Clinical Risk Group
Employee
Patient
B
A
Human Risk Process
Risk
D
Morbidity Risk Types
Morbidity Risk Group
C
Legal Risk
F
3rd Party Risk
G
C
Technology Risk
Trauma Risk
E
Morbidity Risk
H E
J
G
A
I D
Immunological System Risk
Sponsorship
Stakeholders Disease
Risk
Shock Risk
Cardiovascular
System Risk
Pulmonary System Risk
Toxicity Risk
Organ Failure Risk
- Airways
- Conscious
- Bleeding
Triage Risk
- Performance
- Finance
- Standards
Compliance Risk
H
Patient Risk
Neurological
System Risk F
B
Predation Risk

Risk Complexity Map

• Case Study • Pandemics

• Case Study • Pandemics
• Pandemics - during a pandemic episode, such as the recent Ebola outbreak, current
policies emphasise the need to ground decision-making on empiric evidence. This section
studies the tension that remains in decision-making processes when their is a sudden and
unpredictable change of course in an outbreak – or when key evidence is weak or ‘silent’.
• The current focus in epidemiology is on the ‘known unknowns’ - factors with which we are
familiar in the pandemic risk assessment processes. These risk processes cover, for
example, monitoring the course of the pandemic, estimating the most affected age groups,
and assessing population-level clinical and pharmaceutical interventions. This section
looks for the ‘unknown unknowns’ - factors with a lack of, or silence, of evidence, of which
we have only limited or weak understanding in the pandemic risk assessment processes.
• Pandemic risk assessment shows, that any developing, new and emerging or sudden and
unpredictable change in the pandemic situation does not accumulate a robust body of
evidence for decision making. These uncertainties may be conceptualised as ‘unknown
unknowns’, or “silent evidence”. Historical and archaeological pandemic studies indicate
that there may well have been evidence that was not discovered, known or recognised.
This section looks at a new method to discover “silent evidence” - unknown factors - that
affect pandemic risk assessment - by focusing on the tension under pressure that impacts
upon the actions of key decision-makers in the pandemic risk decision-making process.
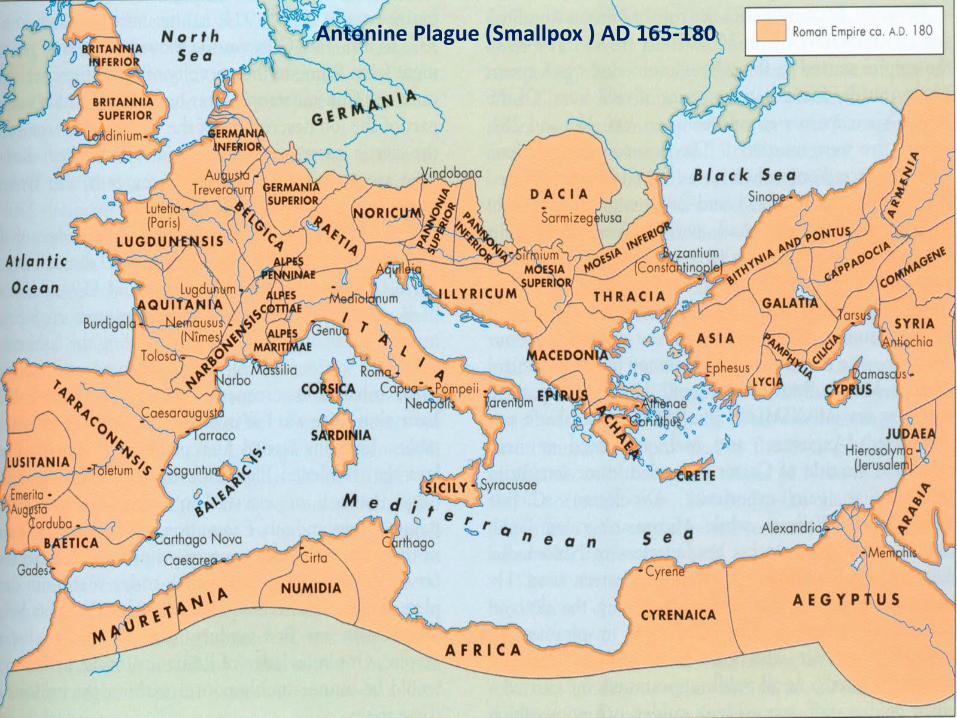
Antonine Plague (Smallpox ) AD 165-180

Pandemic Black Swan Events Black Swan Pandemic Type / Location Impact Date
Malaria For the entirety of human history,
Malaria has been a pathogen
The Malaria pathogen kills more
humans than any other disease 20 kya – present
Smallpox (Antonine Plague) Smallpox Roman Empire / Italy Smallpox is the 2nd worst killer 165-180
Black Death (Plague of Justinian) Bubonic Plague – Roman Empire 50 million people died 6th century
Black Death (Late Middle Ages) Bubonic Plague – Europe 75 to 200 million people died 1340–1400
Smallpox Amazonian Basin Indians 90% Amazonian Indians died 16th century
Tuberculosis Western Europe, 18th - 19th c 900 deaths per 100,000 pop. 18th - 19th c
Syphilis Global pandemic – invariably fatal 10% of Victorian men carriers 19th century
1st Cholera Pandemic Global pandemic Started in the Bay of Bengal 1817-1823
2nd Cholera Pandemic Global pandemic (arrived in London in 1832) 1826-1837
Spanish Flu Global pandemic 50 million people died 1918
Smallpox Global pandemic 300 million people died in 20th c Eliminated 20th c
Poliomyelitis Global pandemic Contracted by up to 500,000
persons per year 1950’s/1960’s 1950’s -1960’s
AIDS Global pandemic – mostly fatal 10% Sub-Saharans are carriers Late 20th century
Ebola West African epidemic – 50% fatal Sub-Saharan Africa epicentre Late 20th century

For the entirety of human history, Malaria has been the most lethal pathogen to attack man

Pandemic Black Swan Event Types
Type Force Epidemiology Black Swan Event
1 Malaria Parasitic
Biological
Disease
The Malaria pathogen has killed more humans than any other disease. Human
malaria most likely originated in Africa and has coevolved along with its hosts,
mosquitoes and non-human primates. The first evidence of malaria parasites
was found in mosquitoes preserved in amber from the Palaeogene period that
are approximately 30 million years old. Malaria may have been a human
pathogen for the entire history of the species. Humans may have originally
caught Plasmodium falciparum from gorillas. About 10,000 years ago, a period
which coincides with the development of agriculture (Neolithic revolution) -
malaria started having a major impact on human survival. A consequence was
natural selection for sickle-cell disease, thalassaemias, glucose-6-phosphate
dehydrogenase deficiency, ovalocytosis, elliptocytosis and loss of the Gerbich
antigen (glycophorin C) and the Duffy antigen on erythrocytes because such
blood disorders confer a selective advantage against malaria infection (balancing
selection). The first known description of malaria dates back 4000 years to 2700
B.C. China where ancient writings refer to symptoms now commonly associated
with malaria. Early malaria treatments were first developed in China from
Quinghao plant, which contains the active ingredient artemisinin, re-discovered
and still used in anti-malaria drugs today. Largely overlooked by researchers is
the role of disease and epidemics in the fall of Rome. Three major types of
inherited genetic resistance to malaria (sickle-cell disease, thalassaemias, and
glucose-6-phosphate dehydrogenase deficiency) were all present in the
Mediterranean world 2,000 years ago, at the time of the Roman Empire.


Pandemic Black Swan Event Types
Type Force Epidemiology Black Swan Event
2 Smallpox Viral
Biological
Disease
The history of smallpox holds a unique place in medical history. One of the
deadliest viral diseases known to man, it is the first disease to be treated by
vaccination - and also the only disease to have been eradicated from the
face of the earth by vaccination. Smallpox plagued human populations for
thousands of years. Researchers who examined the mummy of Egyptian
pharaoh Ramses V (died 1157 BCE) observed scarring similar to that from
smallpox on his remains. Ancient Sanskrit medical texts, dating from about
1500 BCE, describe a smallpox-like illness. Smallpox was most likely
present in Europe by about 300 CE. – although there are no unequivocal
records of smallpox in Europe before the 6th century CE. It has been
suggested that it was a major component of the Plague of Athens that
occurred in 430 BCE, during the Peloponnesian Wars, and was described
by Thucydides. A recent analysis of the description of clinical features
provided by Galen during the Antonine Plague that swept through the
Roman Empire and Italy in 165–180, indicates that the probable cause was
smallpox. In 1796, after noting Smallpox immunity amongst milkmaids –
Edward Jenner carried out his now famous experiment on eight-year-old
James Phipps, using Cow Pox as a vaccine to confer immunity to Smallpox.
Some estimates indicate that 20th century worldwide deaths from smallpox
numbered more than 300 million. The last known case of wild smallpox
occurred in Somalia in 1977 – until recent outbreaks in Pakistan and Syria.

Pandemic Black Swan Event Types
Type Force Epidemiology Black Swan Event
3 Bubonic
Plague
Bacterial
Biological
Disease
The Bubonic Plague – or Black Death – was one of the most devastating
pandemics in human history, killing an estimated 75 to 200 million people
and peaking in Europe in the years 1348–50 CE. The Bubonic Plague is a
bacterial disease – spread by fleas carried by Asian Black Rats - which
originated in or near China and then travelled to Italy, overland along the Silk
Road, or by sea along the Silk Route. From Italy the Black Death spread
onwards through other European countries. Research published in 2002
suggests that the Black Death began in the spring of 1346 in the Russian
steppe region, where a plague reservoir stretched from the north-western
shore of the Caspian Sea into southern Russia. Although there were
several competing theories as to the etiology of the Black Death, analysis of
DNA from victims in northern and southern Europe published in 2010 and
2011 indicates that the pathogen responsible was the Yersinia pestis
bacterium, possibly causing several forms of plague. The first recorded
epidemic ravaged the Byzantine Empire during the sixth century, and was
named the Plague of Justinian after emperor Justinian I, who was infected
but survived through extensive treatment. The epidemic is estimated to have
killed approximately 50 million people in the Roman Empire alone. During
the Late Middle Ages (1340–1400) Europe experienced the most deadly
disease outbreak in history when the Black Death, the infamous pandemic
of bubonic plague, peaked in 1347, killing one third of the human population.

Pandemic Black Swan Event Types
Type Force Epidemiology Black Swan Event
4 Syphilis Bacterial
Biological
Disease
Syphilis - the exact origin of syphilis is unknown. There are two primary
hypotheses: one proposes that syphilis was carried from the Americas to
Europe by the crew of Christopher Columbus, the other proposes that
syphilis previously existed in Europe but went unrecognized. These are
referred to as the "Columbian" and "pre-Columbian" hypotheses. In late 2011
newly published evidence suggested that the Columbian hypothesis is valid.
The appearance of syphilis in Europe at the end of the 1400s heralded
decades of death as the disease raged across the continent. The first
evidence of an outbreak of syphilis in Europe were recorded in 1494/1495
in Naples, Italy, during a French invasion. First spread by returning French
troops, the disease was known as “French disease”, and it was not until
1530 that the term "syphilis" was first applied by the Italian physician and
poet Girolamo Fracastoro. By the 1800s it had become endemic, carried by
as many as 10% of men in some areas - in late Victorian London this may
have been as high as 20%. Invariably fatal, associated with extramarital sex
and prostitution, syphilis was accompanied by enormous social stigma. The
secretive nature of syphilis helped it spread - disgrace was such that many
sufferers hid their symptoms, while others carrying the latent form of the
disease were unaware they even had it. Treponema pallidum, the syphilis
causal organism, was first identified by Fritz Schaudinn and Erich Hoffmann
in 1905. The first effective treatment (Salvarsan) was developed in 1910
by Paul Ehrlich which was followed by the introduction of penicillin in 1943.

Pandemic Black Swan Event Types
Type Force Epidemiology Black Swan Event
5 Tuberculosis Bacterial
Biological
Disease
Tuberculosis - the evolutionary origins of the Mycobacterium tuberculosis
indicates that the most recent common ancestor was a human-specific
pathogen, which encountered an evolutionary bottleneck leading to
diversification. Analysis of mycobacterial interspersed repetitive units has
allowed dating of this evolutionary bottleneck to approximately 40,000 years
ago, which corresponds to the period subsequent to the expansion of Homo
sapiens out of Africa. This analysis of mycobacterial interspersed repetitive
units also dated the Mycobacterium bovis lineage as dispersing some 6,000
years ago. Tuberculosis existed 15,000 to 20,000 years ago, and has been
found in human remains from ancient Egypt, India, and China. Human
bones from the Neolithic show the presence of the bacteria, which may be
linked to early farming and animal domestication. Evidence of tubercular
decay has been found in the spines of Egyptian mummies, and TB was
common both in ancient Greece and Imperial Rome. Tuberculosis reached
its peak the 18th century in Western Europe with a prevalence as high as
900 deaths per 100,000 - due to malnutrition and overcrowded housing with
poor ventilation and sanitation. Although relatively little is known about its
frequency before the 19th century, the incidence of Scrofula (consumption)
“the captain of all men of death” is thought to have peaked between the end
of the 18th century and the end of the 19th century. With advent of HIV there
has been a dramatic resurgence of tuberculosis with more than 8 million
new cases reported each year worldwide and more than 2 million deaths.

Pandemic Black Swan Event Types
Type Force Epidemiology Black Swan Event
6 Cholera Bacterial
Biological
Disease
Cholera is a severe infection in the small intestine caused by the bacterium
vibrio cholerae, contracted by drinking water or eating food contaminated
with the bacterium. Cholera symptoms include profuse watery diarrhoea and
vomiting. The primary danger posed by cholera is severe dehydration, which
can lead to rapid death. Cholera can now be treated with re-hydration and
prevented by vaccination. Cholera outbreaks in recorded history have
indeed been explosive and the global proliferation of the disease is seen by
most scholars to have occurred in six separate pandemics, with the seventh
pandemic still rampant in many developing countries around the world. The
first recorded instance of cholera was described in 1563 in an Indian medical
report. In modern times, the story of the disease begins in 1817 when it
spread from its ancient homeland of the Ganges Delta in the bay of Bengal
in North East India - to the rest of the world. The first cholera pandemic
raged from 1817-1823, the second from 1826-1837 The disease reached
Britain during October 1831 - and finally arrived in London in 1832 (13,000
deaths) with subsequent major outbreaks in 1841, 1848 (21,000 deaths)
1854 (15,000 deaths) and 1866. Surgeon John Snow – by studying the
outbreak cantered around the Broad Street well in 1854 – traced the source
of cholera to drinking water which was contaminated by infected human
faeces – ending the “miasma” or “bad air” theory of cholera transmission.

Pandemic Black Swan Event Types
Type Force Epidemiology Black Swan Event
7 Poliomyelitis Viral
Biological
Disease
The history of poliomyelitis (polio) infections extends into prehistory.
Ancient Egyptian paintings and carvings depict otherwise healthy people
with withered limbs, and children walking with canes at a young age.[3] It is
theorized that the Roman Emperor Claudius was stricken as a child, and this
caused him to walk with a limp for the rest of his life. Perhaps the earliest
recorded case of poliomyelitis is that of Sir Walter Scott. At the time, polio
was not known to medicine. In 1773 Scott was said to have developed "a
severe teething fever which deprived him of the power of his right leg." The
symptoms of poliomyelitis have been described as: Dental Paralysis,
Infantile Spinal Paralysis, Essential Paralysis of Children, Regressive
Paralysis, Myelitis of the Anterior Horns and Paralysis of the Morning.
In 1789 the first clinical description of poliomyelitis was provided by the
British physician Michael Underwood as "a debility of the lower extremities”.
Although major polio epidemics were unknown before the 20th century, the
disease has caused paralysis and death for much of human history. Over
millennia, polio survived quietly as an endemic pathogen until the 1880s
when major epidemics began to occur in Europe; soon after, widespread
epidemics appeared in the United States. By 1910, frequent epidemics
became regular events throughout the developed world, primarily in cities
during the summer months. At its peak in the 1940s and 1950s, polio would
maim, paralyse or kill over half a million people worldwide every year

Pandemic Black Swan Event Types
Type Force Epidemiology Black Swan Event
8 Typhus Bacterial
Biological
Disease
Typhoid fever (jail fever) is an acute illness associated with a high fever that
is most often caused by the Salmonella typhi bacteria. Typhoid may also be
caused by Salmonella paratyphi, a related bacterium that usually leads to a
less severe illness. The bacteria are spread via deposition in water or food
by a human carrier. An estimated 16–33 million cases of typhoid fever occur
annually. Its incidence is highest in children and young adults between 5 and
19 years old. These cases as of 2010 caused about 190,000 deaths up from
137,000 in 1990. Historically, in the pre-antibiotic era, the case fatality rate of
typhoid fever was 10-20%. Today, with prompt treatment, it is less than 1%.
9 Dysentery Bacterial /
Parasitic
Biological
Disease
Dysentery (the Flux or the bloody flux) is a form of gastroenteritis – a type
inflammatory disorder of the intestine, especially of the colon, resulting in
severe diarrhea containing blood and mucus in the feces accompanied by
fever, abdominal pain and rectal tenesmus (feeling incomplete defecation),
caused by any kind of gastric infection. Conservative estimates suggest
that 90 million cases of Bacterial Dysentery (Shigellosis) are contracted
annually, killing at least 100,000. Amoebic Dysentery (Amebiasis) infects
some 50 million people each year, with over 50,000 cases resulting in death.

Pandemic Black Swan Event Types
Type Force Epidemiology Black Swan Event
10 Spanish
Flu
Viral
Biological
Disease
In the United States, the Spanish Flu was first observed in Haskell County,
Kansas, in January 1918, prompting a local doctor, Loring Miner to warn the
U.S. Public Health Service's academic journal. On 4th March 1918, army cook
Albert Gitchell reported sick at Fort Riley, Kansas. A week later on 11th March
1918, over 100 soldiers were in hospital and the Spanish Flu virus had now
reached Queens New York. Within days, 522 men had reported sick at the
army camp. In August 1918, a more virulent strain appeared simultaneously
in Brest, Brittany-France, in Freetown, Sierra Leone, and in the U.S, in Boston,
Massachusetts. It is estimated that in 1918, between 20-40% of the worlds
population became infected by Spanish Flu - with 50 million deaths globally.
11 HIV / AIDS Viral
Biological
Disease
AIDS was first reported in America in 1981 – and provoked reactions which
echoed those associated with syphilis for so long. Many of the earliest cases
were among homosexual men - creating a climate of prejudice and moral
panic. Fear of catching this new and terrifying disease was also widespread
among the public. The observed time-lag between contracting HIV and the
onset of AIDS, coupled with new drug treatments, changed perceptions.
Increasingly it was seen as a chronic but manageable disease. The global
story was very different - by the mid-1980s it became clear that the virus had
spread, largely unnoticed, throughout the rest of the world. The nature of this
global pandemic varies from region to region, with poorer areas hit hardest. In
parts of sub-Saharan Africa nearly 1 in 10 adults carries the virus - a statistic
which is reminiscent of the spread of syphilis in parts of Europe in the 1800s.

Pandemic Black Swan Event Types
Type Force Epidemiology Black Swan Event
12 Ebola Haemorrhagic
Viral
Biological
Disease
Ebola is a highly lethal Haemorrhagic Viral Biological Disease, which has
caused at least 16 confirmed outbreaks in Africa between 1976 and 2015.
Ebola Virus Disease (EVD) is found in wild great apes and kills up to 90% of
humans infected - making it one of the deadliest diseases known to man. It is
so dangerous that it is considered to be a potential Grade A bioterrorism agent
– on a par with anthrax, smallpox, and bubonic plague. The current outbreak
of EVD has seen confirmed cases in Guinea, Liberia and Sierra Leone,
countries in an area of West Africa where the disease has not previously
occurred. There were also a handful of suspected cases in neighbouring Mali,
but these patients were found to have contracted other diseases
For each epidemic, transmission was quantified in different settings (illness in
the community, hospitalization, and traditional burial) and predictive analytics
simulated various epidemic scenarios to explore the impact of medical control
interventions on an emerging epidemic. A key medical parameter was the
rapid institution of control measures. For both epidemic profiles identified,
increasing the rate of hospitalization reduced the predicted epidemic size.
Over 4000 suspected cases of EVD have been recorded, with the majority of
them in Guinea. The current outbreak has currently resulted in over 2000
deaths. These figures will continue to rise as more patients die and as test
results confirm that they were infected with Ebola.

Pandemic Black Swan Event Types
Ebola is a highly lethal Haemorrhagic Viral Biological Disease, which has
caused at least 16 confirmed outbreaks in Africa between 1976 and 2015.

Pandemic Black Swan Event Types
Type Force Epidemiology Black Swan Event
13 Future
Bacterial
Pandemic
Infections
Bacterial
Biological
Disease
Bacteria were most likely the real killers in the 1918 Flu Pandemic - the vast
majority of deaths in the 1918–1919 influenza pandemic resulted directly from
secondary bacterial pneumonia, caused by common upper respiratory-tract
bacteria. Less substantial data from the subsequent 1957 and 1968 Flu
pandemics are consistent with these findings. If severe pandemic influenza is
largely a problem of viral-bacterial co-pathogenesis, pandemic planning needs
to go beyond addressing the viral cause alone (influenza vaccines and
antiviral drugs). The diagnosis, prophylaxis, treatment and prevention of
secondary bacterial pneumonia - as well as stockpiling of antibiotics and
bacterial vaccines – should be high priorities for future pandemic planning.
14 Future
Viral
Pandemic
infections
Viral
Biological
Disease
What was Learned from Reconstructing the 1918 Spanish Flu Virus
Comparing pandemic H1N1 influenza viruses at the molecular level yields key
insights into pathogenesis – the way animal viruses mutate to cross species.
The availability of these two H1N1 virus genomes separated by over 90 years,
provided an unparalleled opportunity to study and recognise genetic properties
associated with virulent pandemic viruses - allowing for a comprehensive
assessment of emerging influenza viruses with human pandemic potential.
There are only four to six mutations required within the first three days of viral
infection in a new human host, to change an animal virus to become highly
virulent and infectious to human beings. Candidate viral gene pools for future
possible Human Pandemics include Anthrax, Lassa Fever, Rift Valley Fever,
SARS, MIRS, H1N1 Swine Flu (2009) and H7N9 Avian / Bat Flu (2013).


Complex Systems and Chaos Theory
Complex Systems and Chaos Theory has been used extensively in the field of Futures Studies, Strategic
Management, Natural Sciences and Behavioural Science. It is applied in these domains to understand
how individuals within populations, societies, economies and states act as a collection of loosely
coupled interacting systems which adapt to changing environmental factors and random events – bio-ecological, socio-economic or geo-political.....

Complex Systems and Chaos Theory
• Complex Systems and Chaos Theory has been used extensively in the field
of Futures Studies, Strategic Management, Natural Sciences and Behavioural
Science. It is applied in these domains to understand how individuals within
populations, societies, economies and states act as a collection of loosely
coupled interacting systems which adapt to changing environmental factors
and random events – bio-ecological, socio-economic or geo-political.
• Complex Systems and Chaos Theory treats individuals, crowds and
populations as a collective of pervasive social structures which are influenced
by random individual behaviours – such as flocks of birds moving together in
flight to avoid collision, shoals of fish forming a “bait ball” in response to
predation, or groups of individuals coordinating their behaviour in order to
respond to external stimuli – the threat of predation or aggression – or in order
to exploit novel and unexpected opportunities which have been discovered or
presented to them.

Complexity Paradigms
• System Complexity is typically characterised and measured by the number of elements in a
system, the number of interactions between elements and the nature (type) of interactions.
• One of the problems in addressing complexity issues has always been distinguishing between
the large number of elements (components) and relationships (interactions) evident in chaotic
(unconstrained) systems - Chaos Theory - and the still large, but significantly smaller number
of both and elements and interactions found in ordered (constrained) Complex Systems.
• Orderly System Frameworks tend to dramatically reduce the total number of elements and
interactions – with fewer and smaller classes of more uniform elements – and with reduced and
sparser regimes of more restricted relationships featuring more highly-ordered, better internally
correlated and constrained interactions – as compared with Disorderly System Frameworks.
Unconstrained
Complexity
Non-linear
Systems
Constrained
Complexity
Complex Adaptive
Systems (CAS)
Linear
Systems
Simplexity Complexity decreasing element density and interaction
the “arrow of time” Order
Enthalpy Entropy Increasing Chaos
Disorder
Void
Uncertainty Certainty Hawking Paradox

Random Event Clustering Patterns in the Chaos
• The defining concept for understanding the effects of Chaos Theory on Complex Systems is that with
any vanishingly small differences in the initial conditions at the onset of a chaotic system cycle – those
minute and imperceptible differences which create slightly different starting points result in massively
different outcomes between two otherwise identical systems, both operating within the same time frame.
• The discovery of Chaos and Complexity has increased our understanding of the Cosmos and its effect
on us. If you surf the chaos content regions of the internet, you will invariably encounter terms such as: -
• These influences can take some time to manifest themselves, but that is the nature of the phenomena
identified as a "strange attractor." Such differences could be small to the point of invisibility - how tiny
can influences be to have any effect? This is captured in the “butterfly scenario” described below.
1. Chaos 2. Clustering 3. Complexity 4. Butterfly effect 5. Disruption 6. Dependence 7. Feedback loops 8. Fractal patterns and dimensions 9. Harmonic Resonance 10. Horizon of predictability 11. Interference patterns 12. Massively diverse outcomes
13. Phase space and locking 14. Randomness 15. Sensitivity to initial conditions 16. Self similarity (self affinity) 17. Starting conditions 18. Stochastic events 19. Strange attractors 20. System cycles (iterations) 21. Time-series Events 22. Turbulence 23. Uncertainty 24. Vanishingly small differences

Complex Systems and Chaos Theory
• Weaver (Complexity Theory) along with Gleick and Lorenzo (Chaos Theory) have given us some of the tools that we need to understand these complex, interrelated chaotic and radically disruptive political, economic and social events such as the collapse of Global markets – and the various protests against this - using Event Decomposition, Complexity Mapping, and Statistical Analysis to help us identify patterns, extrapolations, scenarios and trends unfolding as seemingly unrelated, random and chaotic events. The Hawking Paradox, however, challenges this view of Complex Systems by postulating that uncertainty dominates complex, chaotic systems to such an extent that future outcomes are both unknown - and unknowable.
• System Complexity is typically characterised by the number of elements in a system, the number of interactions between those elements and the nature (type) of interactions. One of the problems in addressing complexity issues has always been distinguishing between the large number of elements and relationships, or interactions evident in chaotic (disruptive, unconstrained) systems - and the still large, but significantly smaller number of elements and interactions found in ordered (constrained) systems. Orderly (constrained) System Frameworks tend to act to both reduce the total number of more-uniform elements and interactions with fewer regimes and of reduced size – and feature explicit rules which govern less random and chaotic, but more highly-ordered, internally correlated and constrained interactions – as compared with the massively increased random, chaotic and disruptive behaviour exhibited by Disorderly (unconstrained) System Frameworks.

Complex Adaptive Systems
• When Systems demonstrate properties of Complex Adaptive Systems (CAS) - which is
often defined as consisting of a small number of relatively simple and loosely connected
systems - then they are much more likely to adapt to their environment and, thus,
survive the impact of change and random events. Complexity Theory thinking has been
present in strategic and organisational studies since the first inception of Complex
Adaptive Systems (CAS) as an academic discipline.
• Complex Adaptive Systems are further contrasted compared with other ordered and
chaotic systems by the relationship that exists between the system and the agents and
catalysts of change which act upon it. In an ordered system the level of constraint means
that all agent behaviour is limited to the rules of the system. In a chaotic system these
agents are unconstrained and are capable of random events, uncertainty and disruption.
In a CAS, both the system and the agents co-evolve together; the system acting to
lightly constrain the agents behaviour - the agents of change, however, modify the
system by their interaction. CAS approaches to behavioural science seek to understand
both the nature of system constraints and change agent interactions and generally takes
an evolutionary or naturalistic approach to crowd scenario planning and impact analysis.

Linear and Non-linear Systems
Linear Systems – all system outputs are directly and proportionally related to system inputs
• Types of linear algebraic function behaviours; examples of Simple Systems include: -
– Game Theory and Lanchester Theory
– Civilisations and SIM City Games
– Drake Equation (SETI) for Galactic Civilisations
Non-linear Systems – system outputs are asymmetric and not proportional or related to inputs
• Types of non-linear algebraic function behaviours: examples of Complex / Chaotic Systems are: -
– Complex Systems – large numbers of elements with both symmetric and asymmetric relationships
– Complex Adaptive Systems (CAS) – co-dependency and co-evolution with external systems
– Multi-stability – alternates between multiple exclusive states.(lift status = going up, down, static)
– Chaotic Systems
• Classical chaos – the behaviour of a chaotic system cannot be predicted.
• A-periodic oscillations – functions that do not repeat values after a certain period (# of cycles)
– Solitons – self-reinforcing solitary waves - due to feedback by forces within the same system
– Amplitude death – any oscillations present in the system cease after a certain period (# of cycles)
due to feedback by forces in the same system - or some kind of interaction with external systems.
– Navis-Stokes Equation for the motion of a fluid: -
• Weather Forecasting
• Plate Tectonics and Continental Drift

System Complexity
• System Complexity is typically characterised by the number of elements in a system,
the number of interactions between those elements and the nature (type) of interactions.
One of the problems in addressing complexity issues has always been distinguishing
between the large number of elements and relationships, or interactions evident in
chaotic (disruptive, unconstrained) systems - and the still large, but significantly smaller
number of elements and interactions found in ordered (constrained) systems.
• Orderly (constrained) System Frameworks tend to have both a restricted number of
uniform elements with simple (linear, proportional, symmetric) interactions with just a few
element and interaction classes of small size, featuring explicit interaction rules which
govern more highly-ordered, internally correlated and constrained interactions – and
therefore tend to exhibit predictable system behaviour with smooth, linear outcomes.
• Disorderly (unconstrained) System Frameworks – tend to have both a very large total
number of non-uniform elements featuring complex (non-linear, asymmetric) interactions
which may be organised into many classes and regimes. Disorderly (unconstrained)
System Frameworks – feature a greater number of more disordered, uncorrelated and
unconstrained element interactions with implicit or random rules – which tend to exhibit
unpredictable, random, chaotic and disruptive system behaviour – and creates surprises.

Complexity Map

Complex Systems and Chaos Theory
• A system may be defined as simple or linear whenever its evolution sensitively is fully
independent of its initial conditions – and may also be described as deterministic
whenever the behaviour of a simple (linear) systems can be accurately predicted and
when all of the observable system outputs are directly and proportionally related to
system inputs. We can expect smooth, linear, highly predictable outcomes to simple
systems which are driven by linear algebraic functions.
• A system may be described as chaotic whenever the system evolution sensitively is
fully dependant upon its initial conditions – and may also be defined as probabilistic –
whenever the behaviour of that stochastic system cannot be predicted. This property
of dependency on initial conditions in chaotic systems implies that from any two invisibly
different starting points or variations in starting conditions – then their trajectories begin
to diverge – and the degree of separation between the two trajectories increases
exponentially over the course of time. In this way, over numerous System Cycles –
invisibly small differences in initial conditions are amplified until they become radically
divergent, eventually producing totally unexpected results with unpredictable outcomes.
Instead of smooth, linear outcomes – we experience surprises. This is why complex,
chaotic systems such as weather and the economy – are impossible to accurately
predict. What we can do, however, is to describe possible, probable and alternative
future scenarios – and calculate the probability of each of those scenarios materialising.

Complex Systems and Chaos Theory
• Chaos Theory has been used extensively in the fields of Futures Studies, Natural
Sciences, Behavioural Science, Strategic Management, Threat Analysis and Risk
Management. The requirements for a stochastic system to become chaotic, are that the
system must be non-linear and multi-dimensional – that is, the system posses at least
three dimensions. The Space-Time Continuum is already multi-dimensional – so any
complex (non-linear) and time-variant system which exists over time in three-dimensional
space - meets all of these criteria.
• The Control of Chaos refers to a process where a tiny external system influence is
applied to a chaotic system, so as to slightly vary system conditions – in order to achieve
a desirable and predictable (periodic or stationary) outcome. To synchronise and resolve
chaotic system behaviour we may invoke external procedures for stabilizing chaos which
interact with symbolic sequences of an embedded chaotic attractor - thus influencing
chaotic trajectories. The major concepts involved in the Control of Chaos, are described
by two methods – the Ott-Grebogi-Yorke (OGY) Method and the Adaptive Method.
• The Adaptive Method for the resolution of Complex, Chaotic Systems introduces multiple
relatively simple and loosely coupled interacting systems in an attempt to model over time
the behaviour of a single, large Complex and Chaotic System - which may still be subject
to undetermined external influences – thus creating random system effects.....

Wave-form Analytics
• • WAVE-FORM ANALYTICS • is an analytical tool based on Time-frequency Wave-
form analysis – which has been “borrowed” from spectral wave frequency analysis in
Physics. Deploying the Wigner-Gabor-Qian (WGQ) spectrogram – a method which
exploits wave frequency and time symmetry principles – demonstrates a distinct trend
forecasting and analysis capability in Wave-form Analytics. Trend-cycle wave-form
decomposition is a critical technique for testing the validity of multiple (compound)
dynamic wave-series models competing in a complex array of interacting and inter-
dependant cyclic systems - waves driven by both deterministic (human actions) and
stochastic (random, chaotic) paradigms in the study of complex cyclic phenomena.
• • WAVE-FORM ANALYTICS in “BIG DATA” • is characterised as periodic alternate
sequences of, high and low trends regularly recurring in a time-series – resulting in
cyclic phases of increased and reduced periodic activity – Wave-form Analytics
supports an integrated study of complex, compound wave forms in order to identify
hidden Cycles, Patterns and Trends in Big Data. The existence of fundamental stable
characteristic frequencies in large aggregations of time-series Economic data sets
(“Big Data”) provides us with strong evidence and valuable information about the
inherent structure of Business Cycles. The challenge found everywhere in business
cycle theory is how to interpret very large scale / long period compound-wave
(polyphonic) temporal data sets which are non-stationary (dynamic) in nature.

Wave-form Analytics
Track and Monitor
Investigate and
Analyse
Scan and Identify
Separate and Isolate
Communicate Discover
Verify and Validate Disaggregate
Background Noise
Individual Wave
Composite Waves
Wave-form Characteristics

Wave-form Analytics in Cycles
• Wave-form Analytics is a powerful new analytical tool “borrowed” from spectral
wave frequency analysis in Physics – which is based on Time-frequency analysis –
a technique which exploits the wave frequency and time symmetry principle. This is
introduced here for the first time in the study of natural and human activity waves,
and in the field of economic cycles, business cycles, market patterns and trends.
• Trend-cycle decomposition is a critical technique for testing the validity of multiple
(compound) dynamic wave-form models competing in a complex array of
interacting and inter-dependant cyclic systems in the study of complex cyclic
phenomena - driven by both deterministic and stochastic (probabilistic) paradigms.
In order to study complex periodic economic phenomena there are a number of
competing analytic paradigms – which are driven by either deterministic methods
(goal-seeking - testing the validity of a range of explicit / pre-determined / pre-
selected cycle periodicity value) and stochastic (random / probabilistic / implicit -
testing every possible wave periodicity value - or by identifying actual wave
periodicity values from the “noise” – harmonic resonance and interference patterns).
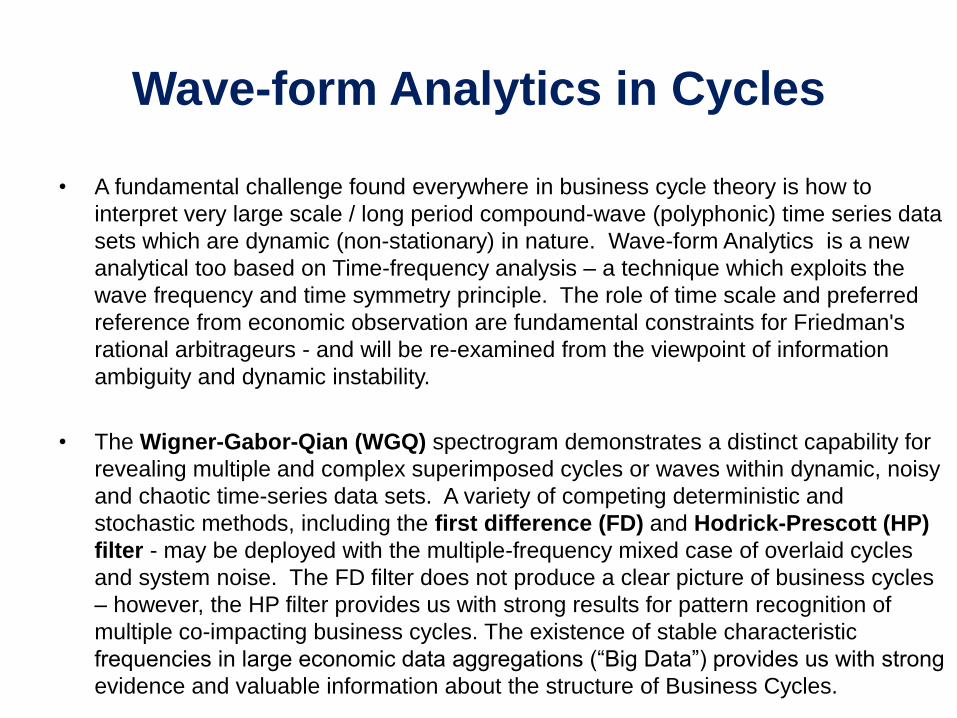
Wave-form Analytics in Cycles
• A fundamental challenge found everywhere in business cycle theory is how to
interpret very large scale / long period compound-wave (polyphonic) time series data
sets which are dynamic (non-stationary) in nature. Wave-form Analytics is a new
analytical too based on Time-frequency analysis – a technique which exploits the
wave frequency and time symmetry principle. The role of time scale and preferred
reference from economic observation are fundamental constraints for Friedman's
rational arbitrageurs - and will be re-examined from the viewpoint of information
ambiguity and dynamic instability.
• The Wigner-Gabor-Qian (WGQ) spectrogram demonstrates a distinct capability for
revealing multiple and complex superimposed cycles or waves within dynamic, noisy
and chaotic time-series data sets. A variety of competing deterministic and
stochastic methods, including the first difference (FD) and Hodrick-Prescott (HP)
filter - may be deployed with the multiple-frequency mixed case of overlaid cycles
and system noise. The FD filter does not produce a clear picture of business cycles
– however, the HP filter provides us with strong results for pattern recognition of
multiple co-impacting business cycles. The existence of stable characteristic
frequencies in large economic data aggregations (“Big Data”) provides us with strong
evidence and valuable information about the structure of Business Cycles.

Wave-form Analytics in Cycles
Wave-form Analytics in Natural Cycles
• Solar, Oceanic and Atmospheric Climate Forcing systems demonstrate Complex Adaptive
System (CAS) behaviour – behaviour which is more similar to an organism than that of
random and chaotic “Stochastic” systems. The remarkable long-term stability and
sustainability of cyclic climatic systems contrasted with random and chaotic short-term
weather systems are demonstrated by the metronomic regularity of climate pattern
changes driven by Milankovich Solar Cycles along with 1470-year Dansgaard-Oeschger
and Bond Cycles – regular and predictable and Oceanic Forcing Climate Sub-systems.
Wave-form Analytics in Human Activity Cycles
• Economic systems also demonstrate Complex Adaptive System (CAS) behaviour - more
similar to an ecology than chaotic “Random” systems. The capacity of market economies
for cyclic “boom and bust” – financial crashes and recovery - can be seen from the impact
of Black Swan Events causing stock market crashes - such as the failure of sovereign
states (Portugal, Ireland, Greece, Iceland, Italy and Spain) and market participants
(Lehman Brothers) due to oil price shocks, money supply shocks and credit crises.
Surprising pattern changes occurred during wars, arm races, and during the Reagan
administration. Like microscopy for biology, non-stationary time series analysis opens up
a new space for business cycle studies and policy diagnostics.

Complex Adaptive Systems Adaption and Evolution
When Systems demonstrate properties of Complex
Adaptive Systems (CAS) - often defined as a
collection or set of relatively simple and loosely
connected interacting systems exhibiting co-adapting
and co-evolving behaviour - then those systems are
much more likely to adapt successfully to their
environment and, thus better survive the impact of both
gradual change and of sudden random events.

Complex Adaptive Systems
• Complex Adaptive Systems (CAS) and Chaos Theory has also been
used extensively in the field of Futures Studies, Strategic Management,
Natural Sciences and Behavioural Science. It is applied in these domains
to understand how individuals within populations, societies, economies and
states act as a collection of loosely coupled interacting systems which
adapt to changing environmental factors and random events – biological,
ecological, socio-economic or geo-political.
• Complex Adaptive Systems (CAS) and Chaos Theory treats individuals,
crowds and populations as a collective of pervasive social structures which
may be influenced by random individual behaviours – such as flocks of
birds moving together in flight to avoid collision, shoals of fish forming a
“bait ball” in response to predation, or groups of individuals coordinating
their behaviour in order to respond to external stimuli – the threat of
predation or aggression – or in order to exploit novel and unexpected
opportunities which have been discovered or presented to them.

Complex Adaptive Systems
• When Systems demonstrate properties of Complex Adaptive Systems (CAS) - which is
often defined as a collection or set of relatively simple and loosely connected interacting
systems exhibiting co-adapting and co-evolving behaviour (sub-systems or components
changing together in response to the same external stimuli) - then those systems are
much more likely to adapt successfully to their environment and, thus better survive the
impact of both gradual change and of sudden random events. Complexity Theory
thinking has been present in biological, strategic and organisational system studies since
the first inception of Complex Adaptive Systems (CAS) as an academic discipline.
• Complex Adaptive Systems are further contrasted compared with other ordered and
chaotic systems by the relationship that exists between the system and the agents and
catalysts of change which act upon it. In an ordered system the level of constraint means
that all agent behaviour is limited to the rules of the system. In a chaotic system these
agents are unconstrained and are capable of random events, uncertainty and disruption.
In a CAS, both the system and the agents co-evolve together; the system acting to
lightly constrain the agents behaviour - the agents of change, however, modify the
system by their interaction. CAS approaches to behavioural science seek to understand
both the nature of system constraints and change agent interactions and generally takes
an evolutionary or naturalistic approach to crowd scenario planning and impact analysis.

Complex Adaptive Systems
• Biological, Sociological, Economic and Political systems all tend to demonstrate
Complex Adaptive System (CAS) behaviour - which appears to be more similar
in nature to biological behaviour in an population than to truly Disorderly, Chaotic,
Stochastic Systems (“Random” Systems). For example, the remarkable long-term
adaptability, stability and resilience of market economies may be demonstrated by
the impact of Black Swan Events causing stock market crashes - such as oil price
shocks (1970-72) and credit supply shocks (1927- 1929 and 2008 onwards) – by
the ability of Financial markets to rapidly absorb and recover from these events.
• Unexpected and surprising Cycle Pattern changes have historically occurred during
regional and global conflicts being fuelled by technology innovation-driven arms
races - and also during US Republican administrations (Reagan and Bush - why?).
Just as advances in electron microscopy have revolutionised the science of biology
- non-stationary time series wave-form analysis has opened up a new space for
Biological, Sociological, Economic and Political system studies and diagnostics.

Event Complexity Map

Crowd Behaviour 1 – the Swarm
• An example of Random Clustering is a Crowd or Swarm in Social Animals -
Insects (locusts), Birds (starlings) and Mammals (lemmings) and Human Beings.
There are a various forces which contribute towards Crowd Behaviour – or
Swarming. In any crowd of human beings or a swarm of animals, individuals in
the crowd or swarm are closely connected so that they share the same mood and
emotions (fear, greed, rage) and demonstrate the same or very similar behaviour
(fight, flee or feeding frenzy). Only the initial few individuals exposed to the
Random Event or incident may at first respond strongly and directly to the initial
“trigger” stimulus, causal event or incident (opportunity or threat – such as
external predation, aggression or discovery of a novel or unexpected opportunity
to satisfy a basic need – such as feeding, reproduction or territorialism).
• Those individuals who have been directly exposed to the initial “trigger” event or
incident - the system input or causal event that initiated a specific outbreak of
behaviour in a crowd or swarm – quickly communicate and propagate their
swarm response mechanism and share with all the other individuals – those
members of the Crowd immediately next to them – so that modified Crowd
behaviour quickly spreads from the periphery or edge of the Crowd.

Crowd Behaviour 2 – the Swarm
• In a gathering or crowd of human beings or in a swarm of animals (insect swarm, fish
bait ball, flock of birds, pack of mammals), individuals are so closely connected or
tightly packed that they share the same, or interconnected, mood and emotions (fear,
curiosity, greed, rage) that they demonstrate the same - or very similar - patterns of
behaviour (fight, flee or feeding frenzy). Only the initial few individuals at the edge of
the crowd that are exposed to the Causal Stimulus, Event or Incident respond at first
- strongly and directly - to the initial “trigger” stimulus, causal event or incident
(opportunity or threat – such as external predation, aggression or territorialism) - or
discovery of a novel or unexpected opportunity to satisfy and fulfil a basic need –
(such as feeding, nesting, roosting or reproduction).
• More and more Peripheral Crowd members in turn adopt the Crowd response
behaviour - without having been directly exposed to, or even know about, the Swarm
“trigger”. Members of the crowd or swarm may be oblivious to the initial source or
nature of the trigger stimulus - nonetheless, the common Crowd or Swarm behaviour
response quickly spreads to all of the individuals in or around that crowd or swarm.

Crowd Behaviour 3 – the Swarm
• Thus those individuals who have been directly exposed to the initial “trigger” event or
incident (predation threat, feeding frenzy, roosting etc.) can quickly communicate and
propagate the initial “trigger” event through their swarm response mechanisms and
share that trigger / response coupling with all the other individuals – beginning with
those members of the Crowd immediately next to them – so that every new, modified
Crowd behaviour quickly spreads from the periphery or edge of the Crowd
throughout the whole Crowd population.
• Peripheral Crowd members in turn adopt the Crowd response behaviour without
having been directly exposed to the “trigger” – the system input or causal event that
initiated a specific outbreak of behaviour in a crowd or swarm . Most members of the
crowd or swarm may be totally oblivious as to the initial source or nature of the
trigger stimulus - nonetheless, the common Crowd behaviour response quickly
spreads to all of the individuals in or around that crowd or swarm.
• This explains the phenomenon of “de-humanisation” – a typical crowd response
during a riot is to abandon their usual social, moral, ethical and religious constraints
and act together, in concert “de-humanised” to the Swarm Stimulus – such as
predation threat (riot police), “feeding frenzy” (fighting, burning, looting, rioting etc.).


Randomness Patterns in the Chaos
The Nature of Randomness – Uncertainty, Disorder and Chaos
Mechanical Processes: –
Thermodynamics (Complexity and Chaos Theory) – governs the behaviour of Systems Classical Mechanics (Newtonian Physics) – governs the behaviour of all everyday objects Quantum Mechanics – governs the behaviour of unimaginably small sub-atomic particles Relativity Theory – governs the behaviour of impossibly super-massive cosmic structures
Wave Mechanics (String Theory) – integrates the behaviour of every size and type of object

Random Event Clustering – Patterns in the Chaos.....
• The defining concept for understanding the effects of Chaos Theory on Complex Systems is that with
any vanishingly small differences in the initial conditions at the onset of a chaotic system cycle – those
minute and imperceptible differences which create slightly different starting points result in massively
different outcomes between two otherwise identical systems, both operating within the same time frame.
• The discovery of Chaos and Complexity has increased our understanding of the Cosmos and its effect
on us. If you surf the chaos content regions of the internet, you will invariably encounter terms such as: -
• These influences can take some time to manifest themselves, but that is the nature of the phenomena
identified as a "strange attractor." Such differences could be small to the point of invisibility - how tiny
can influences be to have any effect? This is captured in the “butterfly scenario” described below.
1. Chaos 2. Clustering 3. Complexity 4. Butterfly effect 5. Disruption 6. Dependence 7. Feedback loops 8. Fractal patterns and dimensions 9. Harmonic Resonance 10. Horizon of predictability 11. Interference patterns 12. Massively diverse outcomes
13. Phase space and locking 14. Randomness 15. Sensitivity to initial conditions 16. Self similarity (self affinity) 17. Starting conditions 18. Stochastic events 19. Strange attractors 20. System cycles (iterations) 21. Time-series Events 22. Turbulence 23. Uncertainty 24. Vanishingly small differences

Complex Systems and Chaos Theory
• Weaver (Complexity Theory) along with Gleick and Lorenzo (Chaos Theory) have given us some of the tools that we need to understand these complex, interrelated chaotic and radically disruptive political, economic and social events such as the collapse of Global markets – and the various protests against this - using Event Decomposition, Complexity Mapping, and Statistical Analysis to help us identify patterns, extrapolations, scenarios and trends unfolding as seemingly unrelated, random and chaotic events. The Hawking Paradox, however, challenges this view of Complex Systems by postulating that uncertainty dominates complex, chaotic systems to such an extent that future outcomes are both unknown - and unknowable.
• System Complexity is typically characterised by the number of elements in a system, the number of interactions between those elements and the nature (type) of interactions. One of the problems in addressing complexity issues has always been distinguishing between the large number of elements and relationships, or interactions evident in chaotic (disruptive, unconstrained) systems - and the still large, but significantly smaller number of elements and interactions found in ordered (constrained) systems. Orderly (constrained) System Frameworks tend to act to both reduce the total number of more-uniform elements and interactions with fewer regimes and of reduced size – and feature explicit rules which govern less random and chaotic, but more highly-ordered, internally correlated and constrained interactions – as compared with the massively increased random, chaotic and disruptive behaviour exhibited by Disorderly (unconstrained) System Frameworks.

Complex Systems and Chaos Theory
• There are many kinds of stochastic or random processes that impacts on every area of
Nature and Human Activity. Randomness can be found in Science and Technology and in
Humanities and the Arts. Random events are taking place almost everywhere we look – for
example from Complex Systems and Chaos Theory to Cosmology and the distribution and
flow of energy and matter in the Universe, from Brownian motion and quantum theory to
Fractal Branching and linear transformations. Further examples include Random Events,
Weak Signals and Wild Cards occurring in each aspect of Nature and Human Activity – from
Ecology and the Environment to Weather Systems and Climatology in Economics and
Behaviour. And then there are the examples of atmospheric turbulence, and the complex
orbital and solar cycles – and much, much more.
• There is an interesting phenomenon called Phase Locking where two loosely coupled
systems with slightly different frequencies show a tendency to move into resonance – in order
to harmonise with one another. We also know that the opposite of system convergence -
system divergence - is also possible with phase-locked systems, which can also diverge with
only very tiny inputs - especially if we run those systems in reverse. Thus phase locking
draws two nearly harmonic systems into resonance and gives us the appearance of a
“coincidence”. There are, however, no coincidences in Physics. Sensitive Dependence in
Complexity Theory also tells us that minute, imperceptible changes to inputs at the initial state
of a system, at the beginning of a cycle, are sufficient to dramatically alter the final state after
even only a few iterations of the system cycle.

Complex Systems and Chaos Theory
• Complex Systems and Chaos Theory has been used extensively in the field of Futures Studies, Strategic
Management, Natural Sciences and Behavioural Science. It is applied in these domains to understand how
individuals or populations, societies and states act as a collection of systems which adapt to changing
environments – bio-ecological, socio-economic or geo-political. The theory treats individuals, crowds and
populations as a collective of pervasive social structures which are influenced by random individual
behaviours – such as flocks of birds moving together in flight to avoid collision, shoals of fish forming a “bait
ball” in response to predation, or groups of individuals coordinating their behaviour in order to exploit novel
and unexpected opportunities which have been discovered or presented to them.
• When Systems demonstrate properties of Complex Adaptive Systems (CAS) - which is often defined as
consisting of a small number of relatively simple and loosely connected systems - then they are much more
likely to adapt to their environment and, thus, survive the impact of change and random events. Complexity
Theory thinking has been present in strategic and organisational studies since the first inception of Complex
Adaptive Systems (CAS) as an academic discipline.
• Complex Adaptive Systems are further contrasted compared with other ordered and chaotic systems by
the relationship that exists between the system and the agents and catalysts of change which act upon it. In
an ordered system the level of constraint means that all agent behaviour is limited to the rules of the system.
In a chaotic system these agents are unconstrained and are capable of random events, uncertainty and
disruption. In a CAS, both the system and the agents co-evolve together; the system acting to lightly
constrain the agents behaviour - the agents of change, however, modify the system by their interaction. CAS
approaches to behavioural science seek to understand both the nature of system constraints and change
agent interactions and generally takes an evolutionary or naturalistic approach to crowd scenario planning
and impact analysis.

Random Event Clustering – Patterns in the Chaos.....
Order out of Chaos – Patterns in the Randomness
• There is an interesting phenomenon called Phase Locking where two loosely coupled systems with slightly
different frequencies show a tendency to move into resonance – in order to harmonise with one another. We
also know that the opposite of system convergence - system divergence - is also possible with phase-locked
systems, which can also diverge with only very tiny inputs - especially if we run those systems in reverse.
• Thus phase locking draws two nearly harmonic systems into resonance and gives us the appearance of a
“coincidence”. There are, however, no coincidences in Physics. Sensitive Dependence in Complexity Theory
also tells us that minute, imperceptible changes to inputs at the initial state of a system, at the beginning of a
cycle, are sufficient to dramatically alter the final state after even only a few iterations of the system cycle.
Multiple Random process also occur in clusters
• The occurrences of rare, multiple related and similar chaotic events tend to form clusters due to the nature of
random processes. At the more local level, we see stochastic processes at work when we experience the
myriad of phenomena that make up our experiences. Almost without exception, we hear of events by type
occurring close together in temporal and spatial proximity. The saying that bad or good news comes in groups
has some validity based upon the nature of event clustering. Plane, train or bus crashes come in groups
spaced close together in time, separated by long periods of no such events. Weather extremes follow a similar
stochastic pattern. Everyone is familiar with "When it rains, it pours" meaning that trouble comes in bunches
and the work load comes all at once, interspersed with quiet periods and calm where one is forced to look busy
to justify their continued employment to the boss. During the busy period when it all happens it once, it's a
tough go just to keep everything acceptably together. In the anarchy of the capitalist market, we see this trend
at work in the economy with booms and busts of all sizes occurring in a combined and unequal fashion.

WAVE THEORY – NATURAL CYCLES
Milankovitch Astronomic Cycles
• Milankovitch Cycles are a Composite Harmonic Wave Series built up from individual wave-forms with
periodicity of 20-100 thousand years - exhibiting multiple wave harmonics, resonance and interference
patterns. Over very long periods of astronomic time Milankovitch Cycles and Sub-cycles have been
beating out precise periodic waves, acting in concert together, like a vast celestial metronome.
• From the numerous geological examples found in Nature including ice-cores, marine sediments and
calcite deposits, we know that Composite Wave Models such as Milankovitch Cycles behave as a
Composite Wave Series with automatic, self-regulating control mechanisms - and demonstrate
Harmonic. Resonance and Interference Patters with extraordinary stability in periodicity through
many system cycles over durations measured in tens of millions of years.
• Climatic Change and the fundamental astronomical and climatic cyclic variation frequencies are
coherent, strongly aligned and phase-locked with the predictable orbital variation of 20-100 k.y
Milankovitch Climatic Cycles – which have been modeled and measured for many iterations, over a
prolonged period of time, and across many levels of temporal tiers - each tier hosting different types of
geological processes, which in turn influence different layers of Human Activity.
• Milankovitch Cycles - are precise astronomical cycles with periodicities of 22, 41, 100 and 400 k.y
– Precession (Polar Wandering) - 22,000 year cycle
– Eccentricity (Orbital Ellipse) 100,000 and 400,000 year cycles
– Obliquity (Axial Tilt) - 41,000-year cycle

WAVE THEORY – NATURAL CYCLES
Sub-Milankovitch Climatic Cycles
• Sub-Milankovitch Climatic Cycles are less well understood – varying from Sun Cycles of 11 years
to Climatic Variation Trends of up to 1470 years intervals, may also impact on Human Activity –
short-term Economic Patterns, Cycles and Innovation Trends – to long-term Technology Waves and
the rise and fall of Civilizations. A possible explanation might be found in Resonance Harmonics of
Milankovitch-Cycles 20-100 ky / sub-Cycle Periodicity - resulting in Interference Phenomenon from
periodic waves being re-enforced and cancelled. Dansgaard-Oeschger (D/O) events – with precise
1470 years intervals - occurred repeatedly throughout much of the late Quaternary Period.
Dansgaard-Oeschger (D/O) events were first reported in Greenland ice cores by scientists Willi
Dansgaard and Hans Oeschger. Each of the 25 observed D/O events in the Quaternary Glaciation
Time Series consist of an abrupt warming to near-interglacial conditions that occurred in a matter of
decades - followed by a long period of gradual cooling down again over thousands of years
• Sub-Milankovitch Climatic Cycles - Harmonic. Resonance and Interference Wave Series
– Solar Forcing Climatic Cycle at 300-Year, 36 and 11 years
• Grand Solar Cycle at 300 years with 36 and 11 year Harmonics
• Sunspot Cycle at 11years
– Oceanic Forcing Climatic Cycles at 1470 years (and at 490 / 735 / 980 years ?)
• Dansgaard-Oeschger Cycles – Quaternary
• Bond Cycles - Pleistocene
– Atmospheric Forcing Climatic Cycles at 117, 64, 57 and 11 years
• North Atlantic Climate Anomalies
• Southern Oscillation - El Nino / La Nina

WAVE THEORY – NATURAL CYCLES and HUMAN ACTIVITY
Dr. Nicola Scafetta - solar-lunar cycle climate forecast -v- global temperature
• In his recent publications Dr. Nicola Scafetta proposed an harmonic wave model of the global
climate, comprised of four major decadal and multi-decadal cycles (periodicity 9.1, 10.4, 20 and 60
years) - which are not only consistent with four major solar/lunar/astronomical cycles - plus a
corrected anthropogenic net warming contribution – but they are also approximately coincident with
Business Cycles taken from Joseph Schumpter’s Economic Wave Series . The model was not only
able to reconstruct the historic decadal patterns of the temperature since 1850 better than any
general circulation model (GCM) adopted by the IPCC in 2007, but it is apparently able to better
forecast the actual temperature pattern observed since 2000. Note that since 2000 the proposed
model is a full forecast. Will the forecast hold, or is the proposed model is just another failed
attempt to forecast climate change? Only time will tell.....
• Randomness. Neither data-driven nor model-driven macro-cyclic Natural or micro-cyclic Human
Activity Composite Wave Series models are alone able to deal with the concept of randomness
(uncertainty) – we therefore need to consider and factor in further novel and disruptive (systemic)
approaches which offer us the possibility to manage uncertainty by searching for, detecting and
identifying Weak Signals - which in turn may predicate possible future chaotic, and radically
disruptive Wild Card or Black Swan events. Random Events can then be factored into Complex
Systems Modelling – so that a Composite Wave Series may be considered and modeled
successfully as an Ordered (Constrained) Complex System – with a clear set of rules (Harmonic.
Resonance and Interference Patters) and exhibiting ordered (restricted) numbers of elements and
classes, relationships and types interacting with randomness, uncertainty, chaos and disruption.
Scafetta on his latest paper: Harmonic climate model versus the IPCC general circulation climate models


WAVE THEORY – NATURAL CYCLES and HUMAN ACTIVITY
• Infinitesimally small differences may be imperceptible to the point of invisibility - how tiny can
influences be to have any effect ? Such influences may take time to manifest themselves –
perhaps not appearing as a measurable effect until many system cycle iterations have been
completed – such is the nature of the "strange attractor." effect. This phenomenon is captured in
the Climate Change “butterfly scenario” example, which is described below.
• Climate change is not uniform – some areas of the globe (Arctic and Antarctica) have seen a
dramatic rise in average annual temperature whilst other areas have seen lower temperature
gains. The original published temperature record for Climate Change is in red, while the updated
version is in blue. The black curve is the proposed harmonic component plus the proposed
corrected anthropogenic warming trend. The figure shows in yellow the harmonic component
alone made of the four cycles, which may be interpreted as a lower boundary limit for the natural
variability. The green area represents the range of the IPCC 2007 GCM projections.
• The astronomical / harmonic model forecast since 2000 looks in good agreement with the data
gathered up to now, whilst the IPCC model projection is not in agreement with the steady
temperature observed since 2000. This may be due to other effects, such as cooling due to
increased water evaporation (humidity has increased about 4% since measurements began in the
18th centaury) or cloud seeded by jet aircraft condensation trails – which reduce solar forcing by
reflecting energy back into space. Both short-term solar-lunar cycle climate forecasting and
long-term Milankovitch solar forcing cycles point towards a natural cyclic phase of gradual
cooling - which partially off-sets those Climate Change factors (Co2 etc.) due to Human Actions.
Scafetta on his latest paper: Harmonic climate model versus the IPCC general circulation climate models


Clustering Phenomena in “Big Data”

Clustering in “Big Data” “A Cluster is a group of the same or similar data elements
which are aggregated – or closely distributed – together”
Clustering is a technique used to explore content and
understand information in every business sector and scientific
field that collects and processes very large volumes of data
Clustering is an essential tool for any “Big Data” problem

• “Big Data” refers to vast aggregations (super sets) consisting of numerous individual
datasets (structured and unstructured) - whose size and scope is beyond the capability of
conventional transactional (OLTP) or analytics (OLAP) Database Management Systems
and Enterprise Software Tools to capture, store, analyse and manage. Examples of “Big
Data” include the vast and ever changing amounts of data generated in social networks
where we maintain Blogs and have conversations with each other, news data streams,
geo-demographic data, internet search and browser logs, as well as the ever-growing
amount of machine data generated by pervasive smart devices - monitors, sensors and
detectors in the environment – captured via the Smart Grid, then processed in the Cloud –
and delivered to end-user Smart Phones and Tablets via Intelligent Agents and Alerts.
• Data Set Mashing and “Big Data” Global Content Analysis – drives Horizon Scanning,
Monitoring and Tracking processes by taking numerous, apparently un-related RSS and
other Information Streams and Data Feeds, loading them into Very large Scale (VLS)
DWH Structures and Document Management Systems for Real-time Analytics – searching
for and identifying possible signs of relationships hidden in data (Facts/Events)– in order to
discover and interpret previously unknown Data Relationships driven by hidden Clustering
Forces – revealed via “Weak Signals” indicating emerging and developing Application
Scenarios, Patterns and Trends - in turn predicating possible, probable and alternative
global transformations which may unfold as future “Wild Card” or “Black Swan” events.
“Big Data”

Clustering in “Big Data” • The profiling and analysis of
large aggregated datasets in
order to determine a ‘natural’
structure of groupings provides
an important technique for many
statistical and analytic
applications. Cluster analysis
on the basis of profile similarities
or geographic distribution is a
method where no prior
assumptions are made
concerning the number of
groups or group hierarchies and
internal structure. Geo-
demographic techniques are
frequently used in order to
profile and segment populations
by ‘natural’ groupings - such as
common behavioural traits,
Clinical Trial, Morbidity or
Actuarial outcomes - along with
many other shared
characteristics and common
factors.....

Clustering in “Big Data”
• "BIG DATA” ANALYTICS – PROFILING, CLUSTERING and 4D GEOSPATIAL ANALYSIS •
• The profiling and analysis of large aggregated datasets in order to determine a ‘natural’
structure of data relationships or groupings, is an important starting point forming the basis of
many mapping, statistical and analytic applications. Cluster analysis of implicit similarities -
such as time-series demographic or geographic distribution - is a critical technique where no
prior assumptions are made concerning the number or type of groups that may be found, or
their relationships, hierarchies or internal data structures. Geospatial and demographic
techniques are frequently used in order to profile and segment populations by ‘natural’
groupings. Shared characteristics or common factors such as Behaviour / Propensity or
Epidemiology, Clinical, Morbidity and Actuarial outcomes – allow us to discover and explore
previously unknown, concealed or unrecognised insights, patterns, trends or data relationships.
• PREDICTIVE ANALYITICS and EVENT FORECASTING •
• Predictive Analytics and Event Forecasting uses Horizon Scanning, Tracking and Monitoring
methods combined with Cycle, Pattern and Trend Analysis techniques for Event Forecasting
and Propensity Models in order to anticipate a wide range of business. economic, social and
political Future Events – ranging from micro-economic Market phenomena such as forecasting
Market Sentiment and Price Curve movements - to large-scale macro-economic Fiscal
phenomena using Weak Signal processing to predict future Wild Card and Black Swan Events
- such as Monetary System shocks.
•


GIS MAPPING and SPATIAL DATA ANALYSIS
• A Geographic Information System (GIS) integrates hardware, software and digital data capture devices for acquiring, managing, analysing, distributing and displaying all forms of geographically dependant location data – including machine generated data such as Computer-aided Design (CAD) data from land and building surveys, Global Positioning System (GPS) terrestrial location data - as well as all kinds of data streams - HDCCTV, aerial and satellite image data.....

GIS Mapping and Spatial Analysis
• GIS MAPPING and SPATIAL DATA ANALYSIS •
• A Geographic Information System (GIS) integrates hardware, software and digital data capture devices for acquiring, managing, analysing, distributing and displaying all forms of geographically dependant location data – including machine generated data such as Computer-aided Design (CAD) data from land and building surveys, Global Positioning System (GPS) terrestrial location data - as well as all kinds of data streams - HDCCTV, aerial and satellite image data.....
• Spatial Data Analysis is a set of techniques for analysing 3-dimensional spatial (Geographic) data and location (Positional) object data overlays. Software that implements spatial analysis techniques requires access to both the locations of objects and their physical attributes. Spatial statistics extends traditional statistics to support the analysis of geographic data. Spatial Data Analysis provides techniques to describe the distribution of data in the geographic space (descriptive spatial statistics), analyse the spatial patterns of the data (spatial pattern or cluster analysis), identify and measure spatial relationships (spatial regression), and create a surface from sampled data (spatial interpolation, usually categorized as geo-statistics).
• The results of spatial data analysis are largely dependent upon the type, quantity, distribution and data quality of the spatial objects under analysis.

World-wide Visitor Count – GIS Mapping

Geo-demographic Clustering in “Big Data”
• GEODEMOGRAPHIC PROFILING – CLUSTERING IN“BIG DATA” •
• The profiling and analysis of large aggregated datasets in order to determine a
‘natural’ or implicit structure of data relationships or groupings where no prior
assumptions are made concerning the number or type of groups discovered or group
relationships, hierarchies or internal data structures - in order to discover hidden data
relationships - is an important starting point forming the basis of many statistical and
analytic applications. The subsequent explicit Cluster Analysis as of discovered data
relationships is a critical technique which attempts to explain the nature, cause and
effect of those implicit profile similarities or geographic distributions. Demographic
techniques are frequently used in order to profile and segment populations using
‘natural’ groupings - such as common behavioural traits, Clinical, Morbidity or Actuarial
outcomes, along with many other shared characteristics and common factors – and
then attempt to understand and explain those natural group affinities and geographical
distributions using methods such as Causal Layer Analysis (CLA).....

GIS Mapping and Spatial Analysis
• A Geographic Information System (GIS) integrates hardware, software and digital
data capture devices for acquiring, managing, analysing, distributing and displaying all
forms of geographically dependant location data – including machine generated data
such as Computer-aided Design (CAD) data from land and building surveys, Global
Positioning System (GPS) terrestrial location data - as well as all kinds of data
streams - HDCCTV, aerial and satellite image data.....
• Spatial Data Analysis is a set of techniques for analysing spatial (Geographic)
location data. The results of spatial analysis are dependent on the locations of
the objects being analysed. Software that implements spatial analysis techniques
requires access to both the locations of objects and their physical attributes.
• Spatial statistics extends traditional statistics to support the analysis of geographic
data. Spatial Data Analysis provides techniques to describe the distribution of data in
the geographic space (descriptive spatial statistics), analyse the spatial patterns of the
data (spatial pattern or cluster analysis), identify and measure spatial relationships
(spatial regression), and create a surface from sampled data (spatial interpolation,
usually categorized as geo-statistics).

BTSA Induction Cluster Map

Geo-Demographic Profile Clusters


Targeting – Map / Reduce
Consume – End-User Data
Data Acquisition – High-Volume
– Mobile Enterprise Platforms (MEAP’s)
– Data Delivery and Consumption
– Data Discovery and Collection
– Analytics Engines - Hadoop
– Data Management Processes
– Performance Acceleration
Apache Hadoop Framework HDFS, MapReduce, Metlab “R” Autonomy, Vertica
Smart Devices Smart Apps Smart Grid
Clinical Trial, Morbidity and Actuarial Outcomes Market Sentiment and Price Curve Forecasting Horizon Scanning,, Tracking and Monitoring Weak Signal, Wild Card and Black Swan Event Forecasting
News Feeds and Digital Media Global Internet Content Social Mapping Social Media Social CRM
Data Audit Data Profile Data Quality Reporting Data Quality Improvement Data Extract, Transform, Load
GPU’s – massive parallelism SSD’s – in-memory processing DBMS – ultra-fast data replication
– Data Presentation and Display
– Data Management Tools
– Info. Management Tools
– Data Warehouse Appliances
Excel Web Mobile
DataFlux Embarcadero Informatica Talend
Business Objects Cognos Hyperion Microstrategy
Biolap Jedox Sagent Polaris
Teradata SAP HANA Netezza (now IBM) Greenplum (now EMC2) Extreme Data xdg Zybert Gridbox
Ab Initio Ascential Genio Orchestra

Clustering Phenomena in “Big Data”
“A Cluster is a group of profiled data similarities aggregated closely together”
• Cluster Analysis is a technique which is used to explore very large volumes of structured and unstructured data - transactional, machine generated (automatic) social media and internet content and geo-demographic information - in order to discover previously unknown, unrecognised or hidden logical data relationships.

Event Clusters and Connectivity
A
B
C
D
E
G
H
F
The above is an illustration of Event relationships - how Events might be connected. Any detailed,
intimate understanding of the connection between Events may help us to answer questions such as: -
• If Event A occurs does it make Event B or H more or less likely to occur ?
• If Event B occurs what effect does it have on Events C,D,E, F and G ?
Answering questions such as these allows us to plan our Event Management approach and Risk
mitigation strategy – and to decide how better to focus our Incident / Event resources and effort…..

Event Clusters and Connectivity
• Aggregated Event includes coincident, related, connected and interconnected Event: -
• Coincident - two or more Events appear simultaneously in the same domain –
but they arise from different triggers (unrelated causal events)
• Related - two more Events materialise in the same domain sharing common
Event features or characteristics (may share a possible hidden common trigger or
cause – and so are candidates for further analysis and investigation)
• Connected - two more Events materialise in the same domain due to the same
trigger (common cause)
• Interconnected - two more Events materialise together in a Event cluster, series
or “storm” - the previous (prior) Event event triggering the subsequent (next) event
in an Event Series…..
• A series of Aggregated Events may result in a significant cumulative impact - and are
therefore frequently identified incorrectly as Wild-card or Black Swan Events - rather
than just simply as event clusters or event “storms”.....

Event Clusters and Connectivity
1
2
3
4
5
7
8
6
The above is an illustration of Event relationships - how Risk Events might be connected. A detailed and
intimate understanding of Event clusters and the connection between Events may help us to understand: -
• What is the relationship between Events 1 and 8, and what impact do they have on Events 2 - 7 ?
• Events 2 - 5 and Events 6 and 7 occur in clusters – what are the factors influencing these clusters ?
Answering questions such as these allows us to plan our Risk Event management approach and mitigation
strategy – and to decide how to better focus our resources and effort on Risk Events and fraud management.
Claimant 1
Risk Event
Claimant 2 Residence
Vehicle
Event
Cluster

Aggregated Event Types
A Trigger A
Coincident Events
B Trigger B
Event
Event
C Trigger 1
Related Events
D Trigger 2
Event
Event
E
Trigger
Connected Events
Event
Event F
G Trigger
Inter-connected Events
Event Event
H

Event Complexity Map

Random Event Clustering Patterns in the Chaos
The Nature of Uncertainty – Randomness
Classical (Newtonian) Physics – apparent randomness is as a result of Unknown Forces Relativity Theory – any apparent randomness or asymmetry is as a result of Quantum effects
Quantum Mechanics – all events are truly and intrinsically both symmetrical and random Wave (String) Theory –apparent randomness and asymmetry is as a result of Unknown Forces

Event Clusters and Connectivity
A
B
C
D
E
G
H
F
The above is an illustration of Event relationships - how Events might be connected. Any detailed,
intimate understanding of the connection between Events may help us to answer questions such as: -
• If Event A occurs does it make Event B or H more or less likely to occur ?
• If Event B occurs what effect does it have on Events C,D,E, F and G ?
Answering questions such as these allows us to plan our Event Management approach and Risk
mitigation strategy – and to decide how better to focus our Incident / Event resources and effort…..

Event Clusters and Connectivity
• Aggregated Event includes coincident, related, connected and interconnected Event: -
• Coincident - two or more Events appear simultaneously in the same domain –
but they arise from different triggers (unrelated causal events)
• Related - two more Events materialise in the same domain sharing common
Event features or characteristics (may share a possible hidden common trigger or
cause – and so are candidates for further analysis and investigation)
• Connected - two more Events materialise in the same domain due to the same
trigger (common cause)
• Interconnected - two more Events materialise together in a Event cluster, series
or “storm” - the previous (prior) Event event triggering the subsequent (next) event
in an Event Series…..
• A series of Aggregated Events may result in a significant cumulative impact - and are
therefore frequently identified incorrectly as Wild-card or Black Swan Events - rather
than just simply as event clusters or event “storms”.....

Event Clusters and Connectivity
1
2
3
4
5
7
8
6
The above is an illustration of Event relationships - how Risk Events might be connected. A detailed and
intimate understanding of Event clusters and the connection between Events may help us to understand: -
• What is the relationship between Events 1 and 8, and what impact do they have on Events 2 - 7 ?
• Events 2 - 5 and Events 6 and 7 occur in clusters – what are the factors influencing these clusters ?
Answering questions such as these allows us to plan our Risk Event management approach and mitigation
strategy – and to decide how to better focus our resources and effort on Risk Events and fraud management.
Claimant 1
Risk Event
Claimant 2 Residence
Vehicle
Event
Cluster

Aggregated Event Types
A Trigger A
Coincident Events
B Trigger B
Event
Event
C Trigger 1
Related Events
D Trigger 2
Event
Event
E
Trigger
Connected Events
Event
Event F
G Trigger
Inter-connected Events
Event Event
H

Event Complexity Map

Multi-channel Retail - Digital Architecture
• The last decade has seen an unprecedented explosion in mobile platforms as the internet and mobile worlds came of age. It is no longer acceptable to have only a bricks-and-mortar high-street presence – customer-focused companies are now expected to deliver their Customer Experience and Journey via internet websites, mobiles and more recently tablets.

Multiple Factor Regression Analysis
In a multivariate regression case, where
there are two or more independent
variables, then the resultant regression
plane cannot be visualised within the
constraints of a two dimensional plane…..

Multiple Factor Regression Analysis
In a multivariate regression case, where there are two
or more independent variables, then the resultant
regression plane cannot be visualised within the
constraints of a two dimensional plane…..

Data Visualisation - Tufte in R
"The idea behind Tufte in R is to use R - the easiest and most powerful
open-source statistical analysis programming language - to replicate
the excellent data visualisation practices developed by Edward Tufte“
- Diego Marinho de Oliveira - Lead Data Scientist / Ph.D. candidate

Targeting – Map / Reduce
Consume – End-User Data
Data Acquisition – High-Volume Data Flows
– Mobile Enterprise Platforms (MEAP’s)
Apache Hadoop Framework HDFS, MapReduce, Metlab “R” Autonomy, Vertica
Smart Devices Smart Apps Smart Grid
Clinical Trial, Morbidity and Actuarial Outcomes Market Sentiment and Price Curve Forecasting Horizon Scanning,, Tracking and Monitoring Weak Signal, Wild Card and Black Swan Event Forecasting
– Data Delivery and Consumption
News Feeds and Digital Media Global Internet Content Social Mapping Social Media Social CRM
– Data Discovery and Collection
– Analytics Engines - Hadoop
– Data Presentation and Display Excel Web Mobile
– Data Management Processes Data Audit Data Profile Data Quality Reporting Data Quality Improvement Data Extract, Transform, Load
– Performance Acceleration GPU’s – massive parallelism SSD’s – in-memory processing DBMS – ultra-fast data replication
– Data Management Tools DataFlux Embarcadero Informatica Talend
– Info. Management Tools Business Objects Cognos Hyperion Microstrategy
Biolap Jedox Sagent Polaris
Teradata SAP HANA Netezza (now IBM) Greenplum (now EMC2) Extreme Data xdg Zybert Gridbox
– Data Warehouse Appliances
Ab Initio Ascential Genio Orchestra
Social Intelligence – The Emerging Big Data Stack


Clustering in “Big Data” “A Cluster is a grouping of the same, similar and equivalent, data
elements containing values which are closely distributed – or
aggregated – together”
Clustering is a technique used to explore content and understand
information in every business and scientific field that collects and
processes verify large volumes of data
Clustering is an essential tool for any “Big Data” problem


• “Big Data” refers to vast aggregations (super sets) consisting of numerous individual
datasets (structured and unstructured) - whose size and scope is beyond the capability of
conventional transactional (OLTP) or analytics (OLAP) Database Management Systems
and Enterprise Software Tools to capture, store, analyse and manage. Examples of “Big
Data” include the vast and ever changing amounts of data generated in social networks
where we maintain Blogs and have conversations with each other, news data streams,
geo-demographic data, internet search and browser logs, as well as the ever-growing
amount of machine data generated by pervasive smart devices - monitors, sensors and
detectors in the environment – captured via the Smart Grid, then processed in the Cloud –
and delivered to end-user Smart Phones and Tablets via Intelligent Agents and Alerts.
• Data Set Mashing and “Big Data” Global Content Analysis – drives Horizon Scanning,
Monitoring and Tracking processes by taking numerous, apparently un-related RSS and
other Information Streams and Data Feeds, loading them into Very large Scale (VLS)
DWH Structures and Document Management Systems for Real-time Analytics – searching
for and identifying possible signs of relationships hidden in data (Facts/Events)– in order to
discover and interpret previously unknown Data Relationships driven by hidden Clustering
Forces – revealed via “Weak Signals” indicating emerging and developing Application
Scenarios, Patterns and Trends - in turn predicating possible, probable and alternative
global transformations which may unfold as future “Wild Card” or “Black Swan” events.
“Big Data”


Forensic “Big Data”
• FORENSIC “BIG DATA” •
• Forensic “Big Data” combines the use of Social Media and Social Mapping Data in order to understand intimate inter-personal relationships for the purpose of National Security, anti-Trafficking and Fraud Prevention – through the identification, composition, activity analysis and monitoring of Criminal Enterprises and Terrorist Cells.....
• “Big Data” Global Internet Content Analysis – drives Horizon Scanning, Monitoring and Tracking by taking numerous, apparently unrelated Publications, Academic Papers Real-time RSS, News and other Data Feeds, along with many other Information Streams gleaned from both structured and unstructured Global Content - which are loaded into Very large Scale (VLS) DWH Data Structures and Document Management Systems for Predictive Analytics – searching for and identifying possible signs of relationships hidden in data (Facts/Events) – to discover and interpret previously unknown “Weak Signals” – “messages” from the future hidden in the background “noise” which, if found, could indicate emerging and developing “Strong Signals” – clear signs of developing future Patterns and Trends - which may predicate possible, probable and alternative global transformations unfolding as future “Wild Card” or “Black Swan” events.

Clustering Phenomena in “Big Data”
“A Cluster is a group of profiled data similarities aggregated closely together”
• Cluster Analysis is a technique which is used to explore very large volumes of structured and unstructured data - transactional, machine generated (automatic) social media and internet content and geo-demographic information - in order to discover previously unknown, unrecognised or hidden logical data relationships.

Clustering in “Big Data”
“A Cluster is a group of profiled data similarities aggregated closely together”
• Cluster Analysis is a technique used to explore very large volumes of transactional and
machine generated (automatic) data, social media and internet content and information -
in order to discover previously unknown, unrecognised or hidden data relationships.
• Clustering is an essential tool for any “Big Data” problem. Cluster Analysis of both
explicit (given) or implicit (discovered) data relationships in “Big Data” is a critical
technique which attempts to explain the nature, cause and effect of the forces which drive
clustering. Any observed profiled data similarities – geographic or temporal aggregations,
mathematical or statistical distributions – may be explained through Causal Layer Analysis.
– Choice of clustering algorithm and parameters are both process and data dependent
– Approximate Kernel K-means provides a good trade-off between clustering accuracy and
data volumes, throughput, performance and scalability
– Challenges include homogeneous and heterogeneous data (structured versus unstructured
data), data quality, streaming, scalability, cluster cardinality and validity

Cluster Types Deep Space Galactic Clusters
Hadoop Cluster – “Big Data” Servers
Molecular Clusters
Geo-Demographic Clusters
Mineral Lode Clusters

• GEODEMOGRAPHIC PROFILING – CLUSTERING IN“BIG DATA” •
• The profiling and analysis of very large aggregated datasets to determine ‘natural’ or
implicit data relationships and discover hidden common factors and data structures -
where no prior assumptions are made concerning the number or type of groups - is
driven by uncovering previously unknown data relationships and natural groupings.
The discovery of such Cluster / Group relationships, hierarchies or internal data
structures is an important starting point forming the basis of many statistical and
analytic applications which are designed to expose hidden data relationships.
• A subsequent explicit Cluster Analysis of previously discovered data relationships is
an important technique which attempts to understand the true nature, cause and
impact of unknown clustering forces driving implicit profile similarities, mathematical
and geographic distributions. Geo-demographic techniques are frequently used in
order to profile and segment Demographic and Spatial data by ‘natural’ groupings –
including common behavioural traits, Clinical Trial, Morbidity or Actuarial outcomes –
along with numerous other shared characteristics and common factors Cluster
Analysis attempt to understand and explain those natural group affinities and
geographical distributions using methods such as Causal Layer Analysis (CLA).....
Clustering in “Big Data”

Cluster Types DISCIPLINE CLUSTER TYPE CLUSTERS DIMENSIONS DATA TYPE DATA SOURCE CLUSTERING
FACTORS /
FORCES
Astrophysics 4D Distribution of
Matter across the
Universe through
Space and Time
Star Systems
Stellar Clusters
Galaxies
Galactic Clusters
Mass / Energy
Space / Time
Astronomy Images –
Microwave, Infrared,
Optical, Ultraviolet, Radio,
X-ray, Gamma-ray
Optical Telescope
Infrared Telescope
Radio Telescope
X-ray Telescope
Gravity
Dark Matter
Dark Energy
Dark Flow
Climate Change Temperature Changes
Precipitation Changes
Ice-mass Changes
Hot / Cold
Dry / Wet
More / Less ice
Temperature
Precipitation
Sea / Land Ice
Average Temperature
Average Precipitation
Greenhouse Gases %
Weather Station Data
Ice Core Data
Tree-ring Data
Solar Forcing
Oceanic Forcing
Atmospheric Forcing
Actuarial Science
Morbidity, Clinical
Trials, Epidemiology
Place / Date of birth
Place / Date of death
Cause of Death
Birth / Death
Longevity
Cause of Death
Medical Events
Geography
Time
Biomedical Data
Demographic Data
Geographic data
Register of Births
Register of Deaths
Medical Records
Health
Wealth
Demographics
Price Curves
Economic Modelling
Long-range Forecasting
Economic growth
Economic recession
Bull markets
Bear markets
Monetary Value
Geography
Time
Real (Austrian) GDP
Foreign Exchange Rates
Interest Rates
Price movements
Daily Closing Prices
Government
Central Banks
Money Markets
Stock Exchange
Commodity Exchange
Business Cycles
Economic Trends
Market Sentiment
Fear and Greed
Supply / Demand
Business Clusters Retail Parks
Digital / Fin Tech
Leisure / Tourism
Creative / Academic
Retail
Technology
Resorts
Arts / Sciences
Company / SIC
Geography
Time
Entrepreneurs
Start-ups
Mergers
Acquisitions
Investors
NGAs
Government
Academic Bodies
Capital / Finance
Political policy
Economic policy
Social policy
Elite Team Sports
Performance Science
Winners
Loosens
Team / Athlete
Sport / Club
League Tables
Medal Tables
Sporting Events
Team / Athlete
Sport / Club
Geography
Time
Performance Data
Biomedical Data
Sports Governing Bodies
RSS News Feeds
Social Media
Hawk-Eye
Pro-Zone
Technique
Application
Form / Fitness
Ability / Attitude
Training / Coaching
Speed / Endurance
Future Management Human Activity
Natural Events
Random Events
Waves, Cycles,
Patterns, Trends
Random Events
Geography
Time
Weak Signals
Strong Signals
Wild Card Events
Black Swan Events
Global Internet Content /
Big Data Analytics -
Horizon Scanning,
Tracking and Monitoring
Random Events
Waves, Cycles,
Patterns, Trends,
Extrapolations

Clustering in “Big Data”
• "BIG DATA” ANALYTICS – PROFILING, CLUSTERING and 4D GEOSPATIAL ANALYSIS •
• The profiling and analysis of large aggregated datasets in order to determine a ‘natural’
structure of data relationships or groupings, is an important starting point forming the basis of
many mapping, statistical and analytic applications. Cluster analysis of implicit similarities -
such as time-series demographic or geographic distribution - is a critical technique where no
prior assumptions are made concerning the number or type of groups that may be found, or
their relationships, hierarchies or internal data structures. Geospatial and demographic
techniques are frequently used in order to profile and segment populations by ‘natural’
groupings. Shared characteristics or common factors such as Behaviour / Propensity or
Epidemiology, Clinical, Morbidity and Actuarial outcomes – allow us to discover and explore
previously unknown, concealed or unrecognised insights, patterns, trends or data relationships.
• PREDICTIVE ANALYITICS and EVENT FORECASTING •
• Predictive Analytics and Event Forecasting uses Horizon Scanning, Tracking and Monitoring
methods combined with Cycle, Pattern and Trend Analysis techniques for Event Forecasting
and Propensity Models in order to anticipate a wide range of business. economic, social and
political Future Events – ranging from micro-economic Market phenomena such as forecasting
Market Sentiment and Price Curve movements - to large-scale macro-economic Fiscal
phenomena using Weak Signal processing to predict future Wild Card and Black Swan Events
- such as Monetary System shocks.
•


Cluster Analysis
• Data Representation – Metadata - identifying common Data Objects, Types and Formats
• Data Taxonomy and Classification – Similarity Matrix (labelled data)
– Grouping of explicit data relationships
• Data Audit - given any collection of labelled objects..... – Identifying relationships between discrete data items
– Identifying common data features - values and ranges
– Identifying unusual data features - outliers and exceptions
• Data Profiling and Clustering - given any collection of unlabeled objects..... – Pattern Matrix (unlabelled data)
– Discover implicit data relationships
– Find meaningful groupings in Data (Clusters)
– Predictive Analytics – Baysean Event Forecasting
– Wave-form Analytics – Periodicity, Cycles and Trends
– Explore hidden relationships between discrete data features
Many big data problems feature unlabeled objects

k-means/Gaussian-Mixture Clustering of Audio Segments

Cluster Analysis
Clustering Algorithms
Hundreds of spatial, mathematical and statistical clustering algorithms are available –
many clustering algorithms are “admissible” – but no single algorithm alone is “optimal”
• K-means
• Gaussian mixture models
• Kernel K-means
• Spectral Clustering
• Nearest neighbour
• Latent Dirichlet Allocation
Challenges in “Big Data” Clustering
• Data quality
• Volume – number of data items
• Cardinality – number of clusters
• Synergy – measures of similarity
• Values – outliers and exceptions
• Cluster accuracy - validity and verification
• Homogeneous versus heterogeneous data (structured and unstructured data)

Distributed Clustering Model Performance
Clustering 100,000 2-D points with 2 clusters on 2.3 GHz quad-core Intel Xeon processors, with 8GB memory in intel07 cluster Network communication cost increases with the no. of processors
K-means Kernel K -means

Distributed Clustering Models
Number of processors
Speedup Factor - K-means
Speedup Factor - Kernel K-means
2 1.1 1.3
3 2.4 1.5
4 3.1 1.6
5 3.0 3.8
6 3.1 1.9
7 3.3 1.5
8 1.2 1.5
K-means
Kernel K -means
Clustering 100,000 2-D points with 2 clusters on 2.3 GHz quad-core
Intel Xeon processors, with 8GB memory in intel07 cluster
Network communication cost increases with the no. of processors

Distributed Clustering Model Performance
Distributed Approximate Kernel K-means
2-D data set with 2 concentric circles
2.3 GHz quad-core Intel Xeon processors, with 8GB memory in intel07 cluster
Run-time
Size of dataset (no. of Records)
Benchmark Performance (Speedup Factor )
10K 3.8
100K 4.8
1M 3.8
10M 6.4

HPCC Clustering Models
High Performance / High Concurrence Real-time Delivery (HPCC)

Distributed Clustering Models

Hadoop Clustering and Managing Data.....
Managing Data Transfers in Networked Computer Clusters using Orchestra
To illustrate I/O Bottlenecks, we studied Data Transfer impact in two clustered computing systems: -
Hadoop - using trace from a 3000-node cluster at Facebook
Spark a MapReduce-like framework with iterative machine learning + graph algorithms.
Mosharaf Chowdhury, Matei Zaharia, Justin Ma, Michael I. Jordan, Ion Stoica
University of California, Berkeley
{mosharaf, matei, jtma, jordan, istoica}@cs.berkeley.edu


Clustering and Managing Data.....

Clustering and Managing Data.....
• The differentials between new and old technology has a way of revealing itself by demonstrating what is elastic and dynamic - compared to what is rigid and static. It’s not a measure of which technology is considered to ne good or bad. It simply represents the progression from client/server technology to the Internet-scale, data-driven services that is now gaining such critical momentum.
• Using antonyms helps better correlate what is considered a cloud service and what is not, as well as the relative relationship between an online service like Google Docs as compared to a Microsoft Word document. The differences can help understand the new way IT services are delivered as compared to older methods.
• Randy Bias, founder of Cloudscaling, did a keynote at Interop’s Enterprise Summit two years ago and argued that elasticity is a side effect of cloud computing. He maintained that the infrastructure from which cloud/web scale operations are built - is fundamentally different from mainframes and client/server technologies.
• The big Internet companies have had to create an infrastructure that could scale and be highly efficient and fast. The result: new ways to think of how we manage data.

Clustering and Managing Data.....

Clustering and Managing Data.....
• Hadoop has become popular as a big data platform because it's scalable, flexible,
cost-effective and can handle a range of data types (also known as multi-structured
data) without the data-modelling and transformation stages associated with relational
database technologies. The major drawback, however, is that the options for data
analysis on-the-fly in Hadoop range from the limited (through Hive, for example) to
the exceedingly restricted, slow and complicated (via batch-oriented MapReduce
processing). Plenty of vendors are working on solutions to this problem – notably:-
• EMC claims that its new Pivotal Labs HD distribution now has this problem resolved.
They announced that they have resolved one of the major limitations of the Apache
Hadoop platform by leveraging its Greenplum massively parallel processing (MPP)
database to query the data directly from the Hadoop Distributed File System (HDFS).
• Informatica Vibe
• IBM BigInsights
• Intel HD
• Microsoft HD / Teradata HD (Hortonworks)
• MAPR with MAPR Control System
• SAP HANA Mono-Clustered Big Data Cloud
• AWS EMR
• Cloudera with Impala
• Dataflex Enterprise
• EMC Pivotal HD distribution
• Hortonworks Hcatalog System
• HP HAVEn

Clustering and Managing Data.....
• Cluster computing applications such as Hadoop, Dryad, Swift, Flume and Millwheel transfer massive amounts of data between each of their computational stages. These transfers can have a significant impact on stage performance and throughput - accounting for more than 50% of elapsed job time. Despite this severe impact, there has been relatively little work done on optimizing the performance of these data transfers - with networking researchers traditionally focusing on data-flow traffic management.
• The Orchestra solution addresses this limitation by proposing a global management architecture and a set of algorithms that, in preliminary findings, are able to: - 1. Improve the transfer times of common data communication patterns - such as
broadcast and shuffle 2. Allow scheduling policies at the transfer level, such as prioritizing a nominated
transfers over other jobs - using a prototype implementation, 3. It may even be possible that the Berkley solution could improve broadcast completion
times by as much as 4 or 5 - compared to the mean times achieved using Hadoop.
• Orchestra may also be possible to demonstrate that transfer-level scheduling can
reduce the completion time of high-priority transfers by a factor of up to 1:7

Clustering and Managing Data.....
• EMC calls its integration of the Greenplum database into Hadoop HAWQ, and a key
advantage of the combination is that it brings standard SQL querying to Hadoop. That's
a contrast with the Hive component of Hadoop, which uses a SQL-like approach to
support only a limited subset -- roughly 30%, by some estimates -- of standard SQL
queries. What's more, HAWQ is 100 times to 600 times faster than Hive, according to
EMC, because it doesn't require the SQL to be converted and executed as MapReduce
jobs. Query response times are said to be in line with current BI and data warehousing
service levels, and the distribution is compatible with both conventional BI and analytics
platforms and emerging big-data analytics platforms such as Datameer, Karmasphere
and Platfora.
• "It's really cool to start seeing folks using a multi-structured data store as the storage
layer for SQL-based analysis," said John Myers, senior analyst at Enterprise
Management Associates, in an interview with Information Week. The combination will
enable companies to use Hadoop as a single platform for both structured and multi-
structured data, essentially combining data warehouses and Hadoop, Myers said. With
HAWQ, business users and analysts can use conventional SQL querying and BI tools for
their work while data scientist can continue to access date directly using programming
APIs and Hadoop-related tools such as MapReduce, Pig, Hive, Scoup and Mahout.

Clustering and Managing Data.....
• While in large part successful, these solutions have so far been focusing on scheduling
and managing computation and storage resources, whilst mostly ignoring network
resources. The Berkley solution for Managing Data Transfers in Networked Computer
Clusters is Orchestra.
• In the last decade we have seen rapid growth of cluster computing frameworks – in order
to analyze the increasing amounts of data collected and generated by web services like
Google, Facebook and Yahoo!. Hadoop frameworks (e.g., MapReduce , Dryad, CIEL and
Spark) typically implement a data-flow computation model - where a series of datasets
pass sequentially through a set of processing stages.
• Many jobs deployed in these frameworks manipulate massive amounts of data and run on
clusters consisting of as many as tens of thousands of machines. Due to the very high
cost of these clusters, operators often aim to maximize the cluster utilization, while
accommodating a variety of applications, workloads, and user requirements. To achieve
these goals, several solutions have recently been proposed to reduce job completion time
utilising these clusters. Operators often aim to maximize the cluster utilization, whilst
accommodating a variety of applications, workloads, and user requirements. To achieve
these goals, several solutions have recently been proposed in order to reduce job
completion time.

Clustering and Managing Data.....
• However, managing and optimizing network activity is critical for improving job
performance. Indeed, Hadoop traces from a 3000-node cluster at Facebook
showed that, on average, transferring data between successive stages
accounts for 33% of the running times of jobs with reduce phases. Existing
proposals for full bisection bandwidth networks along with flow-level scheduling
can improve network performance, but they do not account for collective
behaviours of flows due to the lack of job-level semantics.
• The Berkley solution, Orchestra, is a global control architecture to manage
intra- and inter-transfer activities. In Orchestra, data movement within each
transfer is coordinated by a Transfer Controller (TC), which continuously
monitors the transfer and updates the set of sources associated with each
destination. For broadcast transfers, we propose a TC that implements an
optimized Bit-torrent-like protocol called Cornet, augmented by an adaptive
clustering algorithm to take advantage of the hierarchical network topology in
many data-centres. For shuffle transfers, we propose an optimal algorithm
called Weighted Shuffle Scheduling (WSS), and we provide key insights into
the performance of Hadoop’s shuffle implementation.

Clustering and Managing Data.....
• In this article, we argue that to maximize job performance, we need to optimize
at the highly granular level of data transfers - instead of individual data flows.
We define a transfer as the set of all flows transporting data between two
stages of a job. In frameworks like MapReduce and Dryad, a stage cannot
complete (or sometimes even start) before it receives all the data from the
previous stage. Thus, the job running time depends on the time it takes to
complete the entire transfer, rather than the duration of individual flows
comprising it. To this end, we focus on two transfer patterns that occur in
virtually all cluster computing frameworks and are responsible for most of the
network traffic in these clusters: shuffle and broadcast.
• Shuffle captures the many-to-many communication pattern between the “Map”
and “Reduce” stages in MapReduce, and between Dryad’s stages. Broadcast
captures the one-to-many communication pattern employed by iterative
optimization algorithms - as well as fragment-replicate joins in Hadoop.

Clustering and Managing Data.....
• In order to illustrate I/O Bottlenecks, we studied Data Transfer impact in two different
clustered computing systems: -
– Hadoop - using trace from a 3000-node cluster at Facebook
– Spark - a MapReduce-like framework with iterative machine learning + graph algorithms.
• Typically, large computer clusters are multi-user environments where hundreds of jobs run simultaneously. As a result, there are usually multiple concurrent data transfers. In existing clusters, without any transfer-aware supervising mechanism in place, flows from each transfer get some share of the network as allocated by TCP’s proportional sharing. However, this approach can lead to extended transfer completion times and inflexibility in enforcing scheduling policies{ -
– Scheduling policies: Suppose that a high-priority job, such as a report for a key customer, is
submitted to a MapReduce cluster. A cluster scheduler like Quincy [29] may quickly assign
CPUs and memory to the new job, but the job’s flows will still experience fair sharing with
other jobs’ flows at the network level.
– Completion times: Suppose that three jobs start shuffling equal amounts of data at the same
time. With fair sharing among the flows, the transfers will all complete in time 3t, where t is the
time it takes one shuffle to finish uncontested. In contrast, with FIFO scheduling across
transfers, it is well-known that the transfers will finish faster on average, at times t, 2t and 3t
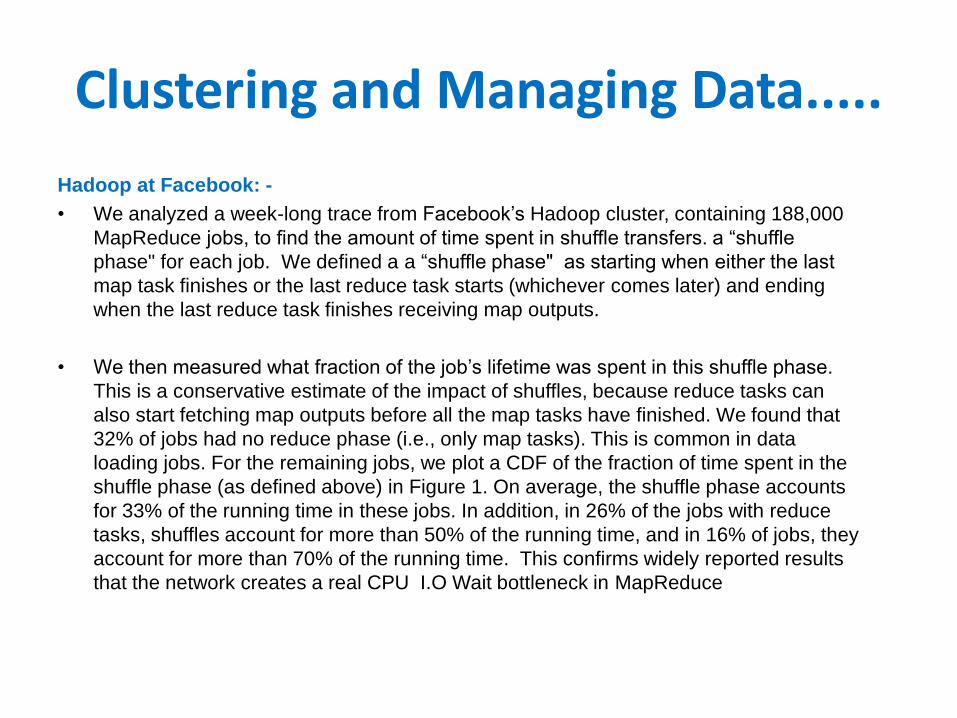
Clustering and Managing Data.....
Hadoop at Facebook: -
• We analyzed a week-long trace from Facebook’s Hadoop cluster, containing 188,000
MapReduce jobs, to find the amount of time spent in shuffle transfers. a “shuffle
phase" for each job. We defined a a “shuffle phase" as starting when either the last
map task finishes or the last reduce task starts (whichever comes later) and ending
when the last reduce task finishes receiving map outputs.
• We then measured what fraction of the job’s lifetime was spent in this shuffle phase.
This is a conservative estimate of the impact of shuffles, because reduce tasks can
also start fetching map outputs before all the map tasks have finished. We found that
32% of jobs had no reduce phase (i.e., only map tasks). This is common in data
loading jobs. For the remaining jobs, we plot a CDF of the fraction of time spent in the
shuffle phase (as defined above) in Figure 1. On average, the shuffle phase accounts
for 33% of the running time in these jobs. In addition, in 26% of the jobs with reduce
tasks, shuffles account for more than 50% of the running time, and in 16% of jobs, they
account for more than 70% of the running time. This confirms widely reported results
that the network creates a real CPU I.O Wait bottleneck in MapReduce

Hadoop Framework

“Big Data” Applications • Science and Technology
– Pattern, Cycle and Trend Analysis
– Horizon Scanning, Monitoring and Tracking
– Weak Signals, Wild Cards, Black Swan Events
• Multi-channel Retail Analytics – Customer Profiling and Segmentation
– Human Behaviour / Predictive Analytics
• Global Internet Content Management
– Social Media Analytics
– Market Data Management
– Global Internet Content Management
• Smart Devices and Smart Apps
– Call Details Records
– Internet Content Browsing
– Media / Channel Selections
– Movies, Video Games and Playlists
• Broadband / Home Entertainment
– Call Details Records
– Internet Content Browsing
– Media / Channel Selections
– Movies, Video Games and Playlists
• Smart Metering / Home Energy
– Energy Consumption Details Records
• Civil and Military Intelligence Digital Battlefields of the Future – Data Gathering
Future Combat Systems - Intelligence Database
Person of Interest Database – Criminal Enterprise,
Political organisations and Terrorist Cell networks
Remote Warfare - Threat Viewing / Monitoring /
Identification / Tracking / Targeting / Elimination
HDCCTV Automatic Character/Facial Recognition
• Security Security Event Management - HDCCTV, Proximity
and Intrusion Detection, Motion and Fire Sensors
Emergency Incident Management - Response
Services Command, Control and Co-ordination
• Biomedical Data Streaming Care in the Community
Assisted Living at Home
Smart Hospitals and Clinics
• Internet of Things (IOT) SCADA Remote Sensing, Monitoring and Control
Smart Grid Data (machine generated data)
Vehicle Telemetry Management
Intelligent Building Management
Smart Homes Automation

Comparing Data in RDBMS, Appliances and Hadoop
RDBMS DWH DWH Appliance Hadoop Cluster
Data size Gigabytes Terabytes Petabytes
Access Interactive and batch Interactive and batch Batch
Structure Fixed schema Fixed schema Unstructured schema
Language SQL SQL Non-procedural Languages
(NoSQL, Hive, Pig, etc)
Data Integrity High High Low
Architecture Shared memory - SMP Shared nothing - MPP Hadoop DFS
Virtualisation Partitions / Regions MPP / Nodal MPP / Clustered
Scaling Nonlinear Nodal / Linear Clustered / Linear
Updates Read and write Write once, read many Write once, read many
Selects Row-based Set-based Column-based
Latency Low – Real-time Low – Near Real-time High – Historic Information
Figure 1: Comparing RDBMS to MapReduce

“Big Data” – Analysing and Informing
• “Big Data” is now a torrent raging through every aspect of the global economy – both the
public sector and private industry. Global enterprises generate enormous volumes of
transactional data – capturing trillions of bytes of information from the internal and
external environment. Data Sources include Social Media, Internet Content, Remote
Sensors, Monitors and Controllers, and transactions from their own internal business
operations – global markets. supply chain, business partners, customers and suppliers.
1. SENSE LAYER – Remote Monitoring and Control Devices – WHAT and WHEN?
2. COMMUNICATION LAYER – Mobile Enterprise Platforms (3G / WiFi + 4G / LTE) – VIA ?
3. SERVICE LAYER – 4D Geospatial / Real-time / Predictive Analytics – WHY?
4. GEO-DEMOGRAPHIC LAYER – Social Media, People and Places – WHO and WHERE ?
5. INFORMATION LAYER – “Big Data” and Internet Content data set “mashing” – HOW ?
6. INFRASTRUCTURE LAYER – Cloud Services / Hadoop Clusters / GPGPUs / SSDs

“Big Data” – Analysing and Informing
SERVICE LAYER – 4D Geospatial / Real-time / Predictive Analytics – WHY?
GEO-DEMOGRAPHIC LAYER – People and Places – WHO and WHERE?
INFORMATION LAYER – “Big Data” Analytics MapReduce / Data Set “mashing” – HOW?
INFRASTRUCTURE LAYER – Cloud Service Platforms Hadoop Clusters / GPGPUs / SSDs
SENSE LAYER – Remote Monitoring and Control Devices – WHAT and WHEN ?
COMMUNICATION LAYER – Mobile Enterprise Platforms (3G / WiFi + 4G / LTE) – VIA ?

“Big Data” – Analysing and Informing
• SENSE LAYER – Remote Monitoring and Control – WHAT and WHEN? – Remote Sensing – Sensors, Monitors, Detectors, Smart Appliances / Devices
– Remote Viewing – Satellite. Airborne, Mobile and Fixed HDCCTV
– Remote Monitoring, Command and Control – SCADA
• COMMUNICATION LAYER – Mobile Enterprise Platforms and the Smart Grid – Connectivity - Smart Devices, Smart Apps, Smart Grid
– Integration - Mobile Enterprise Application Platforms (MEAPs)
– Backbone – Wireless and Optical Next Generation Network (NGE) Architectures
• SERVICE LAYER – Real-time Analytics – WHY? – Global Mapping and Spatial Analysis
– Service Aggregation, Intelligent Agents and Alerts
– Data Analysis, Data Mining and Statistical Analysis
– Optical and Wave-form Analysis and Recognition, Pattern and Trend Analysis
– Big Data - Hadoop Clusters / GPGPUs / SSDs

“Big Data” – Analysing and Informing
SERVICE LAYER – 4D Geospatial / Real-time / Predictive Analytics – WHY?
COMMUNICATION LAYER – Mobile Enterprise Platforms – VIA ?
Market Survey Data TV Set-top Box
Channel Selections Smart App
Playlists
Geographic &
Demographic
Survey Data
Entertainment Factory Office &
Warehouse
Wearable &
Personal
Technology
Transport Public Buildings Smart
Homes
Public house
Mall, Shop,
Store
Smart
Kiosks &
Cubicles
Mobile
Smart
Apps
CCTV /
ANPR
Social Intelligence
Campaign Management
e-Business Smart Apps
Big Data Analytics The Pyramid™
Customer Loyalty
& Brand Affinity
The Pyramid™ Analytics
Smart Apps
INFRASTRUCTURE LAYER – Cloud Services Hadoop Clusters / GPGPUs / SSDs
SENSE LAYER – Remote Monitoring, Data and Control Devices – WHAT and WHEN ?

“Big Data” – Analysing and Informing
• GEO-DEMOGRAPHIC LAYER – People and Places – WHO and WHERE? – Person and Social Network Directories - Personal and Social Media Data
– Location and Property Gazetteers - Building Information Models (BIM)
– Mapping and Spatial Analysis - Topology, Landscape, Global Positioning Data
• INFORMATION LAYER – “Big Data” and Data Set “mashing” – HOW? – Content – Structured and Unstructured Data and Content
– Information – Atomic Data, Aggregated, Ordered and Ranked Information
– Transactional Data Streams – Smart Devices, EPOS, Internet, Mobile Networks
• INFRASTRUCTURE LAYER – Cloud Service Platforms – Cloud Models – Public, Private, Mixed / Hybrid, Enterprise, Secure and G-Cloud
– Infrastructure – Network, Storage and Servers
– Applications – COTS Software, Utilities, Enterprise Services
– Security – Principles, Policies, Users, Profiles and Directories, Data Protection

“DATA SCIENCE” – my own special area of Business expertise
Targeting – Split / Map / Shuffle / Reduce
Consume – End-User Data
Data Provisioning – High-Volume Data Flows
– Mobile Enterprise Platforms (MEAP’s)
Apache Hadoop Framework
HDFS, MapReduce, Metlab “R”
Autonomy, Vertica
Smart Devices
Smart Apps
Smart Grid
Clinical Trial, Morbidity and Actuarial Outcomes
Market Sentiment and Price Curve Forecasting
Horizon Scanning,, Tracking and Monitoring
Weak Signal, Wild Card and Black Swan Event Forecasting
– Data Delivery and Consumption
News Feeds and Digital Media
Global Internet Content
Social Mapping
Social Media
Social CRM
– Data Discovery and Collection
– Analytics Engines - Hadoop
– Data Presentation and Display Excel
Web
Mobile
– Data Management Processes Data Audit
Data Profile
Data Quality Reporting
Data Quality Improvement
Data Extract, Transform, Load
– Performance Acceleration GPU’s – massive parallelism
SSD’s – in-memory processing
DBMS – ultra-fast data replication
– Data Management Tools DataFlux
Embarcadero
Informatica
Talend
– Info. Management Tools Business Objects
Cognos
Hyperion
Microstrategy
Biolap
Jedox
Sagent
Polaris
Teradata
SAP HANA
Netezza (now IBM)
Greenplum (now Pivotal)
Extreme Data xdg
Zybert Gridbox
– Data Warehouse Appliances
Ab Initio
Ascential
Genio
Orchestra
The Emerging “Big Data” Stack
Information Management Strategy
Data Acquisition Strategy

Big Data – Process Overview
Analytics
Big Data Management
Big Data Provisioning
Big Data Platform
Big Data Consumption
Data Stream
Data Scientists Data Architects
Data Analysts
Big Data Administration
Revenue Stream
Data Administrators
Data Managers
Hadoop Platform Engineering Team
Insights

Split-Map-Shuffle-Reduce Process
Big Data Consumers
Split Map Shuffle Reduce
Key / Value Pairs Actionable Insights Data Provisioning Raw Data

Big Data – Products
The MapReduce technique has spilled over into many other disciplines that process vast
quantities of information including science, industry, and systems management. The Apache
Hadoop Library has become the most popular implementation of MapReduce – with
framework implementations from Cloudera, Hortonworks and MAPR

Apache Hadoop Component Stack
HDFS
MapReduce
Pig
Zookeeper
Hive
HBase
Oozie
Mahoot
Hadoop Distributed File System (HDFS)
Scalable Data Applications Framework
Procedural Language – abstracts low-level MapReduce operators
High-reliability distributed cluster co-ordination
Structured Data Access Management
Hadoop Database Management System
Job Management and Data Flow Co-ordination
Scalable Knowledge-base Framework

Data Management Component Stack
Informatica
Drill
Millwheel
Informatica Big Data Edition / Vibe Data Stream
Data Analysis Framework
Data Analytics on-the-fly + Extract – Transform – Load Framework
Flume
Sqoop
Scribe
Extract – Transform - Load
Extract – Transform - Load
Extract – Transform - Load
Talend Extract – Transform - Load
Pentaho Extract – Transform – Load Framework + Data Reporting on-the-fly

Big Data Storage Platforms
Autonomy
Vertica
MongoDB
HP Unstructured Data DBMS
HP Columnar DBMS
High-availability DBMS
CouchDB Couchbase Database Server for Big Data with NoSQL / Hadoop
Integration
Pivotal Pivotal Big Data Suite – GreenPlum, GemFire, SQLFire, HAWQ
Cassandra Cassandra Distributed Database for Big Data with NoSQL and
Hadoop Integration
NoSQL NoSQL Database for Oracle, SQL/Server, Couchbase etc.
Riak Basho Technologies Riak Big Data DBMS with NoSQL / Hadoop
Integration

Big Data Analytics Engines and Appliances
Alpine
Karmasphere
Kognito
Alpine Data Studio - Advanced Big Data Analytics
Karmasphere Studio and Analyst – Hadoop Customer Analytics
Kognito In-memory Big Data Analytics MPP Platform
Skytree
Redis
Skytree Server Artificial Intelligence / Machine Learning Platform
Redis is an open source key-value database for AWS, Pivotal etc.
Teradata Teradata Appliance for Hadoop
Neo4j Crunchbase Neo4j - Graphical Database for Big Data
InfiniDB Columnar MPP open-source DB version hosted on GitHub
Big Data Analytics Engines / Appliances

Big Data Analytics and Visualisation Platforms
Tableaux Tableaux - Big Data Visualisation Engine
Eclipse Symentec Eclipse - Big Data Visualisation
Mathematica Mathematical Expressions and Algorithms
StatGraphics Statistical Expressions and Algorithms
FastStats Numerical computation, visualization and programming toolset
MatLab
R
Data Acquisition and Analysis Application Development Toolkit
“R” Statistical Programming / Algorithm Language
Revolution Revolution Analytics Framework and Library for “R”

Hadoop / Big Data Extended Infrastructure Stack
SSD Solid State Drive (SSD) – configured as cached memory / fast HDD
CUDA CUDA (Compute Unified Device Architecture)
GPGPU GPGPU (General Purpose Graphical Processing Unit Architecture)
IMDG IMDG (In-memory Data Grid – extended cached memory)
Vibe
Splunk
High Velocity / High Volume Machine / Automatic Data Streaming
High Velocity / High Volume Machine / Automatic Data Streaming
Ambari High-availability distributed cluster co-ordination
YARN Hadoop Resource Scheduling
Big Data Extended Architecture Stack

Cloud-based Big-Data-as-a-Service and Analytics
AWS Amazon Web Services (AWS) – Big Data-as-a-Service (BDaaS)
Elastic Compute Cloud (ECC) and Simple Storage Service (S3)
1010 Data Big Data Discovery, Visualisation and Sharing Cloud Platform
SAP HANA SAP HANA Cloud - In-memory Big Data Analytics Appliance
Azure Microsoft Azure Data-as-a-Service (DaaS) and Analytics
Anomaly 42 Anomaly 42 Smart-Data-as-a-Service (SDaaS) and Analytics
Workday Workday Big-Data-as-a-Service (BDaaS) and Analytics
Google Cloud Google Cloud Platform – Cloud Storage, Compute Platform,
Firebrand API Resource Framework
Apigee Apigee API Resource Framework

Data Warehouse Appliance / Real-time Analytics Engine Price Comparison
Manufacturer Server
Configuration Cached Memory
Server
Type
Software
Platform Cost (est.)
SAP HANA 32-node (4
Channels x 8 CPU)
1.3 Terabytes
SMP Proprietary $ 6,000,,000
Teradata 20-node (2
Channels x 10 CPU)
1 Terabyte
MPP Proprietary $ 1,000,000
Netezza
(now IBM)
20-node (2
Channels x 10 CPU)
1 Terabyte
MPP Proprietary $ 180,000
IBM ex5 (non-HANA
configuration)
32-node (4
Channels x 8 CPU)
1.3 Terabytes
SMP Proprietary $ 120,000
Greenplum (now
Pivotal)
20-node (2
Channels x 10 CPU)
1 Terabyte
MPP Open Source $ 20,000
XtremeData xdb
(BO BW)
20-node (2
Channels x 10 CPU)
1 Terabyte
MPP Open Source $ 18,000
Zybert Gridbox 48-node (4
Channels x 12 CPU)
20 Terabytes
SMP Open Source $ 60,000

Apache Hadoop - Framework Distributions
FEATURE Hortonworks Teradata Hadoop
Cloudera MAPR Pivotal
Open Source Hadoop Library Hcatalog (Hortonworks) Impala MAPR HD
Support Yes Yes Yes Yes Yes
Professional Services Yes Yes Yes Yes Yes
Catalogue Extensions Yes Yes Yes Yes Yes
Management Extensions Yes Yes Yes
Architecture Extensions Yes Yes
Infrastructure Extensions Yes Yes
Teradata Cloudera MAPR Pivotal HD
Library
Support
Services
Catalogue
Management
Library
Support
Services
Catalogue
Library
Support
Services
Catalogue
Management
Resilience
Availability
Performance
Library
Support
Services
Catalogue
Management
Resilience
Availability
Performance
Library
Support
Services
Catalogue
Hortonworks
Cloudera with Impala
EMC Pivotal HD distribution
Hortonworks Hcatalog System
MAPR with MAPR Control System

Gartner Magic Quadrant for BI and Analytics Platforms

Apache Hadoop - Framework Distributions
FEATURE Intel Hadoop
Microsoft HD Hindsight
Informatica Vibe
IBM BigInsights
DataStax Enterprise
Open Source Hadoop Library Distribution (Hortonworks) Vibe Symphony Analytics
Support Yes Yes Yes Yes Yes
Professional Services Yes Yes Yes Yes Yes
Catalogue Extensions Yes Yes Yes Yes Yes
Management Extensions Yes Yes Yes
Architecture Extensions Yes Yes
Infrastructure Extensions Yes Yes
Hortonworks Vibe Symphony
Library
Support
Services
Catalogue
Management
Library
Support
Services
Catalogue
Library
Support
Services
Catalogue
Management
Resilience
Availability
Performance
Library
Support
Services
Catalogue
Intel Hadoop DataStax
Library
Support
Services
Catalogue
Management
Resilience
Availability
Performance
Intel HD
Microsoft HD
IBM BigInsights
Informatica Vibe
DataStax Enterprise

Gartner Magic Quadrant for BI

Apache Hadoop – Cloud Hadoop Platforms
FEATURE HP HAVEn Oracle BDA AWS EMR SAP HANA Mono-Clustered Big Data Cloud Solution
Open Source Hadoop Library HP HAVEn (Cloudera) Elastic MapReduce
SAP Cloud for Analytics
SAP HANA on premise
Support Yes Yes Yes Yes Yes
Professional Services Yes Yes Yes Yes Yes
Catalogue Extensions Yes Yes Yes Yes Yes
Management Extensions Yes Yes Yes Yes
Architecture Extensions Yes Yes Yes Yes
Infrastructure Extensions Yes Yes Yes Yes
SAP HANA
Library
Support
Services
Catalogue
HP HAVEn AWS EMR
HP HAVEn
Oracle BDA
AWS EMR
SAP HANA Mono-Clustered
Big Data Cloud Solution
SAP HANA Oracle BDA
Library
Support
Services
Catalogue
Management

HP HAVEn Big Data Platform

IBM BigInsights
IBM Platform Symphony: - Parallel Computing and Application Grid management solution

Informatica / Hortonworks Vibe

Telco 2.0 “Big Data” Analytics Architecture

SAP HANA Hortonworks Real-time Big Data Architecture

Hadoop Framework
Dion Hinchcliffe
10 Ways To Complement the Enterprise RDBMS Using Hadoop
The Insider's Guide to Next-Generation BPM

Hadoop Framework
• The workhorse relational database has been the tool of choice for businesses for well over 20 years now. Challengers have come and gone but the trusty RDBMS is the foundation of almost all enterprise systems today. This includes almost all transactional and data warehousing systems. The RDBMS has earned its place as a proven model that, despite some quirks, is fundamental to the very integrity and operational success of IT systems around the world.
• The relational database is finally showing some signs of age as data volumes and network speeds grow faster than the computer industry's present compliance with Moore's Law can keep pace with. The Web in particular is driving innovation in new ways of processing information as the data footprints of Internet-scale applications become prohibitive using traditional SQL database engines.
• When it comes to database processing today, change is being driven by (at least) four factors:
– Speed. The seek times of physical storage is not keeping pace with improvements in network speeds.
– Scale. The difficulty of scaling the RDBMS out efficiently (i.e. clustering beyond a handful of servers is notoriously hard.)
– Integration. Today's data processing tasks increasingly have to access and combine data from many different non-relational sources, often over a network.
– Volume. Data volumes have grown from tens of gigabytes in the 1990s to hundreds of terabytes and often petabytes in recent years.

Targeting – Map / Reduce
Consume – End-User Data
Data Acquisition – High-Volume
– Mobile Enterprise Platforms (MEAP’s)
– Data Delivery and Consumption
– Data Discovery and Collection
– Analytics Engines - Hadoop
– Data Management Processes
– Performance Acceleration
Apache Hadoop Framework HDFS, MapReduce, Metlab “R” Autonomy, Vertica
Smart Devices Smart Apps Smart Grid
Clinical Trial, Morbidity and Actuarial Outcomes Market Sentiment and Price Curve Forecasting Horizon Scanning,, Tracking and Monitoring Weak Signal, Wild Card and Black Swan Event Forecasting
News Feeds and Digital Media Global Internet Content Social Mapping Social Media Social CRM
Data Audit Data Profile Data Quality Reporting Data Quality Improvement Data Extract, Transform, Load
GPU’s – massive parallelism SSD’s – in-memory processing DBMS – ultra-fast data replication
– Data Presentation and Display
– Data Management Tools
– Info. Management Tools
– Data Warehouse Appliances
Excel Web Mobile
DataFlux Embarcadero Informatica Talend
Business Objects Cognos Hyperion Microstrategy
Biolap Jedox Sagent Polaris
Teradata SAP HANA Netezza (now IBM) Greenplum (now EMC2) Extreme Data xdg Zybert Gridbox
Ab Initio Ascential Genio Orchestra

Hadoop Framework
• These datasets would previously have been very challenging and expensive to take on with a traditional RDBMS using standard bulk load and ETL approaches. Never mind trying to efficiently combining multiple data sources simultaneously or dealing with volumes of data that simply can't reside on any single machine (or often even dozens). Hadoop deals with this by using a distributed file system (HDFS) that's designed to deal coherently with datasets that can only reside across distributed server farms. HDFS is also fault resilient and so doesn't impose the overhead of RAID drives and mirroring on individual nodes in a Hadoop compute cluster, allowing the use of truly low cost commodity hardware.
• So what does this specifically mean to enterprise users that would like to improve their data processing capabilities? Well, first there are some catches to be aware of. Despite enormous strengths in distributed data processing and analysis, MapReduce is not good in some key areas that the RDMS is extremely strong in (and vice versa). The MapReduce approach tends to have high latency (i.e. not suitable for real-time transactions) compared to relational databases and is strongest at processing large volumes of write-once data where most of the dataset needs to be processed at one time. The RDBMS excels at point queries and updates, while MapReduce is best when data is written once and read many times.
• The story is the same with structured data, where the RDBMS and the rules of database normalization identified precise laws for preserving the integrity of structured data and which have stood the test of time. MapReduce is designed for a less structured, more federated world where schemas may be used but data formats can be much looser and freeform.

Big Data – Process Overview
Big Data Analytics
Big Data Management
Big Data Provisioning
Big Data Platform
Big Data Consumption
Data Stream
Data Scientists Data Architects
Data Analysts
Big Data Administration
Revenue Stream
Data Administrators
Data Managers
Hadoop Platform Team
Insights

Hadoop Framework
• Each of these factors is presently driving interest in alternatives that are significantly better at dealing with these requirements. I'll be clear here: The relational database has proven to be incredibly versatile and is the right tool for the majority of business needs today. However, the edge cases for many large-scale business applications are moving out into areas where the RDBMS is often not the strongest option. One of the most discussed new alternatives at the moment is Hadoop, a popular open source implementation of MapReduce. MapReduce is a simple yet very powerful method for processing and analyzing extremely large data sets, even up to the multi-petabyte level. At its most basic, MapReduce is a process for combining data from multiple inputs (creating the "map"), and then reducing it using a supplied function that will distill and extract the desired results. It was originally invented by engineers at Google to deal with the building of production search indexes. The MapReduce technique has since spilled over into other disciplines that process vast quantities of information including science, industry, and systems management. For its part, Hadoop has become the leading implementation of MapReduce.
• While there are many non-relational database approaches out there today (see my emerging IT and business topics post for a list), nothing currently matches Hadoop for the amount of attention it's receiving or the concrete results that are being reported in recent case studies. A quick look at thelist of organizations that have applications powered by Hadoop includes Yahoo! with over 25,000 nodes (including a single, massive 4,000 node cluster), Quantcast which says it has over 3,000 cores running Hadoop and currently processes over 1PB of data per day, and Adknowledge who uses Hadoop to process over 500 million clickstream events daily using up to 200 nodes

Split-Map-Shuffle-Reduce Process
Big Data Consumers
Split Map Shuffle Reduce
Key / Value Pairs Actionable Insights Data Provisioning Raw Data
Data Stream
Insights

RDBMS and Hadoop: Apples and Oranges?
• Above is Figure 1 - a comparison of the overall differences between the RDBMS and MapReduce-based systems such as Hadoop
• From this it's clear that the MapReduce model cannot replace the traditional enterprise RDBMS. However, it can be a key enabler of a number of interesting scenarios that can considerably increase flexibility, turn-around times, and the ability to tackle problems that weren't possible before.
• With the latter the key is that SQL-based processing of data tends not to scale linearly after a certain ceiling, usually just a handful of nodes in a cluster. With MapReduce, you can consistently get performance gains by increasing the size of the cluster. In other words, double the size of Hadoop cluster and a job will run twice as fast, triple it and the same thing, etc.

Ten Ways To Improve the RDBMS with Hadoop
So Hadoop can complement the enterprise RDMS in a number of powerful ways. These include: -
1. Accelerating nightly batch business processes. Many organizations have production transaction systems that require nightly processing and have narrow windows to perform their calculations and analysis before the start of the next day. Since Hadoop can scale linearly, this can enable internal or external on-demand cloud farms to dynamically handle shrink performance windows and take on larger volume situations that an RDBMS just can't easily deal with. This doesn't elide the import/export challenges depending on the application but can certainly compress the windows between them.
2. Storage of extremely high volumes of enterprisedata. The Hadoop Distributed File System is a marvel in itself and can be used to hold extremely large data sets safely on commodity hardware long term that otherwise couldn't stored or handled easily in a relational database. I am specifically talking about volumes of data that today's RDBMS's would still have trouble with, such as dozens or hundreds of petabytes and which are common in genetics, physics, aerospace, counter intelligence and other scientific, medical, and government applications.
3. Creation of automatic, redundant backups. Hadoop can then keep the data that it processes, even after it it's been imported into other enterprise systems. HDFS creates a natural, reliable, and easy-to-use backup environment for almost any amount of data at reasonable prices considering that it's essentially a high-speed online data storage environment.


Ten Ways To Improve the RDBMS with Hadoop
So Hadoop can complement the enterprise RDMS in a number of powerful ways. These include: -
4. Improving the scalability of applications. Very low cost commodity hardware can be used to power Hadoop clusters since redundancy and fault resistance is built into the software instead of using expensive enterprise hardware or software alternatives with proprietary solutions. This makes adding more capacity (and therefore scale) easier to achieve and Hadoop is an affordable and very granular way to scale out instead of up. While there can be cost in converting existing applications to Hadoop, for new applications it should be a standard option in the software selection decision tree. Note: Hadoop's fault tolerance is acceptable, not best-of-breed, so check this against your application's requirements.
5. Use of Java for data processing instead of SQL. Hadoop is a Java platform and can be used by just about anyone fluent in the language (other language options are coming available soon via APIs.) While this won't help shops that have plenty of database developers, Hadoop can be a boon to organizations that have strong Java environments with good architecture, development, and testing skills. And while yes, it's possible to use languages such as Java and C++ to write stored procedures for an RDBMS, it's not a widespread activity.
6. Producing just-in-time feeds for dashboards and business intelligence.Hadoop excels at looking at enormous amounts of data and providing detailed analysis of business data that an RDBMS would often take too long or would be too expensive to carry out. Facebook, for example, uses Hadoop for daily and hourly summaries of its 150 million+ monthly visitors. The resulting information can be quickly transferred to BI, dashboards, or mashup platforms.

Informatica / Hortonworks Vibe

Ten Ways To Improve the RDBMS with Hadoop
So Hadoop can complement the enterprise RDMS in a number of powerful ways. These include: -
7. Handling urgent, ad hoc requests for data. While certainly expensive enterprise data warehousing software can do this, Hadoop is a strong performer when it comes to quickly asking and getting answers to urgent questions involving extremely large datasets.
8. Turning unstructured data into relational data. While ETL tools and bulk load applications work well with smaller datasets, few can approach the data volume and performance that Hadoop can, especially at a similar price/performance point. The ability to take mountains of inbound or existing business data, spread the work over a large distributed cloud, add structure, and import the result into an RDBMS makes Hadoop one of the most powerful database import tools around.
9. Taking on tasks that require massive parallelism. Hadoop has been known to scale out to thousands of nodes in production environments. Even better, It requires relatively little innate programing skill to achieve since parallelism is an intrinsic property of the platform. While you can do the same with SQL, it requires some skill and experience with the techniques. In other words, you have to know what you're doing. For organizations that are experiencing ceilings with their current RDBMS, you can look at Hadoop to help break through them.
10. Moving existing algorithms, code, frameworks, and components to a highly distributed computing environment. Done right -- and there are challenges depending on what your legacy code wants to do -- and Hadoop can be used as a way to migrate old, single core code into a highly distributed environment to provide efficient, parallel access to ultra-large datasets. Many organizations already have proven code that is tested and hardened and ready to use but is limited without an enabling framework. Hadoop adds the mature distributed computing layer than can transition these assets to a much larger and more powerful modern environment.

• EMC has announced that it has resolved one of the big limitations of the Apache Hadoop platform by finding a way to use its Greenplum massively parallel processing (MPP) database appliance to directly query data in the Hadoop Distributed File System (HDFS).

Introduction to Hadoop HDFS
• The core Hadoop project solves two problems with big data – fast, reliable storage and batch processing. We are going to focus on the default storage engine and how to integrate with it using its REST API. Hadoop is actually quite easy to install so let’s see what we can do in 15 minutes. I’ve assumed some knowledge of the Unix shell but hopefully it’s not too difficult to follow – the software versions are listed in the previous post.
• If you’re completely new to Hadoop three things worth knowing are: -
– The default storage engine is HDFS – a distributed file system with directories and files
– Data written to HDFS is immutable – although there is some support for appends
– HDFS is suited for large files – avoid lots of small files
• If you think about batch processing billions of records, large and immutable files make sense. You don’t want the disk spending time doing random access and dealing with fragmented data if you can stream the whole lot from beginning to end.
• Files are split in to blocks so that nodes can process files in parallel using map-reduce. By default a Hadoop cluster will replicate each file block to 3 nodes and each file block can take up to the configured block size (~64M).
• Starting up a local Hadoop instance for development is pretty simple and even easier as we’re only going to start half of it. The only setting that’s needed is the host and port where the HDFS master ‘namenode’ will exist but we’ll add a property for the location of the file system too.


Intel reveals its own Apache Hadoop
• Like EMC and Hewlett-Packard, the overarching idea behind Intel's Hadoop distribution
is to exploit massive amounts of big data for the purpose of enabling better business
decisions while also identifying potential security threats more quickly.
• The big picture for Intel is to beef up its portfolio for the data centre – both analytics and
offering a framework that can connect and manage multiple distributed devices across
an entire enterprise infrastructure landscape in a scalable manner.
• Intel is framing its deployment of the open source software framework as a ground-up
approach by baking Hadoop directly into the silicon level. The Santa Clara, California -
based corporation explained that it is utilizing Hadoop because it is open and scalable,
thus making it a prime technology for handling evolving data centre challenges in the
enterprise space.
• We're now seeing many cases from Hadoop to OpenStack, that open source technology
is driving high-performance computing and the cloud infrastructure - auguring that the
Hadoop framework, in particular, has enormous potential, Hadoop will be a foundational
layer within enterprises that can support a variety of application stacks on top of, or via,
a horizontal distribution.
• Intel added that deploying and managing this Intel-Hadoop distribution should be simple
for IT managers because it is "automatically configured to take the guesswork out of
performance tuning.“ The Ultrabook maker described that it optimized its Xeon chips, in
particular, for networking and I/O use cases to "enable new levels" of data analytics.

HP HAVEn Big Data Platform

• This article describes Orchestra – the Berkley solution for Managing Hadoop Data Transfers across Networked Computer Clusters.
• While in large part successful, Hadoop solutions have so far been focusing on scheduling and managing computation and storage resources, whilst mostly ignoring network capacity and resources.

Performance Optimisation
• New Performance Optimisation frameworks for tackling the “Three V” elements of
big data (volume, variety and velocity) - including making painstaking MapReduce
jobs perform much faster (Parallel Computing Performance Acceleration, In-
memory Processing and Real-time Analytics, for example) – are beginning to
foster increasingly mature approaches to analytics and data mining which are
propelling Big Data query / analytics performance way beyond previous frontiers
– for example, slow-performing, iterative MapReduce jobs which previously took
two days to execute, now complete in ten minutes (Vodafone).
• Those performance paradigms that have made GPUs so powerful in large-scale
analytics for Super Computers running Complex / Chaotic System applications in
support of Scientific Predictive Analytics and Event Forecasting - such as
Econometrics, Cosmology, Weather and Climate Modelling - are now being
applied to Big Data computing problems. Most data mining applications that
leverage classic Monte Carlo Simulation, Clustering and Statistical Analysis
Algorithms for classifying and analysing data – featuring SVM and newer open
source projects like Apache Mahout – all boast a C-kernel, which makes them
prime candidates for GPU / SSD / “R” parallel computing performance
acceleration approaches.

Distributed Clustering Model Performance
Clustering 100,000 2-D points with 2 clusters on 2.3 GHz quad-core Intel Xeon processors, with 8GB memory in intel07 cluster Network communication cost increases with the no. of processors
K-means Kernel K -means

SQL Query Optimisation

Performance Optimisation
• Query optimisation for Big Data that better supports the usage profiles and
data consumption trends that we are now experiencing involves some very
sophisticated computer science - developing new performance acceleration
technology and creating user-friendly query management tools: -
1. Increasing volume from companies keeping detail data, not aggregates, from
many more information sources.
2. More variety in the types of data to be incorporated into queries such as
application logs, sensor time series data, geospatially tagged data, biomedical
data, genomics data, and social media feeds.
3. Diverse storage technologies due to an increasing variety of data technologies
being instead of traditional RDBMS for storing and managing this data.
4. Complex queries generated by advanced clustering, statistical analysis and
wave-form analytics algorithms being applied to Big Data.
• See more at: http://blog.gopivotal.com/pivotal/products/new-benchmark-
results-pivotal-query-optimizer-speeds-up-big-data-queries-up-to-
1000x#sthash.j7ZdRBwc.dpuf

MapReduce Optimisation

Performance Optimisation
• Achieving real-time performance from Big Data query / analytics applications
requires massively complex hardware and systems (including Parallel Computing
Performance Acceleration, In-memory Processing and Real-time Analytics).
Clustering Algorithms which support basic data classification methods (again,
including SVM) have now been joined by revolutionary new techniques such as
Wave-form Analytics, Biomedical Data Science, 3D Geospatial Analysis and the
Temporal Wave - 4D time-series Geospatial Analytics.
• Dimensioning a hadoop cluster depends on many factors. Whilst the main use is still
cantered around batch analytics, and queries crunching large files, other use cases
are emerging and becoming more common use. Think for instance of ad-hoc
queries, streaming analytics and in-memory workflows, and near-real-time analytics
• Distributed processing, in order to be done efficiently, relies on the following factors: -
– available processing resources (cores, cpus)
– available storage hierarchy (cache, ram, disk, ethernet)
– locality of data (dataflow and data scheduling)
– task mapping and partitioning (allocation of computing resources)

HPCC Clustering Models
High Performance / High Concurrence Real-time Delivery (HPCC)

Performance Optimisation
• Distributed processing, in order to execute efficiently, relies on the following factors: -
– available processing resources (clusters, nodes, cores)
– type of processors deployed (no. of cores, GPU v. CPU)
– available storage hierarchy (core RAM, cached RAM, local disk array, ethernet)
– available storage devices (RAM, SSDs, SAN, NAS,)
– locality of data (LAN / WAN local / remote dataflow and job scheduling)
– task mapping and partitioning (manual / dynamic allocation of resources)
•
Let's start with a very well known distributed computing paradigm – specifically the
hadoop map-reduce operation. This is a batch Job Stream which is I/O-bound - the
limiting factor for throughput performance being CPU I/O waits – which can typically
account for 90-95% of CPU time in a well-tuned Hbase environment – and over 99.99%
of CPU time in a poorly-tuned Hbase environment .
• In short, what hadoop does is to take some chunks of data from storage (typically a file
from a local HDD), processing the data while "streaming" input file and then writing back
the results on file (hopefully again locally). Once the "map" phase is finished, the data is
sorted and merged in buckets sharing the same "key" and the process is repeated once
again in the "reduce" phase of map-reduce.

Distributed Clustering Models

Performance Optimimisation
• The map-reduce paradigm, when well tuned, can be very effective and efficient
way of dealing with a large class of parallel computing problems.
However, processing resources and data must be kept as close to each other as
possible – but this is not always possible or feasible. Hence hadoop map-reduce is
an effective parellalization paradigm, so long as during shuffle-and-sort data is
kept relatively local. Provided that enough reducers are running in parallel during
the reduce phase, which in turns depends on way keys are crafted / engineered.
• Moreover, this paradigm relies heavily on disk I/O in order to de-couple the various
stages of the computation. Although many classes of problems can be re-coded
by means of map-reduce operations, it is in many cases possible to gain speed
and efficiency by reusing the data already in memory and execute more complex
DAG (Directed Acyclic Graphs) as larger atomic dataflow operations.
• The main idea behind hadoop is to move processing close to the storage, and
allocate enough memory and cores to balance the throughput provided by the
local disks. The ideal hadoop building block is an efficient computing unit with a
full process, storage, and uplink hardware stack tightly integrated.

Distributed Clustering Model Performance
Distributed Approximate Kernel K-means
2-D data set with 2 concentric circles
2.3 GHz quad-core Intel Xeon processors, with 8GB memory in intel07 cluster
Run-time
Size of dataset (no. of Records)
Benchmark Performance (Speedup Factor )
10K 3.8
100K 4.8
1M 3.8
10M 6.4

The “Big Data” Processing Pipeline
• The Data Processing Pipeline is characterized by just a few generic processes: -
1. Sourcing data: Multiple sources of data have to be fed into the Big Data Processing
Pipeline. These data sources have to be identified scheduled and collected, but they
also need to be checked, cleaned, de-duplicated and moved into a staging area.
2. Data “shoe-horning” : The staging of source data is necessary because of this next
step in the process , something I call “data shoe-horning”. This is something most
people don’t even bat an eye-lid over – it’s often not even identified often as a distinct
process in the pipeline. But pay attention, because this is where traditionally, data gets
re-formatted or "shoe-horned" into a relational model and loaded into an RDBMS.
3. Data Quality and Transformation rules: These include everything from de-duplication
and data scrubbing, data cleansing, data validation to (field) mapping and any other
business rules that need to be applied in the transformation processing of the data
4. "Sink" preparation: The processed data has to make itself to various consumer sinks
i.e. Intermediate Data Files that are going to be consumed by enterprise, group or end-
user applications

The “Big Data” Processing Pipeline
• The Data Processing Pipeline is characterized by just a few generic processes: -
5. Data distribution: Finally the data has to be distributed and loaded into those various
data consumption stacks that service business applications and products .- and it is at
this point that multiple relational data sources are prepped with various target schemas -
very often with an operational data warehouse and data marts - possibly a columnar
database and maybe unstructured content stores serving a search platform (like Solr).
6. Archiving / Purging - Many original raw un-staged data sources as well as intermediate
data files are subject to a purge or archival policy. Where this becomes a source of
contention is when it comes time to re-claim or "re-surface“ all of this data from it's
archive (of course if you deleted it, you have a different kind of problem altogether.....).
• The Data Processing Pipeline is a recognized problem in both transactional and
informational environments and has been successfully tackled by Hadoop - try
tracking down your own applications' data all the way to its raw sources and
document the Data Processing Pipeline workflow. When you explore that pipeline
and all it's woes, do a POC – areas where Hadoop can change the game and
become absolutely transformative is in and around steps 2), 3), 5) and 6).

Performance Optimisation
Keeping power and space in control
• The solution to this problem from a IT and infrastructure perspective has
been so far based on rack or blade servers. In the past years, we have seen
rack and blade systems becoming increasing efficient in terms of form
factor, power, computing and storage resources.
Server miniaturization and scaling axes by Intel
• In our quest for increasingly better performance, we can wait for better
cores, or provide more cores, more CPUs / GPUs or more nodes (or all of
the above of course). However more cores in a chip and brainy chips are
tough to realize, because most of the low hanging fruits there are taken.
Instruction level parallelism (ILP), task level parallelism as well as dissipated
power/inch-square on chip are not yet scaling well according to Moore's law.


Performance Optimimisation
Smaller form factors: the micro-server generation
• On the other side, smaller form factor with a good hardware stack, are
becoming more common. What about a 4 cores i7 intel chip, with 32GB and
dual SSD that fits in palm of your hand? Imagine these units becoming the
new nodes of your hadoop cluster. You can have tens of those instead of a
single rack server. And since processing density is so high, computing
resources do not need to get much lower, even if the cores are optimized for
low air flow and lower power consumption.
As reported by znet, microservers because of their small size, and the fact
they require less cooling than their traditional counterparts, can also be
densely packed together to save physical space in the datacentre. Scaling
out capacity to meet demand simply requires adding more microservers.
Efficiency is further increased by the fact microservers typically share
infrastructure controlling networking, power and cooling, which is built into
the server chassis.


Turing Institute

Turing Institute
• In his Budget announcement, the chancellor, George Osborne pledged government
support for the Turing Institute, a specialist centre named after the great computer
pioneer Alan Turing – which will provide a British home for studying Data Science and
Big Data Analytics. Clustering and Wave-form algorithms in Big Data are the key to
unlocking Cycles, Patterns and Trends in complex (non-linear) systems – Cosmology,
Climate and Weather, Economics and Fiscal Policy – in order to forecast future trends,
outcomes and events with far greater accuracy.
• The chancellor, George Osborne has announced a £42m Alan Turing Institute is to be
founded to ensure that Britain leads the way in Data Science, Big Data Analytics for
studying complex (non-linear) systems - Clustering and Wave-form algorithmic research
in both Deterministic (human activity) and Stochastic (random, chaotic) processes.
• Drawing on the name of the famous British mathematician and computer pioneer Alan
Turing - who led the Enigma code-breaking work during the second world war at
Bletchley Park - the institute is intended to help British companies by bringing together
expertise and experience in tackling the challenges of understanding both deterministic
and stochastic systems – such as Weather, Climate, Economics, Econometrics and the
impact of Fiscal Policy – which require massive data sets and computational power.

Enigma Machine

Turing Institute
• The Turing Institute comes at a time when Data Science, Big Data Analytics and
complex system algorithm research is front and centre on the commercial stage. The
Turing Institute will be the first step to realising the UKs’ digital innovation potential.
Exploitation of big data by applying analytical methods - statistical analysis, predictive
and quantitative modelling - provides deeper insights and achieves brighter outcomes.
• The UK needs a centre of excellence capable of nurturing the talent required to make
British Data Science and Big Data Technology world-class. The cornerstone for the
new digital technologies isn’t just infrastructure, but the talent that’s needed to found,
innovate and grow technology firms and create a knowledge-based digital economy.
• The tender to house the institute will be produced this year. It may be a brand-new
facility or use existing facilities and space in a university, a Treasury spokesman said.
Its funding will come from the Department for Business, Innovation and Skills, and its
chief will report to the science minister, David Willetts. Executive appointments and
establishment numbers for the Turing Institute have yet to be announced.
• "The intention is for this work to benefit British companies to take a critical advantage
in the field of Data Science – algorithms, analytics and big data," said the spokesman.

The “Bombe” at Bletchley Park

Turing Institute
• Alan Turing was a pivotal figure in mathematics and computing and has long been
recognised as such by fellow mathematicians and computer scientists for his ground-
breaking work on Computational Theory. There already exists a Turing Institute at
Glasgow University, and an Alan Turing Institute in the Netherlands, as well as the Alan
Turing building at the Manchester Institute for Mathematical Sciences.
• Alan Turing’s code-breaking work using “the Bombe” - an electromechanical decryption
system - led to the de-ciphering of the German "Enigma" codes, which used very highly
complex encryption. His crypto-analysis work is claimed to have saved hundreds or even
thousands of lives and shortened WWII by as much as two years. Turing later formalised
Computational Theory which underpins modern computer science by the separation of
data from algorithms – sequences of instructions – in computer. programming languages.
• Osborne's announcement marks further official rehabilitation of a scientist who many see
as having been badly treated by the British establishment after his work during WWII.
Turing, who was homosexual, was convicted of indecency in March 1952, and lost his
security clearance with GCHQ - the successor to Bletchley Park. Turing killed himself in
June 1954 - but was only given an official pardon by the UK government in December
2013 after a series of public campaigns for recognition of his achievements.


Digital Village

Digital Village – Strategic Partners
• Digital Village is a consortium of Future Management and Future Systems Consulting firms for Digital Marketing and Lifestyle Strategy – Social Media / Big Data Analytics / Mobile / Cloud Computing / GPS/GIS / Next Generation Enterprise (NGE) / Digital Business Transformation
• Colin Mallett Former Chief Scientist @ BT Laboratories, Martlesham Heath
– Board Member @ SH&BA and Visiting Fellow @ University of Hertfordshire
– Telephone: (Mobile)
– (Office)
– Email: (Office)
• Ian Davey Founder and MD @ Atlantic Forces
– Telephone: +44 (0) 203 4026 225 (Mobile)
– +44 (0) 7581 178414 (Office)
– Email: [email protected]
• Nigel Tebbutt 奈杰尔 泰巴德
– Future Business Models & Emerging Technologies @ INGENERA
– Telephone: +44 (0) 7832 182595 (Mobile)
– +44 (0) 121 445 5689 (Office)
– Email: [email protected] (Private)
Digital Village - Strategic Enterprise Management (SEM) Framework ©