Embed Size (px)
Citation preview

Strategic Cost Strategic Cost ManagementManagement
Chapter 11Chapter 11
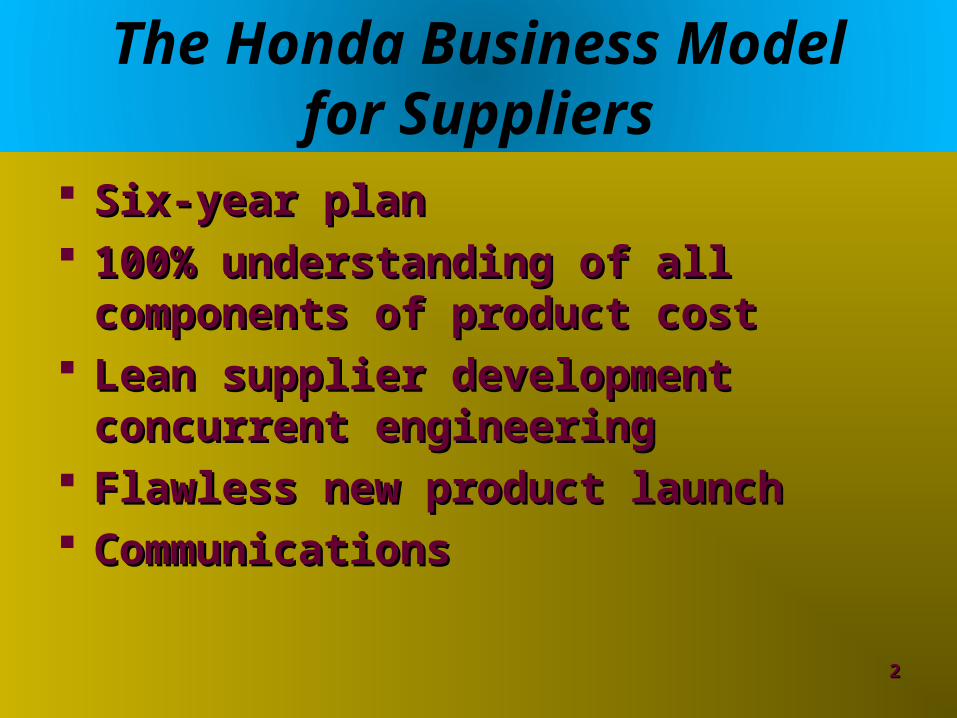
The Honda Business Modelfor Suppliers
Six-year planSix-year plan 100% understanding of all components 100% understanding of all components
of product costof product cost Lean supplier development concurrent Lean supplier development concurrent
engineeringengineering Flawless new product launchFlawless new product launch CommunicationsCommunications
22
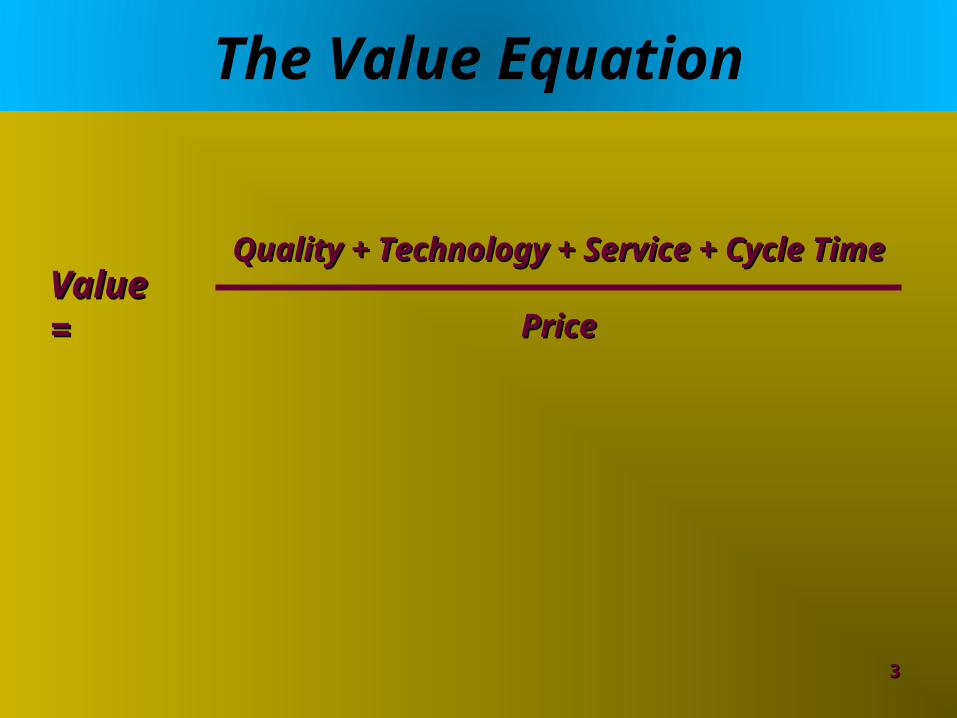
The Value Equation
33
Quality + Technology + Service + Cycle TimeQuality + Technology + Service + Cycle Time
PricePriceValueValue = =

Definitions
Price analysisPrice analysis Process of comparing supplier prices Process of comparing supplier prices
against external price benchmarksagainst external price benchmarks
Cost analysisCost analysis Process of analyzing each individual cost Process of analyzing each individual cost
element that makes up final priceelement that makes up final price
Total cost analysisTotal cost analysis Applies value equation across multiple Applies value equation across multiple
processesprocesses
44

Cost Management Approaches
Tier 2 Tier 2 SupplierSupplier
Tier 1 Tier 1 SupplierSupplier EnterpriseEnterprise CustomerCustomer ConsumerConsumer
55
Single Company Focused Cost-Reduction Initiatives
Strategic Cost Management –Finished Product/Service
Focus throughout theSupply Chain
Customer NeedsCustomer Needs
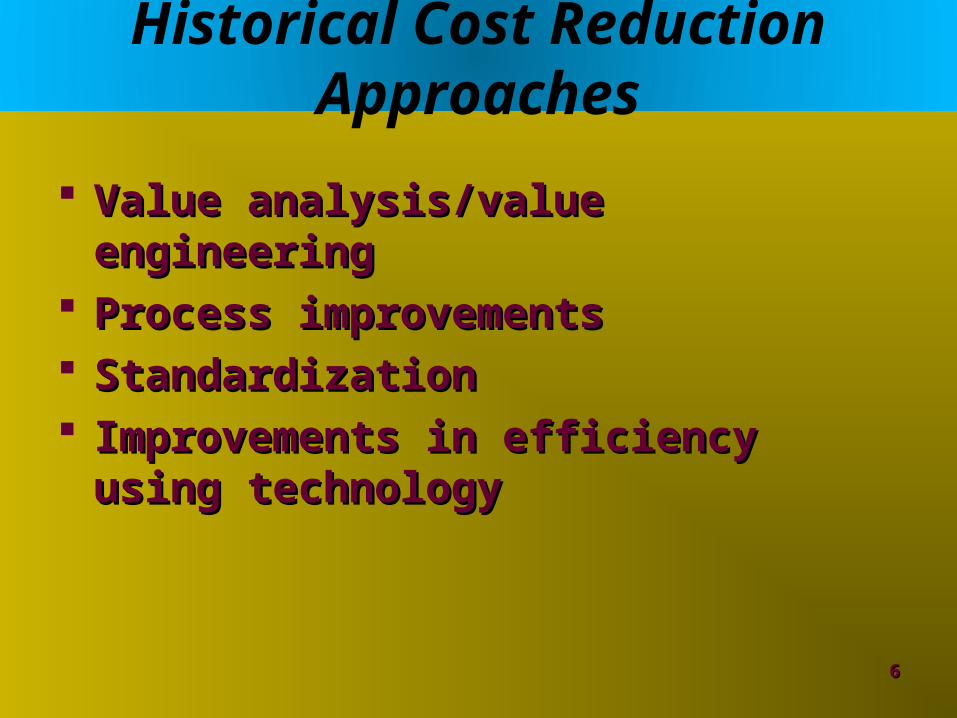
Historical Cost Reduction Approaches
Value analysis/value engineeringValue analysis/value engineering Process improvementsProcess improvements StandardizationStandardization Improvements in efficiency using Improvements in efficiency using
technologytechnology
66

Strategic Cost Management Processes
77
Most focus is
Most focus is
on a single
on a single
company
company
Need to
Need to migrate to a
migrate to a
supply chain
supply chain focusfocus
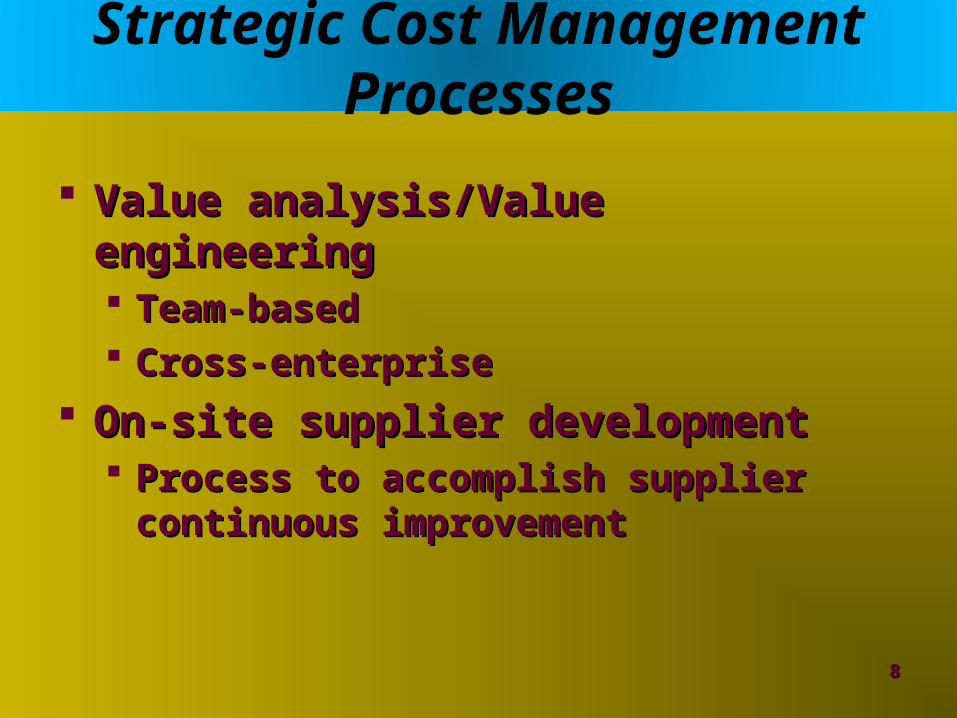
Strategic Cost Management Processes
Value analysis/Value engineeringValue analysis/Value engineering Team-basedTeam-based Cross-enterpriseCross-enterprise
On-site supplier developmentOn-site supplier development Process to accomplish supplier Process to accomplish supplier
continuous improvementcontinuous improvement
88
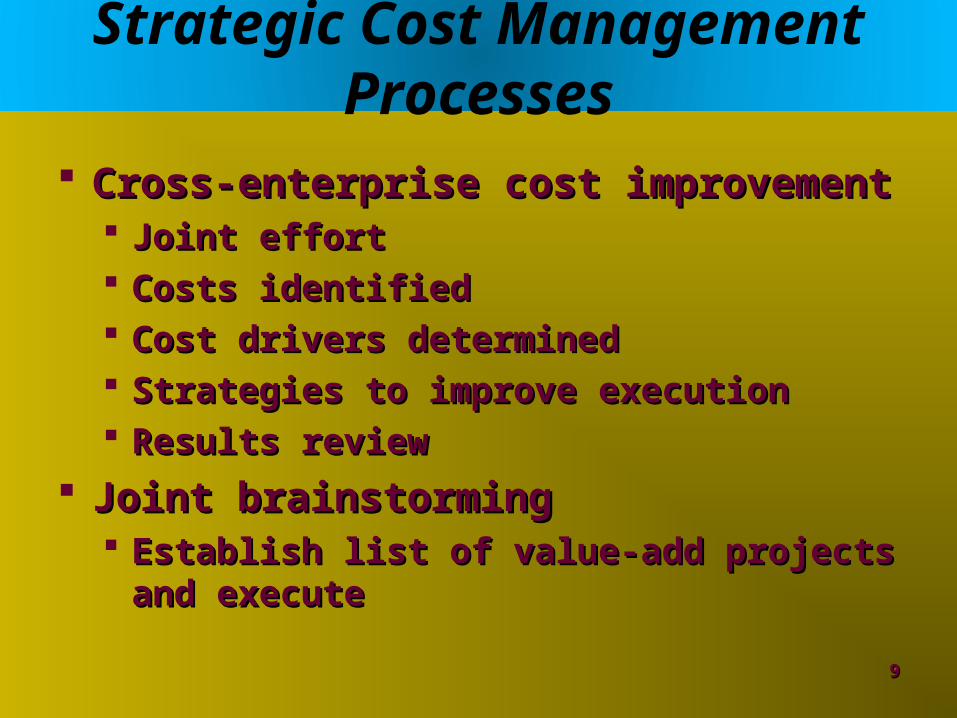
Strategic Cost Management Processes
Cross-enterprise cost improvementCross-enterprise cost improvement Joint effortJoint effort Costs identifiedCosts identified Cost drivers determinedCost drivers determined Strategies to improve executionStrategies to improve execution Results reviewResults review
Joint brainstormingJoint brainstorming Establish list of value-add projects and Establish list of value-add projects and
executeexecute99

Strategic Cost Management Processes
Supplier suggestion programsSupplier suggestion programs MotivateMotivate Act onAct on RewardReward Overall processOverall process
Supply chain compressionSupply chain compression Reducing number of levelsReducing number of levels Supplier consortiumsSupplier consortiums
1010
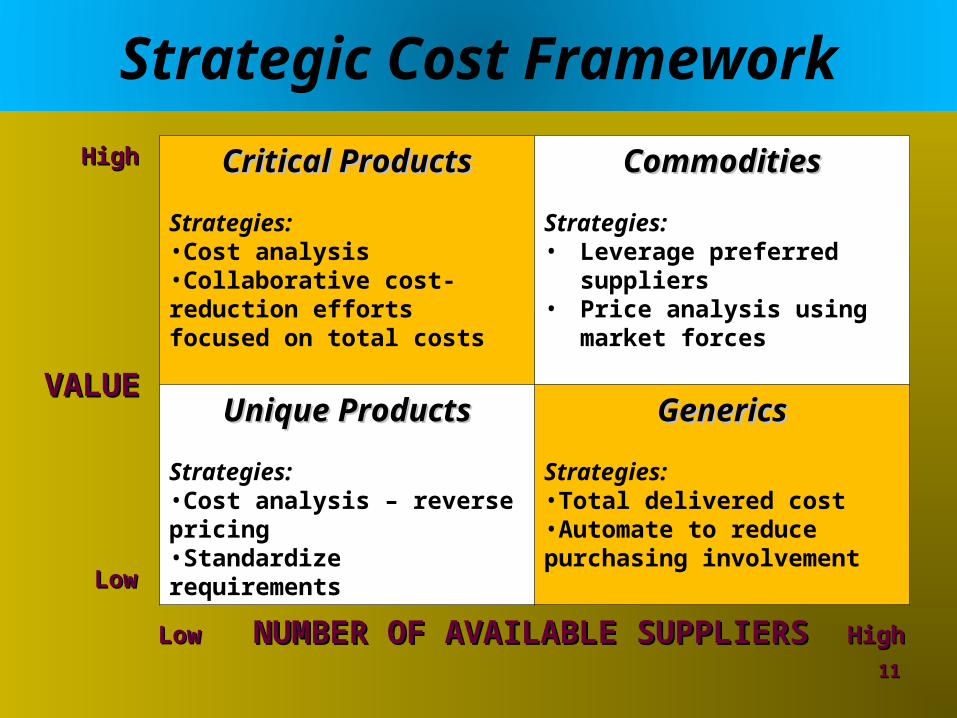
Strategic Cost Framework
Critical ProductsCritical Products
Strategies:•Cost analysis•Collaborative cost-reduction efforts focused on total costs
CommoditiesCommodities
Strategies:• Leverage preferred
suppliers• Price analysis using market
forces
Unique ProductsUnique Products
Strategies:•Cost analysis – reverse pricing•Standardize requirements
GenericsGenerics
Strategies:•Total delivered cost•Automate to reduce purchasing involvement
1111
VALUEVALUE
NUMBER OF AVAILABLE SUPPLIERSNUMBER OF AVAILABLE SUPPLIERS
HighHigh
HighHigh
LowLow
LowLow
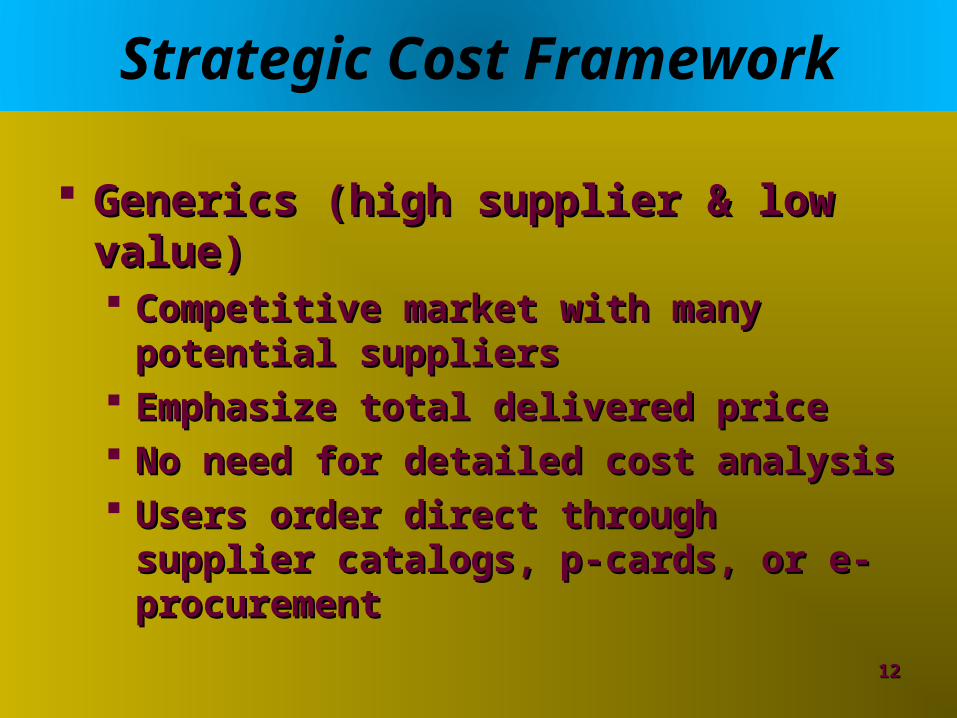
Strategic Cost Framework
Generics (high supplier & low value)Generics (high supplier & low value) Competitive market with many potential Competitive market with many potential
supplierssuppliers Emphasize total delivered priceEmphasize total delivered price No need for detailed cost analysisNo need for detailed cost analysis Users order direct through supplier Users order direct through supplier
catalogs, p-cards, or e-procurementcatalogs, p-cards, or e-procurement
1212
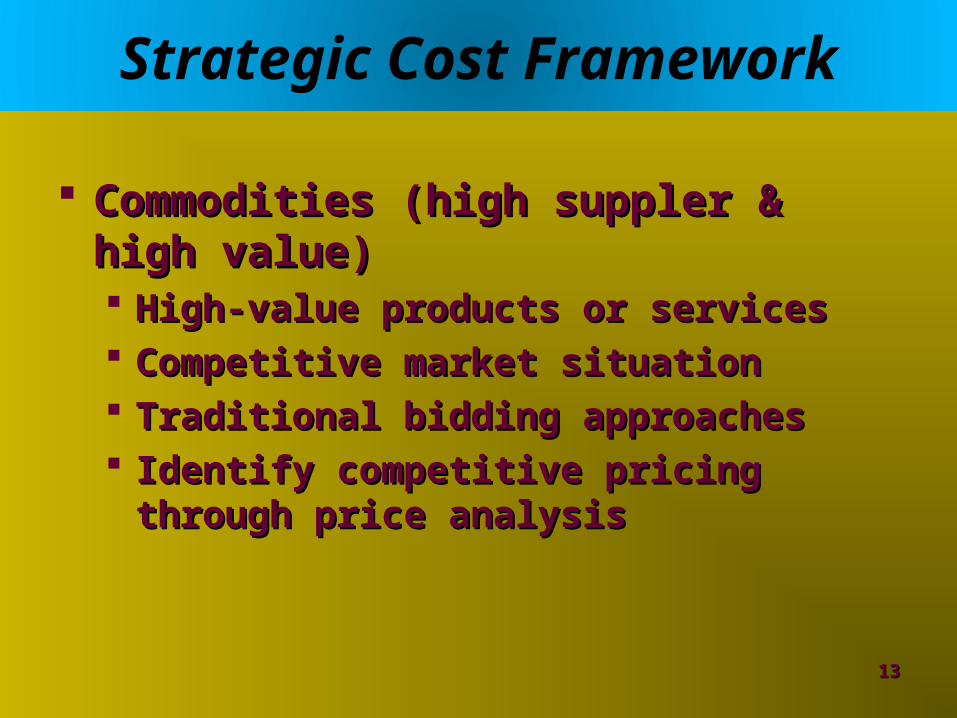
Strategic Cost Framework
Commodities (high suppler & high Commodities (high suppler & high value)value) High-value products or servicesHigh-value products or services Competitive market situationCompetitive market situation Traditional bidding approachesTraditional bidding approaches Identify competitive pricing through price Identify competitive pricing through price
analysisanalysis
1313

Strategic Cost Framework
Unique products (low supplier & low Unique products (low supplier & low value)value) Few available suppliersFew available suppliers Relatively low valueRelatively low value Standardized productsStandardized products Try to move to generics quadrant over timeTry to move to generics quadrant over time
1414
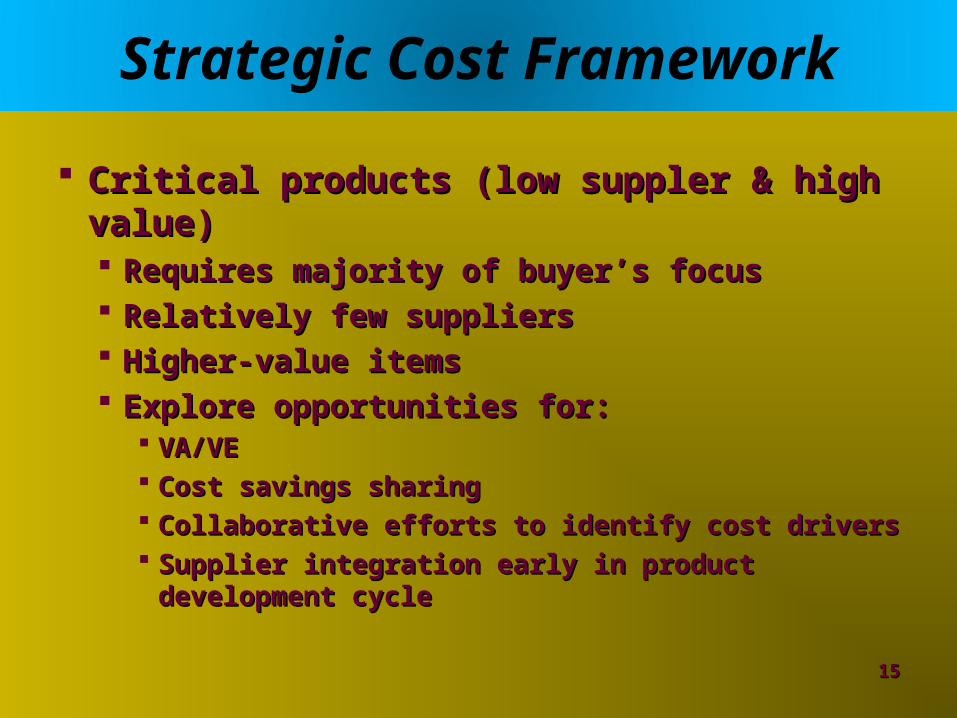
Strategic Cost Framework
Critical products (low suppler & high value)Critical products (low suppler & high value) Requires majority of buyer’s focusRequires majority of buyer’s focus Relatively few suppliersRelatively few suppliers Higher-value itemsHigher-value items Explore opportunities for:Explore opportunities for:
VA/VEVA/VE Cost savings sharingCost savings sharing Collaborative efforts to identify cost driversCollaborative efforts to identify cost drivers Supplier integration early in product development Supplier integration early in product development
cyclecycle
1515

Price vs. Cost vs. Total Cost Analyses
Price analysisPrice analysis Commodities and generics quadrantsCommodities and generics quadrants
Cost analysisCost analysis Unique and critical products quadrantsUnique and critical products quadrants
Total cost analysisTotal cost analysis All quadrantsAll quadrants
1616

Market-Based Pricing
1717
Supplier’sSupplier’sMarketMarket
Buyer’sBuyer’sMarketMarket
PRICEPRICE
VOLUMEVOLUME
SupplySupply
DemandDemand
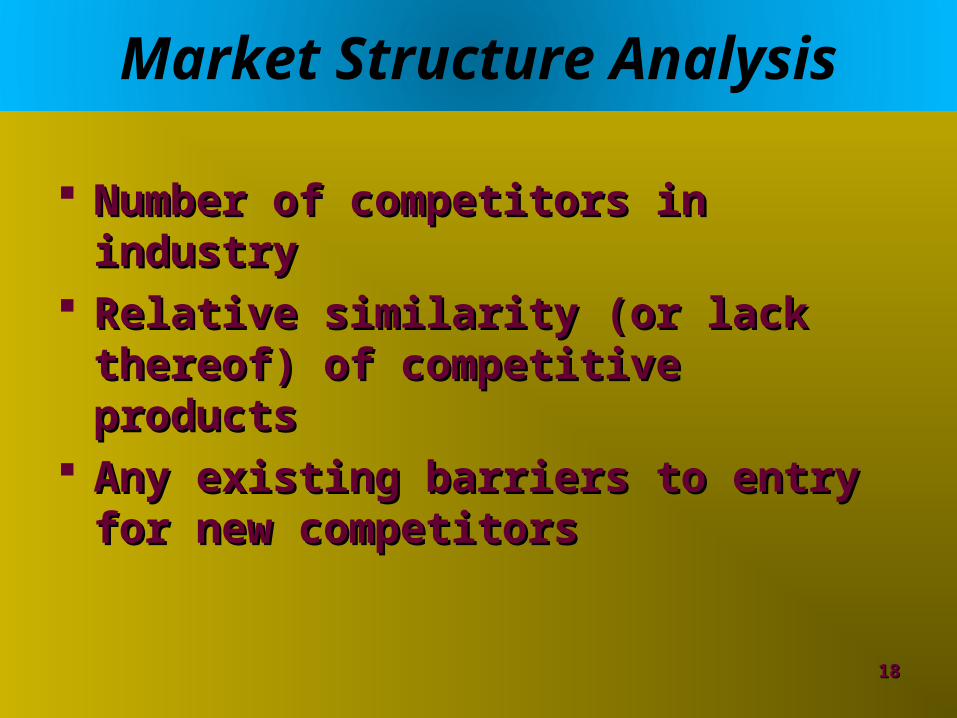
Market Structure Analysis
Number of competitors in industryNumber of competitors in industry Relative similarity (or lack thereof) of Relative similarity (or lack thereof) of
competitive productscompetitive products Any existing barriers to entry for new Any existing barriers to entry for new
competitorscompetitors
1818

Market Structure Types
MonopolyMonopoly Single supplier marketSingle supplier market Unique product with no substitutesUnique product with no substitutes Large barriers to entryLarge barriers to entry
OligopolyOligopoly A few large suppliersA few large suppliers Pricing strategies of one supplier influence Pricing strategies of one supplier influence
others in industryothers in industry
1919

Market Structure Types
Perfect competitionPerfect competition Many small suppliersMany small suppliers Price is solely function of supply and Price is solely function of supply and
demanddemand Minimal barriers to entryMinimal barriers to entry
2020

Economic Conditions
Conditions favorable to supplierConditions favorable to supplier High level of capacity utilizationHigh level of capacity utilization Tight supplyTight supply Strong demandStrong demand
Conditions favorable to buyerConditions favorable to buyer Low level of capacity utilizationLow level of capacity utilization High level of supplyHigh level of supply Weak demandWeak demand
2121

Analyzing Supplier Pricing
Does supplier have long-term or short-Does supplier have long-term or short-term pricing strategy?term pricing strategy?
Is supplier price leader or price Is supplier price leader or price follower?follower?
Is supplier attempting to establish entry Is supplier attempting to establish entry barriers?barriers?
Is supplier using cost-based or market-Is supplier using cost-based or market-based approach?based approach?
2222
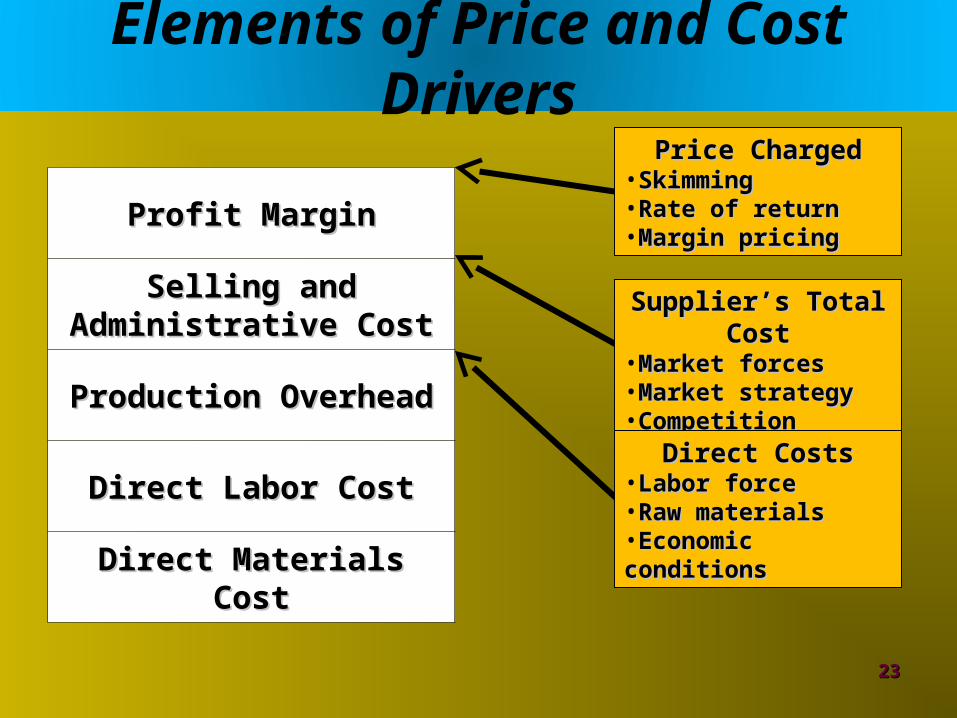
Elements of Price and Cost Drivers
Profit MarginProfit Margin
Selling and Selling and Administrative CostAdministrative Cost
Production OverheadProduction Overhead
Direct Labor CostDirect Labor Cost
Direct Materials CostDirect Materials Cost
2323
Price ChargedPrice Charged•SkimmingSkimming•Rate of returnRate of return•Margin pricingMargin pricing
Supplier’s Total CostSupplier’s Total Cost•Market forcesMarket forces•Market strategyMarket strategy•CompetitionCompetition
Direct CostsDirect Costs•Labor forceLabor force•Raw materialsRaw materials•Economic conditionsEconomic conditions

Market-Driven Pricing Models
Price volume modelPrice volume model Market-share modelMarket-share model Market skimming modelMarket skimming model Revenue pricing modelRevenue pricing model Promotional pricing modelPromotional pricing model Competition pricing modelCompetition pricing model Cash discountsCash discounts
2424
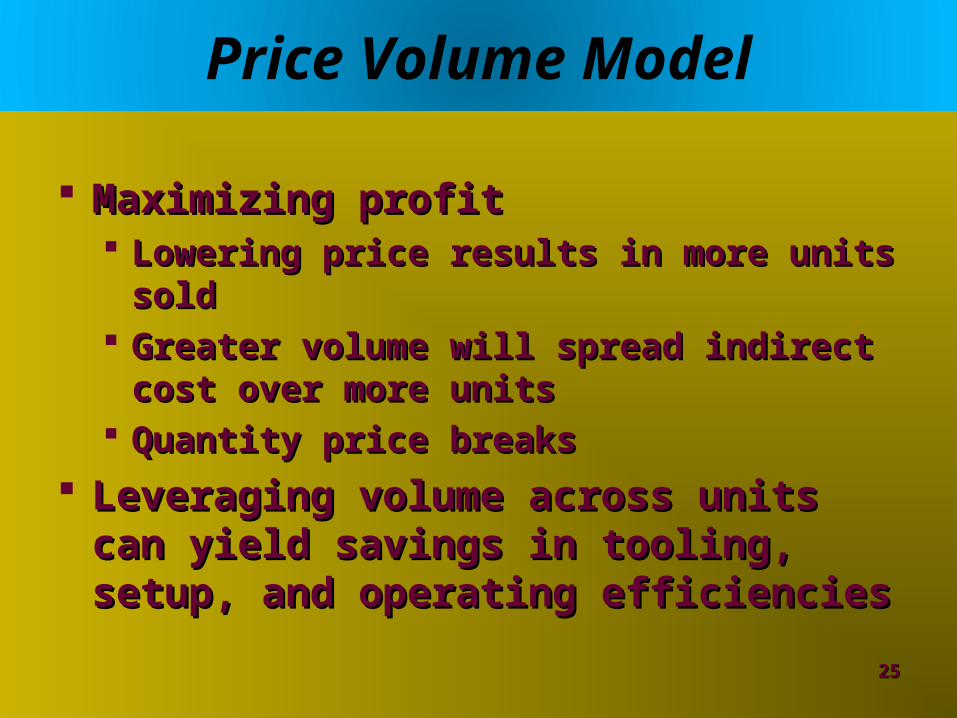
Price Volume Model
Maximizing profitMaximizing profit Lowering price results in more units soldLowering price results in more units sold Greater volume will spread indirect cost Greater volume will spread indirect cost
over more unitsover more units Quantity price breaksQuantity price breaks
Leveraging volume across units can Leveraging volume across units can yield savings in tooling, setup, and yield savings in tooling, setup, and operating efficienciesoperating efficiencies
2525

Market-Share Model
Long run profitability depends on level Long run profitability depends on level of market share obtainedof market share obtained
Also known as penetration pricingAlso known as penetration pricing Lower margins initially to increase Lower margins initially to increase
market sharemarket share Eventually spreads out indirect costs Eventually spreads out indirect costs
over greater volumeover greater volume
2626

Market-Skimming Model
Start with high price with high-end Start with high price with high-end productproduct
Then lower the price as the market Then lower the price as the market penetrates to exclude competitionpenetrates to exclude competition
Seed of revenue management (dynamic Seed of revenue management (dynamic pricing)pricing)
2727

Revenue pricing Model
Dynamic pricingDynamic pricing
Price differentiationPrice differentiation
Airline industryAirline industry
2828
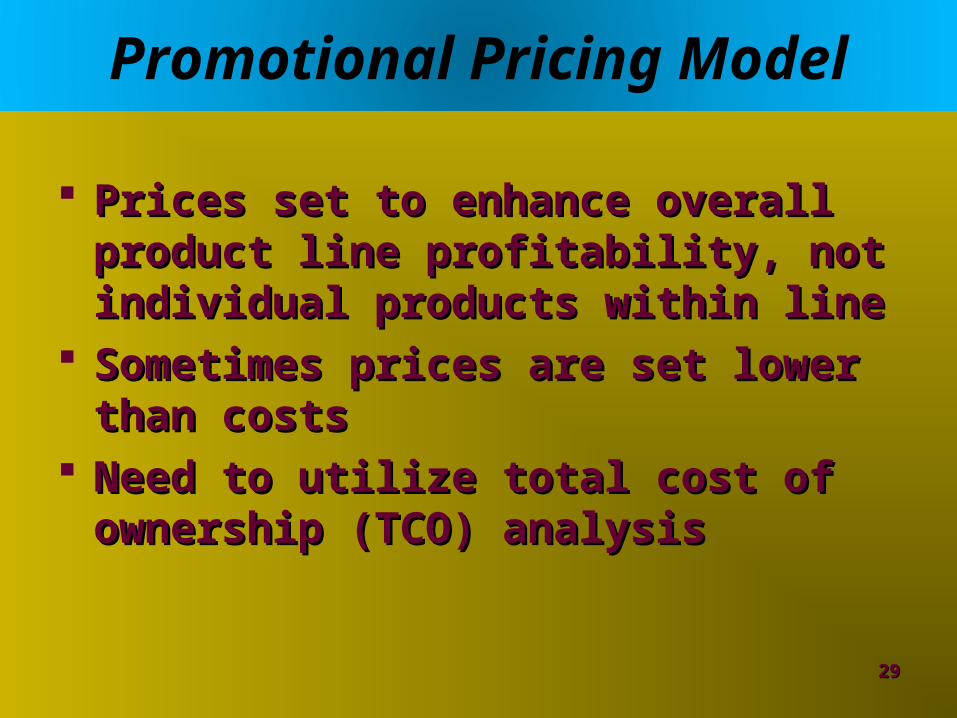
Promotional Pricing Model
Prices set to enhance overall product Prices set to enhance overall product line profitability, not individual line profitability, not individual products within lineproducts within line
Sometimes prices are set lower than Sometimes prices are set lower than costscosts
Need to utilize total cost of ownership Need to utilize total cost of ownership (TCO) analysis(TCO) analysis
2929

Competition Pricing Model
Focuses on reacting to actual or Focuses on reacting to actual or anticipated competitor pricinganticipated competitor pricing
What is highest price the supplier can What is highest price the supplier can charge and be just below its charge and be just below its competition?competition?
ExampleExample Reverse auctionsReverse auctions
3030
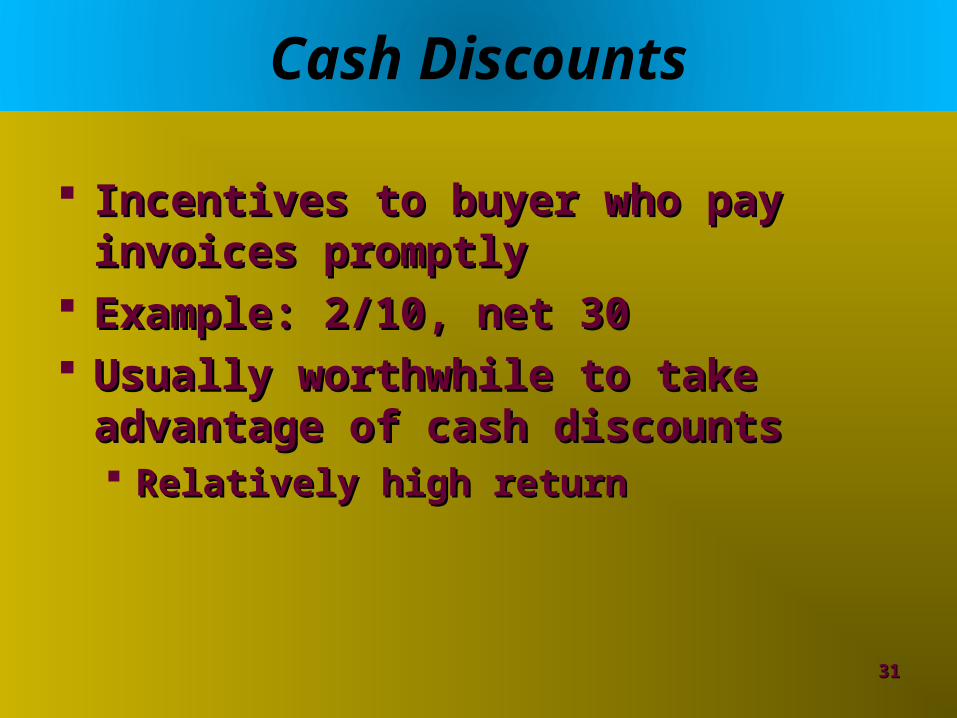
Cash Discounts
Incentives to buyer who pay invoices Incentives to buyer who pay invoices promptlypromptly
Example: 2/10, net 30Example: 2/10, net 30 Usually worthwhile to take advantage Usually worthwhile to take advantage
of cash discountsof cash discounts Relatively high returnRelatively high return
3131
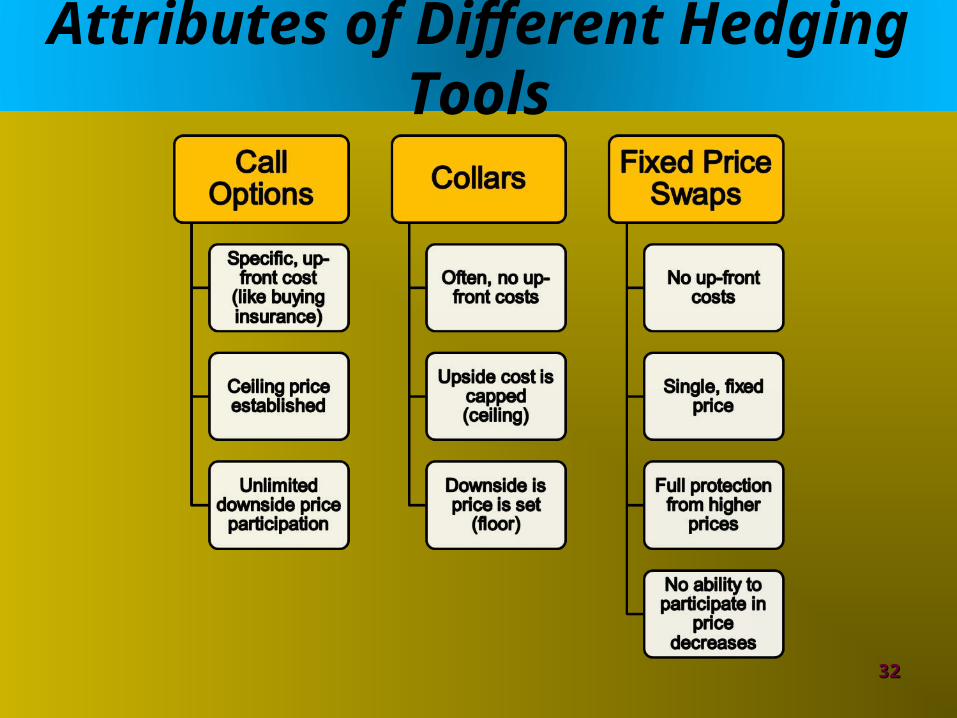
Attributes of Different Hedging Tools
3232

Customer Receives Differenc
e
Customer Buys a Fixed-Price Swap
3333
Swap Price
Net
Pri
ce
Underlying Market Price
HedgedUnhedged
Customer Receives Differenc
e
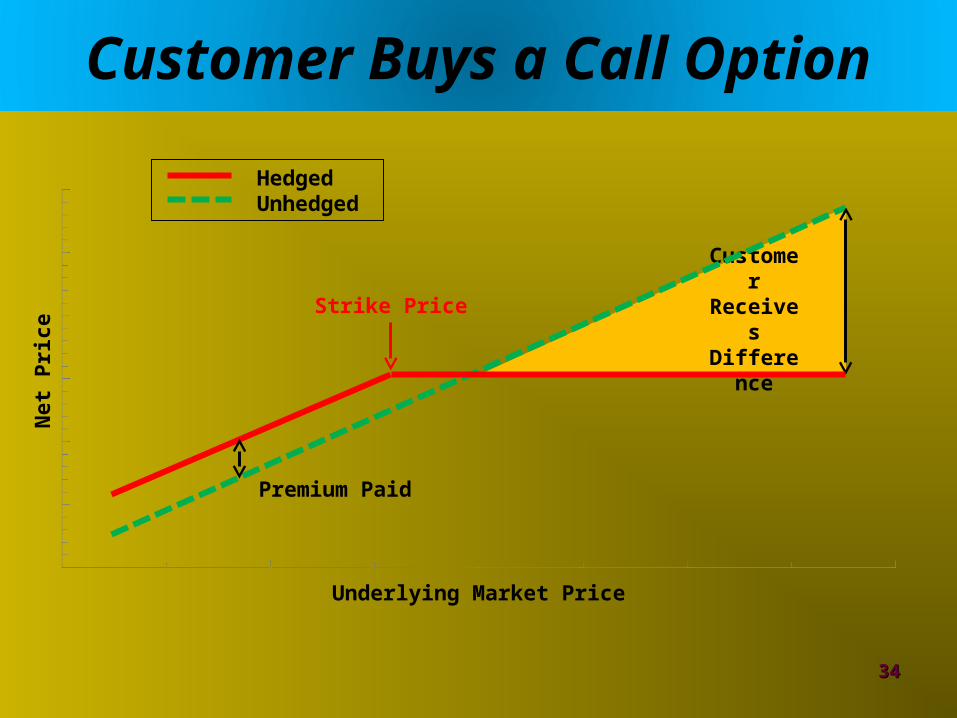
Customer Buys a Call Option
3434
Strike Price
Net
Pri
ce
Underlying Market Price
HedgedUnhedged
Premium Paid
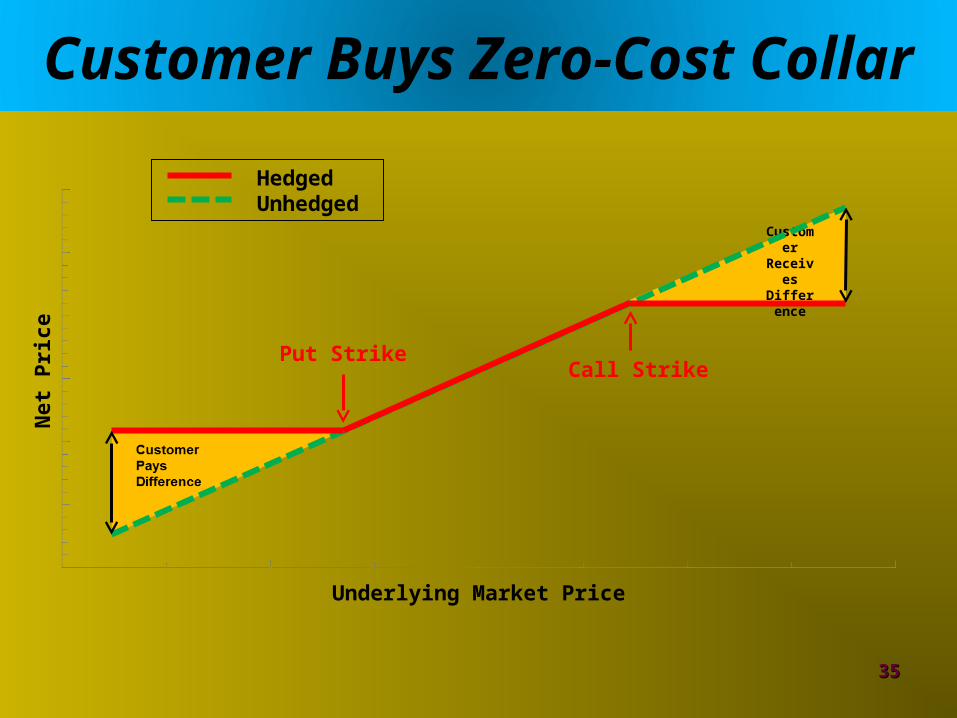
Customer
Receives
Difference
Customer Buys Zero-Cost Collar
3535
Call Strike
Net
Pri
ce
Underlying Market Price
HedgedUnhedged
Put Strike

Producer Price Index (PPI)
Appropriate for market-based products Appropriate for market-based products where price is largely function of where price is largely function of supply and demandsupply and demand
Published by U.S. Bureau of Labor Published by U.S. Bureau of Labor Statistics (BLS)Statistics (BLS)
PPI tracks material price movements on PPI tracks material price movements on quarter-to-quarter basisquarter-to-quarter basis
3636
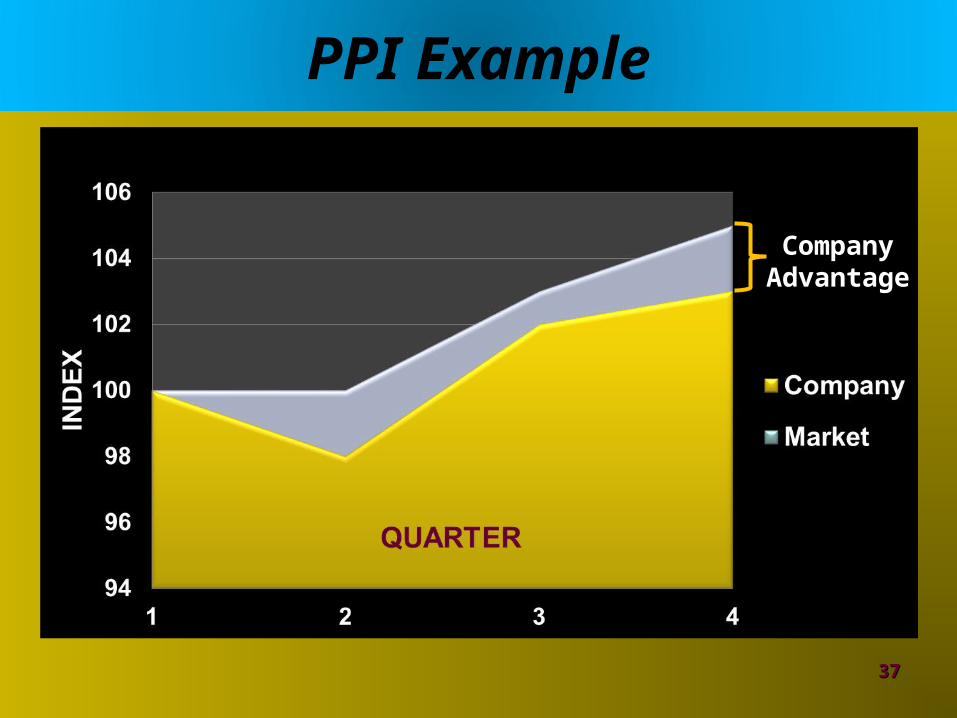
PPI Example
3737
Company Company AdvantageAdvantage

Cost Analysis Techniques
Cost-based pricing modelsCost-based pricing models Product specificationsProduct specifications Estimating supplier costs using reverse Estimating supplier costs using reverse
price analysisprice analysis Break-even analysisBreak-even analysis
3838

Cost-Based Pricing Models
Cost markup pricing modelCost markup pricing model Estimate costs and add markup %Estimate costs and add markup %
Margin pricing modelMargin pricing model Establish profit margin that is Establish profit margin that is
predetermined % of quoted pricepredetermined % of quoted price
Rate-of-return pricing modelRate-of-return pricing model Desired profit on financial investment is Desired profit on financial investment is
added to estimated costsadded to estimated costs
3939
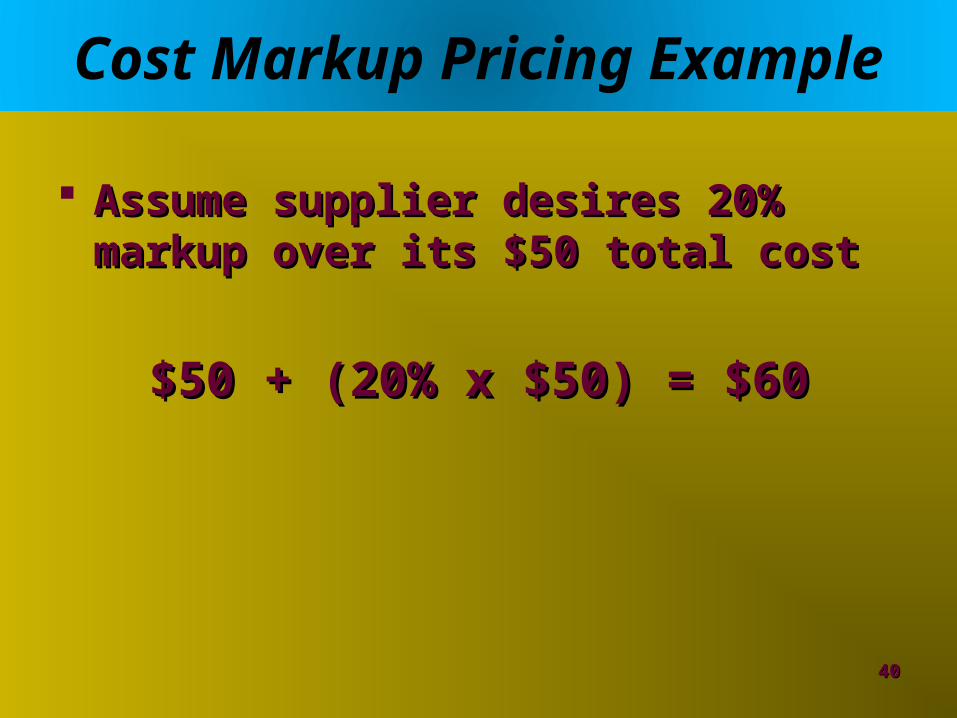
Cost Markup Pricing Example
Assume supplier desires 20% markup Assume supplier desires 20% markup over its $50 total costover its $50 total cost
$50 + (20% x $50) = $60$50 + (20% x $50) = $60
4040
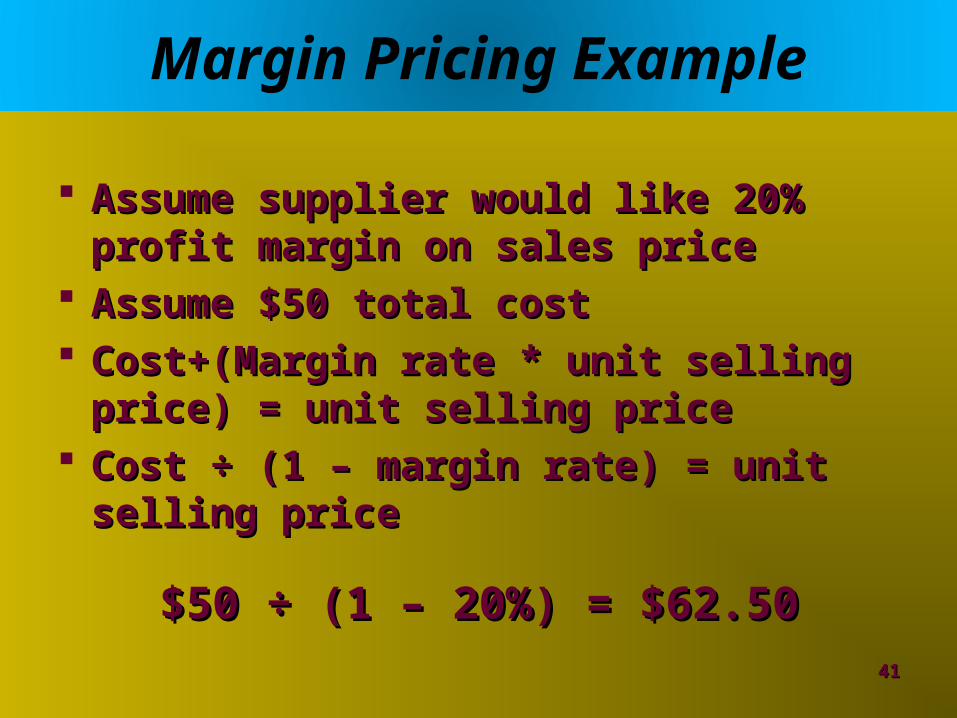
Margin Pricing Example
Assume supplier would like 20% profit Assume supplier would like 20% profit margin on sales pricemargin on sales price
Assume $50 total costAssume $50 total cost Cost+(Margin rate * unit selling price) = Cost+(Margin rate * unit selling price) =
unit selling priceunit selling price Cost ÷ (1 – margin rate) = unit selling Cost ÷ (1 – margin rate) = unit selling
priceprice
$50 ÷ (1 – 20%) = $62.50$50 ÷ (1 – 20%) = $62.504141
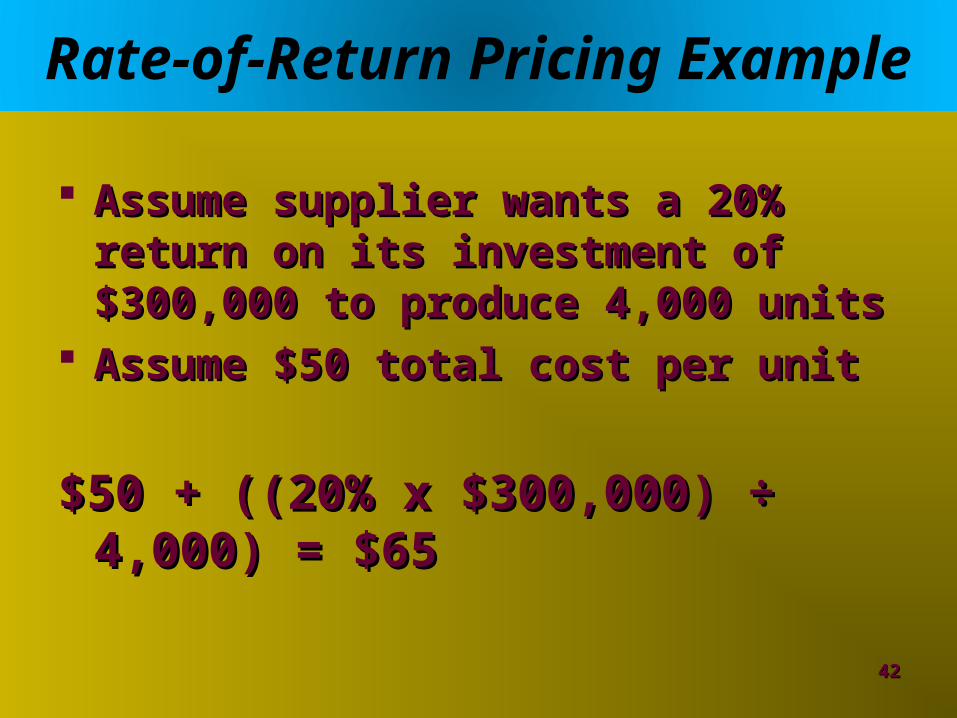
Rate-of-Return Pricing Example
Assume supplier wants a 20% return on Assume supplier wants a 20% return on its investment of $300,000 to produce its investment of $300,000 to produce 4,000 units4,000 units
Assume $50 total cost per unitAssume $50 total cost per unit
$50 + ((20% x $300,000) ÷ 4,000) = $65$50 + ((20% x $300,000) ÷ 4,000) = $65
4242
Product Specifications
Custom design and tooling increases Custom design and tooling increases product costsproduct costs Determine if added differentiation gives Determine if added differentiation gives
competitive advantage in marketplacecompetitive advantage in marketplace
Standardized components helps reduce Standardized components helps reduce product costsproduct costs
4343
Cost Analysis
Direct function of quality and Direct function of quality and availability of informationavailability of information
TechniquesTechniques Require detailed production cost Require detailed production cost
breakdownbreakdown Joint sharing of cost informationJoint sharing of cost information Early supplier design involvementEarly supplier design involvement
4444
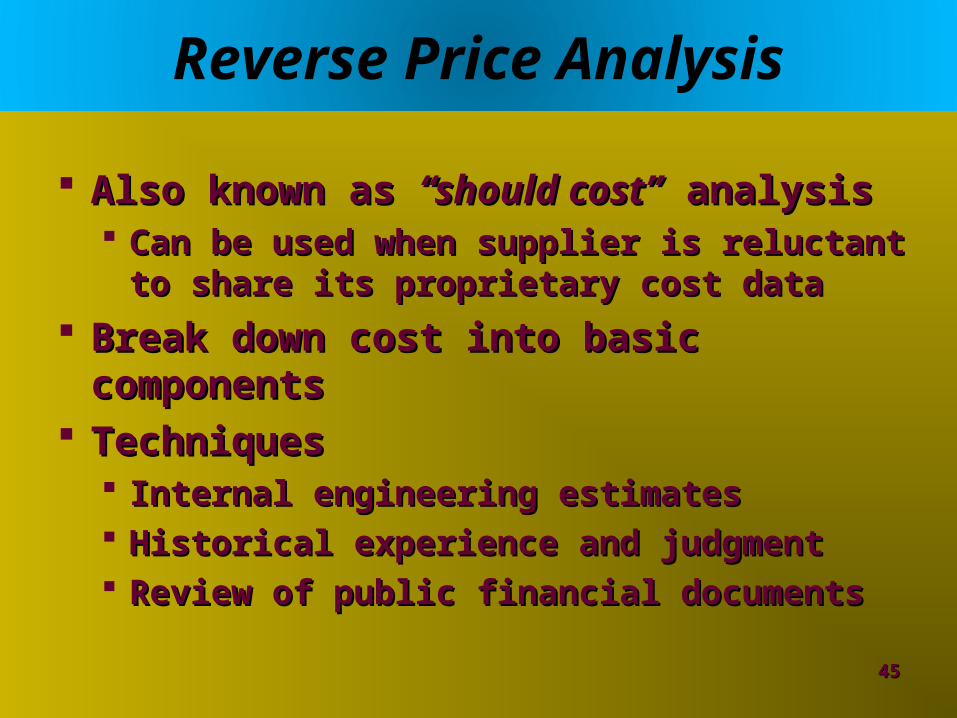
Reverse Price Analysis
Also known as Also known as “should cost”“should cost” analysis analysis Can be used when supplier is reluctant to Can be used when supplier is reluctant to
share its proprietary cost datashare its proprietary cost data
Break down cost into basic componentsBreak down cost into basic components TechniquesTechniques
Internal engineering estimatesInternal engineering estimates Historical experience and judgmentHistorical experience and judgment Review of public financial documentsReview of public financial documents
4545

Reverse Price Analysis Example
Hypothetical price $20
Profit/SG&A allowance (15%) - 3
Subtotal $17
Direct material - 4
Subtotal $13
Direct labor - 3
Manufacturing burden (overhead) $10
4646

Opportunities for Cost Reduction
Plant utilizationPlant utilization Process capabilityProcess capability Learning curve effectLearning curve effect Supplier’s workforceSupplier’s workforce Management capabilityManagement capability Supply management efficiencySupply management efficiency
4747

Learning curve
A learning curve displays the relationship A learning curve displays the relationship between the per unit cost (or time) and the between the per unit cost (or time) and the cumulative quantity produced of a productcumulative quantity produced of a product
Basic Learning Curve Premise:Basic Learning Curve Premise:
The production cost (or time) per unit is The production cost (or time) per unit is
reduced by a fixed percentage (1-reduced by a fixed percentage (1-rr) each ) each
time that production is doubled.time that production is doubled.
4848

Learning curve
4949
DefinitionsDefinitions
CC11 = the cost (or time) of the 1= the cost (or time) of the 1stst unit unit
CCnn = the cost (or time) of the = the cost (or time) of the nnthth unit unit
CCmm = the cost (or time) of the = the cost (or time) of the mmthth unit unit
rr = the learning rate= the learning rate
= % of previous cost (or time) whenever= % of previous cost (or time) whenever
production is doubledproduction is doubled
aa = the learning curve constant (> 0)= the learning curve constant (> 0)
nn or m = total number of units produced or m = total number of units produced

Learning curve
5050
Basic Learning Curve FormulaBasic Learning Curve Formula
::CCnn = = CC11 ( (nn-a-a )= )=CC11 / ( / (nnaa))
Growth rate learning curve FormulaGrowth rate learning curve Formula
: : CCnn = = CCmm[(n/m)[(n/m)-a-a]]
Learning curve
5151
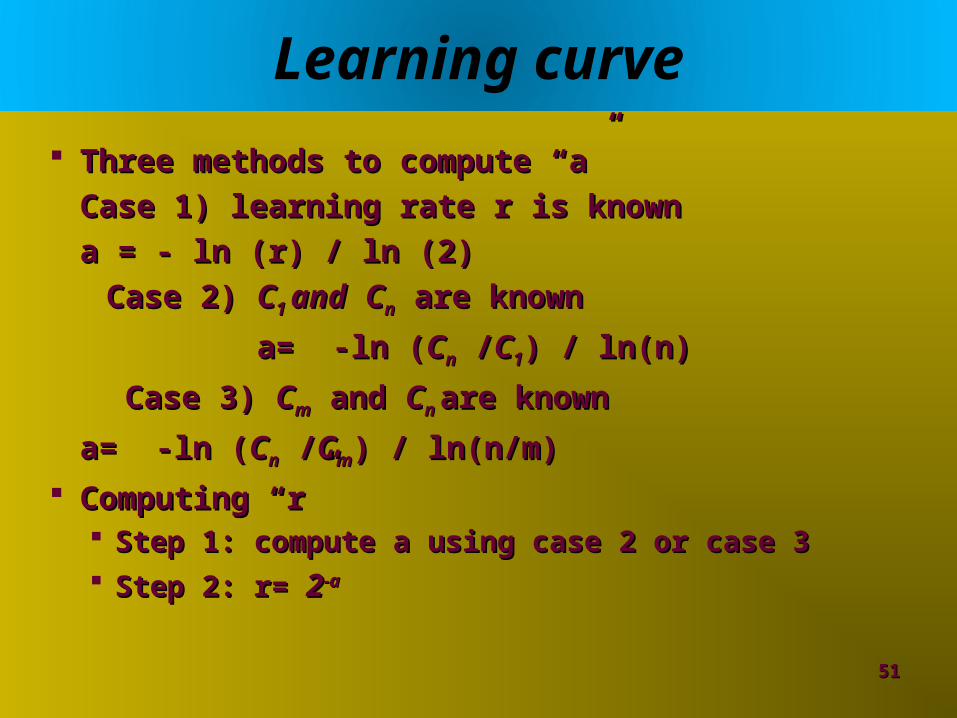
Three methods to compute “a”Three methods to compute “a”
Case 1) learning rate r is knownCase 1) learning rate r is known
a = - ln (r) / ln (2)a = - ln (r) / ln (2)
Case 2) Case 2) CC1 1 andand CCnn are known are known
a= -ln (a= -ln (CCnn / /CC11) / ln(n)) / ln(n)
Case 3) Case 3) CCmm and and CCn n are knownare known
a= -ln (a= -ln (CCnn / /CCmm) / ln(n/m)) / ln(n/m)
Computing “r”Computing “r” Step 1: compute a using case 2 or case 3Step 1: compute a using case 2 or case 3 Step 2: r= Step 2: r= 22-a-a
Learning curve
5252
ExampleExample rr = 90% and = 90% and CC44 = $100 = $100

Learning curve
5353
Example 1Example 1
Production Airlines manufactures small jets. Production Airlines manufactures small jets. The initial jet required 400 labor days to The initial jet required 400 labor days to complete. complete.
Assuming an 80% learning rate, how many Assuming an 80% learning rate, how many labor days will be required for the 20labor days will be required for the 20thth jet. jet.

Learning curve
5454
Example 2Example 2
Suppose it costs a firm $60.00 to produce the Suppose it costs a firm $60.00 to produce the 11stst unit and $48.00 to produce 160 unit and $48.00 to produce 160thth unit. unit. What is the learning rate for this company?What is the learning rate for this company?

Learning curve
5555
Example 3Example 3
Suppose it costs a firm $1200 to produce the Suppose it costs a firm $1200 to produce the 2,0002,000thth unit and its learning rate is 75%. unit and its learning rate is 75%. How much should it cost to produce the How much should it cost to produce the 8,0008,000thth unit? unit?
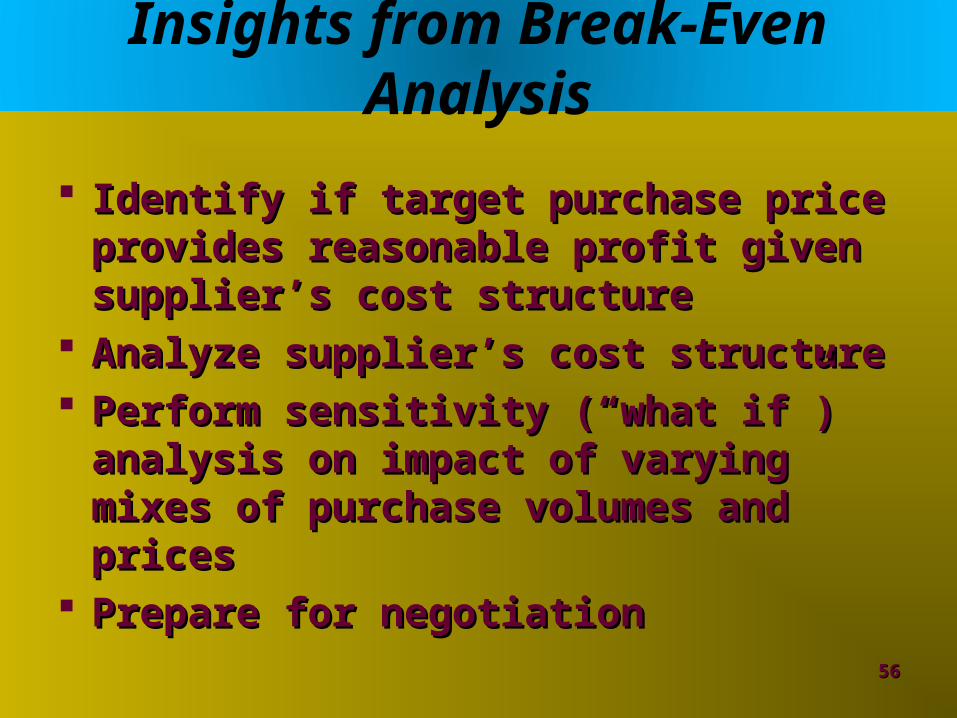
Insights from Break-Even Analysis
Identify if target purchase price Identify if target purchase price provides reasonable profit given provides reasonable profit given supplier’s cost structuresupplier’s cost structure
Analyze supplier’s cost structureAnalyze supplier’s cost structure Perform sensitivity (“what if”) analysis Perform sensitivity (“what if”) analysis
on impact of varying mixes of purchase on impact of varying mixes of purchase volumes and pricesvolumes and prices
Prepare for negotiationPrepare for negotiation
5656
Assumptions of Break-Even Analysis
Fixed costs remain constant over Fixed costs remain constant over period and volumes consideredperiod and volumes considered
Variable costs fluctuate in linear Variable costs fluctuate in linear fashionfashion
Revenues vary directly with volumeRevenues vary directly with volume Fixed and variable costs include Fixed and variable costs include
semivariable costssemivariable costs
5757

Assumptions of Break-Even Analysis
Considers total cost rather than Considers total cost rather than average costsaverage costs
There are minimal joint costsThere are minimal joint costs Considers only quantitative factorsConsiders only quantitative factors
5858
Break-Even Analysis
Where:Where: P = average purchase priceP = average purchase price X = units producedX = units produced VC = variable cost/unit of productionVC = variable cost/unit of production FC = fixed cost of productionFC = fixed cost of production Net income = $0 @ break-even pointNet income = $0 @ break-even point
5959
Net income (or loss) = P(X) - VC(X) - FCNet income (or loss) = P(X) - VC(X) - FC

Break-Even Analysis Example
6060
Total Costs
Fixed Costs
Break-Even Break-Even PointPoint
$30,000
$75,000$75,000
Revenue / Cost ($)
Volume7,5007,500 9,000
Profit
• Target price - $10/unitTarget price - $10/unit• Fixed costs - $30,000Fixed costs - $30,000• Variable costs - $6/unitVariable costs - $6/unit• Forecast purchase volume - Forecast purchase volume - 9,000 units9,000 units
Total Total RevenuesRevenues

Break-Even Example
6161
Net income (or loss) = P(X) - VC(X) - FCNet income (or loss) = P(X) - VC(X) - FC
$$6,0006,000 = $10(9,000) - $6(9,000) - $30,000 = $10(9,000) - $6(9,000) - $30,000
$0 = $10($0 = $10(7,5007,500) - $6() - $6(7,5007,500) - $30,000) - $30,000
Forecasted Volume:Forecasted Volume:
Break-Even Volume:Break-Even Volume:
Total Cost of Ownership (TCO)
Purchase pricePurchase price Invoice amount paid to supplierInvoice amount paid to supplier
Acquisition costsAcquisition costs Costs of bringing product to buyerCosts of bringing product to buyer
Usage costsUsage costs Conversion and support costsConversion and support costs
End-of-life costsEnd-of-life costs Net of amounts received/spent at salvageNet of amounts received/spent at salvage
6262
Building a TCO Model
1.1. Map the process and develop TCO Map the process and develop TCO categoriescategories
2.2. Determine cost elements for each Determine cost elements for each categorycategory
3.3. Determine how each cost element is to Determine how each cost element is to be measured (metrics)be measured (metrics)
4.4. Gather data and quantify costsGather data and quantify costs
5.5. Develop a cost timelineDevelop a cost timeline
6.6. Bring costs to present valueBring costs to present value6363

Opportunity Costs
DefinedDefined Cost of next best alternativeCost of next best alternative
Examples:Examples: Lost salesLost sales Lost productivityLost productivity DowntimeDowntime
6464
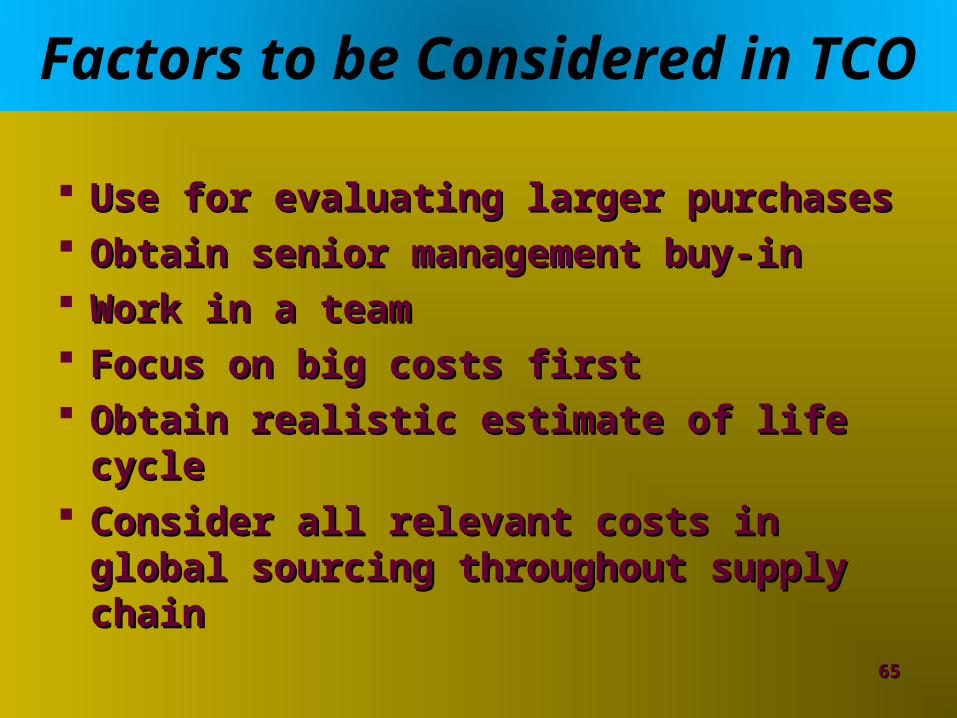
Factors to be Considered in TCO
Use for evaluating larger purchasesUse for evaluating larger purchases Obtain senior management buy-inObtain senior management buy-in Work in a teamWork in a team Focus on big costs firstFocus on big costs first Obtain realistic estimate of life cycleObtain realistic estimate of life cycle Consider all relevant costs in global Consider all relevant costs in global
sourcing throughout supply chainsourcing throughout supply chain
6565

TCO Model Example
Cost Elements Cost Measures for 1,000 PCs
Purchase price:• Hardware• Software licenses A, B, and C
• $1,200/PC – supplier quote• $450/PC – supplier quotes (3)
Acquisition costs:• Sourcing• Administration
• 2 FTE employees @ $85K and $170K for 2 months• 1 P.O. @ $150, 12 invoices @ $40 each
Usage costs:• Installation• Equipment support• Network support• Warranty• Opportunity cost – lost productivity
• $700/PC• $120/month/PC – supplier quote• $100/month – supplier quote• $120/PC for 3-year warranty• Downtime: 15 hours/PC/year @ $30/hour
End-of-life costs• Salvage value • $36/PC
6666

TCO Model Example
6767
Cost Elements Present Year 1 Year 2 Year 3 Purchase Price:
Hardware $ 1,200,000
Software licenses A, B, and C $ 450,000
Acquisition Costs: Sourcing $ 42,500
Administration $ 150 $ 480 $ 480 $ 480
Usage Costs: Opportunity cost – productivity $ 450,000 $ 450,000 $ 450,000
Installation $ 700,000
Equipment support $ 1,440,000 $ 1,440,000 $ 1,440,000
Network support $ 1,200,000 $ 1,200,000 $ 1,200,000
Warranty $ 120,000
End-of-Life Costs: Salvage value $ (36,000)
Total $ 2,512,650 $ 3,090,480 $ 3,090,480 $ 3,054,480
Present Values @ 12% $ 2,512,650 $ 2,759,799 $ 2,463,113 $ 2,174,790

Collaborative Cost Management
Target pricingTarget pricing Used in new product developmentUsed in new product development Sales Price – Profit = Allowable CostSales Price – Profit = Allowable Cost Gap in cost becomes cost reduction goalGap in cost becomes cost reduction goal
Cost savings sharingCost savings sharing Sharing of continuous improvement Sharing of continuous improvement
benefitsbenefits Financial incentives to supplier to pursue Financial incentives to supplier to pursue
cost reductioncost reduction
6868

Target and Cost-Based Pricing
Agreement on supplier’s full costsAgreement on supplier’s full costs Built upon high degree of …Built upon high degree of …
TrustTrust Information sharingInformation sharing Joint problem solvingJoint problem solving
Need to manage risks associated with Need to manage risks associated with target pricingtarget pricing Especially volume variabilityEspecially volume variability
6969

Target and Cost-Based Pricing
Identify and agree on:Identify and agree on: Product volumesProduct volumes Target product costs at different points in Target product costs at different points in
timetime Quantifiable productivity and quality Quantifiable productivity and quality
improvement projectionsimprovement projections Asset base and rate of return requirementsAsset base and rate of return requirements When cost sharing savings starts and how When cost sharing savings starts and how
calculatedcalculated
7070

When to Use Collaborative Cost Management Approaches
Not appropriate for all sourced itemsNot appropriate for all sourced items Supplier contributes high levels of Supplier contributes high levels of
value-addedvalue-added Complex, customized itemsComplex, customized items For products requiring conversion from For products requiring conversion from
raw materials through supplier’s designraw materials through supplier’s design
7171
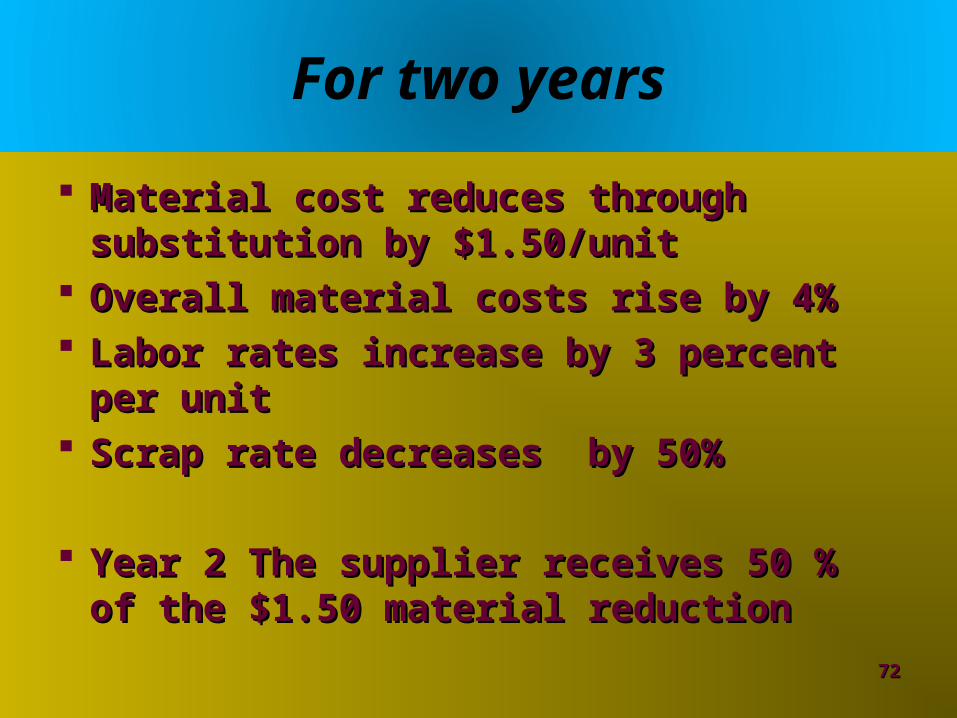
For two years
Material cost reduces through Material cost reduces through substitution by $1.50/unitsubstitution by $1.50/unit
Overall material costs rise by 4%Overall material costs rise by 4% Labor rates increase by 3 percent per unitLabor rates increase by 3 percent per unit Scrap rate decreases by 50%Scrap rate decreases by 50%
Year 2 The supplier receives 50 % of the Year 2 The supplier receives 50 % of the $1.50 material reduction$1.50 material reduction
7272

Cost-Based Pricing Example
First-year target price = $61.00
Negotiated/AnalyzedCost Structure
• Material• Labor rate• Burden rate• Scrap rate• SG&A expense rate• Effective volume range• Projected product life• ROI agreement
• $20/unit• $8.50/unit• 200% of direct labor• 10%• 10% of mfg cost• 125,000 units/year ± 10%• 2 years• 30%
Supplier InvestmentTotal Supplier Investment
Year 1$3,000,000$5,000,000
Year 2$2,000,000
Cost Savings Sharing(50/50)
• Direct labor• Scrap rate
• 10% annual reduction• 50% annual reduction
7373
Cost-Based Pricing Example
7474
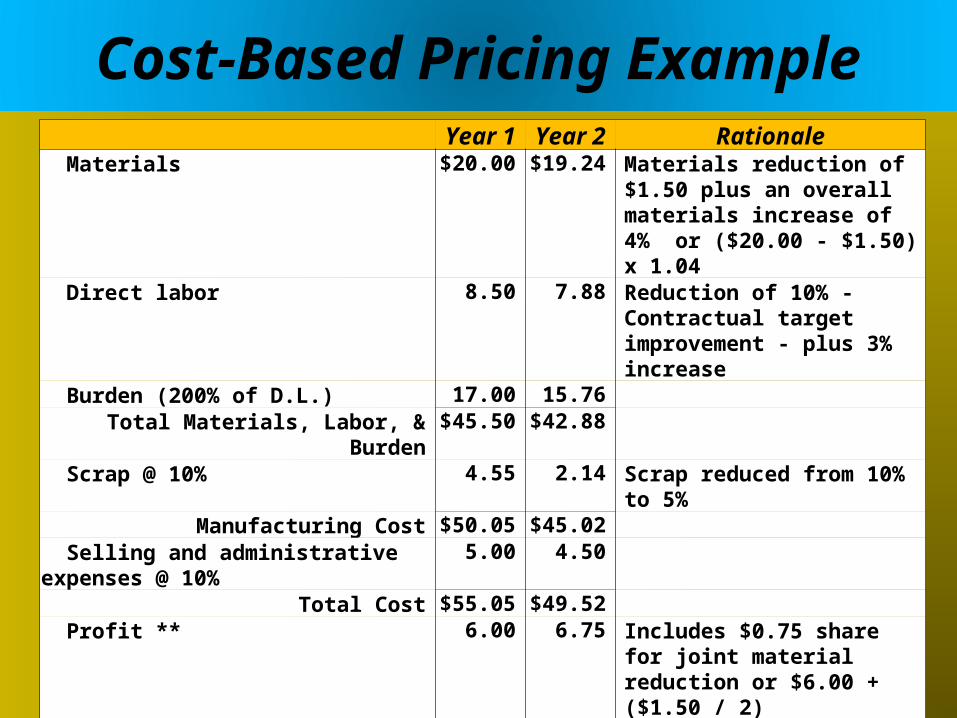
Year 1 Year 2 Rationale Materials $20.00 $19.24 Materials reduction of $1.50 plus
an overall materials increase of 4% or ($20.00 - $1.50) x 1.04
Direct labor 8.50 7.88 Reduction of 10% - Contractual target improvement - plus 3% increase
Burden (200% of D.L.) 17.00 15.76Total Materials, Labor, & Burden $45.50 $42.88
Scrap @ 10% 4.55 2.14 Scrap reduced from 10% to 5% Manufacturing Cost $50.05 $45.02
Selling and administrative expenses @ 10% 5.00 4.50Total Cost $55.05 $49.52
Profit ** 6.00 6.75 Includes $0.75 share for joint material reduction or $6.00 + ($1.50 / 2)
Selling price $61.05 $56.27 New selling price after Year 1 improvements
** Profit based on 30% return on investment negotiated in agreement ($5 million over 2-year investment x 0.3) / 250,000 total units = $6.00 profit/unit


![Untitled-2 [] ape.pdf · Customer Satisfaction Qualified Suppliers ... HONDA MOTORCYCLES HONDA ACTIVA TVS ACCESS TVS SCOOTY TVS XL SUPER . 3 Excellence in Quality 9-255 REAR WHELL](https://img.dokumen.tips/doc/110x75/5acc8eaa7f8b9a875a8cbf0b/untitled-2-apepdfcustomer-satisfaction-qualified-suppliers-honda-motorcycles.jpg)