Embed Size (px)
Citation preview

MARQUETTE AREA PUBLIC SCHOOLS6-8
Math CurriculumRevised February 17, 2004
1

MARQUETTE AREA PUBLIC SCHOOLS MIDDLE SCHOOL MATHEMATICS
CURRICULUMThe Middle School Math Curriculum was developed utilizing current educational research, past practices, the Michigan Curriculum Framework, and the National Council of Teachers of Mathematics Principles and Standards for School Mathematics, 2000.
Strand I. Patterns, Relationships, and FunctionsContent Standard 1: Students recognize similarities and generalize patterns, use patterns to create models and make predictions, describe the nature of
patterns and relationships, and construct representations of mathematical relationships. (Patterns)
6 7 8 Algebra 8
1. Describe, analyze and generalize patterns arising in a variety of contexts and express them in general terms.
Introduce exponents as another way to write a product of factors
Write expressions containing exponents in standard form
Write numbers in scientific notation using positive exponents
Introduce divisibility rules for 2,3,5,6,9,10
Introduce writing a number as a product of its prime factors
Create tables from formulas
Write formulas from tables
Use exponents to express numbers written as a product of factors
Write expressions containing exponents in standard form
Write numbers in scientific notation using both positive and negative exponents
Test numbers for divisibility by 2,3,4,5,6,8,9,10
Write a number as a product of it’s primes
Identify similar figures
Identify and distinguish between an arithmetic and a geometric sequenceDescribe a translation, rotation and reflection
Create tables from formulas
Write formulas from tables
Use exponents to express numbers written as a product of factors
Write expressions containing exponents in standard form
Write numbers in scientific notation using both positive and negative exponents
Test numbers for divisibility by 2,3,4,5,6,8,9,10
Write numbers and algebraic expressions as product of primes both with and without exponents
Use the properties of similar figures to find missing measures
Create tables from formulas
Use exponents to express numbers written as a product of factors
Write expressions containing exponents in standard form
Write numbers in scientific notation using both positive and negative exponents
Categorize numbers into number systems
Write a number as a product of its primes
Recognize and apply algebraic properties in simplifying expressions and solving equations
2

Identify figures that have been translated, rotated or transformed
Explore factoring patterns for various polynomial expressions
Recognize perfect square and perfect cube roots
Solve and graph linear equations and inequalities
Solve and graph systems of equations and inequalities
2. Represent and record patterns in a variety of ways including; tables, charts and graphs, and translate between various representations.Identify two pieces of data represented by a scatterplot
Create, read and interpret bar graphs, frequency tables, line plots, line graphs, pictographs, stem and leaf plots.
Create, read and interpret frequency tables, bar graphs, line plots, line graphs, stem and leaf plots, and scatterplots.
Create, read and interpret frequency tables, pictographs, bar graphs, line plots, line graphs, stem and leaf plots, and scatterplots.
Recognize and analyze frequency distributions
Read and interpret box and whisker plots, scatterplots, bar and circle graphs
3. Use patterns and their generalizations to make and justify their inferences and predictions.
Calculate mean, median, mode and range
Present data using mean, median, mode and range
Calculate the mean, median, mode and range
Identify the quadrant that contains a given point
Match isometric(3 d dot pictures) and orthographic (2d cue drawings) views
Present data using mean, median, mode and range
Calculate the mean, median, mode and range
Identify the quadrant that contains a given point
Use Cartesian Coordinate Plane to justify solution sets to various Algebraic equations
4. Explore and describe visual and numeric patterns, including linear expressions, near-linear patterns and symmetric and spatial patterns.
Determine what comes next in a sequence or series
Replicate and continue a visual pattern
Match graphs to number stories
Determine what comes next in a sequence or series
Replicate and continue a visual pattern
Find measure of interior angles of regular and non-regular polygons
Match graphs to number stories
Determine what comes next in a sequence or series
Replicate and continue a visual pattern
Find measure of interior angles of regular and non-regular polygons
Determine what comes next in a sequence or series
Write an algebraic equation or expression for a given situation
Use Cartesian coordinate plane to justify solution sets to algebraic equations
3

Strand I. Patterns, Relationships, and FunctionsContent Standard 1: Students recognize similarities and generalize patterns, use patterns to create models and make predictions, describe the nature of
patterns and relationships, and construct representations of mathematical relationships. (Patterns)
6 7 8 Algebra 8
5. Use patterns and generalizations to solve problems and explore new content.
Show functional relationships such as:-follow rules to complete table-graphing ordered pairs-applying formulas
Determine if a scatterplot suggests a trend
Generate equations by interpreting a pattern.Show functional relationships by:-following rules to complete table-graphing ordered pairs-applying formulas to find the area, surface area and volume of cylinders, pyramids, and prismsConstruct trend lines to predict future valuesUse inverse operations to solve for a variable
Generate equations through pattern work.
Show functional relationships such as:-follow rules to complete table-graphing ordered pairs-applying formulas
Generate equations through pattern work.
Show functional relationships such as:-follow rules to complete table-graphing ordered pairs-applying formulas
Use factoring patterns to solve polynomial equations
Strand I. Patterns, Relationships and FunctionsContent Standard 2: Students describe the relationships among variables, predict what will happen to one variable as another variable is changed, analyze
natural variation and sources of variability, and compare patterns of change. (Variability and Change)
6 7 8 Algebra 8
1. Identify and describe both complex and abstract situations, explore different kinds of change and patterns. Give a range of reasonable values for an equation
Give a range of reasonable values for an equation
Describe a data set from its graph
Give a range of reasonable values for an equation
Describe a data set from its graph
Determine the mathematical relationships between the formulas for volume and surface area of 3 dimensional figures(ex: prisms, pyramids, cones)
Give a range of reasonable values for an equation
Describe a data set from its graph
Explore relationships between variables in linear and quadratic equations
2. Connect an initial state to a final state and generalize a rule that describes a pattern of change.
Use a rule to generate terms in a sequence or series
Identify a rule for a give sequence or series “
Use a rule to generate terms in a sequence or series
Identify a rule for a give sequence or series
Describe the relationship between experimental and theoretical probability
Use a rule to generate terms in both arithmetic and geometric sequences and series
Identify a rule for a given sequence or series
Describe the relationship between experimental and theoretical probability
Examine relationship between input and output values using function notation
Identify a rule for a given sequence or series
Match a graph to its real number description
4

3. Changes are frequently interdependent (bivariate and linear relationships); exploring what will happen to one quantity if another variable is changed.Describe how one variable will change in relation to another variable
Assess the effects of an outlier on a data set
Describe how one variable will change in relation to another variable
Predict and assess the effects of an outlier on a data set
State the probability of a given situation with and without replacement
Identify which coordinate(s) will change when a reflection (flip), rotation (turn) or translation (slide) occurs.
Use words, tables and graphs to analyze and describe patterns and functions
Predict how one variable will change in relation to another variable
Predict and assess the effects of an outlier on a data set
State the probability of a given situation with and without replacement
State the coordinate(s) that change when a reflection (flip), rotation (turn) or translation (slide) occurs.
Use words, tables and graphs to analyze and describe patterns and functions
Use words, tables and graphs to analyze and describe patterns and functions
Describe how one variable will change in relation to another
Explore relationships between variables in linear and quadratic equations
4. Represent variability or change by ordered pairs, tables, graphs and equations. Use the distributive, commutative and associative properties to expedite mental arithmetic problems
Write equations and expressions to represent relationships involving time, money, rate, distance.
Identify the associative, commutative and distributive properties of addition and multiplication in given equations and expressions
Use the above properties to solve equations mentally.
Demonstrate use of the above properties to solve equations.
Use equations and proportions to solve problems involving percent
Use formulas to solve for changes in Surface Area, Volume, Perimeter and Area when one dimension of a given shape is changed
Use the associative, commutative, distributive, zero and identity properties to solve equations
Write equations and expressions to represent relationships involving time, money, rate, distance.
Use equations and proportions to solve problems involving percent
Use formulas to solve for changes in Surface Area, Volume, Perimeter and Area when one dimension of a given shape is changed
Use the associative, commutative, distributive, zero and identity properties to solve equations
Write equations and expressions to represent relationships involving time, money, rate, distance, mixtures
Transform equations involving multiplication, addition, subtraction and division
Use equations and proportions to solve problems involving percent
Use formulas to solve for changes in Surface Area, Volume, Perimeter and Area when one dimension of a given shape is changed
5. Differentiate between functions and relationships such as linear vs non linear and continuous vs non continuous . Find missing numbers in a function table
Describe a graph from its given rule or equation.
Determine if a graph is a function or relation.
Describe a graph from its given rule or equation.
Determine if a graph is a function or relation.
Describe a graph from its given rule or equation.
Determine if a graph is a function or relation.
Describe a graph from its given rule or equation.
Distinguish between continuous and non-continuous functions
Differentiate between linear and nonlinear relationships
5

6. Explore relationships and use variables and relationships to solve mathematical problems.Use their knowledge of variability and change to make predictions and solve problems.
Read, write and evaluate expressions and equations.
Use their knowledge of variability and change to make predictions and solve problems.
Use Pythagorean Theorem to find the missing sides of a right triangle
Use a model and an equation to solve problems involving positive and negative integers
Read, write and evaluate expressions and equations.
Read, write and evaluate expressions and equations.
Use their knowledge of variability and change to make predictions and solve problems.
Use Pythagorean Theorem to find the missing sides of a right triangle
Use a model and an equation to solve problems involving positive and negative integers
Read, write and evaluate expressions and equations.
Use their knowledge of variability and change to make predictions and solve problems.
Use Pythagorean Theorem to find the missing sides of a right triangle
Use a model and an equation to solve problems involving positive and negative integers
Add, subtract, multiply and divide monomials and polynomials
Strand II. Geometry and MeasurementContent Standard 1: Students develop spatial sense, use shape as an analytic and descriptive tool, identify characteristics and define shapes, identify
properties and describe relationships among shapes. (Shape and Shape Relationships)
6 7 8 Algebra 8
1. Spatial sense relies on the ability to recognize and describe shape.
Classify polygons by the number of sides using the prefixes of tri, quad, pent, hex, oct, and deca.
Classify quadrilaterals based on their properties of parallel and perpendicular sides
Classify triangles by their sides and angles
Classify 3-d objects as prisms, pyramids, or other.
Classify polygons by the number of sides using the prefixes of tri, quad, pent, hex, oct, and deca. All others classified as n-gons.
Classify quadrilaterals based on their properties of parallel and perpendicular sides
Classify triangles by their sides and angles
Classify 3-d objects as prisms, pyramids, or other.
Identify polygons as simple, closed, curves.
Recognize a linear or quadratic equation by its graph
Strand II. Geometry and MeasurementContent Standard 1: Students develop spatial sense, use shape as an analytic and descriptive tool, identify characteristics and define shapes, identify
properties and describe relationships among shapes. (Shape and Shape Relationships)
6 7 8 Algebra 8
2. Generalize the characteristics of shapes and apply their generalizations to classes of shapes.Determine if a polygon is regular Determine if a polygon is regular Determine if a polygon is regular
6

Identify the faces, edges, and vertices of a polyhedron
Classify angles as acute, right, straight, obtuse
Classify angle pairs as adjacent, vertical, supplementary, complementary
Create nets to find surface area of 3d figures
Find the area of irregular figures
Identify the faces, edges, and vertices of a polyhedron
Classify angles as acute, right, straight, obtuse
Classify angle pairs as adjacent, vertical, supplementary, complementary
Find the area of irregular figures
Identify the faces, edges, and vertices of a polyhedron
Classify angles as acute, right, straight, obtuse
Classify angle pairs as adjacent, vertical, supplementary, complementary
Find the area of both regular and irregular figures
Identify the faces, edges, and vertices of a polyhedron
3. Derive generalizations about shapes and apply those generalizations to develop classifications of familiar shapes.Use classifications and properties of triangles and quadrilaterals to find missing measures
Determine if shapes are congruent, similar or neither
Solve attribute puzzles by using the classifications of size, color and shape
Use classifications and properties of triangles and quadrilaterals to find missing measures
Determine if shapes are congruent, similar or neither
Use classifications and properties of triangles and quadrilaterals to find missing measures
Determine if shapes are congruent, similar or neither
Use classifications and properties of triangles and quadrilaterals to find missing measures
4. Construct familiar shapes using coordinates, appropriate tools, sketching and drawing two and three-dimensional shapes.
Construct a figure based upon its description or classification. Example: Draw a 4 sided figure with opposite sides parallel and all angles 90o (square)
Use a protractor to measure angles within a 5 degree accuracy
Construct a figure based upon its description or classification. Example: Draw a 4 sided figure with opposite sides parallel and all angles 90o (square)
Use isometric paper to create 3d representations of objects
Use grid paper to create orthographic representations of the faces of 3d figures
Use a protractor to measure angles within a 5 degree accuracy
Use a compass to bisect and construct an angle and a line segment
Use a compass and straightedge to create a regular pentagon
Create 3d models of a cylinder, prism and pyramid from 2d nets
Construct a figure based upon its description or classification. Example: Draw a 4 sided figure with opposite sides parallel and all angles 90o (square)
Use grid paper to create orthographic representations of the faces of 3d figures
Use a protractor to measure angles within a 5 degree accuracy
Use a compass to bisect and construct an angle and a line segment
Create 3d models of a cylinder, prism and pyramid from 2d nets
Strand II. Geometry and MeasurementContent Standard 1: Students develop spatial sense, use shape as an analytic and descriptive tool, identify characteristics and define shapes, identify
properties and describe relationships among shapes. (Shape and Shape Relationships)
6 7 8 Algebra 8
5. Combine, dissect and transform shapes.Determine whether a figure has point, line or rotational symmetry
Use a scale factor to create a new shape from a given shape
Transform a given figure through reflection, rotation or translation.
7

Subdivide, combine and transform shapes to form new shapes
Transform a given figure through reflection, rotation or translation.
Use tangrams to create convex polygons
Determine whether a figure has point, line or rotational symmetry
Subdivide, combine and transform shapes to form new shapes
Determine whether a figure has point, line or rotational symmetry
Subdivide, combine and transform shapes to form new shapes
6. Informally verify generalizations about the common properties of similar, congruent, parallel and perpendicular shapes.Determine if given shapes are congruent, similar or neither
Identify lines as parallel or perpendicular
Determine if given shapes are congruent, similar or neither
Identify lines as parallel, perpendicular, skew, transversal or neither.
Determine if given shapes are congruent, similar or neither
Identify lines as parallel, perpendicular, skew, transversal or neither.
Determine if given shapes are congruent, similar or neither
Identify lines as parallel, perpendicular, skew, transversal or neither
7. Use shape, shape properties, and shape relationships to describe the physical world and solve problems.“Use classifications of triangles and quadrilaterals to find missing measures
Find the circumference and area of circles, polygons, and regular figures
Use Euler’s theorem to find the number of faces, edges and vertices on a 3d figure. ( F + V = E + 2 )
Use classifications of triangles and quadrilaterals to find missing measures
Find the circumference and area of circles and polygons
Find the area of irregular figures
Use Euler’s theorem to find the number of faces, edges and vertices on a 3d figure. ( F + V = E + 2 )
Use classifications of triangles and quadrilaterals to find missing measures
Find the circumference and area of circles and polygons
Find the area of irregular figures
Use classifications of triangles and quadrilaterals to find missing measures
Find the circumference and area of circles and polygons
Find the area of irregular figures
Strand II. Geometry and Measurement Content Standard 2: Students identify locations of objects, identify location relative to other objects, and describe the effects of transformations (e.g., sliding,
flipping, turning, enlarging, reducing) on an object. (Position)
6 7 8 Algebra 8
1. Locate and describe objects in terms of their position, including compass directions, cartesian coordinates, latitude, longitude and midpoints. Plot points on a Cartesian plane
Identify the quadrant that contains a given point
Identify the midpoint of a line segment, the number line(zero) and the coordinate plane (origin)
Use maps with latitude and longitude to represent the Cartesian coordinates
Plot points on a Cartesian plane
Identify the quadrant that contains a given point
Identify the midpoint of a line segment, the number line(zero) and the coordinate plane (origin)
Plot points on a Cartesian plane
Identify the quadrant that contains a given point
Identify the midpoint of a line segment, the number line(zero) and the coordinate plane (origin)
Plot points and graphs of equations on a Cartesian plane
Extensive use of the Cartesian coordinate plane including formulas relating to this system
2. Locate and describe objects in terms of their orientation and relative position, including symmetry. Label quadrants in the coordinate Label quadrants in the coordinate plane Label quadrants in the coordinate plane
8

plane
Determine from a point’s coordinates whether it is above, below, to the right or left of another point
Use fractional terms (1/4, ½, ¾, full) to describe a shapes rotation
Determine from a point’s coordinates whether it is above, below, to the right or left of another point
Use fractional terms (1/4, ½, ¾, full) to describe a shapes rotation
Determine from a point’s coordinates whether it is above, below, to the right or left of another point
Use fractional terms (1/4, ½, ¾, full) to describe a shapes rotation
Determine from a point’s coordinates whether it lies on the same line or a different line from another point
3. Describe translations, reflections, rotations and dilations using the language of transformations and employ transformations to verify congruence of figures.Translate, reflect, or rotate to determine the congruence of objects
Use transformations to create a kaleidoscopic tesselation
Translate, reflect, or rotate to determine the congruence of objects
Translate, reflect, or rotate to determine the congruence of objects
Explore translations relating to lines
4. Locate the position of points or objects described by two or more conditions; locate all of the points that satisfy a given condition. Use latitude and longitude to find a given location
Find a value in a graph
Identify all the values in a graph that meet a given condition
Use time, distance and rate formulas to find missing values
Determine if a point lies on a given plane
Use latitude and longitude to find a given location
Determine the signs of a number given its quadrants
Use time, distance and rate formulas to find missing values
Use a scatterplot to predict information or determine if information fits
Determine if a point lies on a given plane
Use latitude and longitude to find a given location
Determine the signs of anumber given its quadrants
Use time, distance and rate formulas to find missing values
Use a scatterplot to predict information or determine if information fits
Locate all the points that satisfy a given condition
Determine if a point lies on a given plane
Use time, distance and rate formulas to find missing values
Locate all the points that satisfy a given condition
In depth study of linear equations and their graphs in the Cartesian Plane
5. Concepts of position, direction and orientation to describe the physical world and to solve problems. Recognize a proportion
Determine needed or unnecessary information
Use geometric vocabulary (parallel, perpendicular, complementary, etc.) to describe one object in relation to another.
Use indirect measurement (proportions) to find missing measures
Apply indirect measurement to solve problems in a real world setting
Determine information necessary to create a scale drawing.
Determine maximum and minimum scale possible to fit an object within given parameters
Use geometric vocabulary (parallel, perpendicular, complementary, etc.) to describe one object in relation to another
Apply indirect measurement to solve problems in a real world setting using proportions
Use geometric vocabulary (parallel, perpendicular, complementary, etc.) to describe one object in relation to another
Strand II. Geometry and Measurement
9

Content Standard 3: Students compare attributes of two objects, or of one object with a standard (unit), and analyze situations to determine what measurement(s) should be made and to what level of precision. (Measurement)
6 7 8 Algebra 8
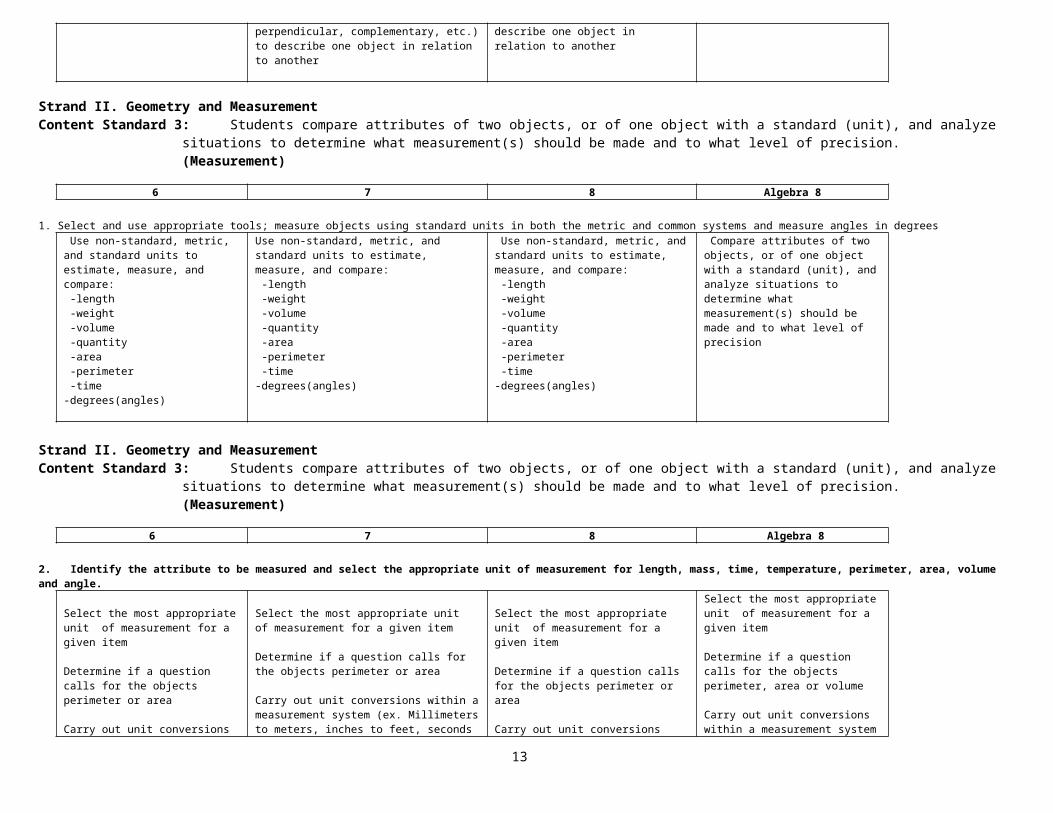
1. Select and use appropriate tools; measure objects using standard units in both the metric and common systems and measure angles in degrees Use non-standard, metric, and standard units to estimate, measure, and compare: -length -weight -volume -quantity -area -perimeter -time-degrees(angles)
Use non-standard, metric, and standard units to estimate, measure, and compare: -length -weight -volume -quantity -area -perimeter -time-degrees(angles)
Use non-standard, metric, and standard units to estimate, measure, and compare: -length -weight -volume -quantity -area -perimeter -time-degrees(angles)
Compare attributes of two objects, or of one object with a standard (unit), and analyze situations to determine what measurement(s) should be made and to what level of precision
Strand II. Geometry and MeasurementContent Standard 3: Students compare attributes of two objects, or of one object with a standard (unit), and analyze situations to determine what
measurement(s) should be made and to what level of precision. (Measurement)
6 7 8 Algebra 8
2. Identify the attribute to be measured and select the appropriate unit of measurement for length, mass, time, temperature, perimeter, area, volume and angle.
Select the most appropriate unit of measurement for a given item
Determine if a question calls for the objects perimeter or area
Carry out unit conversions within a measurement system (ex. Millimeters to meters, inches to feet, seconds to minutes)
Select the most appropriate unit of measurement for a given item
Determine if a question calls for the objects perimeter or area
Carry out unit conversions within a measurement system (ex. Millimeters to meters, inches to feet, seconds to minutes)
Use a proportion to convert from one unit of measurement to another
Select the most appropriate unit of measurement for a given item
Determine if a question calls for the objects perimeter, area or volume
Carry out unit conversions within a measurement system (ex. Millimeters to meters, inches to feet, seconds to minutes)
Use a proportion to convert from one unit of measurement to another
3. Estimate measures with a specified degree of accuracy and decide if an estimate or a measurement is “close enough”.Estimate the area of a polygon
Estimate an angles measure within five degrees
Use a “corner checker” to determine if an angle is right or not
Use a grid sheet to estimate the area of a polygon
Estimate an angles measure within five degrees
Use a corner checker to determine if an angle is right or not
Estimate the area of a polygon
Estimate an angles measure within five degrees
Determine if estimates are reasonable
Determine if estimates are reasonable
Strand II. Geometry and MeasurementContent Standard 3: Students compare attributes of two objects, or of one object with a standard (unit), and analyze situations to determine what
measurement(s) should be made and to what level of precision. (Measurement)
10

6 7 8 Algebra 8
4. Interpret measurements and recognize that two objects may have the same measurement on one attribute but not necessarily on the other.Explore objects that have the same perimeter but not the same area and reverse (The Pig Pen problem)
Create 3d objects with the same surface area but different shape or volume and reverse.
Explore objects that have the same perimeter but not the same area and reverse (The Pig Pen problem)
Create 3d objects with the same surface area but different shape or volume and reverse.
Explore objects that have the same perimeter but not the same area and reverse (The Pig Pen problem)
Create 3d objects with the same surface area but different shape or volume and reverse.
Interpret measurements and recognize that two objects may have the same measurement on one attribute but not necessarily on the other
5. Use proportional reasoning and indirect measurements to draw inferences.Compare two quantities with different units of measure
Recognize proportional relationships
Find a unit rate
Compare two quantities with different units of measure
Recognize proportional relationships
Find a unit rate
Compare two quantities with different units of measure
Recognize proportional relationships
Find a unit rate
Compare quantities with different units of measure
Recognize proportional relationships
Find a unit rate
6. Apply measurement to describe the real world and to solve problems.Use proportions to solve real world problems.
Use an integer to represent a given situation
Use maps and scale drawings to find actual measures
Use proportions to solve real world problems.
Use an integer to represent a given situation
Find the scale factor given the area and perimeter ratios
Use maps and scale drawings to find actual measures
Use proportions to solve real world problems.
Use an integer to represent a given situation
Find the scale factor given the area and perimeter ratios
Use maps and scale drawings to find actual measures
Use proportions to solve real world problems.
Use an integer to represent a given situation
Strand III. Data Analysis and StatisticsContent Standard 1: Students collect and explore data, organize data into a useful form, and develop skill in representing and reading data displayed in different
formats. (Collection, Organization and Presentation of Data)
6 7 8 Algebra 8
1. Collect and explore data through observation, measurement, surveys, sampling techniques and simulations. Collect and record data from an experiment or survey
Collect and record data from an experiment or survey
Collect and record data by conducting a survey using a bias free question
n/a
2Organize data using tables, charts, graphs, spreadsheets and data bases.Given an initial structure organize gathered information and present data in a variety of forms such as equations, graphs, tables, charts, spreadsheets, and plots
Independently organize gathered information and present data in a variety of forms such as equations, graphs, tables, charts, spreadsheets, and plots
Independently organize gathered information and present data in a variety of forms such as equations, graphs, tables, charts, spreadsheets, and plots
Independently organize gathered information and present data in a variety of forms such as equations, graphs, tables, charts, and plots
3. Present data using a variety of appropriate representations and explain why one representation is preferred over another or how a particular representation may bias the presentation.
11

Compare different representations of the same data (i.e. data in chart form versus graph form, bar graph vs line graph).
Determine which type of graph (line, circle, bar) best fits a given data set
Demonstrate how scale can influence a data sets interpretation
Compare different representations of the same data (i.e. data in chart form versus graph form, bar graph vs line graph).
Determine which measure of central tendency (mean, median, mode and rage)best represents the data
Determine which type of graph (line, circle, bar) best fits a given data set
Demonstrate how scale and the use of a scale break can influence a data sets interpretation
Determine whether it is most appropriate to use the slope-intercept or the standard form of an equation
Graph solution sets for open sentences
Graph solution sets for systems of equations using crosshatching or shading
4. Identify what data are needed to answer a particular question or solve a given problem, and design and implement strategies to obtain, organize and present those data.
Use a data sets range to create an appropriate scale
Identify unnecessary and needed information in a given problem
Determine if a graph is misleading
Design investigations to address a question and consider how data collection methods affect the nature of the data set.
Determine a graphs scale and interval
Identify unnecessary and needed information in a given problem
Determine if a graph is misleading Identify why a graph is misleading
Design investigations to address a question and consider how data collection methods affect the nature of the data set.
Determine a graphs scale and intervalIdentify unnecessary and needed information in a given problem
Determine if a graph is misleading
Identify how to make a misleading graph more realistic
Identify unnecessary and needed information in a given problem
Use substitution to solve systems of linear equations
Determine a graph’s scale and interval
Strand III. Data Analysis and StatisticsContent Standard 2: Students examine data and describe characteristics of the distribution, relate data to the situation from which they arose, and use data to
answer questions convincingly and persuasively. (Description and Interpretation)
6 7 8 Algebra 8
1. Critically read data from tables, charts or graphs and explain the source of the data and what the data represent.Identify the highest and lowest pieces of information from bar, circle, scatterplot, pictograph, and line graphs
Compare information from different graphs noting variances in scale and interval
Determine least, most, and congruent information from a bar, circle, scatterplot, and line graph
Compare information from different graphs noting variances in scale and interval
Identify the mode from reading a line or stem and leaf plot
Determine if a scatterplot shows a positive, negative or no relationship(correlation)
Determine least, most, and congruent information from a bar, circle, scatterplot, pictograph, box and whisker plot and line graph
Compare information from different graphs noting variances in scale and interval
Identify the mode from reading a line or stem and leaf plot
Determine if a scatterplot shows a
Read a graph to interpret whether it is a function or relation
Match a graph to the equation of its hyperbola
12
positive, negative or no relationship(correlation)
2. Describe the shape of a data distribution and identify the shape, the spread, correlations and any outliers.
Find any outliers in a data set
Find the range of a data set
Determine if a scatterplot shows a positive, negative or no relationship(correlation)
Identify a trend line (if any) in a data set
Find any outliers in a data set
Find the range of a data set
Identify a trend line (if any) in a data set
Find any outliers in a data set
Find the range of a data set
Describe the shape & important features of a set of a data and compare related data sets, with an emphasis on how the data are distributed.
Describe the shape and important features of a set of a data and compare related data sets, with an emphasis on how the data are distributed.
3. Draw, explain and justify conclusions based on data.Summarize results of a survey in written form
Present survey results verbally to the class
Make defensible inferences from a set of data noting any misleading aspects or outliers in the data set
Summarize results of a survey in written form
Present survey results verbally to the class
Make defensible inferences from a set of data noting any misleading aspects or outliers in the data set
Summarize results of a survey in written form
Present survey results verbally to the class
Make defensible inferences from a set of data noting any misleading aspects or outliers in the data set
Use graphs to solve systems of linear equations
4. Critically question the sources of data; the techniques used to collect, organize and present data; the inferences drawn from the data; and the possible sources of bias in the data or the presentation.
Identify questions and samples containing biased or misleading characteristics
Identify questions and samples containing biased or misleading characteristics
Determine if a graphs scale and interval are appropriate for the data
Identify questions and samples containing biased or misleading characteristics
Determine if a graphs scale and interval are appropriate for the data
.
5. Formulate questions and problems and gather and interpret data to answer those questions. Formulate questions and problems, gather and interpret data to answer those questions.
Formulate questions and problems, gather and interpret data to answer those questions.
Formulate questions and problems, gather and interpret data to answer those questions.
Strand III. Data Analysis and StatisticsContent Standard 3: Students draw defensible inferences about unknown outcomes, make predictions, and identify the degree of confidence they have in their
predictions.(Inference and Prediction)
6 7 8 Algebra 8
1. Make and test hypotheses. Make predictions based on data
Compare predictions with actual results
Make predictions based on data
Compare predictions with actual results
Make predictions based on data
Compare predictions with actual results
13

2. Design experiments to model and solve problems using sampling, simulations and controlled investigations.Survey a small group and compare the results to a larger group
Conduct experiments involving probability and compare their results to the theoretical probability.(ex. Dice outcomes)
Survey a small group and compare the results to a larger group
Conduct experiments involving probability and compare their results to the theoretical probability.(ex. Dice outcomes)
Survey a small group and compare the results to a larger group
3. Formulate, and communicate arguments and conclusions based on data and evaluate their arguments and those of others.Determine the fairness of games of chance
Evaluate questions and surveys looking for bias and fairness in their design and representation
Determine the fairness of games of chance
Evaluate questions and surveys looking for bias and fairness in their design and representation
4. Make predictions and decisions based on data including interpolations and extrapolations. Make predictions based on data. Make predictions based on data.
Make predictions about future values on a graph
Make predictions based on data.
Make predictions about future values on a graph
Make predictions about the slope of a line based on its equation in standard form
5. Employ investigations, mathematical models and simulations to make inferences and predictions to answer questions and solve problems..Make inferences from data
Predict what will come next based on data
Make inferences from a sample of data. (ex:Did a class as a whole score well on a test based on the median, mode, range, mean?)
Use a data sample to make predictions about a group (The monster problem)
Make inferences from data
Predict future outcomes based on data
Make predictions based on data
Make predictions about future values on a graph
Strand IV. Number Sense and NumerationContent Standard 1: Students experience counting and measuring activities to develop intuitive sense about numbers, develop understanding about properties
of numbers, understand the need for and existence of different sets of numbers, and investigate properties of special numbers. (Concepts and Properties of Numbers)
6 7 8 Algebra 8
1. Develop an understanding of integers and rational numbers and represent rational numbers in both fraction and decimal form. Read, write, & understand numerals from millions to thousandths.
Read and write decimals.
Classify a given number as whole, decimal, rational, integer
Represent numbers as rational numbers in lowest terms
Convert between a decimal and a rational number
Read, write, & understand numerals from millions to thousandths.
Read and write decimals.
Classify a given number as whole, decimal, rational, integer
Represent numbers as rational numbers in lowest terms
Convert between a decimal and a rational number
Read, write, & understand numerals from millions to thousandths.
Read and write decimals.
Classify a given number as whole, decimal, rational, integer
Represent numbers as rational numbers in lowest terms
Convert between a decimal and a rational number
Read, write, & understand numerals from millions to thousandths.
Read and write decimals.
Classify a given number as whole, decimal, rational, integer
Represent numbers as rational numbers in lowest terms
Convert between a decimal and a rational number
14

Identify fractions as rational numbers
Convert between a numbers decimal and fractional equivalents
Simplify, add, subtract, multiply and divide fractional equations
Identify fractions as rational numbers
Convert between a numbers decimal and fractional equivalents
Simplify, add, subtract, multiply and divide fractional equations
Identify fractions as rational numbers
Convert between a numbers decimal and fractional
Simplify, add, subtract, multiply and divide fractional equations
Identify fractions as rational numbers
Convert between a numbers decimal and fractional equivalent
Simplify, add, subtract, multiply and divide fractional and algebraic fractional equations
Develop and use the real numbers and all their subsets throughout the year
Express answers to various problems in both exact and approximate form
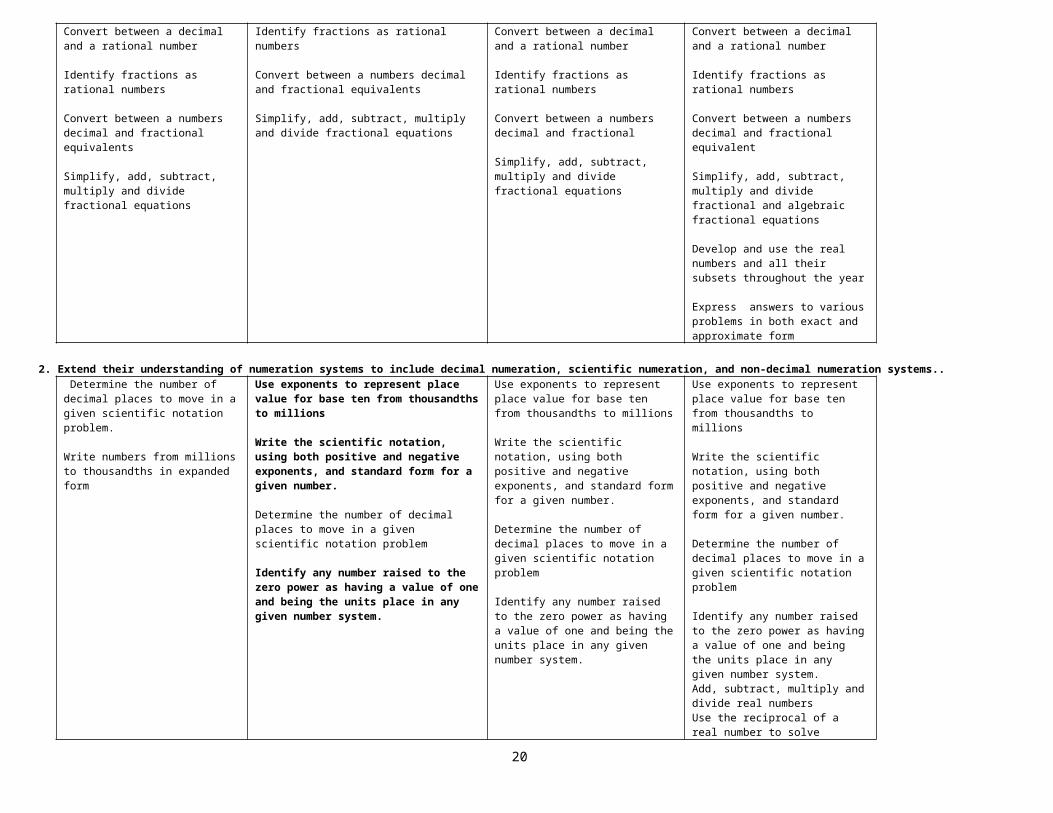
2. Extend their understanding of numeration systems to include decimal numeration, scientific numeration, and non-decimal numeration systems.. Determine the number of decimal places to move in a given scientific notation problem. Write numbers from millions to thousandths in expanded form
Use exponents to represent place value for base ten from thousandths to millions Write the scientific notation, using both positive and negative exponents, and standard form for a given number.
Determine the number of decimal places to move in a given scientific notation problem
Identify any number raised to the zero power as having a value of one and being the units place in any given number system.
Use exponents to represent place value for base ten from thousandths to millions Write the scientific notation, using both positive and negative exponents, and standard form for a given number.
Determine the number of decimal places to move in a given scientific notation problem
Identify any number raised to the zero power as having a value of one and being the units place in any given number system. Add, subtract, multiply and divide real numbersUse the reciprocal of a real number to solve equations
Write and use both positive and negative exponents and scientific notation to solve problems involving very large and very small numbers
3. Develop an understanding of the properties of the integer and rational number systems and of the properties of special numbers including 0, 1 and pi and the additive and multiplicative inverses.
Name numbers in between any two given numbers in either decimal or rational form
Compare and order from least to greatest a given set of numbers in either fractional, integer or decimal form
Use order of operations to solve
Name numbers in between any two given numbers in either decimal or rational form
Compare and order from least to greatest a given set of numbers in either fractional, integer or decimal form
Use order of operations to solve problems
Use the associative, distributive, identify,
Name numbers in between any two given numbers in either decimal or rational form
Compare and order from least to greatest a given set of numbers in either fractional, integer or decimal form
Use order of operations to solve
Compare and order from least to greatest a given set of numbers in either fractional, integer or decimal form
Use order of operations to solve problems
Use the associative, distributive, identify, commutative and zero
15

problems
Recognize various forms of a number’s additive and multiplicative inverse
Use pi to find the circumference and area of circles
commutative and zero properties to solve problems
Identify a given numbers additive and multiplicative inverse
Use pi to find the circumference and area of circles
Identify pi as the ratio between any circles circumference and diameter
problems
Use the associative, distributive, identify, commutative and zero properties to solve problems
Identify a given numbers additive and multiplicative inverse
Use pi to find the circumference and area of circles
Identify pi as the ratio between any circles circumference and diameter
properties to solve problems
Identify a given numbers additive and multiplicative inverse
Use pi to find the circumference and area of circles
Identify pi as the ratio between any circles circumference and diameter
Distinguish between exact and approximate representations of pi
Strand IV. Number Sense and NumerationContent Standard 1: Students experience counting and measuring activities to develop intuitive sense about numbers, develop understanding about properties
of numbers, understand the need for and existence of different sets of numbers, and investigate properties of special numbers. (Concepts and Properties of Numbers)
6 7 8 Algebra 8
4. Apply their understanding of number systems to solve mathematical and applied problems. Solve real world problems involving divisibility, greatest common factor, least common multiple
Solve problems linking fractions to music, stocks, and other actual situations
Write addition, subtraction, multiplication, and division equations to represent a given situation involving fractions, integers and rational numbers.
Solve real world problems involving divisibility, greatest common factor, least common multiple
Solve problems linking fractions to music, stocks, and other actual situations
Write addition, subtraction, multiplication, and division equations to represent a given situation involving fractions, integers and rational numbers.
Solve real world problems involving divisibility, prime or composite, greatest common factor, least common multiple
Solve problems linking fractions to music, stocks, and other actual situations
Write addition, subtraction, multiplication, and division equations to represent a given situation involving fractions, integers and rational numbers.
Solve cost, income, and value problems
Solve time, rate and distance problems
Use factoring and factoring patterns to solve problems
Solve problems involving percent, mixture and work
Analyze problems to determine the number system appropriate for the solution set
Strand IV. Number Sense and NumerationContent Standard 2: Students recognize that numbers are used in different ways such as counting, measuring, ordering, and estimating, understand and
produce multiple representations of a number, and translate among equivalent representations. (Representation and Uses of Numbers)
6 7 8 Algebra 8
1. Give geometric representations of various numbers and number concepts; represent rational numbers and integers on the number line.Compare fractional parts of regions where the regions are of different sizes and shapes.
Explore equivalent fractions by matching fractional parts of regions.
Use pattern blocks and fraction bars, strips, or circles to demonstrate whole, ½,1/3,1/4,1/6, 1/10
Use pattern blocks and fraction bars, strips, or circles to demonstrate whole, ½,1/3,1/4,1/6, 1/10
Use grid sheets to demonstrate numbers which are prime and composite
Use square tiles to demonstrate triangular, rectangular and square numbers
Use two color bingo chips or tiles to
Use grid sheets to demonstrate numbers which are prime and composite
Use square tiles to demonstrate triangular, rectangular and square numbers
Use two color bingo chips or tiles to demonstrate addition, subtraction and multiplication with integers
Represent polynomials as the combination of two and three dimensional figures
Identify a decimal, integral or rational numbers location on a number line
Solve inequalities and relate the solution sets to the number line
16

Identify a decimal, integral or rational numbers location on a number line
demonstrate addition, subtraction and multiplication with integers
Identify a decimal, integral or rational numbers location on a number line
Identify a decimal, integral or rational numbers location on a number line
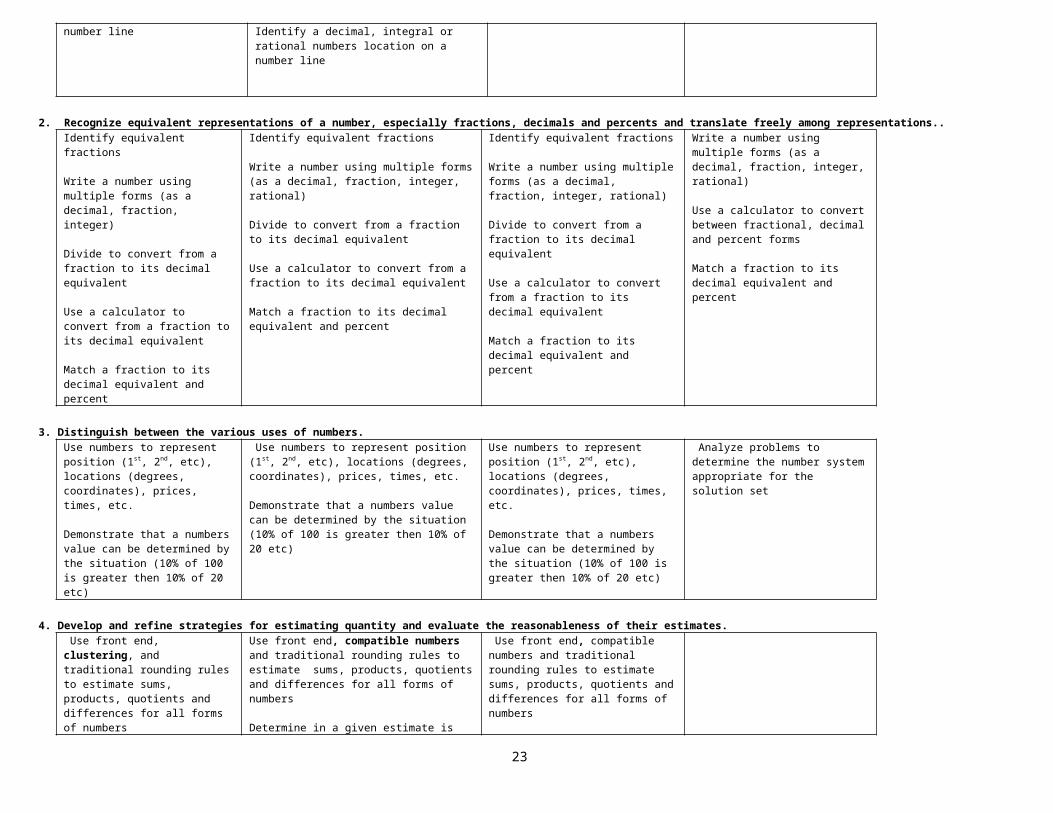
2. Recognize equivalent representations of a number, especially fractions, decimals and percents and translate freely among representations..Identify equivalent fractions
Write a number using multiple forms (as a decimal, fraction, integer)
Divide to convert from a fraction to its decimal equivalent
Use a calculator to convert from a fraction to its decimal equivalent
Match a fraction to its decimal equivalent and percent
Identify equivalent fractions
Write a number using multiple forms (as a decimal, fraction, integer, rational)
Divide to convert from a fraction to its decimal equivalent
Use a calculator to convert from a fraction to its decimal equivalent
Match a fraction to its decimal equivalent and percent
Identify equivalent fractions
Write a number using multiple forms (as a decimal, fraction, integer, rational)
Divide to convert from a fraction to its decimal equivalent
Use a calculator to convert from a fraction to its decimal equivalent
Match a fraction to its decimal equivalent and percent
Write a number using multiple forms (as a decimal, fraction, integer, rational)
Use a calculator to convert between fractional, decimal and percent forms
Match a fraction to its decimal equivalent and percent
3. Distinguish between the various uses of numbers.Use numbers to represent position (1st, 2nd, etc), locations (degrees, coordinates), prices, times, etc.
Demonstrate that a numbers value can be determined by the situation (10% of 100 is greater then 10% of 20 etc)
Use numbers to represent position (1st, 2nd, etc), locations (degrees, coordinates), prices, times, etc.
Demonstrate that a numbers value can be determined by the situation (10% of 100 is greater then 10% of 20 etc)
Use numbers to represent position (1st, 2nd, etc), locations (degrees, coordinates), prices, times, etc.
Demonstrate that a numbers value can be determined by the situation (10% of 100 is greater then 10% of 20 etc)
Analyze problems to determine the number system appropriate for the solution set
4. Develop and refine strategies for estimating quantity and evaluate the reasonableness of their estimates. Use front end, clustering, and traditional rounding rules to estimate sums, products, quotients and differences for all forms of numbers
Use front end, compatible numbers and traditional rounding rules to estimate sums, products, quotients and differences for all forms of numbers
Determine in a given estimate is reasonable
Use front end, compatible numbers and traditional rounding rules to estimate sums, products, quotients and differences for all forms of numbers
Determine in a given estimate is reasonable
Estimate within a given range of reasonableness
Strand IV. Number Sense and NumerationContent Standard 2: Students recognize that numbers are used in different ways such as counting, measuring, ordering, and estimating, understand and
produce multiple representations of a number, and translate among equivalent representations. (Representation and Uses of Numbers)
6 7 8 Algebra 8
5. Select appropriate representations for numbers, including integers and rational numbers in order to simplify and solve problems. Determine the most appropriate representation(fraction, decimal, integer or percent)of a number to
Determine the most appropriate representation(fraction, decimal, integer or percent)of a number to solve a given problem
Determine the most appropriate representation(fraction, decimal, integer or percent)of a number to solve a given
Determine the most appropriate representation(fraction, decimal, integer or percent)of a number to
17

solve a given problem problem solve a given problem
Strand IV. Number Sense and NumerationContent Standard 3: Students investigate relationships such as equality, inequality, inverses, factors and multiples, and represent and compare very large and
very small numbers. (Number Relationships)
6 7 8 Algebra 8
1. Compare and order integers and rational numbers using relations of equality and inequality.
Compare and order integers and rational numbers (both like and unlike denominators) using “equal”, “less than”, or “greater than.”(>, <, =)
Compare and order integers and rational numbers (both like and unlike denominators) using “equal”, “less than”, or “greater than.”(>, <, =)
Compare and order integers and rational numbers (both like and unlike denominators) using “equal”, “less than”, or “greater than.”(>, <, =)
Compare and order integers and rational numbers (both like and unlike denominators) using “equal”, “less than”, or “greater than.”(>, <, =)
2. Express numerical comparisons as ratios and rates.Use ratios to compare quantities
Compare quantities involving measures
Find equivalent ratios and rates
Use tables to analyze ratios and rates
Use ratios to compare quantities
Compare quantities involving measures
Find equivalent ratios and rates
Use tables to analyze ratios and rates
Use ratios to compare quantities
Compare quantities involving measures
Find equivalent ratios and rates
Use tables to analyze ratios and rates
Use ratios to compare quantities
Compare quantities involving measures
Find equivalent ratios and rates
Use tables to analyze ratios and rates
Use long division to divide polynomials
3. Explore the relationships of primes, factors, multiples and divisibility.Identify a number as either prime or composite
Identify factors, multiples, common factors and multiples of give numbers
Apply divisibility tests for 2,3,5,6,9,and 10
Write a number as a product of its prime factors using exponents
Distinguish between prime and composite numbers
Identify factors, multiples, common factors and multiples, and relatively prime numbers
Apply divisibility tests for 2,3,4,5,6,8,9,and 10
Write a number as a product of its prime factors using exponents
Distinguish between prime and composite numbers
Identify factors, multiples, common factors and multiples, and relatively prime numbers and algebraic expressions
Apply divisibility tests for 2,3,4,5,6,8,9,and 10
Write a number or algebraic expression as a product of its prime factors using exponents
Distinguish between prime and composite numbers
Identify factors, multiples, common factors and multiples, and relatively prime numbers and algebraic expressions
Write a number or algebraic expression as a product of its prime factors using exponents
Factor various algebraic expressions
Strand IV. Number Sense and NumerationContent Standard 3: Students investigate relationships such as equality, inequality, inverses, factors and multiples, and represent and compare very large and
very small numbers. (Number Relationships)
6 7 8 Algebra 8
18

4. Explain the meaning of powers and roots of numbers and use calculators to compute powers and square roots.Express a numbers square root concretely by demonstrating that the square root is the length of a side of a square with a given area
Express a numbers square root concretely by demonstrating that the square root is the length of a side of a square with a given area
Use a calculator to find a numbers square and square root
Use a square root table to find a numbers square and square root
Determine if a number is a perfect square
Determine what two integers a numbers square root is between
Use a calculator to find the standard form of a number raised to a given power
Find monomial factors of bi and polynomials
Multiply binomials mentally
Use powers and roots to simplify expressions and to solve equations
Multiply polynomials
Find squares and square roots of binomials
Express solutions in radical form
5. Apply their understanding of number relationships and solving problems.Use understanding of number relationships to solve problems involving real-world applications
Use understanding of number relationships to solve problems involving real-world applications.
Use understanding of number relationships to solve problems involving real-world applications.
Use understanding of number relationships to solve problems involving real-world applications.
Apply polynomials to solve problems involving area
Strand V. Numerical and Algebraic Operations and Analytical ThinkingContent Standard 1: Students understand and use various types of operations (e.g., addition, subtraction, multiplication, division) to solve problems.
(Operations and their Properties)
6 7 8 Algebra 8
1. Use manipulatives and diagrams to model operations and their inverses with integers and rational numbers and relate the model to their symbolic expressions.
Represent the numbers in a given problem symbolically in order to solve for a missing value
Se algebra tiles or other two color objects to model positive and negative numbers
Use bingo chips to demonstrate addition, subtraction, division and multiplication of integers
Use black and red cards to model addition, subtraction and multiplication of integers
Represent the numbers in a given problem symbolically in order to solve for a missing value
Represent the numbers in a given problem symbolically in order to solve for a missing value
Represent the numbers in a given problem symbolically in order to solve for a missing value
2. Choose the appropriate algorithm and mathematical operations to manipulate numbers in a variety of forms.Choose and apply the appropriate method of computation for a given task (i.e. estimation, paper-and-pencil, mental math, or calculator).
Explain why a particular method is chosen to fit a given problem
Choose and apply the appropriate
Choose and apply the appropriate method of computation for a given task (i.e. estimation, paper-and-pencil, mental math, or calculator).
Explain why a particular method is chosen to fit a given problem
Choose and apply the appropriate operation(s) to fit a given problem
Choose and apply the appropriate method of computation for a given task (i.e. estimation, paper-and-pencil, mental math, or calculator).
Choose and apply the appropriate operation(s) to fit a given problem
Choose and apply the appropriate method of computation for a given task (i.e. estimation, paper-and-pencil, mental math, or calculator).
Choose and apply the appropriate operation(s) to fit a given problem
19
operation(s) to fit a given problem
One digit divisors should be done without a calculator
One digit divisors should be done without a calculator
One digit divisors should be done without a calculator
One digit divisors should be done without a calculator
3. Describe the properties of operations with rationals and integers and give examples of how they use those properties.Demonstrate the use of the commutative, distributive, identity, associative and zero properties
Identify a numbers additive inverse
Match the above properties to a given example
Demonstrate the use of the commutative, distributive, identity, associative and zero properties
Identify a numbers additive and multiplicative inverse
Identify the closure property
Match the above properties to a given example
Demonstrate the use of the commutative, distributive, identity, associative and zero properties to simplify expressions and solve equations
Use an additive and multiplicative inverse to isolate variables
Identify the closure property for real numbersMatch the above properties to a given example
4. Efficiently and accurately apply operations with integers, rational numbers and simple algebraic expressions involving problems.
Accurately solve addition, subtraction, multiplication and division problems with integers, rational numbers (both like and unlike denominators) and one-step algebraic expressions both with and without a calculator.
Determine a number’s absolute value
Accurately solve addition, subtraction, multiplication and division problems with integers, rational numbers (both like and unlike denominators) and one-step algebraic expressions both with and without a calculator.
Accurately solve addition, subtraction, multiplication and division problems with integers, rational numbers (both like and unlike denominators) and one-step and two- step algebraic expressions both with and without a calculator.
Accurately solve addition, subtraction, multiplication and division problems with integers, rational and real numbers (both like and unlike denominators) and one-step and multiple step algebraic expressions both with and without a calculator.
Strand V. Numerical and Algebraic Operations and Analytical ThinkingContent Standard 2: Students analyze problems to determine an appropriate process for solution, and use algebraic notations to model or represent problems. (Algebraic and Analytic Thinking)
6 7 8 Algebra 8
1. Read, write, create and simplify algebraic expressions. Solve linear equations and inequalities.Match a given expression to its word phrase
Create an algebraic expression to match a given situation
Translate between verbal and algebraic expression.
Determine if a term will be a variable or a constant
Match a given expression to its word phrase
Create an algebraic expression to match a given situation
Translate between verbal and algebraic expression
Simplify simple algebraic expressions involving like terms (ex. 3x +2x = 5x)
Determine if a term will be a variable or a constant
Match a given expression to its word phrase
Create an algebraic expression to match a given situation
Translate between verbal and algebraic expression
Simplify simple algebraic expressions involving like terms (ex. 3x +2x = 5x) and mixed terms (3x + 4b + 3x)
Determine if a term will be a variable or a constant
Match a given expression to its word phrase
Create an algebraic expression to match a given situation
Translate between written and algebraic expression
Simplify simple algebraic expressions involving like terms (ex. 3x +2x = 5x) and mixed terms (3x + 4b + 3x)
Determine if a term will be a variable or a constant
Use multiple grouping symbols
20

2. Represent algebraic concepts with a variety of models and write corresponding algebraic expressions Construct tables of input and output like: “What’s My Rule?”(2,4,6, 8 . . . Rule is +2) and “What comes next?”
Represent and model situations using a rule, table or graph
Construct tables of input and output like: “What’s My Rule?”(2,4,6, 8 . . . Rule is +2) and “What comes next?”
Represent and model situations using a rule, table, function machine or graph
Construct tables of input and output like: “What’s My Rule?”(2,4,6, 8 . . . Rule is +2) and “What comes next?”
Represent and model situations using a rule, table, function machine or graph
Represent and model situations using algebraic equations and expressions
3. Solve linear equalities and inequalities using algebraic and geometric methods, and use the context of the problem to interpret and explain their solutions.Solve problems using = and not = using algebraic and geometric methods (equations or pictorial representations)
Explain and justify a solution to a given equation
Solve problems using = and not = using algebraic and geometric methods (equations or pictorial representations)
Explain and justify a solution to a given equation
Order real numbers
Solve problems using = and not = using algebraic and geometric methods (equations or pictorial representations)
Explain and justify a solution to a given equation
Order real numbers
Solve problems using = and not = using algebraic and geometric methods (equations or pictorial representations)
Order real numbers
Explain and justify a solution to a given equation
Use pictures to represent problems to assist in setting algebraic equations
4. Analyze, solve and evaluate strategies for solving problems using linear functions.Use working backwards, trying a smaller problem, guess and test to solve a variety of problems.
Use working backwards, a smaller problem, guess and test to solve a variety of problems.
Use the “name(inverse) write, solve, check” process to find the solution to one step algebraic equations
Use an equation to solve a given story problem
Use an equation and inverse operations to solve for a variable in a given equation
Find the reciprocal and the opposite for a given number
Use an equation and inverse operations to solve for a variable in a given equation
Find the reciprocal and the opposite for a given number
Solve systems of linear equations by graphing, substitution, and elimination
5. Students employ algebraic and analytic thinking and the power of technology to explore problems in a modern society.
Selects and uses appropriate technology (calculator, spreadsheet, compass, protractor, ruler, paper and pencil) to enhance mathematical understanding.
Selects and uses appropriate technology (calculator, spreadsheet, compass, protractor, ruler, paper and pencil) to enhance mathematical understanding.
Selects and uses appropriate technology (calculator, spreadsheet, compass, protractor, ruler, paper and pencil) to enhance mathematical understanding.
Selects and uses appropriate technology (calculator, spreadsheet, compass, protractor, ruler, paper and pencil) to enhance mathematical understanding
Strand VI. Probability and Discrete MathematicsContent Standard 1: Students develop an understanding of the notion of certainty and of probability as a measure of the degree of likelihood that can be
assigned to a given event based on the knowledge available, and make critical judgments about claims that are made in probabilistic situations. (Probability)
6 7 8 Algebra 8
1. Describe events as likely or unlikely and give qualitative and quantitative descriptions of the degree of likelihood.Use simple devices such as coins, spinners or dice in activities to
Use simple devices such as coins, spinners or dice in activities to model probability
Describe a given event as likely or unlikely
21

model probability
Describe a given event as likely or unlikely
Describe a given event as likely or unlikely
2. Describe probability as a measure of certainty ranging from 0 to 1 and conduct activities that allow them to express probabilities of simple events in mathematical terms.
Conduct experiments using coins, dice, cards, spinners or other simple devices, and express the likelihood of given events
Describe the likelihood of a given event using fractions.
Describe an events probability as a number between zero and one
Conduct experiments using coins, dice, cards, spinners or other simple devices, and express the likelihood of given events
Describe an events probability as a number between zero and one
Describe the likelihood of a given event using fractions.
3. Conduct experiments and give examples to illustrate the difference between dependent and independent events.
Conduct experiments using cards, dice, spinners, coins or other simple devices that include events both with and without replacement as well as the use of events with the terms and /or. (ex: Probability of rolling a 2 or 3)
Conduct experiments using cards, dice, spinners, coins or other simple devices that include events both with and without replacement as well as the use of events with the terms and /or. (ex: Probability of rolling a 2 or 3)
Find the mathematical probability of an independent or dependent event
Determine a given event as dependent or independent
Find the mathematical probability of an independent or dependent event
4. Explain the difference between experimental and theoretical probability and explain how probability changes for large numbers of trials. Use a class generated data set for a coin toss or dice roll to compare between individual and group results, theoretical and experimental probability
Be able to explain that as the number of trials increases the experimental probability of a given event approaches the theoretical probability
Conduct experiments and then combine class data to highlight the difference between theoretical and experimental probability
5. Conduct probability experiments and simulations to model and solve problems.Conduct a probability experiment to simulate winning in a game of chance
Interpret and connect the uses of probability to the world around them (insurance rates, life insurance estimates, weather, odds, lotteries, games of chance)
Interpret and connect the uses of probability to the world around them (insurance rates, life insurance estimates, weather, odds, lotteries, games of chance)
Conduct a probability experiment to simulate winning in a game of chance
Interpret and connect the uses of probability to the world around them (insurance rates, life insurance estimates, weather, odds, lotteries, games of chance)
Strand VI. Probability and Discrete Mathematics
22
Content Standard 2: Students investigate practical situations such as scheduling, routing, sequencing, networking, organizing and classifying, and analyze ideas like recurrence relations, induction, iteration, and algorithm design. (Discrete Mathematics)
6 7 8 Algebra 8
1. Use manipulatives, diagrams and the fundamental theorem of counting to count permutations and combinations. Use a tree diagram to model the possible outcomes for a given event
Use a tree diagram to model the possible outcomes for a given event
Use the counting principle to find the number of outcomes
Use factorial products to count arrangements
List all the possible combinations of a given event
Use a tree diagram to model the possible outcomes for a given event
Use the counting principle to find the number of outcomes
Use factorial products to count arrangements
List all the possible combinations of a given event
Distinguish between combination and permutation
2. Use sets and set relationships to explore and solve simple algebraic and geometric problems.Classify numbers as those which could be linear or those which could be geometric representations(ex. Units vs. units squared)
Use real world models for perimeter and area
Use pattern blocks, grid sheets or tiles to model patterns involving perimeter and area
Classify numbers as those which could be linear or those which could be geometric representations(ex. Units vs. units squared)
Determine if a set is open or closed under a given operation
Determine if a set is open or closed under a given operation
3. Solve problems involving networks, for example planning delivery routes or counting paths between points. Trace a figure without lifting your pencil or finger.
Use dot figures to model the combination of x number of things taken two at a time
Explore problems involving networks, combinations or delivery routes.
4. Explore recurrence relations and iterations.Determine if a decimal terminates or repeats
Express a common fraction as either a terminating, repeating number
Determine if a decimal terminates or repeats
Express a common fraction as either a terminating, repeating or irrational number
Explore pi as a non terminating, non repeating decimal
Determine if a decimal terminates or repeats
Express a common fraction as either a terminating, repeating or irrational number
Explore pi as a non terminating, non repeating decimal
Express a common fraction as either a terminating, repeating or irrational number
Find square roots of variable expressons
Explore pi as a non terminating, non repeating decimal
5. Mathematical applications frequently require students to develop their own procedures for solving problems.Provide problem solving Provide problem solving opportunities that Provide problem solving opportunities Provide problem solving
23

opportunities that include but are not limited to oral and written activities, manipulatives, group and individual work, pictures and diagrams to allow the students to model mathematical situations and solutions
include but are not limited to oral and written activities, manipulatives, group and individual work, pictures and diagrams to allow the students to model mathematical situations and solutions
that include but are not limited to oral and written activities, manipulatives, group and individual work, pictures and diagrams to allow the students to model mathematical situations and solutions
opportunities that include but are not limited to oral and written activities, manipulatives, group and individual work, pictures and diagrams to allow the students to model mathematical situations and solutions
6. Use discrete mathematics concepts to model and solve problems with or without solutions.Determine if a problem has a solution
Be able to state what information is needed to find a solution
Decide upon the best solutions for a given problem
Determine if a problem has a solution
Be able to state what information is needed to find a solution
Determine how many solutions exist for a given situation
Decide upon the best solutions for a given problem
Determine if a problem has a solution
Be able to state what information is needed to find a solution
Determine how many solutions exist for a given situation
Decide upon the best solutions for a given problem
Determine if a problem has a solution
Be able to state what information is needed to find a solution
Determine how many solutions exist for a given situation
Decide upon the best solutions for a given problem
24