Embed Size (px)
Citation preview

Storing vital products with care ANNUAL REPORT 2016

We ensure safe, efficient and clean storage of products that are needed to meet the basic needs of people. This is what our stakeholders expect from us. This is what they value us for. We store vital products with care
Intro
du
ction
Execu
tive Bo
ard rep
ort
Sto
ring
vital pro
du
cts w
ith care
Key d
evelop
men
ts p
er divisio
nS
ustain
ability
Govern
ance, risk
and
com
plian
ceFin
ancial S
tatemen
tsA
dd
ition
al info
rmatio
n

Introduction 3Executive Board report 11Storing vital products with care
24Key developments per division
42
Sustainability 55
Governance, risk and compliance
85
Financial Statements 118
Additional information 211
ContentsVopak at a glance 4Key figures 5CEO statement 6Profile, mission and strategy 8
Executive Board members 12Report of the Executive Board 13Business environment 16Financial performance 20
Leading assets in leading locations 25Operational leadership 28Service leadership 34Technology leadership 36People leadership 38
Overview 43Netherlands 44Europe, Middle East & Africa 46Asia 48Americas 50LNG 52
Sustainability performance 57Stakeholder engagement and materiality assessment 58Reporting scope 62Notes to Sustainability performance 68Our response to climate change 80Our responsibility towards taxation 83
Supervisory Board members 86Supervisory Board report 88Remuneration report 92Corporate governance 98Internal control and risk management 102Shareholder information 114
Consolidated Financial Statements 120Company Financial Statements 196Other relevant documents 203Executive Board declaration 203Independent auditor’s report 204Assurance report of the independent auditor 208
Non-IFRS proportionate financial information 211Profit Appropriation 213Stichting Vopak 214Principal company officers at 16 February 2017 215Five-year consolidated summary 217Glossary 218Contact us 223
Intro
du
ction
Execu
tive Bo
ard rep
ort
Sto
ring
vital pro
du
cts w
ith care
Key d
evelop
men
ts p
er divisio
nS
ustain
ability
Govern
ance, risk
and
com
plian
ceFin
ancial S
tatemen
tsA
dd
ition
al info
rmatio
n
Intro
du
ction
Execu
tive Bo
ard rep
ort
Sto
ring
vital pro
du
cts w
ith care
Key d
evelop
men
ts p
er divisio
nS
ustain
ability
Govern
ance, risk
and
com
plian
ceFin
ancial S
tatemen
tsA
dd
ition
al info
rmatio
n

Storing vital products with careWe have a long history of connecting the supply of and demand for vital products.Energy, such as oil and gas, for people to cook, heat their homes and travel the world. Chemicals for the manufacturing industry to use in a wide range of products and edible oils to support the growing demand for food and agriculture.
Oil
Gas
Edible oils Chem
icals
VopakFood & agriculture
Man
ufac
turin
g
Energy
| Vopak | Annual Report 2016E
xecutive B
oard
repo
rtS
torin
g vital p
rod
ucts
with
careK
ey develo
pm
ents
per d
ivision
Su
stainab
ilityG
overnan
ce, risk an
d co
mp
liance
Finan
cial Statem
ents
Ad
ditio
nal in
form
ation
Intro
du
ction

IntroductionVopak at a glance
Key figures
CEO statement
Profile, mission and strategy
Intro
du
ction
Execu
tive Bo
ard rep
ort
Sto
ring
vital pro
du
cts w
ith care
Key d
evelop
men
ts p
er divisio
nS
ustain
ability
Govern
ance, risk
and
com
plian
ceFin
ancial S
tatemen
tsA
dd
ition
al info
rmatio
nIn
trod
uctio
nIn
trod
uctio
n
Execu
tive Bo
ard rep
ort
Sto
ring
vital pro
du
cts w
ith care
Key d
evelop
men
ts p
er divisio
nS
ustain
ability
Govern
ance, risk
and
com
plian
ceFin
ancial S
tatemen
tsA
dd
ition
al info
rmatio
n
Execu
tive Bo
ard rep
ort
Intro
du
ction
Introduction
Introduction

Vopak at a glance At year-end 2016
Number of countriesNumber of terminals
Market capitalizationIn EUR billions
2567
5.7
Number of employees In FTE
5,672
Storage capacityIn million cbm
2015
34.3
2016
34.7
2015
0.39
Total Injury Rate (TIR) In 200,000 hours worked own personnel and contractors
2016
0.29
0.29
85% 15%
FY2016 EBITDA in EUR millions -excluding exceptional items-
822Compared to 2015
+1%
FY2016Revenues in EUR millions
1,347Compared to 2015
-3%
FY2016 CFROGA-excluding exceptional items-
10.5%Compared to 2015
+0.1pp
34.7
4 | Vopak | Annual Report 2016In
trod
uctio
nE
xecutive B
oard
repo
rtS
torin
g vital p
rod
ucts
with
careK
ey develo
pm
ents
per d
ivision
Su
stainab
ilityG
overnan
ce, risk an
d co
mp
liance
Finan
cial Statem
ents
Ad
ditio
nal in
form
ation
Intro
du
ction
| Vopak | Annual Report 2016
Vopak at a glance
Vopak at a glance

Key figures2016 2015
Safety performanceTotal Injury Rate (TIR) per 200,000 hours worked for own personnel and contractors 0.29 0.39
Lost Time Injury Rate (LTIR) per 200,000 hours worked for own personnel and contractors 0.13 0.12
Process Safety Events Rate (PSER) per 200,000 hours worked own personnel and contractors 0.23 0.27
Financial results (in EUR millions)Revenues 1,346.9 1,386.0Group operating profit before depreciation and amortization (EBITDA) 1,023.2 805.2
Group operating profit before depreciation and amortization (EBITDA) -excluding exceptional items- 822.3 811.5
Group operating profit (EBIT) 759.3 549.2
Group operating profit (EBIT) -excluding exceptional items- 558.4 555.5
Net profit attributable to holders of ordinary shares 534.0 282.2
Net profit attributable to holders of ordinary shares -excluding exceptional items- 326.1 325.3
Cash flows from operating activities (gross) 783.2 867.2
Capital employed (in EUR millions)Total investments 442.4 581.1
Average gross capital employed 6,673.2 6,620.0
Average capital employed 4,057.9 4,066.7
Capital and financing (in EUR millions)Equity attributable to owners of parent 2,399.7 2,009.4
Net interest-bearing debt 1,804.2 2,295.6
Ratios (excluding exceptional items)EBITDA margin excluding result of joint ventures and associates 51.3% 50.1%
Cash Flow Return On Gross Assets (CFROGA) 10.5% 10.4%
Return On Capital Employed (ROCE) 13.6% 13.7%
Return On Equity (ROE) 14.8% 17.3%
Senior net debt : EBITDA 2.04 2.73
Interest cover (EBITDA : net finance costs) 7.6 7.7
Key figures per ordinary share (in EUR)Basic earnings 4.19 2.21
Basic earnings -excluding exceptional items- 2.56 2.55
Diluted earnings 4.18 2.21
Diluted earnings -excluding exceptional items- 2.55 2.55
(Proposed) dividend 1.05 1.00
Company dataNumber of employees end of period subsidiaries (in FTE) 3,580 3,639
Number of employees end of period joint ventures and associates (in FTE) 2,092 2,263
Total number of employees end of period (in FTE) 5,672 5,902
Storage capacity end of period for subsidiaries (in million cbm) 19.7 20.1
Storage capacity end of period for joint ventures and associates (in million cbm) 12.2 11.9
Storage capacity end of period operatorships (in million cbm) 2.8 2.3
Occupancy rate subsidiaries (average rented storage capacity) 93% 92%
Contracts > 3 years (as a percentage of revenues) 45% 48%
Contracts > 1 year (as a percentage of revenues) 77% 76%
Information on a proportionate basisGroup operating profit before depreciation and amortization (EBITDA) -excluding exceptional items- 916.9 904.1
Cash Flow Return On Gross Assets (CFROGA) -before interest, after tax- 10.2% 10.2%
Occupancy rate subsidiaries, joint ventures and associates 94% 92%
Number of shares outstandingBasic weighted average 127,498,822 127,622,305
Weigthed average including dilutive effect 127,715,702 127,761,760
Total including treasury shares end of period 127,835,430 127,835,430
Treasury shares end of period 370,000 290,000
5Key figures |In
trod
uctio
nE
xecutive B
oard
repo
rtS
torin
g vital p
rod
ucts
with
careK
ey develo
pm
ents
per d
ivision
Su
stainab
ilityG
overnan
ce, risk an
d co
mp
liance
Finan
cial Statem
ents
Ad
ditio
nal in
form
ation
Intro
du
ction
Intro
du
ction
Execu
tive Bo
ard rep
ort
Sto
ring
vital pro
du
cts w
ith care
Key d
evelop
men
ts p
er divisio
nS
ustain
ability
Govern
ance, risk
and
com
plian
ceFin
ancial S
tatemen
tsA
dd
ition
al info
rmatio
n
5E
xecutive B
oard
repo
rt
Intro
du
ction
| Vopak | Annual Report 2016
Key figures
Key figures

CEO statement
Storing vital products with care
2016 was first and foremost the year in which we celebrated our 400-year history. A milestone for our company, instilling a sense of pride in all of us. It has been a long and rich journey, which took us from unloading tea, cotton and spices in the port of Amsterdam, to storing LNG, fuels, edible oils and chemicals in key ports around the world.
While change has been a constant factor in our history, its pace is currently faster and its impact more profound than ever before. This impelled us to ask ourselves a fundamental question: what makes us relevant to society today and what will make us relevant tomorrow? We discussed this with stakeholders in many areas of business and society. Their views converged. Vital products like energy, food and chemicals are in growing demand, as the world population is increasing and becoming more affluent. Through our global network of terminals, we connect supply and demand. Energy that allows people to cook, heat their homes and travel throughout the world. Chemicals for a wide range of products, from car and smartphone components to insulation material. Edible oils and fertilizers to support the growing demand for food.
We ensure safe, efficient and clean storage of products that are needed to meet the basic needs of people. This is what our stakeholders expect from us. This is what they value us for. We store vital products with care.
Eelco HoekstraChairman of the Executive Board and CEO of Royal Vopak
6 | Vopak | Annual Report 2016In
trod
uctio
nE
xecutive B
oard
repo
rtS
torin
g vital p
rod
ucts
with
careK
ey develo
pm
ents
per d
ivision
Su
stainab
ilityG
overnan
ce, risk an
d co
mp
liance
Finan
cial Statem
ents
Ad
ditio
nal in
form
ation
Intro
du
ction
| Vopak | Annual Report 2016
CEO statement
CEO statement

Finally, we inspire our people to lead the way by following our values, resulting in a highly motivated, skilled, open-minded and diverse Vopak team. Our performance in 2016 shows that we are achieving positive results in our pursuit of leadership in our industry with better safety results, higher customer satisfaction scores and overall positive feedback from our employee engagement survey. This adds to a good financial performance and a healthy balance sheet that can support our future growth.
Sustainability in 2017 and beyondLooking forward, we will continue to increase our operational capabilities and productivity through digitization to safely store and handle vital products with care. We will continue to diligently assess the changing energy landscape to facilitate the introduction of more sustainable products, services and technologies. Examples are our expansions for cleaner fuels in Durban (South Africa) and our investment in Rotterdam (the Netherlands) to enable the use of LNG as a transportation fuel. Finally, I am excited about the fact that Vopak will continue to invest in the long-term relationship with the local communities close to our terminals through the WeConnect program, to inspire young people to broaden their horizons and connect to the world. Because the young people of today will help us stay relevant to society tomorrow.
On behalf of the Executive Board, I want to thank all our colleagues for their hard work. I also thank our shareholders, customers and partners for their support and confidence. Eelco Hoekstra Chairman of the Executive Board and CEO of Royal Vopak
Long-term positioningIn-depth market studies confirm our view of new opportunities resulting from the growing demand for plastics, chemicals, food and agricultural products worldwide, as well as a growing energy demand, particularly in non-OECD countries. The gradual shift from coal and oil to gas and renewables will lead to challenges and repositioning at some locations, while creating opportunities at others, such as gas distribution or cleaner fuels imports. Vopak is well-positioned to seize such opportunities at existing
and new locations and to meet changing needs. We finalized the divestment program, as announced mid-2014, in 2016 with the sale of the development project in Dongguan (China) and the terminals in Japan. We also succesfully completed the sale of our UK assets. At the same time, we commissioned several projects in line with our strategic growth focus. I am proud that we started activities in Panama, added LNG small-scale activities to the Gate Terminal in Rotterdam, expanded in the United Arab Emirates and opened a new LPG facility in Singapore.
Five areas of leadershipIn this Annual Report, we highlight five areas in which we distinguish ourselves and will further strengthen our leadership position in our industry. First, we are combining our global market orientation with a strong local presence to invest in the right assets, in the right place, at the right time. Second, we are doing the right things right in operations, thereby setting the standard in the field of safety and sustainability, service and costs. Third, we are serving our customers by prioritizing safety while helping them to improve their performance. Fourth, we are innovating by using and developing new technology to improve safety, efficiency and service (e.g. digitizing our core and support processes).
“ Our performance in 2016 shows that we are achieving positive results in our pursuit of leadership in our industry, with better safety results, higher customer satisfaction scores and overall positive feedback from our employee engagement survey. This adds to a good financial performance and a healthy balance sheet that can support our future growth.”
7CEO statement |In
trod
uctio
nE
xecutive B
oard
repo
rtS
torin
g vital p
rod
ucts
with
careK
ey develo
pm
ents
per d
ivision
Su
stainab
ilityG
overnan
ce, risk an
d co
mp
liance
Finan
cial Statem
ents
Ad
ditio
nal in
form
ation
Intro
du
ction
Intro
du
ction
Execu
tive Bo
ard rep
ort
Sto
ring
vital pro
du
cts w
ith care
Key d
evelop
men
ts p
er divisio
nS
ustain
ability
Govern
ance, risk
and
com
plian
ceFin
ancial S
tatemen
tsA
dd
ition
al info
rmatio
n
7 | Vopak | Annual Report 2016 | CEO statementE
xecutive B
oard
repo
rt
Intro
du
ction

unloading ships and storing and handling products for multiple customers. We have thus been connecting global trade flows for 400 years. Looking forward, we will continue to enable the delivery of vital products by building on our heritage and living the Vopak Values: Care for Safety, Health and the Environment, Integrity, Team Spirit, Commitment and Agility.
Sustainability at the coreWe store and handle products that are crucial to people’s lives, yet can endanger their health and the environment if stored or handled inappropriately. This comes with a huge responsibility. As a service provider, we do not determine what type of products are in use. As a service provider, our mission is to connect the supply of and demand for these products by providing safe, efficient and clean storage and handling services for our customers. By fulfilling our mission, we strive to be the partner of choice for all our stakeholders, from customers, business partners and investors, to governments, local communities and society at large. Our ambition is to be a strong link in our customers’ value chains and a leader in our industry. We realize that our long-term success depends on our ability to innovate and adapt to new demands from both the market and society. This is why we proactively engage with various stakeholders and explore ways to facilitate the introduction of more sustainable technologies, processes and products. We believe that putting sustainability at the core of
Connecting global trade flows and storing vital products for
400years
A world leader Royal Vopak is the world’s leading independent tank storage company. We operate a global network of terminals located at strategic locations along major trade routes. With a 400-year history and a strong focus on safety and sustainability, we ensure efficient, safe and clean storage and handling of bulk liquid products and gases for our customers. By doing so, we enable the delivery of products that are vital to our economy and daily lives, ranging from oil, chemicals, gases and LNG to biofuels and vegoils. Vopak is listed on the Euronext Amsterdam stock exchange and is headquartered in Rotterdam, the Netherlands. Including our joint ventures and associates, we employ an international workforce of over 5,500 people.
Building on our heritage Vopak’s history dates back to 1616. Our earliest ancestors stored and handled coffee, tea, cocoa, sugar, silk, spices and other products from all over the world for trading companies such as the Dutch East India Company, the world’s first multinational company. Since then, much has changed. Dry bulk gave way to liquid bulk and the company grew, eventually establishing a presence on every continent. Unchanged is that we are still loading and
Profile, mission and strategy
8 | Vopak | Annual Report 2016In
trod
uctio
nE
xecutive B
oard
repo
rtS
torin
g vital p
rod
ucts
with
careK
ey develo
pm
ents
per d
ivision
Su
stainab
ilityG
overnan
ce, risk an
d co
mp
liance
Finan
cial Statem
ents
Ad
ditio
nal in
form
ation
Intro
du
ction
| Vopak | Annual Report 2016
Profile, mission and strategy
Profile, mission and strategy

our decisions and operations will enable us to remain relevant to society and to continue to store and handle vital products for future generations.
Vision and strategy As the world population is growing and becoming more affluent, vital products like energy, chemicals and food are in growing demand. Yet these products are not always available locally. We see a growing geographic imbalance between areas of production and areas of consumption of such products. This leads to transportation of oil, gas and petrochemicals over longer distances around the world and a growing demand for storage and handling of bulk liquids and gases at key locations along global marine trade routes. Through our global network of terminals, Vopak connects the supply of and demand for these products and resources. This requires that we respond to constantly changing markets and product flows as a result of ambitious climate policies, geopolitical shifts and the development of new energy sources and cleaner fuels. Determining the best locations for our terminals requires a long-term vision on the products that society needs, while evolving customer demands require flexibility and short-term action in the day-to-day work at the terminals. In such a dynamic context, our success depends on our ability to show leadership in the following five key areas:
Vopak’s terminal network
67 Terminals
25 Countries
24 Joint ventures and associates
1 Leading assets in leading locations We see market changes earlier than others and offer the right service at the right time, in the right place. Over the years, we have grown our global portfolio and sharpened our value proposition for our strategic terminal types: industrial, gas, distribution and hub terminals. At the same time, we keep instilling the ‘Vopak way’ in different geographies, resulting in a stronger asset base than our competition at lower cost of ownership.
2 Operational leadership Vopak takes a leadership role in operating capabilities and sets the standard in the field of safety and sustainability, service and costs. We abide by existing rules and regulations as a minimum and adopt best practices whenever possible. We explore ways to facilitate the introduction of more sustainable technologies, processes and products.
3 Service leadership While safety is our first and foremost priority, we help to improve our customers’ business performance by maximizing operational productivity and increasing efficiency to keep costs down, for instance by shortening idle times. High customer satisfaction indicates that we are on the right track. But we always need to try harder by listening to our customers and by anticipating their future needs.
Terminal Hub location/terminal(s)
9Profile, mission and strategy |In
trod
uctio
nE
xecutive B
oard
repo
rtS
torin
g vital p
rod
ucts
with
careK
ey develo
pm
ents
per d
ivision
Su
stainab
ilityG
overnan
ce, risk an
d co
mp
liance
Finan
cial Statem
ents
Ad
ditio
nal in
form
ation
Intro
du
ction
Intro
du
ction
Execu
tive Bo
ard rep
ort
Sto
ring
vital pro
du
cts w
ith care
Key d
evelop
men
ts p
er divisio
nS
ustain
ability
Govern
ance, risk
and
com
plian
ceFin
ancial S
tatemen
tsA
dd
ition
al info
rmatio
n
9 | Vopak | Annual Report 2016 | Profile, mission and strategy
Intro
du
ction
Execu
tive Bo
ard rep
ort

Founder’s mentality
Vopak Values
4 Technology leadership We innovate in the way we design, construct, maintain and operate our terminals. This includes introducing new technology, in particular digital technology like smart robots and mobile devices. Innovation will help us reduce safety incidents, improve service through better traceability and planning, and lower costs by working more efficiently and saving energy.
5 People leadership We need to lead in our investment decisions, in our care for the planet and people, and in living our values. This requires that we inspire and challenge our people and help them develop the right capabilities and leadership skills. We aim for a highly motivated, skilled, agile and diverse Vopak team.
Independentstorage andtransshipment
Feedstockproduction
Feedstockgathering
Producttransmission
Productionand refining
Producttransmission
Mid-streamand end-userdistribution
Independentstorage andtransshipment
Vopak in the supply chain
Five leadership areas
Leading assets in
leading locations
Operational
leadership
Service
leadership
Technology
leadership
People
leadership
Storing vital products with care
For all this, we find a foundation in our 400 years of history and our ‘founder’s mentality’. This reminds us that we must not tie ourselves down to what we know now and what has worked in the past, but be open to new solutions and opportunities, with an entrepreneurial mindset. This, in combination with the ‘Vopak Values’, enables us to work every day as if each one of us is the founder or owner of Vopak, investing in the company’s success.
10 | Vopak | Annual Report 2016In
trod
uctio
nS
torin
g vital p
rod
ucts
with
careK
ey develo
pm
ents
per d
ivision
Govern
ance, risk
and
com
plian
ceA
dd
ition
al info
rmatio
n| Vopak | Annual Report 2016 | Profile, mission and strategy
Finan
cial Statem
ents
Su
stainab
ilityIn
trod
uctio
nE
xecutive B
oard
repo
rt

Executive Board reportExecutive Board members
Report of the Executive Board
Business environment
Financial performance
Intro
du
ction
Execu
tive Bo
ard rep
ort
Sto
ring
vital pro
du
cts w
ith care
Key d
evelop
men
ts p
er divisio
nS
ustain
ability
Govern
ance, risk
and
com
plian
ceFin
ancial S
tatemen
tsA
dd
ition
al info
rmatio
nE
xecutive B
oard
repo
rt
Intro
du
ction
Sto
ring
vital pro
du
cts w
ith care
Key d
evelop
men
ts p
er divisio
nG
overnan
ce, risk an
d co
mp
liance
Ad
ditio
nal in
form
ation
Finan
cial Statem
ents
Su
stainab
ilityIn
trod
uctio
nE
xecutive B
oard
repo
rt
Executive Board report
Executive Board report

Executive Board members
Eelco HoekstraChairman of the Executive Board and CEO of Royal Vopak Nationality Dutch Year of birth 1971 Education Master’s Degree in Economics Career Eelco Hoekstra has been active in the international tank storage industry since 1995 and joined Vopak in 2003. At Vopak, he held various management positions in the Middle East, Latin America and Asia. Until his appointment to the Executive Board, Eelco was President of Vopak Asia. He has been a member of the Executive Board since November 2010.
Jack de KreijVice-Chairman of the Executive Board and CFO of Royal Vopak Nationality Dutch Year of birth 1959 Education Chartered Accountant (RA), Certified Management Accountant (CMA) Career Jack de Kreij was employed with the Dutch Ministry of Finance from 1980 until 1986. He joined PricewaterhouseCoopers (PwC) in 1986 and was appointed Partner in 1990. Before being appointed as member of the Executive Board of Vopak, Jack was Senior Partner and Territory Leader in the Netherlands for PwC’s Transaction Services. He has been a member of the Executive Board since January 2003 and has decided to step down as per 1 February 2018. Jack also holds Supervisory Board positions at TomTom and Corbion.
Frits EulderinkMember of the Executive Board and COO of Royal Vopak Nationality Dutch Year of birth 1961 Education PhD in Astrophysics and two cum laude Master’s Degrees in Mathematics and in Astronomy Career Frits Eulderink joined the Royal Dutch Shell Group in 1990, where he held various technical and management positions in the Netherlands, North America, Africa and the Middle East, including in the fields of Research, Manufacturing, Exploration and Production. Until the end of 2009, Frits was Vice-president Unconventional Oil in Houston (United States). He has been a member of the Executive Board since April 2010.
12 | Vopak | Annual Report 2016In
trod
uctio
nS
torin
g vital p
rod
ucts
with
careK
ey develo
pm
ents
per d
ivision
Govern
ance, risk
and
com
plian
ceA
dd
ition
al info
rmatio
nFin
ancial S
tatemen
tsS
ustain
ability
Execu
tive Bo
ard rep
ort
| Vopak | Annual Report 2016
Executive Board members
Executive Board members

Eelco Hoekstra
Jack de Kreij
Frits Eulderink
A memorable year We celebrated our 400-year history in 2016, underpinning Vopak’s ability to respond to new market developments as well as changing demands from society. Our entrepreneurial spirit has enabled us to seize new opportunities and adapt to changing circumstances in order to stay relevant for all our stakeholders. Our open mindset has allowed us to continuously challenge the way we work and the decisions we make, leading us to improve, to evolve and to grow. It is also about taking ownership in what we do and showing leadership in all our endeavours. As the Executive Board of Royal Vopak, we are proud to be part of such a diverse company with a rich history.
Report of the Executive Board
13Report of the Executive Board |In
trod
uctio
nE
xecutive B
oard
repo
rtS
torin
g vital p
rod
ucts
with
careK
ey develo
pm
ents
per d
ivision
Su
stainab
ilityG
overnan
ce, risk an
d co
mp
liance
Finan
cial Statem
ents
Ad
ditio
nal in
form
ation
Execu
tive Bo
ard rep
ort
13 | Vopak | Annual Report 2016
Report of the Executive Board
Report of the Executive Board

Three years ago, the outcome of our business review indicated that Vopak’s outlook was no longer fully aligned with the company’s long-term growth ambitions. Therefore, Vopak set out to sharpen the focus of its existing network, strengthen the free cash flow generation and improve its capital efficiency. We worked hard to improve our safety performance and the service offering of our terminals, while optimizing our terminal portfolio and improving the integrity of our assets.
Safety remains our top priorityWhile we were proud to have improved our overall personal and process safety performance in 2016, the new year started off with a fatal accident involving a well-respected contractor at one of our terminals in Belgium. This deeply tragic accident reminds us again that safety is never a given and that we have to keep on strengthening our safety culture, systems and equipment to ensure a safe working place for all.
Doing the right things rightOur service delivery is dependent on the quality of our infrastructure, our operational performance in using this infrastructure and, last but not least, the way we engage with our customers. We strive to pay attention to every detail relating to our front-line execution. We are therefore pleased to see that our customers value our continuous efforts to improve our service offering, which is reflected in a higher customer satisfaction score in 2016 compared to the previous year. We owe this success to our people, the driving force behind our leadership position.
People leadershipIn today’s dynamic world, we aim to inspire our people to be committed, open-minded and forward-looking. We are proud to say that the results of the biannual Vopak Engagement Survey in 2016 have improved compared to 2014, both in response rate and in the overall engagement score. However, we cannot lean back. The survey also points out areas for improvement, which vary per division, terminal and department. We will therefore continue to motivate our people to develop the right capabilities and skills to meet the challenges of today and tomorrow.
Accomplishments in 2016A milestone was the completion of the divestment program launched in 2014 as part of the realignment of our strategic priorities. At the same time, we successfully pursued the growth priorities that we defined in 2014. We opened a new LPG facility in Singapore, marking the start of Southeast Asia’s first independent LPG import and storage terminal.
This facility further strengthens our global LPG network and reinforces our strategic focus on gas markets. Similarly, our potential acquisition of the FSRU business of Exmar and the possible cooperation with Exmar on future projects would reinforce our position in the LNG market. The finalization and scope of the agreement with the FSRU business of Exmar are subject to the outcome of ongoing discussions. Finally, together with its partners, Vopak also added crude oil storage to the Fujairah trading hub, an expansion accomplished within three million man-hours without any serious personal incidents.
Business environment and financial resultsOur business environment in 2016 has been influenced by various developments, including low commodity prices, geopolitical unrest and increased global commitment to tackle climate change and environmental issues. It has been a year of transition and adaptation, especially for those active in the energy industry. Focusing on efficiencies and costs savings, our customers are taking the opportunity to reinvent themselves for a leaner and more sustainable future.
Supported by healthy occupancy rates across all divisions, we managed to improve our EBITDA, in spite of the divestments and negative foreign currency exchange effects. Vopak’s improved financial position provides for optimal flexibility to grow the company in a disciplined manner and respond to the megatrends that are impacting our industry. We welcome the renewal of our revolving credit facility, which helps reinforce this strong position, as a sign of trust by key financial partners.
Looking aheadDuring the period 2017-2019, Vopak anticipates volatility in energy, commodity, financial markets and unpredictable geopolitical developments. Notwithstanding inherent short-term effects, Vopak believes it will be able to continue its long-term growth journey and positive EPS development while maintaining a Cash Flow Return on Gross Assets after tax (CFROGA) between 9% and 11%.
With a solid foundation we are overall well-positioned to successfully set out in our strategic direction for the period 2017-2019 towards disciplined capacity growth and productivity improvements.
The Executive Board
14 | Vopak | Annual Report 2016In
trod
uctio
nS
torin
g vital p
rod
ucts
with
careK
ey develo
pm
ents
per d
ivision
Govern
ance, risk
and
com
plian
ceA
dd
ition
al info
rmatio
n| Vopak | Annual Report 2016 | Report of the Executive Board
Finan
cial Statem
ents
Su
stainab
ilityE
xecutive B
oard
repo
rt

Youth instituteProject goalTo stimulate low-income and culturally diverse urban youth to achieve good school results and broaden their professional horizon.
Realized in 2016During an eight week summer program, Vopak colleagues and the YMCA Youth Institute organized a wide range of activities for urban youngsters. These activities gave them a broader view on future career options and taught them
how to work together in culturally diverse groups and different situations. Typical urban youth are only exposed to careers they see on TV or are familiar with certain jobs through their family. Spending time at the Port of Los Angeles and providing personal insights about career development, made them aware of many more career possibilities that lie ahead. The team was excited to see how the participants engaged in the career mapping and goal setting activities, such as creating a website and making a video.
Weconnect Vopak Terminal Los Angeles, United States
15Report of the Executive Board |In
trod
uctio
nE
xecutive B
oard
repo
rtS
torin
g vital p
rod
ucts
with
careK
ey develo
pm
ents
per d
ivision
Su
stainab
ilityG
overnan
ce, risk an
d co
mp
liance
Finan
cial Statem
ents
Ad
ditio
nal in
form
ation
Execu
tive Bo
ard rep
ort
15 | Vopak | Annual Report 2016

Business environment
• Transitions in China and India China’s growth is slowing down and India’s growth is accelerating. China’s 15-year economic growth boom is entering a new, more mature, phase. The country is transitioning from a production-driven economy towards a service-driven economy. India is restructuring its economy and growth is accelerating, leading to more trade. The related product flows, for example oil product exports from China, have found their way to the Singapore Straits hub
• Increased focus on environmental effects The International Maritime Organization (IMO) decided in October 2016 that the new sulfur cap of 0.5% will enter force on 1 January 2020. Therefore, the maritime industry has about three years to decide on their compliance measures. At present, it is still uncertain how the market will respond, but a ‘one-size-fits-all’ solution seems unlikely
Oil productsFrom an oil perspective, 2016 has been a volatile year with oil prices under pressure. Market dynamics are changing rapidly: importers are turning into exporters and vice versa. In some mature markets, we observe that, for example, refinery shutdowns (e.g. in Australia) or upgrades (e.g. in the ARA region) have changed the business landscape. This has lead to increased product imports or changes in the
Global demand for energy and chemicals continued to rise
in 2016
Global demand for energy and feedstock for the manufacturing industry continued to rise in 2016 supported by population and GDP growth. Increasing geographic imbalances between areas of production and consumption required more trans-portation of oil, gas and petrochemicals around the world and, at the same time, infrastructure to cater for these flows. The combination of these factors created a solid basis for Vopak’s services.
Key themes in 2016Our overall business environment in 2016 has been influenced by the following themes:• Low commodity prices
This has put pressure on oil and gas producers in emerging markets, such as Brazil and Venezuela. At the same time, others have benefited because of cheaper feedstock, resulting in healthier refining and trade margins
• A year of transition and adaptation for companies active in the energy sector Companies are increasingly adapting to sustained low commodity prices thereby focusing on capturing efficiencies and companies are taking the opportunity to reinvent themselves for a more sustainable future
• Geopolitical unrest Volatility in the Middle East continued to surge with conflict escalating in Syria, gradual lifting of the sanctions on Iran, tensions in the Baltic, the cohesion of the EU coming under pressure by ‘Brexit’ and a year-close with a US Presidential election that was one of the most unpredictable in many years, have all brought uncertainty to the market place
16 | Vopak | Annual Report 2016In
trod
uctio
nS
torin
g vital p
rod
ucts
with
careK
ey develo
pm
ents
per d
ivision
Govern
ance, risk
and
com
plian
ceA
dd
ition
al info
rmatio
nFin
ancial S
tatemen
tsS
ustain
ability
Execu
tive Bo
ard rep
ort
| Vopak | Annual Report 2016
Business environment
Business environment

products handled. In other countries, deregulation, new regulations and population growth are driving changes in oil flow patterns. China’s appetite for gasoline coincides with a surge in diesel exports. India’s oil demand is surging, while a wave of new refining capacity is coming onstream in the Middle East. Europe and the US also showed a healthy demand for gasoline in 2016.
Chemicals and gasesGlobal demand for chemicals remained robust in 2016, supported by favorable conditions in consumer-led markets such as packaging, automotive and construction. Besides growing end markets, demand for petrochemicals increased due to the continued trend of substitution of materials by plastics.
Low oil prices supported the economics of naphtha crackers, which are predominantly located in Europe and Asia. Although these regions have become more competitive, the US and the Middle East remained the lowest cost regions because of their access to cheap feedstock (ethane). In the US, the shale gas revolution provoked a surge of investments in the petrochemical industry, predominantly located around the US Gulf Coast. New crackers are under construction and expected to come on stream in the next few years. China continues to aim for self-sufficiency with a focus mainly on olefins and intermediate chemicals such as styrene monomer. Overall chemical imports in China continued to increase, driven by a growing need for petrochemical building blocks such as methanol.
With lower oil prices, it becomes a challenge for the Middle East to continue their petrochemical investments at the high levels we have seen in the past decade. In 2016, the first part of the Sadara project, the world’s largest chemical complex ever built in a single phase, came on stream in Saudi Arabia. Vopak handles the product flows from and to the 26 integrated world-scale manufacturing plants through our joint venture Chemtank (Jubail). The Sadara complex follows a trend in the chemical industry to build more and larger integrated petrochemical sites.
Global LPG oversupply and lower price levels strengthened the competitiveness of LPG as a feedstock, and additional volumes were mostly absorbed by crackers in Europe and PDH plants in China. Low LPG pricing was also an incentive for increased demand in household use of LPG in Asia, resulting in increased throughputs at our terminals in Pakistan and China.
LNGThe expectation early 2016 was that, as production increased, the market would be oversupplied leading to more LNG being delivered to Europe. However, resurgence of demand growth in China, India, the Middle East and North Africa has resulted in a relatively balanced global market this year with higher spot prices.
Vegoils and biofuelsFrom a vegoils perspective, the year started with good availability and a low price environment. Buyers around the world built stocks and flows were strong into vegoil hubs like Rotterdam (the Netherlands), Savannah (US), Santos (Brazil) and Kandla (India). During the year, the weather phenomenon El Nino heavily impacted supply, especially palm oil, leading to a historical decrease in vegoils production. This led to a high price environment and a gradual reduction of stocks.
The demand development for fuel ethanol and biodiesel varied around the globe from stable (Europe) to slight growth (US) to strong growth (Indonesia). US ethanol exports were strong targeting Canada, Brazil and Asia (e.g. China and India). US biodiesel imports reached record levels with mostly Argentinian and Indonesian producers benefitting from the US blenders’ credit Brazilian ethanol exports remain robust targeting the US for fuel ethanol and Korea for industrial-grade ethanol. Although several courts ruled on annulling anti-dumping duties on biofuels, new appeals from European producers continue to make Europe a closed market with mostly intra-European trade-flows.
Competition in the hubsCompetition increased from existing (local) service providers as well as new entrants in 2016.Expansions and announcements for new capacitytook place in the main hubs, especially in the ARAregion for oil and chemical products. Rationalization of European production assets, available land and an attractive business environment have been drivingthese developments. In light of these events, it is key to further differentiate ourselves from competition to maintain our competitive edge, while building on our unique capabilities in the five leadership areas. Reference is made to the chapter Storing vital products with care for more information regarding these capabilities.
17Business environment |In
trod
uctio
nE
xecutive B
oard
repo
rtS
torin
g vital p
rod
ucts
with
careK
ey develo
pm
ents
per d
ivision
Su
stainab
ilityG
overnan
ce, risk an
d co
mp
liance
Finan
cial Statem
ents
Ad
ditio
nal in
form
ation
Execu
tive Bo
ard rep
ort
17 | Vopak | Annual Report 2016 | Business environment

Vopak’s business highlights in 2016• In February, Vopak received its first cargo at the
new LPG facility at its Banyan terminal on JurongIsland, marking the start-up of Southeast Asia’sfirst independent LPG import and storage facility
• In March, Vopak completed the earlier announceddivestment of all of its UK assets. The divestmentcomprised the three wholly-owned terminals:Vopak Terminal London, Vopak Terminal Teesside and Vopak Terminal Windmill and Vopak’s 33.3% investment in the joint venture Thames Oilport
• In May, Vopak divested its 40% ownership in thejoint venture Nippon Vopak. This joint ventureowned and operated five terminals in Japan with acombined operational capacity of 203,200 cbm
• In June, Vopak successfully renewed a EUR 1 billionsenior unsecured multicurrency revolving creditfacility (RCF). This facility replaces the previous RCFof EUR 1 billion, which was in place since February2011. The new RCF is fully available for drawdownand has an initial maturity of five years withtwo extension options of one year each.This supports Vopak’s funding flexibility necessaryto execute its long-term growth ambitions
• In July, Vopak announced that it had reached along-term agreement with Chevron to manage andoperate Chevron’s existing 509,000 cbm terminal atBahia Las Minas, in Panama. Beside this agreement
with Chevron, the key regulatory approvals were obtained for the development of a first phase 360,000 cbm independent oil terminal, owned by Vopak, at the same location. A long-term contract has already been signed for part of this new capacity
• In August, Gate Terminal and its shareholdersGasunie and Vopak announced the expansion ofthe LNG terminal to include a third berth and specialinfrastructure for the loading of small LNG vessels
• In September, Vopak Horizon Fujairah fully commis-sioned the new 478,000 cbm crude oil capacity,increasing its total capacity to 2.6 million cbm
• In October, Vopak completed the divestment of its50% ownership in its terminal development projectin Dongguan (China)
• In December, Vopak and Exmar signed an agreementon the acquisition of the FSRU business of Exmar byVopak and the possible cooperation between Vopakand Exmar in future projects. The agreement on theacquisition envisages the transfer in stages ofExmar’s participation in FSRU assets, FSRU projectsunder development and a corresponding part of theExmar organisation. The finalization of the deal issubject to consent and cooperation of multiplestakeholders including current partners in theFSRUs and customary approval from authorities.Subsequently, the ultimate scope of the transactionis dependent on the outcome of this process
“ Laying the foundation for Fujairah to also become a trading hub for crude oil”
Crude oil storage in Fujairah Vopak Horizon Fujairah Limited celebrated the commissioning of the seventh phase of expansion, adding 478,000 cbm of crude oil storage capacity to increase the facility’s total capacity to 2.6 million cbm. This new capacity is the first crude oil capacity in the Middle East for independent storage purposes with open access for very large crude carriers (VLCCs).
The expansion features five storage tanks, one manifold and a pipeline connection to the VLCC jetty as well as to other jetties in the Port of Fujairah. All crude oil handled in the new tanks will be loaded and discharged through the jetties of the Port of Fujairah. The Port of Fujairah opened a new VLCC jetty in September 2016. Vopak Horizon Fujairah is the launching customer for this new jetty. In the picture from left to right: Mr Saif Humaid Al Falasi, CEO of Emirates National Oil Company, Mr Eelco Hoekstra, CEO of Royal Vopak, His Highness Sheikh Hamad bin Mohammed Al Sharqi, Member of the Supreme Council of the United Arab Emirates and Ruler of the Emirate Fujairah.
18 | Vopak | Annual Report 2016In
trod
uctio
nS
torin
g vital p
rod
ucts
with
careK
ey develo
pm
ents
per d
ivision
Govern
ance, risk
and
com
plian
ceA
dd
ition
al info
rmatio
n| Vopak | Annual Report 2016 | Business environment
Finan
cial Statem
ents
Su
stainab
ilityE
xecutive B
oard
repo
rt

Growth perspective
Storage capacity developments 2016
Country TerminalVopak’s
ownership ProductsCapacity
(cbm)
Existing terminals
Belgium Antwerp (Eurotank) 100% Chemicals 30,000Singapore Banyan 55.6% LPG 75,800UAE Fujairah 33.3% Oil products 478,000Brazil Alemoa 100% Chemicals 14,000South Africa Durban 70% Oil products 60,200Various Net change at various terminals
including decommissioningVarious 80,000
New terminals
Saudi Arabia Chemtank (Jubail) 25% Chemicals 36,000Panama Bahia Las Minas N.A.1 Oil products 509,000
Divestments
UK London, Teesside, Windmill 100% Chemicals/oil products - 696,600UK Thames Oilport 33.3% Oil products – Japan Nippon terminals 40% Chemicals - 203,200
1. Only acting as operator.
Net change total storage capacity 2016: 0.4 million cbm
Announced storage capacity developments for the period up to and including 2019
Country Terminal
Vopak’s owner-
ship ProductsCapacity
(cbm) 2013 2014 2015 2016 2017 2018 2019
Existing terminals
China Caojing 50% Chemicals 24,000United States Deer Park 100% Chemicals 138,000South Africa Durban 70% Oil products 130,000
New terminals
Singapore Banyan Cavern Storage Services
N.A.1 Oil products 990,000
Saudi Arabia Chemtank Jubail 25% Chemicals 377,000Panama Panama Atlantic 100% Oil products 360,000South Africa Lesedi 70% Oil products 100,000Malaysia PT2SB (Pengerang) 29.7% Chemicals/oil
products/LPG 1,650,000
Net change for the period up to and including 2019: 3.8 million cbm
start construction
expected to be commissioned
1. Vopak Terminals Singapore (in which Vopak holds 69.5%) has a 45% interest in a joint service company.
Note: ‘storage capacity’ is defined as the total available storage capacity (jointly) operated by the Group at the end of the reporting period, being storage capacity for subsidiaries, joint ventures, associates (with the exception of Maasvlakte Olie Terminal in the Netherlands, which is based on the attributable capacity, being 1,085,786 cbm), and other (equity) interests, and including currently out of service capacity due to maintenance and inspection programs.
19Business environment |In
trod
uctio
nE
xecutive B
oard
repo
rtS
torin
g vital p
rod
ucts
with
careK
ey develo
pm
ents
per d
ivision
Su
stainab
ilityG
overnan
ce, risk an
d co
mp
liance
Finan
cial Statem
ents
Ad
ditio
nal in
form
ation
Execu
tive Bo
ard rep
ort
19 | Vopak | Annual Report 2016 | Business environment

Financial performance
Including exceptional items, total personnel expenses for 2016 amounted to EUR 342.2 million compared to EUR 358.3 million in 2015.
Other operating expenses In 2016, other operating expenses -excluding exceptional items- amounted to EUR 322.4 million, which is a decrease of EUR 24.1 million (-7%) compared to EUR 346.5 million in 2015. Excluding the positive currency translation effect of EUR 2.8 million, the decrease amounts to EUR 21.3 million. This decrease can be attributed for the larger part to the effect of the divested terminals.
In 2016, exceptional losses were recognized in the other operating expenses for the amount of EUR 16.5 million (2015: loss of EUR 32.4 million). This was mainly related to settlement of various claims and provisions for legal cases for the amount of EUR 6.7 million and EUR 6.6 million of expenditures relating to the Vopak 400 stakeholders events.
The Group’s other operating expenses -including exceptional items- for 2016 amounted toEUR 338.9 million compared to EUR 378.9 millionin 2015.
Revenues In 2016, Vopak generated revenues of EUR 1,346.9 million, a decrease of EUR 39.1 million (-3%) compared to EUR 1,386.0 million in 2015. Excluding the negative currency translation effect of EUR 12.5 million, the decrease amounts to EUR 26.6 million. The effects of the divestments of 2015 and early 2016 were EUR 83.6 million, while the increase in revenues, resulting from a higher average occupancy rate at all divisions, and to a smaller extent from new capacity, partially offsets this effect.
The average occupancy rate for Vopak’s subsidiaries (i.e. excluding joint ventures and associates) for 2016 increased to 93% compared to 92% in the same period in 2015.
Expenses
Personnel expensesIn 2016, personnel expenses -excluding exceptional items- amounted to EUR 341.6 million, a decrease of EUR 16.5 million (-5%) compared to EUR 358.1 million in 2015. Excluding the positive currency translation effect of EUR 2.9 million, the decrease amounted to EUR 13.6 million. This decrease was primarily caused by the effect of the divestments of EUR 24.9 million, partially offset by the higher long-term incentive plan expenses of EUR 2.8 million and more capitalized personnel expenses of EUR 6.5 million.
During 2016, Vopak employed, in FTE, an average of 3,913 employees (2015: 4,037), excluding joint ventures and associates. This comprises 3,546 own employees (2015: 3,725) and 367 (2015: 312) temporary employees. The decrease in the average number of employees is primarily the result of the divestments during 2015 and 2016.
EBITDA in EUR millions -excluding exceptional items-
822.3
+1%Compared to 2015
20 | Vopak | Annual Report 2016In
trod
uctio
nS
torin
g vital p
rod
ucts
with
careK
ey develo
pm
ents
per d
ivision
Govern
ance, risk
and
com
plian
ceA
dd
ition
al info
rmatio
nFin
ancial S
tatemen
tsS
ustain
ability
Execu
tive Bo
ard rep
ort
| Vopak | Annual Report 2016
Financial performance
Financial performance

Result of joint ventures and associatesIn 2016, the result of joint ventures and associates -excluding exceptional items- amounted toEUR 123.8 million, an increase of EUR 19.5 million(19%) compared to EUR 104.3 million in 2015.Excluding the negative currency translation effectof EUR 2.2 million, the increase amounts toEUR 21.7 million. This increase was mainly due to thecontribution of the newly commissioned capacity inthe Middle East, as well as improved performance ofjoint ventures, primarily in the Asia division. This waspartially offset by lower results from our joint venturein Estonia and our associate in Haiteng in China.
In 2016, exceptional losses were recognized in the result of joint ventures and associates for the amount of EUR 63.9 million (2015: loss of EUR 50.3 million). This amount primarily comprises an impairment on our equity investment in the joint venture Vopak E.O.S. (Estonia) of EUR 55.7 million.
In 2016, the result of joint ventures and associates -including exceptional items- amounted toEUR 59.9 million compared to EUR 54.0 millionin 2015.
Group operating profit before depreciation and amortization Group operating profit before depreciation and amortization (EBITDA) -excluding exceptional items- and including the net result of joint ventures and associates for 2016 amounted to EUR 822.3 million, which is EUR 10.8 million (1%) higher compared to EUR 811.5 million in 2015. Excluding the negative currency translation effect of EUR 9.4 million, the increase amounted to EUR 20.2 million (3%). The divestments had a negative impact of EUR 30.9 million.
Including exceptional items, Group operating profit before depreciation and amortization (EBITDA) for 2016 amounted to EUR 1,023.2 million compared to EUR 805.2 million in 2015.
ROCE -excluding exceptional items- of 13.6% was in line with prior year (2015: 13.7%).
Cash flows from operating activities and working capital Cash inflow from operating activities (gross) amounted to EUR 783.2 million in 2016(2015: EUR 867.2 million). This decrease of EUR 84.0 million was primarily due to a combination of lower operating cash flows as a result of the divestments, additional operating expenditures of which costs were recognized in prior year and lower one-off cash inflows compared to 2015. These items
were, to some extent, offset by the higher dividends received from joint ventures and associates.
Strategic investments and divestments
Cash flows from investing activities Cash flows from investing activities amounted to a net cash inflow of EUR 114.7 million (2015: net cash outflow of EUR 276.5 million). In 2016, total investments amounted to EUR 442.4 million (2015: EUR 581.1 million), of which EUR 328.0 million was invested in property, plant and equipment (2015: EUR 335.5 million). Investments in joint ventures and associates, including acquisitions, amounted to EUR 74.3 million (2015: EUR 132.1 million).
Of the investments in property, plant and equipment, EUR 84.1 million was invested in expansions at existing terminals (2015: EUR 110.9 million).
According to the strategic review of 2014, the Group aimed to reduce its sustaining and improvement capex program, for the period mid-2014 up to and including 2016, from EUR 800 million to approximately EUR 700 million. The total sustaining and service capex for 2016 amounted to EUR 237.8 million (2015: EUR 190.9 million and 2014: EUR 249.7 million).
Divestments The divestment program of around 15 primarily smaller terminals, has been completed. During 2016, the Group divested eight terminals (2015: nine terminals) and two business development projects. This resulted in a total cash inflow from divestments of EUR 464.6 million (2015: EUR 297.6 million) and an exceptional gain of EUR 287.3 million (2015: EUR 79.5 million) before tax.
The assets held for sale per year-end 2016 comprise a business development joint venture in China and fixed asset components in the Netherlands.
Depreciation and amortizationDepreciation and amortization expenses amounted to EUR 263.9 million in 2016, an increase of EUR 7.9 million (3%) compared to EUR 256.0 million in 2015. Of these total expenses EUR 9.4 million (2015: EUR 9.1 million) related to amortization of intangible assets. Excluding the positive currency translation effect of EUR 1.6 million, the total increase of depreciation and amortization amounts to EUR 9.5 million. The increased depreciation and amortization charges were primarily related to commissioned capacity and IT projects, while partially being offset by the downward effect of EUR 11.5 million caused by the divestments of terminals.
21Financial performance |In
trod
uctio
nE
xecutive B
oard
repo
rtS
torin
g vital p
rod
ucts
with
careK
ey develo
pm
ents
per d
ivision
Su
stainab
ilityG
overnan
ce, risk an
d co
mp
liance
Finan
cial Statem
ents
Ad
ditio
nal in
form
ation
Execu
tive Bo
ard rep
ort
21 | Vopak | Annual Report 2016 | Financial performance

ImpairmentsIn 2016, total net impairments (including impairments of joint ventures and associates) amounted to EUR 65.8 million (2015: EUR 54.0 million). This amount primarily comprises an impairment on our equity investment in the joint venture Vopak E.O.S. (Estonia) of EUR 55.7 million. This impairment is mainly caused by a structural deterioration of the business environment in which the terminal operates, which is heavily dependent on the flows of Russian oil products.
The other impairments of EUR 10.1 million in total, mainly relate to a partial impairment on a scope change in a construction project in the Americas division and a smaller terminal impairment in China due to changes in the markets in which this terminal operates.
Capital structure
Equity The equity attributable to holders of ordinary shares increased by EUR 390.3 million to EUR 2,399.7 million (31 December 2015: EUR 2,009.4 million). This increase mainly resulted from the addition of the net profit for the year of EUR 534.0 million, partially offset by dividend payments in cash of EUR 127.5 million and actuarial losses on defined benefit plans of EUR 26.2 million.
Net debt The net interest-bearing debt decreased to EUR 1,804.2 million compared to EUR 2,295.6 million per year-end 2015. Excluding the negative currency translation effect of EUR 58.0 million, the decrease amounted to EUR 549.4 million. The overall decrease in the net interest-bearing debt is due to the combination of our operational cash flow versus our capex program and the proceeds from the completed divestments.
For 2016 only USD 2.9 million (EUR 2.6 million) of regular scheduled debt repayments were originally planned as the last repayment under our original USPP 2001 Program. This was executed, but following the overall surplus cash position, the company also prepaid USD 30.3 million (EUR 27.3 million) as part of the USPP 2012 loan at par and prepaid SGD 225.0 million (EUR 146.8 million) on the 2010 Asian PP loan. The latter resulted in a make-whole payment of EUR 4.4 million. In addition, as part of the flexibility in our Corporate RCF, EUR 100.0 million of drawdowns under this facility were repaid during 2016. The Corporate RCF of EUR 1 billion was renewed on June 1, 2016 and as per year-end 2016 this facility was fully available.
As at 31 December 2016, an equivalent of EUR 1,999.4 million (2015: EUR 2,111.5 million) was drawn under private placement programs with an average remaining term of 7.7 years (2015: 8.2 years) next to SGD 100.0 million (EUR 68.9 million) funded by banks at the level of Vopak Terminals Singapore, with an average remaining term of 3.5 years.
The Senior net debt : EBITDA ratio decreased to 2.04 compared to 2.73 per year-end 2015, which is well below the maximum agreed ratios in the covenants with the lenders.
During 2017, regular repayments of long-term loans will amount to USD 150.0 million (approximately EUR 143 million) and EUR 20.0 million under our Private Placement Programs.
Net finance costs In 2016, the Group’s net finance costs -excluding exceptional items- amounted to EUR 107.2 million, an increase of EUR 4.3 million (4%) compared to EUR 102.9 million in 2015. This increase resulted mainly from a make-whole payment of EUR 4.4 million relating to the voluntary early redemption of the SGD 225 million Asian PP loan. The lower interest expenses due to the repayment of interest-bearing loans during 2016, were partially offset by the lower amount of capitalized interest.
The average interest rate over the reporting period was 4.1% (2015: 4.2%). The fixed-to-floating ratio of the long-term interest-bearing loans, including interest rate swaps, amounted to 99% versus 1% at 31 December 2016, compared to 95% versus 5% at year-end 2015.
Cash flows from financing activitiesCash flows from financing activities amounted to a net cash outflow of EUR 602.2 million (2015: net cash outflow of EUR 563.4 million). This amount consisted mainly of dividend payments of EUR 168.8 million, interest payments of EUR 101.9 million and the net repayment of borrowings of EUR 331.7 million.
Income taxesIncome tax expenses -excluding exceptional items- amounted to EUR 79.3 million in 2016, a decrease of EUR 2.7 million (-3%) compared to EUR 82.0 million in 2015. The effective tax rate -excluding exceptional items- was 17.6% compared to18.1% in 2015. The main drivers behind the decreasewere changes in estimates of prior year tax positionsand a higher result from joint ventures, which aresubject to the Dutch participation exemption.
22 | Vopak | Annual Report 2016In
trod
uctio
nS
torin
g vital p
rod
ucts
with
careK
ey develo
pm
ents
per d
ivision
Govern
ance, risk
and
com
plian
ceA
dd
ition
al info
rmatio
n| Vopak | Annual Report 2016 | Financial performance
Finan
cial Statem
ents
Su
stainab
ilityE
xecutive B
oard
repo
rt

Income tax expenses -including exceptional items- amounted to EUR 72.5 million in 2016, a decrease of EUR 44.8 million (-38%) compared to EUR 117.3 million in 2015. The effective tax rate -including exceptional items- was 11.1% comparedto 26.4% in 2015. This decrease in the effective taxrate is primarily caused by the gain on the divestmentof the three terminals and a development project inthe United Kingdom which was tax exempt,while the result on the divestment of the USterminals in 2015 resulted in a tax expense.
Net profit attributable to holders of ordinary sharesNet profit attributable to holders of ordinary shares -excluding exceptional items- amounted toEUR 326.1 million, an increase of EUR 0.8 millioncompared to EUR 325.3 million in 2015.Earnings per ordinary share -excluding exceptionalitems- amounted to EUR 2.56 in 2016, whichwas comparable to EUR 2.55 in 2015.
Net profit attributable to holders of ordinary shares -including exceptional items- amounted toEUR 534.0 million, an increase of EUR 251.8 million(89%) compared to EUR 282.2 million in 2015.
For a detailed overview of all exceptional items, reference is made to note 2.2 of the Consolidated Financial Statements in the Annual Report 2016.
Earnings per ordinary share -including exceptional items- amounted to EUR 4.19, an increase of 90% compared to EUR 2.21 in 2015.
Dividend proposal Barring exceptional circumstances, the principle underlying Vopak’s dividend policy for ordinary shares is to pay an annual cash dividend of 25% to 50% of the net profit -excluding exceptional items- attributable to holders of ordinary shares. The net profit -excluding exceptional items-, which is the basis for dividend payments, may be adjusted for the financial effects of one-off events such as changes in accounting policies, acquisitions or reorganizations. A dividend of EUR 1.05 per ordinary share (2015: EUR 1.00), payable in cash, will be proposed to the Annual General Meeting of 19 April 2017. Excluding exceptional items, the payout ratio will be 41% of earnings per ordinary share (2015: 39%).
Renewed EUR 1 billion revolving credit facilityVopak successfully renewed a EUR 1 billion senior unsecured multicurrency revolving credit facility (RCF) with a syndicate of 15 international relationship banks.
The new RCF is fully available for drawdown and has an initial maturity of five years with two extension options of one year each. This new revolving credit facility continues to provide the funding flexibility necessary to execute Vopak’s long-term business ambitions. With this transaction, Vopak has also further aligned its core banking group with the different project-based growth opportunities in different regions.
“ Funding flexibility to execute our business”
23Financial performance |In
trod
uctio
nE
xecutive B
oard
repo
rtS
torin
g vital p
rod
ucts
with
careK
ey develo
pm
ents
per d
ivision
Su
stainab
ilityG
overnan
ce, risk an
d co
mp
liance
Finan
cial Statem
ents
Ad
ditio
nal in
form
ation
Execu
tive Bo
ard rep
ort
23 | Vopak | Annual Report 2016 | Financial performance

Storing vital products with careLeading assets in leading locations
Operational leadership
Service leadership
Technology leadership
People leadership
Intro
du
ction
Execu
tive Bo
ard rep
ort
Key d
evelop
men
ts p
er divisio
nG
overnan
ce, risk an
d co
mp
liance
Ad
ditio
nal in
form
ation
Su
stainab
ilityFin
ancial S
tatemen
tsS
torin
g vital p
rod
ucts
with
care
Storing vital products with care

Leading assets in leading locations
• New and disruptive technologiesTechnological advancement and the increasingspeed of the adoption of new technologies requirecompanies to monitor these developments moreclosely. For instance, the large-scale adoption ofelectrical or hybrid vehicles will impact fueldemand in OECD countries, more so than innon-OECD countries
• Sustainability and climate changeCOP21 in 2015 and COP22 in 2016 furtherstrengthen the resolution to limit global warming.Extreme weather, the effect of excessive pollutionin certain cities and natural disasters to name afew, have all led to increased awareness amongcompanies and consumers
Combining our global market orientation with a strong local presence
Vopak has successfully strengthened its global network of terminals in 2016 with the completion of the divestment program, together with a new operatorship and capacity expansions at existing locations. Looking beyond the commemoration of our 400th anniversary, we set out to sharpen our strategic direction.
MegatrendsWe mapped relevant global megatrends and explored the impact of these developments on our customers’ end markets, which has formed the basis of an extensive study on future growth opportunities in several possible product-market combinations. The five megatrends that we believe will have a significant impact on our end markets are:• Urbanization
Migration from rural areas to cities continues.There is generally a positive correlation betweenrising levels of urbanization and income, resultingin an increasing GDP
• Changing demographicsGlobal population growth is slowing down,especially in OECD countries. This, together withan aging population that consumes less relativeto a younger population, is expected to have adampening effect on global economic growth
• Geopolitical developments and global tradeInternational trade has grown considerably sincethe 1980s due to the increasing interconnectivityof global and regional value chains. However, recentpolitical polarization and the rise in protectionistpolicies, could contribute to uncertainty, affectingmarkets and disrupting efficiencies that are currentlysupporting global trade
25Leading assets in leading locations |In
trod
uctio
nE
xecutive B
oard
repo
rtS
torin
g vital p
rod
ucts
with
careK
ey develo
pm
ents
per d
ivision
Su
stainab
ilityG
overnan
ce, risk an
d co
mp
liance
Finan
cial Statem
ents
Ad
ditio
nal in
form
ation
Sto
ring
vital pro
du
cts w
ith care
25 | Vopak | Annual Report 2016 | Leading assets in leading locations
Leading assets in leading locationsLeading assets in leading locations

End marketsVopak is active in providing infrastructure services for vital products used in three end markets:• Energy
Energy demand is expected to continue to growover the next decades. Depending on the speed oftechnological advancement and costs, renewablesources such as solar and wind are expected togrow the most. However, from a much smallerbase. Gas is expected to grow significantly givenits availability and competitiveness. For thetransport sector, oil is expected to continue toconstitute a large part of the energy mix.However, energy efficiency improvements andalternative fuels will cap its growth. Furthermore,growth patterns will look very differentdepending on the different regions
• ManufacturingMain market segments such as construction,automotive and advanced industries use chemicalsas feedstock for their manufacturing. This sectoris expected to grow significantly over the nextfew decades, creating opportunities to provideadditional industrial infrastructure services
• Food & agriculturePopulation growth and rising wealth levels drivethe demand for food and agriculture. Our vegoilbusiness is closely connected to this sector.Although we have limited exposure to thissegment at present, its fundamental importanceto the world means that major developmentswould affect all other end markets
In short, we expect that a growing population, urbanization and increasing wealth levels will drive demand in the above-mentioned end markets, especially in non-OECD countries. Demand for chemicals, gas and edible oils is forecasted to increase the most, as well as for oil and oil products, albeit at a slower pace, and only in specific regions. Given the fact that production centers for the different product groups are generally not located near demand areas, this will further increase trade flows. The changes in these flows, and the substitution of products that can take place mean that we have to examine each region and location within these regions separately. As part of our review process, we will continuously monitor these trends and anticipate their impact on our business at local level.
Opportunities per strategic terminal typeWe have used these insights to further sharpen our value proposition for the four strategic terminal types through which we serve our customers. 1 Industrial terminals
Vopak operates industrial terminals, of which several are large terminals exclusively supporting chemical clusters in Asia and the Middle East. In addition, we also operate terminals that have significant long-term pipeline businesses and serve major global and regional plants. We provide a centralized fit-for-purpose solution and deliver value to customers and local authorities through economies of scale. Vopak is constantly assessing whether it can develop additional services that can be offered to its customers at these type of terminals
2 Gas terminals Vopak expects that a range of gases will play an increasingly important role in the global energy mix. Based on the shale gas developments in theUS, the global growth in liquefaction (LNG) andthe diversification of energy and feedstock inthe Middle East, we expect that gas, such asLNG and LPG, will become a more globally tradedvital product. In order to optimize supply chains,additional infrastructure will be required thatfacilitates the growing trade in these products
3 Distribution terminals Oil and chemical distribution terminals remain an important part of Vopak’s business. Looking ahead, OECD markets provide some opportunities due to refinery closures and oil majors that are divesting infrastructure. For non-OECD markets, opportunities mainly arise from increasing demand for transport fuels in markets without sufficient refining capacity. This, in combination with the deregulation of markets, enables new possibilities for storage and distribution of fuels
4 Hub terminals Most growth in demand for oil products is in non-OECD countries. The diverse product specifications as well as underdeveloped infrastructure mean that hubs such as Fujairah and Singapore will continue to be relevant as the location to blend, break bulk and make bulk. For chemicals, Vopak has been expanding its presence in the hub locations, such as the Amsterdam-Rotterdam-Antwerp (ARA) region, during recent years from a large basis. We are also investing in Houston to facilitate petrochemical exports and are continuously searching for opportunities to improve our position and competitiveness by further optimization of our assets and integration of our assets with local parties
26 | Vopak | Annual Report 2016In
trod
uctio
nE
xecutive B
oard
repo
rtK
ey develo
pm
ents
per d
ivision
Govern
ance, risk
and
com
plian
ceA
dd
ition
al info
rmatio
n| Vopak | Annual Report 2016 | Leading assets in leading locations
Su
stainab
ilityFin
ancial S
tatemen
tsS
torin
g vital p
rod
ucts
with
care

Distribution terminals
Import and distribution terminals in major markets with structural deficitsThe capacity for refining and petrochemical production is expected to disappear in certain energy consuming countries. These countries will continue to have a high demand for energy and chemicals. However, they lack competitive production capabilities. The import of oil and chemicals will thus become more important.
Gas Liquid
LNGNGLLPG
Gas terminals
Terminals facilitating growth in global gas marketsVopak expects that a range of gases will play an increasingly important role in the global energy mix. Based on the shale gas developments inNorth America, the global growth in LNGliquefaction and the diversification of energyand feedstock in the Middle East, we observeincreasing demand for storage and handlingservices of LNG, LPG and various industrial gasesamong a growing number of market participants.
customer
Acustomer
Bcustomer
Ccustomer
Dcustomer
E
Industrial terminals
Industrial terminals in the Americas, the Middle East and AsiaPetrochemical customers are increasingly interested in contracting storage and handling services that are integrated in their industrial processes but executed by specialists like us.
Hub terminals
Major hubs, supporting intercontinental product flowsMajor hubs are terminals along major shipping routes, where many suppliers and customers are active and where efficient supply chain management processes are of utmost importance. We have strengthened our position in these terminals in recent years, making them safer, more efficient and better able to deliver higher service levels in a competitive environment. Major hubs in our network are: Houston, the ARA region, Fujairah and the Singapore Strait.
27Leading assets in leading locations |In
trod
uctio
nE
xecutive B
oard
repo
rtS
torin
g vital p
rod
ucts
with
careK
ey develo
pm
ents
per d
ivision
Su
stainab
ilityG
overnan
ce, risk an
d co
mp
liance
Finan
cial Statem
ents
Ad
ditio
nal in
form
ation
Sto
ring
vital pro
du
cts w
ith care
27 | Vopak | Annual Report 2016 | Leading assets in leading locations

Operational leadership
Health and safetyOur ‘License to Operate’ and our ‘License to Grow’ are conditional upon our ability to operate safely and responsibly.
Process safety and the occupational health and safety of our own employees and our contractors is our top priority. We have developed a thorough understanding in constructing our terminals, in designing core processes with the appropriate level of controls, and in following a robust maintenance regime. All our terminals are governed by an extensive set of global standards as well as local regulatory requirements. Where there are differences, our approach is to adopt the more stringent requirements. Our global standards also cover key operational and maintenance processes. In the daily operation and maintenance of our terminals, we will encounter non-routine activities, and these are managed with additional control measures such as control of work procedures.Every Vopak employee, contractor and service provider is required to adhere to our Safety, Health and Environmental requirements, formalized through employment and service contracts, and upon entry to any of our sites. Safety committees are organized on a terminal level at all terminals. All levels of employees and contractors are represented through these committees.
The right people, high quality assets and robust repeatable processes
As an integral part of our customers’ value chain, we have to make sure that we do the right things right, each and every step of the way. Vopak has a leadership role in operating capabilities and aims to set the standard in the field of safety, service and efficiency.
Trusted partner We are our customers’ trusted partner. They depend on us to take care of their valuable goods. These goods are crucial to people’s lives, but can endanger their health and the environment if stored or handled inappropriately. We abide by existing rules and regulations as a minimum and adopt best practices whenever possible. Safety is our first and foremost priority.
Having the right people, high quality assets in the right locations, and robust repeatable processes to execute every step needed to deliver high quality and efficient service not only today, but also in the future, this is what distinguishes us from our competitors.
We are constantly evaluating how we build, operate, maintain and improve our facilities in order to ensure that our services remain relevant to changing market needs. We aim to apply a common approach in all these different phases, supported with the right toolkits, ensuring that we follow key processes with people who are trained in their respective roles. In order to ensure that we have the right checks and balances in place, we operate and control based on internally developed protocols.
28 | Vopak | Annual Report 2016In
trod
uctio
nE
xecutive B
oard
repo
rtK
ey develo
pm
ents
per d
ivision
Govern
ance, risk
and
com
plian
ceA
dd
ition
al info
rmatio
nS
ustain
ability
Finan
cial Statem
ents
Sto
ring
vital pro
du
cts w
ith care
| Vopak | Annual Report 2016
Operational leadershipOperational leadership

Assure 2016 – major accident preventionOne of our core programs, Assure 2016, provides a framework to guard against major process accidents that have the highest potential impact on our people, contractors and facilities. This program was initially launched in 2014 as an asset-integrity program (i.e. checks on safety critical devices, tanks and pipelines) and as part of improvement reviews. The scope was subsequently broadened and now also includes people (such as training and assessment on Vopak Fundamentals) and process aspects.
Asset integrity remains the core element of our Assure 2016 program, and is secured through the 3-Year Maintenance Program (3YMP), in which arisk-based approach is used to determine the levelof maintenance required for key assets such as tanks,pipelines and plant control systems. The 3YMP isreviewed annually during the budget cycle, in additionto the routine maintenance activities. Consequently,the progress made is measured quarterly andbenchmarked against the original plan, as part ofthe divisional review. In cases where additionalmaintenance is required, these requests arepromptly assessed and resourced to ensure thatintegrity is not at risk.
Operational leadership
Toolkits• Repeatable formula
• Vopak ProjectManagement (VPM)
• Vopak Way Standards
• Project PostImplementation Review(PIR)
• My Learning Operations(MLO)
• Core operationsprocesses (e.g. stockmanagement, shippingoperations)
• Incident reporting
• Vopak Way Standards
• Terminal HealthAssessment (THA)
• Assure 2016
• MaintenanceManagement System(ME2)
• Terminal Master Plan(TMP)
• 3-Year Maintenance Plan(3YMP)
• Vopak Way Standards
• Terminal HealthAssessment (THA)
• Assure 2016
Key processes
Governance
Build safely Operate flawlessly Maintain effectively
The Assure 2016 program applies global standards, information from our Maintenance Management System (ME2) and existing global toolkits such as learning and assessment modules within My Learning Operations (MLO). All terminals have performed a self-assessment against the Assure requirements in 2016 as preparation for the audits that will be performed at all terminals in 2017. Assure 2016 will not only prioritize and help us ‘do the right things’, but also helps to demonstrate conformance.
Equipping our people – Vopak fundamentals and core processesCare for Safety, Health and Environment is a fundamental expectation of Vopak for all its employees and contractors working at its terminals. MLO has been one of our most effective tools to train and assess proficiency in our Vopak Fundamentals. In 2016, 4,729 people were using the system, of which 89% are current with their Vopak Fundamentals (based on our annual re-certification requirement). In addition to our Vopak Fundamentals, we have other safety critical modules available within MLO, which are also used to train and assess our field employees. We have a small number of locations which have not deployed MLO, but which follow the same guidance in terms of safety training.
29Operational leadership |In
trod
uctio
nE
xecutive B
oard
repo
rtS
torin
g vital p
rod
ucts
with
careK
ey develo
pm
ents
per d
ivision
Su
stainab
ilityG
overnan
ce, risk an
d co
mp
liance
Finan
cial Statem
ents
Ad
ditio
nal in
form
ation
Sto
ring
vital pro
du
cts w
ith care
29 | Vopak | Annual Report 2016 | Operational leadership

We are also using MLO to train and assess our operational employees on our core operational processes such as shipping and trucking. We expect to complete all our core e-modules related to our operational activities in 2017. These trainings will also be administered and monitored through our MLO system.
Contractor managementOur construction and maintenance activities are performed by contractors under our supervision. Driven by the many greenfield projects as well as maintenance activities, our contractors’ exposure hours equal and mostly exceed that of our own employees, making contractor management equally important as that of Vopak employees.
The process starts with the selection of contractors for which safety performance and experience are critical qualifying criteria. We require our contractors and their subcontractors to behave responsibly and uphold the minimum standards defined within our Supplier Code which covers care for safety, health and environment, integrity and compliance with human rights and labor conventions.
Our expectations with regard to health and safety are equally binding for our contractors and our own employees. It is very common in Vopak today to see active and equal participation of contractors in our safety committees and initiatives, including surveillance checks within the worksites.
We have identified locations where labor rights risks are higher, in which case we assume an extended role to check that minimum conditions are being met. Our contractor development efforts are mainly in the area of health and safety, human rights, labor conditions and business ethics and integrity.
Environmental care Our operations can adversely impact the environment through emissions, which in our case are related to Volatile Organic Compounds (VOCs), through soil contamination (and consequently groundwater pollution) as well as through water pollution. Although carbon dioxide emissions are not a key topic, Vopak has chosen to report on these voluntarily.
Celebrating Vopak’s global SHE dayEvery year, Vopak celebrates the care for Safety, Health and the Environment at all its terminals around the world during our SHE day. During this special day, the whole company, including contractors and other non-Vopak staff working for the company, is engaged in a dialogue with the aim to stimulate the continuous improvement in our care for Safety, Health and the Environment. It is important to ensure that our company remains relevant and healthy for the next generation. Sustainability lies at the center of why and how we contribute to society.
Therefore, we engage in a continuous dialogue with customers, neighbors, local communities, regional and national authorities and investors. During this Global SHE day, our Executive Board took the opportunity to meet a number of important stakeholders. CEO Eelco Hoekstra went to the Port Authority in Rotterdam to talk about health and safety. CFO Jack de Kreij visited a WeConnect project that provides practical classes for young people to be better prepared for the labor market. COO Frits Eulderink had a meeting at the regional environmental agency in Rotterdam (the Netherlands) to discuss actual and future challenges.
“ Engaging in a continuous dialogue”
30 | Vopak | Annual Report 2016In
trod
uctio
nE
xecutive B
oard
repo
rtK
ey develo
pm
ents
per d
ivision
Govern
ance, risk
and
com
plian
ceA
dd
ition
al info
rmatio
n| Vopak | Annual Report 2016 | Operational leadership
Su
stainab
ilityFin
ancial S
tatemen
tsS
torin
g vital p
rod
ucts
with
care

Our core management approach is to reduce such risks firstly through design, supported by a robust process to prevent such occurrences. Additionally, we have an ongoing process to ensure the integrity of our assets covering safety critical equipment, such as tanks and pipelines. The majority of our spills have been contained and recovered due to the provision of secondary containment. Our target continues to be a year-on-year improvement of our Process Safety Event Rate (PSER), and a reduction of spill quantities. Soil and groundwater pollutionAs the owner and/or user of approximately 1,550 hectares of land, with more than 4,500 tanks, Vopak is responsible for taking care of this land. The majority of our tanks are equipped with a secondary protection system to prevent spills and other contaminants from entering the soil and groundwater.
Specific locations where the risk of spillage is higher, such as pumping pits, truck loading stations and jetty manifolds, are already equipped with secondary containment to prevent damage to the environment. We continue to improve the coverage of secondary containment and, led by a risk-based approach, we continue to improve the protection of the subsoil and groundwater at our terminals.
If a spill or any unwanted discharge takes place, emergency mitigation procedures are in place at all our terminals, according to the Vopak Standards: ‘Spill control’ and ‘Soil and groundwater management’. Water pollutionAs all our terminals are situated at open water ways, we particularly seek to avoid any unwanted discharge of product to the surface water. Prevention takes place by our focus on asset integrity, adherence to operational procedures, specifically designed containment and drainage facilities at the jetties and piers. In the event that product is discharged to the surface water, mitigation will take place through specific equipment present at any pier or jetty, supported by services to recover and prevent further spread of contaminants. We measure the effectiveness of the prevention of spills to surface and sewage water as part of our Assure 2016 and Terminal Health Assessment programs.
Volatile Organic Compounds (VOCs)Our prime responsibility is to adhere to the (local) legislation on air emissions. Compliance with the legislation is achieved by different measurements. Managing VOCs beyond local legislation has proved to be more difficult due to both the different types of products that we store (which have different treatment requirements), and differing throughput patterns (which affect sizing and economic effectiveness).
We intend to develop management guidelines in 2017 to ensure that such equipment is installed and monitored adequately so as to minimize the generation of VOCs and to improve measurement of VOCs generation. It is our long-term aim to reduce our VOC emissions over time. We have formed a centralized team within the Netherlands division in 2016 in an effort to combine our collective knowledge and provide support to our network. In the meantime, we continuously upgrade our vapor-abatement systems across our network, for example at Vopak Terminal Westpoort and Vopak Terminal Europoort, based on existing technologies. Carbon dioxideThe majority of our carbon dioxide emissions are generated through operational processes such as pumping, heating and incineration. The most direct step that we have taken is to switch to cleaner fuels for these type of activities. For instance, the switch from coal to fuel oil, and the use of fuel oil with a lower sulfur content. Energy efficiency is also seen as another means to reduce our carbon dioxide footprint. As heating is a large component of our energy consumption, we launched an energy-efficiency program for our terminals in the Netherlands in 2016. The initial outcome will be reviewed in 2017, and we will evaluate ways to further deploy this in other locations.
31Operational leadership |In
trod
uctio
nE
xecutive B
oard
repo
rtS
torin
g vital p
rod
ucts
with
careK
ey develo
pm
ents
per d
ivision
Su
stainab
ilityG
overnan
ce, risk an
d co
mp
liance
Finan
cial Statem
ents
Ad
ditio
nal in
form
ation
Sto
ring
vital pro
du
cts w
ith care
31 | Vopak | Annual Report 2016 | Operational leadership

Incident reporting and learningsAll employees including contractors and service providers are expected to participate in safety dialogues, which also include reporting observations and incidents. We follow the reporting guidelines of API RP 754 tracking both lagging as well as leading indicators. Incidents and high potential near misses are reviewed, with actions tracked to ensure closure.
Sharing learnings forms an important part of creating awareness and influencing a safer behavior through improved insights. Key incidents and learnings are reported quarterly, and form part of the management topics discussed at the highest levels within the organization. In striving to reach all levels within the organization, key learnings are converted into ‘Safety Alerts’, which are shared internally across our terminals.
Security, including cybersecurityThe topic of security and cybersecurity, has gained importance in our company. Security of our terminals is a core element of terminal management given the nature and value of the products that we store.
We use a common approach: leveraging on engineering and technology, making sure that we have robust processes and protocols in place, and making sure that our people are trained and equipped. For example, securing the physical integrity of our terminals is already a long-standing requirement mandated by Vopak as well as local authorities (e.g. customs and port authorities). This has been further enhanced in compliance with the International Ship and Port Security Code (ISPS) mandated by the United States. Protection is assured via the implementation of physical fencing and cameras, surveillance by security officers and guards, and audits following the ISPS protocol.
As we are becoming more reliant on information technology and have adopted a strategy to digitize our terminals, cybersecurity has become more important. Cybersecurity breaches can lead to corruption of our systems by viruses and malware, loss of data or disruption of our operations either through intentional attacks, unintentional incidents or disasters. Another important aspect of security concerns data integrity and data security. Data exchanged between our operating entities and external entities have increased thereby introducing new risks. We have increased our focus on customer data and personnel data. Breaches of physical security, cybersecurity and loss or improper exchange of sensitive data can lead to operational disruptions, impact on our reputation and ultimately have a financial impact.
Monitoring framework for safety, health and environment We use API RP 754 as a framework and basis for monitoring safety, health and environment related performance. The typical KPIs related to measuring performance are lagging indicators, which measure past performance. They are used actively at all our facilities. These include reporting of incidents and near misses, sickness and absenteeism rates, contractor performance etc. Our performancetrends provide a clear indication that we are making good progress.
Our monitoring framework includes programs to monitor the health of our operations. This is further secured through our Terminal Health Assessment (THA) program, which is based on the Chemical Distribution Institute audit protocol for Terminals (CDI-T). This audit covers broad areas from site management and asset integrity to conformance to Vopak standards, and this audit is repeated every three years. The last improvement cycles carried out on our THA program were in 2015 to enhance field checks and in 2016 to link to our Assure 2016 program.
Likewise, we have programs to monitor the health of our safety culture, conducted through external surveys every two to five years. We also conduct an engagement survey of our people every two years and, based on these results, we tend to see improving trends.
In terms of people, some of our programs are literally monitoring the health of our people, especially those at the terminals who have to perform physical activities on site. For example, within our Netherlandsorganization, which has a higher percentage of older employees, the ‘Vopak Vital’ program was initiated to encourage physical exercise.
If things go wrong
Emergency preparednessOur terminals are equipped and tested once a year on their emergency and crisis management responsiveness. Emergency preparedness is an important aspect within our operations and our emergency response and business continuity plans account for scenarios including calamities. A typical Emergency Response Plan (ERP) at a terminal includes various scenarios and their recommended response steps, the necessary contacts (e.g. neighbors, support and organizations) and escalation channels should the incident require this. In defining these ERPs, local authorities are involved (representing local communities).
32 | Vopak | Annual Report 2016In
trod
uctio
nE
xecutive B
oard
repo
rtK
ey develo
pm
ents
per d
ivision
Govern
ance, risk
and
com
plian
ceA
dd
ition
al info
rmatio
n| Vopak | Annual Report 2016 | Operational leadership
Su
stainab
ilityFin
ancial S
tatemen
tsS
torin
g vital p
rod
ucts
with
care

To combat cyber threats and to protect data, we have defined and implemented an Information Technology Control Framework that defines (cybersecurity) controls, which enables the proper operation and protection of our information technology systems. We use a risk-based approach to secure our IT systems in combination with the Vopak minimum security standard. We also use external companies to monitor the protection of our IT systems. We have initiated a cybersecurity program to enable the safe and secure digitalization of our terminals in the future. The program addresses infrastructure security, access control, awareness and monitoring, including a review of legacy plant control systems.
Best practice sharingApplication of best practices is an essential aspect, especially for a network organization where rich local knowledge is leveraged globally. The basic approach is to gather learnings and experiences from both good and bad outcomes, and share this across our network. This accelerates learning and prevents the recurrence of incidents.
Designing and building our facilities is one of our competitive strengths. In our design toolkit, we have our global standards and repeatable formula. Additionally, we follow our Vopak Project Management (VPM) standard, which secures the necessary peer reviews. These standards are continuously updated. In 2016, we formally trained 322 individuals on our VPM version 8.0.
The most effective sharing of learnings has been within the area of safety, primarily driven by our ambition for zero incidents. We have established an active distribution list and can quickly distribute alerts from incidents and high potential near misses. Safety performance and learnings are shared globally every two to three months. We have expanded this in 2016 to include sharing of technical learnings and alerts. Knowledge management is an area on which we intend to focus more in 2017. In addition, we are developing relevant indicators to monitor our progress in sharing best practices.
Collision-tolerant drone inspects confined spacesAt Vopak Terminal Vlissingen, a drone was used to inspect tank walls. The ‘Elios’ drone is specially designed to move in small spaces where it can bump into the walls without damaging the object or the drone. The drone is used to inspect the space between the concrete wall outside and the first tank wall inside of the gas tanks at the terminal.
Nataly Katan, Innovation Manager: “The test results of these drone inspections are very promising. The work is performed more efficiently and safety risks are significantly smaller.”
Besides this collision-tolerant drone inspection, successful drone inspections were also carried out to inspect a jetty construction with a sailing drone and to inspect a storage tank with a flying drone.
“ More efficient inspections with less safety risks”
33Operational leadership |In
trod
uctio
nE
xecutive B
oard
repo
rtS
torin
g vital p
rod
ucts
with
careK
ey develo
pm
ents
per d
ivision
Su
stainab
ilityG
overnan
ce, risk an
d co
mp
liance
Finan
cial Statem
ents
Ad
ditio
nal in
form
ation
Sto
ring
vital pro
du
cts w
ith care
33 | Vopak | Annual Report 2016 | Operational leadership

Service leadership
Our wide range of customers is generally active in the production, purchasing and marketing of oil products, chemicals, gases, biofuels, edible oils and LNG. Based on their geographic presence, they can be divided into three categories: global, regional and local. In 2016, our top 10 customers accounted for approximately 37% of the revenues. No individual customer accounted for more than 10% of the revenues.
Global networkVopak operates a global portfolio of different types of terminals, all strategically located in key ports along the major shipping routes. Our way of operating is standardized and, more importantly, consistent throughout our network of terminals. We also fine-tune our terminal concepts and service offerings according to our customers’ needs, which allows us to provide customized, high quality, service.
Enabling customersCustomer orientation is central in our service approach. We facilitate global relationships with the implementation of our Global Terms and Conditions, significantly increasing the speed of doing business. We create long-term and sustainable business relationships by focusing on the underlying supply chains and market drivers of our customers.
Constantly reviewing our performance and seeking to improve our service offering
Our global network of strategically located and well-equipped terminals with service-minded staff allows Vopak to provide its customers with the best possible solutions to seamlessly link and optimize their supply chains and capitalize on business opportunities.
ServicesAs an independent service provider, our core business is to provide customers with storage and handling services for liquid bulk and gaseous products. Additionally, we offer auxiliary handling services at our terminals. These auxiliary services includes blending of various products, mixing additives into product, applying nitrogen blanketing on top of a product to push out oxygen, heating or cooling products and loading or unloading ships, railcars and trucks. At many locations, we can also assist with customs formalities and documentation.
Port agency services are provided by Vopak Agencies from Vopak’s network of offices in Northwest Europe and Singapore, contributing to the integrated logistics services the Group offers to its customers.
We constantly review and seek to improve our service offering in order to remain the reliable partner that our customers want us to be. As a result, Vopak has maintained relationships with customers served at our terminals for decades.
CustomersThe customers that we serve include national and international producers, distributors and traders of liquid bulk oil, chemicals and gaseous products.
34 | Vopak | Annual Report 2016In
trod
uctio
nE
xecutive B
oard
repo
rtK
ey develo
pm
ents
per d
ivision
Govern
ance, risk
and
com
plian
ceA
dd
ition
al info
rmatio
nS
ustain
ability
Finan
cial Statem
ents
Sto
ring
vital pro
du
cts w
ith care
| Vopak | Annual Report 2016
Service leadershipService leadership

Our service is based on a thorough understanding of specific customer needs combined with our in-depth knowledge of markets, products and operational expertise. Our service delivery starts with our customers’ expectations and develops over time as we continuously strive to improve the levels of safety and increase the efficiency of our terminal performance. Accordingly, the positive results of our customer satisfaction survey in 2016 confirm that we are on the right track, working towards a common goal.
We firmly believe that our customers are best served by transparency in information flows and data collection. The availability of real-time data and digital connectivity is one of our innovation projects. We usually develop or test our new technologies together with our customers. We aim to proactively share a wider range of data with our customers. An example is a customer dialogue leading to the proof-of-concept regarding the use of sensor-equipped pipelines connected to customer databases. This provides more insight and enables faster and more accurate measuring and benchmarking of our performance.
Customers demand higher transparency of the total supply chain involving multiple stakeholders. With the smart use of data analytics, Vopak can facilitate customers in optimizing their total value chains. This approach is reshaping our customer relationships into a cooperation model where Vopak maximizes its added value by contributing to making our customers’ supply chains more effective. For more information regarding our innovation and digitization initiatives. Reference is made to the chapter Technology Leadership for more information.
Serving our customers
Customers NetworkSolutions Service
Port innovation programVopak is one of the partners of PortXL, a mentorship-driven open innovation program focusing on port-related industries, ranging from start-ups and spinouts to SMEs and multinationals. Experienced teams work with a proven and well-known start-up acceleration formula, based on more than ten years of worldwide experience. An intensive 100-day mentorship-driven program accelerated ten carefully selected start-ups.
“ Mentorship-driven program accelerated start-ups.”
Leo Brand, CIO Vopak: “PortXL offers an ecosystem of founders, investors and corporate partners that support and accelerate the entrepreneurial journey.” The teams pitched their business ideas to an audience of launching customers, business angels, venture capitalists, multinationals, journalists, sponsors and others who will help kick-start their businesses.
35Service leadership |In
trod
uctio
nE
xecutive B
oard
repo
rtS
torin
g vital p
rod
ucts
with
careK
ey develo
pm
ents
per d
ivision
Su
stainab
ilityG
overnan
ce, risk an
d co
mp
liance
Finan
cial Statem
ents
Ad
ditio
nal in
form
ation
Sto
ring
vital pro
du
cts w
ith care
35 | Vopak | Annual Report 2016 | Service leadership

Technology leadership
think ahead and to seize opportunities early enough in order not to miss out on them.
Using the I-IoT to improve our daily operationsInternet and digital technologies can help make operations at our terminals more efficient, reliable, sustainable and safer. For instance, our operators working in the field will be able to communicate more effectively with the central control room. An operator traditionally reads a meter, records the value on a clipboard, delivers it to the central control room where a control room operator keys it into a system. With the support of this new technology, using industrial mobile devices and smart equipment, the operator will only have to aim the camera at the meter and press a button. A mobile app will identify the meter, read the value and send it directly to the system including when and where the meter reading was performed and by whom. Data can therefore be shared in real time, thereby speeding up operations and eliminating human errors in the processing of data. We are building up Machine Learning and data analytics competences to become a more data-driven company. To take it a step further, meters could be equipped with intelligent sensors, allowing them to feed data directly into the system. This would further increase personal safety, as operators would no longer need to be sent to potentially hazardous areas. At the same time, it would increase process integrity
Eliminating human error, increasing safety and improving the productivity of our terminals
Looking at the near future of Vopak, we expect to operate our terminals more efficiently as a result of the advancement of technology and the ‘Industrial Internet of Things’ (I-IoT). Industrial mobile devices already allow us to do so at some of our terminals. Intelligent sensors will allow us to feed data directly into the system and data will increasingly be shared in real-time thereby speeding up operations, eliminating human error, increasing safety and improving services for our customers.
Industry 4.0Consistent focus on the development and adaptation of new technology has already enabled Vopak to enhance its operations in terms of sustainability and competitiveness. However, we cannot rely solely on past successes, we must embrace promising new developments in order to remain relevant. Applications, including predictive maintenance, smart monitoring of operational processes and connectivity optimization, are changing the way we do business at a very high speed.
We now find ourselves on the verge of what is known as Industry 4.0. This transition entails an acceleration of automation in industrial value chains, which will reshape current business practices with the increasing use of the internet and digital technology. IoT technologies adapted to industrial value chains are often referred to as the ‘Industrial Internet of Things’ (I-IoT). We believe that I-IoT could become one of the key drivers of productivity and growth for our industry in the next decade. At the same time, it requires us to
36 | Vopak | Annual Report 2016In
trod
uctio
nE
xecutive B
oard
repo
rtK
ey develo
pm
ents
per d
ivision
Govern
ance, risk
and
com
plian
ceA
dd
ition
al info
rmatio
nS
ustain
ability
Finan
cial Statem
ents
Sto
ring
vital pro
du
cts w
ith care
| Vopak | Annual Report 2016
Technology leadershipTechnology leadership

and efficiency by having constant real-time information about the state of equipment and by identifying potential risks or incidents before they occur.
I-IoT and remote sensing technologies present uswith many other safety and efficiency opportunities.For instance, Vopak is actively involved in theEuropean Petrobot Project, which aims to developrobots to conduct inspections of storage tanks andvessels using magnetic wheels. Inspections arecurrently performed by people working inside suchconfined spaces, which means that assets have tobe shutdown to ensure the safety of the inspectors.The use of robots would avoid sending staff intoconfined spaces, minimize the exposure of personnelto potentially hazardous conditions, reduce downtimeand save resources. Likewise, underwater robots canalready be used to inspect jetties and pipelines, whiledrones are being tested for the internal inspection oftanks. We also now have terminals where weimplemented an I-IoT platform with sensors tooptimize the use of our energy consumption, andprovide benefits to our customers.
Improving our service to customers and other stakeholdersTechnology allows us to further improve our relationship with customers and their partner networks. Through modern, web-based platforms, we provide customers with the latest information on the expected execution of services, such as the loading or unloading of products and the actual stock levels of their products at our terminals. We have direct connections with our customers’ IT systems in place, which enable us to anticipate their orders and execute accordingly. This allows us to become an even better link in their operations and value chain. Ultimately, we aim to achieve the highest level of reliability and predictability and to substantially enhance customer satisfaction.
Technology helps us to further improve our relationship with other stakeholders such as our neighbors; people living in the vicinity of our terminals. For instance, at our terminals in Rotterdam (the Netherlands), Durban (South Africa) and Fujairah (United Arab Emirates), Vopak uses electronic equipment known as ‘E-noses’ to detect certain odors, allowing us to remedy the causes before neighboring residents experience discomfort.
Making the digital leapVopak believes that the principal barrier, to make the digital leap, is cultural. Stimulating the right mindset is crucial. This requires entrepreneurship, excellent people and a business environment in which ideas can be developed and tested. Forging open relationships with partners in and outside the industry is a powerful way to achieve more in an interconnected world. For example, in the Rotterdam port area, an ecosystem that fosters the development and adoption of new technologies is being developed through several initiatives. Companies in the port form alliances with their counterparts, start-ups, the port authority, the city and universities. As a participant in these alliances, Vopak has been eager to work together with the various parties involved and identify new possibilities. Innovation is a key driver for success. We have implemented a global process with proof-of-concepts to experiment with new technologies and, if attractive, scale this up to all terminals.
An open and secure environment is essential as well. The integration of internet technologies in businesses will flourish only when companies can rely on conditions that allow them to use the internet to its full potential, i.e. without restrictions and with the guarantee that online and offline data are protected. Such an open and secure atmosphere will boost entrepreneurship aimed at creating and implementing innovative technologies in businesses.
Technology leadership - Industry 4.0
Mechanization, water power, steam power
Mass production, assembly line, electricity
Computer and automation Cyber physical systems
1st 3rd2nd 4th
37Technology leadership |In
trod
uctio
nE
xecutive B
oard
repo
rtS
torin
g vital p
rod
ucts
with
careK
ey develo
pm
ents
per d
ivision
Su
stainab
ilityG
overnan
ce, risk an
d co
mp
liance
Finan
cial Statem
ents
Ad
ditio
nal in
form
ation
Sto
ring
vital pro
du
cts w
ith care
37 | Vopak | Annual Report 2016 | Technology leadership

People leadership
We are dedicated to demonstrating leadership in this ever-changing world, which means adapting and organizing our company to meet the new needs of the future. We aim to inspire and challenge our people, without losing sight of our strong core competencies and values. Developing the right capabilities and skills is a must in order to accelerate further growth and enable continuous improvement at our terminals.
Sharing the Vopak Values We operate as a global network spanning over 25 countries, all with different cultures. Our business environment has grown more competitive and more volatile, with more governance and legal requirements to adhere to. These developments make it even more important to reinforce our ‘Vopak Values’, since these values support us in making decisions in difficult circumstances.
Our 400-year anniversary celebrations in 2016 provided a natural moment for us to further communicate our values, which were updated in 2015, and embed them in the way we work. These values provide a strong guidance for all decisions that we take and for any role an employee can have in Vopak.
Care for Safety, Health & EnvironmentSustainability is at the core of every decision
IntegrityWe can look ourselves in the mirror every day
Team spiritWe work together, we excel together
CommitmentWe say what we do and we do what we say
AgilityWe learn, adjust, improve and change
We have made our Vopak Values in conjunction with our Code of Conduct explicit, with clear expectations, to all employees.
38 | Vopak | Annual Report 2016In
trod
uctio
nE
xecutive B
oard
repo
rtK
ey develo
pm
ents
per d
ivision
Govern
ance, risk
and
com
plian
ceA
dd
ition
al info
rmatio
nS
ustain
ability
Finan
cial Statem
ents
Sto
ring
vital pro
du
cts w
ith care
| Vopak | Annual Report 2016
People leadershipPeople leadership

Talent managementBased on the outcome of a recent reputation survey, we can proudly say that Vopak’s reputation among specific stakeholders worldwide is very positive. This is even more true in the Netherlands, where the general public also rate the firm at a high level of appreciation. This image, together with an open and inclusive culture, and our entrepreneurial nature, has helped us attract the right talent. In order to strengthen this even further, we maintain our visibility in the labor markets through engagements and visits to schools and universities, management participation in young talent platforms, facilitation of terminal visits and internships.
Attracting and retaining talent is more challenging outside Europe where the Vopak brand is less visible outside the industry. These are often the countries of high growth or higher growth potential. What it means for Vopak is that we have to work even harder in these locations to attract qualified and talented personnel while deploying our experienced resources from other matured teams in the short term.
Our core approach to talent management is having a strong development focus and facilitating learning on the job, which also allows us to rejuvenate our workforce. In addition, we have also recruited subject matter experts in areas which are new to the company or areas where internal development lacks capacity, for the specialized nature of the positions concerned. Another important program that we have used successfully is our Management Trainee program.
Our Management Trainee program continues to be important in attracting young talent and developing future leaders. These programs are actively pursued in most divisions. In 2016, we hired over 20 trainees, 43% of which were outside the Netherlands. We have continued to review and adjust the program and, as part thereof, we strive to increase the ratio of trainees with an operational and technical education to better match our future needs.
People developmentOur people development efforts are all driven towards having the right people, with the right skills, in the right place and at the right time in order to strengthen our organization and enable further growth. Opportunities for growth and development are also a key component for retention.
Our performance review process not only focuses on measuring past performance, but also steering long-term development. Many Vopak employees participate in this process.
Development needs are identified and translated into plans based on a yearly cycle. This development process includes job rotation, which allows teams to rejuvenate either with people from other positions within Vopak or external hires. Of the 29 management appointments in 2016, 83% were filled internally.
Sailing around the hubsTo celebrate its 400th anniversary, Vopak organized a spectacular employee and stakeholder event: ‘Sailing around the Hubs’. Vopak teams sailed on three traditional tall ships to visit different Vopak terminals around the world. Two eras met on three continents when the tall ships Oosterschelde, Eendracht and Mutiara Laut visited Vopak’s modern terminals in the Gulf of Mexico and in the waters of Northwest Europe and Singapore.
“ Taking the younger generation back in time”
With this event, Vopak evoked the days of the Dutch East India Company by symbolically taking the younger generation back in time. The shipping industry is more modern than ever before but it is still interesting to see how things used to be done. It offered our colleagues and stakeholders a glimpse of the past. The arrival of the ships at their final destinations in Houston, Singapore and Rotterdam, was marked with a party for all stakeholders.
39People leadership |In
trod
uctio
nE
xecutive B
oard
repo
rtS
torin
g vital p
rod
ucts
with
careK
ey develo
pm
ents
per d
ivision
Su
stainab
ilityG
overnan
ce, risk an
d co
mp
liance
Finan
cial Statem
ents
Ad
ditio
nal in
form
ation
Sto
ring
vital pro
du
cts w
ith care
39 | Vopak | Annual Report 2016 | People leadership

We have made further efforts to strengthen leadership development. We endorsed the Vopak Leadership Profile through a series of workshops involving over 100 managers within our global network. We believe that leadership behavior is crucial in embedding and sustaining the Vopak Values in the organization, and therefore we have used the Vopak Values as the starting point for our Vopak Leadership Profile. Likewise, as people growth is viewed as a key requirement to sustain success, we have included People Growth as one of the critical competencies for Vopak leaders. The Vopak Leadership Profile will be used to guide both existing and new leadership development programs worldwide and will be a key part of the performance management and recruitment of new leaders.
Critical capabilitiesVopak encourages continuous improvement and innovation. We have identified areas of focus which are strategically important but where we are traditionally less equipped as an organization, or where our internal development pipeline lacks capacity. Technology leadership is one of those strategic focus areas, which we believe will support future success. For that reason, we have created a Digital Innovation team comprised of experienced talents from the terminals and external hires. One of the most notable achievements in 2016 was the successful development of a cloud-based solution to support our core execution process at one of the terminals in the Americas division. The team that developed this consisted of a group of internal professionals (with in-depth knowledge of our processes) in combination with external professionals familiar with the new technology. We are happy to see that members of this team have returned to the business to lead the implementation process.
Another key area is project management for expansion projects. Given the many large and critical projects Vopak delivers every year, we have invested in strengthening the project management skills of employees involved in projects in addition to external hires. For example, in terms of project governance, we have conducted over 32 internal training sessions on Vopak Project Management (VPM) for 322 participants. We also launched an online VPM training in 2016 for all employees to fully understand project management and work according to one Vopak standard.
Diversity Vopak is a company that operates in many countries. Therefore, our workforce is very diverse in terms of nationalities, ethnicity, gender, beliefs, age, educational background, competencies and skills. Increasing diversity reflects the society we live in, ensures that all employees can develop their potential to the full and improves the way we solve problems. Furthermore, it
widens our access to talent while at the same time contributing to retention.
The oil and gas sector traditionally has an imbalance in terms of gender representation, and therefore a very basic route to widen our access to talent is to focus on this. We have set our long-term ambition to have at least 20% women in senior positions/management teams by 2020. The current representation is at 11% in senior positions and no representation in the Executive Board and Supervisory Board. These facts have spurred us to increase our focus on this issue.
In January 2016, at the World Economic Forum, Vopak’s CEO Eelco Hoekstra signed, together with several CEOs from the oil and gas industry, a declaration expressing a call to action to close the gender gap based on seven key initiatives. These initiatives are, amongst others, related to senior leadership endorse ment, recruitment, line management responsibility, inclusive culture and work-life balance. Since then, Vopak has translated these initiatives into a number of guidelines which are applicable across our network.
Recruitment and the way to recruit is a critical foundation to improve the gender balance in the future. At the global office, 42% of the new management recruits in 2016 were women. We have also increased representation within the global directors pool with two appointments in 2016 bringing the ratio to 36%. This is more challenging for our terminals where the majority of our workforce is based. We will continue to engage openly on the issue of diversity and inclusiveness. Not only to increase visibility but also to change the mindset within the company.
Our experience in increasing talent diversity in other dimensions such as nationalities, ethnicity and background comes with varying degrees of success. Our intent has always been a well-balanced international representation in our global operations. Our global leadership is 48% Dutch, a majority of whom have international experience. For many years now, our teams have been composed of many nationalities, many of which with Dutch as a minority.
As a network company, many individuals within a local team have the opportunity to participate regionally and globally. Short-term as well as long-term assignments outside one’s own home country are not uncommon. In 2016, we had approximately 74 employees working outside their home country in either short-term (3-12 months) or long-term assignments, of which approximately 25 were senior management, and approximately 40 were from a Dutch home base. This development opportunity has also provided returns in terms of sharing best practices and experience globally,
40 | Vopak | Annual Report 2016In
trod
uctio
nE
xecutive B
oard
repo
rtK
ey develo
pm
ents
per d
ivision
Govern
ance, risk
and
com
plian
ceA
dd
ition
al info
rmatio
n| Vopak | Annual Report 2016 | People leadership
Su
stainab
ilityFin
ancial S
tatemen
tsS
torin
g vital p
rod
ucts
with
care

in addition to meeting both business and career enrichment needs.
This mix has allowed us to better understand and interact in the local marketplace, in addition to being competitive locally. These individuals also become the conduit through which we move as an organization towards a common way of working.
Compensation and benefitsVopak’s compensation philosophy is to provide market-competitive pay and benefits while rewarding employees for their individual performance. At the same time, the company constantly aims to maintain a balance between costs and market competitiveness. The organization’s compensation package includes a base salary and may include incentives, such as cash bonuses and share-based compensation for senior management. It also includes comprehensive benefits, which vary by country, depending on the local market practice and the tax and social security structure. Vopak targets salary ranges between median (mid-market) and the third quartile (75th percentile) relevant for the country in which we operate.
Vopak has a non-discriminatory compensation policy, which is based purely on the requirements of the job and the experience and competencies of the individual. Based on a review of gross salaries in the Netherlands, there were no indicators that significant differences in compensation exist between men and women in the same positions.
Employee engagementAn engaged workforce is the most powerful lever to drive business success. An engaged workforce contributes towards a pull factor and improves our ability to retain talent. Our 400-year anniversary celebrations gave us additional opportunities to engage with our employees and other key stakeholders. More importantly, the anniversary celebrations helped us to build a sense of pride and belonging as one big Vopak family.
The most effective way to review the effectiveness of our management approach is to ask our employees, and to do this consistently. We conduct our Vopak Engagement Survey every two years.In October 2016, we conducted the survey with 4,322 participants. The participation rate was 88% and this was 4% higher than the previous survey conducted in 2014. The overall result of the engagement level is 85%. This is slightly better than in 2014 and at par with the very best companies in the survey data base. The highest score was in ‘safety’ (88%), while the lowest score was on ‘performance and reward’ (66%) although this improved by 2%. The main areas of attention were ‘stress, balance and workload’ for which the scores decreased. The results have been
communicated to all employees and each team and organization will take up activities for further improvement in 2017. Highly engaged employees are likely to stay. In most countries where we operate, our turnover rate is lower than the market average. In our recent survey, we see substantial improvements in ‘empowerment’ and ‘intent to stay’, two important elements since this shows that people are motivated to take the lead in their work, to speak up freely and really feel engaged to stay with Vopak.
Enhancing HR capabilities We started with the implementation of a new global HR infrastructure platform in 2016. This platform will serve as a springboard for employees to steer their own performance, targets, training and career optimally and it will also enable line managers to obtain an in-depth real-time insight into all details of their organization.
Human rights Vopak respects human rights as described in the United Nation’s Universal Declaration of Human Rights, the UN Guiding Principles on Business and Human Rights and the OECD Guidelines for Multinational Enterprises, and accepts the responsibility to ensure that all our entities respect human rights when conducting business.
Vopak screens all major investment proposals for human rights issues. Our screening is based on the country in which the project is being carried out and the characteristics of the investment proposal. The screening includes an assessment of the areas where the risks of human rights issues are high. For these projects, specific agreements are to be made between all the stakeholders in the project which detail the manner in which parties will uphold human rights.
All partners, contractors and suppliers are required to adhere explicitly to the Vopak Code of Conduct, which also covers human rights.
Labor rightsIn line with the aforementioned UN Guiding Principles on Business and Human Rights and OECD Guidelines for Multinational Enterprises, we base our labor rights commitments on the International Covenant on Civil and Political Rights, on the International Covenant on Economic, Social and Cultural Rights and on the fundamental rights set out in the International Labor Organization’s Declaration on Fundamental Principles and Rights at Work.
We seek to uphold these rights in our operations and in our relationships with our suppliers, our business partners, works councils and unions within the boundaries of local laws and regulations.
41People leadership |In
trod
uctio
nE
xecutive B
oard
repo
rtS
torin
g vital p
rod
ucts
with
careK
ey develo
pm
ents
per d
ivision
Su
stainab
ilityG
overnan
ce, risk an
d co
mp
liance
Finan
cial Statem
ents
Ad
ditio
nal in
form
ation
Sto
ring
vital pro
du
cts w
ith care
41 | Vopak | Annual Report 2016 | People leadership

Key developments per divisionOverview
Netherlands
Europe, Middle East & Africa
Asia
Americas
LNG
Intro
du
ction
Execu
tive Bo
ard rep
ort
Sto
ring
vital pro
du
cts w
ith care
Govern
ance, risk
and
com
plian
ceA
dd
ition
al info
rmatio
nFin
ancial S
tatemen
tsS
ustain
ability
Key d
evelop
men
ts p
er divisio
n
Key developments per division

Capacity per division
In million cbm 2016 2015
Netherlands 10.0 9.9
EMEA 8.5 8.6
Asia 11.5 11.6
Americas 3.9 3.4
LNG 0.8 0.8
Total Vopak 34.7 34.3
EBITDA per division
In EUR million, -excluding exceptional items- 2016 2015
Netherlands 286.5 278.5
EMEA 121.1 128.1
Asia 296.7 288.9
Americas 120.5 122.6
LNG 28.0 30.7
Global functions, corporate activities and other -30.5 -37.3
Total Vopak 822.3 811.5
Original contract duration
In percentage of revenues 2016 2015
Contracts < 1 year 23 24
Contracts 1-3 years 32 28
Contracts > 3 years 45 48
Total Vopak 100 100
Overview
Capacity per division
29%
33%
25%
11%2%
NL AsiaEMEAAmericas LNG
Original contract duration
45%
32%
23%
< 1 year > 3 years1-3 years
EBITDA per division
34%
35%
14%
14%3%
NL AsiaEMEAAmericas LNG
43Overview |In
trod
uctio
nE
xecutive B
oard
repo
rtS
torin
g vital p
rod
ucts
with
careK
ey develo
pm
ents
per d
ivision
Su
stainab
ilityG
overnan
ce, risk an
d co
mp
liance
Finan
cial Statem
ents
Ad
ditio
nal in
form
ation
Key d
evelop
men
ts p
er divisio
n43 | Vopak | Annual Report 2016
OverviewOverview

Netherlands
Vopak Netherlands operates ten terminals, located in Rotterdam, Vlaardingen, Amsterdam, Eemshaven and Vlissingen. Besides its terminals, Vopak Netherlands also offers agency services via a network of offices in Northwest Europe and Singapore.
Market developmentsJan Bert Schutrops, Division President Netherlands: “Especially during the first half of 2016, we continued to benefit from the positive storage market for crude oil and oil products, characterized by lower oil prices and a contango in the forward market structure. Furthermore, the situation of oversupply in Northwest Europe and the continued global imbalances of various oil products have resulted in a strong demand for our storage and handling services.
In the chemical sector, demand for our services has been in line with the previous year resulting in similar utilization levels. In the vegoils markets, we observed a strong demand for storage in the first half of 2016 turning back into a more challenging market characterized by an oversupply of storage capacity in the second half of 2016. For biofuels, we still observe a strong impact of EU legislation and trade policies on the feedstock flows. In LPG and chemical gases, we currently observe a challenging market caused by low product prices. Nevertheless, we are still looking into selective growth opportunities, whereby our expanded capacity in recent years has been rented out in the meantime.”
Sustainability“We continued our focus on improvement of our safety culture in 2016. We are proud to see that the number of incidents continues to decrease. Investing in people and their capabilities is a key success factor in this process. We continuously strive to live up to the confidence of all our stakeholders, inch by inch and every day.
Six terminals in the Netherlands currently participate in the European Carbon Trading System due to the installation of vapor treatment plants at our terminals. Vopak has four terminals in the Netherlands that are certified under ISCC (International Sustainability & Carbon Certification)
0.47
Total Injury Rate (TIR)In 200,000 hours worked for
own personnel and contractors
Process Safety Events Rate (PSER)In 200,000 hours worked for
own personnel and contractors
0.41
2015
1.35
2016
0.41
2015
1.01
2016
0.47
EBITDA in EUR millions -excluding exceptional items-
286.5
+3%Compared to 2015
44 | Vopak | Annual Report 2016In
trod
uctio
nE
xecutive B
oard
repo
rtS
torin
g vital p
rod
ucts
with
careG
overnan
ce, risk an
d co
mp
liance
Ad
ditio
nal in
form
ation
Finan
cial Statem
ents
Su
stainab
ilityK
ey develo
pm
ents
per d
ivision
| Vopak | Annual Report 2016
NetherlandsNetherlands

Original contract duration Netherlands
< 1 year > 3 years1-3 years
35%
41%
24%
In EUR millions 2016 2015
Revenues 496.4 487.9
Operating profit before depreciation and amortisation (EBITDA) 1) 286.5 278.5
Operating profit (EBIT) 1) 180.8 181.2
Average gross capital employed 2,126.5 2,051.6
Average capital employed 1,205.0 1,226.9
Occupancy rate 95% 94%
Storage capacity (cbm) 10,010,300 9,934,700
1. Excluding exceptional items.
Jan Bert Schutrops (50)is President of Vopak Netherlands. He studied Economics and holds an MBA from IMD in Lausanne. Jan Bert has held various management positions in the Netherlands, the UK, Malaysia and China within Vopak.
for the storage of biofuels namely: Vlaardingen, Botlek, TTR and Chemiehaven. Vopak Vlaardingen is RSPO certified. RSPO stands for ‘Roundtable on Sustainable Palm Oil’, an organization with the aim of developing standards for sustainable palm oil production in order to promote and enhance the production and consumption of sustainable palm oil.”
Highlights of 2016“We continued to invest in the integrity and modernization of our assets in order to improve our service offering to our customers, while at the same time capturing new market opportunities.
We initiated a successful health program (‘Vopak Vital’) for our employees in 2016, focusing on a healthy lifestyle with exercise, healthy food, and a good night’s sleep. One of the highlights of the program were the 400 employees who were preparing for one of the distances of the Rotterdam Marathon in our 400th anniversary year.
We successfully connected two of our chemical terminals in Rotterdam under water with a bundle of seven pipelines, which improved the flexibility of our service to customers. We also reached a number of milestones in our innovation journey in 2016. Among others, handheld devices were introduced for handling loading papers on site, the control rooms of two of our terminals were integrated and the first tank inspections were carried out by drones. Furthermore, we realized several smaller investments that have supported the Netherlands division to become a more integrated, efficient and flexible network of terminals.”
Performance“Our financial performance improved in 2016, compared to 2015, largely due to positive market circumstances in the oil market and the daily delivery of excellent service by our staff. This was supported by our continued focus on cost control and autonomous growth.”
2017 and beyond “With sufficient storage capacity available to serve markets, we will also continue our strategy to deliver the best, safe, clean and efficient storage services to our customers in 2017. It is our aim to contribute to the success of our customers’ business operations with the broadening range of products that we store and handle at our terminals.”
45Netherlands |In
trod
uctio
nE
xecutive B
oard
repo
rtS
torin
g vital p
rod
ucts
with
careK
ey develo
pm
ents
per d
ivision
Su
stainab
ilityG
overnan
ce, risk an
d co
mp
liance
Finan
cial Statem
ents
Ad
ditio
nal in
form
ation
Key d
evelop
men
ts p
er divisio
n45 | Vopak | Annual Report 2016 | Netherlands

Vopak EMEA operates 14 terminals. In Europe, these are located in Belgium, Germany, Spain and Estonia. It has five terminals in the Middle East, including Saudi Arabia, Pakistan and the United Arab Emirates. Vopak EMEA also operates a terminal in South Africa.
Market developmentsDick Meurs, Division President EMEA: “In general, the demand for storage for oil and chemical products continued to be strong.The demand for chemicals in Europe is still growing while Europeancracker capacity and utilization remain stable. This leads to opportunitiesfor growing imports from the Middle East and the US, which arebeneficial for the performance of our terminals in Belgium and Spain.The oil markets performance is rather diverse. On one hand, the marketoutlook for the export of Russian oil products through the Baltic statesremains uncertain. The volumes handled by our joint venture terminalVopak E.O.S. have decreased significantly due to lower production of therefineries in Russia, in combination with an adverse geopolitical climate.This resulted in an impairment. The oil markets in Germany and Spainare mature, but the terminals are well-positioned to maintain theirmarket share in bunkering, distribution and trading and both terminalshave a solid customer base.
In South Africa, the demand for cleaner fuels continues to develop, and Vopak Terminal Durban plays a key role in enabling imports of these fuels in large quantities. Vopak Horizon Terminal Fujairah further developed its hub position for oil products by adding crude storage to its portfolio of services. This terminal is also well-positioned as a regional hub for gasoline, gasoil and fuel oil. In Pakistan, the demand for LPG increased substantially. This product is mainly used in the transport sector.”
Sustainability“While the personal and process safety performance in 2016 of Vopak EMEA did not improve, an important milestone was the 15 million manhours worked without an LTI in the last nine years in Vopak Horizon Terminal Fujairah. Furthermore, Engro Vopak Terminal in Pakistan celebrated 19 years of operations without an LTI. In several locations,
Europe, Middle East & Africa
0.65
Total Injury Rate (TIR)In 200,000 hours worked for
own personnel and contractors
Process Safety Events Rate (PSER)In 200,000 hours worked for
own personnel and contractors
0.21
2015
0.15
2016
0.21
2015
0.58
2016
0.65
EBITDA in EUR millions -excluding exceptional items-
121.1
-5%Compared to 2015
46 | Vopak | Annual Report 2016In
trod
uctio
nE
xecutive B
oard
repo
rtS
torin
g vital p
rod
ucts
with
careG
overnan
ce, risk an
d co
mp
liance
Ad
ditio
nal in
form
ation
Finan
cial Statem
ents
Su
stainab
ilityK
ey develo
pm
ents
per d
ivision
| Vopak | Annual Report 2016
Europe, Middle East & AfricaEurope, Middle East & Africa

In EUR millions 2016 2015
Revenues 189.9 251.5
Operating profit before depreciation and amortisation (EBITDA) 1) 121.1 128.1
Operating profit (EBIT) 1) 80.3 81.6
Average gross capital employed 1,068.2 1,244.7
Average capital employed 771.9 799.7
Occupancy rate 96% 93%
Storage capacity (cbm) 8,478,900 8,555,700
1. Excluding exceptional items.
Dick Meurs (55)is President of Vopak EMEA. He has a degree in Civil Engineering. Dick has held various management positions in the maritime and logistics industry in Asia, Europe and Latin America.
the local authorities approached Vopak to assist in the reduction of stench nuisance in the port environment. Based on the experience and best practices of Vopak, we have been able to assist in the implementation of monitoring systems to reduce stench nuisance in several ports.”
Highlights 2016“An important highlight of the past year was the opening of 478,000 cbm of storage capacity for crude oil at our joint venture Vopak Horizon Terminal Fujairah. This first independent capacity in the Middle East for crude oil with full VLCC access is a major stepping stone, adding crude oil to the Fujairah trading hub. In our chemical hub terminals in Antwerp, several jetty infrastructure projects were commissioned to substantially improve the service levels for our customers. In addition, we expanded our Eurotank terminal (Belgium) with another 30,000 cbm for specialty chemicals. At Vopak Terminal Durban (South Africa), another important expansion for fuels was completed, including four truck loading bays for local distribution. In addition to these expansions, we completed the divestment of our UK assets in early 2016.”
Performance“The center of gravity in terms of capacity moved to the Middle East and Africa in 2016 as the sale of our UK assets was completed in the first quarter of 2016. Together with the newly commissioned capacity in South Africa and the UAE, we have increased our presence in non-OECD countries, in line with the division’s strategy. The customer service as acknowledged by our customers has been further improved for most of the operating companies. The commitment of the division is to continuously strive for the highest customer satisfaction and safety levels in our operations.”
2017 and beyond“Safety and customer service will remain our key priorities for 2017. The right safety culture and safety leadership are crucial for realizing our ambitions. The focus in service is to become even more customer centric and further increase the added value for our customers. Vopak EMEA will balance selective growth and focus on the successful commissioning of new projects. Among others, the oil products expansion in South Africa will demonstrate our ability to pursue new opportunities, while operating the existing business in a service-oriented, sustainable and reliable manner.”
Original contract duration EMEA
< 1 year > 3 years1-3 years
61%
27%
12%
47Europe, Middle East & Africa |In
trod
uctio
nE
xecutive B
oard
repo
rtS
torin
g vital p
rod
ucts
with
careK
ey develo
pm
ents
per d
ivision
Su
stainab
ilityG
overnan
ce, risk an
d co
mp
liance
Finan
cial Statem
ents
Ad
ditio
nal in
form
ation
Key d
evelop
men
ts p
er divisio
n47 | Vopak | Annual Report 2016 | Europe, Middle East & Africa

Asia
Vopak Asia operates 23 terminals. These are widely spread and are located in India, China, Korea, Thailand, Vietnam, Malaysia, Singapore, Indonesia, and Australia.
Market developmentsDick Richelle, Division President of Vopak Asia: “We see continued growth in flows and storage demand in the oil markets in Asia. Increased production in China created new flows of diesel heading towards Southeast Asia for storage and consumption in other regions. This has stimulated storage demand in Singapore and Malaysia. Gasoline consumption continues to rise in developing countries including India and Indonesia. In addition, jet fuel maintained high levels of demand during 2016 fueled by the upward growth in air traffic.
Asia’s chemical and base oil industry faced a more challenging year. Product prices remained weak, whereas increased production in China reduced the need for imports and forthcoming flows from Southeast Asia. Hence, producers and traders are experiencing pressure on their margins resulting in cautious pick up of storage capacity especially in trading hubs such as Singapore. However, end markets including Thailand, Indonesia and India benefited from a growing economy resulting in an increased need for a vast assortment of commodity and specialty chemicals used in daily lives.”
Sustainability“Our continuous efforts in safety have resulted in improved performance, especially on personal safety. However, we are not resting on our laurels and will continue the current initiatives with the objective to prevent incidents and we will focus on promoting a strong safety culture in our operating companies and among our contractors. I’m proud that several of our terminals booked significant achievements in 2016. Sakra and Thailand completed over 10 years without an LTI while Kandla, Singapore and Kertih secured external safety excellence awards. We have also embarked on regional sustainability initiatives on energy and waste reduction to minimize our environmental footprint.
0.13
Total Injury Rate (TIR)In 200,000 hours worked for
own personnel and contractors
Process Safety Events Rate (PSER)In 200,000 hours worked for
own personnel and contractors
0.10
2015
0.12
2016
0.10
2015
0.20
2016
0.13
EBITDA in EUR millions -excluding exceptional items-
296.7
+3%Compared to 2015
48 | Vopak | Annual Report 2016In
trod
uctio
nE
xecutive B
oard
repo
rtS
torin
g vital p
rod
ucts
with
careG
overnan
ce, risk an
d co
mp
liance
Ad
ditio
nal in
form
ation
Finan
cial Statem
ents
Su
stainab
ilityK
ey develo
pm
ents
per d
ivision
| Vopak | Annual Report 2016
AsiaAsia

In EUR millions 2016 2015
Revenues 385.2 379.4
Operating profit before depreciation and amortisation (EBITDA) 1) 296.7 288.9
Operating profit (EBIT) 1) 230.4 224.4
Average gross capital employed 2,344.5 2,266.2
Average capital employed 1,407.6 1,397.6
Occupancy rate 91% 89%
Storage capacity (cbm) 11,487,900 11,630,600
1. Excluding exceptional items.
Dick Richelle (46)is President of Vopak Asia. After obtaining his degree in Business Economics, Dick joined Vopak and he has held various management positions in the Netherlands and the Americas region.
In addition, we support a number of projects in the local communities in which we operate. For example, in India, Indonesia, Malaysia, Singapore and Vietnam we helped young people develop skills and knowledge through enrichment courses and training.”
Highlights of 2016 “We commissioned a new LPG facility at our Banyan terminal in Singapore in early 2016. With this important step, Vopak has established the first independent LPG storage facility in Southeast Asia, anticipating growing flows and consumption of LPG.
Since the commissioning of our new oil terminal PITSB in Pengerang, (Malaysia) in 2014 we have seen increased demand for tankage and services in this location. The 500th vessel safely arriving at our berth in March 2016 signifies our customers’ recognition of our excellent service levels and the terminal’s capability to serve ships in varying sizes spanning barges to fully loaded VLCCs.”
Performance “Our overall financial performance improved in 2016. However, there was continuing pressure on our chemicals business as a result of a decrease in Singapore’s petrochemical exports to China, its largest export destination. The impact was largely mitigated by the contango market for crude oil that developed in 2015 and gathered pace through 2016. Furthermore, it is not expected that the main customer of Vopak Terminal Haiteng will restart its production before 2018.”
2017 and beyond “In 2017 and beyond, we will continue to operate and execute in line with Vopak’s strategy by pursuing selective growth, enhancing our operational leadership through productivity and efficiency projects and delivering excellent customer service in a sustainable and safe manner.”
Original contract duration Asia
< 1 year > 3 years1-3 years
46%
31%
23%
49Asia |In
trod
uctio
nE
xecutive B
oard
repo
rtS
torin
g vital p
rod
ucts
with
careK
ey develo
pm
ents
per d
ivision
Su
stainab
ilityG
overnan
ce, risk an
d co
mp
liance
Finan
cial Statem
ents
Ad
ditio
nal in
form
ation
Key d
evelop
men
ts p
er divisio
n49 | Vopak | Annual Report 2016 | Asia

Americas
Vopak Americas operates 18 terminals of which, four terminals in the United States, four in Canada, three in Brazil, two in Colombia, three in Mexico, one in Venezuela and one in Panama.
Market developmentsBoudewijn Siemons, Division President Americas: “Vopak Americas operates in a dynamic market, in which Latin American countries have shown many different faces. On the one hand, liberalized import markets are offering opportunities for independent storage, but on the other hand, many countries are experiencing contracting economies. Despite the latter development, product imbalances persist and depreciation of local currencies continue to support the competitiveness of export markets. The petrochemical industry’s developments in the US Gulf Coast continue to provide a strong market environment, driving exports to South America. Our overall expectation is that intercontinental and regional trade flows will continue to support our existing business and provide opportunities for expansion across the Americas.”
Sustainability“In line with the Vopak ambition, the Americas division focused on deepening its social and environmental focus in 2016. We will continue to push forward existing initiatives and to further expand our support to the local communities in the regions where our terminals are located. We also partnered with the Youth Institute in the US in 2016 to support the academic achievement of 120 urban youngsters and increase the likelihood of their involvement in postsecondary education through an after-school program and summer camp. Additionally, we launched the Vopak-Aflateen project in Mexico and Colombia, which focuses on providing about 2,000 young people with practical tools that will enhance their opportunity to learn about teamwork, empathy, entrepreneurship and social empowerment. Both of these projects are part of the global Vopak WeConnect program.
0.36
Total Injury Rate (TIR)In 200,000 hours worked for
own personnel and contractors
Process Safety Events Rate (PSER)In 200,000 hours worked for
own personnel and contractors
0.51
2015
0.20
2016
0.51
2015
0.39
2016
0.36
EBITDA in EUR millions -excluding exceptional items-
120.5
-2%Compared to 2015
50 | Vopak | Annual Report 2016In
trod
uctio
nE
xecutive B
oard
repo
rtS
torin
g vital p
rod
ucts
with
careG
overnan
ce, risk an
d co
mp
liance
Ad
ditio
nal in
form
ation
Finan
cial Statem
ents
Su
stainab
ilityK
ey develo
pm
ents
per d
ivision
| Vopak | Annual Report 2016
AmericasAmericas

In EUR millions 2016 2015
Revenues 273.8 266.7
Operating profit before depreciation and amortisation (EBITDA) 1) 120.5 122.6
Operating profit (EBIT) 1) 76.2 80.6
Average gross capital employed 938.4 909.4
Average capital employed 499.2 517.5
Occupancy rate 91% 90%
Storage capacity (cbm) 3,883,100 3,356,100
1. Excluding exceptional items.
Improvement initiatives contributed to a further reduction in energy use and waste generation and a better understanding and quantification at all terminals of our environmental footprint, which lead to fit-for-purpose reduction plans.”
Highlights of 2016“The safety of our people, terminals and neighboring areas continued to be our top priority in 2016 as well, directly followed by aiming to provide the highest service to our valued customers. Together, we managed to further strengthen our safety culture, which resulted in a safer working environment for our employees and contractors. 2016 was a year of consolidation in our existing operating companies and a year of growth in a number of strategic locations. In Panama, we started operating an existing terminal and we will start expanding this location for oil products storage including a bunker position supporting the growth of business driven by the canal expansion. In the US Gulf Coast, we started the expansion of our chemicals hub in Deer Park and, in Brazil, we expanded our operation in Santos, the largest port of Latin America.”
Performance “I am satisfied with our financial performance in 2016. Excluding the impact of the divested terminals in 2015, we have grown our business on a normalized basis as a result of growth and cost-efficiency achievements. Negative effects of a dynamic market environment were again partially offset, thanks to a well-balanced product mix and geographic spread.”
2017 and beyond“In 2017 and beyond, we will focus on further improving our safety and service levels. We aim to operate and execute in line with Vopak’s strategy by focusing on value creation in the four terminal types. We will seek to further strengthen our culture based on the Vopak Values and we will continue to develop our leadership skills and potential.”
Boudewijn Siemons (52)is President of Vopak Americas. He graduated from the Royal Netherlands Naval College and obtained a degree in Mechanical Engineering.Boudewijn joined Vopak in 2006 and he has held several management positions in the Netherlands, Europe and the Middle East.
Original contract duration Americas
< 1 year > 3 years1-3 years
50%
19%
31%
51Americas |In
trod
uctio
nE
xecutive B
oard
repo
rtS
torin
g vital p
rod
ucts
with
careK
ey develo
pm
ents
per d
ivision
Su
stainab
ilityG
overnan
ce, risk an
d co
mp
liance
Finan
cial Statem
ents
Ad
ditio
nal in
form
ation
Key d
evelop
men
ts p
er divisio
n51 | Vopak | Annual Report 2016 | Americas

Vopak has earmarked storage and handling of gas as one of its strategic focus areas and is therefore looking for strategic opportunities to strengthen its presence as a service provider in the LNG infrastructure market. Vopak jointly owns and operates two land-based storage and regasification terminals: the Gate Terminal in the Port of Rotterdam (the Netherlands), and the TLA terminal in Altamira (Mexico) and is actively looking to expand its service offering in LNG.
Market developmentsKees van Seventer, Division President Vopak LNG: “In 2016, the LNG market was again impacted by increased pressure on demand due to competition from coal, nuclear and renewable energy sources. This affected both global volumes and prices. However, with the growing interest in more sustainable energy and the ample supply of LNG, the demand for natural gas and regasification facilities is expected to increase in the future. Vopak’s LNG business will benefit from such market growth and we see opportunities in LNG import terminals as well as in new business segments such as LNG break-bulk, transshipment and truck-loading services. These developments provide new market opportunities for our LNG activities. Furthermore, the LNG trade is growing, especially in Asia Pacific, which is leading to a greater need for LNG storage infrastructure.”
Sustainability “Providing LNG infrastructure supports the use of LNG as a more environmental friendly fuel. Both our LNG terminals pay the highest attention to running their operations in a sustainable manner. As methane is a greenhouse gas, we strive to operate both our terminals as zero-emission terminals, i.e. no natural gas venting and/or flaring during normal operations. Venting or flaring will then only occur during an occasional upset condition or due to a specific maintenance outage. The Gate Terminal extracts the heat required for the regasification process from the cooling water from the nearby industry. This process represents additional savings for the environment as it utilizes the lost energy in the heated cooling water.”
LNG
0.25
Total Injury Rate (TIR)In 200,000 hours worked for
own personnel and contractors
Process Safety Events Rate (PSER)In 200,000 hours worked for
own personnel and contractors
0.25
2015
0.00
2016
0.25
2015
0.00
2016
0.25
EBITDA in EUR millions -excluding exceptional items-
28.0
-9%Compared to 2015
52 | Vopak | Annual Report 2016In
trod
uctio
nE
xecutive B
oard
repo
rtS
torin
g vital p
rod
ucts
with
careG
overnan
ce, risk an
d co
mp
liance
Ad
ditio
nal in
form
ation
Finan
cial Statem
ents
Su
stainab
ilityK
ey develo
pm
ents
per d
ivision
| Vopak | Annual Report 2016
LNGLNG

In EUR millions 2016 2015Operating profit before depreciation and amortisation (EBITDA) 1) 28.0 30.7
Operating profit (EBIT) 1) 28.0 30.7
Average gross capital employed 158.6 144.7
Average capital employed 154.0 136.4
Storage capacity (cbm) 840,000 840,000
1. Excluding exceptional items.
Kees van Seventer (50)is President of Vopak LNG. Kees studied Business Administration. He has held various management positions within Vopak, including his most recent role as Commercial President of Royal Vopak.
Highlights of 2016 “Gate Terminal was expanded in 2016 to include a third berth and dedicated infrastructure for the loading of small LNG vessels. These small LNG vessels will enable distribution to LNG terminals in other North Sea and Baltic ports where large LNG tankers are unable to deliver directly due to their draught. In conjunction with LNG bunker vessels, the new berth will also make it easier for ocean-going vessels to fill up with LNG in Rotterdam. Furthermore, we took the decision to triple the existing truck-loading capacity to facilitate the growth in LNG trucking.
Vopak and Exmar announced the signing of an agreement on 21 December 2016 regarding the acquisition of the FSRU business of Exmar by Vopak and the possible cooperation between Vopak and Exmar in future projects. The finalization and scope of the deal is subject to consent and cooperation of multiple stakeholders including current partners in the FSRUs and customary approval from authorities.”
Performance “Our result from joint ventures remained stable and we continued to operate safely in 2016. We maintained our focus on developing new opportunities. The lower EBITDA is primarily caused by business development costs in connection with the announced transactionrelating to the LNG activities of Exmar.”
2017 and beyond “We expect that new LNG production capacity will significantly influence the energy mix in the coming years. These LNG streams will need to find new demand centers, e.g. to be connected to national grids serving growing deficit markets and to serve as gas supply for gas-powered electricity production. These new consumption markets, which often are being served by Vopak’s current network customers, require quick market solutions. Vopak LNG sees floating storage and regasification assets as a solution to capture these opportunities, supported by long-term customer contracts. In connection with jetty or mooring infrastructure, these FSRUs provide entry points to distribute LNG in new and existing markets. In addition, a foothold in LNG infrastructure with a floating solution creates a strategic position to leverage on future LNG flow developments of land-based LNG regasification terminal solutions once markets have matured. Vopak’s global network and local presence support these opportunities.”
53LNG |In
trod
uctio
nE
xecutive B
oard
repo
rtS
torin
g vital p
rod
ucts
with
careK
ey develo
pm
ents
per d
ivision
Su
stainab
ilityG
overnan
ce, risk an
d co
mp
liance
Finan
cial Statem
ents
Ad
ditio
nal in
form
ation
Key d
evelop
men
ts p
er divisio
n53 | Vopak | Annual Report 2016 | LNG

Learning by doingProject goalTo provide practical safety and health lessons to young students who have difficulty processing theoretical information.
Realized in 2016A team of Vopak employees organized a range of practical classes providing the pupils, between ages 14 and 18, with basic skills and enhancing their safety awareness. These classes helped them to increase their chances of graduating and potentially getting an internship or maybe even
finding a future job. The lessons turned out to be a great success. With a lot of personal attention, patience and, above all, enthusiasm, Vopak employees taught the students important safety response measures, like how to extinguish a fire, how to work with an oxygen mask and how to provide first aid. The students were also invited for a visit to a terminal and received a ‘certificate of participation’. A few students succeeded in obtaining their official VCA certificate (Safety, Health and Environment Checklist for Contractors) and some of them even found an internship.
Weconnect Vopak Terminal Botlek,the Netherlands
54 | Vopak | Annual Report 2016In
trod
uctio
nE
xecutive B
oard
repo
rtS
torin
g vital p
rod
ucts
with
careG
overnan
ce, risk an
d co
mp
liance
Ad
ditio
nal in
form
ation
Finan
cial Statem
ents
Su
stainab
ilityK
ey develo
pm
ents
per d
ivision
| Vopak | Annual Report 2016

SustainabilitySustainability performance
Stakeholder engagement and materiality assessment
Reporting scope
Notes to Sustainability performance
Our response to climate change
Our responsibility towards taxation
Intro
du
ction
Execu
tive Bo
ard rep
ort
Sto
ring
vital pro
du
cts w
ith care
Key d
evelop
men
ts p
er divisio
nS
ustain
ability
Govern
ance, risk
and
com
plian
ceFin
ancial S
tatemen
tsA
dd
ition
al info
rmatio
nS
ustain
ability
Sustainability

Project goalTo increase employment opportunities for students by setting up an integrated university course focused on the terminaling industry and giving them exposure to international business.
Realized in 2016On the initiative of Vopak, Tolani Polytechnic College and industry experts designed a 30-hour curriculum about the terminalingindustry, including theory, a practicum and fieldvisits of the students to the Vopak terminal.Under the program,130 final-year studentsfrom the Tolani Polytechnic college weretrained in specific modules about Safety,Health and the Environment, operation andterminal infrastructure development andmaintenance. The students who passed theirexamination successfully completed thecourse and were awarded a certificate.Moreover, four outstanding students havebeen selected to visit a Vopak terminal inSingapore to apply their learnings in a differentbusiness environment and gain insight intocultural differences. These students will alsobe given priority in interviews for the Kandlatraineeship program for graduate and diplomaengineers. The learnings of the first year of thisproject will be integrated in the curriculum fornext year, and further relevant elements willbe added for a new group of students.
With this project, the team in Kandla is proud to contribute to realizing the Indian government’s ambition to increase the skills and employability of the workforce, in particular of young people. The team is highly motivated to continue its efforts.
Weconnect Vopak Terminal Kandla, India
Utkarsh
56 | Vopak | Annual Report 2016In
trod
uctio
nE
xecutive B
oard
repo
rtS
torin
g vital p
rod
ucts
with
careK
ey develo
pm
ents
per d
ivision
Govern
ance, risk
and
com
plian
ceA
dd
ition
al info
rmatio
nFin
ancial S
tatemen
tsS
ustain
ability
| Vopak | Annual Report 2016

Note 2016 2015 2014 2013
Occupational health and safety 1
Fatalities, own employees and contractors 0 1 0 1
Total Injury Rate (TIR), own employees and contractors (per 200,000 hours worked) 0.29 0.39 0.39 0.36
Lost Time Injury Rate (LTIR), own employees and contractors (per 200,000 hours worked) 0.13 0.12 0.13 0.12
Sickness absence rate own employees 2.2% 2.0% 1.8% 2.0%
Process safety 2
Process Safety Events Rate (PSER), own employees and contractors (per 200,000 hours worked) 0.23 0.27 0.20 0.35
Total Tier 1 process safety events 12 9 12 22
Total Tier 2 process safety events 17 29 24 34
Application of best practices 3 Q.R. N.R. N.R. N.R.
VOC emissions 4
Total VOC emissions Q.R. N.R. N.R. N.R.
Total NOx emissions (metric tons) 514 527 547 N.R.
Total SOx emissions (metric tons) 3 3 13 N.R.
Soil and groundwater pollution 5
Total number of reportable spills 44 N.R. N.R. 48
Total amount of reportable spills (metric tons) 776 894 260 558
Water pollution 6
Total number of spills to surface and sewage water 9 N.R. N.R. N.R.
Total amount of spills to surface and sewage water (metric tons) 18 N.R. N.R. N.R.
CO2 emissions (including energy use) 7
Direct carbon emissions (kiloton) 186 189 189 223
Indirect carbon emissions (kiloton) 240 260 231 248
Total carbon emissions (kiloton) 426 449 420 471
Total relative carbon emissions (kg/cbm) 13.7 14.4 14.2 17.0
(Cyber) security threats 8 Q.R. N.R. N.R. N.R.
Business ethics and integrity 9
Number of fines from permit violations 2 3 2 4
Monetary value of fines from permit violations (in EUR thousands) 96 27 10 170
Total number of incidents of discrimination, fraud, corruption and bribery 3 12 2 8
Total number of vapor, odor and stench complaints 54 17 22 N.R.
Diversity 10
Total number of employees (in headcount) 5,555 5,930 5,779 6,088
- Percentage of men 85% 84% 85% N.R.
- Percentage of women 15% 16% 15% N.R.
Talent attraction and retention 11
Annual training hours per employee 47 42 N.R. N.R.
Employee turnover rate 16.7% 8.9% 8.8% N.R.
Financial performance 12 Q.R. N.R. N.R. N.R.
N.R. Not reported as not in sustainability reporting scope before 2016Q.R. Only qualitative reporting
Sustainability performance
57Sustainability performance |In
trod
uctio
nE
xecutive B
oard
repo
rtS
torin
g vital p
rod
ucts
with
careK
ey develo
pm
ents
per d
ivision
Su
stainab
ilityG
overnan
ce, risk an
d co
mp
liance
Finan
cial Statem
ents
Ad
ditio
nal in
form
ation
Su
stainab
ility57 | Vopak | Annual Report 2016
Sustainability performanceSustainability performance

Stakeholder engagement and materiality assessment
Daily contacts Customers, suppliers, business partners and employees meet to share important information every day. In addition, various audits are undertaken, both by Vopak (Global Insurance, Global Internal Audit, Terminal Health Assessments and Project Post Implementation Reviews) and by our customers and various authorities. These audits aim to assure control for internal purposes, confirm the integrity of our terminals and processes, and assess implementation plans.
Regular contacts We maintain regular contacts with neighbors, local communities, authorities and financial and capital markets. Organizing around 300 individual meetings, presentations, roadshows and other events each year enables us to demonstrate our aim to be transparent towards all of these target groups. In addition, we organize regular communications through webcasts and our websites.
Annual contacts We maintain contacts with non-governmental organizations (NGOs), sustainability organizations and governments in the countries in which we operate. Besides maintaining direct contacts with these stakeholders, we undertake various surveys throughout the year. The aim of these employee and customer satisfaction surveys is to verify the implementation of the suggestions, comments and recommendations we have received at operational and policy levels.
In order to identify and determine the strategic sustainability priorities going forward, we conducted a stakeholder exercise in 2016 among a diverse group of stakeholders spread across the globe. In this exercise, we engaged with our internal and external stakeholders.
This section presents details on the process of the stakeholder engagement and the materiality assessment.
The following topics are presented in this section:• Materiality assessment process 2016• Materiality matrix
Identifying and determinig our strategic sustainability priorities
Vopak aims for transparency and an open dialogue with its various stakeholders. Transparency creates trust, and an open dialogue provides valuable insights into our business and operating environments. We maintain direct and regular contact with our stakeholders throughout many levels in our organization, using various channels such as meetings, surveys, capital market updates, roadshows and webcasts.
58 | Vopak | Annual Report 2016In
trod
uctio
nE
xecutive B
oard
repo
rtS
torin
g vital p
rod
ucts
with
careK
ey develo
pm
ents
per d
ivision
Govern
ance, risk
and
com
plian
ceA
dd
ition
al info
rmatio
nFin
ancial S
tatemen
tsS
ustain
ability
| Vopak | Annual Report 2016
Stakeholder engagement and materiality assessmentStakeholder engagement and materiality assessment

Materiality assessment process 2016
Stakeholder groups We reassessed the stakeholders who can impact or influence our business and those that could be impacted by our operations. This longlist of various stakeholders was then categorized into groups based on their common interest. As a result, a total of nine stakeholder groups were identified:
Stakeholder group Expectations Key topics
Customers Increasingly put sustainability high on their agenda and require Vopak, as an important link in their supply chain, to at least align its sustainability policy with theirs.
• Business ethics and integrity• Process safety• Occupational health and safety
Business partners Looking for long-term relationships to realize growth based on mutual trust and value creation.
• Application of best practices• Process safety• Customer acceptance and continuation
Authorities Issue stricter regulations and increase inspections for the industry as a whole.
• Business ethics and integrity• Process safety• VOC emissions, Soil and groundwater
pollution and Water pollution
Financial and capital markets
Increasingly take a long-term appreciative view of companies that aim for sustainable profitability.
• Financial performance• (Cyber) security threats• Process safety
Neighbors and local communities
Increasingly require Vopak to engage with them to address issues such as stench and odors.
• VOC emissions, soil and groundwaterpollution and water pollution
• Business ethics and integrity• Process safety
NGOs NGOs expect Vopak to be a responsible, transparent, cooperative and trustworthy partner.
• VOC emissions, Soil and groundwaterpollution and Water pollution
• Business ethics and integrity• Process safety
Employees Value a company that cares, helps to develop their talents and offers training programs to develop the full potential of every individual.
• Business integrity and ethics• Financial performance• (Cyber) security threats
Senior management Determines the overall long-term strategy on our ‘License to Operate’ and our expansion plans.
• Business ethics and integrity• Process safety• (Cyber) security threats
Suppliers Suppliers of assets value long-term relationships. Suppliers of services (e.g. contractors) expect a safe and healthy workspace and fair treatment.
• Occupational health and safety• Process safety• Business ethics and integrity
Within each stakeholder group, a number of diverse stakeholders were selected. The relevant contacts of the stakeholders were then identified and informed by our global, regional or local management. Our response to the key topics and concerns from the stakeholders is embedded in our Management Approach. For the Disclosures on Management Approach (DMA) on the relevant topics, reference is made to the reference table in the Reporting scope section.
Relevant topicsBased on the previous exercise in 2014, the wealth of feedback received from roadshows, employee and customer surveys and additional desk research, a similar process was followed to arrive at the final short list of 26 most relevant topics. These topics are prioritized and plotted in the Materiality matrix. A full explanation of each topic featured in the matrix can be found on the next page.
EngagementWe approached the selected stakeholders by sending out questionnaires and, in some cases, through interviews. All stakeholders were asked to rank each topic on a scale of one to five according to what they consider would be relevant and impactful for Vopak to act on, with the opportunity to add comments and missing topics. Additionally, they were asked ‘dilemma’ or boundary questions. This led to a total of 54 survey responses.
59Stakeholder engagement and materiality assessment |In
trod
uctio
nE
xecutive B
oard
repo
rtS
torin
g vital p
rod
ucts
with
careK
ey develo
pm
ents
per d
ivision
Su
stainab
ilityG
overnan
ce, risk an
d co
mp
liance
Finan
cial Statem
ents
Ad
ditio
nal in
form
ation
Su
stainab
ility59 | Vopak | Annual Report 2016 | Stakeholder engagement and materiality assessment

Ranking and validation Our external stakeholders (including employees, but excluding senior management) collectively determined the level of importance of the 26 topics. Each stakeholder group is weighted equally.
Senior management collectively determined the importance to the business of the 26 topics. The initial outcome was discussed and validated through various management platforms resulting in minor shifts in the ranking of topics based on their importance to the business. A final session was held with the Executive Board, leading to the Materiality matrix as presented in the next section.
Materiality matrixBased on the ranking of topics determined as most important across stakeholder groups (vertical axis), and ranked as most impactful to our business (horizontal axis), nine key topics emerged as being the most material. We identified three additional topics of increasing material importance; financial performance, CO2 emissions and diversity.• Key topics: We aim to fulfill a leading role with regard to these topics and have translated them into strategic
sustainability priorities going forward• Topics to monitor: We want to demonstrate our social responsibility regarding these topics. We measure
and (partly) report on these topics in our report• Other topics: These are important topics for Vopak and are accordingly managed but currently not reported
Impact on Vopak’s business
Relevance to stakeholders
Social topics
19 Process safety20 Occupational health and safety21 Talent attraction and retention22 Nuisance23 Labor conditions24 Human rights25 Diversity26 Community engagement
and charity
Financial and governance topics
9 Business ethics and integrity10 Application of best practices11 (Cyber) security threats12 Threats of natural disasters13 Consumer acceptance and continuation14 Financial performance15 Innovation16 Remuneration17 Supplier acceptance and continuation18 Taxation
Environmental topics
1 VOC emissions2 Soil and groundwater pollution3 Water pollution4 Waste5 CO2 emissions6 Energy use7 Water use8 Biodiversity
19
9
1
2011
21
10
23
5 4
67
8
22
12
2313
2514
261617
18
2415
Materiality matrix
Key topics
Other topics
Topics to monitor
60 | Vopak | Annual Report 2016In
trod
uctio
nE
xecutive B
oard
repo
rtS
torin
g vital p
rod
ucts
with
careK
ey develo
pm
ents
per d
ivision
Govern
ance, risk
and
com
plian
ceA
dd
ition
al info
rmatio
n| Vopak | Annual Report 2016 | Stakeholder engagement and materiality assessment
Finan
cial Statem
ents
Su
stainab
ility
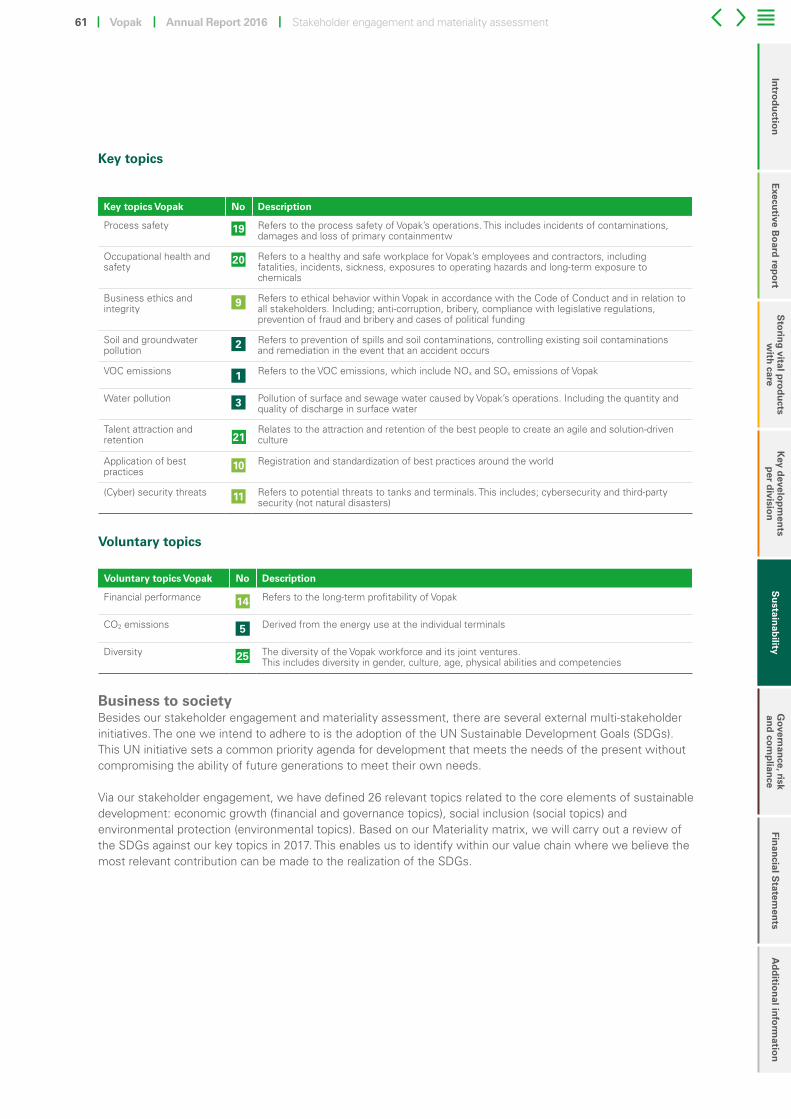
Key topics
Key topics Vopak No Description
Process safety 19 Refers to the process safety of Vopak’s operations. This includes incidents of contaminations,damages and loss of primary containmentw
Occupational health and safety
20 Refers to a healthy and safe workplace for Vopak’s employees and contractors, includingfatalities, incidents, sickness, exposures to operating hazards and long-term exposure to chemicals
Business ethics and integrity 9 Refers to ethical behavior within Vopak in accordance with the Code of Conduct and in relation to
all stakeholders. Including; anti-corruption, bribery, compliance with legislative regulations, prevention of fraud and bribery and cases of political funding
Soil and groundwater pollution 2 Refers to prevention of spills and soil contaminations, controlling existing soil contaminations
and remediation in the event that an accident occurs
VOC emissions 1 Refers to the VOC emissions, which include NOx and SOx emissions of Vopak
Water pollution 3 Pollution of surface and sewage water caused by Vopak’s operations. Including the quantity and quality of discharge in surface water
Talent attraction and retention
1921
Relates to the attraction and retention of the best people to create an agile and solution-driven culture
Application of best practices 10 Registration and standardization of best practices around the world
(Cyber) security threats 11 Refers to potential threats to tanks and terminals. This includes; cybersecurity and third-party security (not natural disasters)
Voluntary topics
Voluntary topics Vopak No Description
Financial performance 14 Refers to the long-term profitability of Vopak
CO2 emissions 5 Derived from the energy use at the individual terminals
Diversity 25 The diversity of the Vopak workforce and its joint ventures.This includes diversity in gender, culture, age, physical abilities and competencies
Business to society Besides our stakeholder engagement and materiality assessment, there are several external multi-stakeholder initiatives. The one we intend to adhere to is the adoption of the UN Sustainable Development Goals (SDGs). This UN initiative sets a common priority agenda for development that meets the needs of the present without compromising the ability of future generations to meet their own needs.
Via our stakeholder engagement, we have defined 26 relevant topics related to the core elements of sustainable development: economic growth (financial and governance topics), social inclusion (social topics) and environmental protection (environmental topics). Based on our Materiality matrix, we will carry out a review of the SDGs against our key topics in 2017. This enables us to identify within our value chain where we believe the most relevant contribution can be made to the realization of the SDGs.
61Stakeholder engagement and materiality assessment |In
trod
uctio
nE
xecutive B
oard
repo
rtS
torin
g vital p
rod
ucts
with
careK
ey develo
pm
ents
per d
ivision
Su
stainab
ilityG
overnan
ce, risk an
d co
mp
liance
Finan
cial Statem
ents
Ad
ditio
nal in
form
ation
Su
stainab
ility61 | Vopak | Annual Report 2016 | Stakeholder engagement and materiality assessment

Reporting scopeWe aim to be clear and transparent towards our stakeholders regarding our sustainability vision, our sustainability policy and our sustainability performance.
The Executive Board determines Vopak’s vision and ambition with regard to sustainability and is responsible for the implementation of Vopak’s Sustainability Policy. This responsibility is delegated to division management and to the management of our operating companies. All Vopak employees have a shared responsibility with regard to sustainability as laid down in the Vopak Code of Conduct and our Sustainability Policy.
Informing stakeholders about Vopak’s sustainability performance has two benefits:• It enhances the support for and credibility with regard to the way Vopak manages its sustainability issues• It enables a dialogue with stakeholders and the communities in which Vopak operates, which helps us gain
insights and improve our performance in the area of sustainability
The purpose of the sustainability information in our Annual Report (including the GRI index as published on our website), covering the financial year 2016, is to inform our stakeholders about our sustainability policy and performance, in connection with our main strategic objectives and targets. The GRI Index specifies the references to the indicators in scope, as well as any omissions and reasons therefore. This report specifically reviews the developments and performance in 2016 and is based on topics identified as material for Vopak. Information that has a more static nature or is considered to have a lower reporting priority is therefore included in the GRI index on our website.
This section contains the disclosures relevant for understanding the basis of preparation of the consolidated sustainability performance.
Reporting periodThe reporting period for the sustainability information in this Annual Report is the 2016 financial year, covering Vopak’s activities from 1 January 2016 to 31 December 2016. This report builds on the previous annual Sustainability Reports. In recognition of the fact that sustainability is a core element of our strategy and operations, we continue to combine our Sustainability Report with the Annual Report.
Reporting process and assuranceAs in previous years, sustainability information has been subject to internal audit. In addition, Vopak has requested its external auditor to provide limited assurance on its sustainability reporting. The external auditor takes the findings of the internal auditor into consideration, to the extent relevant.
The sustainability data have mainly been obtained from our global consolidation and management reporting system and additionally from the HR management system, compliance management system and operational (safety and environment) management reporting system.
The data are consolidated by our Global Operations department and reviewed by the Global Finance department. The responsibility for reporting on sustainability is currently assigned to the Global Operations department. We have a continuous focus to further embed the material themes into the responsibilities of the relevant departments, strengthen our non-financial data collection process and proceed with further integration into the financial reporting process. On a quarterly basis, key sustainability topics will be reported to the Supervisory Board and the Executive Board.
For further details on the governance and control framework, reference is made to the Governance and compliance chapter.
Reporting criteriaThis report on Vopak’s sustainability performance has been prepared in accordance with the G4 sustainability reporting guidelines of the Global Reporting Initiative (GRI), which were created to promote globally uniform, measurable reports in the economic, social and environmental domains. Our 2016 sustainability reporting follows the ‘comprehensive’ option of the GRI G4 reporting guidelines.
62 | Vopak | Annual Report 2016In
trod
uctio
nE
xecutive B
oard
repo
rtS
torin
g vital p
rod
ucts
with
careK
ey develo
pm
ents
per d
ivision
Govern
ance, risk
and
com
plian
ceA
dd
ition
al info
rmatio
nFin
ancial S
tatemen
tsS
ustain
ability
| Vopak | Annual Report 2016
Reporting scope Reporting scope
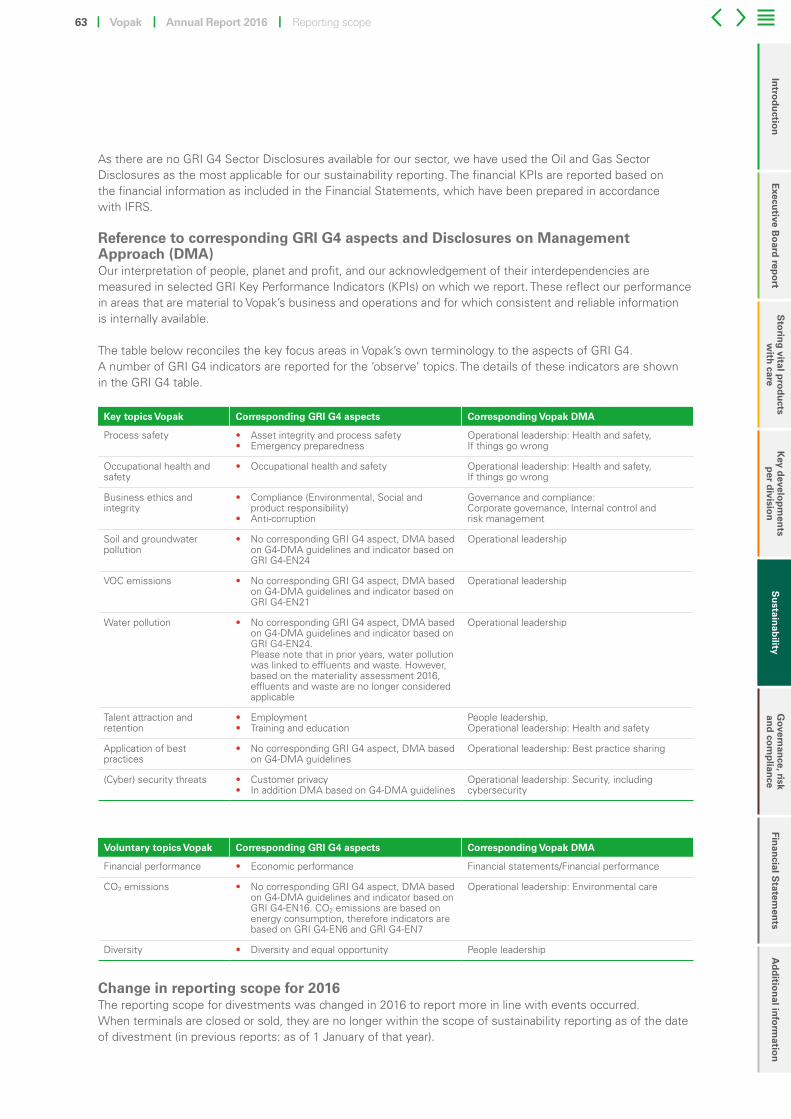
As there are no GRI G4 Sector Disclosures available for our sector, we have used the Oil and Gas Sector Disclosures as the most applicable for our sustainability reporting. The financial KPIs are reported based on the financial information as included in the Financial Statements, which have been prepared in accordance with IFRS.
Reference to corresponding GRI G4 aspects and Disclosures on Management Approach (DMA)Our interpretation of people, planet and profit, and our acknowledgement of their interdependencies are measured in selected GRI Key Performance Indicators (KPIs) on which we report. These reflect our performance in areas that are material to Vopak’s business and operations and for which consistent and reliable information is internally available.
The table below reconciles the key focus areas in Vopak’s own terminology to the aspects of GRI G4. A number of GRI G4 indicators are reported for the ‘observe’ topics. The details of these indicators are shown in the GRI G4 table.
Key topics Vopak Corresponding GRI G4 aspects Corresponding Vopak DMA
Process safety • Asset integrity and process safety• Emergency preparedness
Operational leadership: Health and safety, If things go wrong
Occupational health and safety
• Occupational health and safety Operational leadership: Health and safety, If things go wrong
Business ethics and integrity
• Compliance (Environmental, Social andproduct responsibility)
• Anti-corruption
Governance and compliance: Corporate governance, Internal control and risk management
Soil and groundwater pollution
• No corresponding GRI G4 aspect, DMA basedon G4-DMA guidelines and indicator based onGRI G4-EN24
Operational leadership
VOC emissions • No corresponding GRI G4 aspect, DMA basedon G4-DMA guidelines and indicator based onGRI G4-EN21
Operational leadership
Water pollution • No corresponding GRI G4 aspect, DMA basedon G4-DMA guidelines and indicator based onGRI G4-EN24.Please note that in prior years, water pollutionwas linked to effluents and waste. However,based on the materiality assessment 2016,effluents and waste are no longer consideredapplicable
Operational leadership
Talent attraction and retention
• Employment• Training and education
People leadership, Operational leadership: Health and safety
Application of best practices
• No corresponding GRI G4 aspect, DMA basedon G4-DMA guidelines
Operational leadership: Best practice sharing
(Cyber) security threats • Customer privacy• In addition DMA based on G4-DMA guidelines
Operational leadership: Security, including cybersecurity
Voluntary topics Vopak Corresponding GRI G4 aspects Corresponding Vopak DMA
Financial performance • Economic performance Financial statements/Financial performance
CO2 emissions • No corresponding GRI G4 aspect, DMA basedon G4-DMA guidelines and indicator based onGRI G4-EN16. CO2 emissions are based onenergy consumption, therefore indicators arebased on GRI G4-EN6 and GRI G4-EN7
Operational leadership: Environmental care
Diversity • Diversity and equal opportunity People leadership
Change in reporting scope for 2016The reporting scope for divestments was changed in 2016 to report more in line with events occurred. When terminals are closed or sold, they are no longer within the scope of sustainability reporting as of the date of divestment (in previous reports: as of 1 January of that year).
63Reporting scope |In
trod
uctio
nE
xecutive B
oard
repo
rtS
torin
g vital p
rod
ucts
with
careK
ey develo
pm
ents
per d
ivision
Su
stainab
ilityG
overnan
ce, risk an
d co
mp
liance
Finan
cial Statem
ents
Ad
ditio
nal in
form
ation
Su
stainab
ility63 | Vopak | Annual Report 2016 | Reporting scope

Reporting adjustmentsThere have been no adjustments to information provided in previous reports.
Basis of consolidationFor sustainability reporting purposes, Vopak consolidates data from those terminals under its operational control unless acquired within the last 12 months and from terminals that report voluntarily although they are not under our operational control. A terminal under operational control implies:• Application of Vopak´s operational standards• Adherence to Vopak´s Code of Conduct• Being part of the three-year cycle of Vopak´s Terminal Health Assessments (THA)
ConsolidationFour terminals report voluntarily. These are the two LNG terminals: Gate Terminal (the Netherlands) and the TLA terminal (Mexico), and Vopak Terminal Korea (Korea), and Engro Vopak Terminal (Pakistan).
The table below reconciles the storage capacity reported in the financial statements to that used for sustainability reporting purposes:
In million cbm 2016
Total storage capacity according to Vopak Financial Statements 34.7
Bahia Las Minas -0.5
Sabtank (Jubail) -1.5
Sabtank (Yanbu) -0.3
Chemtank (Jubail) -0.2
Maasvlakte Olie Terminal (MOT) -1.1
Estonian Railway Services (ERS - part of Vopak E.O.S.) 0.0
Total excluded -3.6
Total storage capacity according to the sustainability reporting scope 31.1
Total storage capacity according to the sustainability reporting scope - LNG 0.8
Total storage capacity according to the sustainability reporting scope - Liquid bulk and other gases 30.3
This annual report includes changes in our 2016 storage capacity in accordance with the following principles:• Greenfield: Undeveloped land that is acquired to build a new terminal is within the reporting scope from
the first day of acquisition• Brownfield: When an existing terminal is expanded, the entity is immediately within the scope of
sustainability reporting• Acquisition: When a terminal is acquired and operations are continued, there will be a grace period of one
calendar year before the terminal is within the scope of sustainability reporting. During this year, all datamust be reported and monitored in our internal reporting system
• Divestment: When terminals are closed or sold, they are no longer within the scope of sustainabilityreporting as of the date of divestment
Acquisitions and divestments The capacity expanded in 2016 by a net increase in storage capacity at existing terminals and the addition of new terminals, and acquisitions, corrected for divestments. A reference is made to the Storage capacity developments 2016 overview in the Business envrionment section of the Executive Board report.
64 | Vopak | Annual Report 2016In
trod
uctio
nE
xecutive B
oard
repo
rtS
torin
g vital p
rod
ucts
with
careK
ey develo
pm
ents
per d
ivision
Govern
ance, risk
and
com
plian
ceA
dd
ition
al info
rmatio
n| Vopak | Annual Report 2016 | Reporting scope
Finan
cial Statem
ents
Su
stainab
ility

Reporting of people The starting point of the Vopak sustainability program is that every person employed by a Vopak-operated entity will be counted as one person.
All reported number of employees in the sustainability part of this Annual Report are based on actual headcount, unless otherwise stated. All reported number of contractors in the sustainability part of this Annual Report are based on man years.
Safety extends to contractors Please note that safety relates not only to Vopak employees, but also to the employees of our contractors when they are working on our sites.
Carbon reporting Vopak’s reporting on energy use and carbon emissions (based on CO2 emissions), encompasses Scope 1 (direct energy use and emissions from the combustion of fossil fuels) and Scope 2 emissions (indirect energy use and emissions from electricity purchased for our own use). Despite the fact that this was considered not material to Vopak during the materiality assessment, we decided to report on parts of the GRI G4 requirements as far as they are applicable to Vopak and deliver added value to stakeholders. Therefore, our reporting on emissions includes carbon dioxide as well as other emissions (NOx, SOx and not yet reported VOC). Vopak does not report on its Scope 3 (other indirect) emissions as this is not material compared to our total carbon emissions. The total of our scope 3 emissions is less than 5%.
Scope of carbon reporting
CO2 SF6 CH4 N2O HFCS PFCS x
Scope 2 Scope 1 Scope 3Indirect Direct Indirect
Purchased electricity for own use
Fuel combustion Production of purchased materials
Product use Outsourced activities
Employee business travel
Waste disposal
Contractor-owned vehicles
Vopak’s energy consumption depends on the products we store for our customers, the weather conditions and the amount of product pumped (electricity consumption). Short-term energy-saving programs focus therefore on improving the processes of heat exchange and efficiencies within the system.
65Reporting scope |In
trod
uctio
nE
xecutive B
oard
repo
rtS
torin
g vital p
rod
ucts
with
careK
ey develo
pm
ents
per d
ivision
Su
stainab
ilityG
overnan
ce, risk an
d co
mp
liance
Finan
cial Statem
ents
Ad
ditio
nal in
form
ation
Su
stainab
ility65 | Vopak | Annual Report 2016 | Reporting scope

Spills reporting All spills with an impact of more than 200kg will be reported as reportable spills. This also includes the process safety related Tier 1 and Tier 2 loss of primary containments according to API RP 754.
Basis of measurement Within Vopak, we use internal standards for safety and incident reporting, environmental issues, technical design issues, etc. Some of these standards are part of the reporting system that provides the basic data for our sustainability reporting. However, we also use specific external standards that give the methods for the calculation of specific parameters and standard conversion factors. Vopak applies the following external methods and standards:
Safety
Personal and process safety API RP 754
Energy
Conversion of consumption to energy Dutch list of fuels and standard CO2 emission factors, version January 2016
Conversion of natural gas consumption to energy Energy Information Administration (EIA) and for Belgium and Singapore location specific conversion factors
Carbon
Direct energy conversion to carbon emissions Dutch list of fuels and standard CO2 emission factors, version January 2016
Conversion of electricity to carbon emissions International Energy Agency (IEA)
SOx emissions 2015 Specific emission factors per source stream
NOx emissions IPCC guidelines for National Greenhouse Gas Inventories
Vopak 400 jubilee trams Edwin Sonneveld and Heleen Groeneweg won the Vopak 400 tram design competition, which was open to everybody who lives, works or studies in the Rotterdam area. Both designs were inspired by the huge Vopak tanks that are visible in the Port of Rotterdam.
Edwin used a satellite as his starting point for his design showing the tanks as circles. He used the circles to present moments in the rich history of Vopak. Heleen used the 400-year old Vopak hat which she also turned into a party hat, and safety helmet. “It’s both the management and the people on the workfloor who made Vopak” she explained her choice to use the different types of Vopak hats.
“ It represents the people who made Vopak”
66 | Vopak | Annual Report 2016In
trod
uctio
nE
xecutive B
oard
repo
rtS
torin
g vital p
rod
ucts
with
careK
ey develo
pm
ents
per d
ivision
Govern
ance, risk
and
com
plian
ceA
dd
ition
al info
rmatio
n| Vopak | Annual Report 2016 | Reporting scope
Finan
cial Statem
ents
Su
stainab
ility

Project goalTo help high school and university students develop critical thinking, empathy, creativity and self-confidence.
Realized in 2016Together with our local partner and with the engagement of undergraduate students and colleagues in Karachi, Pakistan, we realized Summer Camps for more than 200 students, boys and girls, between the ages of 13 and 16. The youngsters from low-income governmental schools were given the opportunity to explore their abilities and talents in an alternative learning environment, whereby personal engagement and mutual respect came first.
The program helped the teenagers gain confidence and feel free to speak openly. They explored their abilities and talents and learned about subjects like philosophy, world history, drama and art. The undergraduate students attended a special Fellowship Program to develop their personal and professional skills, enabling them to act as a mentor and teacher and to help them realize their own potential. The program received an excellent response. Not only from the participants, but also from the enthusiastic employees who were excited to open up new horizons for young people in their community.
Weconnect Engro Vopak Terminal,Pakistan
Pensail
67In
trod
uctio
nE
xecutive B
oard
repo
rtS
torin
g vital p
rod
ucts
with
careK
ey develo
pm
ents
per d
ivision
Su
stainab
ilityG
overnan
ce, risk an
d co
mp
liance
Finan
cial Statem
ents
Ad
ditio
nal in
form
ation
Su
stainab
ility |
Intro
du
ction
Execu
tive Bo
ard rep
ort
Sto
ring
vital pro
du
cts w
ith care
Key d
evelop
men
ts p
er divisio
nG
overnan
ce, risk an
d co
mp
liance
Ad
ditio
nal in
form
ation
67 | Vopak | Annual Report 2016 | Reporting scope
Finan
cial Statem
ents
Su
stainab
ility
| Vopak | Annual Report 2016

Notes to Sustainability performanceThis section comprises notes which provide specifications and explanations to Vopak’s sustainability performance for the year 2016.
The following notes are presented in this section:• 1 Occupational health and safety• 2 Process safety• 3 Application of best practices• 4 VOC emissions• 5 Soil and groundwater pollution• 6 Water pollution• 7 CO2 emissions (including energy use)• 8 (Cyber) security threats• 9 Business ethics and integrity• 10 Diversity• 11 Talent attraction and retention• 12 Financial performance
Note 1. Occupational health and safetyThe year 2017 started off with a regretful and deeply tragic fatal accident due to a fall from height at our ACS terminal in Antwerp (Belgium) involving one of our contractors. This is a reminder to all of us that safety is our first and foremost priority and that after each working day we are all entitled to return safely to our homes and families. It emphasizes again that we all have to keep on focusing on how to continue to further improve our safety culture, systems and hardware to ensure a safe working place for all.
How we performed
Subject Commitment Achievement
Personal safety Strive to achieve a Total Injury Rate (TIR) of 0.34 or less per 200,000 working hours for own employees and contractors in 2016
The TIR was 0.29 in 2016
Safety improvements Fewer incidents occurred in 2016 compared to previous years. However, the sickness rate increased on a company-wide level compared to previous year.
Total Injury Rate Lost Time Injury Rate Sickness rate %
In EUR millions 2016 2015 2016 2015 2016 2015
Netherlands 0.47 1.01 0.18 0.27 5.4 5.3
Europe, Middle East & Africa 0.65 0.58 0.31 0.25 2.8 2.8
Asia 0.13 0.20 0.03 0.05 1.2 0.9
Americas 0.36 0.39 0.20 0.00 1.2 1.0
LNG 0.25 0.00 0.25 0.00 3.0 1.8
Global HQ 0.35 0.32 0.35 0.32 2.4 2.1
Total Vopak 0.29 0.39 0.13 0.12 2.2 2.0
The percentage of people exposed to higher work-related risks related to their occupation (operational and maintenance staff at our terminals) was 50% of the total workforce in 2016.
68 | Vopak | Annual Report 2016In
trod
uctio
nE
xecutive B
oard
repo
rtS
torin
g vital p
rod
ucts
with
careK
ey develo
pm
ents
per d
ivision
Govern
ance, risk
and
com
plian
ceA
dd
ition
al info
rmatio
nFin
ancial S
tatemen
tsS
ustain
ability
| Vopak | Annual Report 2016
Notes to Sustainability performanceNotes to Sustainability performance

Total Injury Rate
0.36 0.39 0.39
0.29
2015 20162013 2014
0.7
0.6
0.5
0.4
0.3
0.2
0.1
Lost Time Injury Rate
0.13 0.120.12
2015 20162013 2014
0.7
0.6
0.5
0.4
0.3
0.2
0.10.13
In terms of personal safety, the performance in 2016 is significantly better than in 2015. The combined TIR of 0.29 is significantly lower than the performance in the same period last year (0.39) and is below the set target of 0.34 for 2016. The Total Injuries Combined (TIC) of 47 reported in 2016, is a reduction of 27% compared to the injury events recorded in 2015. Key improvements came from the Netherlands division. As part of the TIC, the increased Lost Time Injuries in 2016 (21) compared to 2015 (19) is a matter of concern.
Sickness percentage There were no reported cases of employees suffering from occupational diseases. There is no specific reason for the minor increase of the sickness rate of 2.2% compared to 2.0% in 2015. However, this is an area of attention for the specific terminals with a higher sickness percentage.
2017 and beyondPrimarily driven by our ambition for zero personal incidents, Vopak will keep on strengthening the safety culture, systems and hardware to ensure a safe working place for all. In line with this aspiration for improvement, Vopak strives not to exceed a Total Injury Rate (TIR) of 0.31 per 200,000 working hours for own employees and contractors in 2017.
Global mindsOn 5 October 2016, the Dutch King Willem-Alexander attended the ‘Global Minds’ Conference in Rotterdam, which was organized for the occasion of celebrating the 400 years’ history of Royal Vopak. Former Secretary-General of the United Nations, Kofi Annan, who was a speaker at the conference, emphasized in his speech the importance of cross-border collaboration.
Photographer Jimmy Nelson also gave an inspiring speech about the importance of communication in connection with his photographs of tribes from across the globe.
“ Companies cannot succeed in a failing society”
69Notes to Sustainability performance |In
trod
uctio
nE
xecutive B
oard
repo
rtS
torin
g vital p
rod
ucts
with
careK
ey develo
pm
ents
per d
ivision
Su
stainab
ilityG
overnan
ce, risk an
d co
mp
liance
Finan
cial Statem
ents
Ad
ditio
nal in
form
ation
Su
stainab
ility69 | Vopak | Annual Report 2016 | Notes to Sustainability performance

Note 2. Process safety
How we performed
Subject Commitment Achievement
Process safety Reduce the Process Safety Events Rate (PSER) to a maximum of 0.27 incidents per 200,000 working hours
The PSER was 0.23 in 2016
Process Safety Event Rate
2015 20162013 2014
0.7
0.6
0.5
0.4
0.3
0.2
0.1
0.35
0.200.27
0.23
Process Safety Indicators 2016
Tier 1 PSE Count Tier 2 PSE Count Tier 1 & Tier 2 PSER
Netherlands 4 3 0.41
Europe, Middle East & Africa 2 4 0.21
Asia 1 4 0.10
Americas 4 6 0.51
LNG 1 0 0.25
Global HQ 0 0 0.00
Total Vopak 12 17 0.23
The total number of Tier 1 and Tier 2 incidents showed a decrease of 24% compared to 2015 (38). However, a matter of concern is that the number of Tier 1 incidents (serious incidents) increased by 33%. The decrease of total incidents is mainly due to improvements in our Netherlands division, partially offset by the increased Tier 1 incidents in our Americas division.
2017 and beyondPrimarily driven by our ambition for zero process incidents, Vopak will keep on strengthening the safety culture, systems and hardware to ensure a safe working place for all. In line with this aspiration for improvement, Vopak strives not to exceed the Process Safety Event Rate (PSER) of 0.25 per 200,000 working hours in 2017.
70 | Vopak | Annual Report 2016In
trod
uctio
nE
xecutive B
oard
repo
rtS
torin
g vital p
rod
ucts
with
careK
ey develo
pm
ents
per d
ivision
Govern
ance, risk
and
com
plian
ceA
dd
ition
al info
rmatio
n| Vopak | Annual Report 2016 | Notes to Sustainability performance
Finan
cial Statem
ents
Su
stainab
ility

Note 3. Application of best practices
How we performedThrough participations in various working groups and discussion platforms, Vopak explains its position and value as an independent storage company in order to contribute to developing best practices and standards within the industry. The knowledge from these participations will be used in the development and updating of our internal standards and programs (e.g. Assure).
Vopak participates in discussions about international developments and government policies with respect to the direction of the energy and chemical industry in the long term. Furthermore, the technical knowledge of Vopak personnel is translated into practical guidelines and technical papers. Vopak also participates in research and innovation platforms such as iTanks and SmartPort (innovation platforms in the Port of Rotterdam) and in fundamental research (Bio-based Geo and Civil Engineering for a Sustainable Society).
Vopak participated in the following three types of associations in 2016:
Branch organizations These include numerous organizations at a local, national and regional level, such as: the Dutch association of independent tank storage companies (VOTOB), the Federation of European Tank Storage Associations (FETSA), the Dutch LNG Platform, the Dutch Hydrogen Platform, the European Petrochemical Association, the Gulf Petrochemicals and Chemicals Association and the Network for Industrially Contaminated Land in Europe (NICOLE). Vopak is also member of the NICOLA organization, the South African equivalent of NICOLE.
Technical affiliations Vopak is among others a member of a subcommittee of the World Association for Waterborne Transport Infrastructure (PIANC), the Engineering Equipment and Materials Users’ Association (EEMUA), the Nederlands Normalisatie Instituut which sets guidelines and technical standards in the Netherlands (NEN), and StrucTuuRvisie ONderGrond (STRONG), a Dutch governmental initiative of the Ministries of Infrastructure and Economic Affairs, for organizing the activities in the subsoil on land as well as on the seabed, and the Petrobot program. Vopak participates in the Oil Companies International Marine Forum (OCIMF), a voluntary association of oil companies with an interest in the shipment and storage of crude oil, oil products, petrochemicals and gases.
Research and public debate Vopak is amongst others involved in the International Energy Forum, Clingendael International Energy Program (CIEP), the World Economic Forum, STW (Dutch technology foundation for fundamental research) and the iTanks institute. Within the BioGeoCivil program, Bio-based Geo & Civil Engineering for a Sustainable Society, biology-based materials, technology and processes have been studied and developed with the aim of solving engineering challenges, while at the same time reducing the impact on the environment.
Vopak became associated with the EcoVadis system in 2015. EcoVadis operates the first collaborative platform providing supplier sustainability ratings for global supply chains. Since its establishment in 2007, EcoVadis has become a trusted partner for procurement organizations in more than 120 leading multinationals worldwide. At present, 21 of our Vopak terminals are storing products on behalf of these organizations.
During 2016, we contributed to the introduction of:• The final report of STRONG ‘Ontwerp structuurvisie ondergrond’• The PIANC report ‘Recommendations for the design of Marine Oil Terminals’
2017 and beyondAll terminals will be audited against the Assure 2016 requirements in 2017. We will continue to participate in external associations and organizations to develop and update our internal standards and programs, in particular for the tank storage industry.
71Notes to Sustainability performance |In
trod
uctio
nE
xecutive B
oard
repo
rtS
torin
g vital p
rod
ucts
with
careK
ey develo
pm
ents
per d
ivision
Su
stainab
ilityG
overnan
ce, risk an
d co
mp
liance
Finan
cial Statem
ents
Ad
ditio
nal in
form
ation
Su
stainab
ility71 | Vopak | Annual Report 2016 | Notes to Sustainability performance

Note 4. VOC emissions
How we performedOur prime responsibility is to adhere to the (local) legislation on air emissions. In our 2016 materiality assessment, we received confirmation from our stakeholders that our Volatile Organic Compound (VOC) releases to the air are deemed as material. As of today, we only measure/calculate our VOC emissions at a limited amount of locations. Therefore, we are not able to report quantitatively on a consolidated level. However, related to the VOC emissions the emissions of NOx and SOx are available and reported.
Vopak is currently engaged in a process to assess its VOC emissions. At present, the terminals that are reporting on VOC emissions measure this according to the existing reporting models. We are working on increasing our understanding of and improving the reporting of VOC. This also includes the implementation of applicable calculating models at our terminals and an upgrade of terminals that do not have sufficient preventive measures.
In order to minimize our VOC emissions at the source, we have already implemented the following standard measures at our terminals:
Level of effectiveness
Tank design (minimizing breathing, vaporizing of liquid in the tank)Design pressure 10-100%
Insulation 50-90%
Color 10-30%
Floating roof (minimizing breathing vapors)Reduces exchange of vapor from liquid to air in the tank 50-95%
Vapor balancingConnecting the vapor spaces 90-99%
Treatment (when vapors are released, Vopak applies vapor treatment)Vapour treatment 90-99,99%
NOx and SOx emissions
In metric tons 2016 2015 2014 2013
Total NOx emissions 514 527 547 N.R.
Total SOx emissions 3 3 13 N.R.
Both emissions are calculated based on our energy consumption. Main contributors for NOx emissions are natural gas and gas oil/diesel oil. SOx emissions are mainly related to the use of the natural gas and heating fuel.
2017 and beyondWe aim to report on our VOC emissions globally. In order to accomplish this, we will use a risk-based approach. This means that terminals with a higher expected VOC emission will be addressed first.
72 | Vopak | Annual Report 2016In
trod
uctio
nE
xecutive B
oard
repo
rtS
torin
g vital p
rod
ucts
with
careK
ey develo
pm
ents
per d
ivision
Govern
ance, risk
and
com
plian
ceA
dd
ition
al info
rmatio
n| Vopak | Annual Report 2016 | Notes to Sustainability performance
Finan
cial Statem
ents
Su
stainab
ility

Note 5. Soil and groundwater pollution
How we performed
Spills to soil and groundwater
Contained Uncontained Total
Total number of reportable spills 19 25 44
Total amount of spills (metric tons) 631 145 776
Any uncontained spill is immediately remediated according to the requirements stated in our Vopak standards ‘Spill control’ and ‘Soil and groundwater management’.
Of the total 776 metric tons spilled into soil and groundwater (2015: 894 metric tons), the three major spills (88% of total) were:• Spill of 600 metric tons of low sulfur fuel oil at Sebarok (Singapore)• Spill of 41 metric tons of gasoline at Sebarok (Singapore)• Spill of 41 metric tons of rapeseed oil at Vopak Terminal Vlaardingen (the Netherlands)The spill of gasoline at Sebarok resulted in a soil pollution. This will be handled according to local regulationsand our own Vopak Standards (‘Spill control’ and ‘Soil and groundwater management’). The two other spills werecontained and collected and did not lead to any soil and groundwater pollution.
Ongoing remediation projectsOur terminals are equipped with secondary containment systems to prevent spills and other contaminations from entering the soil and groundwater, especially at locations where the risk of spillage and loss of containment is apparent (such as tank pits, pump pits and loading stations). We continue to identify the total amount of secondary containment and, led by a risk-based approach, we continue to improve the protection of the subsoil and groundwater at our terminals.
Besides prevention, Vopak is also engaged in a process of remediation of 15 existing contaminated locations and one newly acquired contaminated location (Panama), reference is made to Environmental provisions under note 8.5 in the Consolidated Financial Statements. The identification and remediation are guided by our local legislation and ‘Soil and groundwater management’ standard, an internal global standard applicable to all locations within the sustainability scope.
2017 and beyondWe will expand and report on the ratio of secondary containment versus total surface area in the future. In addition to the prevention of new contamination, we will proceed with the remediation at the 16 existing contaminated locations.
Note 6. Water pollution
How we performedIn 2016, we had nine reportable spills into surface and sewage water, with a total of 18 metric tons of product. All spilled product was removed from surface and sewage water. The spill at Vopak Terminal Los Angeles (United States) led to a formal permit violation. For the financial impact of this violation, reference is made to note 9 Business ethics and integrity.
2017 and beyondWe aim to have zero spills to surface and sewage water.
73Notes to Sustainability performance |In
trod
uctio
nE
xecutive B
oard
repo
rtS
torin
g vital p
rod
ucts
with
careK
ey develo
pm
ents
per d
ivision
Su
stainab
ilityG
overnan
ce, risk an
d co
mp
liance
Finan
cial Statem
ents
Ad
ditio
nal in
form
ation
Su
stainab
ility73 | Vopak | Annual Report 2016 | Notes to Sustainability performance

Note 7. CO2 emissions (including energy use)
How we performedThe CO2 emissions over 2016, as well as the relative CO2 emissions (per cbm) decreased by 5% compared to 2015. Main contributions are the decreased consumptions at Vopak E.O.S. (Estonia) and Terminal de Altamira de S. de R.L. (Mexico), the divestments in the UK and in Japan, partially offset by increased consumptions atVopak Terminal Deer Park (United States).
In kilotons 2016 2015 2014 2013
Direct carbon emissions 186 189 189 223
Indirect carbon emissions 240 260 231 248
- Liquid bulk and other gases operations 208 217 189 208
- LNG operations 32 43 42 40
Total carbon emissions 426 449 420 471
Total relative carbon emissions (kg/cbm) 13.7 14.4 14.2 17.0
Our CO2 emissions are measured and calculated based on our energy consumption. The majority is generated during the production of steam for heating purposes (gas consumption) or through electricity consumption for powering our pumps and on a lower level for heating and cooling.
Energy consumption reporting at Vopak is split into two separate categories, liquid bulk operations and LNG operations. The main reason for this is that the LNG operations are more process-oriented than the conventional liquid bulk storage and handling operations. The amount of energy required for the regasification of the LNG is a major part of the total energy consumption.
As regasification of LNG requires a significant consumption of energy, Vopak is using a renewable energy source for this process. At Gate Terminal (the Netherlands), we convert the imported LNG into gas using process water of the nearby electrical power plant. At Terminal de Altamira de S. de R.L. (Mexico), we use regular (i.e. unprocessed) sea water. This means that the terminals do not have to use additional energy sources to heat and vaporize the LNG at the terminals. The electricity used in the LNG operations is mainly used for pumping direct carbon emissions from the LNG operations negligible, a reference is made to the graphs below.
Natural gas LPGFuel/Gas oil Electricity Process water
Carbon emissions mix liquid bulk operations
Carbon emissions mix LNG operations
Energy mix liquid bulk operations
Energy mix LNG operations
37%
7%3%
53%
100%
58%
8%
92%9%
3%
30%
2017 and beyondIn order to achieve 20% savings on energy consumption, the member states of the European Union transposed the Energy Efficiency Directive into national law. This Directive includes measures requiring energy audits that should be carried out every four years, started December 2015.
Vopak has identified the impact of this directive on its terminals. It appeared that only the terminals in the Netherlands needed to have an energy efficiency program. This program was developed and externally assessed as required, without any findings. During 2016, this resulted in the Energy Efficiency Program 2017-2020. We aim to extend a similar energy efficiency program to other locations. In order to accomplish this, we will use an impact-based approach.
74 | Vopak | Annual Report 2016In
trod
uctio
nE
xecutive B
oard
repo
rtS
torin
g vital p
rod
ucts
with
careK
ey develo
pm
ents
per d
ivision
Govern
ance, risk
and
com
plian
ceA
dd
ition
al info
rmatio
n| Vopak | Annual Report 2016 | Notes to Sustainability performance
Finan
cial Statem
ents
Su
stainab
ility

Unfortunately, our energy efficiency programs will be partially impacted by an increase in Vapor Treatment Units (VTU) in order to reduce the VOC emissions. Installation of VTUs implies an increase in energy consumption due to the fact that support gas combustion is needed.
For our contribution towards de-carbonization, a reference is made to the section of Our response to climate change.
Note 8. (Cyber) security threats
How we performedVopak applies a company-wide system to report and monitor incidents related to data leakage, data theft or other loss of data. No incidents have been reported during 2016.
On cybersecurity there are no incidents that have lead to material impact.
2017 and beyondWe aim to have no incidents.
Note 9. Business ethics and integrity
How we performed
Incidents of discrimination, fraud, corruption and bribery23 whistleblower cases were reported to the confidential officer in 2016. All whistleblower cases were followed up and reported to the Executive Board and Supervisory Board. Appropriate action was taken including changes of internal controls as needed. In addition, a total of three cases were investigated and identified as fraud and appropriate measures were taken. All had non-material financial consequences. None of these cases were related to discrimination. Our anti-corruption/bribery policy and Code of Conduct is to be followed by all employees.
Permit violationsIn general, permit violations and fines are related to three compliance issues: • Non-compliance with operating permits (or expired permits)• Non-compliance with environmental regulations/limits• Non-compliance with safety regulations
North America and Europe are traditionally the most structured in terms of regulatory requirements, controls and enforcement. In China, following the Tianjin port incident last year, we are experiencing increased requirements and enforcement.
Two permit violations were issued to Vopak in 2016 resulting in a fine:• A significant permit violation was issued to Vopak Shanghai Logistics Company (China) of EUR 94,500 due
to an MMA scrubber exhaust outlet exceeding the emission standard (120 Nm3/hr) by 26,080 Nm3/hr• Vopak Terminal Los Angeles (United States) was issued with a permit violation by the US Coast Guard as
a result of the oil spill that took place at dock on 31 March 2016. The fine was EUR 1,900. The terminal isexpecting another fine to be imposed by the State Wildlife and Fishery department in due course for thesame violation
Vapor, odor and stench complaintsDuring 2016, we received 54 stench complaints (2015: 17, all at Vopak Terminal Europoort) of which 34 in the Netherlands (mainly at Vopak Terminal Europoort), 14 at Vopak Terminal Durban (South Africa) and six non-official complaints at Vopak Terminal Merak (Indonesia).
Despite the significant progress towards resolving our vapor issues and the implementation of Vapor Treatment Units at Vopak Terminal Europoort (the Netherlands), we had four incidents during 2016 resulting in 32 complaints (2015: four incidents resulting in 17 complaints).
75Notes to Sustainability performance |In
trod
uctio
nE
xecutive B
oard
repo
rtS
torin
g vital p
rod
ucts
with
careK
ey develo
pm
ents
per d
ivision
Su
stainab
ilityG
overnan
ce, risk an
d co
mp
liance
Finan
cial Statem
ents
Ad
ditio
nal in
form
ation
Su
stainab
ility75 | Vopak | Annual Report 2016 | Notes to Sustainability performance

The number of stench complaints at our Durban terminal (South Africa) resulted from the handling of ethyl acrylates.
2017 and beyondOur Assure 2016 program will further improve the integrity of our assets and the control of our processes. This should reduce our environmental impact resulting in mitigation of permit violations.
For the stench complaints at Vopak Terminal Europoort we continue to align our processes to external circumstances and optimize the use of our Vapor Treatment systems.
At Vopak Terminal Durban, we will invest in additional E-noses. These E-noses detect changes in the air composition (such as volatile hydrocarbons) at various locations at and around the terminal, and provide wireless data to a central monitoring station in order to mitigate stench complaints.
For contingencies regarding environmental obligations and other legal proceedings and risks, a reference is made to note 8.8 in the Consolidated Financial Statements.
Note 10. Diversity
How we performed
Total number of employees (at year-end 2016)
Headcount Men Women Full-time Part-time
Netherlands 965 87% 13% 91% 9%
Europe, Middle East & Africa 1,107 86% 14% 96% 4%
Asia 2,160 84% 16% 99% 1%
Americas 909 83% 17% 100% 0%
LNG 193 85% 15% 97% 3%
Global HQ 221 71% 29% 81% 19%
Total Vopak (in headcount) 5,555 85% 15% 96% 4%
Gender and nationality of managers and senior leadership
Executive Board
Terminal and divisional
management teams
Global staff directors Global staff HQ
% employees 2016 2015 2016 2015 2016 2015 2016 2015
Gender
Men 100% 100% 80% 80% 64% 79% 79% 79%
Women – – 20% 20% 36% 21% 21% 21%
Nationality
Dutch 100% 100% 13% 12% 93% 86% 84% 89%
Other1 – – 87% 88% 7% 14% 16% 11%
1 Any nationality other than Dutch.
The diversity numbers still do not show the optimal balance that Vopak believes should be the right reflection of the society that we are part of.
Approximately 41% of our employees are employed under a Collective Labor Agreement (CLA), most of these employees work in the operations and maintenance departments at our terminals. We strive for long-lasting relationships with unions and works councils all over the world in the best interest of our employees and the Company.
76 | Vopak | Annual Report 2016In
trod
uctio
nE
xecutive B
oard
repo
rtS
torin
g vital p
rod
ucts
with
careK
ey develo
pm
ents
per d
ivision
Govern
ance, risk
and
com
plian
ceA
dd
ition
al info
rmatio
n| Vopak | Annual Report 2016 | Notes to Sustainability performance
Finan
cial Statem
ents
Su
stainab
ility

Age distribution
45 - 54 > 6455 - 6415 - 24 25 - 44
3,500
3,000
2,500
2,000
1,500
1,000
50046
646
1,320
3,292
251
Number of contractorsDuring 2016, over 10,000 man-years of contractors worked for Vopak.
2017 and beyondThe diversity both in nationality and gender is part of the 2017 agenda and several actions will be taken to improve the balance and, where needed, increase the inclusiveness.
Note 11. Talent attraction and retention
How we performed
Employee hires and turnover
Joiners Relative joiners Leavers Relative turnover
Netherlands 139 15.0% 121 13.0%
Europe, Middle East & Africa 93 6.9% 344 25.5%
Asia 308 15.1% 387 19.0%
Americas 66 7.3% 61 6.7%
LNG 22 13.3% 7 4.2%
Global HQ 36 16.1% 18 7.7%
Total Vopak 664 11.8% 938 16.7%
The relative turnover is higher compared to 2015 (8.9%), mainly due to the divestments in the United Kingdom, Japan, China and the Netherlands.
The staff turnover rate is acceptable for the markets we operate in and we believe, as also testified by the engagement survey, that the intention to stay with the company is strengthened by good leadership, good career and development opportunities and working together based on our values and a positive working environment. When a divestment is made, Vopak will do its utmost to ensure that the employees working at the specific terminal(s) are transferred under the same contractual arrangements as when they were working for Vopak.
Training hours per employee2016 2015
Netherlands 44 45
Europe, Middle East & Africa 44 36
Asia 55 46
Americas 43 47
LNG 60 45
Global HQ N.R. N.R.
Total Vopak 47 42
77Notes to Sustainability performance |In
trod
uctio
nE
xecutive B
oard
repo
rtS
torin
g vital p
rod
ucts
with
careK
ey develo
pm
ents
per d
ivision
Su
stainab
ilityG
overnan
ce, risk an
d co
mp
liance
Finan
cial Statem
ents
Ad
ditio
nal in
form
ation
Su
stainab
ility77 | Vopak | Annual Report 2016 | Notes to Sustainability performance

The number of training hours per division shows that Vopak employees spend a substantial amount of time on training each year. Besides formal training as measured by the hour, training and coaching on the job and best practice sharing are also an important, informal way, of training.
Compensation ratio2016 ratios1 2015 ratios1 Increase to 20152
The Netherlands 8.8 8.8 -
Singapore 8.0 8.0 1.16%
Unites States 3.3 3.2 -2.15%
The ratio is defined based on the annual base salaries per 1 December 2016.1. The ratio is defined as the salary of highest paid job holder/median salary excluding highest salary.2. Increase in annual total compensation for the highest-paid individual to the median percentage increase in annual total compensation for all
employees (excluding the highest-paid individual) in the same country in 2016 compared to 2015.
2017 and beyondWe will further increase the accessibility to (formal) training in 2017 and 2018 via the new HR digital platform.
Note 12. Financial performance
How we performedFor the financial performance, reference is made to the Executive Board report and the Consolidated Financial Statements.
2017 and beyondWe aim to report on financial assistance received from and paid to governments. For further information with regard to our financial performance outlook, reference is made to the Report of the Executive Board.
“ A healthy gift to the city of Puerto Cabello”
Anniversary run in VenezuelaTo celebrate Vopak’s 400-year anniversary, Vopak employees in Venezuela hosted a run with the objective to promote a healthier lifestyle. Thousands of runners, together with Vopak employees, participated.
“ A healthy gift to the city of Puerto Cabello”
“We wanted to promote the importance of improving wellness habits, such as eating and exercising. We also wanted to give a gift to the city of Puerto Cabello. Basically, we wanted to make a positive impact and I think we achieved just that.” - Jesus Rodriguez, Compliance and External Affairs, Vopak Venezuela.
78 | Vopak | Annual Report 2016In
trod
uctio
nE
xecutive B
oard
repo
rtS
torin
g vital p
rod
ucts
with
careK
ey develo
pm
ents
per d
ivision
Govern
ance, risk
and
com
plian
ceA
dd
ition
al info
rmatio
n| Vopak | Annual Report 2016 | Notes to Sustainability performance
Finan
cial Statem
ents
Su
stainab
ility

Weconnect Vopak Terminals in Colombia and Mexico
Vopak-Aflateen Project goalTo empower young people, through social and financial education, to lead productive lives and play a positive role in their communities. Realized in 2016 The Vopak-Aflateen project team partnered with the Amsterdam-based NGO Aflatoun to promote entrepreneurship and provide social and financial education to around 2,300 young people, mainly teenagers, near Vopak locations in Mexico and Colombia.
The project aims to empower young people to move out of poverty and become agents of change in their communities. In Mexico, 450 children from a nearby school and two children homes were involved in the project and took part in an entrepreneurship competition, while 38 teachers and six Vopak volunteers were trained. In Colombia, through support to Aflateen clubs, teenagers learned to organize and plan in order to turn a variety of projects into financially successful enterprises. Children also experienced the importance of saving money and learned about their rights and responsibilities in society. In Mexico, children of two orphanages and children of Vopak employees jointly participated in a summer course, deepening mutual understanding and providing enriching experiences for both groups.
79In
trod
uctio
nE
xecutive B
oard
repo
rtS
torin
g vital p
rod
ucts
with
careK
ey develo
pm
ents
per d
ivision
Su
stainab
ilityG
overnan
ce, risk an
d co
mp
liance
Finan
cial Statem
ents
Ad
ditio
nal in
form
ation
Su
stainab
ility |
Intro
du
ction
Execu
tive Bo
ard rep
ort
Sto
ring
vital pro
du
cts w
ith care
Key d
evelop
men
ts p
er divisio
nG
overnan
ce, risk an
d co
mp
liance
Ad
ditio
nal in
form
ation
79
Finan
cial Statem
ents
Su
stainab
ility
| Vopak | Annual Report 2016

Our response to climate change
Direct effects on a global scale
Temperature increaseThe projected long-term warming (associated with doubling CO2 concentrations) is likely to be in the range of 2 to 4.5 degrees Celsius. This will result in higher sea levels. Areas of concern with respect to higher sea levels are the Netherlands, Germany and Indonesia. Increased flooding could result in operational interruptions and/or failures.
Precipitation and humidityIncreases in annual precipitation are predicted for most of Northern Europe, Canada and the Northeast of the United States.
Extreme wind and rain, storms and other eventsExtreme weather conditions are expected, involving increased intense tropical cyclone activity, increased frequency of floods and large-area floods in many regions, higher sea levels and an increased risk of drought in Australia, Eastern New Zealand, and the Mediterranean, with exceptional seasonal droughts in Central Europe and Central America. This could lead to wind storms and flooding. It is expected that climate change may lead to more tropical storms. Therefore, certain areas such as the US Gulf Coast, China, Japan and Vietnam are increasingly vulnerable.
Indirect effects on a global scaleGlobal warming will result in warmer and more frequent hot days/nights, which may affect the health of the population. The spread of worldwide diseases may increase. For example, malaria could migrate to Northern regions, such as Spain and as far north as Southern Great Britain. This increases the risk of epidemics.
Effects on VopakVopak builds its terminals for a period of at least 40 years. Terminals are built with the knowledge and guidelines at the time they are constructed, including preventive measures. Higher sea levels may therefore
We have identified potential risks and opportunities related to sustainability and climate change. Business-related risks are elaborated in the section Risks and risk management in the Governance and compliance chapter.
The following topics are presented in this section:• Climate change• Carbon emissions trading scheme• Sustainability trends: de-carbonization
Climate changeClimate change trends and the response to this are important to Vopak and our future. Vopak continues to assess the impact of these trends as part of its ongoing process of identifying threats and opportunities, and will report in the coming years on medium- and long-term objectives related to this trend.
The Intergovernmental Panel on Climate Change (IPCC) has identified adverse changes in the global climate system, including an increase in average temperatures, changes in precipitation, a rise in sea levels, extreme events (such as hurricanes, floods and draughts) and other physical changes.The concluded ‘COP21’ agreement (ratified by the UN in 2016) has drawn greater global attention to the adverse effects of climate change. The overall objective is to halt the rise in global temperature, with agreements reached to jointly work towards limiting temperature rise to only 2.0 degrees Celsius. All countries are to set targets to reduce carbon emissions, and these countries shall report on their progress transparently.
We have identified key areas that are of direct as well as indirect importance to Vopak. As part of our ongoing monitoring, we will continue to assess the impact of national goals and regulations such as China aiming to achieve 20% non-fossil energy in primary energy consumption by the year 2030. Goals within the European Union are: 40% carbon reduction of emissions in 2030 and 80% reduction in 2050.
Vopak is closely monitoring the impact of these developments and this is included in our ‘Beyond 400’ initiatives and studies. The relevance of climate change is related to changes in the future energy mix. This requires us to adjust our service offering for the medium and longer term.
80 | Vopak | Annual Report 2016In
trod
uctio
nE
xecutive B
oard
repo
rtS
torin
g vital p
rod
ucts
with
careK
ey develo
pm
ents
per d
ivision
Govern
ance, risk
and
com
plian
ceA
dd
ition
al info
rmatio
nFin
ancial S
tatemen
tsS
ustain
ability
| Vopak | Annual Report 2016
Our response to climate changeOur response to climate change

require extra measures for quays, and floodwall protections may be needed (e.g. Vopak Terminal Hamburg). Extreme weather conditions may require adaption of the tank construction, floodwater sewers (e.g. storm-water gutters).These have already been installed at some of our terminals, including Vopak Terminal Deer Park (US Gulf Coast). An increase in temperature will also lead to extra vapor pressure from the products we store. More focus will therefore be put on vapor recovery and/or vapor treatment, in line with applicable industry standards and legislations. Climate change could also reduce our energy requirements due to warmer winters.
HamburgThe port of Hamburg experiences high swell and high tides with Northwesterly winds. These are potentially high enough to flood the existing embankments/dikes and to partially flood industrial areas. The Port of Hamburg decided that all industrial areas should therefore be equipped with floodwalls. This resulted in the obligation to raise the dikes through a sheet pile wall around the site (one meter extra height over two kilometers).
Carbon emissions trading schemeMore and more countries are setting up, or plan to set up, a carbon emissions trading system or a carbon tax system as a mechanism to combat climate change. These initiatives can lead to regulatory risks and are currently not only limited to Europe, where the European Union Emissions Trading System has been operational since 2005, but also in other regions and countries where Vopak is active.
Carbon regulation by regionA growing number of countries have already implemented some kind of regulation on carbon emissions. Vopak expects that this number (which includes countries in which Vopak is active) will grow in the near future (e.g. China will introduce their carbon emissions system in January 2017). For an overview of all the carbon emissions systems currently in place or being implemented in the near future, reference is made to: www.worldbank.org. All of these individual carbon-pricing regulations impact Vopak directly and indirectly.
Direct impact The direct effects of carbon emissions systems are:• Additional administration and audits
Demonstration of our carbon emissions will beneeded in regions where a carbon emissionssystem is present. This will involve additionaladministration at the specific location. In addition,in those specific locations where we exceed thecarbon emissions threshold, we should also
account for the costs of the carbon emission rights, including external audits by the National Emission Authorities
• Costs of CO2 emission rightsThe direct costs of CO2 emissions relate to thepurchase of emission rights. Nine Vopak terminalsare included in the European Carbon TradingSystem, which accounts for approximately 45% ofVopak’s total direct carbon emissions. Theterminals are: six terminals in the Netherlands andthree of the Vopak E.O.S. terminals in Estonia.Based on the 2016 average CO2 price ofapproximately EUR 5 per ton, this will result incarbon emissions costs of approximately EUR150,000 calculated on the direct energyconsumption of the terminals included in theEuropean Trading System and based on theassumption that approximately 70% of the CO2
allowances are currently still free of charge. So farVopak has not yet purchased any emission rightsdue to the fact that enough emission rights are stillavailable within Vopak as a result of a decrease inenergy consumption (especially Estonia andVlaardingen) resulting in a surplus of emissionrights. However, oil and chemical companies arecurrently already calculating their business cases,depending on the region, based on carbon pricesof approximately EUR 17 to EUR 66 per ton CO2
emissions in 2040. Based on these potentialincreases in carbon emission costs, the totalannual emission costs of the Vopak terminals inthe European Union could vary betweenEUR 1 million and EUR 4 million per year based onthe direct energy consumption of the terminalscurrently included in the European Trading Systemand based on the assumption that approximately20% of the CO2 allowances are free of chargein 2040
Indirect impact Customers could move their business to other regions and invest in alternative countries that do not have an emissions-trading system; this is also referred to as carbon leakage. It could result in a change in Vopak’s customer base or a change in logistic requirements and potentially result in a lossof customers and/or a lower demand for storage capacity.
Sustainability trends: de-carbonization Vopak aims to contribute to limiting temperature rise by facilitating a change in demand resulting from de-carbonization efforts such as carbon capture and storage and by facilitating a shift in the energy mix towards cleaner fuels like LNG and hydrogen.
81Our response to climate change |In
trod
uctio
nE
xecutive B
oard
repo
rtS
torin
g vital p
rod
ucts
with
careK
ey develo
pm
ents
per d
ivision
Su
stainab
ilityG
overnan
ce, risk an
d co
mp
liance
Finan
cial Statem
ents
Ad
ditio
nal in
form
ation
Su
stainab
ility81 | Vopak | Annual Report 2016 | Our response to climate change

Regulatory opportunities One of the biggest opportunities arising from laws and regulations is carbon capture storage. Vopak and Gasunie jointly investigated the feasibility of developing a collection hub for the handling and temporary storage of CO2 in the Netherlands where gaseous and/or liquefied CO2 can be received from CO2 emitters and can be subsequently loaded into large seagoing vessels or transferred to pipeline networks for transportation to depleted offshore gas fields. A potential CO2 distribution hub in the Rotterdam area could benefit from the presence of the Gate Terminal (the Netherlands) due to the availability of cold energy from this LNG terminal.
Other opportunities The drive towards further reducing emissions has led to the development of new storage opportunities such as Vopak’s current LNG activities. Vopak and Gasunie commissioned new infrastructure at our LNG terminal in 2016 to enable small scale re-loading and bunker services to LNG-powered ships. In addition, the recent developments in the use of biofuels may accelerate the introduction of second and third generation biofuels, such as oil from algae. For biofuels, we have expanded and are expanding our services in this specific field, which started already in 2007 with the construction of dedicated storage facilities in various countries.
InitiativesIn addition to the investment to enable the use of LNG as a transportation fuel, Vopak Terminal Durban (South Africa) has expanded to facilitate imports of cleaner fuels.
The Netherlands division has joined the Transition Coalition of Dutch businesses that have embraced the Paris climate objectives for 2050 and joined forces to request the government to prioritize the acceleration of the energy transition.
Third LNG berth in RotterdamGate Terminal (shareholders Gasunie and Vopak) in Rotterdam expanded with a third berth and special infrastructure for the loading of small LNG vessels. These small LNG vessels will enable distribution to LNG terminals in other North Sea and Baltic ports where large LNG tankers are prohibited to deliver directly due to their draught.
In conjunction with LNG bunker vessels, the new berth will also make it easier for ocean-going vessels to fill up with LNG in Rotterdam in the future. The Port of Rotterdam is encouraging the use of LNG as a maritime fuel by giving a discount on harbor dues. Facilitating the LNG market with a safe and efficient infrastructure and operation is aligned with the Vopak’s long-term strategy.
“ Facilitating LNG as bunker fuel”
82 | Vopak | Annual Report 2016In
trod
uctio
nE
xecutive B
oard
repo
rtS
torin
g vital p
rod
ucts
with
careK
ey develo
pm
ents
per d
ivision
Govern
ance, risk
and
com
plian
ceA
dd
ition
al info
rmatio
n| Vopak | Annual Report 2016 | Our response to climate change
Finan
cial Statem
ents
Su
stainab
ility

Our responsibility towards taxationVopak’s Global Tax policy views taxation as an integrated part of the business and as an important contribution to Vopak’s position in the marketplace and society, by reflecting its attitude towards taxation as part of its corporate social responsibility towards a wide range of stakeholders. As such, tax is an integral part of the company’s sustainability policy.
• Vopak’s business strategy is leading: Vopak aims toachieve an effective tax rate that does not exceedthe weighted average statutory tax rate by avoidingdouble taxation, that does not trigger anti-abuseregulations and that does not result in losing lossutilization opportunities. In addition, Vopak aims tooptimize the use of tax incentives and investmentschemes for the purposes for which these havebeen designed. In striving to achieve this goal,Vopak will only optimize real business structuresand transactions and will not set-up legal entities ortransactions solely for the purpose of tax savingsor tax avoidance. The business strategy is leading.Vopak acts in line with the letter and the spirit ofthe law
• Vopak aims to minimize its cash tax rate to clearfunds for sustainable growth. This is achieved, forexample, by making use of tax deferral facilities
• Vopak does not use ‘tax havens’, unless realeconomic activity takes place in the country
• Taxes that are merely collected by Vopak shouldnot impact profit or interfere with day-to-daybusiness. Automation of these collecting activitiesshould be maximized for the purpose of efficiencyimprovement and cost reduction
• Reliability and efficiency are key in Vopak’s serviceoffering. As Vopak and its customers arecontinuously faced with customs and other dutiesduring primary processes, Vopak aims to achievereliable, fast and cost-efficient handling of customsand other duties without disturbing primaryprocesses, when possible by applying for anAuthorized Economic Operator qualification orstandards set for non-EU equivalents
• Vopak maintains and builds mutual professional andrespectful relations with local tax authorities basedon open and transparent communications bothverbal and in writing. When possible, Vopak aims toenter into cooperative compliance programs(e.g. the Netherlands)
• Vopak aims to fully comply with laws andregulations in technical and procedural matters.Tax positions benefiting Vopak are only taken whensufficiently substantiated. Intercompanytransactions are conducted ‘at arm’s length’
• To support the above, ‘tax surprises’ are unwanted(irrespective whether positive or negative) as thesecould have a financial and reputational impact.Tax risks not aligned with the company’s riskappetite are undesirable. Tax risk management andmanagement of tax opportunities are embedded inthe (tax) control framework as well as in ourenterprise risk management process. Adherence tothe company’s risk appetite is also monitored by,among other, the Global Risk Committee
• We will always adhere to the Vopak Values whenexecuting our tax policy
The tax policy applies to all countries where Vopak operates and where it is able to control adherence to this policy. For operating companies where the company has joint control or only significant influence, the company strives to apply the concepts of the tax policy as it cannot unilaterally enforce compliance.
The tax policy was updated during 2016. This update was discussed and approved by the Executive Board.
Vopak’s approach to tax has been discussed with our stakeholders as part of the stakeholder engagement dialogue. For more information on this dialogue, reference is made to the section Stakeholder engagement and materiality assessment. This dialogue did not result in a revision of the company’s tax policy.
Vopak took the required actions to be able to comply with the newly introduced requirements for country-by-country reporting. Apart from providing additional information to the authorities, this requirement has no impact on the company.
83Our responsibility towards taxation |In
trod
uctio
nE
xecutive B
oard
repo
rtS
torin
g vital p
rod
ucts
with
careK
ey develo
pm
ents
per d
ivision
Su
stainab
ilityG
overnan
ce, risk an
d co
mp
liance
Finan
cial Statem
ents
Ad
ditio
nal in
form
ation
Su
stainab
ility83 | Vopak | Annual Report 2016
Our responsibility towards taxationOur responsibility towards taxation

In the Netherlands, the company participates in the ‘Horizontaal Toezicht’ program, which is a co-operative compliance program with the Dutch tax authorities.
Effective tax rate per main countryVopak pays a fair tax in the countries in which it operates. The largest operations are located in the Netherlands, Singapore and the United States.
For an overview of the effective tax rate per main country per (geographical) division, referene is made to the table below. This overview is a change to the previous year when the company only reported at the segment-only level. For more information on the segments and other financial information per segment, reference is made to note 2.1 of the Consolidated Financial Statements.
Tax overview Vopak principal group companies 2016Statutory tax rate Effective tax rate
The Netherlands (incl. Global HQ) 25.0% 15.4%
Europe, Middle East & Africa 26.2% 1.8%
of which:
Belgium 34.0% 27.3%
Germany 33.0% 30.9%
Spain 25.0% 26.8%
South Africa 28.0% 46.7%
Asia 19.3% 14.7%
of which:
China 25.0% 34.8%
Australia 30.0% 28.6%
Singapore 17.0% 14.5%
Indonesia 25.0% 35.9%
India 34.0% 34.0%
Americas 43.2% 42.3%
of which:
United States 35.0% 25.1%
Mexico 30.0% 22,6%
Brazil 34.0% 51.7%
Vopak group 21.7% 11.1%
Furthermore, Vopak’s Key Control Framework has a dedicated section stipulating the internal controls, which are addressing the risks related to tax and which enforce compliance with the global tax policy. The In-control statement by the Executive Board, as included in this Annual Report, is based on the effectiveness of Vopak’s internal controls, including those relating to tax. For more information, including the involvement of Global Internal Audit in the monitoring of the effectiveness internal controls, reference is made to section Internal control and risk management in the Governance and compliance chapter.
The effective tax rate of EMEA contains the effect of the divestment of the UK terminals, of which the capital gain has been exempt under the Dutch participation exemption. For a further more detailed reconciliation between the weighted average statutory tax rate and the effective tax rate of the company, including an explanation of the differences, reference is made to note 7.1 of the Consolidated Financial Statements.
Risk and risk managementThe principal risks of Vopak and the mitigating actions applied by management are disclosed in this Annual Report. The company has no principal risks relating specifically to tax. For an overview of the principal risks of the company, referene is made to section Internal control and risk management in the Governance and compliance chapter.
84 | Vopak | Annual Report 2016In
trod
uctio
nE
xecutive B
oard
repo
rtS
torin
g vital p
rod
ucts
with
careK
ey develo
pm
ents
per d
ivision
Govern
ance, risk
and
com
plian
ceA
dd
ition
al info
rmatio
n| Vopak | Annual Report 2016 | Our responsibility towards taxation
Finan
cial Statem
ents
Su
stainab
ility

Governance, risk and complianceSupervisory Board members
Supervisory Board report
Remuneration report
Corporate governance
Internal control and risk management
Shareholder information
Intro
du
ction
Execu
tive Bo
ard rep
ort
Sto
ring
vital pro
du
cts w
ith care
Key d
evelop
men
ts p
er divisio
nS
ustain
ability
Govern
ance
and
com
plian
ceFin
ancial S
tatemen
tsA
dd
ition
al info
rmatio
nG
overnan
ce, risk an
d co
mp
liance
Governance, risk and compliance

Supervisory Board membersMr Anton van Rossum ChairmanChairman of the Selection and Appointment Committee and Member of the Remuneration Committee
Nationality Dutch Year of birth 1945 Career Mr Anton van Rossum was previously Chairman of the Executive Committee (CEO) of Fortis NV/SA until the end of 2004 and Senior Partner at McKinsey and Company Inc. Mr Van Rossum was first appointed to the Supervisory Board on 27 September 2007. His current term ends in 2017. He is a member of the Supervisory Boards of Münchener Rückversicherungs-Gesellschaft, Rotterdam School of Management (Chairman), Presidents Institute (Chairman), Francqui Foundation and the Netherlands Economic Institute (Chairman). He also is a member of the Advisory Committee of Omnes Capital. He does not own any Vopak shares.
Mr Mel Groot Vice-Chairman Member of the Audit Committee and Member of the Selection and Appointment Committee
Nationality Dutch Year of birth 1959 Career Mr Mel Groot is Chairman of the Executive Board of HAL Holding N.V. Mr Groot was first appointed to the Supervisory Board on 18 December 2014. His current term ends in 2018. He is a member of the Supervisory Boards of GrandVision N.V. and Anthony Veder Group N.V. Mr Groot is also non-executive director of Safilo SpA. He does not own any Vopak shares.
Mr Frans Cremers MemberChairman of the Audit Committee
Nationality Dutch Year of birth 1952 Career Mr Frans Cremers was previously a member of the Executive Board and CFO of VNU N.V. Mr Cremers was first appointed to the Supervisory Board on 1 October 2004. His current term ends in 2018. He is Chairman of the Supervisory Board of SBM Offshore N.V and proposed Chairman of the Supervisory Board of Wolters Kluwer N.V. He is also a member of the Board of Directors of Stichting Preferente Aandelen Philips and Stichting Preferente Aandelen Heijmans. Mr Cremers is also a member of the Capital Market Committee of AFM. He does not own any Vopak shares.
86 | Vopak | Annual Report 2016In
trod
uctio
nE
xecutive B
oard
repo
rtS
torin
g vital p
rod
ucts
with
careK
ey develo
pm
ents
per d
ivision
Ad
ditio
nal in
form
ation
Finan
cial Statem
ents
Su
stainab
ilityG
overnan
ce, risk an
d co
mp
liance
| Vopak | Annual Report 2016
Supervisory Board membersSupervisory Board members

Mr Rien Zwitserloot Member Chairman of the Remuneration Committee
Nationality Dutch Year of birth 1949 Career Mr Rien Zwitserloot was previously Chairman of the Executive Board of Wintershall Holding A.G. Mr Zwitserloot was first appointed to the Supervisory Board on 1 October 2009. His current term ends in 2017. He is a member of the Supervisory Boards of TenneT Holding B.V., ACT Commodities Group B.V. and Vroon Group B.V. He does not own any Vopak shares.
Mr Ben Noteboom Member Member of the Audit Committee
Nationality Dutch Year of birth 1958 Career Mr Ben Noteboom was previously CEO of Randstad Holding N.V. Mr Noteboom was first appointed to the Supervisory Board on 20 April 2016. His current term ends in 2020. He is a member of the Supervisory Boards of Wolters Kluwer N.V., Aegon N.V., Koninklijke Ahold N.V. and Stichting Holland Festival. He is also a board member of Stichting Prioriteit Ordina Groep and Cancer Center Amsterdam. He owns 3,500 Vopak shares.
Mr Carel van den Driest Member Member of the Selection and Appointment Committee
Nationality Dutch Year of birth 1947 Career Mr Carel van den Driest is Director of Carelshaven B.V. Mr Van den Driest previously held the position of Chairman of the Executive Board of Royal Vopak and was first appointed to the Supervisory Board on 27 April 2006. His current term ends in 2018. He is a member of the Supervisory Boards of Anthony Veder Group N.V. (Chairman), Van Oord N.V. (Chairman) and Teslin Capital Management B.V. (Chairman). He does not own any Vopak shares.
87Supervisory Board members |In
trod
uctio
nE
xecutive B
oard
repo
rtS
torin
g vital p
rod
ucts
with
careK
ey develo
pm
ents
per d
ivision
Su
stainab
ilityG
overnan
ce an
d co
mp
liance
Finan
cial Statem
ents
Ad
ditio
nal in
form
ation
Govern
ance, risk
and
com
plian
ce87 | Vopak | Annual Report 2016 | Supervisory Board members

Supervisory Board report financing of the company and succession planning for senior management. In addition the Supervisory Board reviewed the stakeholder engagement and materiality assessment.
The Supervisory Board discussed and approved the 2017 budget, quarterly reports and various investment proposals related to expansions at several existing locations and acquisition opportunities. The Supervisory Board also reviewed the progress of ongoing projects and the pipeline of new projects.
External auditors were present at two meetings where the annual results and half-year results were discussed. The interim report and auditors reports issued by the external auditors were reviewed during these meetings. The minutes of all the meetings of the Audit Committee, Remuneration Committee and the Selection and Appointment Committee are shared with and reviewed by the Supervisory Board.
The Supervisory Board discussed the operation of the company’s risk management and control systems. In absence of the Executive Board members, the Supervisory Board discussed the performance of the Executive Board and the proposal by the Remuneration Committee for the remuneration of the Executive Board.
The Supervisory Board evaluated its own performance in 2016 and that of its committees. In preparation and as part of the self-assessment procedure, each member completed a questionnaire. Observations in regard to the functioning of the Supervisory Board, its relationship with the Executive Board and other stakeholders of the company were hereby taken into account. This was discussed and assessed by the Supervisory Board during the meeting held in December 2016. Main topics of the evaluation relate to the effectiveness of the Supervisory Board in fulfilling its tasks, the effectiveness of the committees and of the individual members. Also the relationship with the Executive Board and engagement with the organization are included in the evaluation process. The outcome of the evaluation process shows that it meets the governance requirements.
SupervisionThe Supervisory Board oversees and advises the Executive Board in performing its management tasks and guides the company’s operational and financial development. In performing their duties, the members of the Supervisory Board are guided by the interests of Vopak and all its stakeholders.
The Supervisory Board met six times face-to-face in regular meetings during 2016 next to one additional meeting to discuss an investment proposal. All of these meetings were held jointly with the full Executive Board present. Almost all plenary sessions of the Supervisory Board were preceded by an executive session with the CEO in attendance. Between meetings the Chairman of the Supervisory Board has regular contact with the CEO to discuss the current state of affairs of the company and to prepare for meetings.
None of the Supervisory Board members were absent from the Supervisory Board meetings. In 2016 the average attendance at all meetings was 100%. In 2016, the Supervisory Board visited the Terquimsa terminal in Tarragona (Spain), the VHFL terminal in Fujairah (United Arab Emirates) and the Botlek and Europoort terminals (the Netherlands).
Strategy is one of the Supervisory Board’s main priorities. In 2016, a two-days session held in Barcelona was fully dedicated to discuss with the Executive Board the Vopak ‘Beyond 400’ strategy process with the aim to create a common view on the direction of the company. This strategy process provides an overall view on the future portfolio of existing business and newly identified ideas and opportunities. The Supervisory Board approved the strategy as presented by the Executive Board. In executing the strategy, the company will make clear choices while continuing to allocate the available capital in the right way and in the right locations.
During its 2016 meetings the Supervisory Board discussed a number of topics recurring at each meeting. The Supervisory Board lends particular importance to sustainability in its discussions. Other topics included the company’s operational and financial objectives and financial performance,
88 | Vopak | Annual Report 2016In
trod
uctio
nE
xecutive B
oard
repo
rtS
torin
g vital p
rod
ucts
with
careK
ey develo
pm
ents
per d
ivision
Ad
ditio
nal in
form
ation
Finan
cial Statem
ents
Su
stainab
ilityG
overnan
ce, risk an
d co
mp
liance
| Vopak | Annual Report 2016
Supervisory Board reportSupervisory Board report

Composition of the Supervisory BoardThe Supervisory Board currently comprises six members: Mr Van Rossum (Chairman), Mr Groot (Vice-Chairman), Mr Cremers, Mr Van den Driest, Mr Noteboom and Mr Zwitserloot. Mr C.K. Lam decided to step down as member of the Supervisory Board following his assessment of a potential future conflict of interest with respect to a new position. At the Annual General Meeting held on 20 April 2016, Mr B.J. Noteboom was appointed as member of the Supervisory Board for a term of four years. Mr F.J.G.M. Cremers was reappointed as a member of the Supervisory Board for a term of two years taking into account his valuable contribution during the past years.
For more information about the Supervisory Board members, reference is made to the Supervisory Board members section in this Annual Report.
The Supervisory Board recognizes its own role in the company’s corporate governance structure, with members receiving updates and information to adequately fulfill their roles and responsibilities.Ongoing education is an important part of good governance. As part of the induction program, new members of the Supervisory Board visit various terminal locations and meet with divisional and local management. They also attend induction sessions at which they are informed about the financial, reporting, internal audit, HR, sales and marketing, IT, legal and governance related affairs.
All Supervisory Board members, except for one, as permitted by the Code, qualify as independent in the meaning of best practice provision III.2.2 of the Dutch Corporate Governance Code. Mr Groot does not satisfy all independence criteria. In 2016, there was no actual or potential conflict of interest between Vopak, any Supervisory Board or Executive Board member.
The Supervisory Board has three committees: the Audit Committee, the Selection and Appointment Committee and the Remuneration Committee. Their roles are described below in more detail. The committees generate, review and discuss detailed information and prepare recommendations relating to their specific areas while the full Supervisory Board retains overall responsibility and always takes the final decisions. In each case, the Committee Chair reports the Committee’s main considerations and findings to the full Supervisory Board, usually immediately after the relevant Committee meeting.
The Audit Committee assists the Supervisory Board in its responsibility to oversee Vopak’s financing, financial statements, financial reporting, compliance and system of internal business controls, risk management and audit findings. Non-financial topics are also reviewed as part of risk management including whistleblower cases. The Remuneration Committee primarily makes recommendations regarding the remuneration and the remuneration policy of the Executive Board and the Supervisory Board.
Audit CommitteeThe Audit Committee met five times in 2016. The attendance rate was 93%. All meetings were attended by the CFO, the Global Director Control and Business Analysis and the Global Director Internal Audit. The external auditor was also present at all of these meetings. In general, the Audit Committee, together with the external auditor, discusses at the end of each meeting without management being present its assessment of Vopak’s performance as well as the collaboration with the Executive Board and the organization, including their functioning.
A core task of the Audit Committee was to extensively review the financial reports and the budget before their consideration by the full Supervisory Board. The committee also discussed topics related to Vopak’s financing structure, analyses of the financial ratios, pensions, status of legal claims and proceedings, tax matters, fraud and whistleblowing reports, reports on the risks associated with the company’s operational, commercial, financial and other activities, compliance matters as well as the company’s management reporting. It also discussed the dividend proposal for 2016 and the company’s views on notifications from Dutch corporate governance platform organizations and the Dutch regulator (AFM).
The Audit Committee considered the 2016 audit plan of the external auditor and the Internal Audit department’s plan for 2017. The main topics of the audit plan include the materiality levels, the audit scope, the key audit risks and the key elements of the audit approach as well as the auditor’s assessment of the risk of fraud within the company. The audit reports from Internal Audit performed during 2016 and the progress realized in implementing recommendations from audits, were also considered. The committee reviewed the risk management and internal control processes and discussed the recommendations in the management letters and the relationship with the external auditors.
89Supervisory Board report |In
trod
uctio
nE
xecutive B
oard
repo
rtS
torin
g vital p
rod
ucts
with
careK
ey develo
pm
ents
per d
ivision
Su
stainab
ilityG
overnan
ce an
d co
mp
liance
Finan
cial Statem
ents
Ad
ditio
nal in
form
ation
Govern
ance, risk
and
com
plian
ce89 | Vopak | Annual Report 2016 | Supervisory Board report

Deloitte Accountants B.V. is appointed as the external auditor of the company to audit the annual statements of the company for the financial year ending 31 December 2016. The Audit Committee monitored the independence of the external auditor. During 2016, non-audit services were not provided by the group’s external auditor but only audit or audit-related services were provided. The performance of the external auditor was assessed based on a satisfaction survey conducted among the divisions, operating companies and relevant global functions. This assessment includes a consideration of the quality of the audit work, the expertise and composition of the audit team, the audit fee and the quality control within the audit firm.
Finally, the Audit Committee assessed its own performance throughout the year and its regulations, supported by an extensive questionnaire that was discussed by all committee members. The committee’s performance met the requirements in all areas. During 2016, Mr Cremers continued to act as financial expert as defined in the relevant best practice provisions of the Dutch Corporate Governance Code.
Selection and Appointment CommitteeThe Selection and Appointment Committee is primarily tasked with advising on candidates to fill vacancies in both the Executive Board and the Supervisory Board. An important activity of the Committee is also succession planning of senior management up to and including the members of the Executive Board. The Committee met two times in 2016. The attendance was 100%. During these meetings the Committee discussed in detail various relevant topics. This includes diversity-related topics to ensure that the composition of both Boards represents a good balance in terms of diversity (including experience, gender, and nationality). Diversity in the broad sense continues to be a topic on the Supervisory Board agenda and is therefore discussed by the Selection and Appointment Committee on a regular basis. The Supervisory Board supports the efforts of the company to strive for a global workforce that is a reflection of society and to create a working environment where all employees feel included. As part of its regular activities, the Committee discussed extensively, among others, the rotation schedule, the future composition of the Supervisory Board and the specific profiles of the Supervisory Board members. In 2016 the Selection and Appointment Committee performed an evaluation of the effectiveness of the Executive Board members as a team in leading the company and implementing the strategy.
The recruitment process makes use of the specific profiles for the various positions within the Executive Board and the Supervisory Board. These profiles are drawn up against the background of the full Executive and Supervisory Board’s profile. These profiles take into account the specific nature of the company, its stakeholders and its activities. Also the desired expertise and background relating to economic, environmental and social topics are considered. The process is aimed at maintaining a composition consisting of a good mix of competencies and experienced professionals who deal with key areas in an appropriate manner. External search agencies are being engaged for the fielding of candidates for succession and nomination.
On 15 November 2016, it was announced that Mr De Kreij has informed the Supervisory Board that he has decided to step down as per 1 February 2018. The Supervisory Board is grateful to Mr De Kreij for his significant contributions to the company during his tenure of serving as Vice-Chairman of the Executive Board and CFO since January 2003. The Selection and Appointment Committee has started the recruitment process to fill this vacancy in the Executive Board.
Remuneration CommitteeThe Remuneration Committee met three times in 2016. In addition, the Committee held regular informal consultations and consulted professional internal and external advisors. For the following topics that recur annually, proposals were developed and submitted to the Supervisory Board for approval:• The actual short-term incentive for 2015• The targets for the short-term and long-term
incentive plans 2016• The annual base salary of Executive Board
members in 2017• The incentive plans opportunities and targets for
the Short-Term Incentive Plan 2017 and theLong-Term Incentive Plan 2017-2019
The Remuneration Committee conducted a comprehensive and in-depth analysis of the total compensation levels and individual components thereof, of the Executive Board against the benchmark sets of companies with the help of external consultants. Since the design elements of the compensation program had been reviewed extensively in 2015, no design changes were proposed for 2017.
90 | Vopak | Annual Report 2016In
trod
uctio
nE
xecutive B
oard
repo
rtS
torin
g vital p
rod
ucts
with
careK
ey develo
pm
ents
per d
ivision
Ad
ditio
nal in
form
ation
| Vopak | Annual Report 2016 | Supervisory Board reportFin
ancial S
tatemen
tsS
ustain
ability
Govern
ance, risk
and
com
plian
ce

The Remuneration Committee also discussed certain ‘guiding principles’ for determining the compensation (design and levels) for the Executive Board to be followed, also keeping in mind external developments and the potential requirements of the Dutch Corporate Governance Code on Remuneration provisions and best practices.
The Remuneration Committee carries out a benchmark of the remuneration of members of the Supervisory Board once every two years. Considering the company’s international scope, increasing governance responsibilities and market developments, the Remuneration Committee recommended to increase the Supervisory Board fees and to maintain the current committee fees for the financial years 2017 and 2018.
For further details on the remuneration policy, reference is made to the Vopak website. For further details on the actual remuneration during 2016 and the shareholding positions of the Executive Board and the Supervisory Board, reference is made to the Remuneration report.
The year 2016 was a commemorable year in which the company celebrated its 400-year anniversary. The Supervisory Board would like to express its sincere appreciation to the Executive Board and all the company’s employees for their dedication and hard work in achieving a successful 2016.
The members of the Supervisory Board have signed the financial statements in order to comply with the statutory obligation pursuant to article 2:101 paragraph 2 of the Dutch Civil Code.
Rotterdam, 16 February 2017
The Supervisory BoardA. van Rossum (Chairman)M.F. Groot (Vice-Chairman)F.J.G.M. CremersC.J. van den DriestB.J. NoteboomR.G.M. Zwitserloot
91Supervisory Board report |In
trod
uctio
nE
xecutive B
oard
repo
rtS
torin
g vital p
rod
ucts
with
careK
ey develo
pm
ents
per d
ivision
Su
stainab
ilityG
overnan
ce an
d co
mp
liance
Finan
cial Statem
ents
Ad
ditio
nal in
form
ation
Govern
ance, risk
and
com
plian
ce91 | Vopak | Annual Report 2016 | Supervisory Board report

Remuneration reportThis section of the Annual Report provides an overview of the implementation of Vopak’s remuneration policy for the members of the Executive Board and the Supervisory Board during 2016.
Remuneration policy 2016The Supervisory Board decides annually on a total remuneration package for the Executive Board. This package is composed of the following four elements:• An annual fixed base salary• A short-term variable remuneration• A long-term variable remuneration• A pension plan
The characteristics of the short-term and long-term variable remuneration plans are summarized in the following table in terms of the type of incentive (cash or shares), the performance criteria (financial and non-financial) and the annualized incentive opportunities related to the targets set at the beginning of the year.
Variable component
Type of incentive
Performancecriterion
Incentive as % of annual base salary
Threshold 2 Target Maximum
Short-term variable remuneration
Cash 50%1: Financial target (EBITDA)+/- 10% discretionary range on the financial incentive result
50%1: Non-financial targetsSafety (personal and process safety);Customer satisfaction; EB effectiveness
Chairman
Member
15%
12.5%
60%
50%
90%
75%
Long-term variable remuneration
Shares 3 Financial target (EPS)+/- 10% discretionary range on the financial incentive result
Chairman
Member
45%
35%
90%
70%
135%4
105%4
1. 50%-50% distribution at target level. No payout of non-financial component in case performance is below target levels for Non-Financial Targets.2. Threshold only applies to financial targets. No variable remuneration is paid below the threshold level.3. Payout for the Long-Term Share Plans 2014-2016 and 2015-2017 will be 50% in shares and 50% in cash.
The payout for the LTSP 2016-2018 will be fully in shares, with the exception of Mr De Kreij, for whom the plan will be cash settled as per Plan rules, due to his announced retirement in 2018.
4. Annualized values of an award as a percentage of the average salary during the plan period.
In April 2016, the Annual General Meeting approved the proposal of the Supervisory Board to further align the incentive packages with the Dutch AEX/AMX job-level based market with an increase in the incentive opportunity from January 2016 as shown below.
Variable compensation 2016
Short-term variable remuneration
Long-term variable remuneration
Total variable remuneration
Target Max Target Max Target Max
E.M. Hoekstra 2016 60% 90% 90% 135% 150% 225%
2015 60% 90% 80% 120% 140% 210%
J.P. de Kreij and F. Eulderink
2016 50% 75% 70% 105% 120% 180%
2015 45% 75% 65% 97.5% 110% 172.5%
In determining the set-up of the variable remuneration plans, the likely scenarios on possible outcomesand consequences of these outcomes on the total remuneration packages were analyzed and taken intoconsideration.
92 | Vopak | Annual Report 2016In
trod
uctio
nE
xecutive B
oard
repo
rtS
torin
g vital p
rod
ucts
with
careK
ey develo
pm
ents
per d
ivision
Ad
ditio
nal in
form
ation
Finan
cial Statem
ents
Su
stainab
ilityG
overnan
ce, risk an
d co
mp
liance
| Vopak | Annual Report 2016
Remuneration reportRemuneration report

The pension plan for the Executive Board remained unchanged in 2016.
For further details of the Remuneration Policy 2016, reference is made to the Vopak website. Actual remuneration entitlements Executive Board 2016The table below shows the actual remuneration to which each member of the Executive Board was entitled in 2016. The actual costs for the period incurred by the company for the remuneration of the Executive Board including accrued amounts for the long-term incentive plans are disclosed separately at the end of this report.
Annual base salary
Short-Term Incentive
Long-Term Incentive Pension Total
In EUR thousands 2016 2015 20161 2015 2016 2015 2016 2015 20161 2015
E.M. Hoekstra 625 625 563 469 1,916 N.A. 121 121 3,225 1,215
J.P. de Kreij 520 520 390 332 1,196 N.A. 190 190 2,296 1,042
F. Eulderink 500 495 375 316 1,135 N.A. 136 135 2,146 946
Total 1,645 1,640 1,328 1,117 4,247 N.A. 447 446 7,667 3,203
1. The short-term incentive amounts in 2016 include the incentive for the customer service part assumed at target levels, since the actual NPS result will become available in March 2017. The total actual amount will be presented at the Annual General Meeting 2017.
N.A. Not applicable.
With regard to the long-term incentive, there was no pay-out of any incentive plan in 2016 as all current plans will only vest or be settled in 2017 and thereafter.
Annual base salary 2016Results of external benchmarking on total compensation against similar positions in the AEX and AMX companies in the Netherlands indicated that the fixed pay levels of the Executive Board were generally in line with the market. The salaries of the Executive Board members, therefore, remained unchanged except for Mr Eulderink, whose salary was slightly increased.
Short-term variable remuneration 2016The achievements on the pre-set short-term incentive (STI) targets for 2016 were evaluated beginning of 2017. The table below shows the results for each board member on the various performance criteria, both in target and actual percentage of the annual base salary.
Base Salary Target results Total STI 2016
Financial SafetyCustomer
satisfaction Effectiveness Opportunity Actual 1
In EUR thousands 2016 Target Actual Target Actual Target Actual1 Target Actual Target Max in % In EUR
E.M. Hoekstra 625 30% 60% 10% 10% 10% 10% 10% 10% 60% 90% 90% 563
J.P. de Kreij 520 25% 50% 8.33% 8.33% 8.33% 8.33% 8.33% 8.33% 50% 75% 75% 390
F. Eulderink 500 25% 50% 8.33% 8.33% 8.33% 8.33% 8.33% 8.33% 50% 75% 75% 375
1. The actual short-term incentive 2016, including the result on customer satisfaction, will be presented at the AGM 2017.
FinancialWith regard to the financial target, EBITDA -excluding exceptional items- for 2016 amounted to EUR 822.3 million, which exceeded the maximum of the target range set at the beginning of the year, after considering the adjustment for the terminals divested in the course of the year.
For details on the EBITDA development during 2016, reference is made to the section Financial performance in the Executive Board report chapter. The Supervisory Board decided not to use the +/-10% discretionary range on the financial incentive result. Results on the pre-set non-financial performance targets for the short-term incentive, related to safety (personal safety and process safety), customer satisfaction and effectiveness of the Executive Board as a team, are described on the next page.
93Remuneration report |In
trod
uctio
nE
xecutive B
oard
repo
rtS
torin
g vital p
rod
ucts
with
careK
ey develo
pm
ents
per d
ivision
Su
stainab
ilityG
overnan
ce an
d co
mp
liance
Finan
cial Statem
ents
Ad
ditio
nal in
form
ation
Govern
ance, risk
and
com
plian
ce93 | Vopak | Annual Report 2016 | Remuneration report

SafetyVopak’s ‘License to Operate’ and its ‘License to Grow’ are conditional upon its ability to operate safely and responsibly. Process safety and the occupational health and safety of employees and contractors is its top priority. Initiatives like Assure 2016, focusing on major process incidents and Vopak Safety Fundamentals emphasizing adherence to Safety, Health and Environmental (SHE) requirements for all employees, contracts and service providers significantly contributed to the improved safety results.
The Total Injury Rate measuring personal safety showed improvement against the target 2016 notably for Vopak Americas and Vopak Asia with the other divisions showing year-on-year reductions as compared to previous years. Also the severity of incidents and process safety performance came out better than target.
For further details on our safety results, reference is made to the Sustainability chapter of this Annual Report.
Customer satisfaction Our customer service improvement efforts in 2016 have further increased in order to remain in the top league of service providers in the world. Vopak intensified the service dialogues with its customers and also other service providers to its customers operating in the same supply chain and having interactions with various terminals. Implementing global terms and conditions also helped to significantly increase the speed of doing business with its customers. Vopak is also investing in technologies which will make available real time data and digital connectivity, which will provide greater transparency in information flows and data collection. This enables Vopak to meet and strive to exceed its customers’ expectations and helps add value by making their supply chain more effective.
Since the customer satisfaction survey measuring the Net Promoter Score runs until end of February 2017, actual data for the STI 2016 are not yet available and therefore assumed at target levels in the STI amount. The actual STI amounts will be reported at the Annual General Meeting of Shareholders in April 2017.
Team effectiveness Based on individual evaluation meetings with the Executive Board, on the implementation and realization of the agenda of the Executive Board for 2016 as set at the beginning of the year, the Supervisory Board evaluated the team performance of the Executive Board as ‘effective’.
Long-term variable remuneration 2016In 2014, a ‘roof tile’ plan structure of Long-Term Share Plans started with the grant of the Long-Term Share Plan 2014-2016. This year, another ‘roof tile’ has been granted in terms of the Long-Term Share Plan 2016-2018. The plan is similar to the previous plan. However, with an increased incentive opportunity for the CEO, CFO and COO as shown below:
Incentive as % of Annual Base Salary
Executive Board LTI Plan Threshold Target Maximum
E.M. Hoekstra 2014-2016 40% 80% 120%
2015-2017 40% 80% 120%
2016-2018 45% 90% 135%
J.P. de Kreij 2014-2016 30% 60% 90%
2015-2017 32.5% 65% 97.5%
2016-2018 35% 70% 105%
F. Eulderink 2014-2016 30% 60% 90%
2015-2017 32.5% 65% 97.5%
2016-2018 35% 70% 105%
94 | Vopak | Annual Report 2016In
trod
uctio
nE
xecutive B
oard
repo
rtS
torin
g vital p
rod
ucts
with
careK
ey develo
pm
ents
per d
ivision
Ad
ditio
nal in
form
ation
| Vopak | Annual Report 2016 | Remuneration reportFin
ancial S
tatemen
tsS
ustain
ability
Govern
ance, risk
and
com
plian
ce

Long-Term Share Plan Plan period and year of actual award
2014 2015 2016 2017 2018 2019
Long-Term Share Plan 2014-2016 3 x Award1
Long-Term Share Plan 2015-2017 Awards
Long-Term Share Plan 2016-2018 Awards
1. As the financial targets are met for the performance plan 2014-2016, the long-term incentive 2014-2016 will be settled in 2017. Since no new plans were granted in 2011, 2012 and 2013, there was no settlement in 2016. In order to bridge the gap between the last long-term incentive pay-out in 2014 and the next pay-out moment in 2017, it was decided in 2014, that the first pay-out in 2017, if any, would be multiplied by three. Subsequent plans will (potentially) vest annually, starting in 2017 for the 2015-2017 plan without multiplication.
For further details on the Long-Term Incentive Plans, reference is made to the Remuneration Policy on the Vopak website and note 6.2 to the Consolidated Financial Statements.
Share ownershipThe share portfolios of each of the Executive Board members at year-end 2015 and 2016 are indicated in the following table. The table distinguishes between privately invested shares acquired at the own cost and risk of the individual Executive Board members over the past years, and performance shares acquired on a net basis as rewards under the long-term incentive plans vested since 2011.
The overview does not include potentially awarded shares under the Long-Term Share Plans 2014-2016, 2015-2017 and 2016-2018. These plans will be settled respectively in 2017, 2018 and 2019.
In number of shares
Rewarded performance shares year-
end 2016
Privately invested sharesyear-end 2016
Total shares year-end 2016
Total shares year-end 2015
E.M. Hoekstra 13,289 9,582 22,871 22,871
J.P. de Kreij 50,286 300,000 350,286 350,286
F. Eulderink 4,423 750 5,173 5,173
1. The Vopak share price at year-end 2016 and 2015 were EUR 44.88 and EUR 39.67 respectively.
The performance shares may be sold by the Executive Board members. However, the remaining value of the portfolio of performance shares must be equal to two years’ annual base salary for the CEO and one year base salary for the CFO and COO.
In accordance with its policy, Vopak did not provide any personal loans, advances or guarantees to the Executive Board members.
Reference is also made to note 6.3 of the Consolidated Financial Statements.
Cost of the Remuneration of the Executive Board 2016The total cost for the company for Executive Board remuneration as recognized in the 2016 Consolidated Statement of Income increased in 2016 from EUR 5.1 million to EUR 6.1 million. The amounts for annual base salary and pension are equal to the amounts the Executive Board members are entitled to for 2016. However, the short-term incentive and long-term incentive amounts refer to the recognized IFRS costs accrued by the company during the financial year 2016 for the Long-Term Incentive Plans 2014-2016, 2015-2017 and 2016-2018.
Based on the latest estimates of the three plans, subject to realization of the pre-set targets:
Plan 2014-2016• The change in estimate for the accrued cost in 2014 and 2015 for years 1 and 2• The accrued cost in 2016 for year 3Plan 2015-2017• The change in estimate for the accrued cost in 2015 for year 1• The accrued cost in 2016 for year 2Plan 2016-2018• The accrued cost in 2016 for year 1
95Remuneration report |In
trod
uctio
nE
xecutive B
oard
repo
rtS
torin
g vital p
rod
ucts
with
careK
ey develo
pm
ents
per d
ivision
Su
stainab
ilityG
overnan
ce an
d co
mp
liance
Finan
cial Statem
ents
Ad
ditio
nal in
form
ation
Govern
ance, risk
and
com
plian
ce95 | Vopak | Annual Report 2016 | Remuneration report

For further details on the cost of the Long-Term Incentive Plans reference is made to note 6.2 to the Consolidated Financial Statements.
Annual base salary
Short-Term Incentive
Long-Term Incentive Pension Total
In EUR thousands 2016 2015 20161 2015 2016 2015 2016 2015 20161 2015
E.M. Hoekstra 625 625 563 531 1,191 776 121 121 2,500 2,053
J.P. de Kreij 520 520 390 371 814 493 190 190 1,914 1,574
F. Eulderink 500 495 375 353 726 469 136 135 1,737 1,452
Total 1,645 1,640 1,328 1,255 2,730 1,738 447 446 6,150 5,079
1. The short-term incentive amounts 2016 are preliminary and based on the current estimate which is accrued for. The actuals will be presented at the Annual General Meeting 2017.
Remuneration of the Supervisory Board 2016The Remuneration of the Supervisory Board was fixed for a two-year period (2015 and 2016) and was approved by the shareholders in the Annual General Meeting in 2015. The table below shows the amounts each member received in 2016, resulting in a total cost to the company of EUR 0.41 million, as compared to EUR 0.42 million in 2015. The reduction in cost was due to changes to the Board composition as shown below.
In EUR thousandsSupervisory
BoardAudit
Committee
Selection and Appointment
CommitteeRemuneration
Committee Total 2016 Total 2015
A. van Rossum (Chairman) 77.5 – 7.0 7.0 91.5 91.5
M.F. Groot (Vice-Chairman) 55.0 8.5 5.0 – 68.5 68.5
F.J.G.M. Cremers 55.0 15.0 – – 70.0 70.0
C.J. van den Driest 55.0 4.25 2.5 – 61.75 63.5
C.K. Lam (until 01-03-2016) 9.2 – – 1.2 10.4 62.0
B.J. Noteboom (from 20-04-2016) 41.3 6.4 – – 47.7 –
R.G.M. Zwitserloot 55.0 – – 10.0 65.0 65.0
Total 348.0 34.1 14.5 18.2 414.85 420.5
In accordance with the policy, Supervisory Board members did not receive any fixed allowance or performance-related incentives.
The company reimbursed travel costs for Supervisory Board members living outside the Netherlands, which is not included in the table above.
Vopak did not provide any personal loans, advances or guarantees to Supervisory Board members. No Supervisory Board member held any Vopak shares at year-end 2016, except for Mr Noteboom, who held 3,500 shares at year-end 2016. Reference is also made to note 6.3 of the Consolidated Financial Statements.
96 | Vopak | Annual Report 2016In
trod
uctio
nE
xecutive B
oard
repo
rtS
torin
g vital p
rod
ucts
with
careK
ey develo
pm
ents
per d
ivision
Ad
ditio
nal in
form
ation
| Vopak | Annual Report 2016 | Remuneration reportFin
ancial S
tatemen
tsS
ustain
ability
Govern
ance, risk
and
com
plian
ce

Windows to the world Project goalTo equip high school youth with better skills for their future careers, especially by learning English.
Realized in 2016The Vopak team in Malaysia adopted a local high school with students from middle- and low-income families to help them improve their English.
A good knowledge of the English language is key to create new opportunities for these students from a traditional local community. The team set up English corners in their classrooms, expanded their libraries with a good collection of English
books, arranged professional lessons and sang English songs. In addition, they organized several activities to broaden their horizons. The students visited the local English newspaper, a university and an international school. Vopak employees gave motivational talks, shared life experiences and stressed the importance of embracing diversity.
During life skills workshops, the students learned how to manage a good work-life balance. As one of the students said: “I hope to attend more programs like this in the future. I learned new things that can benefit my future.”
97Remuneration report |In
trod
uctio
nE
xecutive B
oard
repo
rtS
torin
g vital p
rod
ucts
with
careK
ey develo
pm
ents
per d
ivision
Su
stainab
ilityG
overnan
ce an
d co
mp
liance
Finan
cial Statem
ents
Ad
ditio
nal in
form
ation
Govern
ance, risk
and
com
plian
ce97 | Vopak | Annual Report 2016 | Remuneration report| Vopak | Annual Report 2016
Weconnect Pengerang Independent Terminal, Malaysia

Vopak is incorporated and based in the Netherlands. As a result, Vopak’s governance structure is based on the requirements of Dutch legislation including securities laws, the company’s articles of association, complemented by internal policies and procedures. Given the worldwide exposure of its businesses, the international context is of vital importance and relevant international developments are closely monitored.
Good corporate governance is a key component of Vopak’s way of doing business and is embedded in its core values. The corporate governance is supported by a strong focus on integrity, transparency and clear and timely communication. Good governance and proper supervision are important prerequisites for generating and maintaining trust in the company.
Vopak complies with the vast majority of the principles and best practices laid down in the Dutch Corporate Governance Code (the Code). The limited number of exceptions to the best practice provisions, has increased by one to five, compared to 2015. The exceptions are explained in the following paragraphs.
Set-up and policy Vopak aims to strike a sound balance between the interests of the company’s various stakeholders. Integrity, openness, supervision, transparent reporting and accountability are the cornerstones of our corporate governance policy. The company has also developed a clear policy with regard to reporting for financial matters and sustainability. For details of the Sustainability Policy, reference is made to the Vopak website.
Vopak confirms that the principles reflected in the Code are applied by Vopak.
Vopak has a two-tier governance structure requiring a well-managed relationship between the Executive Board solely composed of executive members and the Supervisory Board solely composed of non-executive directors. The two Boards are independent of each other and have their own roles and responsibilities in the governance structure.
The Executive Board is responsible for the management of the company and for the realization of its objectives. These include the objectives for strategy and policy, health, safety, the environment (part of sustainability), quality, as well as results.
The Executive Board is assisted in fulfilling its responsibilities by the Risk Committee, the Compliance Committee and the Disclosure Committee. The activities of the Risk Committee include facilitating and challenging risk reporting within the company, providing oversight of main risks and related risk management activities. The primary objective of the Compliance Committee is to support and advise the Executive Board in fulfilling its oversight responsibilities on all compliance matters relevant to Vopak’s activities. The Disclosure Committee assists the Executive Board with ensuring that information is disclosed accurately and timely to the outside world in line with the applicable laws and regulations.
The Supervisory Board reviews Vopak´s overall performance, including the policies pursued and results achieved by the Executive Board, the company´s financial situation, its financial statements, key risks and opportunities. The Supervisory Board also reviews and approves the strategy of Vopak, as proposed by the Executive Board. Similarly, it approves important proposals for capital expenditure, acquisitions and divestments, changes in financial and other corporate policies and the annual budget. The Supervisory Board evaluates the performance of the Executive Board as a whole and that of its individual members, and proposes any changes to the composition of the Executive Board to the General Meeting. Similarly, the Supervisory Board reviews its own performance annually and proposes changes to the composition of the Supervisory Board to the General Meeting. Finally, the Supervisory Board ensures that the company´s policies are formulated and pursued in the interest of all its stakeholders, including shareholders and employees, and that these policies are sustainable and meet the highest ethical standards.
As Vopak is an international holding company, the Dutch ‘large company regime’ does not apply.
The Supervisory Board is carefully selected to include members with diverse backgrounds and experience in areas relevant to Vopak’s core business and the foreign markets in which it operates. Their experience ranges from economic, financial, technical, operational and social areas, to political and business-related areas. The Supervisory Board, in performing its duties, focuses on the realization of the objectives of the company, the strategy and its implementation. The Supervisory Board appoints an Audit Committee, a Remuneration Committee and a
Corporate governance
98 | Vopak | Annual Report 2016In
trod
uctio
nE
xecutive B
oard
repo
rtS
torin
g vital p
rod
ucts
with
careK
ey develo
pm
ents
per d
ivision
Ad
ditio
nal in
form
ation
Finan
cial Statem
ents
Su
stainab
ilityG
overnan
ce, risk an
d co
mp
liance
| Vopak | Annual Report 2016
Corporate governanceCorporate governance

Selection and Appointment Committee from among its members. In accordance with the provisions of the Code, Vopak has further specified the role and powers of these committees in specific regulations that apply to them.
In addition to the authority to appoint, suspend and dismiss members of the Executive Board and Supervisory Board, the General Meeting has other authorities such as passing resolutions for legal mergers and split-offs, adopting financial statements, and appropriation of profits available for distribution on ordinary shares. Furthermore, the General Meeting determines the remuneration policy for the Executive Board and has to approve any significant amendments to this policy. The General Meeting also sets the remuneration of the members of the Supervisory Board. The remuneration of the members of the Executive Board is set by the Supervisory Board on the basis of a proposal from the Remuneration Committee, in accordance with the remuneration policy as adopted by the General Meeting. Vopak will continue to facilitate proxy voting. Dutch law provides for a mandatory registration date to exercise voting and attendance rights 28 days before the date of the General Meeting.
The Dutch Corporate Governance CodeVopak has evaluated its corporate governance structure against the Dutch Corporate Governance Code (the Code) and concluded that in 2016 it satisfied the principles and best practice provisions of the Code, with the exception of the following five items:
1 Best practice provision II.1.1 (appointment of Executive Board members for four years) The term of Mr De Kreij’s contract of employment is not in accordance with this provision. The contract was concluded for an indefinite period of time and before the Code came into effect. On 15 November 2016, it was announced that Mr De Kreij has informed the Supervisory Board that he has decided to step down as per 1 February 2018.
2 Best practice provision II.2.5 (blocking period of five years for shares granted to the Executive Board without financial consideration) The blocking period of five years is not included in the Long-Term Incentive Plans (LTIPs). However, the remaining value of the portfolio of performance shares must be at least equal to two year’s annual base salary for the CEO and one year base salary for the CFO and COO.
3 Best practice provision II.2.8 (maximum severance pay) The employment contract between Vopak and Mr De Kreij is not in accordance with this provision. In the event of his dismissal, Mr De Kreij will be contractually entitled to at least two years’ salary. Such severance pay may also become due if Mr De Kreij cannot reasonably be asked to fulfill his duties as a result of changes in circumstances, for example if a public bid is made. The contract was concluded before the Code came into effect and existing rights may not be impaired.
4 Principle III.3 and best practice provision III.3.1 (expertise and composition of the Supervisory Board) These provisions relate to diversity and state that the Supervisory Board should strive for a diverse composition as to gender and age and should formulate concrete targets to achieve this. The Supervisory Board of Vopak strives to achieve a diverse composition of its members and has formulated key elements of its membership profile. These elements are available in the Corporate Governance section of the Vopak website. Vopak does not strictly follow the recommendation to set an explicit target for diversity in terms of gender or age. For diversity in terms of gender, age or area of expertise the overriding principle for Vopak is that the Supervisory Board has a diverse composition of members taking into account various factors including a valuable contribution in terms of broad international management experience and knowledge of the oil, petrochemical or LNG industries in the regions in which Vopak is active, or other relevant business knowledge for the independent tank terminal business. Diversity in the broad sense is a topic on the Supervisory Board agenda and is discussed in the Selection and Appointment Committee meetings.
5 Best practice provision III.3.5. (expertise and composition of the Supervisory Board) With respect to this best practice provision, it should be noted that although Mr Cremers reached the maximum of three four-year terms, the AGM held on 20 April 2016 reappointed Mr Cremers as a member of the Supervisory Board for an additional period of two years. Section III.3.5 of the Code limits the number of four-year terms to a maximum of three. The Articles of Association provide that the General Meeting may decide otherwise, which it did in the case of Mr Cremers, based on his valuable contributions to the Board as financial expert and his relevant financial knowledge and experience gained at internationally operating companies.
99Corporate governance |In
trod
uctio
nE
xecutive B
oard
repo
rtS
torin
g vital p
rod
ucts
with
careK
ey develo
pm
ents
per d
ivision
Su
stainab
ilityG
overnan
ce an
d co
mp
liance
Finan
cial Statem
ents
Ad
ditio
nal in
form
ation
Govern
ance, risk
and
com
plian
ce99 | Vopak | Annual Report 2016 | Corporate governance

The number of exceptions have increased by one compared to 2015 relating to the reappointment of Mr Cremers as a member of the Supervisory Board for an additional period of two years. Vopak has several regulations in place governing the performance of its various bodies and ensuring implementation of the rules applicable within Vopak. These regulations have been amended in line with the Code, recent legislative amendments and decisions made by the Executive Board and the Supervisory Board, and were disclosed during the General Meeting in April 2016. The regulations can be found in the Corporate Governance section of the Vopak website.
These regulations concern:• Regulations of the Executive Board• Regulations of the Supervisory Board• Regulations of the Audit Committee of the
Supervisory Board• Regulations of the Remuneration Committee of
the Supervisory Board• Regulations of the Selection and Appointment
Committee of the Supervisory Board• Regulations in respect of the ownership of and
transactions in Vopak shares and certain other financial instruments. Vopak also maintains Insider Lists
• Regulations on suspected irregularities (‘whistleblower regulations’)
The following items also appear on the Vopak website:• Articles of Association• Information on the members of the Executive
Board and Supervisory Board and the composition of the core committees
• Profile of the Supervisory Board• Retirement schedule for the Supervisory Board
members• Retirement schedule for the Executive Board
members• Policy related to bilateral contacts with
shareholders• Code of Conduct• Sustainability Policy• Corporate Governance Compliance Manual• Remuneration report, containing the main points of
the remuneration policy• Corporate Governance Statement (the content of
which forms part of this Annual Report and is deemed incorporated here by reference)
Anti-takeover measuresVopak’s principal defense against a (hostile) takeover is the ability to issue cumulative preference shares (‘protective preference shares’) to Stichting Vopak. Such defensive preference shares will be issued, in the event that Stichting Vopak exercises its option right. On 18 October 1999, the General Meeting decided to grant Stichting Vopak the right to take up protective preference shares up to a maximum nominal amount equal to 100% of the share capital issued at that time to third parties in the form of ordinary and financing preference shares, less one ordinary share. Vopak and Stichting Vopak further formalized their relationship with regard to the option right in an option agreement of 1 November 1999. This agreement was amended on 5 May 2004, whereby the original put option granted to Vopak was cancelled. In light of the possible introduction in the future of other classes of shares, the Extraordinary General Meeting of 17 September 2013 resolved to expand Stichting Vopak’s right to acquire protective preference shares in such a way that it is not only related to share capital issued to third parties in the form of ordinary and financing preference shares at the time Stichting Vopak exercises this, but to all shares in the share capital of Vopak issued to third parties at such time, less one ordinary share. The option agreement with Stichting Vopak was amended on 17 September 2013 to reflect this change. Exercise by Stichting Vopak of its option right in part does not affect its right to acquire the remaining protective preference shares under the option granted to Stichting Vopak. The option agreement provides that in the event that Stichting Vopak exercises its option right and the results thereof are fully or partially cancelled (for instance as a result of the cancellation of the protective preference shares issued), Stichting Vopak will continue to be able to exercise its option right.
The granting of the call option to Stichting Vopak has been entered in the Company Registry. The objective of Stichting Vopak is to promote the interests of Vopak and companies affiliated to the Vopak group. It does this in a way that safeguards the interests of Vopak and its stakeholders to the greatest possible extent and, to the best of its ability, it resists influences opposing those interests, which could impair the independence and/or continuity and/or identity of Vopak. It undertakes all actions relating to or conducive to these objectives. The board of Stichting Vopak therefore determines whether and when it is necessary to issue the protective preference shares. These measures can be taken for example (but not necessarily limited to) in the event of a (hostile) takeover bid if the board of Stichting Vopak believes it is in the interest of Vopak
100 | Vopak | Annual Report 2016In
trod
uctio
nE
xecutive B
oard
repo
rtS
torin
g vital p
rod
ucts
with
careK
ey develo
pm
ents
per d
ivision
Ad
ditio
nal in
form
ation
| Vopak | Annual Report 2016 | Corporate governanceFin
ancial S
tatemen
tsS
ustain
ability
Govern
ance, risk
and
com
plian
ce

and its stakeholders to establish its position in respect of the hostile party and its plans, and to create opportunities to seek alternative scenarios.
Information referred to in Section 1 of the Takeover Directive (Article 10) Decree
Capital structureA description of Vopak’s capital structure, the various classes of shares and the rights and obligations attached to them can be found in note 5.1 to the Consolidated Financial Statements. At 31 December 2016, a total of 127,835,430 ordinary shares had been issued with a nominal value of EUR 0.50 each. No financing preference shares and no protective preference shares have been issued at 31 December 2016.
Restrictions on the transfer of sharesVopak´s Articles of Association do not provide for a restriction on the transfer of ordinary shares. They do, however, provide for a restriction on the transfer of financing preference shares. Financing preference shares may only be transferred to natural persons, subject to specific exceptions for a legal entity holding the financing preference shares for the purpose of administration and other parties pursuant to Article 10A, paragraph 7 of the Articles of Association. With regards to the protective preference shares, the Articles of Association provide that any transfer requires the approval of the Executive Board.
Major holdings subject to mandatory disclosureMore information on major shareholdings that are subject to mandatory disclosure pursuant to the Financial Markets Supervision Act can be found in the section Shareholder information. Furthermore, additional information on the transactions with major shareholders can be found in note 6.3 of the Consolidated Financial Statements.
System of control over employee share plansInformation on share plans can be found in note 6.2 to the Consolidated Financial Statements of this Annual Report.
Rules governing the appointment and dismissal of members of the Executive Board and Supervisory Board and the amendment of the Articles of AssociationUnder Vopak’s Articles of Association, members of the Executive Board and Supervisory Board are appointed and dismissed by the General Meeting. The Supervisory Board makes a non-binding nomination for the appointment of members of the Executive Board. Upon the appointment of members of the Supervisory Board, the Supervisory Board may make a non-binding nomination.
The General Meeting may only resolve to amend the Articles of Association following a proposal from the Executive Board that is subject to approval by the Supervisory Board. Such a resolution of the General Meeting requires a majority of at least two-thirds of the number of votes validly cast.
Share issuance and repurchaseThe General Meeting or the Executive Board, if so designated by the General Meeting, resolves or decides on the issuance of shares. Any share issuance is subject to approval by the Supervisory Board. At 31 December 2016, no authorization to issue shares had been granted to the Executive Board.
The Executive Board is authorized until 19 October 2017 to repurchase fully paid-up ordinary shares in Vopak´s capital, subject to approval by the Supervisory Board. Any repurchase must be limited to the maximum number held by virtue of the law and the Articles of Association (10% at 31 December 2016). Their purchase price must be between the nominal value of the ordinary shares and 110% of the average share price listed on the five most recent trading days prior to the date of the purchase.
Key agreements containing change-of-control provisionsReference is made to the change-of-control provisions in connection with loans in note 5.6 to the Consolidated Financial Statements.
With respect to agreements entered into with members of the Executive Board and employees that provide for payment upon termination of their employment following a public bid, refererence is made to the description of the remuneration policy on the Vopak website and the Corporate Governance section, particularly the explanation of the exception from best practice provision II.2.8 of the Code.
101Corporate governance |In
trod
uctio
nE
xecutive B
oard
repo
rtS
torin
g vital p
rod
ucts
with
careK
ey develo
pm
ents
per d
ivision
Su
stainab
ilityG
overnan
ce an
d co
mp
liance
Finan
cial Statem
ents
Ad
ditio
nal in
form
ation
Govern
ance, risk
and
com
plian
ce101 | Vopak | Annual Report 2016 | Corporate governance

The Executive Board, under the supervision of the Supervisory Board, bears the ultimate responsibility for an effective internal control and risk management framework. In order to be able to carry out these responsibilities, the Executive Board is assisted among others by Global Internal Audit and the Global Risk Committee, respectively.
Internal Control Divisional management teams together with terminal management are responsible for implementing the strategy, achieving results, identifying risks that could impact the success of the strategy and for ensuring operations are carried out in line with our internal control principles. These internal control principles, which cover all key processes, are set out in our Key Control Framework (KCF). It is the responsibility of local management, supported by Divisions and Global functional departments, to implement an internal control environment in accordance with the KCF. Divisions and Global Functions are responsible for the on-going monitoring of the design and effectiveness of internal controls as the ‘second line of defense’ with
Global Internal Audit acting as the ‘third’ line. In addition to internal audit activities, the maturity of implementation is assessed on an annual basis by each terminal completing a Control Risk Self-Assessment (CRSA). This CRSA includes controls specifically directed at fraud and corruption, such as the existence of a gift register. The results of the CRSAs, are analyzed by Global Internal Audit and reported to the Executive Board, who in turn discusses the findings and next step maturity action plans with the Divisions. Our KCF is reviewed on an annual basis by specific represen tatives from Global Control and Business Analysis and Global Internal Audit to ensure ongoing application and enhancement of internal control procedures.
Internal control and risk management
Internal control framework
Executive Board
Senior Management
Supervisory Board/Audit Committee
Extern
al aud
it
1st line of defense
Management controlsInternal control measures and compliance
2nd line of defense
Financial controlRisk managementSecurityQualityCompliance
3rd line of defense
Internal Audit
Terminal Division/Global
102 | Vopak | Annual Report 2016In
trod
uctio
nE
xecutive B
oard
repo
rtS
torin
g vital p
rod
ucts
with
careK
ey develo
pm
ents
per d
ivision
Ad
ditio
nal in
form
ation
Finan
cial Statem
ents
Su
stainab
ilityG
overnan
ce, risk an
d co
mp
liance
| Vopak | Annual Report 2016
Internal control and risk managementInternal control and risk management

Role of Internal AuditThe role of Global Internal Audit is to provide assurance and advice to the Executive Board in its responsibility for internal controls. Activities undertaken can be considered as either value preservation or value creation activities. Independent objective assurance activities relating to the application and effective working of governance, risk management and internal controls fall under the category of value preservation. Value creation refers to the advising activities designed to add value and improve our operations and set up. Global Internal Audit primarily executes audits of an operational, IT, investigative and compliance nature with the audit of the Financial Statements being the responsibility of Vopak’s external auditor. The Internal Audit Charter has been endorsed by the Executive Board and the Audit Committee.
The annual internal audit plan is developed using a risk-based approach, the process of which includes dialogues with Divisional Management teams, Global Directors and the Executive Board. Progress in relation to the plan is reported on a periodic basis to the Executive Board and the Audit Committee with the results of all audits executed also being discussed each quarter with both the Executive Board and the Audit Committee. Follow up and closure of the audit findings is the responsibility of Divisional management with formal reporting to Internal Audit and thereafter to the Executive Board and Audit Committee on a biannual basis. The work performed by Global Internal Audit is in accordance with International Internal Auditing Standards.
Internal audit to preserve and create value
Strategic performance
Operational performance
Governance focus
Control and compliance
Value creation
Value preservation
Consulting Assurance(In-Control Statement)
Performance and efficiency
Regulation and Control
Clear and objective in findings; Constructive and realistic in recommendations
Fraud and whistleblower investigations
New ‘development’ reviews/advice
Operational, IT and Compliance
audits
Letters of Representation and In-Control StatementThe Executive Board requires all terminal management, Divisional Finance Directors, Division Presidents and Global Directors to sign a Letter of Representation at the end of each half year and full year representing the key elements of control
and full disclosure of deviations to that control, if applicable. The results of this process are evaluated each period and provide input for the In-Control Statement declared by our Executive Board. For our In-Control Statement, reference is made to the Executive Board declaration, included directly after the Financial Statements.
103Internal control and risk management |In
trod
uctio
nE
xecutive B
oard
repo
rtS
torin
g vital p
rod
ucts
with
careK
ey develo
pm
ents
per d
ivision
Su
stainab
ilityG
overnan
ce an
d co
mp
liance
Finan
cial Statem
ents
Ad
ditio
nal in
form
ation
Govern
ance, risk
and
com
plian
ce103 | Vopak | Annual Report 2016 | Internal control and risk management

Management review cycleThe regular reporting cycle is key to our control process. Monthly and quarterly management reports are prepared by all subsidiaries and joint ventures in line with clearly defined, mandatory reporting requirements with regular consultations across the management layers involved. The reports and related discussions cover not only the financial results but also key operational, human resources and commercial performance indicators aimed at achieving the strategic objectives. A critical element of these discussions is comparing progress against Vopak’s Annual Budget which, together with the two subsequent (plan) years, is reviewed and approved by the Executive Board for all divisions and operating companies each year. Budget updates take place each quarter as part of the ‘Latest Estimate’ process and are discussed on a quarterly basis between Executive Board, Global Control and Business Analysis and the Division management teams.
Risk managementThe identification and mitigation of risks that could prevent the achievement of our strategic objectives is the responsibility of all levels of management.
Budget and Latest Estimate reports include ‘critical issue reporting’ and dedicated Enterprise Risk Management (ERM) reporting that is mandatory on a biannual basis. Our ERM process, including reporting thereof, requires all operating companies to assess and report their principal risks, their likelihood, financial impact and the mitigating actions in place to address these risks. These risks are subsequently reviewed, challenged and complemented by the divisions and Global Functions. The total process is guided and overseen by the Risk Committee. The result of this process by the Risk Committee is shared and discussed with the Executive Board, the Audit Committee and the Supervisory Board.
The Risk Committee, consisting of a number of Global Directors, acts as an advisory committee to the Executive Board on all matters regarding risk management. This also includes challenging the risks reported, providing a centralized oversight of the risks identified and their mitigating actions bottom-up as well as top-down. The Risk Committee is also dedicated to creating and fostering a ‘risk conscience’ culture in a manner that is natural and acceptable to the business.
Vopak’s Risk Management Framework
• Risks identifiedby the individualterminals anddivisions
• Strategic risk discussions withglobal seniormanagement
• Global principal risks reviewedby the RiskCommittee andagreed with theExecutive Board
• Risk appetites ofall principal risksare determinedby the ExecutiveBoard andshared within theorganization
• A standard riskmanagementmethodologyfacilitatescommunicationwithin the group
• Mitigating actionsare establishedfor the identifiedrisks andreviewed by theRisk Committee
• Separate action plansare establishedand executedfor risks, whichexceed the riskappetite
• Effectiveness ofthe mitigatingactions ismonitored acrossthe three lines ofdefense
• Risk Committeereviewseffectives of riskmanagementprocess and actsas the steward ofrisk management
• The Risk Committee informsthe Executive Boardand theSupervisory Boardon the principalrisks and theeffectiveness of therisk managementprocess
4. Monitor3. Manage 5. Report1. Identify 2. Measure
Risk exposures aligned with the strategic objectives
Embedded in a risk conscious culture
104 | Vopak | Annual Report 2016In
trod
uctio
nE
xecutive B
oard
repo
rtS
torin
g vital p
rod
ucts
with
careK
ey develo
pm
ents
per d
ivision
Ad
ditio
nal in
form
ation
| Vopak | Annual Report 2016 | Internal control and risk managementFin
ancial S
tatemen
tsS
ustain
ability
Govern
ance, risk
and
com
plian
ce

Risk-reward appetiteWhen formulating the company’s strategy, the Executive Board defines an applicable risk-reward
appetite for each risk category. Our risk-reward appetite in 2016 is comparable to that of the previous year.
Our principal risks and uncertainties and how we mitigate theseThe principal risks that prevent the company from achieving its objectives are described in the following table, together with the mitigating actions applied by the company and the link to the company’s strategy. In addition to identifying our principal risks, we also recognize industry-related trends that could lead to future uncertainties. The nature of our business model is long-term, resulting in many of our risks being enduring in nature. Nonetheless, the company’s risks may develop and evolve over time due to internal and external developments. Furthermore, our risk overview should be read carefully when evaluating the company’s business model, the historical and future performance and the forward-looking statements contained in this Annual Report.
Although we consider our risk management to be effective, there can be no absolute certainty that our mitigating activities with regard to our principal risks will be effective or that other risks may be prevented from occurring. In addition, the risks described below are not the only risks that the company faces, but are based on management’s assessment of the current principal risks of the company.
Vopak’s risk-reward appetite
Risk Category (COSO) Strategic themes Vopak’s risk-reward appetite
Strategic risks • Leading assets in leading locations
Low to high: Dependent on the fit-for-purpose value creation opportunities and the corresponding future incremental expansion and growth options, the company evaluates the entrepreneurial risk-return profiles on an individual merit basis by consistently applying different metrics for different purposes.
Operational risks • Operational leadership• Service leadership• Technology leadership• People leadership
Low: on safety issues. Moderate: on other areas/topics with alignment of targets and related cost, and a clear focus on sustainable EBIT growth.
Compliance risks • Operational leadership• People leadership
Low: full compliance with legal and regulatory environments.
Financial and non-financial reporting risks
Low: full compliance with financial and non-financial reporting laws and regulations.
105Internal control and risk management |In
trod
uctio
nE
xecutive B
oard
repo
rtS
torin
g vital p
rod
ucts
with
careK
ey develo
pm
ents
per d
ivision
Su
stainab
ilityG
overnan
ce an
d co
mp
liance
Finan
cial Statem
ents
Ad
ditio
nal in
form
ation
Govern
ance, risk
and
com
plian
ce105 | Vopak | Annual Report 2016 | Internal control and risk management

Industry-related trends that may lead to uncertainties and future business risks
Risk description Mitigating actions
Strategic theme: Leading assets in leading locations
Changing markets driven by ‘trends’ continue to challenge our business agilityMarket dynamics in the energy and petrochemical landscape continue to lead to increased volatility in certain product-market combinations in different regions.
Changing markets and/or trade patterns are mainly driven by the following trends:• US shale developments• Asian growth paths• continued rationalization in the refinery and
petrochemical sector• climate change and the energy market transition
(‘de-carbonization’ trend)• geopolitical developments, volatility and lower (crude)
oil market prices
Successful execution of our strategy:Our strategy includes:• Maintaining and expanding our well-diversified global
terminal network based on our strategic criteria forterminals:• major hubs, supporting intercontinental product flows• import and distribution terminals in major markets with
structural deficits• terminals facilitating growth in global gas markets• Industrial and chemical terminals in the Americas,
the Middle East and Asia• Divesting terminals not meeting our strategic criteria,
supporting the long-term development of the company.• Continuously performing in-depth analyses of scenarios
and global trends in the markets by Global Sales andMarketing in conjunction with divisions and local teams(Vopak ‘Beyond 400’). This ensures that the company isable to timely identify developments in the markets andrespond to these developments
Increased global ‘climate change’ awareness and the energy transition lead to uncertainties, risks and opportunitiesClimate change and the de-carbonization trend in general brings uncertainties, risks and opportunities to the energy industry. The energy transition is already taking place, however, the speed and precise direction of this transition is not yet clear. Vopak aims to facilitate the market’s demand resulting from de-carbonization efforts in the energy mix towards cleaner fuels. The de-carbonization trend leads to opportunities, such as carbon capture storage and Vopak’s existing LNG activities. However, these and future developments may impact the type of infrastructure needs and locations of our terminals.
A strategic assessment program Vopak ‘Beyond 400’ (long-term impact):Our strategy includes:• Dedicated focus in considering potential energy market
changes (e.g. the future of carbon fuel) and the potentialimpact on the company via the Global Sales andMarketing department and also via the divisions andOperating companies
• Considering the potential effects and timing of the energytransition when assessing investment proposals for newterminals and expansions of existing terminals on acase-by-case basis
• Continuous assessment of the impact on Vopak and theoil and gas industry of COP21 and development of othersuch national agreements
Enhanced environmental legislationClimate change brings increased complexity to our operations and the potential risk of non-compliance in the short term. Additional investments may be required.
• Effective monitoring of (changing) compliancerequirements in place and follow up of requirements asnecessary
Rising sea levels/Extreme weather conditions These can potentially impact the ongoing operations of our terminals located in a flood-risk area leading to additional preventive investments.
• Need for additional or an adaption of floodwall protectionmeasures, quay requirements, tank construction,floodwater sewers and vapor recovery treatment systemsis monitored
• Leveraging off our global expertise and technicalknowledge to ensure optimal cost-effective solutions aresought and implemented
106 | Vopak | Annual Report 2016In
trod
uctio
nE
xecutive B
oard
repo
rtS
torin
g vital p
rod
ucts
with
careK
ey develo
pm
ents
per d
ivision
Ad
ditio
nal in
form
ation
| Vopak | Annual Report 2016 | Internal control and risk managementFin
ancial S
tatemen
tsS
ustain
ability
Govern
ance, risk
and
com
plian
ce

Risk description Mitigating actions
Strategic theme: Leading assets in leading locations
We are exposed to (crude) oil and gas market price developments leading to risks and opportunitiesThe low oil price environment provides a current opportunity for storage. Nevertheless, the long-term consequences for the overall oil and gas industry could have a less positive impact on our longer term business due to pressures in the value chain. Differences per regions are observed.
Continued strategy execution with a sound business model:• Having a well-diversified global terminal network• Development of technologies to further improve our
service offering to our customers• Active relationship management allows us to gain insight
into and anticipate the developments that our clients are facing. This allows us to provide our customers with the services that meet their current and future demands
• Appropriate pricing strategies in line with our high quality service offering
• Ensuring business partners (e.g. vendors) have a strategic intent that is aligned with our strategic direction
• Our terminals are located at strategic locations and are a vital link in the supply chain of many of our customers. We aim to continuously improve our high and reliable service levels, while striving to ensure that our terminal infrastructure is fully aligned with the demands of our customers. This ensures that customers are willing to continue to pay the current competitive fees for our services
Geopolitical developments, which are unpredictable by nature, continue to present challenges to our business going forwardGeopolitical developments can impact the development of laws and regulations and the global trade environment which consequently can lead to changing product flows. Recent geopolitical developments may lead to a trend of market protectionism potentially impacting global trade. Other geopolitical challenges that continue to impact our business are those related to Russia and the Middle East.
• Having a well-diversified global terminal network• Monitoring such geopolitical developments including
multi-disciplinary risk analyses and the impact on global trade and taking action as needed timely
107Internal control and risk management |In
trod
uctio
nE
xecutive B
oard
repo
rtS
torin
g vital p
rod
ucts
with
careK
ey develo
pm
ents
per d
ivision
Su
stainab
ilityG
overnan
ce an
d co
mp
liance
Finan
cial Statem
ents
Ad
ditio
nal in
form
ation
Govern
ance, risk
and
com
plian
ce107 | Vopak | Annual Report 2016 | Internal control and risk management

Our principal risks impacting our current and day-to-day business
Risk description Mitigating actions
Strategic theme: Operational leadership
Occurrence of a major (personal or process) safety incident and environmental riskIncidents can affect the lives and health of our staff and business partners. Our ‘License to Operate’ could be effected impacting our earnings, expose the company to potential liabilities and will most likely have an adverse effect on the company’s reputation.
Vopak gives safety the highest priority for all who work with us and at our locations.Our main mitigating actions include, but are not limited to:• Structurally embedded safety and environmental
programs such as operator skills, safety awareness (ownpersonnel and contractors) and behavioral programs andthe monitoring thereof
• Ensuring an optimal balance between manpowerrequirements and the level of activity undertaken
• Emergency preparedness / Emergency Response Plans.• Ensuring the highest asset integrity standards through
robust maintenance and sustaining capex programs• Secondary containment measures must be in place• Continued implementation of vapor treatment systems.• Implementing a consistently high safety culture
regardless of geographical location through globalactivities, such as the Global SHE Day and theVopak Fundamentals annual assessment
• Independent regular monitoring of the Vopak (Safety)fundamentals application and execution of key processesvia Terminal Health Assessment (THA) and ‘Assure’program
• Continuation of well-established Vopak safety standards,Vopak Way Standards, Vopak Fundamentals and relatedtraining programs
Strategic theme: Service leadership
Increasing competition and overcapacity could affect our market position and earnings potentialWe experience increasing competition in various regions resulting from increased storage capacity constructed by existing and new competitors. This increased capacity has the potential to put pressure on our occupancy rates, pricing and contract durations, depending on the location.
‘Newer’ terminals furthermore have the opportunity to achieve higher service levels by applying increased efficiencies.
Top quality service and cost efficiency are cornerstones of our competitive positionOur strategy includes:• Long-term focused Terminal Master Plans developed per
terminal align service requirements and investment levelsin the context of the local (competitive) environment.This ensures that terminals continue to meet ourcustomers’ demands
• Continued optimization of sustaining and improvementcapex programs leading to a re-assessment of the costbase while ensuring continued compliance with oursafety and service standards
• Carrying out focused productivity and organizationalefficiency enhancements leading to higher service quality.
• Ensuring we understand our customers’ needs andrequirements via the independent evaluation of serviceKPIs such as the: annual customer survey ‘Net PromotorScore’ and ‘Vopak Service Quality Index’
• The use of a customer satisfaction target for allemployees in our short-term incentive plans furtherembeds a customer-focused service culture
• Gaining insight into Vopak’s reputation via an independentsurvey enabling increased understanding and furtherimprovements as needed
108 | Vopak | Annual Report 2016In
trod
uctio
nE
xecutive B
oard
repo
rtS
torin
g vital p
rod
ucts
with
careK
ey develo
pm
ents
per d
ivision
Ad
ditio
nal in
form
ation
| Vopak | Annual Report 2016 | Internal control and risk managementFin
ancial S
tatemen
tsS
ustain
ability
Govern
ance, risk
and
com
plian
ce

Risk description Mitigating actions
Strategic theme: Operational leadership
Operational and Environmental compliance with increasingly complex and changing laws and regulations can be challengingPermits to operate, such as concessions from port authorities, renewals or revisions for permits and licenses for product storage from local and national governments, are essential to start or continue operating our terminals. A trend that is observed increasingly is that governments are becoming stricter, intensified by recent failings/incidents in the industry. In particular, in the more developing countries, regulations are changing frequently making monitoring thereof challenging and hence more complex in terms of compliance. This can lead to additional costs and uncertainties with respect to permit renewals and applications. More stringent demands on environmental requirements may require additional sustaining capex investments. Fines and penalties in relation to non-compliance can also be sizeable.
Operating in a compliant manner is critical• Terminal management is responsible for ensuring the
appropriate compliance processes are in place; i) up-to-date knowledge and interpretation of local laws and regulations; ii) required documentation is in place; iii) required reporting to authorities
• Division/Global support and involvement of external specialists are used when needed
• The status of permits on the critical path for project developments is actively monitored and starting the permitting process pro-actively is critical
• Special programs which safeguard that compliance has the required focus level company-wide
Strategic themes: Leading assets in leading locations / Operational leadership
Ensuring the same values are applied to business regardless of locationCultural differences, particularly in developing regions compared to a Western approach, can lead to other approaches to doing business that differ from the Vopak ‘norm’ which could be considered inappropriate and could lead to financial and reputational consequences.
Bridging regional differences is key• Vopak is an open-minded global company that embraces
and respects diversity whether this concerns culture, nationality, age, gender or beliefs, and whether this concerns Vopak personnel or business partners
• Continuous awareness and embedding of the ‘Vopak Way’ globally (for example via mailings, workshops and other official communications) despite different geographies by means of our Code of Conduct and reinforcement of Vopak Values: Care for Safety, Health and Environment, Integrity, Team spirit, Commitment and Agility
Strategic theme: Leading assets in leading locations
Large expansion projects bring complexityMost projects under development represent sizeable long-term investments and are recognized as being individually complex due to different business, engineering, financing, environmental, cultural and political circumstances. Should projects not be effectively managed in terms of cost and quality, increased costs can be detrimental to the desired end result.
• A robust multi-disciplinary (capital disciplined) investment proposal decision-making process is in place. Guidance is provided by the global departments and external experts during all stages of the project
• The company applies the standard Vopak Project Management methodology (VPM) for all large projects. VPM provides the framework for how a project is to be managed and reported (e.g. templates, risk management, organization, etc.). Usage of VPM is mandatory
• Embedded (independent) quality assurance processes (e.g. health check, project readiness reviews, post-investment reviews and lessons learned sessions at different stages of project development ensure timely rectification as needed and lessons learned are shared throughout the organization for future developments
• The introduction of Global Engineering provides a common approach and sharing of experience in developing new projects
109Internal control and risk management |In
trod
uctio
nE
xecutive B
oard
repo
rtS
torin
g vital p
rod
ucts
with
careK
ey develo
pm
ents
per d
ivision
Su
stainab
ilityG
overnan
ce an
d co
mp
liance
Finan
cial Statem
ents
Ad
ditio
nal in
form
ation
Govern
ance, risk
and
com
plian
ce109 | Vopak | Annual Report 2016 | Internal control and risk management

Risk description Mitigating actions
Strategic theme: Operational leadership
Terminal security riskThe primary consequences of an unauthorized entry into the terminal area mainly theft of product or a process incident; this could also lead to reputation risk.
Robust physical integrity processes in place• Securing the physical integrity of our terminals is a
mature requirement mandated by Vopak as well as local authorities (e.g. customs and port authorities)
• Compliance with the International Ship and Port Security Code (ISPS) mandated by the United States. Protection is assured via the implementation of physical fencing and cameras, surveillance by security officers and guards, and audits following the ISPS protocol
Strategic theme: Technology leadership
The successful development of business relevant innovations and new IT systems is critical for our business successOur strategy recognizes that Information Technology and innovation are major catalysts for bringing our services to the next level, creating process efficiencies in our business, and creating opportunities for customer service improvements and organizational changes. These initiatives are vital for maintaining long-term profitability.Our legacy systems, used by the majority of our terminals, are due to be replaced in the coming years. This provides the opportunity for ensuring not only optimal performance and business continuity but also the necessity to keep up with innovations in the industry as well as the demands of customers and supply chain partners. A global IT program (MOVES) is in place to specifically ensure that our IT ambitions are managed on time. Risks relating to the implementation of Moves are:• Potential disruption of the existing IT environment while
a new environment is being developed in parallel• Non-alignment of business and IT interests
Effective identification of company-wide needs combined with a well-structured governance and monitoring program, with strong business ownership• Vopak’s standard project methodology, Vopak Project
Management (VPM) is also in place for IT projects• Change management is recognized as a critical factor• A ‘Program Board’ acts as an advisory committee to the
ICT Board and the Executive Board ensuring both alignment and prioritization of available resources
• Pilot terminals are chosen to ‘test’ the proposed application prior to global rollout
Strategic theme: Technology leadership
Unavailability of (existing) key IT systemsOur key operating systems are currently being replaced. This replacement is managed through the MOVES program. However, it remains important to ensure that the legacy (existing) systems continue to be supported to ensure continuity of operations. Discontinuity could disrupt our service delivery and have a negative impact.
Availability of systems is top of mind• This requires prioritization of resources particularly if only
a limited group of experts possesses the required knowledge
• Continuation of legacy systems during the transition period, specifically addressed by the MOVES program
• Timely delivery of the replacement systems in line with the project planning
• Implementation of the COBIT 4 framework for IT controls and monitoring is in progress
• Business continuity plans
110 | Vopak | Annual Report 2016In
trod
uctio
nE
xecutive B
oard
repo
rtS
torin
g vital p
rod
ucts
with
careK
ey develo
pm
ents
per d
ivision
Ad
ditio
nal in
form
ation
| Vopak | Annual Report 2016 | Internal control and risk managementFin
ancial S
tatemen
tsS
ustain
ability
Govern
ance, risk
and
com
plian
ce

Risk description Mitigating actions
Strategic theme: Technology leadership
Cybercrime/ IT security breach / data protection risk (privacy regulation)Like other companies, Vopak may be vulnerable to cybersecurity attacks, including virus and malware attacks, ransomware and unauthorized access attempts.
Business interruptions or confidential data disclosures could furthermore impact our reputation, financial position, operations, and, potentially lead to costs related to recovery and forensic activities.
A (security) breach could potentially also lead to a violation of privacy regulations in the various countries where we operate, leading to potential litigation and fines.
COINS (five-year) program in place to address IT security globallyWith the increasing recognition of this potential risk, it is acknowledged that internal controls together with the software and hardware solutions protecting our IT infrastructure are critical. Several tools and processes have been established to mitigate this risk:• The appointment of a dedicated IT-risk officer who is part
of senior management and who periodically discussesthe IT-risks with the members of the Executive Board
• Rollout of our Global Information security policy• Global implementation of ISO 27001, the standard
providing the requirements of an information securitymanagement system (ISMS) and monitoring compliancethereof
• Set up of an Information Technology Control Frameworkincluding the cybersecurity controls ensuring appropriateoperation and protection of our information technologysystems
• Hiring of specialized staff with the capabilities to identify,monitor and address such risks
• Global security self-assessment performed and follow up.• Implementation of the COBIT 4 framework for IT controls
and monitoring is in progress• Vopak is in the process of enhancing its privacy
compliance framework. To this end, Vopak has laid downbinding corporate rules with further implementationtaking place during 2017
Strategic themes: Operational leadership / People leadership
Risks of non-compliance of matters not relating to operating/environmental permitsWe can be held liable for any non-compliance with laws and regulations - national and international. For example, specific laws and regulations relating to trade sanctions, privacy, anti-bribery and anti-corruption and anti-trust and anti-competition. Such risks can lead to reputational and financial consequences.
Compliance is a key focus area• The company-wide compliance organization has been
strengthened with the establishment of a complianceoffice providing global support on key compliance areas
• Our procedures and controls for ensuring compliance areupdated and communicated promptly throughout theorganization. Where needed, ‘alerts’ are sent out to bringspecific attention to topics and awareness sessions areheld at various levels of the organization
• Monitoring processes and adapting to changes (in legalsystems, regulatory controls and practices) are in place ateach terminal
• A number of policies are in place to safeguardcompliance (i.e. Whistleblower policy, Fraud Prevention,Reporting and Investigation, Anti-Corruption) andadherence is continuously supported by the Vopak Valuesand, in some cases, external parties
111Internal control and risk management |In
trod
uctio
nE
xecutive B
oard
repo
rtS
torin
g vital p
rod
ucts
with
careK
ey develo
pm
ents
per d
ivision
Su
stainab
ilityG
overnan
ce an
d co
mp
liance
Finan
cial Statem
ents
Ad
ditio
nal in
form
ation
Govern
ance, risk
and
com
plian
ce111 | Vopak | Annual Report 2016 | Internal control and risk management

Risk description Mitigating actions
Strategic theme: People leadership
Getting the right people at the right location at the right timeChallenges in general are acknowledged in recruiting, appointing and retaining staff with the required skills, competencies and experiences, in particular the more remote locations. Further increasing the diversity (gender and nationality) of our workforce is challenging.
Motivation, retention and leadership programs are key• Motivation and retention are achieved through
competitive remuneration packages and the creation ofan empowering and supportive environment, aligned withour Vopak Values
• Management programs focus on coaching, staffdevelopment and inclusiveness
• A global HR system is in place that managesperformance based on a worldwide talent-managementstrategy and leadership and management development
• Structured succession planning and effective use of thestrength of Vopak´s network ensure the requiredresources when needed
• Global identification of the talent pool within Vopak.• Fluid movement of staff between locations enables not
only experienced staff to be where needed but alsoprovides local staff with the opportunity to be coachedand trained for future leadership potential
• Monitoring takes place every two years (most recently in2016) via the Employee Engagement Survey providing anindependent assessment of how our employees feel andproviding guidance as to improvement areas
Other general risks
Financial risksThe economic developments of all companies that are relevant for our network are monitored on a regular basis. The consequences of potential risks are analyzed. Strong monitoring controls for financial and non-financial reporting are established at the divisional and global level. Natural hedges resulting from our global operations between the main currencies are continuously reviewed and measures are taken to limit currency exposure.
Our financial risks are described in detail in section 5 of the Consolidated Financial Statements.
Refinancing and liquidity risksVopak is a capital-intensive company. Vopak’s funding strategy is focused on ensuring continuous access to capital markets so that funding capital is available at a time of our choice and at acceptable cost. The development of our Senior Net Debt to EBITDA ratio is continuously monitored and discussed on a regular basis in the Strategic Finance Committee, the Executive Board, the Audit Committee and the Supervisory Board to ensure that the company remains within its covenant ratios. A clear funding policy with respect to subsidiaries and joint ventures is in place. Group liquidity requirements are monitored continuously. Long-term liquidity risks are reviewed each quarter and before every significant investment. Active cash management takes place on a daily basis.
Liquidity risks are described in more detail in section 5 of the Consolidated Financial Statements.
112 | Vopak | Annual Report 2016In
trod
uctio
nE
xecutive B
oard
repo
rtS
torin
g vital p
rod
ucts
with
careK
ey develo
pm
ents
per d
ivision
Ad
ditio
nal in
form
ation
| Vopak | Annual Report 2016 | Internal control and risk managementFin
ancial S
tatemen
tsS
ustain
ability
Govern
ance, risk
and
com
plian
ce

Tax and tax-related risksVopak operates terminals and other activities in 25 different countries. As tax laws and regulations differ per country and can be complex, the company runs the inherent risk of non-compliance with the local tax legislation and the tax policy of the company. Vopak’s Key Control Framework has a dedicated section stipulating the internal controls which are addressing the risks related to tax and which enforce compliance with the group tax policy. Furthermore, the highly skilled tax experts at the Global Tax department assist local and divisional management in complying with the tax requirements and monitor effectiveness of the internal controls relating to tax as well as the tax position of the group.
Insurable risksA general business risk exists that losses could be suffered due to inappropriate coverage of the incident by third-party insurers. Our Global Insurance Policy aims to strike the right balance between arranging insurance to cover Vopak’s risks and financing adverse implications ourselves. The principal factors underlying our insurance policy are risk tolerance and risk transfer costs. On this basis, Vopak has purchased world-wide insurance cover for a wide range of risks, such as environmental and third-party liability, property damage and business interruption. Covering reasonably expected exposures. The financial credit ratings of the insurance companies involved are reviewed on a regular basis and,where appropriate, risks are spread across several insurance companies.
113Internal control and risk management |In
trod
uctio
nE
xecutive B
oard
repo
rtS
torin
g vital p
rod
ucts
with
careK
ey develo
pm
ents
per d
ivision
Su
stainab
ilityG
overnan
ce an
d co
mp
liance
Finan
cial Statem
ents
Ad
ditio
nal in
form
ation
Govern
ance, risk
and
com
plian
ce113 | Vopak | Annual Report 2016 | Internal control and risk management

In EUR 2016 2015
Share price at 1 January 39.67 43.09
Highest share price 48.89 54.12
Average share price 44.08 44.02
Lowest share price 36.17 34.47
Share price at 31 December 44.88 39.67
Free float 51.5% 51.6%
Average number of shares traded per day 338,318 422,273
Market capitalization at year-end 5,737,254,098 5,071,231,508
Share price movement in 2016In %
70
80
90
100
110
120
130
Jan. Feb. Mar. Apr. May Jun. Jul. Aug. Sept. Oct. Nov. Dec.
Euronext Amsterdam AEX Index Vopak
Share price movement 2003 - 2016 In EUR
0
10
20
30
40
50
60
2003 2004 2005 2006 2007 2008 2009 2010 2011 2012 2013 2014 2015 2016
Shareholder information
114 | Vopak | Annual Report 2016In
trod
uctio
nE
xecutive B
oard
repo
rtS
torin
g vital p
rod
ucts
with
careK
ey develo
pm
ents
per d
ivision
Ad
ditio
nal in
form
ation
Finan
cial Statem
ents
Su
stainab
ilityG
overnan
ce, risk an
d co
mp
liance
| Vopak | Annual Report 2016
Shareholder informationShareholder information

Information per ordinary share of EUR 0.50
In EUR 2016 2015
Basic earnings 4.19 2.21
Basic earnings -excluding exceptional items- 2.56 2.55
Diluted earnings 4.18 2.21
Diltuted earnings -excluding exceptional items- 2.55 2.55
Equity attributable to holders of ordinary shares 18.83 15.75
Dividend (proposal 2016) 1.05 1.00
Payout ratio -excluding exceptional items- 41% 39%
Shares outstanding
2016 2015
Basic weighted average number of ordinary shares 127,498,822 127,622,305
Weighted average number of ordinary shares including dilutive effect 127,715,702 127,761,760
Number of ordinary shares at year-end 127,835,430 127,835,430
Total number of shares outstanding 127,835,430 127,835,430
Ordinary shares 1) 127,465,430 127,545,430
Total voting rights at year-end 127,465,430 127,545,430
1. Excluding treasury shares in 2016: 370,000 and in 2015: 290,000.
Investor RelationsVopak is transparent and non-discriminatory in disclosing information to investors and other stakeholders. A separate agreement on information sharing has been made with our major shareholder HAL Holding N.V. Reference is made to note 6.3 of the Consolidated Financial Statements for more information. Our objective is to provide information to stakeholders about developments at Vopak and to ensure that this information is equally and simultaneously accessible to all parties. Information is disclosed through annual and half-year reports, interim updates, press releases, presentations, which are all available on the Vopak website. Members of the Executive Board together with the Investor Relations team held approximately 300 meetings during (reverse) roadshows and conferences with shareholders as well as interested investors during 2016. In addition, a two-day Capital Markets Day event was organized in Singapore and Malaysia in order to provide an update on the strategy execution of Vopak. Vopak held press conferences coinciding with the publication of its annual and half-year results, and organized meetings with financial analysts following the publication of the annual and half-year results. The publication of first and third quarter results was followed by a telephone conference with analysts. These sessions could be attended via the company’s website in either a video or audio webcast, and information presented at these meetings was also published on the company’s website. Vopak complies with the rules and regulations of the Dutch Financial Markets Authority (AFM) and International Financial Reporting Standards (IFRS), as endorsed by the European Union, in all its publications. Stock exchange listingVopak shares are listed on the Euronext stock exchange in Amsterdam, the Netherlands, and Vopak is a constituent of the Amsterdam Exchange Index (AEX), ticker symbol VPK (ISIN no. NL0009432491). Options on Vopak shares are also traded on Euronext Amsterdam. Silent periodsSilent periods are the periods prior to the publication of financial results. In principle, no meetings are held with and no presentations are given to financial analysts and investors during this period.
No other communication with analysts and investors takes place, unless it relates to the factual clarification of previously disclosed information. The length of the silent period is four weeks prior to full-year results (and publication of the Annual Report), the half-year results and Q1 and Q3 interim updates.
115Shareholder information |In
trod
uctio
nE
xecutive B
oard
repo
rtS
torin
g vital p
rod
ucts
with
careK
ey develo
pm
ents
per d
ivision
Su
stainab
ilityG
overnan
ce an
d co
mp
liance
Finan
cial Statem
ents
Ad
ditio
nal in
form
ation
Govern
ance, risk
and
com
plian
ce115 | Vopak | Annual Report 2016 | Shareholder information

Bilateral contractsVopak may engage in bilateral contacts with existing and potential shareholders. The main objective would be to explain Vopak’s strategy and operational performance and answer questions. Vopak takes the Dutch Corporate Governance Code (December 2008) into account when engaging in bilateral contacts with shareholders.
The following guidelines have been established:• A dialogue with shareholders outside the context of a formal shareholders’ meeting can be useful for both
investors and Vopak• Vopak reserves the right to determine, at its sole discretion, whether it will accept invitations from
shareholders, or parties representing shareholders, to engage in such a dialogue. Vopak may ask for furtherclarification of the views, aims and investment objectives of such shareholders before accepting or rejectingany invitation to engage in a dialogue outside the context of a formal shareholders’ meeting
• Vopak communicates as openly as possible to maximize transparency• Responses to third-party publications, such as analyst reports or draft reports, are only given by referring to
public information and published guidance. Comments on these reports are given only with regard toincorrect factual information
• Vopak’s contacts with investors and sell-side analysts will at all times comply with the applicable rules andregulations, in particular those concerning selective disclosure, price sensitive information and equaltreatment
Dividend policyBarring exceptional circumstances, the principle underlying Vopak’s dividend policy for ordinary shares is to pay an annual cash dividend of 25% to 50% of the net profit -excluding exceptional items- attributable to holders of ordinary shares.
The net profit -excluding exceptional items-, which is the basis for dividend payments, may be adjusted for the financial effects of one-off events such as changes in accounting policies, acquisitions, divestments or reorganizations.
In setting the dividend amount, Vopak takes into account the target capital ratios and financing structure, as well as the flexibility that it requires to successfully pursue its growth strategy. At the same time, Vopak aims to pursue a consistent dividend policy for its shareholders.
Investors and their advisors can put their questions directly to Chiel Rietvelt, Head of Investor Relations:Telephone: +31 (0)10 400 2776E-mail: [email protected]
Royal Vopak shareholdersPursuant to the Financial Supervision Act, a shareholding of 3% or more in a Dutch company must be disclosed. Vopak has received the following notifications concerning such holdings of shares as at February 2017.
Ordinary shareholdings
Date of notification
HAL Trust 48.15% 01-01-15
Oppenheimer Funds, Incl. 4.27% 01-01-15
116 | Vopak | Annual Report 2016In
trod
uctio
nE
xecutive B
oard
repo
rtS
torin
g vital p
rod
ucts
with
careK
ey develo
pm
ents
per d
ivision
Ad
ditio
nal in
form
ation
| Vopak | Annual Report 2016 | Shareholder informationFin
ancial S
tatemen
tsS
ustain
ability
Govern
ance, risk
and
com
plian
ce

Geographical distribution of holders of ordinary shares outstanding
52%
18%
7%
13%
4%6 %
2016
53 %
17%
9%
11%
4%6 %
The Netherlands United States and Canada United Kingdom
Rest of world UnidentifiedRest of Europe
2015
Financial calendar
2017 201817 February 2017 Publication of 2016 annual results 16 February 2018 Publication of 2017 annual results
19 April 2017 Publication of 2017 first-quarter results 18 April 2018 Publication of 2018 first-quarter results
19 April 2017 Annual General Meeting 18 April 2018 Annual General Meeting
21 April 2017 Ex-dividend quotation 20 April 2018 Ex-dividend quotation
24 April 2017 Dividend record date 23 April 2018 Dividend record date
26 April 2017 Dividend payment date 25 April 2018 Dividend payment date
25 August 2017 Publication of 2017 half-year results 17 Augustus 2018 Publication of 2018 half-year results
6 November 2017 Publication of 2017 third-quarter results 5 November 2018 Publication of 2018 third-quarter results
117Shareholder information |In
trod
uctio
nE
xecutive B
oard
repo
rtS
torin
g vital p
rod
ucts
with
careK
ey develo
pm
ents
per d
ivision
Su
stainab
ilityG
overnan
ce an
d co
mp
liance
Finan
cial Statem
ents
Ad
ditio
nal in
form
ation
Govern
ance, risk
and
com
plian
ce117 | Vopak | Annual Report 2016 | Shareholder information

Financial StatementsConsolidated Financial Statements
Company Financial Statements
Other relevant documents
Executive Board declaration
Independent auditor’s report
Assurance report of the independent auditor
Intro
du
ction
Execu
tive Bo
ard rep
ort
Sto
ring
vital pro
du
cts w
ith care
Key d
evelop
men
ts p
er divisio
nS
ustain
ability
Govern
ance, risk
and
com
plian
ceA
dd
ition
al info
rmatio
nFin
ancial S
tatemen
ts
Financial Statements

Consolidated Financial Statements and notesConsolidated Financial Statements 120Consolidated Statement of Income 120Consolidated Statement of Comprehensive Income 121Consolidated Statement of Financial Position 122Consolidated Statement of Changes in Equity 123Consolidated Statement of Cash Flows 124
Section 1 Basis of preparation 125Note 1.1 Basis of preparation 125
Section 2 Group operating performance 130Note 2.1 Segment information 130Note 2.2 Exceptional items 132Note 2.3 Revenues 133Note 2.4 Other operating income 134Note 2.5 Personnel expenses 134Note 2.6 Other operating expenses 135Note 2.7 Result of joint ventures and associates 137Note 2.8 Translation and operational currency risk 137Note 2.9 Cash flows from operating activities (gross) 138
Section 3 Strategic investments and divestments 139Note 3.1 Acquisition and divestment of subsidiaries 139Note 3.2 Intangible assets 141Note 3.3 Property, plant and equipment 142Note 3.4 Joint ventures and associates 144Note 3.5 Assets held for sale 148Note 3.6 Depreciation and amortization 149Note 3.7 Impairment tests and impairments 150
Section 4 Working capital 155Note 4.1 Changes in working capital 155Note 4.2 Trade and other receivables and related
credit risk 155Note 4.3 Trade and other payables 156
Section 5 Capital structure 157Note 5.1 Issued capital, share premium, treasury
shares and capital management 157Note 5.2 Other reserves 158Note 5.3 Retained earnings 159Note 5.4 Non-controlling interests 159Note 5.5 Interest-bearing loans and net debt 160Note 5.6 Liquidity risk 162Note 5.7 Currency risk 164Note 5.8 Interest rate risk 166Note 5.9 Derivative financial instruments 168Note 5.10 Net finance costs 169
Section 6 Governance 171Note 6.1 Remuneration of Board members 171Note 6.2 Long-term incentive plans (LTIPs) 171Note 6.3 Related parties 174Note 6.4 Fees paid to auditors appointed at the
Annual General Meeting 174
Section 7 Income taxes 176Note 7.1 Income taxes 176Note 7.2 Deferred taxes 178
Section 8 Other disclosures 180Note 8.1 Earnings per ordinary share - number of
shares 180Note 8.2 Loans granted and finance lease receivable 181Note 8.3 Other non-current assets 181Note 8.4 Pensions and other employee benefits 181Note 8.5 Provisions 187Note 8.6 Operating leases 189Note 8.7 Investment commitments undertaken 189Note 8.8 Contingent assets and contingent liabilities 189Note 8.9 Financial assets and liabilities and credit risk 190Note 8.10 New standards and interpretations not yet
implemented 192Note 8.11 Principal subsidiaries, joint ventures and
associates 193Note 8.12 Subsequent events 195
Intro
du
ction
Execu
tive Bo
ard rep
ort
Sto
ring
vital pro
du
cts w
ith care
Key d
evelop
men
ts p
er divisio
nS
ustain
ability
Govern
ance, risk
and
com
plian
ceFin
ancial S
tatemen
tsA
dd
ition
al info
rmatio
nFin
ancial S
tatemen
ts
Intro
du
ction
Execu
tive Bo
ard rep
ort
Sto
ring
vital pro
du
cts w
ith care
Key d
evelop
men
ts p
er divisio
nS
ustain
ability
Govern
ance, risk
and
com
plian
ceFin
ancial S
tatemen
tsA
dd
ition
al info
rmatio
nFin
ancial S
tatemen
ts

Consolidated Financial StatementsConsolidated Statement of Income
In EUR millions Note 2016 2015
Revenues 2.3 1,346.9 1,386.0
Other operating income 2.4 303.2 106.1
Total operating income 1,650.1 1,492.1
Personnel expenses 2.5 342.2 358.3
Depreciation and amortization 3.6 263.9 256.0
Impairment 3.7 5.7 3.7
Other operating expenses 2.6 338.9 378.9
Total operating expenses 950.7 996.9
Operating profit 699.4 495.2
Result of joint ventures and associates using the equity method 2.7 59.9 54.0
Group operating profit (EBIT) 759.3 549.2
Interest and dividend income 5.10 11.4 10.7
Finance costs 5.10 - 118.6 - 115.9
Net finance costs - 107.2 - 105.2
Profit before income tax 652.1 444.0
Income tax 7.1 - 72.5 - 117.3
Net profit 579.6 326.7
Net profit attributable to non-controlling interests 5.4 - 45.6 - 44.5
Net profit attributable to holders of ordinary shares 534.0 282.2
Basic earnings per ordinary share (in EUR) 8.1 4.19 2.21
Diluted earnings per ordinary share (in EUR) 8.1 4.18 2.21
120 | Vopak | Annual Report 2016In
trod
uctio
nE
xecutive B
oard
repo
rtS
torin
g vital p
rod
ucts
with
careK
ey develo
pm
ents
per d
ivision
Su
stainab
ilityG
overnan
ce, risk an
d co
mp
liance
Finan
cial Statem
ents
Ad
ditio
nal in
form
ation
Finan
cial Statem
ents
| Vopak | Annual Report 2016
Consolidated Financial StatementsConsolidated Financial Statements

121Consolidated Financial Statements |In
trod
uctio
nE
xecutive B
oard
repo
rtS
torin
g vital p
rod
ucts
with
careK
ey develo
pm
ents
per d
ivision
Su
stainab
ilityG
overnan
ce, risk an
d co
mp
liance
Finan
cial Statem
ents
Ad
ditio
nal in
form
ation
Finan
cial Statem
ents
121 | Vopak | Annual Report 2016 | Consolidated Financial Statements
Consolidated Statement of Comprehensive Income
In EUR millions Note 2016 2015
Net profit 579.6 326.7
Exchange differences on translation of foreign operations 5.2, 5.4 37.7 50.6
Net investment hedges 5.2 - 18.2 - 65.2Use of exchange rate differences on translation of foreign operations and use of net investment hedges 5.2, 5.4 0.5 0.8
Effective portion of changes in fair value of cash flow hedges 5.2 - 0.8 26.2
Use of effective portion of cash flow hedges to statement of income 5.2 - 5.5 - 5.1
Share in other comprehensive income of joint ventures and associates 5.2 - 1.1 13.3Other comprehensive income that may be reclassified to statement of income in subsequent periods 12.6 20.6
Remeasurement of defined benefit plans 5.3, 7.2, 8.4 - 26.2 72.2Other comprehensive income that will not be reclassified to statement of income in subsequent periods - 26.2 72.2
Other comprehensive income, net of tax - 13.6 92.8
Total comprehensive income 566.0 419.5
Attributable to:
Holders of ordinary shares 518.7 369.9
Non-controlling interests 47.3 49.6
Total comprehensive income 566.0 419.5
Items are disclosed net of tax. The income tax relating to each component of other comprehensive income is disclosed in note 7.1.

122 | Vopak | Annual Report 2016In
trod
uctio
nE
xecutive B
oard
repo
rtS
torin
g vital p
rod
ucts
with
careK
ey develo
pm
ents
per d
ivision
Su
stainab
ilityG
overnan
ce, risk an
d co
mp
liance
Ad
ditio
nal in
form
ation
| Vopak | Annual Report 2016 | Consolidated Financial StatementsFin
ancial S
tatemen
ts
Consolidated Statement of Financial Position
In EUR millions Note 31-Dec-16 31-Dec-15
ASSETSIntangible assets 3.2 145.8 89.8
Property, plant and equipment 3.3 3,553.0 3,496.0
- Joint ventures and associates 3.4 1,091.7 1,068.1
- Finance lease receivable 8.2 30.5 29.3
- Loans granted 8.2 14.5 9.8
- Other financial assets 1.1 1.0
Financial assets 1,137.8 1,108.2
Deferred taxes 7.2 15.7 13.9
Derivative financial instruments 5.9 94.2 119.4
Other non-current assets 8.3 27.5 28.6
Total non-current assets 4,974.0 4,855.9
Trade and other receivables 4.2 224.6 232.0
Loans granted 8.2 – 85.9
Prepayments 16.4 14.2
Derivative financial instruments 5.9 35.9 16.5
Cash and cash equivalents 5.5 306.0 109.9
Assets held for sale 3.5 25.1 182.8
Total current assets 608.0 641.3
Total assets 5,582.0 5,497.2
EQUITYIssued capital 5.1 63.9 63.9
Share premium 5.1 194.4 194.4
Treasury shares 5.1 - 13.2 - 9.4
Other reserves 5.2 - 121.5 - 127.7
Retained earnings 5.3 2,276.1 1,888.2
Equity attributable to owners of parent 2,399.7 2,009.4
Non-controlling interests 5.4 159.3 151.0
Total equity 2,559.0 2,160.4
LIABILITIESInterest-bearing loans 5.5 1,938.7 2,304.0
Derivative financial instruments 5.9 71.2 91.7
Pensions and other employee benefits 8.4 169.0 126.1
Deferred taxes 7.2 221.3 206.2
Provisions 8.5 23.8 26.1
Other non-current liabilities 28.8 7.5
Total non-current liabilities 2,452.8 2,761.6
Bank overdrafts and short-term borrowings 5.5 8.5 98.6
Interest-bearing loans 5.5 163.0 2.9
Derivative financial instruments 5.9 11.0 8.1
Trade and other payables 4.3 302.1 308.7
Taxes payable 47.9 64.1
Pensions and other employee benefits 8.4 1.5 1.5
Provisions 8.5 36.2 28.1
Liabilities related to assets held for sale 3.5 - 63.2
Total current liabilities 570.2 575.2
Total liabilities 3,023.0 3,336.8
Total equity and liabilities 5,582.0 5,497.2

123Consolidated Financial Statements |In
trod
uctio
nE
xecutive B
oard
repo
rtS
torin
g vital p
rod
ucts
with
careK
ey develo
pm
ents
per d
ivision
Su
stainab
ilityG
overnan
ce, risk an
d co
mp
liance
Finan
cial Statem
ents
Ad
ditio
nal in
form
ation
Finan
cial Statem
ents
123 | Vopak | Annual Report 2016 | Consolidated Financial Statements
Consolidated Statement of Changes in Equity
Equity attributable to owners of parent
In EUR millions NoteIssued capital
Share premium
Treasury shares
Other reserves
Retained earnings Total
Non- controlling
interestsTotal
equity
Balance at 31 December 2014 63.9 194.4 - 6.5 - 143.0 1,649.4 1,758.2 144.6 1,902.8
Net profit – – – – 282.2 282.2 44.5 326.7Other comprehensive income, net of tax – – – 15.5 72.2 87.7 5.1 92.8
Total comprehensive income – – – 15.5 354.4 369.9 49.6 419.5
Dividend paid in cash 5.3, 5.4 – – – – - 118.1 - 118.1 - 52.0 - 170.1
Capital injection 5.4 – – – – – – 8.8 8.8
Purchase treasury shares 5.1 – – - 2.9 – – - 2.9 – - 2.9
Release revaluation reserve 5.2, 5.3 – – – - 0.2 0.2 – – –Measurement of equity-settled share-based payment arrangements 5.3, 6.2 – – – – 2.3 2.3 – 2.3
Total transactions with owners – – - 2.9 - 0.2 - 115.6 - 118.7 - 43.2 - 161.9
Balance at 31 December 2015 63.9 194.4 - 9.4 - 127.7 1,888.2 2,009.4 151.0 2,160.4
Net profit – – – – 534.0 534.0 45.6 579.6Other comprehensive income, net of tax – – – 10.9 - 26.2 - 15.3 1.7 - 13.6
Total comprehensive income – – – 10.9 507.8 518.7 47.3 566.0
Dividend paid in cash 5.3, 5.4 – – – – - 127.5 - 127.5 - 41.3 - 168.8
Capital injection 5.4 – – – – – – 2.3 2.3
Purchase treasury shares 5.1 – – - 3.8 – – - 3.8 – - 3.8
Release revaluation reserve 5.2, 5.3 – – – - 4.7 4.7 – – –Measurement of equity-settled share-based payment arrangements 5.3, 6.2 – – – – 2.9 2.9 – 2.9
Total transactions with owners – – - 3.8 - 4.7 - 119.9 - 128.4 - 39.0 - 167.4
Balance at 31 December 2016 63.9 194.4 - 13.2 - 121.5 2,276.1 2,399.7 159.3 2,559.0

124 | Vopak | Annual Report 2016In
trod
uctio
nE
xecutive B
oard
repo
rtS
torin
g vital p
rod
ucts
with
careK
ey develo
pm
ents
per d
ivision
Su
stainab
ilityG
overnan
ce, risk an
d co
mp
liance
Ad
ditio
nal in
form
ation
| Vopak | Annual Report 2016 | Consolidated Financial StatementsFin
ancial S
tatemen
ts
Consolidated Statement of Cash Flows
In EUR millions Note 2016 2015
Cash flows from operating activities (gross) 2.9 783.2 867.2
Interest received 5.10 3.0 4.4
Dividend received 5.10 1.0 1.0
Income tax paid - 70.9 - 104.6
Cash flows from operating activities (net) 716.3 768.0
Investments:
Intangible assets 3.2 - 16.2 - 11.4
Property, plant and equipment 3.3 - 328.0 - 335.5
Joint ventures and associates 3.4 - 74.3 - 121.5
Loans granted 8.2 - 3.3 - 101.9
Other non-current assets - 0.1 - 0.2
Acquisitions of subsidiaries, including goodwill 3.1 - 20.5 –
Acquisitions of joint ventures and associates 3.4 – - 10.6
Total investments - 442.4 - 581.1
Disposals and repayments:
Property, plant and equipment 3.3 10.5 2.0
Loans granted 8.2 85.9 20.8
Finance lease receivable 8.2 5.0 10.1
Assets held for sale/divestments 3.1 464.6 297.6
Total disposals and repayments 566.0 330.5
Cash flows from investing activities (excluding derivatives) 123.6 - 250.6
Settlement of derivatives (net investment hedges) - 8.9 - 25.9
Cash flows from investing activities (including derivatives) 114.7 - 276.5
Financing:
Proceeds from interest-bearing loans 5.5 4.0 81.6
Settlement of derivative financial instruments – 9.0
Proceeds and repayments in short-term financing 5.5 - 58.4 - 175.5
Repayment of interest-bearing loans 5.5 - 273.3 - 154.7
Finance costs paid - 101.9 - 106.8
Dividend paid in cash 5.3 - 127.5 - 114.8
Dividend paid to non-controlling interests 5.4 - 41.3 - 52.0
Dividend paid on financing preference shares 5.3 – - 3.3
Paid share premium financing preference shares – - 23.3
Withdrawal financing preference shares 5.1 – - 20.7
Purchase treasury shares 5.1 - 3.8 - 2.9
Cash flows from financing activities - 602.2 - 563.4
Net cash flows 228.8 - 71.9
Exchange differences 1.7 1.3
Net change in cash and cash equivalents due to assets held for sale – - 0.7
Net change in cash and cash equivalents (including bank overdrafts) 230.5 - 71.3
Net cash and cash equivalents (including bank overdrafts) at 1 January 67.3 138.6
Net cash and cash equivalents (including bank overdrafts) at 31 December 5.5 297.8 67.3

125Consolidated Financial Statements |In
trod
uctio
nE
xecutive B
oard
repo
rtS
torin
g vital p
rod
ucts
with
careK
ey develo
pm
ents
per d
ivision
Su
stainab
ilityG
overnan
ce, risk an
d co
mp
liance
Finan
cial Statem
ents
Ad
ditio
nal in
form
ation
Finan
cial Statem
ents
125 | Vopak | Annual Report 2016 | Consolidated Financial Statements
Section 1 Basis of preparationTaking into account the characteristics of Vopak’s business, the notes have been grouped into eight thematic sections rather than in consecutive order based on line items in the Consolidated primary statements. Each note of a section starts with the Group’s accounting policies as well as the critical accounting estimates and judgments made.
This section contains the disclosures relevant for understanding the basis of preparation of the Consolidated financial statements:• Reporting entity• Statement of compliance• Functional and presentation currency• Basis of measurement• Changes in accounting policies for 2016• Going concern• Basis of consolidation• Foreign currency translation• Hyperinflation accounting• Accounting policies, not attributable to a specific section• Use of key accounting estimates and judgments• Financial risk management
Note 1.1 Basis of preparation
Reporting entityKoninklijke Vopak N.V. (Royal Vopak) has its registered office in Rotterdam (the Netherlands). Vopak is listed on the Euronext Amsterdam. The Consolidated financial statements of the company for the year ending on 31 December 2016 contain the financial figures of the company and its subsidiaries (jointly referred to as the ‘Group’), as well as the interests of the Group in joint ventures and associates.
Vopak is the world’s leading independent tank storage provider, specialized in the storage and handling of liquid chemicals, gases and oil products.
Statement of complianceThe Consolidated financial statements have been prepared in accordance with the International Financial Reporting Standards (IFRS) as adopted by the European Union (EU) and also comply with the financial reporting requirements included in Part 9 of Book 2 of the Dutch Civil Code, as far as applicable. The accounting policies based on IFRS, as described in this section, have been applied consistently for the years presented by all entities. There were no material changes in the accounting policies applied compared to the previous year.
The financial statements were approved by the Executive Board and the Supervisory Board on 16 February 2017 and are subject to adoption by the shareholders during the Annual General Meeting.
Functional and presentation currencyThe Consolidated financial statements are presented in euros (EUR), which is Vopak’s functional and presentation currency. All amounts are presented in EUR million and have been rounded to the nearest EUR 100k, unless otherwise indicated.
Basis of measurementThe Consolidated financial statements are based on the historical cost basis except for the following assets and liabilities, which are measured at fair value: derivative financial instruments, financial assets available for sale, assets held for sale (when measured at fair value less cost of disposal) and defined benefit pension plans (plan assets measured at fair value).
Changes in accounting policies for 2016The Group has not applied any new accounting standards in 2016.
Several IFRS amendments apply for the first time in 2016; however, these do not materially impact the Group’s Consolidated financial statements.

126 | Vopak | Annual Report 2016In
trod
uctio
nE
xecutive B
oard
repo
rtS
torin
g vital p
rod
ucts
with
careK
ey develo
pm
ents
per d
ivision
Su
stainab
ilityG
overnan
ce, risk an
d co
mp
liance
Ad
ditio
nal in
form
ation
| Vopak | Annual Report 2016 | Consolidated Financial StatementsFin
ancial S
tatemen
ts
Going concernThe Executive Board has assessed the going concern assumptions, during the preparation of the Group’s Consolidated financial statements. The Executive Board believes that no events or conditions give rise to doubt about the ability of the Group to continue in operation in the next reporting period. This conclusion is drawn based on knowledge of the Group, the estimated economic outlook and identified risks and uncertainties in relation thereto. Furthermore, this conclusion is based on a review of the budget, including expected developments in liquidity and capital, current credit facilities available including contractual and expected maturities and covenants. Consequently, it has been concluded that it is reasonable to apply the going concern concept as the underlying assumption for the financial statements.
Basis of consolidationSubsidiaries are entities controlled by the Group. Vopak controls an entity when it is exposed to, or has rights to, variable returns from its involvement with the entity and has the ability to affect those returns through its power over the entity. The financial statements of subsidiaries are included in the Consolidated financial statements from the date on which control commences until the date on which control ceases, using consistent accounting policies.
Non-controlling interests in equity and in results are presented separately. Transactions with non-controlling interests that do not result in loss of control are accounted for as transactions with shareholders. For purchases of non-controlling interests, the difference between any consideration paid and the relevant share acquired of the carrying value of the net asset of the subsidiary is recorded directly in equity. Gains or losses on disposals of non-controlling interests are also recorded directly in equity.
Upon initial recognition, a non-controlling interest is measured either at its proportionate interest in the fair value of the net assets acquired or full fair value, which is elected on a transaction-by-transaction basis.
The Group’s interests in equity-accounted investees comprise interests in joint ventures and associates.
A joint venture is an arrangement in which the Group has joint control, whereby the Group has rights to the net assets of the arrangement, rather than rights to its assets and obligations for its liabilities. Associates are entities in which the Group has significant influence, but no control or joint control, over the financial and operating policies.
Upon loss of control, the Group derecognizes the assets and liabilities of the subsidiary, any non-controlling interests and the other components of equity related to the subsidiary. Any surplus or deficit arising on the loss of control is recognized in profit or loss.
When the Group ceases to consolidate or equity account for an investment because of a loss of control, joint control or significant influence, any retained interest in the entity is remeasured to its fair value with the change in carrying amount recognized in profit or loss. This fair value becomes the initial carrying amount for the purpose of subsequently accounting for the retained interest as an associate, joint venture or financial asset. In addition, any amounts previously recognized in other comprehensive income are reclassified to the income statement.
If the ownership interest in a joint venture or an associate is reduced but joint control or significant influence is retained, only a proportionate share of the amounts previously recognized in other comprehensive income is reclassified to profit or loss where appropriate.
Transactions eliminated on consolidation: all inter-company balances and transactions, including unrealized gains and losses on transactions, are eliminated on consolidation. Unrealized gains arising from transactions with joint ventures and associates are eliminated to the extent of the Group’s interest in the equity. Unrealized losses are eliminated in the same manner as unrealized gains, but only to the extent that there is no evidence of impairment.
For a list of the principal subsidiaries, joint ventures and associates, reference is made to note 8.11 of this report.

127Consolidated Financial Statements |In
trod
uctio
nE
xecutive B
oard
repo
rtS
torin
g vital p
rod
ucts
with
careK
ey develo
pm
ents
per d
ivision
Su
stainab
ilityG
overnan
ce, risk an
d co
mp
liance
Finan
cial Statem
ents
Ad
ditio
nal in
form
ation
Finan
cial Statem
ents
127 | Vopak | Annual Report 2016 | Consolidated Financial Statements
Foreign currency translationItems included in the financial statements of each of the Group’s entities are measured using the currency of the primary economic environment in which the entity operates (‘the functional currency’).
Foreign currency transactions are translated into the functional currency using the exchange rate at the dates of the transactions or valuation where items are remeasured. Foreign exchange gains and losses resulting from the settlement of such transactions and from the translation at year-end exchange rates of monetary assets and liabilities denominated in foreign currencies are recognized in the statement of income, except when deferred in other comprehensive income as qualifying cash flow hedges and net investment hedges.
Upon consolidation, the assets and liabilities of non-euro entities, including goodwill and fair value adjustments at the time of the acquisition, are translated into euros at the year-end rates of exchange (closing exchange rates). The items of the statement of income of foreign activities, excluding foreign operations in hyperinflationary economies, are translated at the average exchange rates for the reporting period. The resulting translation differences of the net investments in foreign activities are recognized as foreign currency translation reserve (translation reserve) within other comprehensive income. The same applies to exchange differences arising from loans drawn and other financial instruments to the extent that these hedge the currency risk related to the net investment.
Upon disposal of all or part of an interest in an entity, or upon liquidation of an entity, cumulative currency translation differences related to that entity are recognized in the income statement. When the Group disposes of only part of its interest in a subsidiary with a foreign operation, while retaining control, the relevant portion of the cumulative amount is not transferred to profit or loss but reattributed to non-controlling interests. Upon disposal of a foreign activity with a non-controlling interest, the cumulative amount relating to the non-controlling interests shall be derecognized, but shall not be reclassified to profit or loss. A share capital or share premium distribution by an entity is not considered to be a partial disposal when the Group retains its relative share in the entity.
The following main exchange rates are used in the financial statements:
Closing exchange rate Average exchange rate
EUR 1.00 is equivalent to 2016 2015 2016 2015
US dollar 1.05 1.09 1.11 1.11
Singapore dollar 1.52 1.54 1.53 1.53
Chinese yuan 7.34 7.09 7.35 6.98
Australian dollar 1.45 1.49 1.49 1.48
Brazilian real 3.43 4.30 3.85 3.69
The results and financial position of our terminal in Venezuela are translated from bolivar to euros for the reporting periods presented based on the closing exchange rate at year-end applied by the company because the entity has the currency of a hyperinflationary economy, the bolivar, as its functional currency.
Hyperinflation accountingVopak applies hyperinflation accounting only for the terminal in Venezuela. The effects of this hyperinflation accounting on the consolidated financial figures of the Group are limited. The operations in Venezuela represent an insignificant part of the total assets and the Group operating profit of Vopak. The terminal in Venezuela is fully licensed, operates in accordance with the Vopak Standards and has a solid performance.
The index used to apply hyperinflation accounting is the monthly Consumer Price Index (‘CPI’) published by the Banco Central de Venezuela.

128 | Vopak | Annual Report 2016In
trod
uctio
nE
xecutive B
oard
repo
rtS
torin
g vital p
rod
ucts
with
careK
ey develo
pm
ents
per d
ivision
Su
stainab
ilityG
overnan
ce, risk an
d co
mp
liance
Ad
ditio
nal in
form
ation
| Vopak | Annual Report 2016 | Consolidated Financial StatementsFin
ancial S
tatemen
ts
Accounting policies, not attributable to a specific sectionThe Group’s significant accounting policies are described in the relevant individual notes to the Consolidated financial statements or otherwise stated below. A list of the notes is shown in the table of contents preceding the financial statements.
Offsetting of financial instrumentsFinancial assets and liabilities are offset and the net amount is reported in the balance sheet when there is a legally enforceable right to offset the recognized amounts and there is an intention to settle on a net basis or realize the asset and settle the liability simultaneously.
Cash flow statementThe cash flow statement is prepared based on the indirect method. Cash flows denominated in foreign currencies are translated at average exchange rates. Exchange and translation gains and losses on cash and cash equivalents (including current liabilities arising from credit facilities) are presented separately.
The Consolidated statement of cash flows shows the Group’s cash flows from operating, investing and financing activities for the year.
Use of key accounting estimates and judgmentsPreparing the Consolidated financial statements means that the Group must use insights, estimates and assumptions that could affect the reported assets and liabilities and the information provided on contingent assets and liabilities as at the statement of financial position date as well as the reported income and expenses. The actual results may ultimately differ from these estimates. The estimates and the underlying assumptions are reviewed on a regular basis. Adjustments are made in the period in which the estimates were reviewed if the adjustment affects that period, or in the relevant period and the future periods if the adjustment affects both current and future periods.
Management insights, estimates and assumptions that might have a major impact on the financial statements are:• Assets held for sale (note 3.5)• Useful life and residual value of property, plant and equipment (note 3.6)• Impairment tests (note 3.7)• Determining the recoverable value of our associate Vopak Terminal Haiteng (note 3.7)• Derivative financial instruments (note 5.9)• Deferred tax (note 7.2)• Pension and other employee benefits (note 8.4)• Provisions (note 8.5)

129Consolidated Financial Statements |In
trod
uctio
nE
xecutive B
oard
repo
rtS
torin
g vital p
rod
ucts
with
careK
ey develo
pm
ents
per d
ivision
Su
stainab
ilityG
overnan
ce, risk an
d co
mp
liance
Finan
cial Statem
ents
Ad
ditio
nal in
form
ation
Finan
cial Statem
ents
129 | Vopak | Annual Report 2016 | Consolidated Financial Statements
Financial risk management The Group is exposed to a number of financial risks inherent in its day-to-day operations. These risks are connected with the effects of movements in exchange rates and interest rates. The Group is also exposed to credit risk and liquidity risk.
Financial risks are identified by Global Treasury, the central treasury department, and discussed in detail with the CFO. The Executive Board provides written principles for overall risk management as well as written policies covering specific areas such as foreign exchange risk, interest risk, credit risk, use of derivative financial instruments and non-derivative financial instruments, and investment of excess liquidity. Reports on risk and risk management are submitted on a regular basis.
Hedging alternatives are discussed by the Strategic Finance Committee, a body comprising representatives from the various financial disciplines at the head office, prior to approval for the transactions being requested from the Executive Board.
In order to control the risks attached to fluctuations in foreign currencies and interest rates, Vopak uses derivative financial instruments in accordance with a financial policy approved by the Executive Board. This financial policy is designed to control the effects of such risks on cash flows, equity and results. Speculative positions are not allowed. The main derivative financial instruments used by the Group are forward exchange contracts, interest rate swaps and cross-currency interest rate swaps (CCIRSs).
The areas involving the most significant financial risks are trade and other receivables, foreign currency exchange risk arising from future commercial transactions, recognized assets and liabilities and net investments in foreign operations, net finance costs resulting from fluctuations in market interest rates and liquidity risks. Information about the Group’s objectives, policies and processes for measuring and managing the risk exposures related to these items is included in the following notes: • Trade and other receivables and related credit risk (note 4.2)• Liquidity risk (note 5.6)• Currency risk (note 5.7)• Interest rate risk (note 5.8)• Financial assets and liabilities and related credit risk (note 8.9)
The Group has not identified additional financial risk exposures in 2016 compared to the previous year, and the approach to capital management and risk management activities remained unchanged compared to the prior year.
The Group is exposed to risk in relation to the translation of the results of foreign operations, which is not mitigated. This risk is described in the following note:• Translation and operational currency risk (note 2.8)

130 | Vopak | Annual Report 2016In
trod
uctio
nE
xecutive B
oard
repo
rtS
torin
g vital p
rod
ucts
with
careK
ey develo
pm
ents
per d
ivision
Su
stainab
ilityG
overnan
ce, risk an
d co
mp
liance
Ad
ditio
nal in
form
ation
| Vopak | Annual Report 2016 | Consolidated Financial StatementsFin
ancial S
tatemen
ts
Section 2 Group operating performanceThis section comprises notes which provide specifications and explanations related to the Group’s operating performance for the year, including disclosures on segmentation.
The following notes are presented in this section:
• 2.1 Segment information• 2.2 Exceptional items• 2.3 Revenues• 2.4 Other operating income• 2.5 Personnel expenses• 2.6 Other operating expenses• 2.7 Result of joint ventures and associates• 2.8 Translation and operational currency risk• 2.9 Cash flows from operating activities (gross)
Note 2.1 Segment information
Accounting policiesThe accounting policies of the reportable segments are the same as the Group’s accounting policies described throughout the notes when relevant.
Reportable segmentsOperating segments are reported in a manner consistent with the internal reporting provided to the Executive Board, which is the chief operating decision maker. The division structure is primarily based on geographical markets. Business activities that cannot be allocated to any other segment are reported under ‘Global functions, corporate activities and others’. These include primarily the head office costs and expenses related to other interests.
As of 2016, the operating segment ‘LNG’ is reported as a separate division. In prior years, the LNG activities were part of the ‘Global functions, corporate activities and others’. This change in presentation has no effect on the financial figures, as the LNG activities were already presented separately under the ‘Global functions, corporate activities and others’ in prior years.
The operating segments Asia and China have been aggregated into the reportable segment ‘Asia’ as their terminal portfolios have similar economic characteristics, among others, in the area of profitability, and provide similar services to a similar type of customer. The China operating segment represents a small part of the Asia reportable segment.

131Consolidated Financial Statements |In
trod
uctio
nE
xecutive B
oard
repo
rtS
torin
g vital p
rod
ucts
with
careK
ey develo
pm
ents
per d
ivision
Su
stainab
ilityG
overnan
ce, risk an
d co
mp
liance
Finan
cial Statem
ents
Ad
ditio
nal in
form
ation
Finan
cial Statem
ents
131 | Vopak | Annual Report 2016 | Consolidated Financial Statements
Statement of income
Revenues 1
Depreciation and amortization
Result of joint ventures and
associatesGroup operating
profit (EBIT)
In EUR millions 2016 2015 2016 2015 2016 2015 2016 2015
Netherlands 496.4 487.9 105.7 97.3 1.9 2.5 180.8 181.2
Europe, Middle East & Africa 189.9 251.5 40.8 46.5 38.2 21.1 80.3 81.6
Asia 385.2 379.4 66.3 64.5 49.9 46.9 230.4 224.4
of which Singapore 278.9 266.5 41.9 39.3 0.6 0.8 161.9 154.6
Americas 273.8 266.7 44.3 42.0 0.5 0.2 76.2 80.6
of which United States 171.3 168.8 24.8 24.7 0.5 – 56.2 58.6
LNG – – – – 32.8 33.4 28.0 30.7Global functions, corporate activities and others 1.6 0.5 6.8 5.7 0.5 0.2 - 37.3 - 43.0
Total excluding exceptional items 1,346.9 1,386.0 263.9 256.0 123.8 104.3 558.4 555.5
Exceptional items:
Netherlands 0.9 - 2.8
Europe, Middle East & Africa 226.3 - 38.8
Asia - 16.5 - 17.5
Americas - 2.7 54.1Global functions, corporate activities and others - 7.1 - 1.3
Total including exceptional items 759.3 549.2
Reconciliation consolidated net profit 2
Group operating profit (EBIT) 759.3 549.2
Net finance costs - 107.2 - 105.2
Profit before income tax 652.1 444.0
Income tax - 72.5 - 117.3
Net profit 579.6 326.7
1. There are no single external customers that represent 10% or more of the Group’s total revenues.2. As the Group neither allocates interest expenses to segments, nor accounts for taxes in them, there is no segmented disclosure of the net profit.
Statement of financial position at 31 December
Assets of subsidiaries
Joint ventures and associates Total assets Total liabilities
In EUR millions 2016 2015 2016 2015 2016 2015 2016 2015
Netherlands 1,479.8 1,439.7 0.3 1.7 1,480.1 1,441.4 116.2 117.9
Europe, Middle East & Africa 699.8 903.9 240.5 282.6 940.3 1,186.5 151.9 204.5
Asia 1,128.4 1,139.1 632.7 614.0 1,761.1 1,753.1 290.7 324.2
of which Singapore 670.5 680.8 1.0 1.5 671.5 682.3 232.7 263.7
Americas 732.4 731.9 49.0 1.2 781.4 733.1 210.2 195.7
of which United States 310.5 357.1 47.7 – 358.2 357.1 129.9 144.2
LNG 0.7 1.2 170.0 169.5 170.7 170.7 3.1 2.3
Global functions, corporate activities and others 449.2 213.3 - 0.8 - 0.9 448.4 212.4 2,250.9 2,492.2
Total 4,490.3 4,429.1 1,091.7 1,068.1 5,582.0 5,497.2 3,023.0 3,336.8

132 | Vopak | Annual Report 2016In
trod
uctio
nE
xecutive B
oard
repo
rtS
torin
g vital p
rod
ucts
with
careK
ey develo
pm
ents
per d
ivision
Su
stainab
ilityG
overnan
ce, risk an
d co
mp
liance
Ad
ditio
nal in
form
ation
| Vopak | Annual Report 2016 | Consolidated Financial StatementsFin
ancial S
tatemen
ts
Investments 1
Intangible assets
Property, plant and equipment
Other non- current assets
Joint ventures and associates Total
In EUR millions 2016 2015 2016 2015 2016 2015 2016 2015 2016 2015
Netherlands 1.2 1.7 147.3 109.0 – – 0.7 – 149.2 110.7
Europe, Middle East & Africa 0.9 1.6 87.2 101.6 – – 0.1 22.4 88.2 125.6
Asia 0.2 0.4 38.2 71.2 – – 72.5 95.7 110.9 167.3
of which Singapore 0.1 0.1 22.7 53.9 – – – – 22.8 54.0
Americas 0.1 0.2 48.4 51.8 0.1 0.2 1.0 – 49.6 52.2
of which United States – - 0.1 23.0 30.1 – – 1.0 – 24.0 30.0
LNG – – – – – – – 3.4 – 3.4Global functions, corporate activities and others 13.8 7.5 6.9 1.9 – – – – 20.7 9.4
Total 16.2 11.4 328.0 335.5 0.1 0.2 74.3 121.5 418.6 468.6
1. Excluding loans granted, finance lease receivable and acquisition of subsidiaries, joint ventures and associates.
Note 2.2 Exceptional items
Group policyThe items in the statement of income include items that are exceptional by nature from a management perspective based on their size and/or nature. For the definition of exceptional items applied by the company, reference is made to the Glossary. The material exceptional items are disclosed separately in the notes when relevant in order to increase transparency.
Exceptional items
In EUR millions Note 2016 2015
Gains on assets held for sale/divestments 2.4 287.6 77.4
Loss on assets held for sale/divestments 2.6 - 1.0 –
Claims settlement 2.4, 2.6 – - 18.9
Transaction expenses divestments UK 2.6 – - 5.0
Impairments 3.7 - 5.7 - 5.8
Reversal impairments 3.7 – 2.1
Write-off receivables 2.6 - 5.3 - 4.1
Legal costs 2.6 - 3.6 –
Vopak 400 stakeholder events 2.5, 2.6 - 7.2 - 1.4
Others – - 0.3
Operating profit 264.8 44.0
Impairments joint ventures and associates 3.7 - 63.1 - 64.1
Reversal impairments joint ventures and associates 3.7 3.0 13.8
Exceptional items included in Result joint ventures and associates 2.7 - 3.8 –
Group operating profit 200.9 - 6.3
Finance costs 5.10 – - 2.3
Profit before income tax 200.9 - 8.6
Tax on above-mentioned items 7.1 6.8 - 21.9
Write-off tax receivables 7.1 – - 13.4
Total effect on net profit 207.7 - 43.9

133Consolidated Financial Statements |In
trod
uctio
nE
xecutive B
oard
repo
rtS
torin
g vital p
rod
ucts
with
careK
ey develo
pm
ents
per d
ivision
Su
stainab
ilityG
overnan
ce, risk an
d co
mp
liance
Finan
cial Statem
ents
Ad
ditio
nal in
form
ation
Finan
cial Statem
ents
133 | Vopak | Annual Report 2016 | Consolidated Financial Statements
For more information on the individual exceptional items, including their amount and nature, reference is made to the corresponding notes. A reconciliation between the income statement based on IFRS and the income statement excluding exceptional items is presented in the table below.
2016 2015
In EUR millions IFRS figuresExceptional
items
Excluding exceptional
items
Excluding exceptional
items
Revenues 1,346.9 – 1,346.9 1,386.0
Other operating income 303.2 287.6 15.6 25.8
Total operating income 1,650.1 287.6 1,362.5 1,411.8
Personnel expenses - 342.2 - 0.6 - 341.6 - 358.1
Impairment - 5.7 - 5.7 – –
Other operating expenses - 338.9 - 16.5 - 322.4 - 346.5
Result joint ventures and associates 59.9 - 63.9 123.8 104.3Group operating profit before depreciation and amortization (EBITDA) 1,023.2 200.9 822.3 811.5
Depreciation and amortization - 263.9 - - 263.9 - 256.0
Group operating profit (EBIT) 759.3 200.9 558.4 555.5
Interest and dividend income 11.4 – 11.4 10.7
Finance costs - 118.6 – - 118.6 - 113.6
Net finance costs - 107.2 – - 107.2 - 102.9
Profit before income tax 652.1 200.9 451.2 452.6
Income tax - 72.5 6.8 - 79.3 - 82.0
Net profit 579.6 207.7 371.9 370.6
Non-controlling interests - 45.6 0.2 - 45.8 - 45.3
Net profit holders of ordinary shares 534.0 207.9 326.1 325.3
Basic earnings per ordinary share (in EUR) 4.19 2.56 2.55
Diluted earnings per ordinary share (in EUR) 4.18 2.55 2.55
Note 2.3 Revenues
Accounting policiesRevenue represents the fair value of the consideration received or receivable for services provided in the normal course of business, stated net of discounts and value added taxes. When it is probable that the future economic benefits will flow to the Group, the recognition in the statement of income is in proportion to the stage of the rendered performance as at the end of the reporting period. Tank rentals, including minimum guaranteed throughputs, are recognized on a straight-line basis over the contractual period. Revenues from excess throughputs and other services are recognized on completion of the services. Modifications of property, plant and equipment upfront paid by customers are accounted for as prepaid revenues and recognized in the statement of income over the contractual period on a straight-line basis.
Revenues
In EUR millions 2016 2015
Storage services 1,090.6 1,105.6
Product movements 106.9 111.8
Storage and handling related services 96.4 130.2
Other services 53.0 38.4
Revenues 1,346.9 1,386.0

134 | Vopak | Annual Report 2016In
trod
uctio
nE
xecutive B
oard
repo
rtS
torin
g vital p
rod
ucts
with
careK
ey develo
pm
ents
per d
ivision
Su
stainab
ilityG
overnan
ce, risk an
d co
mp
liance
Ad
ditio
nal in
form
ation
| Vopak | Annual Report 2016 | Consolidated Financial StatementsFin
ancial S
tatemen
ts
Note 2.4 Other operating income
Accounting policiesGains on the sale of assets are deemed realized at the time the benefits and the risks of the assets are entirely borne by the buyer and there is no uncertainty as to whether the agreed payment will be received. Gains on the sale of subsidiaries are realized at the time control is no longer exercised.
Other operating income
In EUR millions 2016 2015
Management fee joint ventures and associates 7.5 16.1
Gains on sale of property, plant and equipment 2.8 1.4
Gains on assets held for sale/divestments 287.6 77.4
Other 5.3 11.2
Total 303.2 106.1
The divestments that were completed during 2016 resulted in an exceptional gain on divestment of EUR 287.6 million (2015: EUR 77.4 million). This also includes an amount of EUR 2.1 million relating to the formation of a joint venture in the Americas division. For more information, reference is made to note 3.1 and note 3.4.
Other in 2015 includes an exceptional item of EUR 2.9 million primarily relating to a successful settlement of a legal case in the Americas division.
Note 2.5 Personnel expenses
Accounting policiesShort-term employee benefits: wages, salaries, social security contributions, annual leave and sickness absenteeism, bonuses and non-monetary benefits are recognized in the year in which the related services are rendered by employees. Termination benefits are payable when employment is terminated by the Group before the normal retirement date, or whenever an employee accepts voluntary redundancy in exchange for these benefits. The Group recognizes termination benefits at the earlier of the following dates: (a) when the Group can no longer withdraw the offer of those benefits; and (b) when the Group recognizes a restructuring provision that involves the payment of termination benefits. The Group recognizes a provision for bonus plans where contractually obliged or where there is a past practice that has created a constructive obligation. For the accounting policies related to share-based compensation, other types of remuneration and Pensions and other employee benefits reference is made to the notes 6.2 and 8.4.

135Consolidated Financial Statements |In
trod
uctio
nE
xecutive B
oard
repo
rtS
torin
g vital p
rod
ucts
with
careK
ey develo
pm
ents
per d
ivision
Su
stainab
ilityG
overnan
ce, risk an
d co
mp
liance
Finan
cial Statem
ents
Ad
ditio
nal in
form
ation
Finan
cial Statem
ents
135 | Vopak | Annual Report 2016 | Consolidated Financial Statements
Personnel expenses
In EUR millions Note 2016 2015
Wages and salaries 265.0 263.8
Social security charges 33.6 34.6
Contribution to pension schemes (defined contribution) 9.0 10.2
Pension charges (defined benefit plans) 8.4 29.9 37.3
Long-term incentive plans 6.2 10.5 7.7
Early retirement 2.3 5.2
Other personnel expenses 29.0 30.1
Capitalized personnel expenses - 37.1 - 30.6
Total 342.2 358.3
For the years presented, no costs were recognized in connection with an organizational alignment.
Average number of employees (in FTEs)During the year under review, the Group employed an average of 3,913 employees and temporary staff (in FTEs) (2015: 4,037). The movements in the number of own employees at subsidiaries (in FTEs) were as follows:
In FTEs 2016 2015
Number at 1 January 3,639 3,860
Joiners 419 290
Leavers - 341 - 344
Acquisition 33 –
Deconsolidation - 170 - 167
Number at 31 December 3,580 3,639
Note 2.6 Other operating expenses
Accounting policiesOperating expenses are recognized in the income statement when incurred. They are caused by a decrease in future economic benefits related to a decrease of an asset or an increase of a liability that has arisen and can be measured reliably.
Losses on the sale of assets are presented under Other operating expenses and are recognized as soon as they are foreseen. Costs relating to the identification and selection phases of business development projects are recognized in the statement of income in the year in which the costs are incurred.
Leased assets, of which the benefits and risks remain substantially with the lease provider, are regarded as operating leases. Payments made for operating leases are charged to the statement of income on a straight-line basis over the term of the lease. If an operating lease is terminated early, any financial obligation or penalty owed to the owner will be recognized in the statement of income in the period in which the lease was terminated.
136 | Vopak | Annual Report 2016In
trod
uctio
nE
xecutive B
oard
repo
rtS
torin
g vital p
rod
ucts
with
careK
ey develo
pm
ents
per d
ivision
Su
stainab
ilityG
overnan
ce, risk an
d co
mp
liance
Ad
ditio
nal in
form
ation
| Vopak | Annual Report 2016 | Consolidated Financial StatementsFin
ancial S
tatemen
ts
Other operating expenses
In EUR millions 2016 2015
Maintenance 57.1 56.7
Energy and utilities 41.9 49.9
Operating lease 53.0 52.8
Environmental, safety and cleaning 31.4 32.9
Advisory fees 31.5 24.3
Insurance 13.4 23.5
Rents and rates 20.2 22.6
Third party logistics 8.6 14.4
IT 15.1 17.0
Other 66.7 84.8
Total 338.9 378.9
2016In 2016, other operating expenses were recognized as exceptional items for the amount of EUR 16.5 million. The total amount of exceptional items primarily relates to the following:
The divestment of our interest in the joint venture Nippon Vopak, resulted in a divestment loss of EUR 1.0 million. Reference is also made to note 3.4.
A write-down of a receivable relating to a legal dispute in the Asia division has resulted in an exceptional loss of EUR 3.1 million. Furthermore, EUR 3.6 million was recognized as legal expenses in connection with a legal case resulting from a dispute with a contractor in the Asia division.
In addition, the Group provided additional funds of EUR 2.2 million to the joint venture Vopak Terminal Dongguan during 2016. These additions to the total net investment in the joint venture have been fully impaired, as they were used for funding the pre-operating losses of the company prior to the divestment.
An amount of EUR 7.2 million was recognized as an exceptional item on expenditures relating to the Vopak 400 stakeholder events, of which EUR 6.6 million was recognized as Other operating expenses.
2015In 2015, exceptional items were recognized as other operating expenses for the amount of EUR 32.4 million. The total amount of exceptional items primarily relates to the following: In connection with the company’s 400th anniversary, which was celebrated in 2016, EUR 1.4 million of exceptional items were already recognized in 2015 (of which EUR 0.2 million under Personnel expenses). Furthermore, transaction expenses in connection with the divestment of the UK assets (EMEA division) led to an exceptional expense of EUR 5.0 million.
In addition, an amount of EUR 4.1 million was recognized as a write-off of various other receivables. The larger part of this write-off related to a dispute with a contractor for the amount of EUR 3.2 million in the Asia division.
During 2015, the EMEA division recognized an exceptional loss of EUR 13.1 million in connection with claim settlements as a result of the divestment of the UK assets and various legal cases. The Americas division recognized an exceptional loss of EUR 8.7 million in connection with legal cases for which it was estimated that the likely outcome of the court case will not be positive for Vopak. Reference is also made to note 8.5.

137Consolidated Financial Statements |In
trod
uctio
nE
xecutive B
oard
repo
rtS
torin
g vital p
rod
ucts
with
careK
ey develo
pm
ents
per d
ivision
Su
stainab
ilityG
overnan
ce, risk an
d co
mp
liance
Finan
cial Statem
ents
Ad
ditio
nal in
form
ation
Finan
cial Statem
ents
137 | Vopak | Annual Report 2016 | Consolidated Financial Statements
Note 2.7 Result of joint ventures and associates
Accounting policiesJoint ventures and associates are accounted for using the equity method. For the accounting policies relating to joint ventures and associates, reference is made to note 3.4.
Result of joint ventures and associates
In EUR millions Note 2016 2015
Result of joint ventures and associates (excluding exceptional items) 3.4 120.0 104.3
Impairments joint ventures and associates (exceptional items) 3.4, 3.7 - 63.1 - 64.1
Reversal of impairments joint ventures and associates (exceptional items) 3.4, 3.7 3.0 13.8
Total 59.9 54.0
Joint ventures are an important part of the Group. Summarized financial information of our joint ventures and associates on an IFRS basis is presented in note 3.4. In addition, the effects of unaudited non-IFRS proportionate consolidation on the statement of financial position and statement of income of the Group are presented under Additional information accompanying this report.
Note 2.8 Translation and operational currency riskThe Group is exposed to a low level of currency risk on the transaction level, since operating income and operating expenses are, as a rule, largely denominated in the same currency. However, in some countries (in particular, in Latin America and Asia), a substantial portion of the income flow is in US dollars whereas the operating expenses are denominated in local currencies. In these countries, the aim is to hedge the transaction risk naturally. Any material net transaction position can be hedged in full by means of forward exchange contracts.
The Group is, however, exposed to risk in connection with translation of income statements and net assets of foreign entities into euros, since a significant portion of the Group’s results is generated in foreign entities.
In Venezuela, the Group is exposed to exchange controls and currency exchange rate fluctuations. The country of Venezuela currently operates a number of alternative exchange mechanisms, the official ‘DIPRO’ rate (VEF 10.00 per US dollar) and the ‘DICOM’ rate. Vopak applies the DICOM exchange rate of VEF 673.50 per US dollar at year-end 2016 (2015: VEF 198.72 per US dollar).
Sensitivity to exchange rates arising from the translation of the results of foreign currency operationsThe translation risk of converting the net result of foreign entities into euros mainly concerns the Singapore dollar and the US dollar. The sensitivity to these currencies, based on a reasonable change in the exchange rate at the reporting date, is as follows:
A 10 dollar cent change in the EUR/USD exchange rate approximately affects Vopak’s figures as follows (based on figures for 2016, excluding exceptional items):• Revenues would differ by EUR 19.2 million (2015: EUR 18.5 million)• Group operating profit before depreciation and amortization (EBITDA) would differ by EUR 12.1 million
(2015: EUR 11.9 million)• Group operating profit (EBIT) would differ by EUR 9.1 million (2015: EUR 9.1 million)• Net profit would differ by EUR 6.7 million (2015: EUR 6.9 million)
A 10 dollar cent change in the EUR/SGD exchange rate approximately affects Vopak’s figures as follows (based on figures for 2016 excluding exceptional items):• Revenues would differ by EUR 18.5 million (2015: EUR 17.5 million)• Group operating profit before depreciation and amortization (EBITDA) would differ by EUR 13.8 million
(2015: EUR 12.3 million)• Group operating profit (EBIT) would differ by EUR 11.1 million (2015: EUR 9.8 million)• Net profit would differ by EUR 9.2 million (2015: EUR 5.6 million)

138 | Vopak | Annual Report 2016In
trod
uctio
nE
xecutive B
oard
repo
rtS
torin
g vital p
rod
ucts
with
careK
ey develo
pm
ents
per d
ivision
Su
stainab
ilityG
overnan
ce, risk an
d co
mp
liance
Ad
ditio
nal in
form
ation
| Vopak | Annual Report 2016 | Consolidated Financial StatementsFin
ancial S
tatemen
ts
Accounting estimates and judgmentsAs a result of the country of Venezuela having introduced a number of alternative currency exchange mechanisms (DIPRO and DICOM), depending on the type of transaction, Vopak continues to assess the appropriate rate at which to translate the results and net assets of its Venezuelan terminal into euros.
Due to the exceptional situation where two (2015: three) different exchange rates exist, management has to apply judgment to assess which rate applies to the company. Based on the current facts and circumstances, management has assessed the most appropriate exchange rate for the years presented. It was concluded that the DICOM rate was the most likely exchange rate at which future dividends may be remitted and consequently for translating the financial figures of our Venezuela terminal into euros.
In this multiple foreign exchange rate system, Vopak is exposed to the risk that the DICOM rate will further devalue. Because the Venezuelan bolivar-denominated assets, liabilities, income and expenses of our Venezuelan operations are translated into euros for consolidation purposes, a further devaluation of the Venezuelan bolivar going forward could result in lower translated results, assets and liabilities in Vopak’s consolidated figures, which are presented in euros. As the Venezuela operations represent an insignificant part of the Vopak Group, the effects of a devaluation would be immaterial.
Although our operation in Venezuela is subject to exchange controls, the impact on the company is limited. The total cash and cash equivalents balance at year-end 2016 in Venezuela is limited (EUR 1.6 million). This is caused, among others, by pursuing continuous growth opportunities causing cash balances to be continuously reinvested in the company.
Note 2.9 Cash flows from operating activities (gross)
In EUR millions Note 2016 2015
Net profit 579.6 326.7
Adjustments for:
- Depreciation and amortization 3.6 263.9 256.0
- Impairment 3.7 5.7 3.7
- Net finance costs 5.10 107.2 105.2
- Income tax 7.1 72.5 117.3
- Movements in other non-current assets 0.8 0.8
- Movements in other long-term liabilities - 5.5 - 0.6
- Movements in provisions excluding deferred taxes 9.5 41.7
- Movements in non-controlling interests 5.4 2.3 8.8
- Result joint ventures and associates 2.7 - 59.9 - 54.0
- Measurement of equity-settled share-based payment arrangements 5.3 2.9 2.3
- Result on sale of property, plant and equipment 2.4 2.5 - 0.3
- Result on sale of assets held for sale 2.4 - 293.0 - 77.4
Total adjustments 108.9 403.5
Realized value adjustments of derivative financial instruments - 8.6 17.4
Movements in other current assets (excluding cash and cash equivalents) - 1.1 46.8
Movements in other current liabilities (excluding bank overdrafts and dividends) - 7.2 - 15.1
Dividend received from joint ventures and associates 3.4 112.7 92.7
Effect of changes in exchange rates on other current assets and liabilities - 1.1 - 4.8
Cash flows from operating activities (gross) 783.2 867.2

139Consolidated Financial Statements |In
trod
uctio
nE
xecutive B
oard
repo
rtS
torin
g vital p
rod
ucts
with
careK
ey develo
pm
ents
per d
ivision
Su
stainab
ilityG
overnan
ce, risk an
d co
mp
liance
Finan
cial Statem
ents
Ad
ditio
nal in
form
ation
Finan
cial Statem
ents
139 | Vopak | Annual Report 2016 | Consolidated Financial Statements
Section 3 Strategic investments and divestmentsThis section presents details on the core operating assets that form the basis for the activities of the Vopak Group, including the main developments with regard to these assets during the financial years presented.
The following notes are presented in this section:
• 3.1 Acquisition and divestment of subsidiaries• 3.2 Intangible assets• 3.3 Property, plant and equipment• 3.4 Joint ventures and associates• 3.5 Assets held for sale• 3.6 Depreciation and amortization• 3.7 Impairment tests and impairments
Note 3.1 Acquisition and divestment of subsidiaries
Accounting policies
Business combinationsAcquired businesses are recognized in the Consolidated financial statements from the acquisition date, which is the date when the Group effectively obtains control of the acquired business. Businesses that are divested or wound up are recognized in the Consolidated financial statements until the date of divestment or winding-up. Comparative figures are not restated for businesses acquired, divested or wound up.
When the Group obtains control of a business, the acquisition method is applied. The identifiable assets, liabilities and contingent liabilities are measured at fair value at the acquisition date. Identifiable intangible assets are recognized if separable or if they arise from contractual or other legal rights. Deferred tax related to fair value adjustments is also recognized.
Any excess of the fair value of the consideration transferred, the recognized amount of any non-controlling interests and the fair value of any existing equity interest in the acquired entity over the fair value of identifiable assets, liabilities and contingent liabilities, is recognized as goodwill. When the excess is negative, a bargain purchase gain is recognized in the statement of income at the acquisition date.
If parts of the consideration are conditional upon future events (contingent consideration) or satisfaction of agreed terms, these parts are recognized at fair value at the acquisition date. Transaction costs that the Group incurs in connection with the business combination are expensed as incurred under Other operating expenses.
DivestmentsGains or losses on the divestments or winding-up of subsidiaries, joint ventures or associates are measured as the difference between the consideration received adjusted for directly related divestment or winding-up costs and the carrying amount of the net assets at the time of disposal or winding-up including any carrying amount of allocated goodwill.
Acquisitions of subsidiariesThere were no acquisitions of subsidiaries in 2016 and 2015.
Panama As part of the agreement with Chevron for the operatorship of Chevron’s existing terminal at Bahia Las Minas in Panama, Vopak also acquired several assets via the acquisition of a legal entity in the second half of 2016. As the acquired entity does not constitute a business, this transaction is treated as a n asset deal. The 2016 cash outflow relating to this transaction was EUR 20.5 million. Vopak will develop and construct an independent oil terminal at this location.

140 | Vopak | Annual Report 2016In
trod
uctio
nE
xecutive B
oard
repo
rtS
torin
g vital p
rod
ucts
with
careK
ey develo
pm
ents
per d
ivision
Su
stainab
ilityG
overnan
ce, risk an
d co
mp
liance
Ad
ditio
nal in
form
ation
| Vopak | Annual Report 2016 | Consolidated Financial StatementsFin
ancial S
tatemen
ts
Announced acquisition of FSRU business On 21 December 2016, Vopak and Exmar signed an agreement on the acquisition of the FSRU business of Exmar by Vopak and the possible cooperation between Vopak and Exmar in future projects. The agreement on the acquisition envisages the transfer in stages of Exmar’s participation in FSRU assets, FSRU projects under development and a corresponding part of the Exmar organization.
The finalization of the deal is subject to certain significant conditions precedent, such as consent and cooperation of multiple stakeholders including current partners in the FSRUs and customary approval from authorities. Subsequently, the ultimate scope of the transaction is dependent on the outcome of this process and is currently not yet known. Also, as no control has been transferred before year-end 2016 or before publication for the 2016 financial statements, no (preliminary) purchase price allocation is disclosed.
DivestmentsThe table below provides an overview of all the divestments completed during 2016 and 2015, including joint ventures and associates, as well as the results realized on these divestments.
In EUR millions 2016 2015
UK terminals 282.9 –
Vopak Terminal Dongguan 2.4 –
Result formation of joint venture 2.1 –
Nippon terminals - 1.0 –
US terminals – 59.9
Finland terminals – 17.8
Sweden terminals – 1.4
Plot of land in Marmara (Turkey) – –
Others 0.9 0.4
Total 287.3 79.5
The above-mentioned divestments, except for the UK transaction, are in line with Vopak’s earlier decision to divest around 15 primarily smaller terminals. This program has been completed. The total net cash proceeds (excluding tax effects) from these divestments amounted to EUR 464.6 million (2015: EUR 297.6 million). The gains on divestments of subsidiaries are recognized as Other operating income. Reference is also made to note 2.2.
For an overview of the results realized on the divestment of joint ventures and associates, reference is made to note 3.4.
Divestments of subsidiaries
2016United Kingdom In the first quarter of 2016, Vopak completed the earlier announced divestment of all of its assets in the United Kingdom (EMEA division). The divestment comprised the three wholly-owned terminals: Vopak Terminal London, Vopak Terminal Teesside and Vopak Terminal Windmill and Vopak’s 33.3% investment in the business development joint venture Thames Oilport. The divestment resulted in a net exceptional gain on divestment of EUR 282.9 million.
2015Turkey Vopak completed the divestment of its land position in Turkey on 22 January 2015. The effect of this divestment on the statement of income was negligible.
United States Vopak completed the divestment of three wholly-owned terminals and a plot of land in the United States on 27 February 2015. The terminals involved were: Vopak Terminal North Wilmington and Vopak Terminal South Wilmington, both located in the state of North Carolina, and Vopak Terminal Galena Park, located in the state of Texas. The plot of land was located in Perth Amboy, New Jersey.

141Consolidated Financial Statements |In
trod
uctio
nE
xecutive B
oard
repo
rtS
torin
g vital p
rod
ucts
with
careK
ey develo
pm
ents
per d
ivision
Su
stainab
ilityG
overnan
ce, risk an
d co
mp
liance
Finan
cial Statem
ents
Ad
ditio
nal in
form
ation
Finan
cial Statem
ents
141 | Vopak | Annual Report 2016 | Consolidated Financial Statements
This divestment has resulted in a pre-tax exceptional gain of EUR 59.9 million. This transaction also resulted in a tax charge of EUR 24.3 million. In total, this divestment led to a net exceptional gain of EUR 35.6 million.
Sweden Vopak completed the divestment of the Swedish entity Vopak Sweden AB on 10 June 2015. The divested entity consisted of four terminals: Vopak Terminal Gothenburg, Vopak Terminal Gävle, Vopak Terminal Malmö and Vopak Terminal Södertälje.
A small reversal of an impairment was recognized at the date of divestment for the amount of EUR 2.1 million. The divestment also resulted in some additional expenses and tax. As such, the total net gain in relation to the divestment amounted to EUR 1.3 million.
Finland Vopak completed the divestment of its two terminals in Finland, Vopak Terminal Mussalo and Vopak Terminal Hamina on 15 July 2015. The exceptional gain on the divestment was EUR 17.8 million.
Reference is made to note 3.5 for information on the subsidiaries and joint ventures classified as ‘held for sale’ at year-end.
Note 3.2 Intangible assets
Accounting policiesIntangible assets include goodwill, capitalized software costs, contractual relationships, concessions and favorable leases ensuing from business combinations. Goodwill represents the difference between the purchase price and Vopak’s share in the fair value of the acquired identifiable assets, liabilities and contingent liabilities of the company acquired at the time Vopak obtains control (acquisition method). Goodwill is carried at cost less accumulated impairments.
For the purpose of impairment testing, goodwill acquired in a business combination is allocated to each of the cash-generating units (‘CGUs’; normally an individual terminal), or groups of CGUs, which are expected to benefit from the synergies of the combination. Each unit or group of units to which the goodwill is allocated represents the lowest level within the Vopak Group at which the goodwill is monitored for internal management purposes. Goodwill is monitored by the management at the operating segment level and is therefore allocated to the operating segments for impairment testing purposes.
Goodwill relating to the associate or joint venture is included in the carrying amount of the investment in the associate or joint venture and is not tested for impairment separately, but is part of the impairment testing of the investment in the associate or joint venture.
Software is carried at historical cost, net of straight-line amortization based on its expected useful life and any potential impairment.
Other intangible assets are carried at their initial fair value at the time of the acquisition, net of straight-line amortization and impairments.
Other items are mainly licenses that are carried at historical cost, net of straight-line amortization.

142 | Vopak | Annual Report 2016In
trod
uctio
nE
xecutive B
oard
repo
rtS
torin
g vital p
rod
ucts
with
careK
ey develo
pm
ents
per d
ivision
Su
stainab
ilityG
overnan
ce, risk an
d co
mp
liance
Ad
ditio
nal in
form
ation
| Vopak | Annual Report 2016 | Consolidated Financial StatementsFin
ancial S
tatemen
ts
Movements in intangible assets
In EUR millions Note Goodwill Software Other Total
Purchase price of operating assets 52.8 93.3 23.0 169.1
Accumulated amortization and impairment - 9.0 - 72.8 - 9.2 - 91.0
Carrying amount in use 43.8 20.5 13.8 78.1
Purchase price under construction – 13.4 – 13.4
Carrying amount at 31 December 2014 43.8 33.9 13.8 91.5
Movements:
Additions – 11.4 – 11.4
Reclassification to assets held for sale/divestments 3.5 - 2.5 - 1.1 - 0.1 - 3.7
Amortization 3.6 – - 7.7 - 1.4 - 9.1
Impairment 3.7 – - 0.1 – - 0.1
Exchange differences 0.3 - 0.2 - 0.3 - 0.2
Carrying amount at 31 December 2015 41.6 36.2 12.0 89.8
Purchase price of operating assets 44.5 94.5 19.2 158.2
Accumulated amortization and impairment - 2.9 - 69.6 - 7.2 - 79.7
Carrying amount in use 41.6 24.9 12.0 78.5
Purchase price under construction – 11.3 – 11.3
Carrying amount at 31 December 2015 41.6 36.2 12.0 89.8
Movements:
Acquisitions – – 47.8 47.8
Additions – 16.2 – 16.2
Amortization 3.6 – - 7.7 - 1.7 - 9.4
Impairment 3.7 – – - 0.4 - 0.4
Exchange differences 1.4 0.2 0.2 1.8
Carrying amount at 31 December 2016 43.0 44.9 57.9 145.8
Purchase price of operating assets 43.0 107.6 67.5 218.1
Accumulated amortization and impairment – - 76.6 - 9.6 - 86.2
Carrying amount in use 43.0 31.0 57.9 131.9
Purchase price under construction – 13.9 – 13.9
Carrying amount at 31 December 2016 43.0 44.9 57.9 145.8
The increase in the intangible assets in 2016, primarily relates to internally developed IT-projects and intangible assets acquired as part of the acquisition of assets in Panama. For the latter, reference is made to note 3.1.
Note 3.3 Property, plant and equipment
Accounting policiesProperty, plant and equipment are broken down into their components and carried at historical cost, net of accumulated straight-line depreciation and less any impairment losses. Interest during construction is capitalized (see also note 5.10). Historical cost includes the initial acquisition cost plus other direct acquisition costs (such as unrecoverable taxes or transport) and construction costs that can be allocated directly (such as hours of own employees and advisory fees). To the extent that dismantling obligations exist at the end of the useful life, these estimated costs and any amendments thereto are included in the cost of the assets.
Subsequent costs are included in the asset’s carrying amount or recognized as a separate asset, as appropriate, only when it is probable that future economic benefits associated with the item will flow to the Group and the cost of the item can be measured reliably. The carrying amount of the replaced part is derecognized. Costs of repairs and maintenance that do not increase the future economic benefits are recognized as expenses.

143Consolidated Financial Statements |In
trod
uctio
nE
xecutive B
oard
repo
rtS
torin
g vital p
rod
ucts
with
careK
ey develo
pm
ents
per d
ivision
Su
stainab
ilityG
overnan
ce, risk an
d co
mp
liance
Finan
cial Statem
ents
Ad
ditio
nal in
form
ation
Finan
cial Statem
ents
143 | Vopak | Annual Report 2016 | Consolidated Financial Statements
Leases of property, plant and equipment where the Group, as lessee, has substantially all the risks and rewards of owner ship are classified as finance leases. Finance leases are capitalized at the lease’s inception at the fair value of the leased property or, if lower, the present value of the minimum lease payments. The finance cost is charged to the profit or loss over the lease period so as to produce a constant periodic rate of interest on the remaining balance of the liability for each period.
The property, plant and equipment acquired under finance leases are depreciated over the asset’s useful life or over the shorter of the asset’s useful life and the lease term if there is no reasonable certainty that the Group will obtain ownership at the end of the lease term.
Leases in which a significant portion of the risks and rewards of ownership are not transferred to the Group as lessee are classified as operating leases. Payments made under operating leases are charged to profit or loss on a straight-line basis over the period of the lease.
Movements in property, plant and equipment
In EUR millions Note Land BuildingsTank storage
terminalsMachinery and
equipment Total
Purchase price of operating assets 53.4 269.0 4,940.7 226.8 5,489.9
Accumulated depreciation and impairment – - 129.7 - 2,039.2 - 139.1 - 2,308.0
Carrying amount in use 53.4 139.3 2,901.5 87.7 3,181.9
Purchase price under construction 45.1 16.2 373.1 6.1 440.5
Carrying amount at 31 December 2014 98.5 155.5 3,274.6 93.8 3,622.4
Movements:
Additions - 4.5 25.9 304.7 9.4 335.5
Disposals – - 1.0 - 0.7 – - 1.7Reclassification to assets held for sale/divestments 3.5 - 1.1 - 11.4 - 214.6 - 4.9 - 232.0
Reclassification – - 0.9 0.2 0.7 –
Depreciation 3.6 – - 11.0 - 220.5 - 15.4 - 246.9
Impairment 3.7 - 0.2 – - 3.2 - 0.2 - 3.6
Exchange differences 2.4 5.5 12.2 2.2 22.3
Carrying amount at 31 December 2015 95.1 162.6 3,152.7 85.6 3,496.0
Purchase price of operating assets 45.1 263.5 4,967.5 208.6 5,484.7
Accumulated depreciation and impairment - 0.2 - 129.8 - 2,098.9 - 126.3 - 2,355.2
Carrying amount in use 44.9 133.7 2,868.6 82.3 3,129.5
Purchase price under construction 50.2 28.9 284.1 3.3 366.5
Carrying amount at 31 December 2015 95.1 162.6 3,152.7 85.6 3,496.0
Movements:
Acquisitions 5.9 – 1.2 – 7.1
Additions – 35.9 276.6 15.5 328.0
Disposals – - 0.5 - 12.2 - 0.3 - 13.0Reclassification to assets held for sale/divestments 3.5 - 38.4 - 16.6 - 1.2 - 0.7 - 56.9
Reclassification – 2.2 - 2.4 0.2 –
Depreciation 3.6 – - 11.8 - 227.2 - 15.5 - 254.5
Impairment 3.7 – – - 5.3 – - 5.3
Exchange differences 4.0 2.1 43.8 1.7 51.6
Carrying amount at 31 December 2016 66.6 173.9 3,226.0 86.5 3,553.0
Purchase price of operating assets 48.6 298.4 5,298.9 219.0 5,864.9
Accumulated depreciation and impairment – - 145.7 - 2,302.3 - 137.3 - 2,585.3
Carrying amount in use 48.6 152.7 2,996.6 81.7 3,279.6
Purchase price under construction 18.0 21.2 229.4 4.8 273.4
Carrying amount at 31 December 2016 66.6 173.9 3,226.0 86.5 3,553.0

144 | Vopak | Annual Report 2016In
trod
uctio
nE
xecutive B
oard
repo
rtS
torin
g vital p
rod
ucts
with
careK
ey develo
pm
ents
per d
ivision
Su
stainab
ilityG
overnan
ce, risk an
d co
mp
liance
Ad
ditio
nal in
form
ation
| Vopak | Annual Report 2016 | Consolidated Financial StatementsFin
ancial S
tatemen
ts
The Group leased assets with a total book value of EUR 20.0 million at 31 December 2016 (2015: EUR 13.8 million), of which substantially all risks and rewards lie within the Group. The related finance lease obligation for the amount of EUR 20.6 million (2015: EUR 13.9 million) was recognized under interest-bearing loans (see note 5.5).
For an overview of the investment commitments of the Group in relation to property, plant and equipment reference is made to note 8.7.
Note 3.4 Joint ventures and associates Vopak’s interest in the principal joint ventures and associates at year-end 2016 consists of 28 (2015: 28) unlisted joint ventures and 4 (2015: 4) unlisted associates. Although the Group conducts a large part of its activities by means of these joint ventures and associates, none of these entities are currently individually material for the Group. The nature of, and changes in, the risks associated with its interests in joint ventures and associates is primarily linked to the region and/or the activities. For the disclosure of the nature, extent and financial effects of our joint ventures, we make a distinction in the activities of the division Europe, Middle East & Africa (mainly oil storage terminals), LNG (joint ventures with long-term contracts), and Asia (mainly industrial terminals).
No significant judgments were made by the Group with regard to the classification of joint ventures and associates. All material joint arrangements are currently classified as joint ventures because joint control is established by contract and the Group only has rights to the net assets of these entities. The Group currently has no material investment in a joint operation.
The Group has two majority ownerships which qualify as joint ventures: a 60% majority ownership in LNG Terminal Altamira in Mexico and a 51% majority ownership in Vopak Terminals Korea Ltd. In Mexico, the Group has 50% of the voting rights and in Korea, the partner owns an exercisable call option right at any time of 1% of the shares and therefore the substantive voting rights of the Group are limited to 50%.
Reference is made to note 8.11 for an overview of the principal joint ventures and associates.
Accounting policiesJoint ventures and associates are accounted for using the equity method, which involves recognition in the Consolidated statement of income of Vopak’s share of the net result of the joint ventures and associates for the year. Accounting policies of joint ventures and associates have been changed where necessary to ensure consistency with the policies adopted by the Group. Vopak’s interest in a joint venture or associate is carried in the statement of financial position at its share in the net assets of the joint venture or associate together with goodwill paid on acquisition, less any impairment loss. When the share in the losses exceeds the carrying amount of an equity-accounted company (including any other receivables forming part of the net investment in the company), the carrying amount is written down to nil and recognition of further losses is discontinued, unless we have incurred legal or constructive obligations relating to the company in question.

145Consolidated Financial Statements |In
trod
uctio
nE
xecutive B
oard
repo
rtS
torin
g vital p
rod
ucts
with
careK
ey develo
pm
ents
per d
ivision
Su
stainab
ilityG
overnan
ce, risk an
d co
mp
liance
Finan
cial Statem
ents
Ad
ditio
nal in
form
ation
Finan
cial Statem
ents
145 | Vopak | Annual Report 2016 | Consolidated Financial Statements
Group’s share of the total comprehensive income and the carrying amount
Joint ventures Associates Total
In EUR millions 2016 2015 2016 2015 2016 2015
Vopak's share in net assets 889.5 805.5 90.4 63.1 979.9 868.6
Goodwill on acquisition 81.6 67.4 6.6 6.2 88.2 73.6
Carrying amount at 1 January 971.1 872.9 97.0 69.3 1,068.1 942.2
Share in profit or loss 2.7 112.2 103.5 7.8 0.8 120.0 104.3
Impairments 2.7, 3.7 - 63.1 - 64.1 – – - 63.1 - 64.1
Reversal of impairments 2.7, 3.7 3.0 13.8 – – 3.0 13.8
Net profit 52.1 53.2 7.8 0.8 59.9 54.0
Other comprehensive income 5.2 - 0.3 14.1 – – - 0.3 14.1
Comprehensive income 51.8 67.3 7.8 0.8 59.6 68.1
Dividends received 2.9 - 112.7 - 92.7 – – - 112.7 - 92.7
Investments 74.4 99.1 - 0.1 22.4 74.3 121.5
Acquisitions 42.5 10.6 – – 42.5 10.6
Reclassification to assets held for sale - 50.0 - 36.9 – – - 50.0 - 36.9
Exchange differences 10.1 50.8 - 0.2 4.5 9.9 55.3
Carrying amount at 31 December 987.2 971.1 104.5 97.0 1,091.7 1,068.1
Vopak's share in net assets 917.7 889.5 98.2 90.4 1,015.9 979.9
Goodwill on acquisition 69.5 81.6 6.3 6.6 75.8 88.2
Carrying amount at 31 December 987.2 971.1 104.5 97.0 1,091.7 1,068.1
Other comprehensive income is related to the effective portion of changes in the fair value of cash flow hedges within the joint ventures, which are recognized through the Consolidated statement of comprehensive income.
For more information on the impairments recognized on the investments in joint ventures and associates, reference is made to note 3.7.
Investments and divestments of joint ventures and associates
2016United Kingdom - divestment In the first quarter of 2016, Vopak completed the earlier announced divestment of all of its UK assets, including Vopak’s 33.3% investment in the joint venture Thames Oilport. The divestment result from this divestment was limited as the company already impaired its investment in the joint venture to the estimated recoverable value of approximately nil per year-end 2015.
For the details of the reclassification as held for sale of our investment in the business development joint venture Thames Oilport at year-end 2015, reference is made to note 3.5.
Japan - divestment Vopak divested its 40% ownership in the joint venture Nippon Vopak in the second quarter of 2016. Nippon Vopak owned and operated five terminals in Japan with a combined operational capacity of 203,200 cbm. The agreed net cash proceeds, based on the debt-free enterprise value of the divested ownership, amounted to EUR 26.6 million (after capital gains tax). The divestment resulted in a net exceptional loss of EUR 1.0 million.
The divestment of the joint venture Nippon Vopak was in line with Vopak’s decision to divest around 15 primarily smaller terminals.

146 | Vopak | Annual Report 2016In
trod
uctio
nE
xecutive B
oard
repo
rtS
torin
g vital p
rod
ucts
with
careK
ey develo
pm
ents
per d
ivision
Su
stainab
ilityG
overnan
ce, risk an
d co
mp
liance
Ad
ditio
nal in
form
ation
| Vopak | Annual Report 2016 | Consolidated Financial StatementsFin
ancial S
tatemen
ts
Netherlands - divestment Vopak divested its 50% ownership in the joint ventures Cosco Container Lines B.V. and Cross-Ocean C.V. in the third quarter of 2016. The proceeds and divestment results from these divestments were limited.
China - divestment In the fourth quarter of 2016, Vopak divested its 50% ownership in the joint venture Vopak Terminal Dongguan. The proceeds as well as the result from this divestment were limited as the company already impaired its investment in the joint venture to the estimated recoverable value of approximately nil at year-end 2015. The positive divestment result included EUR 1.7 million of realized foreign currency exchange results, previously recognized in equity via OCI.
This divestment also led to the release of the provision of EUR 15.0 million for the (indirect) financial guarantee which was provided for earlier in 2016. Reference is also made to note 8.8.
United States - investment In the first quarter of 2016, the establishment of a project development joint venture in the Americas division, and the subsequent contribution of assets from a Vopak subsidiary to this joint venture, led to an exceptional gain of EUR 2.1 million.
2015Saudi Arabia - investment Our associate Jubail Chemicals Storage and Services Company (JCSSC, or Chemtank) entered into two agreements with Sadara Chemical Company (Sadara) for the provision of liquid product storage and handling services at the King Fahd Industrial Port (KFIP) in Jubail, Kingdom of Saudi Arabia, on 2 November 2015. The agreements with Chemtank will allow for the storage and export of Sadara’s liquid products from the Kingdom.
As part of the Tank Storage Construction Agreement, Chemtank has acquired, as per 30 November 2015, from Sadara for approximately SAR 1.76 billion (EUR 431.6 million) a tank farm that has been constructed by Sadara at PCQ-2. This 348,000 cbm tank farm, which has partially been commissioned, supplements the 220,000 cbm port terminal and related port facilities that were under construction. Under the Terminal Services Agreement, Chemtank will provide Sadara with liquid product storage and handling services at KFIP for an initial term of 20 years.
The aforementioned transaction is accounted for as an acquisition of assets at the level of the associate and does not directly affect the carrying value of the associate in the Consolidated Statement of Financial Position of the Group.
Netherlands - investment Vopak’s interest in the joint venture Gate Terminal B.V. increased to 50% via an acquisition of an additional 2.4% share for EUR 10.6 million.
Summarized information of joint ventures and associates on a 100% basisThe following information reflects the amounts presented in the financial statements of the joint ventures and associates adjusted for differences in accounting policies between the Group and the joint ventures and associates and, when applicable, the effects of the purchase price allocation performed by the Group with regard to the acquisition of the joint venture or associate.

147Consolidated Financial Statements |In
trod
uctio
nE
xecutive B
oard
repo
rtS
torin
g vital p
rod
ucts
with
careK
ey develo
pm
ents
per d
ivision
Su
stainab
ilityG
overnan
ce, risk an
d co
mp
liance
Finan
cial Statem
ents
Ad
ditio
nal in
form
ation
Finan
cial Statem
ents
147 | Vopak | Annual Report 2016 | Consolidated Financial Statements
Summarized statement of total comprehensive income
EMEA joint ventures
Asia joint ventures
LNG joint ventures
Other joint ventures
Total joint ventures
Total associates
In EUR millions 2016 2015 2016 2015 2016 2015 2016 2015 2016 2015 2016 2015
Revenues 211.1 225.0 373.3 349.0 217.1 214.2 28.9 32.3 830.4 820.5 103.6 45.1
Operating expenses - 81.5 - 103.4 - 117.5 - 116.9 - 39.6 - 33.5 - 12.7 - 13.6 - 251.3 - 267.4 - 22.8 - 16.5Depreciation, amortization and impairment - 157.2 - 164.7 - 78.5 - 104.8 - 45.5 - 44.4 - 5.7 - 5.5 - 286.9 - 319.4 - 22.8 - 18.3
Operating profit (EBIT) - 27.6 - 43.1 177.3 127.3 132.0 136.3 10.5 13.2 292.2 233.7 58.0 10.3
Net finance costs - 3.6 - 4.8 - 31.7 - 30.6 - 42.1 - 44.6 - 2.7 - 4.6 - 80.1 - 84.6 - 11.6 - 7.4
Income tax 12.6 - 4.7 - 35.9 - 26.2 - 28.4 - 28.6 - 1.1 - 1.4 - 52.8 - 60.9 - 12.1 - 0.5
Net profit - 18.6 - 52.6 109.7 70.5 61.5 63.1 6.7 7.2 159.3 88.2 34.3 2.4Other comprehensive income 0.1 0.3 - 3.9 8.4 2.4 17.3 0.5 2.2 - 0.9 28.2 - -
Total comprehensive income - 18.5 - 52.3 105.8 78.9 63.9 80.4 7.2 9.4 158.4 116.4 34.3 2.4
Vopak's share of net profit - 30.1 - 15.1 46.4 31.9 32.8 33.4 3.0 3.0 52.1 53.2 7.8 0.8Vopak's share of other comprehensive income 0.1 0.1 - 1.8 4.0 1.2 8.8 0.2 1.2 - 0.3 14.1 – –
Vopak's share of total comprehensive income - 30.0 - 15.0 44.6 35.9 34.0 42.2 3.2 4.2 51.8 67.3 7.8 0.8
Summarized statement of financial position at 31 December
EMEA joint ventures
Asia joint ventures
LNG joint ventures
Other joint ventures
Total joint ventures
Total associates
In EUR millions 2016 2015 2016 2015 2016 2015 2016 2015 2016 2015 2016 2015
Non-current assets 610.4 750.6 2,025.6 2,061.7 1,162.4 1,163.4 253.9 98.1 4,052.3 4,073.8 1,132.2 1,097.9Cash and cash equivalents 40.1 29.4 170.7 143.2 67.4 158.1 11.2 15.8 289.4 346.5 117.9 38.2
Other current assets 24.1 27.5 79.6 84.9 25.3 21.3 9.4 13.1 138.4 146.8 56.9 71.7
Total assets 674.6 807.5 2,275.9 2,289.8 1,255.1 1,342.8 274.5 127.0 4,480.1 4,567.1 1,307.0 1,207.8
Financial non-current liabilities 80.4 49.5 693.7 797.6 716.0 736.2 80.0 80.9 1,570.1 1,664.2 725.6 402.3Other non-current liabilities 18.4 69.2 37.6 34.8 250.4 246.0 18.2 19.8 324.6 369.8 34.1 19.7Financial current liabilities 48.2 72.2 48.8 52.3 68.6 60.9 5.8 5.0 171.4 190.4 67.4 343.7
Other current liabilities 61.9 61.4 90.6 139.2 25.7 107.4 4.5 15.4 182.7 323.4 119.4 117.0
Total liabilities 208.9 252.3 870.7 1,023.9 1,060.7 1,150.5 108.5 121.1 2,248.8 2,547.8 946.5 882.7
Net assets 465.7 555.2 1,405.2 1,265.9 194.4 192.3 166.0 5.9 2,231.3 2,019.3 360.5 325.1
Vopak's share of net assets 185.0 230.1 577.3 549.8 106.9 107.6 48.5 2.0 917.7 889.5 98.2 90.4
Goodwill on acquisition 5.8 17.1 0.6 2.6 63.1 61.9 – – 69.5 81.6 6.3 6.6
Vopak's carrying amount of net assets 190.8 247.2 577.9 552.4 170.0 169.5 48.5 2.0 987.2 971.1 104.5 97.0
On 22 February 2016, the associate Jubail Chemicals Storage and Services Company (JCSSC) entered into a non-recourse project financing. As a consequence, the initial proportionate shareholder loan from Vopak of approximately EUR 86 million was repaid during the first quarter of 2016.
Contingent assets and liabilitiesOur LNG joint venture in Altamira received a material claim in 2014, which was revoked in 2015. For an overview of the contingent liabilities relating to our joint ventures and associates, reference is made to note 8.8.

148 | Vopak | Annual Report 2016In
trod
uctio
nE
xecutive B
oard
repo
rtS
torin
g vital p
rod
ucts
with
careK
ey develo
pm
ents
per d
ivision
Su
stainab
ilityG
overnan
ce, risk an
d co
mp
liance
Ad
ditio
nal in
form
ation
| Vopak | Annual Report 2016 | Consolidated Financial StatementsFin
ancial S
tatemen
ts
Note 3.5 Assets held for sale
Accounting policiesNon-current assets and disposal groups are classified as held for sale when their carrying amount is to be recovered principally through a sales transaction and a sale is considered highly probable at the end of the reporting period. They are stated at the lower value of the carrying amount and the fair value less expected selling costs. When the criteria for the held for sale classification have been met, the non-current assets subject to depreciation and amortization are no longer depreciated or amortized. In addition, equity accounting for joint ventures and associates ceases once classified as held for sale.
Key accounting estimates and judgmentsAt the end of the reporting period, management has to assess if the value of the assets will be recovered principally through a divestment transaction rather than through continued use and what the likelihood is that an asset will be divested within a year. This assessment is based on the facts and circumstances at that date. These facts and circumstances may change and could result in a situation where assets are divested, which were not classified as held for sale at year-end.
When classifying non-current assets as held for sale, management makes estimates of their fair value (sales price and expected costs to sell). Depending on the nature of the non-current assets, the estimated fair value may be associated with uncertainty and possibly adjusted subsequently. Measurement of the fair value of non-current assets is categorized as level 3 in the fair value hierarchy as measurement is not based on observable market data.
Assets and liabilities classified as held for sale
In EUR millions 31-Dec-16 31-Dec-15
Property, plant and equipment 5.5 108.3
Joint ventures 19.6 37.0
Other non-current assets – 5.4
Current assets – 32.1
Total assets held for sale 25.1 182.8
Provisions – 30.6
Current liabilities – 32.6
Total liabilities related to assets held for sale – 63.2
Net assets held for sale of disposal groups 25.1 119.6
In 2014, the Group initiated a divestment program of around 15 primarily smaller terminals, with the objective of further aligning our global network. This program resulted in various divestments in 2016 and 2015. This program has been completed. For the divestments realized during 2016 and 2015, reference is made to note 3.1. and note 3.4.

149Consolidated Financial Statements |In
trod
uctio
nE
xecutive B
oard
repo
rtS
torin
g vital p
rod
ucts
with
careK
ey develo
pm
ents
per d
ivision
Su
stainab
ilityG
overnan
ce, risk an
d co
mp
liance
Finan
cial Statem
ents
Ad
ditio
nal in
form
ation
Finan
cial Statem
ents
149 | Vopak | Annual Report 2016 | Consolidated Financial Statements
2016The assets held for sale as at year-end 2016, comprise a business development joint venture in China and fixed asset components in the Netherlands.
2015UK assets On 19 December 2015, Vopak reached agreement on the sale of all of its UK assets (EMEA division) to Macquarie Capital and Greenergy. Macquarie Capital acquired 100% of the shares of the three wholly-owned terminals: Vopak Terminal London, Vopak Terminal Teesside and Vopak Terminal Windmill. Greenergy acquired Vopak Holding UK, which comprised Vopak’s 33.3% investment in the joint venture Thames Oilport (former Coryton refinery).
Vopak completed the sale of Vopak Holding UK, comprising Vopak’s 33.3% investment in the joint venture Thames Oilport (former Coryton refinery) to Greenergy on 29 January 2016. The second transaction, comprising the sale of the UK terminals, was completed by the end of Q1 2016.
The UK activities comprised less than 4% of the 2015 Group operating profit before depreciation and amortization (EBITDA) -excluding exceptional items- and including the net result of joint ventures and associates. The three terminals and the investment in the joint venture Thames Oilport were classified as held for sale at year-end 2015.
In connection with this divestment, EUR 5.0 million of transaction expenses were recognized in the income statement in 2015. In line with the treatment of the results of divestments, these expenses were classified as an exceptional item under Other operating expenses. Reference is also made to note 2.6.
Note 3.6 Depreciation and amortization
Accounting policiesThe expected useful life of software is subject to a maximum of seven years. Amortization of other intangible assets and licenses is based on the term of the validity of the contract or term of the validity period and varies from 5-30 years.
Depreciation of property, plant and equipment is computed from the date the asset is available for use, using the straight-line method over the expected useful life and taking the estimated residual value into account. The useful life of the main assets is as follows: for buildings 10-40 years, for main components of tank storage terminals 10-40 years, for IT hardware 3-5 years, for machinery, equipment and fixtures 3-10 years. Land is not depreciated.
The residual value and useful life of intangible assets and property, plant and equipment are reviewed annually and adjusted if necessary.
Key accounting estimates and judgmentsProperty, plant and equipment form a substantial part of the total assets of the company, while periodic depreciation charges form a substantial part of the annual operating expenses. The useful life and residual value determined by the Board based on its estimates and assumptions have a major impact on the measurement and determination of results of property, plant and equipment. The useful life of property, plant and equipment is partly estimated based on their useful productive lives, experiences related to such assets, the maintenance history and the period during which the company has the economic benefits from the utilization of the assets. Periodic reviews show whether changes have occurred in estimates and assumptions as a result of which the useful life and/or residual value need to be adjusted. Such an adjustment will be made prospectively.

150 | Vopak | Annual Report 2016In
trod
uctio
nE
xecutive B
oard
repo
rtS
torin
g vital p
rod
ucts
with
careK
ey develo
pm
ents
per d
ivision
Su
stainab
ilityG
overnan
ce, risk an
d co
mp
liance
Ad
ditio
nal in
form
ation
| Vopak | Annual Report 2016 | Consolidated Financial StatementsFin
ancial S
tatemen
ts
Depreciation and amortization
In EUR millions Note 2016 2015
Amortization intangible assets 3.2 9.4 9.1
Depreciation property, plant and equipment 3.3 254.5 246.9
Total 263.9 256.0
Note 3.7 Impairment tests and impairments
Accounting policiesThe carrying amount of goodwill is tested for impairment annually in the fourth quarter (unless there is reason to do so more frequently), while all assets are tested for impairment whenever events or changes in circumstances indicate that the carrying amounts for those assets may not be recoverable. If assets are determined to be impaired, the carrying amounts of those assets are written down to their recoverable amount, which is the higher of fair value less costs of disposal and value in use.
Impairments of a cash-generating unit are allocated to the assets of the cash-generating unit on a proportionate basis. Impairments of intangible assets and property, plant and equipment are presented in the statement of income under Impairment. Impairments, except those related to goodwill, are reversed as applicable to the extent that the events or circumstances that triggered the original impairment have changed.
All financial assets, including joint ventures and associates, are reviewed for impairment. If there is objective evidence of impairment as a result of one or more events after initial recognition, an impairment loss is recognized in the statement of income. The impairments for joint ventures and associates are presented under Result of joint ventures and associates using the equity method.
Estimates used to measure the recoverable amountValue in use is determined as the amount of estimated discounted future cash flows. For this purpose, assets are grouped into cash-generating units based on separately identifiable and largely independent cash flows. The cash flow projections are based on Group operating profits and sustaining capital expenditures of the approved budget for the coming year and the two subsequent planning years. Cash flows beyond the previously mentioned period of three years are extrapolated, using a stable or decreasing growth rate, unless an increasing rate can be substantiated. Given that the cash flows are estimated before taxes, the discount rates used to calculate the present value of the cash flows are pre-tax rates based on the risk-free rates for 15-year bonds issued by the government in the relevant market, adjusted for a risk premium and specific risks relating to the countries and risks specific to the assets. The 15-year bonds period reflects the average remaining useful life of the principal assets. As a company based in Europe, the Group assumes the long-term market equity risk premium to be 6.0% (2015: 5.5%).

Key accounting estimates and judgmentsImpairment analyses In performing the impairment test, management makes an assessment of whether the cash-generating unit (mostly an individual terminal) will be able to generate positive net cash flows that are sufficient to support the value of the intangible assets, property, plant and equipment, and financial assets.
For value in use, the assessment is based on estimates of future expected cash flows (value in use) made on the basis of the budget for the coming year and two subsequent plan years, which form the basis for the 15-year period discounted cash flow model. Key assumptions applied are the expected occupancy, the estimated storage rate per cbm (for revenues not covered by long-term contracts), expected growth rates and the estimated terminal value after the 15-year period, together with the applied discount rates.
Fair value less cost of disposal is primarily based either on comparable market-multiples and/or (indicative non-)binding bids or discounted cash flow models from the perspective of a willing buyer in an orderly transaction.
When the fair value less cost of disposal of a terminal is based on (preliminary) offers received from interested parties, management has assessed that these offers are a good reflection of the fair value of the terminals concerned and assumed that it is probable that these terminals will be sold in the near future resulting in a situation where the carrying amount will be recovered principally through a sale instead of through continued use. A change in one of these assumptions could potentially lead to a future impairment.
These key assumptions are based on the current facts and circumstances and information available to management. By nature, these assumptions are subject to developments in later periods. This could potentially lead to impairments of individual terminals going forward.
Vopak Terminal Haiteng (China) As a result of the incident that occurred in April 2015 at the production facility of the main customer of our associate Vopak Terminal Haiteng, as disclosed in the Annual Report 2015, the customer has still not resumed operations. Based on the current facts and circumstances available, including the estimated long-term demand for the product manufactured at the facility and the technological state of the facility/terminal, management has assessed that it is most likely that the facility will be taken into operation again. The date on which the facility, on which the terminal is dependent, will be taken into production again is currently still unknown, but not expected before early 2018.
If, due to any reason, the production facility will not be taken into operation again, this may result in a significant impairment on our investment in the associate Vopak Terminal Haiteng, which is an industrial terminal. The maximum risk exposure amounts to the Group’s equity investment in the company of EUR 54.8 million per year-end 2016 (2015: EUR 61.6 million). Please note that additional proportionate shareholder funding may be required going forward in relation to required repair and maintenance. If such funding occurs, the maximum risk exposure increases and as such, the risk of impairment could increase. Furthermore, changes in the facts and circumstances, among others, related to the timing and conditions of the restart, could potentially lead to one-offs and/or exceptional losses in the coming year within the aforementioned range of the maximum exposure. Please note, that a successful restart could result in additional gains from this associate, due the fact that certain revenues that were not recognized after the incident, could still be recovered from the associate’s clients.
151Consolidated Financial Statements |In
trod
uctio
nE
xecutive B
oard
repo
rtS
torin
g vital p
rod
ucts
with
careK
ey develo
pm
ents
per d
ivision
Su
stainab
ilityG
overnan
ce, risk an
d co
mp
liance
Finan
cial Statem
ents
Ad
ditio
nal in
form
ation
Finan
cial Statem
ents
Intro
du
ction
Execu
tive Bo
ard rep
ort
Sto
ring
vital pro
du
cts w
ith care
Key d
evelop
men
ts p
er divisio
nS
ustain
ability
Govern
ance, risk
and
com
plian
ceFin
ancial S
tatemen
tsA
dd
ition
al info
rmatio
n
151 | Vopak | Annual Report 2016 | Consolidated Financial Statements
Finan
cial Statem
ents

152 | Vopak | Annual Report 2016In
trod
uctio
nE
xecutive B
oard
repo
rtS
torin
g vital p
rod
ucts
with
careK
ey develo
pm
ents
per d
ivision
Su
stainab
ilityG
overnan
ce, risk an
d co
mp
liance
Ad
ditio
nal in
form
ation
| Vopak | Annual Report 2016 | Consolidated Financial StatementsFin
ancial S
tatemen
ts
Impairment test results
In EUR millions Note 2016 2015
Intangible assets 3.2 0.4 0.1
Property, plant and equipment 3.3 5.3 5.7
Reversal impairment property, plant and equipment 3.3 – - 2.1
Impairment 5.7 3.7
Joint ventures and associates 3.4 63.1 64.1
Reversal impairment joint ventures and associates 3.4 - 3.0 - 13.8
Total 65.8 54.0
GoodwillA summary of the carrying amount of goodwill by geographical area, which is equal to the operating segments (CGUs), is presented below.
In EUR millions 2016 2015
Europe, Middle East & Africa 1.8 1.8
Asia 24.2 23.8
Americas 17.0 16.0
Carrying amount at 31 December 43.0 41.6
The Group has limited goodwill balances as it mostly develops its own greenfield terminals instead of acquiring new terminals. No impairments of goodwill were recognized in 2016 and 2015.
Assumptions appliedThe recoverable value of an operating segment which includes goodwill is based on the value in use. In the impairment tests, the growth factor for years four through fifteen were based on the inflation rate within the range of 1.9% to 2.6% depending on the operating segment (2015: 2% for all operating segments). The pre-tax discount rate used depends on the (average) risk profile of the cash-generating unit and was 8.7% for Asia, 11.5% for Americas and 8.7% for the other segments. The operating profit included in the calculations is based on the approved budget for 2017 and the subsequent plan years.
SensitivityThe value in use calculations indicated more than sufficient headroom, such that a reasonably possible change to key assumptions would not result in an impairment of the related goodwill.
Other intangible assetsNo material impairments were recognized on intangible assets in 2016 and 2015.
Property, plant and equipment
Cancelled projects2016 The cancellation of a business development project in the EMEA division and a scope change in a construction project in the Americas division led to a total impairment on Property, plant and equipment of EUR 5.3 million.
2015 The cancellation of a terminal automation project (Netherlands) and the cancellation of business development projects (EMEA division) led to a total impairment of EUR 5.7 million.
Terminals in operationFor a very limited number of terminals in operation, management has assessed based on consistently applied methodology, that the value in use is lower than the carrying amount. For these individual terminals, the fair value less cost of disposal has been calculated in order to assess whether this value exceeds the value in use and the carrying amount of the assets. For terminals or assets which are actively being marketed by the company, the fair value less cost of disposal is based primarily on offers received from interested parties

153Consolidated Financial Statements |In
trod
uctio
nE
xecutive B
oard
repo
rtS
torin
g vital p
rod
ucts
with
careK
ey develo
pm
ents
per d
ivision
Su
stainab
ilityG
overnan
ce, risk an
d co
mp
liance
Finan
cial Statem
ents
Ad
ditio
nal in
form
ation
Finan
cial Statem
ents
153 | Vopak | Annual Report 2016 | Consolidated Financial Statements
(level 2 fair value). For the other terminals, the fair value less cost of disposal is primarily based on a combination of the estimated normalized EBITDA and transaction multiples observable in the Merger & Acquisition (M&A) markets for comparable terminals (level 2 fair value) together with discounted cash flow models (level 3 fair value). The value in use and fair value less cost of disposal assessments may change over time and when applicable could result in (partial) reversal of recognized impairments.
2016 The above-mentioned approach did not result in any impairment of the subsidiary terminals in operation in 2016.
2015 No impairments were recognized of terminals in operation in 2015. The impairment of EUR 2.7 million in the Netherlands division and the impairment of EUR 3.0 million in the EMEA division related to obsolete property, plant and equipment components.
Joint ventures and associates
2016Vopak E.O.S. (Estonia) Vopak recognized an impairment of the book value of its equity participation in the joint venture Vopak E.O.S. in Estonia (EMEA division) of EUR 55.7 million. This impairment is primarily related to a structural deterioration of the business environment in which the terminal operates, which is heavily dependent on the flows of Russian oil products. The continued low oil product prices and premiums limit demand for terminal services and competition increased due to overcapacity in the region.
The recoverable value was based on the value in use, using a pre-tax discount rate of approximately 9.0% (2015: 8.3%) and management’s best estimate of the future cash flows of the terminal, for which the budget for the coming year was the basis. A further decrease in the product flows handled by the terminal and subsequently storage rates charged to the customers, could potentially lead to an additional impairment going forward. The carrying value of Vopak’s investment in the joint venture after impairment amounts to EUR 54.4 million at year-end 2016.
China An impairment of EUR 7.4 million and EUR 3.8 million of exceptional joint venture result were recognized for one of the smaller joint venture terminals in China (Asia division) relating to changes in the markets in which this terminal operates and a revision in the estimate of the decommissioning date of this terminal.
2015Vopak Terminal Jakarta (Indonesia) The Group partially impaired its 49% equity share in the joint venture Vopak Terminal Jakarta (Asia division) in 2012 because the progress of deregulation of the subsidized fuel distribution was progressing much slower than originally assumed. As disclosed in the 2012 Annual Report, this was considered a timing issue.
A reversal of an impairment of EUR 9.7 million was recognized for this terminal in 2015. This reversal of an impairment results from the structural performance improvements of the terminal, aided among others by favorable market conditions and the economic reforms in Indonesia.
Vopak Terminal Dongguan (China) In 2014, this project in Dongguan (Asia division) was already impaired by EUR 16.1 million to the estimated recoverable value of nil based on a fair value less cost of disposal calculation (level 2 fair value). This project was faced with a longer-term negative timing effect in the industrial developments in the region, compared to initial expectations.
In 2015, the Group provided additional funds of EUR 3.8 million to the joint venture Vopak Terminal Dongguan.These additions to the total net investment in the joint venture have been fully impaired in 2015, as they were used for funding the pre-operating losses of the company. The divestment of this entity in 2016 led to a partial reversal of the historical impairment for the amount of EUR 2.9 million.

154 | Vopak | Annual Report 2016In
trod
uctio
nE
xecutive B
oard
repo
rtS
torin
g vital p
rod
ucts
with
careK
ey develo
pm
ents
per d
ivision
Su
stainab
ilityG
overnan
ce, risk an
d co
mp
liance
Ad
ditio
nal in
form
ation
| Vopak | Annual Report 2016 | Consolidated Financial StatementsFin
ancial S
tatemen
ts
The Group divested this joint venture on 21 October 2016. As part of this divestment the (indirect) financial guarantee of EUR 33.2 million provided in connection with this terminal has been revoked. For more details on the divestment of this entity and the former (indirect) financial guarantee provided, reference is made to note 3.4 and note 8.8.
Thames Oilport (United Kingdom) Vopak, Greenergy and Shell UK Limited acquired the former Coryton refinery (UK) in June 2012. The objective of the partners was to demolish the refinery, develop and invest in an import and distribution terminal called Thames Oilport (EMEA division) to be managed by Vopak, and sell surplus land available.
Vopak and its partners conducted a thorough assessment of this project, including analyses of the economic circumstances, the key market developments in the South East of the UK, the European refinery sector developments and the total development costs of the project. The partners concluded that under all scenarios 403 acres of land will not be required and accordingly decided to offer this land for sale. Vopak conducted its own in-depth analysis of the financial consequences of the decision to offer the land for sale and recognized an impairment on the book value of its equity participation in the joint venture of EUR 40.6 million during the first half of 2015.
A substantial part of this impairment related to the planned demolition of the assets on the land for sale. The other part related to the value in use of the entity, which is below the remaining carrying value of the assets.
Vopak’s interest in the joint venture Thames Oilport was divested together with the other UK assets. The consideration agreed with the acquiring party exceeds the carrying value of the Group’s equity share after impairment, resulting in a partial reversal of the impairment for the amount of EUR 4.0 million in the second half of 2015. In total, an impairment of EUR 36.6 million was recognized for the joint venture in 2015.
Vopak SDIC Yangpu Terminal (China) An impairment of the joint venture Vopak SDIC Yangpu Terminal (Asia division) for EUR 15.0 million was recognized in 2015, because the carrying amount exceeded the estimated recoverable value. The recoverable value was based on the value in use, using a pre-tax discount rate of approximately 11% and management’s best estimate of the future cash flows of the terminal, for which the budget for the coming year and two subsequent plan years formed the basis.
This terminal was commissioned in the third quarter of 2015 and has since then benefited from the contango in the market for petroleum products. The terminal was constructed to capture and handle industrial product flows as well as distribution product flows to independent Chinese refineries. Although the terminal had healthy occupancy rates during 2016, the terminal still faces uncertainties around the developments in the Chinese economy, crude oil deregulation and the timing of regional industrial business developments in the mid-term. Depending on how these economic developments materialize, the value in use and/or fair value could potentially be subject to change. This could lead to further impairments going forward, or reversals of the impairment recognized prior year. The carrying value of Vopak’s investment in the joint venture after impairment amounts to EUR 45.2 million at year-end 2016.
Nippon Vopak (Japan) During 2015, it became apparent that the recoverable value of Vopak’s equity participation in the joint venture Nippon Vopak (Asia division) was below the carrying value of the joint venture. Consequently, an impairment was recognized for the amount of EUR 8.5 million.
In the second quarter of 2016, Vopak divested its 40% ownership in this joint venture.

155Consolidated Financial Statements |In
trod
uctio
nE
xecutive B
oard
repo
rtS
torin
g vital p
rod
ucts
with
careK
ey develo
pm
ents
per d
ivision
Su
stainab
ilityG
overnan
ce, risk an
d co
mp
liance
Finan
cial Statem
ents
Ad
ditio
nal in
form
ation
Finan
cial Statem
ents
155 | Vopak | Annual Report 2016 | Consolidated Financial Statements
Section 4 Working capitalThis section presents details on the working capital items that the Group uses for operating our assets and providing services to our customers.
This section comprises notes to understand the developments in working capital:• 4.1 Changes in working capital• 4.2 Trade and other receivables and related credit risk• 4.3 Trade and other payables
Note 4.1 Changes in working capital
In EUR millions 2016 2015
Movements in other current assets (excluding cash and cash equivalents) - 1.1 46.8
Movements in other current liabilities (excluding bank overdrafts and dividends) - 7.2 - 15.1
Total - 8.3 31.7
Note 4.2 Trade and other receivables and related credit riskTrade and other receivables are exposed to credit risk which could result in impairment losses. This note includes general information about trade and other receivables as well as specifications and explanations of the related risk.
Accounting policiesTrade and other receivables are recognized initially at fair value. Subsequent to initial recognition, receivables are measured at amortized cost, using the effective interest method, less any provision for impairment.
Impairment losses are recognized when objective evidence indicates that a receivable is impaired. This is based on an individual review for impairment due to insolvency of the customer, past due amounts and taking into account any retention right on product stored for this customer.
The creation and release of a provision for impaired trade receivables are recognized under Other operating expenses.
Other receivables also include the dividend receivables from joint ventures and associates for which the decision about dividend distribution was taken before year-end.
Trade and other receivables
In EUR millions 2016 2015
Trade debtors gross 111.5 104.9
Provision for impairment of trade debtors - 3.2 - 2.9
Trade debtors net 108.3 102.0
Taxes receivable 28.3 26.2
Other receivables 88.0 103.8
Total 224.6 232.0
There was no indication as at the statement of financial position date that these receivables will not be recovered, other than as already provided for.

156 | Vopak | Annual Report 2016In
trod
uctio
nE
xecutive B
oard
repo
rtS
torin
g vital p
rod
ucts
with
careK
ey develo
pm
ents
per d
ivision
Su
stainab
ilityG
overnan
ce, risk an
d co
mp
liance
Ad
ditio
nal in
form
ation
| Vopak | Annual Report 2016 | Consolidated Financial StatementsFin
ancial S
tatemen
ts
Trade receivables
Ageing of trade receivables2016 2015
In EUR millions Gross Provision Net Gross Provision Net
Not past due 79.0 - 0.1 78.9 65.8 – 65.8
Past due up to 3 months 25.5 – 25.5 27.4 - 0.1 27.3
Past due 3 to 6 months 3.7 – 3.7 4.0 – 4.0
Past due more than 6 months 3.3 - 3.1 0.2 7.7 - 2.8 4.9
Total 111.5 - 3.2 108.3 104.9 - 2.9 102.0
Provision for impairment of trade debtors
In EUR millions 2016 2015
Balance at 1 January - 2.9 - 4.6
Impairments - 1.2 - 1.3
Reversal of impairments 0.9 3.4
Receivables written off during the year as uncollectible – –
Exchange differences – - 0.4
Balance at 31 December - 3.2 - 2.9
Exposure to bad debts is mostly related to rendering services to international manufacturers and traders. The value of the products stored for these customers usually exceeds the value of the receivables and Vopak generally has the right of retention.
Historically, amounts written off as uncollectible have been relatively low, which is also the case for the years presented.
Other receivablesThe total dividend receivable from joint ventures and associates amounted to EUR 1.5 million at the end of 2016 (2015: EUR 3.7 million). There are also no amounts overdue nor impaired for the other items included in the Other receivables.
Note 4.3 Trade and other payables
Accounting policiesTrade and other payables are measured at amortized cost, using the effective interest method.
Trade and other payables
In EUR millions 2016 2015
Trade payables 43.6 40.1
Accrued expenses 108.4 102.0
Deferred revenues 38.5 35.8
Accrued interest expenses 6.0 6.7
Wage tax and social security charges 7.1 6.4
Other creditors 98.5 117.7
Total 302.1 308.7

157Consolidated Financial Statements |In
trod
uctio
nE
xecutive B
oard
repo
rtS
torin
g vital p
rod
ucts
with
careK
ey develo
pm
ents
per d
ivision
Su
stainab
ilityG
overnan
ce, risk an
d co
mp
liance
Finan
cial Statem
ents
Ad
ditio
nal in
form
ation
Finan
cial Statem
ents
157 | Vopak | Annual Report 2016 | Consolidated Financial Statements
Section 5 Capital structureThe notes in this section provide insight into the capital structure, financing items and financial risk management of the company.
In this section, the following notes are presented:
Equity:• 5.1 Issued capital, share premium, treasury shares and capital management• 5.2 Other reserves• 5.3 Retained earnings• 5.4 Non-controlling interests
Borrowings:• 5.5 Interest-bearing loans and net debt• 5.6 Liquidity risk• 5.7 Currency risk• 5.8 Interest rate risk• 5.9 Derivative financial instruments• 5.10 Net finance costs
EQUITY
Note 5.1 Issued capital, share premium, treasury shares and capital management
Accounting policiesTreasury shares are deducted from the share capital at their nominal value of EUR 0.50 per share. Differences between this amount and the amount paid to acquire or the amount received for disposing of treasury shares are deducted directly in equity.
Share capitalThe company´s authorized share capital amounted to EUR 190,800,000, as at 31 December 2016 divided into 140,000,000 ordinary shares, 190,800,000 protective preference shares and 50,800,000 cumulative finance preference shares, all with a nominal value of EUR 0.50 each.
The issued share capital at 31 December 2016 consisted of 127,835,430 ordinary shares, of which 370,000 shares are held in the treasury stock in connection with existing commitments under the long-term incentive plans. No cumulative finance preference shares were issued at year-end 2016.
Numbers Amounts in EUR millions
Issued ordinary
shares
Financing preference
shares Total sharesTreasury
sharesIssued capital
Share premium
Treasury shares
Balance at 31 December 2014 127,835,430 – 127,835,430 - 210,000 63.9 194.4 - 6.5
Purchase treasury shares – – – - 80,000 – – - 2.9
Balance at 31 December 2015 127,835,430 – 127,835,430 - 290,000 63.9 194.4 - 9.4
Purchase treasury shares – – – - 80,000 – – - 3.8
Balance at 31 December 2016 127,835,430 – 127,835,430 - 370,000 63.9 194.4 - 13.2
On 19 August 2014, the Supervisory Board approved the proposal of the Executive Board to repurchase the outstanding financing preference shares of EUR 44 million on 2 January 2015, of which EUR 0.7 million was distributed from retained earnings. This liability was recognized under Trade and other payables in the Consolidated statement of financial position at year-end 2014 and was fully repaid early 2015.

158 | Vopak | Annual Report 2016In
trod
uctio
nE
xecutive B
oard
repo
rtS
torin
g vital p
rod
ucts
with
careK
ey develo
pm
ents
per d
ivision
Su
stainab
ilityG
overnan
ce, risk an
d co
mp
liance
Ad
ditio
nal in
form
ation
| Vopak | Annual Report 2016 | Consolidated Financial StatementsFin
ancial S
tatemen
ts
Capital managementVopak is a capital-intensive company. The financing policy is directed at establishing and maintaining an optimal financing structure that takes due account of the current asset base and the current and future investment programs. Vopak seeks access to capital markets and flexibility at acceptable finance costs.
A solid capital structure supports Vopak’s objective to create long-term shareholder value while meeting the agreed covenants (see note 5.5) and other requirements with its other capital providers. Vopak aims to maintain a healthy financial position through capital-disciplined investment decisions, effective working capital management, long-term funding and a balanced dividend policy and is continuously reviewing its capital structure options, including but not limited to equity(-linked) or other (debt) capital instruments, to effectively finance the future growth that Vopak aims for. The Group works actively to maintain and further develop the already established diversified funding base, with regard to the number of markets and the number of investors.
Note 5.2 Other reserves
In EUR millionsTranslation
reserve
Revaluation reserve
derivatives
Revaluation reserve assets
Transaction reserve NCI
Total other reserves
Balance at 31 December 2014 15.3 - 164.5 4.9 1.3 - 143.0
Exchange differences on net investments 42.4 – – – 42.4
Effective part of hedges of net investments - 65.2 – – – - 65.2
Tax effect on exchange differences and hedges 3.2 – – – 3.2Use of exchange differences on net investments (to statement of income) - 9.7 – – – - 9.7Use of effective part of hedges of net investments (to statement of income) 11.2 – – – 11.2
Tax on release exchange differences and hedges - 0.7 – – – - 0.7
Movements in effective part of cash flow hedges – 34.5 – – 34.5
Tax effect on movements in cash flow hedges – - 8.4 – – - 8.4Use of effective part of cash flow hedges (to statement of income) – - 6.5 – – - 6.5
Tax effect on use of cash flow hedges – 1.4 – – 1.4Movements in effective part of cash flow hedges joint ventures – 13.3 – – 13.3
Depreciation on revaluation of assets – – - 0.3 – - 0.3
Tax effect on depreciation on revaluation of assets – – 0.1 – 0.1
Balance at 31 December 2015 - 3.5 - 130.2 4.7 1.3 - 127.7
Exchange differences on net investments 36.6 – – – 36.6
Effective part of hedges of net investments - 18.2 – – – - 18.2
Tax effect on exchange differences and hedges - 0.6 – – – - 0.6Use of exchange differences on net investments (to statement of income) 0.7 – – – 0.7Use of effective part of hedges of net investments (to statement of income) 1.9 – – – 1.9
Tax on release exchange differences and hedges - 2.1 – – – - 2.1
Movements in effective part of cash flow hedges – - 1.0 – – - 1.0
Tax effect on movements in cash flow hedges – 0.2 – – 0.2Use of effective part of cash flow hedges (to statement of income) – - 7.4 – – - 7.4
Tax effect on use of cash flow hedges – 1.9 – – 1.9Movements in effective part of cash flow hedges joint ventures – - 1.1 – – - 1.1
Release on revaluation of assets – – - 5.9 – - 5.9
Tax effect on release on revaluation of assets – – 1.2 – 1.2
Balance at 31 December 2016 14.8 - 137.6 – 1.3 - 121.5

159Consolidated Financial Statements |In
trod
uctio
nE
xecutive B
oard
repo
rtS
torin
g vital p
rod
ucts
with
careK
ey develo
pm
ents
per d
ivision
Su
stainab
ilityG
overnan
ce, risk an
d co
mp
liance
Finan
cial Statem
ents
Ad
ditio
nal in
form
ation
Finan
cial Statem
ents
159 | Vopak | Annual Report 2016 | Consolidated Financial Statements
The translation reserve includes all exchange differences resulting from the translation of the financial statements of foreign entities. It also includes the exchange differences on liabilities and the effective currency component of fair value changes of derivative financial instruments (net of tax), to the extent that they hedge the net investments of the Group in foreign entities and hedge accounting is applied.
The revaluation reserve derivatives contains the effective part of the accumulated change in the fair value of the cash flow hedges, net of tax, in respect of which the hedged future transaction has not yet taken place.
In EUR millions 2017 2018 2019 2020 2021 > 2021 TotalUse of revaluation reserve derivatives 66.5 8.9 71.9 51.9 - 0.5 - 61.1 137.6
Note 5.3 Retained earnings
In EUR millions 2016 2015
Balance at 1 January 1,888.2 1,649.4
Dividend paid in cash - 127.5 - 118.1
Remeasurements of defined benefit plans - 26.2 72.2
Measurement of equity-settled share-based payment arrangements 2.9 2.3
Release of revaluation reserve 4.7 0.2
Net profit attributable to owners of parent 534.0 282.2
Balance at 31 December 2,276.1 1,888.2
Of the reserves, EUR 1,860.3 million (2015: EUR 1,473.5 million) can be distributed freely (see note 4 to the Company Financial Statements). The actual dividend paid in cash per ordinary share in 2016 was EUR 1.00 (2015: EUR 0.90).
For the proposed dividend per share, reference is made to the paragraph Profit Appropriation.
Note 5.4 Non-controlling interests
In EUR millions 2016 2015
Balance at 1 January 151.0 144.6
Net profit 45.6 44.5
Dividend paid in cash - 41.3 - 52.0
Capital injection 2.3 8.8
Movements in effective part of cash flow hedges – 0.1
Exchange differences 1.7 5.0
Balance at 31 December 159.3 151.0
The Group has one subsidiary with a material non-controlling interest (NCI). The aggregated information of NCI and the information of the material subsidiary is shown in the table below.
NCI %
Profit allocated to NCI
(in EUR millions)
Dividends paid to NCI
(in EUR millions)Accumulated NCI (in EUR millions)
2016 2015 2016 2015 2016 2015 31-Dec-16 31-Dec-15
Total 45.6 44.5 41.3 52.0 159.3 151.0of which Vopak Terminals Singapore Pte. Ltd. 30.5% 30.5% 40.1 39.4 37.1 46.8 92.7 88.4

160 | Vopak | Annual Report 2016In
trod
uctio
nE
xecutive B
oard
repo
rtS
torin
g vital p
rod
ucts
with
careK
ey develo
pm
ents
per d
ivision
Su
stainab
ilityG
overnan
ce, risk an
d co
mp
liance
Ad
ditio
nal in
form
ation
| Vopak | Annual Report 2016 | Consolidated Financial StatementsFin
ancial S
tatemen
ts
The summarized financial information (at 100%) regarding Vopak Terminals Singapore Pte. Ltd. is as follows:
In EUR millions 31-Dec-16 31-Dec-15
Total non-current assets 522.7 537.9
Cash and cash equivalents 21.4 29.9
Other current assets 35.2 25.0
Total assets 579.3 592.8
Current liabilities 51.8 82.5
Total non-current liabilities 223.6 220.6
Total liabilities 275.4 303.1
Total net assets 303.9 289.7
In EUR millions 2016 2015
Revenues 271.0 266.5
Net profit 131.4 129.1
Other comprehensive income 4.4 12.7
Total comprehensive income 135.8 141.8
Operating cash flow 164.8 168.5
Increase/decrease (-) in cash and cash equivalents - 8.5 - 38.7
BORROWINGS
Note 5.5 Interest-bearing loans and net debt
Accounting policiesInterest-bearing loans are initially measured at fair value and subsequently at amortized cost, applying the effective interest method unless the interest rate has been converted in a hedge relation from fixed into floating by means of a fair value hedge. In that case, the carrying amount is adjusted for the fair value changes caused by the hedged risk.
Fees paid on the establishment of loan facilities are recognized as transaction costs of the loan to the extent that it is probable that some or all of the facility will be drawn down. In this case, the fee is deferred until the drawdown occurs. To the extent there is no evidence that it is probable that some or all of the facility will be drawn down, the fee is capitalized as pre-payment for liquidity services and amortized over the period of the facility to which it relates.
Net debt reconciliation
In EUR millionsCash and cash
equivalentsShort-term borrowings
Interest-bearing loans
Net interest-bearing debt
Carrying amount at 31 December 2014 138.6 - 68.9 - 2,336.0 - 2,266.3
Cash flows - 71.9 12.9 235.6 176.6
Other non-cash movements - 0.7 – - 2.0 - 2.7
Exchange differences 1.3 – - 204.5 - 203.2
Carrying amount at 31 December 2015 67.3 - 56.0 - 2,306.9 - 2,295.6
Cash flows 228.8 55.7 266.2 550.7
Other non-cash movements – – - 1.3 - 1.3
Exchange differences 1.7 – - 59.7 - 58.0
Carrying amount at 31 December 2016 297.8 - 0.3 - 2,101.7 - 1,804.2
Current assets 306.0 – – 306.0
Non-current liabilities – – - 1,938.7 - 1,938.7
Current liabilities - 8.2 - 0.3 - 163.0 - 171.5
Carrying amount at 31 December 2016 297.8 - 0.3 - 2,101.7 - 1,804.2
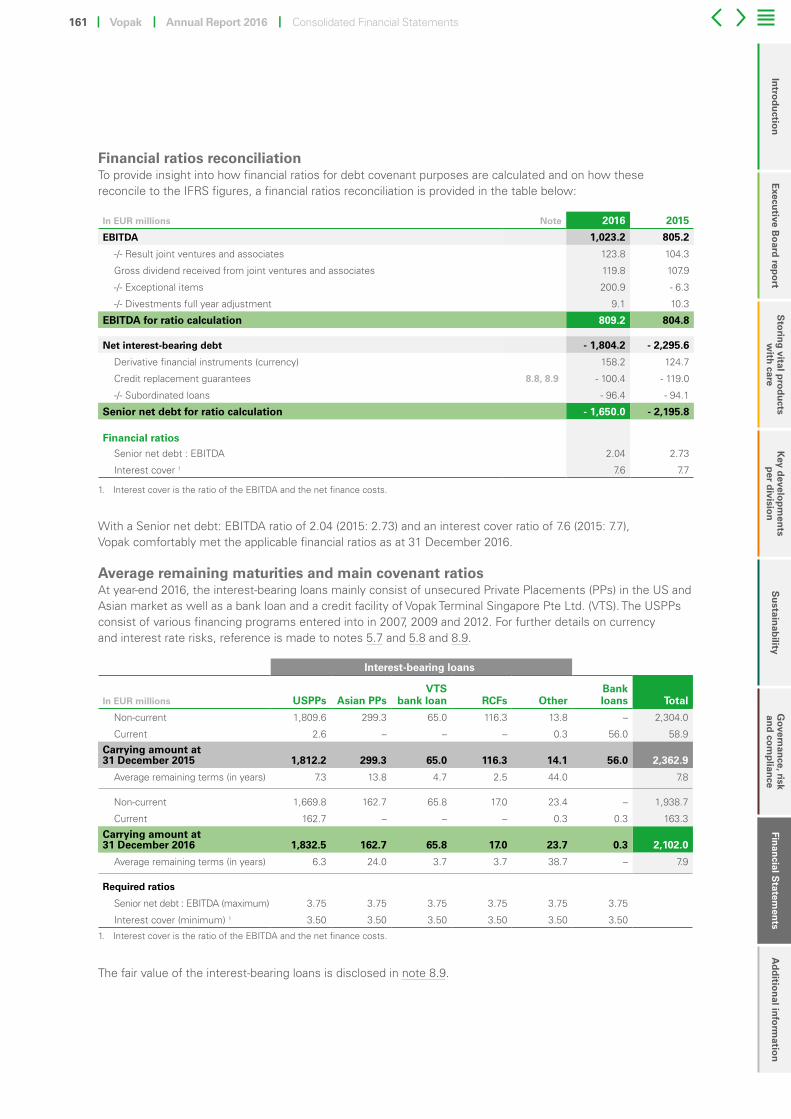
161Consolidated Financial Statements |In
trod
uctio
nE
xecutive B
oard
repo
rtS
torin
g vital p
rod
ucts
with
careK
ey develo
pm
ents
per d
ivision
Su
stainab
ilityG
overnan
ce, risk an
d co
mp
liance
Finan
cial Statem
ents
Ad
ditio
nal in
form
ation
Finan
cial Statem
ents
161 | Vopak | Annual Report 2016 | Consolidated Financial Statements
Financial ratios reconciliationTo provide insight into how financial ratios for debt covenant purposes are calculated and on how these reconcile to the IFRS figures, a financial ratios reconciliation is provided in the table below:
In EUR millions Note 2016 2015
EBITDA 1,023.2 805.2
-/- Result joint ventures and associates 123.8 104.3
Gross dividend received from joint ventures and associates 119.8 107.9
-/- Exceptional items 200.9 - 6.3
-/- Divestments full year adjustment 9.1 10.3
EBITDA for ratio calculation 809.2 804.8
Net interest-bearing debt - 1,804.2 - 2,295.6
Derivative financial instruments (currency) 158.2 124.7
Credit replacement guarantees 8.8, 8.9 - 100.4 - 119.0
-/- Subordinated loans - 96.4 - 94.1
Senior net debt for ratio calculation - 1,650.0 - 2,195.8
Financial ratiosSenior net debt : EBITDA 2.04 2.73
Interest cover 1 7.6 7.7
1. Interest cover is the ratio of the EBITDA and the net finance costs.
With a Senior net debt: EBITDA ratio of 2.04 (2015: 2.73) and an interest cover ratio of 7.6 (2015: 7.7), Vopak comfortably met the applicable financial ratios as at 31 December 2016.
Average remaining maturities and main covenant ratiosAt year-end 2016, the interest-bearing loans mainly consist of unsecured Private Placements (PPs) in the US and Asian market as well as a bank loan and a credit facility of Vopak Terminal Singapore Pte Ltd. (VTS). The USPPs consist of various financing programs entered into in 2007, 2009 and 2012. For further details on currency and interest rate risks, reference is made to notes 5.7 and 5.8 and 8.9.
Interest-bearing loans
In EUR millions USPPs Asian PPsVTS
bank loan RCFs OtherBank loans Total
Non-current 1,809.6 299.3 65.0 116.3 13.8 – 2,304.0
Current 2.6 – – – 0.3 56.0 58.9
Carrying amount at 31 December 2015 1,812.2 299.3 65.0 116.3 14.1 56.0 2,362.9
Average remaining terms (in years) 7.3 13.8 4.7 2.5 44.0 7.8
Non-current 1,669.8 162.7 65.8 17.0 23.4 – 1,938.7
Current 162.7 – – – 0.3 0.3 163.3
Carrying amount at 31 December 2016 1,832.5 162.7 65.8 17.0 23.7 0.3 2,102.0
Average remaining terms (in years) 6.3 24.0 3.7 3.7 38.7 – 7.9
Required ratios
Senior net debt : EBITDA (maximum) 3.75 3.75 3.75 3.75 3.75 3.75
Interest cover (minimum) 1 3.50 3.50 3.50 3.50 3.50 3.50
1. Interest cover is the ratio of the EBITDA and the net finance costs.
The fair value of the interest-bearing loans is disclosed in note 8.9.

162 | Vopak | Annual Report 2016In
trod
uctio
nE
xecutive B
oard
repo
rtS
torin
g vital p
rod
ucts
with
careK
ey develo
pm
ents
per d
ivision
Su
stainab
ilityG
overnan
ce, risk an
d co
mp
liance
Ad
ditio
nal in
form
ation
| Vopak | Annual Report 2016 | Consolidated Financial StatementsFin
ancial S
tatemen
ts
Cash and cash equivalentsIn EUR millions 31-Dec-16 31-Dec-15
Cash and bank 93.0 91.1
Short-term deposits 213.0 18.8
Total 306.0 109.9
Cash and cash equivalents include all cash balances and short-term deposits, which are immediately redeemable. The effective interest rate on short-term deposits at year-end 2016 was 0.77% (2015: 1.84%); these deposits have an average term of 31 days (2015: 64 days) and are subject to limited value changes.
The reconciliation with the Consolidated Cash Flow Statement and the net debt reconciliation is as follows:
In EUR millions 31-Dec-16 31-Dec-15
Cash and cash equivalents 306.0 109.9
Bank overdrafts - 8.2 - 42.6
Total 297.8 67.3
The cash and cash equivalents were at the free disposal of the Group for the years presented.
Note 5.6 Liquidity riskThe primary objective of liquidity management is providing sufficient cash and cash equivalents at all times to enable Vopak to meet its payment obligations.
Cash managementThe liquidity requirements are monitored continuously and funding is planned in such a way as to avoid excessive short-term financing needs. The long-term liquidity risk is assessed prior to every major investment obligation and the current financing policy is reviewed on the basis of this assessment and adjusted where necessary. Active cash management is a daily responsibility and the liquidity requirements are identified each quarter based on thorough scenario planning. Surplus cash is invested in interest-bearing current accounts and deposit accounts.
Vopak’s Global Treasury function acts as an in-house bank that allocates funds, which are raised centrally, internally within the Group. Surplus cash held by the operating entities over and above balances required for working capital management is transferred to Global Treasury and operating companies are normally funded by a combination of equity and inter-company loans. Exceptions to this are the bank loan of EUR 65.8 million (SGD 100 million), drawdowns under the revolving credit facilities of EUR 19.7 million (SGD 30 million) of Vopak Terminals Singapore Pte. Ltd. and the bank loan of EUR 3.0 million (INR 216 million) of our terminal in India which have been raised locally.
Joint ventures and associates, where possible, are normally funded optimally with external debt on a non-recourse basis for Vopak, taking into account local circumstances and contractual obligations.

163Consolidated Financial Statements |In
trod
uctio
nE
xecutive B
oard
repo
rtS
torin
g vital p
rod
ucts
with
careK
ey develo
pm
ents
per d
ivision
Su
stainab
ilityG
overnan
ce, risk an
d co
mp
liance
Finan
cial Statem
ents
Ad
ditio
nal in
form
ation
Finan
cial Statem
ents
163 | Vopak | Annual Report 2016 | Consolidated Financial Statements
Available credit facilitiesAt year-end 2016, the company has two revolving credit facilities (RCFs) which provide flexibility to finance Vopak´s long-term growth strategy.
31 December 2016 31 December 2015
In EUR millions Maturity Total
facility 1 Used Unused Total facility 1 Used Unused
Royal Vopak - Revolving credit facility < 5 years 1,000.0 – 1,000.0 1,000.0 100.0 900.0
VTS - Revolving credit facility < 4 years 65.8 19.7 46.1 65.0 16.3 48.7
Total committed facilities 1,065.8 19.7 1,046.1 1,065.0 116.3 948.7
Royal Vopak - Bank loan facility < 1 year 180.0 – 180.0 200.0 53.0 147.0
Total uncommitted facilities 180.0 – 180.0 200.0 53.0 147.0
Total facilities 1,245.8 19.7 1,226.1 1,265.0 169.3 1,095.7
1. At nominal value.
On 1 June 2016, Vopak successfully renewed the EUR 1 billion senior unsecured multicurrency revolving credit facility (RCF). This facility replaced the previous RCF of EUR 1 billion, which was in place since February 2011. The new RCF has an initial maturity of five years with two extension options of one year each. This facility was unutilized at year-end 2016.
At 31 December 2016, the Group also had unused lines of credit of EUR 180 million (2015: EUR 147 million) that are available to meet short-term liquidity needs. There are no significant restrictions on the use of these facilities.
Maturity analysisThe table below analyzes the Group’s non-derivative financial liabilities and net-settled derivative financial liabilities into relevant maturity categories based on the remaining period at the end of the reporting period to the contractual maturity date. Derivative financial instruments are included in the analysis if their contractual maturities are essential for an understanding of the timing of the cash flows. The table also analyzes the maturity profile of financial assets in order to provide a complete view of the contractual commitments and liquidity. The amounts disclosed in the table are the contractual undiscounted cash flows. The financial guarantees and securities (see note 8.8) are included for their full amount and it is assumed for disclosure purposes that these can be called within one year.

164 | Vopak | Annual Report 2016In
trod
uctio
nE
xecutive B
oard
repo
rtS
torin
g vital p
rod
ucts
with
careK
ey develo
pm
ents
per d
ivision
Su
stainab
ilityG
overnan
ce, risk an
d co
mp
liance
Ad
ditio
nal in
form
ation
| Vopak | Annual Report 2016 | Consolidated Financial StatementsFin
ancial S
tatemen
ts
< 1 year 1-2 years 2-5 years > 5 years
In EUR millions - at 31 December 2016 2015 2016 2015 2016 2015 2016 2015
Cash and cash equivalents 306.0 109.9 – – – – – –
Trade and other receivables 224.6 232.0 – – – – – –
Loans to joint ventures and associates – 85.9 – – – – 2.0 2.0
Other loans – – – – – – 12.5 7.8
Finance lease receivable 5.2 4.9 5.3 5.0 22.5 27.2 76.5 74.9Total undiscounted financial assets (excluding gross settled derivatives) 535.8 432.7 5.3 5.0 22.5 27.2 91.0 84.7
Bank overdrafts 8.2 42.6 – – – – – –
Redemption of interest-bearing loans 163.0 2.9 1.6 157.3 608.1 697.6 1,329.0 1,449.1
Short-term borrowings 0.3 56.0 – – – – – –
Interest payments 93.1 100.8 86.8 98.0 219.1 242.1 259.8 317.8
Interest rate swaps - 5.6 - 13.5 - 3.3 - 12.5 - 3.3 - 17.7 76.9 80.1Trade and other creditors (excluding non-financial instruments) 149.2 164.2 – – – – – –
Total undiscounted financial liabilities (excluding gross settled derivatives) 408.2 353.0 85.1 242.8 823.9 922.0 1,665.7 1,847.0
Derivative financial instruments outflow - 156.1 – – - 156.1 - 385.0 - 403.4 - 355.4 - 359.0
Derivative financial instruments inflow 190.3 – – 184.1 477.0 483.4 387.4 375.7
Total undiscounted gross settled derivatives 34.2 – – 28.0 92.0 80.0 32.0 16.7
Financial guarantees and securities issued 126.5 195.9 – – – – – –
Total financial guarantees and securities 126.5 195.9 – – – – – –
Liquidity movements 35.3 - 116.2 - 79.8 - 209.8 - 709.4 - 814.8 - 1,542.7 - 1,745.6
Change of control clausesCertain lenders have the right to demand complete repayment of the outstanding amounts in case any person or any group of persons acting together, except for the shareholders with a shareholding of more than 5% as at the end of 2010, acquires control of more than 50% of the voting rights of Koninklijke Vopak N.V.
Note 5.7 Currency riskThe Group is exposed to foreign currency exchange risks. These arise mainly from the US dollar (USD) and Singapore dollar (SGD). Foreign currency exchange risk arises from future commercial transactions, recognized assets and liabilities and net investments in foreign operations.
Local currency Euro
In millions 2016 2015 2016 2015
Euro (EUR) 90.7 184.1 90.7 184.1
US dollar (USD) 1,794.7 1,827.9 1,700.9 1,677.9
Pound sterling (GBP) 35.0 35.0 41.1 47.6
Canadian dollar (CAD) 25.0 25.0 17.7 16.7
Singapore dollar (SGD) 130.0 350.0 85.6 227.5
Japanese yen (JPY) 20,000.0 20,000.0 162.7 153.1
India Rupee (INR) 215.8 – 3.0 –
Total 2,101.7 2,306.9
The primary objective of the currency risk policy is to protect the value of Vopak’s cash flows. Account is taken of future cash flows from investments and disposals as well as cash flows from operating and financing activities. Each quarter, currency risks are identified and the hedging strategy is reviewed and subsequently presented to the Executive Board for approval. The main derivative financial instruments used by the Group to hedge currency risks are forward exchange contracts and cross-currency interest rate swaps (CCIRSs).

165Consolidated Financial Statements |In
trod
uctio
nE
xecutive B
oard
repo
rtS
torin
g vital p
rod
ucts
with
careK
ey develo
pm
ents
per d
ivision
Su
stainab
ilityG
overnan
ce, risk an
d co
mp
liance
Finan
cial Statem
ents
Ad
ditio
nal in
form
ation
Finan
cial Statem
ents
165 | Vopak | Annual Report 2016 | Consolidated Financial Statements
The risks associated with commercial transaction positions arising from operating activities are limited for Vopak, since operating income and operating expenses are, as a rule, largely denominated in the same currency. However, in some countries (in particular, in Latin America), a substantial portion of the income flow is in US dollars whereas the operating expenses are denominated in local currencies. In these countries, the aim is to hedge the transaction risk naturally. Any material net transaction position can be hedged in full by means of forward exchange contracts.
The main foreign currency risk results from investments in foreign operations of which the net assets are exposed to foreign currency translation risk. The Group result is also impacted by translating the result of foreign currency operations, which is described in note 2.8.
Translation risk arising from the investments in foreign operationsNet investments in foreign activities are, in principle, hedged by loans in the same currency and forward exchange contracts, while applying net investment hedge accounting. The amount of the hedge is determined mainly by the expected net financing position : EBITDA ratio of subsidiaries for the next three years and hedging costs.
Due to the Private Placements in foreign currency, the Group is exposed to currency risk. It is the Group’s policy to hedge this exposure to leave the Group with no material risks by making use of foreign currency contracts, cross-currency swaps and natural hedges (net investment hedges).
Hedges of a net investment in a foreign operation, including a hedge of a monetary item that is accounted for as part of the net investment, are accounted for in a way similar to cash flow hedges. Gains or losses on the hedging instrument relating to the effective portion of the hedge are recognized in the translation reserve (equity component) via OCI to the extent that they relate to the hedging of net investments in foreign activities. Reversal through the statement of income takes place proportionately if all or part of the underlying position is sold. Both the ineffective part and the interest component are recognized directly in the statement of income. All currency hedges for 2016 and 2015 were highly effective (between 80% and 125%).
The market value of the currency part of derivative financial instruments at 31 December 2016 and 31 December 2015 in order of maturity date is shown below:
31 December 2016 31 December 2015
In EUR millions Maturity Assets 1 Liabilities 1
Notional amount Assets 1 Liabilities 1
Notional amount
Forward foreign currency contracts 2 < 1 year 0.3 2.4 395.3 2.5 2.4 250.1
Total net investment hedges 0.3 2.4 395.3 2.5 2.4 250.1
Forward foreign currency contracts < 1 year 1.7 8.6 454.0 14.0 5.7 922.9
Cross currency swaps 3 < 1 year 34.3 – 156.1 – – –
Cross currency swaps 3 1-5 years 92.1 – 385.0 108.0 – 559.5
Cross currency swaps 3 > 5 years 47.7 15.7 355.4 39.9 23.3 359.0
Total cash flow hedges 175.8 24.3 1,350.5 161.9 29.0 1,841.4
Total derivative financial instruments 176.1 26.7 1,745.8 164.4 31.4 2,091.5
1. At fair value.2. Foreign currency forwards accounted for as hedges on net investments.3. Cross currency swaps accounted for as cash flow hedges are used to hedge currency (2016: USD 971 million and JPY 16 billion;
2015: USD 1 billion and JPY 16 billion) on fixed debt denominated in foreign currency.
Reference is made to note 5.9 for a reconciliation between the amounts presented in the table above and the amounts recognized in the Consolidated Statement of Financial Position.
Sensitivity of exchange rate changes of financial instruments on net profit and equityThe value of debt and hedging instruments denominated in currencies other than the functional currency of the entities holding them are subject to exchange rate movements. The sensitivity analysis for the main currencies and their positions at 31 December 2016 and 31 December 2015 shows how changes in exchange rates by 10% affect net profit and equity, while taking into account the effect of the use of derivatives and the hedge accounting applied.
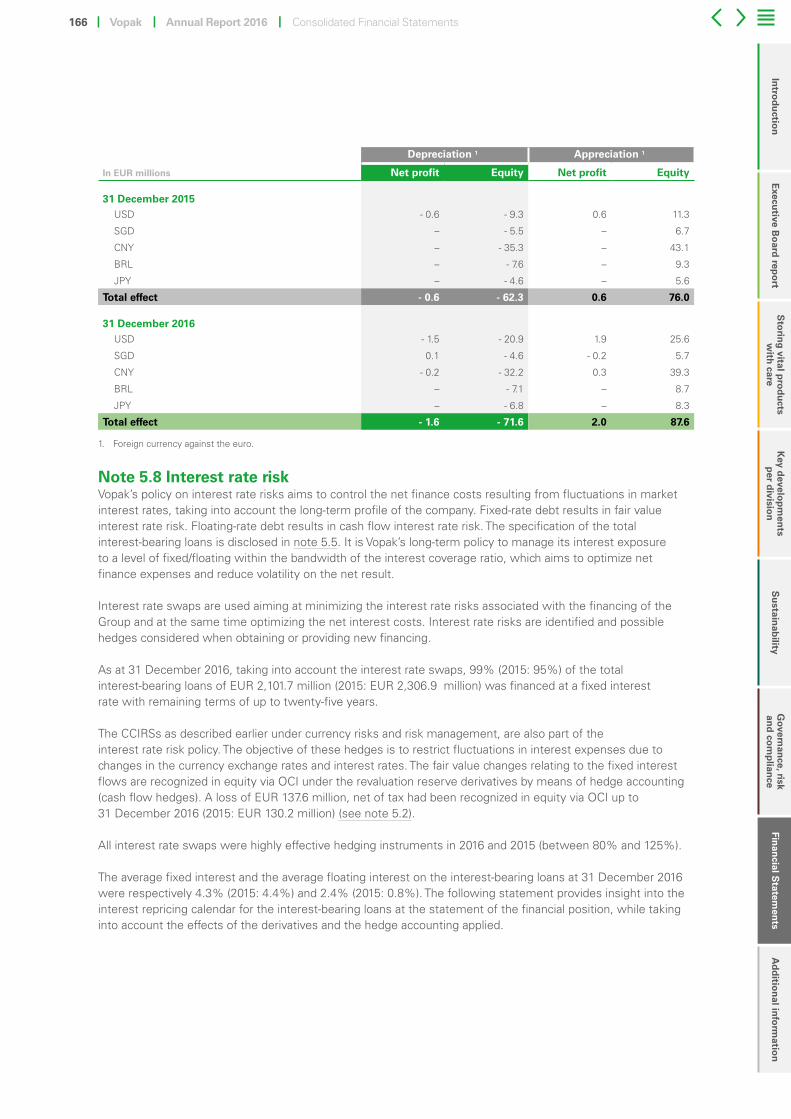
166 | Vopak | Annual Report 2016In
trod
uctio
nE
xecutive B
oard
repo
rtS
torin
g vital p
rod
ucts
with
careK
ey develo
pm
ents
per d
ivision
Su
stainab
ilityG
overnan
ce, risk an
d co
mp
liance
Ad
ditio
nal in
form
ation
| Vopak | Annual Report 2016 | Consolidated Financial StatementsFin
ancial S
tatemen
ts
Depreciation 1 Appreciation 1
In EUR millions Net profit Equity Net profit Equity
31 December 2015USD - 0.6 - 9.3 0.6 11.3
SGD – - 5.5 – 6.7
CNY – - 35.3 – 43.1
BRL – - 7.6 – 9.3
JPY – - 4.6 – 5.6
Total effect - 0.6 - 62.3 0.6 76.0
31 December 2016USD - 1.5 - 20.9 1.9 25.6
SGD 0.1 - 4.6 - 0.2 5.7
CNY - 0.2 - 32.2 0.3 39.3
BRL – - 7.1 – 8.7
JPY – - 6.8 – 8.3
Total effect - 1.6 - 71.6 2.0 87.6
1. Foreign currency against the euro.
Note 5.8 Interest rate riskVopak’s policy on interest rate risks aims to control the net finance costs resulting from fluctuations in market interest rates, taking into account the long-term profile of the company. Fixed-rate debt results in fair value interest rate risk. Floating-rate debt results in cash flow interest rate risk. The specification of the total interest-bearing loans is disclosed in note 5.5. It is Vopak’s long-term policy to manage its interest exposure to a level of fixed/floating within the bandwidth of the interest coverage ratio, which aims to optimize net finance expenses and reduce volatility on the net result.
Interest rate swaps are used aiming at minimizing the interest rate risks associated with the financing of the Group and at the same time optimizing the net interest costs. Interest rate risks are identified and possible hedges considered when obtaining or providing new financing.
As at 31 December 2016, taking into account the interest rate swaps, 99% (2015: 95%) of the total interest-bearing loans of EUR 2,101.7 million (2015: EUR 2,306.9 million) was financed at a fixed interest rate with remaining terms of up to twenty-five years.
The CCIRSs as described earlier under currency risks and risk management, are also part of the interest rate risk policy. The objective of these hedges is to restrict fluctuations in interest expenses due to changes in the currency exchange rates and interest rates. The fair value changes relating to the fixed interest flows are recognized in equity via OCI under the revaluation reserve derivatives by means of hedge accounting (cash flow hedges). A loss of EUR 137.6 million, net of tax had been recognized in equity via OCI up to 31 December 2016 (2015: EUR 130.2 million) (see note 5.2).
All interest rate swaps were highly effective hedging instruments in 2016 and 2015 (between 80% and 125%).
The average fixed interest and the average floating interest on the interest-bearing loans at 31 December 2016 were respectively 4.3% (2015: 4.4%) and 2.4% (2015: 0.8%). The following statement provides insight into the interest repricing calendar for the interest-bearing loans at the statement of the financial position, while taking into account the effects of the derivatives and the hedge accounting applied.

167Consolidated Financial Statements |In
trod
uctio
nE
xecutive B
oard
repo
rtS
torin
g vital p
rod
ucts
with
careK
ey develo
pm
ents
per d
ivision
Su
stainab
ilityG
overnan
ce, risk an
d co
mp
liance
Finan
cial Statem
ents
Ad
ditio
nal in
form
ation
Finan
cial Statem
ents
167 | Vopak | Annual Report 2016 | Consolidated Financial Statements
31 December 2016 31 December 2015
In EUR millions Floating Fixed Total Floating Fixed Total
< 1 year - 163.0 - 163.0 – - 2.9 - 2.9
1-2 years - 1.6 – - 1.6 – - 157.3 - 157.3
2-3 years – - 190.3 - 190.3 - 100.0 - 145.5 - 245.5
3-4 years - 19.8 - 256.1 - 275.9 – - 185.4 - 185.4
4-5 years – - 141.9 - 141.9 - 16.3 - 250.4 - 266.7
> 5 years – - 1,329.0 - 1,329.0 – - 1,449.1 - 1,449.1
Total 1 - 21.4 - 2,080.3 - 2,101.7 - 116.3 - 2,190.6 - 2,306.9
1. Of which currency component derivatives amounts to EUR 158.2 million (2015: EUR 124.7 million).
The market value of the interest rate part of the derivative financial instruments, including credit risk, and in order of maturity date are shown below.
31 December 2016 31 December 2015
In EUR millions Maturity Assets 1 Liabilities 1
Notional amount Assets 1 Liabilities 1
Notional amount
Cross currency interest rate swaps 2 < 1 year 0.4 156.1 – – –
Cross currency interest rate swaps 2 1-5 years – 18.5 385.0 1.0 13.6 559.5
Cross currency interest rate swaps 2 > 5 years – 82.6 355.4 – 84.3 359.0
Total cash flow hedges – 101.5 896.5 1.0 97.9 918.5
Total derivative financial instruments – 101.5 896.5 1.0 97.9 918.5
1. At fair value.2. Cross currency swaps accounted are used to hedge future cash flow interest rate risks (2016: USD 971 million and JPY 16 billion;
2015: USD 1 billion and JPY 16 billion) on fixed debt denominated in foreign currency.
Reference is made to note 5.9 for a reconciliation between the amounts presented in the table above and the amounts recognized in the Consolidated Statement of Financial Position.
Sensitivity to changes in market interest rates The sensitivity analysis shows how changes in market interest rates affect net profit and equity, while taking into account the effects of the derivatives and the hedge accounting applied and assuming that all other variables remain constant. Due to the volatility of the market interest rates, Vopak has used a fixed percentage of 25% as a reasonable change at year-end 2016 and year-end 2015.
Increase 25% Decrease 25%
In EUR millions Closing level 3-month Net profit Equity 1 Net profit Equity 1
31 December 2015EUR -0.09% - 0.3 27.4 0.3 - 28.9
USD 0.68% - 0.1 - 17.1 0.1 17.6
SGD 1.13% 0.4 3.7 - 0.4 - 3.8
JPY -0.22% – - 8.9 – 9.3
Total effect – 5.1 – - 5.8
31 December 2016EUR -0.35% - 0.2 17.4 0.2 - 16.5
USD 0.67% 0.3 - 13.0 - 0.3 13.3
SGD 0.94% 0.3 2.9 - 0.1 - 3.0
JPY -0.04% – - 3.9 – 4.0
Total effect 0.4 3.4 - 0.2 - 2.2
1. Revaluation reserve derivatives through Other comprehensive income.

168 | Vopak | Annual Report 2016In
trod
uctio
nE
xecutive B
oard
repo
rtS
torin
g vital p
rod
ucts
with
careK
ey develo
pm
ents
per d
ivision
Su
stainab
ilityG
overnan
ce, risk an
d co
mp
liance
Ad
ditio
nal in
form
ation
| Vopak | Annual Report 2016 | Consolidated Financial StatementsFin
ancial S
tatemen
ts
Note 5.9 Derivative financial instrumentsIn order to control the risks attached to fluctuations in foreign currencies and interest rates, Vopak uses derivative financial instruments in accordance with a financial policy approved by the Executive Board. This financial policy is designed to control the effects of such risks on cash flows, equity and results. Speculative positions are not allowed.
The main derivative financial instruments used by the Group are forward exchange contracts, interest rate swaps and cross-currency interest rate swaps.
Accounting policiesDerivative financial instruments are recognized in the statement of financial position on the transaction date and measured at fair value. Changes in fair value are recognized in the statement of income unless hedge accounting is applied. With respect to hedge accounting, Vopak makes a distinction between fair value hedges, cash flow hedges and hedges of net investments in foreign companies.
The Group only applies fair value hedge accounting for hedging fixed interest risk on loans drawn. If a fair value hedge is used, the hedging instrument is carried at fair value and the changes in fair value are recognized in the statement of income. The hedged position is recognized at fair value to the extent that the movements in the fair value are caused by the hedged risk. These movements in value are likewise recognized directly in the statement of income.
A cash flow hedge is applicable for those derivatives qualifying and designated as a hedge of the change in cash flows to be received or paid relating to a recognized asset or liability or a highly probable forecasted transaction. The effective parts of changes in the fair value of derivative financial instruments are recognized in other comprehensive income.
The gain or loss as a result of ineffectiveness and the interest component that is a result of the time value of money in the valuation of the derivative financial instrument are recognized directly in the statement of income. This also applies to the credit risks on derivatives, unless the cumulative change in the fair value of the hedging instrument is lower than the hedged item.
Amounts accumulated in equity are reclassified to profit or loss at the same date as the hedged transaction affects profit or loss or if the hedged transaction is no longer probable. The effects are shown under Finance costs. If the established agreement or the foreseeable transaction that is hedged results in the recognition of a non-financial asset, the accumulated gains or losses previously deferred in equity are reclassified from equity and recognized in the initial recognition of the asset or liability.
If a hedging instrument or the hedge relationship is terminated but the hedged transaction is still expected to take place, the accumulated gains or losses will remain in equity at that time and will subsequently be recognized in the statement of income when the previously hedged transaction takes place.
Net investments in foreign activities can be hedged (net investment hedge) by qualifying and designated derivative financial instruments, which are accounted for in a way similar to cash flow hedges (see above). If a debt denominated in foreign currency hedges a net investment in a foreign operation in the same currency, the exchange differences due to translation of the net investment and the debt into euros are recognized in other comprehensive income, to the extent that the hedge is effective. The ineffective part is recognized in the statement of income under Finance costs. Accumulated exchange losses and gains in equity are reclassified at the time foreign activities are (partially) disposed of.

169Consolidated Financial Statements |In
trod
uctio
nE
xecutive B
oard
repo
rtS
torin
g vital p
rod
ucts
with
careK
ey develo
pm
ents
per d
ivision
Su
stainab
ilityG
overnan
ce, risk an
d co
mp
liance
Finan
cial Statem
ents
Ad
ditio
nal in
form
ation
Finan
cial Statem
ents
169 | Vopak | Annual Report 2016 | Consolidated Financial Statements
Key accounting estimates and judgmentsThe fair value of a derivative financial instrument not traded on active markets is measured as the present value of the expected future cash flows under the contract. In determining this value, a valuation model is used that is based on the interest rates and the exchange rates as at the end of the reporting period. Reference is made to note 8.9 for more information.
Reconciliation of derivative financial instruments
31 December 2016 31 December 2015
In EUR millions Note Assets Liabilities Total Assets Liabilities TotalCurrency part derivative financial instruments 5.7 176.1 26.7 149.4 164.4 31.4 133.0Interest part derivative financial instruments 5.8 – 101.5 - 101.5 1.0 97.9 - 96.9
Total derivative financial instruments 176.1 128.2 47.9 165.4 129.3 36.1
Offsetting - 46.0 - 46.0 – - 29.5 - 29.5 –
Total 130.1 82.2 47.9 135.9 99.8 36.1
Non-current 94.2 71.2 23.0 119.4 91.7 27.7
Current 35.9 11.0 24.9 16.5 8.1 8.4
Total 130.1 82.2 47.9 135.9 99.8 36.1
The table above shows the effects of combining the currency part of the derivative financial instruments (see note 5.7) and the interest part of the derivative financial instruments (see note 5.8) as well as the offsetting applied on the individual contractual positions and a reconciliation to the Consolidated statement of financial position.
Note 5.10 Net finance costs
Accounting policiesInterest income from granted loans and dividends from other financial assets (over whose financial and operating policies the Group has no significant influence) are presented under Interest and dividend income, using the effective interest method. Dividend income is recognized when the right to receive payment is established.
Finance costs consist primarily of interest and exchange differences on loans drawn and of results on hedging instruments recognized in the statement of income. Interest expenses are recognized in the period to which they relate, taking into account the effective interest rate.

170 | Vopak | Annual Report 2016In
trod
uctio
nE
xecutive B
oard
repo
rtS
torin
g vital p
rod
ucts
with
careK
ey develo
pm
ents
per d
ivision
Su
stainab
ilityG
overnan
ce, risk an
d co
mp
liance
Ad
ditio
nal in
form
ation
| Vopak | Annual Report 2016 | Consolidated Financial StatementsFin
ancial S
tatemen
ts
Net finance costs
In EUR millions 2016 2015
Interest income 10.4 9.7
Dividends on other financial assets 1.0 1.0
Interest and dividend income 11.4 10.7
Interest expense 1 97.8 100.0
Capitalized interest - 4.9 - 8.4
Interest component of provisions 0.4 0.6
Fair value movements of (part of) derivative financial instruments (no hedge accounting) - 3.3 - 127.2
Exchange differences on underlying items 2 23.5 142.5
Other 5.1 8.4
Finance costs 118.6 115.9
Net finance costs 107.2 105.2
1. Interest expense includes the impact of interest rate derivatives that are part of a fair value hedge accounting relationship and/or the recycling of results from the cash flow hedge reserve.
2. Exchange differences on underlying items includes the impact of foreign currency derivatives that are part of a fair value hedge accounting relationship and/or the recycling of results from the cash flow hedge reserve.
A make-whole payment of EUR 4.4 million was recognized in 2016 relating to the voluntary early redemption of the SGD Asian PP loan. In addition, the repayment of an intercompany loan which was historically part of the net investment by one of our terminals in the Americas division resulted in the recognition of a loss of EUR 4.5 million of foreign currency translation differences which were previously recognized in OCI. The lower interest expenses due to the repayment of interest-bearing loans during 2016, were partially offset by the lower amount of capitalized interest.
In 2016, capitalized interest during construction was subject to an average interest rate of 7.5% (2015: 6.4%).

171Consolidated Financial Statements |In
trod
uctio
nE
xecutive B
oard
repo
rtS
torin
g vital p
rod
ucts
with
careK
ey develo
pm
ents
per d
ivision
Su
stainab
ilityG
overnan
ce, risk an
d co
mp
liance
Finan
cial Statem
ents
Ad
ditio
nal in
form
ation
Finan
cial Statem
ents
171 | Vopak | Annual Report 2016 | Consolidated Financial Statements
Section 6 GovernanceThis section comprises notes related to the Governance of the company, including Board Remuneration, External Auditor fees and transactions with related parties.
The following notes are presented in this section:
• 6.1 Remuneration of Board members• 6.2 Long-term incentive plans (LTIPs)• 6.3 Related parties• 6.4 Fees paid to auditors appointed at the Annual General Meeting
Note 6.1 Remuneration of Board membersReference is made to the section of the Remuneration report for information regarding the remuneration of the Supervisory Board members and the Executive Board members.
Note 6.2 Long-term incentive plans (LTIPs)
At year-end 2016, the Group operated three (2015: two) Long-Term Share Plans (LTSPs) and Long-Term Cash Plans (LTCPs). The LTSPs consist of equity-settled share-based compensation plans for 50% and cash-settled share-based compensation plans for 50%. For the Executive Board only, the LTSP 2016-2018 is 100% equity settled. As an exception, the recognition of the LTSP 2016-2018 was amended into fully cash-settled for Mr De Kreij in accordance with the plan rules, following his decision and announcement to step down early 2018.
The LTCPs are other long-term remuneration plans settled in cash. The periods to which the plans relate are presented below:• LTSP and LTCP 2014-2016• LTSP and LTCP 2015-2017• LTSP and LTCP 2016-2018
Earlier equity-settled share-based compensation plans were vested and settled in prior years.
Accounting policies
Share-based compensationFor equity-settled share-based compensation plans, the fair value is determined at the date of granting and expensed in the statement of income based on the Group’s estimate of the shares that will eventually vest, with a corresponding adjustment directly in equity. For cash-settled share-based compensation plans, the fair value is determined at the date of granting and is remeasured at each reporting date until the liability is settled and is recognized over the vesting period as an expense to the extent to which participants have rendered services to date.
Generally, the compensation cost is recognized on a straight-line basis over the vesting period. The amounts expensed are adjusted over the vesting period for changes in the estimate of the number of shares and the equivalent in cash that will eventually vest. Adjustments are made at the end of each reporting period to reflect expected and actual forfeitures during the vesting period due to the failure to satisfy service conditions or non-market performance conditions, such as profitability growth targets and remaining an employee of the Group over a specified time period.
Other long-term remunerationLong-term remuneration settled in cash that depends on the development of the earnings per ordinary share (EPS) during a period of three years is allocated to these years based on the latest estimates of the EPS. Liabilities are remeasured at the end of each reporting period.

172 | Vopak | Annual Report 2016In
trod
uctio
nE
xecutive B
oard
repo
rtS
torin
g vital p
rod
ucts
with
careK
ey develo
pm
ents
per d
ivision
Su
stainab
ilityG
overnan
ce, risk an
d co
mp
liance
Ad
ditio
nal in
form
ation
| Vopak | Annual Report 2016 | Consolidated Financial StatementsFin
ancial S
tatemen
ts
Costs of long-term incentive plans
LTSP 2016 LTSP 2015 LTSP 2014
In EUR thousandsequity-settled
cash-settled 1
equity-settled
cash-settled 1
equity-settled
cash-settled 1
Cash Plan
Total 2016
Total2015
E.M. Hoekstra 242.6 – 91.9 100.1 287.3 468.8 – 1,190.7 775.8
J.P. de Kreij – 212.6 62.1 67.7 179.3 292.7 – 814.4 493.1
F. Eulderink 150.9 – 59.9 65.2 170.9 278.6 – 725.5 469.2
Current members Executive Board 393.5 212.6 213.9 233.0 637.5 1,040.1 – 2,730.6 1,738.1
Other 443.7 450.0 357.4 399.9 1,211.5 1,606.6 3,296.4 7,765.5 5,912.7
Total 837.2 662.6 571.3 632.9 1,849.0 2,646.7 3,296.4 10,496.1 7,650.8
1. The total carrying amount of liabilities for cash-settled share-based payment at 31 December 2016 was EUR 7.2 million (31 December 2015: EUR 3.2 million).
For more information on the remuneration policy and the remuneration of the Executive Board members and the Supervisory Board members, reference is made to the Remuneration report as included in the Governance and compliance chapter.
Long-Term Share PlansThe current LTSPs reward participants for the increase in Vopak’s Earnings per Share (EPS) performance during the three-year performance period, respectively from start date of the plan to the end date of the plan (either 2014-2016, 2015-2017 or 2016-2018), at pre-set EPS targets. If a considerable, ambitious improvement in the EPS has been achieved during the three-year performance period, a long-term remuneration will be awarded that ranges for the LTSP 2014 and LTSP 2015 from 0% to 120% per annum and for the LTSP 2016 from 0% to 135% per annum of the Chairman’s average annual salary and for other Board members from 0% to 90% per annum for the LTSP 2014, 0% to 97.5% per annum for the LTSP 2015 and 0% to 105% per annum for the LTSP 2016. For key managers, these annual percentages are either 0% to 60% or 0% to 45% of their average annual salaries.
Long-Term Cash PlansFor senior managers who are not eligible to participate under the LTSP but who contribute significantly to the company´s shareholder value, three-year Cash Plans have been granted. The LTCPs provide for additional pay in the form of deferred compensation under the terms and conditions of the plan after a three-year vesting period. The financial performance is measured by the EPS growth during the three-year period, the incentive can rise from 0% to a maximum of 30% or 22.5% per annum of the average salary over the vesting period.
Movements in the number of conditional awards
In numbers E.M. Hoekstra J.P. de Kreij F. Eulderink Other Total
Outstanding at 1 January 2015 35,080 21,924 20,420 128,626 206,050
Change in expected average salary 1 - 202 - 148 162 3,974 3,786
Forfeited – – – - 15,806 - 15,806
Newly awarded 12,496 8,446 8,040 52,080 81,062
Outstanding at 31 December 2015 47,374 30,222 28,622 168,874 275,092
Change in expected average salary 1 - 596 - 384 - 240 - 1,642 - 2,862
Newly awarded 15,308 9,759 9,525 59,480 94,072
Outstanding at 31 December 2016 62,086 39,597 37,907 226,712 366,302
1. The conditional awards under the LTSPs are based on an average salary over the 3-year performance period. The estimated average salaries are updated annually, which could result in an increase or decrease of the number of conditional awards at target level.

173Consolidated Financial Statements |In
trod
uctio
nE
xecutive B
oard
repo
rtS
torin
g vital p
rod
ucts
with
careK
ey develo
pm
ents
per d
ivision
Su
stainab
ilityG
overnan
ce, risk an
d co
mp
liance
Finan
cial Statem
ents
Ad
ditio
nal in
form
ation
Finan
cial Statem
ents
173 | Vopak | Annual Report 2016 | Consolidated Financial Statements
Valuation and cost allocation
Conditional awards 1 Number of expected shares 2 Allocated cost to 3
In EUR thousands NumberValue at
grant NumberValue at vesting
Value for cost
allocation 2016 2015
E.M. HoekstraLTSP 2016, equity-settled (conditional) 15,308 686.6 16,226 NA 727.7 242.6 –
LTSP 2015, equity-settled (conditional) 6,124 281.2 6,063 NA 278.4 91.9 93.7
LTSP 2015, cash-settled (conditional) 6,124 281.2 6,063 NA 265.6 100.1 77.0
LTSP 2014, equity-settled (unconditional) 17,265 560.2 21,409 960.8 694.7 287.3 280.3
LTSP 2014, cash-settled (unconditional) 17,265 560.2 21,409 955.5 955.5 468.8 324.8
62,086 2,369.4 71,170 1,916.3 2,921.9 1,190.7 775.8
J.P. de KreijLTSP 2016, cash-settled (conditional) 4 9,759 437.7 10,345 NA 443.0 212.6 –
LTSP 2015, equity-settled (conditional) 4,140 190.1 4,099 NA 188.2 62.1 63.4
LTSP 2015, cash-settled (conditional) 4,140 190.1 4,099 NA 179.6 67.7 52.1
LTSP 2014, equity-settled (unconditional) 10,779 349.8 13,366 599.9 433.7 179.3 174.9
LTSP 2014, cash-settled (unconditional) 10,779 349.8 13,366 596.5 596.5 292.7 202.7
39,597 1,517.5 45,275 1,196.4 1,841.0 814.4 493.1
F. EulderinkLTSP 2016, equity-settled (conditional) 9,525 427.2 10,097 NA 452.9 150.9 –
LTSP 2015, equity-settled (conditional) 3,968 182.2 3,928 NA 180.4 59.9 60.3
LTSP 2015, cash-settled (conditional) 3,968 182.2 3,928 NA 172.1 65.2 49.6
LTSP 2014, equity-settled (unconditional) 10,223 331.7 12,677 568.9 411.4 170.9 166.4
LTSP 2014, cash-settled (unconditional) 10,223 331.7 12,677 565.8 565.8 278.6 192.9
37,907 1,455.0 43,307 1,134.7 1,782.6 725.5 469.2
Current members Executive Board 139,590 5,341.9 159,752 4,247.4 6,545.5 2,730.6 1,738.1
Other senior executivesLTSP 2016, equity-settled (conditional) 29,740 1,255.6 31,526 NA 1,331.0 443.7 –
LTSP 2016, cash-settled (conditional) 29,740 1,255.6 31,526 NA 1,349.9 450.0 –
LTSP 2015, equity-settled (conditional) 24,776 1,080.0 24,528 NA 1,069.2 357.4 355.4
LTSP 2015, cash-settled (conditional) 24,776 1,080.0 24,528 NA 1,074.6 399.9 307.6
LTSP 2014, equity-settled (unconditional) 58,840 2,344.8 72,961 3,274.5 2,907.5 1,211.5 1,126.4
LTSP 2014, cash-settled (unconditional) 58,840 2,344.8 72,961 3,256.2 3,256.2 1,606.6 1,058.9
Others 226,712 9,360.8 258,030 6,530.7 10,988.4 4,469.1 2,848.3
Total LTIPs 366,302 14,702.7 417,782 10,778.1 17,533.9 7,199.7 4,586.4
Of which vested and settled in 2015 – – – – – – –
Of which vested and settled in 2016 – – – – – – –
Outstanding LTIPs 31 December 2016 366,302 14,702.7 417,782 10,778.1 17,533.9 7,199.7 4,586.4
1. On a target level of 100%. For the LTSPs based on the average salary over the vesting period since date of appointment, the value at grant is the conditional number of shares multiplied by the average share price at the grant date.
2. The value for cost allocation for the equity-settled LTSPs is based on the number of expected or vested shares and multiplied by the fair value per share award at the grant date, which has been reduced with the expected discounted future dividends payable during the respective vesting periods since the holders of shares are not entitled to receive dividends during the vesting period. The value for cost allocation for the cash-settled LTSPs is based on the number of expected or vested shares and multiplied by the fair value per award at the reporting date less discounted expected future dividend payments. Expected dividends have been applied in accordance with the dividend policy of the company. The estimated vesting percentages of the LTSPs are based on a Monte Carlo simulation scenario analysis.
3. The (fair) value of the employee services received in exchange for the awards is recognized rateably over the vesting period of the plan.4. On 15 November 2016, Mr De Kreij, Chief Financial Officer and Vice-Chairman of the Executive Board has informed the Supervisory Board
that he has decided to step down as per 1 February 2018. The recognition of the LTSP 2016 was amended into fully cash settled for Mr De Kreij in accordance with the plan rules, due to his announced resignation early in 2018. The costs of the LTSP are allocated to the remaining period of service.

174 | Vopak | Annual Report 2016In
trod
uctio
nE
xecutive B
oard
repo
rtS
torin
g vital p
rod
ucts
with
careK
ey develo
pm
ents
per d
ivision
Su
stainab
ilityG
overnan
ce, risk an
d co
mp
liance
Ad
ditio
nal in
form
ation
| Vopak | Annual Report 2016 | Consolidated Financial StatementsFin
ancial S
tatemen
ts
Note 6.3 Related parties
Transactions with Supervisory Board members and Executive Board membersFor the remuneration of Supervisory Board members and Executive Board members, the key management of the Group, reference is made to the sections Remuneration Supervisory Board and Actual remuneration 2016 of the Remuneration report, which are deemed part of these financial statements.
No loans, advances or guarantees have been provided to current or former members of the Supervisory Board and the Executive Board.
For both years presented, the Group has not conducted any transactions with companies in which Executive Board members and/or persons closely related to them have a significant financial interest.
Transactions with joint ventures and associates The transactions with our joint ventures and associates, other than providing equity and receiving dividends, principally consist of fees for services provided by the Group, loans issued by the Group and the related interest income.
Joint ventures Associates Total
In EUR millions 2016 2015 2016 2015 2016 2015
Other operating income 7.0 15.4 0.5 0.7 7.5 16.1
Interest income on borrowings to – 0.6 0.6 0.3 0.6 0.9
Amounts owed by 2.0 2.0 – 85.9 2.0 87.9
Transactions with major shareholdersBesides the annual dividend distribution and the repayment of share premium to the financing preference shareholders during 2015, no related party transactions have been entered into with the major shareholders during the years presented.
Vopak has been informed by HAL Holding N.V. (‘HAL’), that it is technically required for HAL to consolidate Vopak in its Consolidated financial statements as from 1 January 2014. Accordingly, HAL has requested Vopak to provide detailed accounting information with respect to the Consolidated financial statements in order for HAL to be able to consolidate Vopak in its Consolidated statements. To facilitate HAL in complying with its obligations under IFRS 10, a Memorandum of Understanding was signed between Vopak and HAL with respect to confidentiality, the process of exchanging information, subsequent events procedures, external auditor involvement and attendance rights to the Audit Committee meetings for an independent financial expert on behalf of HAL.
Transactions with pension funds Related party transactions with Vopak’s pension funds are presented in note 8.4.
Note 6.4 Fees paid to auditors appointed at the Annual General MeetingThe fees listed in the table below relate to the procedures applied to the company and its consolidated Group entities by Deloitte Accountants B.V., the Netherlands, the external auditor as referred to in Section 1(1) of the Dutch Accounting Firms Oversight Act (Dutch acronym: Wta), as well as by other Dutch and foreign-based Deloitte individual partnerships and legal entities, including their tax services and advisory groups.
In EUR millions 2016 2015
Financial statements audit fees 1.2 1.1
Other assurance fees 0.1 –
Tax fees – –
Total 1.3 1.1
The financial statements audit fees include the aggregate fees in 2016 and 2015 for professional services rendered for the audit of Vopak’s annual financial statements and annual statutory financial statements of subsidiaries or services that are normally provided by the auditor in connection with the audits.

175Consolidated Financial Statements |In
trod
uctio
nE
xecutive B
oard
repo
rtS
torin
g vital p
rod
ucts
with
careK
ey develo
pm
ents
per d
ivision
Su
stainab
ilityG
overnan
ce, risk an
d co
mp
liance
Finan
cial Statem
ents
Ad
ditio
nal in
form
ation
Finan
cial Statem
ents
175 | Vopak | Annual Report 2016 | Consolidated Financial Statements
The other assurance fees include the aggregate fees invoiced for assurance and services for other audit services, which generally only the company’s independent auditor can reasonably provide, such as comfort letters.
In line with the Dutch independence legislation, no tax advisory, compliance services or other non-audit services were provided in 2016 and 2015.
The total fees of Deloitte Accountants B.V., the Netherlands, charged to the company and its consolidated Group entities amounted to EUR 0.7 million in 2016 (2015: EUR 0.5 million). Of the disclosed 2016 fees, an amount of EUR 0.2 million relates to non-recurring fees for the 2015 audit which were approved in 2016.

176 | Vopak | Annual Report 2016In
trod
uctio
nE
xecutive B
oard
repo
rtS
torin
g vital p
rod
ucts
with
careK
ey develo
pm
ents
per d
ivision
Su
stainab
ilityG
overnan
ce, risk an
d co
mp
liance
Ad
ditio
nal in
form
ation
| Vopak | Annual Report 2016 | Consolidated Financial StatementsFin
ancial S
tatemen
ts
Section 7 Income taxesThis section comprises all relevant disclosures and specifications regarding tax recognized in the Consolidated financial statements. The following notes are presented in this section:• 7.1 Income taxes• 7.2 Deferred taxes
Note 7.1 Income taxes
Accounting policiesTaxes on profit or loss for the financial year comprise current and deferred taxes. Taxes are recognized in the statement of income unless they relate to items directly recognized in equity through other comprehensive income.
Current taxes are the expected taxes payable on the taxable income for the year, using tax rates enacted at the end of the reporting period, plus any adjustments to prior-year tax payable.
Deferred taxes are provided for, using the liability method, whereby provisions are made for all taxable temporary differences between the carrying amounts of assets and liabilities for financial reporting purposes and their tax base. No deferred taxes are provided for the following temporary differences: goodwill not deductible for tax purposes; the initial recognition of assets and liabilities that neither affect accounting nor taxable profit; and differences relating to investments in subsidiaries to the extent that they will not reverse in the foreseeable future. The calculation is based on tax rates enacted or substantively enacted, as at the end of the reporting period.
Deferred tax assets, including assets arising from losses carried forward, are recognized to the extent that it is probable that future taxable profits will be available against which these temporary differences or unused tax losses can be utilized. Deferred tax assets and liabilities are stated at nominal value.
The Group recognizes liabilities for potential tax audit issues based on estimates of whether additional taxes will be due. Where the final tax outcome of these matters is different from the amounts that were initially recorded, such differences will impact the current and deferred income tax assets and liabilities in the period in which such determination is made.
A provision is formed for tax, principally regarding withholding tax, for which a liability might arise in connection with the distribution of retained earnings if a decision has been made to distribute such earnings.

177Consolidated Financial Statements |In
trod
uctio
nE
xecutive B
oard
repo
rtS
torin
g vital p
rod
ucts
with
careK
ey develo
pm
ents
per d
ivision
Su
stainab
ilityG
overnan
ce, risk an
d co
mp
liance
Finan
cial Statem
ents
Ad
ditio
nal in
form
ation
Finan
cial Statem
ents
177 | Vopak | Annual Report 2016 | Consolidated Financial Statements
Income tax recognized in the Consolidated statement of income
In EUR millions 2016 2015
Current taxesCurrent financial year 66.5 100.6
Adjustments for prior years - 5.5 1.0
61.0 101.6
Deferred taxesAdjustments for prior years - 4.6 - 3.9
Temporary differences 17.5 4.6
Recognition of tax losses and tax credits - 1.5 15.7
Changes in tax rates 0.1 - 0.7
11.5 15.7
Tax on profit 72.5 117.3
Income tax paid 70.9 104.6
Movements in current and deferred tax balances 1.6 12.7
Income tax expense 72.5 117.3
In 2016, EUR 6.8 million of exceptional income was recognized in the income tax expenses (2015: expenses of EUR 35.3 million). This exceptional income relates in full (2015: expenses EUR 21.9 million) to the tax effects on the exceptional items included in the profit before tax.
In 2015, EUR 13.4 million related to the derecognition of deferred tax assets for which management has assessed that, based on the facts and circumstances at that moment, it was not likely at year-end 2015 that these assets would be realized in the near future.
The difference between the tax expenses for the year and the current tax charge is caused by deferred tax expenses mostly related to differences in the depreciation rates of Property, plant and equipment. For further details on the deferred tax position, reference is made to note 7.2.
The tax expense per share amounts to EUR 0.57 (2015: EUR 0.92).
Reconciliation of effective tax rate
In EUR millions 2016 2015
Profit before income tax 652.1 444.0
Tax on profit 72.5 117.3
Effective tax rate 11.1% 26.4%
Composition: Amount % Amount %
Weighted average statutory tax rate 143.8 22.0 122.4 27.5
Participation exemption - 69.1 - 10.6 - 23.2 - 5.2
Non-deductible expenses 9.7 1.5 14.2 3.2
Changes in tax rates – – - 0.7 - 0.2
Recognition of tax losses and tax credits 1.4 0.2 14.9 3.4
Tax facilities – – - 4.1 - 0.9
Movements in prior-year taxes - 10.1 - 1.5 - 2.8 - 0.6
Other effects - 3.2 - 0.5 - 3.4 - 0.8
Effective tax (rate) 72.5 11.1 117.3 26.4
The income tax expense for 2016 amounted to EUR 72.5 million (2015: EUR 117.3 million). The effective tax rate decreased from 26.4% in 2015 to 11.1% in 2016. This decrease was mainly due to the effects of the exceptional items, of which the impairments and the divestment of the UK terminals, for which the gains from divestment are not taxed based on the Dutch participation exemption, were the largest contributors. Excluding exceptional items, the effective tax rate for 2016 was 17.6% (2015: 18.1%).

178 | Vopak | Annual Report 2016In
trod
uctio
nE
xecutive B
oard
repo
rtS
torin
g vital p
rod
ucts
with
careK
ey develo
pm
ents
per d
ivision
Su
stainab
ilityG
overnan
ce, risk an
d co
mp
liance
Ad
ditio
nal in
form
ation
| Vopak | Annual Report 2016 | Consolidated Financial StatementsFin
ancial S
tatemen
ts
Income tax recognized in other comprehensive income
In EUR millions Note 2016 2015
On changes in the value of cash flow hedges 5.2 - 0.2 8.4
On exchange differences and hedges 5.2 0.6 - 3.2
On use of cash flow hedges 5.2 - 1.9 - 1.4
On use of exchange differences and hedges 5.2 2.1 0.7
On remeasurements of defined benefit plans - 8.8 23.8
Total - 8.2 28.3
Note 7.2 Deferred taxes
Key accounting estimates and judgmentsDeferred tax assets, including those arising from carry-forward losses, are recognized if it is likely that taxable profit is available against which losses can be set off. In determining this, Vopak uses estimates and assumptions that also affect the measurement of the deferred tax assets. A maturity schedule of the unrecognized carry-forward losses is shown on the next page.
Deferred tax assets and liabilities
Temporary differences
In EUR millions
Carry forward
losses
Property, plant and
equipmentLoans
grantedEmployee
benefits Other Other
Offset assets and
liabilities
Statement of financial
position
Assets 6.5 11.3 - 58.7 38.8 - 1.3 - 61.3 52.7
Liabilities – - 259.5 - 5.3 - 1.2 - 18.3 – 61.3 - 223.0
Balance 31 December 2014 6.5 - 248.2 - 5.3 57.5 20.5 - 1.3 – - 170.3
Movements:
- Statement of income - 1.9 - 11.0 5.6 2.8 0.1 - 11.3 - 15.7
- Other comprehensive income – 0.2 – - 23.8 - 4.7 – - 28.3
- Acquisitions/divestments – 18.6 – - 2.4 1.2 – 17.4
- Reclassification – – – – – 13.4 13.4
- Exchange differences - - 10.4 0.5 1.4 - 0.4 0.1 - 8.8
Balance 31 December 2015 4.6 - 250.8 0.8 35.5 16.7 0.9 - 192.3
Assets 4.6 7.7 0.8 35.5 32.3 0.9 - 67.9 13.9
Liabilities – - 258.5 – – - 15.6 – 67.9 - 206.2
Balance 31 December 2015 4.6 - 250.8 0.8 35.5 16.7 0.9 - - 192.3
Movements:
- Statement of income 1.5 - 22.2 2.2 5.8 1.3 - 0.1 - 11.5
- Other comprehensive income – – - 3.7 8.8 – – 5.1
- Acquisitions/divestments – – – – – – –
- Reclassification – 8.7 – – - 8.6 - 0.1 - 0.0
- Exchange differences - 2.0 - 5.8 0.2 0.4 0.4 - 0.1 - 6.9
Balance 31 December 2016 4.1 - 270.1 - 0.5 50.5 9.8 0.6 - 205.6
Assets 4.1 6.7 – 50.6 35.0 0.6 – 81.3 15.7
Liabilities - - 276.8 - 0.5 - 0.1 - 25.2 – 81.3 - 221.3
Balance 31 December 2016 4.1 - 270.1 - 0.5 50.5 9.8 0.6 - - 205.6
Deferred tax assets and liabilities are offset against each other to the extent that this is a legally enforceable right and the deferrals belong to the same fiscal unit. The decision to account for deferred tax assets is taken annually for each fiscal unit after critically assessing whether conditions are sufficient to realize these deferred tax assets, based on the strategic plans and related tax plans.

179Consolidated Financial Statements |In
trod
uctio
nE
xecutive B
oard
repo
rtS
torin
g vital p
rod
ucts
with
careK
ey develo
pm
ents
per d
ivision
Su
stainab
ilityG
overnan
ce, risk an
d co
mp
liance
Finan
cial Statem
ents
Ad
ditio
nal in
form
ation
Finan
cial Statem
ents
179 | Vopak | Annual Report 2016 | Consolidated Financial Statements
In determining the deferred tax liabilities, withholding tax and any other tax due for unremitted earnings of subsidiaries were not recognized. These earnings have been permanently reinvested.
Deferred tax assets not recognized in the Consolidated statement of financial positionCarry-forward losses for which deferred tax assets have not been recognized amounted to EUR 27.2 million at 31 December 2016 (2015: EUR 57.5 million). The maturity schedule is as follows:
In EUR millions 2017 2018 2019 2020 2021+ unlimited Total
Offsettable carry-forward losses 9.6 2.1 0.6 1.7 2.2 11.0 27.2
Deferred tax assets regarding these carry-forward losses have not been recognized because it is not probable that sufficient taxable profit will be available to utilize the deferred tax asset in time.

180 | Vopak | Annual Report 2016In
trod
uctio
nE
xecutive B
oard
repo
rtS
torin
g vital p
rod
ucts
with
careK
ey develo
pm
ents
per d
ivision
Su
stainab
ilityG
overnan
ce, risk an
d co
mp
liance
Ad
ditio
nal in
form
ation
| Vopak | Annual Report 2016 | Consolidated Financial StatementsFin
ancial S
tatemen
ts
Section 8 Other disclosuresThis section provides details on items which are not included in other sections, but which are of statutory or secondary importance for understanding the financial performance of the Group due to their nature. A list of principal subsidiaries, joint ventures and associates of the Vopak Group is also included in this section.
The following notes are presented in this section:• 8.1 Earnings per ordinary share - number of shares• 8.2 Loans granted and finance lease receivables• 8.3 Other non-current assets• 8.4 Pensions and other employee benefits• 8.5 Provisions• 8.6 Operating leases• 8.7 Investment commitments undertaken• 8.8 Contingent assets and contingent liabilities• 8.9 Financial assets and liabilities and related credit risk• 8.10 New standards and interpretations not yet implemented• 8.11 Principal subsidiaries, joint ventures and associates• 8.12 Subsequent events
Note 8.1 Earnings per ordinary share - number of sharesBasic earnings per ordinary share are calculated by dividing the net profit attributable to holders of ordinary shares by the time-weighted average number of outstanding ordinary shares (excluding the average number of treasury shares). The weighted average number of outstanding shares was 127,498,822 in 2016 (2015: 127,622,305).
In calculating the diluted earnings per ordinary share, the weighted average number of outstanding shares is adjusted for the dilutive effects of all dilutive potential ordinary shares, such as share-based payment plans.
The composition of the weighted average number of outstanding shares and of the diluted weighted average number of outstanding shares is as follows:
In thousands Note 2016 2015
Outstanding ordinary shares at 1 January 5.1 127,545 127,625
Purchase treasury shares 5.1 - 46 - 3
Basic weighted average number of ordinary shares 127,499 127,622
Dilutive effect of LTSPs (equity-settled part) 217 140
Weighted average number of ordinary shares including dilutive effect 127,716 127,762
At 31 December 2016, the company owned 370,000 treasury shares (2015: 290,000). The treasury shares have no voting rights attached to them, nor are they eligible for dividends during the period when these are held by the company.
When the vesting conditions of the equity-settled share-based payment plans are met, the settlement will result in an increase of the number of shares outstanding, which will have a dilutive effect. During 2016 and 2015, no share-based payment plans were settled and nil treasury shares were sold.
The LTSP 2014-2016 will be settled in 2017. For more information reference is made to note 6.2.

181Consolidated Financial Statements |In
trod
uctio
nE
xecutive B
oard
repo
rtS
torin
g vital p
rod
ucts
with
careK
ey develo
pm
ents
per d
ivision
Su
stainab
ilityG
overnan
ce, risk an
d co
mp
liance
Finan
cial Statem
ents
Ad
ditio
nal in
form
ation
Finan
cial Statem
ents
181 | Vopak | Annual Report 2016 | Consolidated Financial Statements
Note 8.2 Loans granted and finance lease receivable
Loans to joint ventures and
associates Other loansTotal loans
grantedFinance lease
receivable
In EUR millions 2016 2015 2016 2015 2016 2015 2016 2015
Carrying amount at 1 January 87.9 31.2 7.8 3.0 95.7 34.2 29.3 34.4
Movements:
Loans granted – 95.3 3.3 6.6 3.3 101.9 – –
Repayments - 85.9 - 19.5 – - 1.3 - 85.9 - 20.8 - 5.0 - 10.1
Reclassification to assets held for sale – - 23.5 – – – - 23.5 – –
Finance lease interest income – – – – – – 5.3 5.3
Exchange differences – 4.4 1.4 - 0.5 1.4 3.9 0.9 - 0.3
Carrying amount at 31 December 2.0 87.9 12.5 7.8 14.5 95.7 30.5 29.3
Non-current receivables 2.0 2.0 12.5 7.8 14.5 9.8 30.5 29.3
Current receivables – 85.9 – – – 85.9 – –
Carrying amount at 31 December 2.0 87.9 12.5 7.8 14.5 95.7 30.5 29.3
Loans granted do not include any subordinated loans.
On 22 February 2016, the associate Jubail Chemicals Storage and Services Company (JCSSC) entered into a non-recourse project financing. As a consequence, the initial proportionate shareholder loan from Vopak of EUR 85.9 million was repaid.
Reference is made to note 8.9 for the fair value information and note 5.6 on the remaining period at the end of the reporting period to the contractual maturity date.
With respect to the loans granted and the finance lease receivables, which are neither impaired nor past due, there are no indications as of the reporting date that the debtors will not meet their payment obligations.
Note 8.3 Other non-current assetsThe other non-current assets primarily relate to prepaid land use rights. These prepaid land use rights are allocated to the period to which they relate. The terms remaining at 31 December 2016 vary between 5 to 44 years.
Note 8.4 Pensions and other employee benefitsThe majority of employees are either covered by defined benefit plans, defined contribution plans or mandatory external pension plans. The defined benefit plans are plans that apply in the Netherlands, the United States, Germany and Belgium. A hybrid pension plan, combining average-pay pensions and defined contributions, applies in the Netherlands, while the other countries mostly operate final-pay pension plans. Most of the defined benefit plans are administrated by pension funds separated from the company.
Accounting policies
Defined benefit plansThe Group’s net pension obligation is calculated by an independent actuary, using the projected unit credit method. This calculation is performed separately for each plan by estimating the amount of the benefit that employees have earned in relation to their past services. The liability recognized in the balance sheet is the present value of these benefits at the end of the reporting period (defined benefit obligation) less the fair value of plan assets. The defined benefit obligation is determined by discounting the estimated future cash flows using interest rates of high-quality corporate bonds with durations matching the terms of the benefits.
The increase in the defined benefit obligation due to the passage of time and the expected return on plan assets, using the same interest rate as for the defined benefit obligation, are included in the pension costs.

182 | Vopak | Annual Report 2016In
trod
uctio
nE
xecutive B
oard
repo
rtS
torin
g vital p
rod
ucts
with
careK
ey develo
pm
ents
per d
ivision
Su
stainab
ilityG
overnan
ce, risk an
d co
mp
liance
Ad
ditio
nal in
form
ation
| Vopak | Annual Report 2016 | Consolidated Financial StatementsFin
ancial S
tatemen
ts
Past-service costs are recognized immediately in the statement of income. Actuarial gains and losses arising from experience adjustments and changes in actuarial assumptions are charged or credited to equity via other comprehensive income in the period in which they arise.
When a plan is changed or when a plan is curtailed, the resulting change in the defined benefit obligation that relates to past-service or the gain or loss on curtailment is recognized immediately in the statement of income under Personnel expenses.
Defined contribution plansContributions to defined contribution plans are recognized in the statement of income as incurred.
Key accounting estimates and judgmentsThe defined benefit obligation is determined on the basis of assumptions for future developments in variables such as salary increase, price index increase, life expectancy and discount rate. All assumptions are assessed at the reporting date. Changes in the assumptions may significantly affect the liabilities and pension costs under the defined benefit plans. The weighted average of these assumptions as well as sensitivities of key assumptions are disclosed in this note.
Pensions and other employee benefits
The Netherlands Foreign Total
in EUR millions 2016 2015 2016 2015 2016 2015
Funded defined benefit obligation 1,141.3 1,035.0 137.1 125.8 1,278.4 1,160.8
Fair value of plan assets - 1,035.9 - 972.8 - 96.0 - 85.3 - 1,131.9 - 1,058.1
Deficit of funded plans 105.4 62.2 41.1 40.5 146.5 102.7
Unfunded defined benefit obligation - - 19.2 19.1 19.2 19.1
Total deficit of defined benefit plans 105.4 62.2 60.3 59.6 165.7 121.8
Net pension obligation under defined contribution plans 3.8 5.1 1.0 0.7 4.8 5.8
Net pension obligation recognized at 31 December 109.2 67.3 61.3 60.3 170.5 127.6
Current liabilities 1.5 1.5
Non-current liabilities 169.0 126.1
Net pension obligation recognized at 31 December 170.5 127.6
Due to legislative changes in the Netherlands, the early retirement schemes for employees born on or after 1 January 1950 were curtailed as per 1 January 2006. These employees were offered a defined contribution plan and a contribution to a life-cycle savings scheme instead. A provision was formed in 2006 for future contributions that correspond to years of past service. The employer’s contribution to the defined contribution plan amounted to EUR 2.6 million in 2016 (2015: EUR 2.9 million), of which EUR 1.3 million (2015: EUR 1.5 million) is compensated for by the release of the provision for the employer’s contribution corresponding to years of past service.
Pension plan governance in the NetherlandsThe Dutch pension fund holds 88% (2015: 89%) of the total defined benefit obligation. Therefore, detailed information regarding the Dutch pension plan on a local basis is provided below.
Through the pension fund, employees are insured against the consequences of old age, disability and death. The employer and the employees (as of 1 January 2008) each pay contributions to the pension plan. The pension fund has the legal structure of a foundation. The (actuarial) risks related to the pension plan consist of demographic risks (primarily life expectancy) and financial risks (primarily discount rate, and return on plan assets) and are regularly reviewed by the board of trustees. The board of trustees is the most senior governing body of the pension fund and is composed of equal numbers of employer and employee representatives (including pensioners).

183Consolidated Financial Statements |In
trod
uctio
nE
xecutive B
oard
repo
rtS
torin
g vital p
rod
ucts
with
careK
ey develo
pm
ents
per d
ivision
Su
stainab
ilityG
overnan
ce, risk an
d co
mp
liance
Finan
cial Statem
ents
Ad
ditio
nal in
form
ation
Finan
cial Statem
ents
183 | Vopak | Annual Report 2016 | Consolidated Financial Statements
Pension plans in the Netherlands are subject to the Pension Act which includes the Financial Assessment Framework. This framework sets out minimum capital and buffer requirements for pension funds. A pension fund’s financial position is reflected mainly in the funding level. This expresses the relationship between the fair value of plan assets and the present value on a local basis of the benefits relating to past service, averaged over the last twelve months. The minimum required funding level is 104%. In addition, a pension fund must hold sufficient buffers (equity) to be able to cope with financial setbacks. The greater the investment risks in the pension fund, the higher the buffer requirements. The buffer requirement for the Dutch pension fund is 115%.
The Dutch pension fund had a funding level of 111% at year-end 2015. Averaged out over the last twelve months, the funding level at year-end 2015 amounted to 114%. The funding level at 31 December 2016 was calculated preliminarily at 112%. Averaged out over the last twelve months the funding level at year-end 2016 amounted to 109%. The Dutch pension fund holds insufficient buffers and has therefore submitted a recovery plan to the Dutch Central Bank (DNB) in 2016. DNB and the Dutch Authority for Financial Markets (AFM) oversee the Dutch pension funds. The recovery plan was approved by the DNB. According to the recovery plan no additional contributions are needed to restore the buffers. The financial agreement between the employer and the pension fund comprises a maximum employer’s contribution of 25% of total pensionable salaries.
An annual report including an actuarial review of the plan is prepared in accordance with legal requirements and can be found on the website of the pension fund (https://pensioenfonds.vopak.com).
The plan assets are managed by independent asset managers who also execute the investment transactions. A fiduciary asset manager has been appointed for the overall asset management.
The risks and monitoring controls for the pension fund have been analyzed based on the risk analysis method of the DNB. An update of this analysis was performed in 2016 and will be finalized in 2017. The risks of market-related fluctuations in the value of plan assets are managed by means of a prudent investment strategy and by monitoring the investments. The investment strategy is determined taking into account pension liabilities and local practice and derives from an asset-liability study executed in consultation with external advisors. In order to match liabilities, interest rate hedging and currency hedging strategies have been implemented and in order to stabilize returns, diversification is pursued. The monitoring covers, for example, risks related to changes in interest rates, equity values, currency rates and credit spreads.
Recognized cost of defined benefit plansThe following table summarizes the effects of the pension expenses of defined benefit plans recorded in the Consolidated statement of income and the remeasurements of these plans which were directly recognized in equity through other comprehensive income.
The Netherlands Foreign Total
in EUR millions Note 2016 2015 2016 2015 2016 2015
Current service costs 20.3 23.6 5.1 7.8 25.4 31.4Past service costs and gains (-) and losses from settlements – – 0.1 – 0.1 –
Administration costs and taxes 1.0 1.0 0.3 0.2 1.3 1.2
Service costs 21.3 24.6 5.5 8.0 26.8 32.6
Net Interest expenses 1.3 2.5 1.8 2.2 3.1 4.7Components of defined benefit costs recorded in profit or loss 2.5 22.6 27.1 7.3 10.2 29.9 37.3
Remeasurement of net defined benefit liability:Return on plan assets (excluding interest income on plan assets) - 64.5 - 5.8 - 3.3 4.6 - 67.8 - 1.2Actuarial gains (-) and losses from changes in demographic assumptions 3.3 – - 0.7 5.4 2.6 5.4Actuarial gains (-) and losses arising from experience 5.8 - 5.6 - 1.6 - 3.6 4.2 - 9.2Actuarial gains (-) and losses arising from changes in financial assumptions 90.2 - 76.1 5.8 - 14.9 96.0 - 91.0
Components of defined benefit costs recorded in other comprehensive income 34.8 - 87.5 0.2 - 8.5 35.0 - 96.0
Total of components of defined benefit costs 57.4 - 60.4 7.5 1.7 64.9 - 58.7

184 | Vopak | Annual Report 2016In
trod
uctio
nE
xecutive B
oard
repo
rtS
torin
g vital p
rod
ucts
with
careK
ey develo
pm
ents
per d
ivision
Su
stainab
ilityG
overnan
ce, risk an
d co
mp
liance
Ad
ditio
nal in
form
ation
| Vopak | Annual Report 2016 | Consolidated Financial StatementsFin
ancial S
tatemen
ts
The costs recognized in 2016 in relation to the defined benefits plans of the divested UK terminals amounted to EUR 0.8 million.
Market volatility had a negative impact on the Group’s defined benefit plans in 2016, which resulted in remeasurement losses (gross) of EUR 35.0 million (2015: gain of EUR 96.0 million), being recorded, net of tax, in other comprehensive income. These remeasurements were mostly the result of lower discount rates.
Changes in defined benefit obligation
The Netherlands Foreign Total
in EUR millions 2016 2015 2016 2015 2016 2015
Defined benefit obligation at 1 January 1,035.0 1,106.4 144.9 241.3 1,179.9 1,347.7
Movements:
Current service costs 20.3 23.6 4.3 7.8 24.6 31.4
Past service costs – – 0.1 – 0.1 –
Interest expenses 22.9 22.9 5.1 8.8 28.0 31.7Actuarial gains (-) and losses from changes in demographic assumptions (remeasurement) 3.3 – - 0.7 5.4 2.6 5.4
Actuarial gains (-) and losses from experience 5.8 - 5.6 - 1.6 - 3.6 4.2 - 9.2Actuarial gains (-) and losses from changes in financial assumptions (remeasurement) 90.2 - 76.1 5.8 - 14.9 96.0 - 91.0
Benefits paid from the pension fund - 38.6 - 38.4 - 3.8 - 6.3 - 42.4 - 44.7
Benefits paid directly by the employer – – - 1.9 - 1.8 - 1.9 - 1.8
Employees' contributions 1.4 1.2 – 0.5 1.4 1.7
Administration costs and taxes 1.0 1.0 0.3 0.2 1.3 1.2
Curtailment due to divestments – – – - 1.1 – - 1.1
Reclassification to held for sale – – – - 107.7 – - 107.7
Exchange differences – – 3.8 16.3 3.8 16.3
Defined benefit obligation at 31 December 1,141.3 1,035.0 156.3 144.9 1,297.6 1,179.9
Allocated to the plans' participants:
Active members 388.9 328.4 66.4 59.1 455.3 387.5
Deferred members 217.3 188.7 36.3 35.7 253.6 224.4
Pensioners 535.1 517.9 53.6 50.1 588.7 568.0
Defined benefit obligation at 31 December 1,141.3 1,035.0 156.3 144.9 1,297.6 1,179.9

185Consolidated Financial Statements |In
trod
uctio
nE
xecutive B
oard
repo
rtS
torin
g vital p
rod
ucts
with
careK
ey develo
pm
ents
per d
ivision
Su
stainab
ilityG
overnan
ce, risk an
d co
mp
liance
Finan
cial Statem
ents
Ad
ditio
nal in
form
ation
Finan
cial Statem
ents
185 | Vopak | Annual Report 2016 | Consolidated Financial Statements
Change in the fair value of plan assets and major classes of plan assetsThe following tables summarize the changes in the fair value of the plan assets and the composition of the characteristics/main elements of the plan assets at 31 December.
The Netherlands Foreign Total
in EUR millions 2016 2015 2016 2015 2016 2015
Movement in fair value of plan assetsFair value of plan assets at 1 January 972.8 972.4 85.3 164.5 1,058.1 1,136.9
Movements:
Interest income 21.6 20.4 3.3 6.6 24.9 27.0Return on plan assets excluding interest income (remeasurement gains and losses) 64.5 5.8 3.3 - 4.6 67.8 1.2
Employer's contributions 14.2 11.4 7.0 9.4 21.2 20.8
Employees' contributions 1.4 1.2 – 0.5 1.4 1.7
Benefits paid - 38.6 - 38.4 - 5.7 - 8.1 - 44.3 - 46.5
Reclassification to held for sale – – – - 95.3 – - 95.3
Exchange differences – – 2.8 12.3 2.8 12.3
Fair value of plan assets at 31 December 1,035.9 972.8 96.0 85.3 1,131.9 1,058.1
Major classes of plan assetsAAA 247.4 235.0 12.7 10.1 260.1 245.1
AA 123.3 121.1 7.4 6.2 130.7 127.3
A 51.3 49.1 14.4 15.9 65.7 65.0
BBB and lower 166.2 141.8 21.5 17.9 187.7 159.7
Not rated 23.5 56.8 0.9 1.1 24.4 57.9
Bonds 611.7 603.8 56.9 51.2 668.6 655.0
- Europe 90.0 82.0 8.3 7.2 98.3 89.2
- North America 145.9 123.9 29.3 26.1 175.2 150.0
- Asia-Pacific 45.0 38.5 1.3 0.6 46.3 39.1
- Emerging markets 58.3 64.1 0.2 0.2 58.5 64.3
Equity instruments 339.2 308.5 39.1 34.1 378.3 342.6
- Europe 32.3 29.7 – – 32.3 29.7
- North America 20.6 17.0 – – 20.6 17.0
- Asia-Pacific 6.5 8.0 – – 6.5 8.0
- Emerging markets 4.9 2.0 – – 4.9 2.0
Real estate 64.3 56.7 – – 64.3 56.7
- Interest rate swaps 20.5 14.9 – – 20.5 14.9
- Forward foreign exchange contracts 0.2 - 11.1 – – 0.2 - 11.1
Derivatives 20.7 3.8 – – 20.7 3.8
Fair value of plan assets at 31 December 1,035.9 972.8 96.0 85.3 1,131.9 1,058.1
Investments are well-diversified, such that the failure of any single investment would not have a material impact on the overall level of assets.
Government Bonds generally have a credit rating that is not lower than ‘A’ and have quoted market prices in an active market (level 1 fair value classification). Corporate bonds are generally categorized in level 2 of the fair value hierarchy. Equity instruments represent investments in equity funds and direct investments. They are generally based on quoted market prices in an active market (level 1 fair value classification). Real estate consists of investments in (listed) real estate funds.
Derivatives are only used for risk management purposes, no speculative positions were adopted. In the absence of quoted prices, other observable inputs are used to estimate fair value (level 2 fair value classification).
The pension fund has not invested directly in shares of Royal Vopak, parts of the Group or in real estate of the Group.

186 | Vopak | Annual Report 2016In
trod
uctio
nE
xecutive B
oard
repo
rtS
torin
g vital p
rod
ucts
with
careK
ey develo
pm
ents
per d
ivision
Su
stainab
ilityG
overnan
ce, risk an
d co
mp
liance
Ad
ditio
nal in
form
ation
| Vopak | Annual Report 2016 | Consolidated Financial StatementsFin
ancial S
tatemen
ts
Expected maturity, contribution and impact on resultThe expected maturity analysis of undiscounted pension benefits at 31 December 2016 is as follows:
In EUR millions 2017 2018 2019 2020 2021 2022+ Total
Undiscounted pension benefits 42.2 42.0 41.8 43.2 44.4 1,854.7 2,068.3
The employer’s contribution for defined benefit plans to the Dutch pension plan increased from EUR 20.8 million in 2015 to EUR 21.2 million in 2016. Based on the latest funding agreements, the employer’s contribution is expected to remain at this level in 2017.
Assumptions and sensitivity analysis
AssumptionsThe Netherlands Foreign Total
2016 2015 2016 2015 2016 2015Assumptions based on weighted average at 31 DecemberDiscount rate on net liability 1.82% 2.25% 3.43% 3.67% 2.01% 2.42%
Expected general salary increase 2.75% 2.75% 4.47% 4.44% 2.96% 2.96%
Expected price index increase 1.75% 1.75% 2.64% 2.62% 1.86% 1.86%
Life expectancy in years:
Age 65 for men 21.5 21.5 20.9 21.2
Age 65 for women 24.0 23.6 23.4 23.9
Age 65 in 20 years for men 23.9 23.7 22.4 22.7
Age 65 in 20 years for women 26.3 25.8 24.9 25.4
The discount rates used in the determination of defined benefit obligations and pension expenses are based on high quality corporate bonds (AA) with a duration matching the duration of the pension liabilities.
In addition, the calculations were based on recent mortality tables, taking future developments in mortality rates into account through projections or surpluses. Local historical data were used for turnover and disability assumptions.
The liabilities and pension expenses related to defined benefit plans are subject to risks regarding changes in discount rates, plan assets and returns derived from these assets, future salary increases, inflation and life expectancy. Such changes can negatively or positively influence the liabilities and necessitate additional future pension charges under IAS 19. The table below shows the estimated impact on the defined benefit obligations for defined benefit plans for each risk variable.
Sensitivity analysisIn EUR millions Change Increase Decrease
Sensitivity assumptionsPrice inflation 1.0% 265.8 - 205.6
Salary growth 0.25% 2.1 - 2.1
Discount rates 1.0% - 218.4 282.6
Life expectation 1 year 52.4 NA
The sensitivity analysis is based on realistically possible changes as at the end of the financial year. Each change in a significant actuarial assumption was analyzed separately as part of the test. Interdependencies were not taken into account.
The pension expenses for defined benefit plans are expected to increase from EUR 29.9 million in 2016 to approximately EUR 36.5 million in 2017, mainly due to lower discount rates.

187Consolidated Financial Statements |In
trod
uctio
nE
xecutive B
oard
repo
rtS
torin
g vital p
rod
ucts
with
careK
ey develo
pm
ents
per d
ivision
Su
stainab
ilityG
overnan
ce, risk an
d co
mp
liance
Finan
cial Statem
ents
Ad
ditio
nal in
form
ation
Finan
cial Statem
ents
187 | Vopak | Annual Report 2016 | Consolidated Financial Statements
Note 8.5 Provisions
Accounting policiesProvisions are recognized for legal or constructive obligations that arose in the past, the amount of which, though uncertain, can be reliably estimated and where it is probable that the settlement of the obligations will entail a cash outflow. Provisions are measured at the present value of the expenditures expected to be required to settle the obligation using a pre-tax rate that reflects current market assessments of the time value of money and the risks specific to the obligation. The increase in the provision due to the passage of time is recognized as interest expense.
In accordance with current legislation, environmental plans and other measures to be adopted are agreed with local, regional and national authorities as appropriate. As soon as such plans are approved or other statutory obligations arise, a provision is formed based on the most reliable estimate possible of the future expenses.
A provision for reorganization is formed when Vopak has approved a detailed and formalized reorganization plan and when the reorganization has either commenced or been made public.
Provisions for other deferred long-term employee benefits, other than pensions and other employee benefits, for example, redundancy benefits, anniversary bonuses and long-term remuneration settled in cash, are calculated using the method for defined benefit plans. Any actuarial results arising are recognized immediately in the statement of income. The same applies to any changes relating to past service.
Key accounting estimates and judgmentsThe amount recognized as a provision is management’s best estimate of the amount required to settle the obligation. The outcome depends on future events that are uncertain by nature. In assessing the likely outcome of lawsuits and tax disputes, management also bases its assessment on external legal assistance and established precedents.
The Group is exposed to risks regarding environmental obligations arising from past activities. For example, a number of sites have to be decontaminated before being handed back at the end of the contractual period. Under current legislation, environmental plans and any other measures to be adopted have to be agreed with local, regional and national authorities as appropriate. As soon as such plans are approved or other legal obligations arise, a provision is formed based on the most reliable estimate of possible future expenses. Given the degree of difficulty in making estimates, this does not guarantee that no additional costs will arise in the future.

188 | Vopak | Annual Report 2016In
trod
uctio
nE
xecutive B
oard
repo
rtS
torin
g vital p
rod
ucts
with
careK
ey develo
pm
ents
per d
ivision
Su
stainab
ilityG
overnan
ce, risk an
d co
mp
liance
Ad
ditio
nal in
form
ation
| Vopak | Annual Report 2016 | Consolidated Financial StatementsFin
ancial S
tatemen
ts
Movements in provisions
In EUR millionsEnvironmental
liabilities Other Total
Non-current liabilities 6.6 19.5 26.1
Current liabilities 11.0 17.1 28.1
Balance at 31 December 2015 17.6 36.6 54.2
Movements:
Additions 0.7 17.8 18.5
Acquisitions 1.9 – 1.9
Withdrawals - 2.3 - 6.7 - 9.0
Releases - 0.2 - 6.7 - 6.9
Interest accrual 0.3 – 0.3
Exchange differences 0.4 0.6 1.0
Balance at 31 December 2016 18.4 41.6 60.0
Non-current liabilities 8.1 15.7 23.8
Current liabilities 10.3 25.9 36.2
Balance at 31 December 2016 18.4 41.6 60.0
Expected withdrawals
< 1 year 10.3 25.9 36.2
2nd year 2.5 7.2 9.7
3rd year 2.9 2.6 5.5
4th year 0.7 1.8 2.5
5th year 0.3 0.8 1.1
> 5th year 1.7 3.3 5.0
Total 18.4 41.6 60.0
Environmental provisionsVopak is obliged to clean up soil contamination at different locations. In general, an accurate and reliable estimate of the provision for this environmental risk can only be made after conducting a thorough survey and drawing up a management plan for the site, on the basis of which the governmental authorities issue an order.
At year-end 2016, the total provision for environmental liabilities amounted to EUR 18.4 million (2015: EUR 17.6 million). The provision mainly relates to environmental liabilities at various terminals in the divisions Netherlands, EMEA and the Americas. No material additions to the environmental provision were made during 2016.
Other provisionsThe other provisions primarily relate to legal and claims-related provisions and the provisions for the LTIPs. Many of the claims-related provisions concern insured events, for which the receivable on the insurance company is recognized separately under the Other receivables.
LTIPsOther provisions included an amount of EUR 14.5 million (2015: EUR 7.3 million) for the LTCPs (see note 6.2), for the cash-settled share-based payments of the LTSPs (see note 1 to the first table of note 6.2). EUR 11.1 million of the provision in relation to the LTIPs will be settled in 2017 (2016: nil). The addition to the provisions in connection with the LTIPs amounted to EUR 7.3 million in 2016 (2015: EUR 5.3 million). Reference is also made to note 6.2.

189Consolidated Financial Statements |In
trod
uctio
nE
xecutive B
oard
repo
rtS
torin
g vital p
rod
ucts
with
careK
ey develo
pm
ents
per d
ivision
Su
stainab
ilityG
overnan
ce, risk an
d co
mp
liance
Finan
cial Statem
ents
Ad
ditio
nal in
form
ation
Finan
cial Statem
ents
189 | Vopak | Annual Report 2016 | Consolidated Financial Statements
OtherPer year-end 2016, EUR 27.1 million (2015: EUR 29.3 million) was recognized under the Other provisions, which comprises primarily various smaller legal cases and claim settlements mainly in the divisions Netherlands and Americas, of which the larger part was related to insured events. For more information, reference is also made to note 2.6. On balance, EUR 10.5 million (2015: EUR 21.3 million) was added for expected claims in 2016.
In 2015, the EMEA division recognized a net exceptional loss for the increase of its legal provisions with regard to a legal case for the amount of EUR 2.5 million relating to the divested entity Vopak Terminal Finland. At year-end 2016, a provision of EUR 2.4 million was recognized for this case. This case will most likely be resolved in the near future.
No other individual items within the remaining provisions are considered to be individually material. The company expects that the current cases provided for will be substantively resolved within five years.
Note 8.6 Operating leasesThe amounts due in respect of non-cancellable operating leases are as follows:
In EUR millions 2016 2015
Less than 1 year 55.3 61.0
Between 1 and 5 years 204.1 222.8
More than 5 years 479.6 562.5
Total 739.0 846.3
The lease amounts due are mainly in respect of the leasehold on land and the lease of buildings.
In 2016, EUR 62.5 million was recognized as expenses in the statement of income relating to operating leases and hires (2015: EUR 64.9 million).
Note 8.7 Investment commitments undertakenThe investment commitments undertaken by the Group for subsidiaries amounted to EUR 106.1 million as at 31 December 2016 (2015: EUR 147.8 million), and were primarily related to property, plant and equipment.
Note 8.8 Contingent assets and contingent liabilities
Contingencies in respect of joint ventures and associates
Joint ventures Associates Total
In EUR millions 31-Dec-16 31-Dec-15 31-Dec-16 31-Dec-15 31-Dec-16 31-Dec-15
Commitments to provide debt or equity funding – – 71.4 77.4 71.4 77.4
Guarantees and securities provided 123.1 177.4 – – 123.1 177.4
The decrease in guarantees and securities provided is mainly due to the cancellation of a (indirect) financial guarantee provided for the divested joint venture Vopak Terminal Dongguan (China) for the amount of EUR 33.2 million and due to the partial repayment of the loan to PT Jakarta Tank Terminal (Indonesia) and the fulfillment of conditions precedent with respect to the loan for the amount of EUR 19.8 million.
The commitments for associates mainly relate to the construction of the industrial terminal PT2SB in Pengerang (Malaysia).
The amounts of guarantees and securities can potentially be called within one year.
Guarantees and securities included in ratio calculationsThe notional amount of guarantees and securities provided on behalf of participating interests in joint ventures and associates, which is also included in ratios, decreased from EUR 119.0 million at 31 December 2015 to EUR 100.4 million at 31 December 2016. Of this amount, EUR 0.1 million was recognized in the statement of financial position (2015: EUR 0.1 million). Reference is also made to note 5.5.

190 | Vopak | Annual Report 2016In
trod
uctio
nE
xecutive B
oard
repo
rtS
torin
g vital p
rod
ucts
with
careK
ey develo
pm
ents
per d
ivision
Su
stainab
ilityG
overnan
ce, risk an
d co
mp
liance
Ad
ditio
nal in
form
ation
| Vopak | Annual Report 2016 | Consolidated Financial StatementsFin
ancial S
tatemen
ts
Other contingencies
Environmental obligationsThe Group is exposed to risks regarding environmental obligations arising from past activities. For example, a number of sites have to be decontaminated before being handed back at the end of the contractual period. Under current legislation, environmental plans and any other measures to be adopted have to be agreed with local, regional and national authorities as appropriate. As soon as such plans are approved or other legal obligations arise, a provision is formed based on the most reliable estimate possible of future expenses. The Executive Board is of the opinion that the provisions are adequate, based on information currently available. However, given the degree of difficulty in making estimates, this does not guarantee that no additional costs will arise going forward.
Other legal proceedings and risksAs a result of its day-to-day activities, the Group is involved in a number of other legal proceedings. The Executive Board is of the opinion that for the legal cases and risks for which no provisions have been recognized, it is not probable that the final outcome will result in a cash outflow, therefore no provisions have been formed. Furthermore, as explained in the Internal control and risk management, the Group can be held liable for any non-compliance with laws and regulations. The risks in connection with non-compliance as well as the potential impact on the company, are disclosed in the Internal control and risk management section of this report.
As part of divestments of terminals and assets, Vopak has provided certain customary representations and warranties in the relevant sales purchase agreements. These representations and warranties will generally terminate, depending on their specific features, a number of years after the relevant transaction completion date. Based on the current facts and circumstances, management has determined that for the items for which no provision is currently recognized, the likelihood of a cash outflow relating to these items is considered to be remote.
Note 8.9 Financial assets and liabilities and credit risk
Financial assets and liabilities
Carrying amount Fair value
In EUR millions Note 2016 2015 2016 2015
Other financial assets 1.1 1.0 1.1 1.0
Currency derivatives 149.4 133.0 149.4 133.0
Interest rate derivatives - 101.5 - 96.9 - 101.5 - 96.9
Financial instruments at fair value 49.0 37.1 49.0 37.1
Loans granted 8.2 14.5 95.7 14.5 95.7
Trade and other receivables 4.2 224.6 232.0 224.6 232.0
Cash and cash equivalents 5.5 306.0 109.9 306.0 109.9
Finance lease receivable 8.2 30.5 29.3 30.5 29.3
Loans and receivables 575.6 466.9 575.6 466.9
Bank overdrafts and short-term borrowings 5.5 - 8.5 - 98.6 - 8.5 - 98.6
US Private Placements 5.5 - 1,832.5 - 1,812.2 - 2,030.1 - 1,966.5
SGD Private Placements 5.5 – - 146.2 – - 154.9
JPY Private Placement 5.5 - 162.7 - 153.1 - 178.0 - 157.9
Bank loans 5.5 - 65.8 - 65.0 - 69.0 - 67.6
Credit facilities and other long-term loans 5.5 - 40.7 - 130.4 - 40.7 - 130.4
Trade creditors 4.3 - 43.6 - 40.1 - 43.6 - 40.1
Other creditors 4.3 - 98.5 - 117.7 - 98.5 - 117.7
Other financial liabilities -2,252,3 - 2,563.3 -2,468.4 - 2,733.7
Net at amortized cost -1,676.7 - 2,096.4 -1892.8 - 2,266.8
Standby credit facility 5.5 1,046.1 948.7
Standby bank facility 180.0 147.0
Unrecognized financial instruments 1,226.1 1,095.7

191Consolidated Financial Statements |In
trod
uctio
nE
xecutive B
oard
repo
rtS
torin
g vital p
rod
ucts
with
careK
ey develo
pm
ents
per d
ivision
Su
stainab
ilityG
overnan
ce, risk an
d co
mp
liance
Finan
cial Statem
ents
Ad
ditio
nal in
form
ation
Finan
cial Statem
ents
191 | Vopak | Annual Report 2016 | Consolidated Financial Statements
Determination of fair value for financial instrumentsA number of the Group’s accounting policies and disclosures require the determination of fair value for the financial instruments. A fair value measurement is an estimate of the price that would be received upon the sale of an asset or paid to transfer a liability in an orderly transaction between market participants at the measurement date. Where available, fair value measurements are derived from quoted prices (unadjusted) in active markets for identical assets or liabilities (level 1). In the absence of such information, other observable inputs, either directly (i.e. as prices) or indirectly (i.e. derived from prices), are used to estimate fair values (level 2). There were no financial instruments measured at fair value using level 3 (inputs not based on observable market data). Inputs derived from external sources are corroborated or otherwise verified, as appropriate.
The fair values of the Private Placements, revolving credit facility and other long-term bank loans are measured by discounting the future cash flows using observable market interest information (level 2) as no similar instrument is available due to the specific profiles of the instruments. The calculations include credit spreads based on the most recent borrowing contracts.
The fair values of interest rate swaps, cross-currency interest rate swaps and forward foreign exchange contracts are determined by discounting the future cash flows using the applicable period-end yield curve, taking into account credit risk and the risk of non-performance.
In view of the short-term nature or the magnitude of the amounts, the Group considers that the fair value of loans granted, trade and other receivables, cash and cash equivalents, bank overdrafts, credit facilities, other long-term loans and trade creditors are not materially different to their carrying value.
The initial measurement at the trade date of all financial instruments is the fair value. Except for derivatives, the initial measurement of financial instruments is adjusted for directly attributable transaction costs.
Credit risk and credit risk management Credit risk arises when a customer or other counterparty of a financial instrument fails to discharge its contractual obligation.
Vopak’s credit risk arises primarily from loans granted, trade and other receivables, cash and cash equivalents, and derivative financial instruments. Vopak’s maximum exposure to credit risks is the carrying amount of these financial assets, amounting to EUR 675.2 million (2015: EUR 573.5 million), and the credit replacing guarantees amounting to EUR 100.4 million (2015: EUR 119.0 million). Of this amount, EUR 0.1 million was recognized in the statement of financial position at year-end 2016 (2015: EUR 0.1 million).
Loans granted to joint ventures and associates are not secured by collateral.
Credit risk with regard to trade receivables and lease receivables is limited as the value of the product stored for these clients usually exceeds the value of the receivables and Vopak generally has the right of retention although other claims may have priority ranking over the right of retention in a bankruptcy case. Vopak constantly monitors the outstanding receivables and the value of the stored products. See note 4.2 for further details.
Vopak has spread its liquidity investments across a select group of high rated financial institutions while daily limiting the cash and cash equivalents within the Group and assessing the exposure to each financial institution. Vopak applies credit limits per institution, depending on their credit ratings and credit default swap spread, and regularly reviews these limits. These treasury activities are concluded with financial institutions that have at least an A- Standard & Poor’s credit rating. At 31 December 2016, the maximum risk in the event of the default of a single financial institution amounted to EUR 87.9 million (2015: EUR 66.2 million).

192 | Vopak | Annual Report 2016In
trod
uctio
nE
xecutive B
oard
repo
rtS
torin
g vital p
rod
ucts
with
careK
ey develo
pm
ents
per d
ivision
Su
stainab
ilityG
overnan
ce, risk an
d co
mp
liance
Ad
ditio
nal in
form
ation
| Vopak | Annual Report 2016 | Consolidated Financial StatementsFin
ancial S
tatemen
ts
The derivative financial instruments will be settled on a gross basis. The credit risk of derivative financial instruments with a positive value is mitigated by ISDA Master Agreements with counterparties, which have the option to settle all gross amounts on a net basis in the event of a default of the counterparty, and by setting qualitative and financial limits for the derivative counterparties. For JPY cross-currency hedges, which have an initial maturity of 30 years, break clauses are applicable to reduce the credit risk to a period shorter than 10 years. The Group maintains a control system that includes the authorization, reporting and monitoring of derivative activities including the Credit Default Swaps developments of counterparties observed on the secondary market. Vopak believes there are no material credit risks to the Group’s financial position. At year-end 2016, the derivatives with a counterparty credit risk amounted to EUR 130.1 million (2015: EUR 135.9 million).
Assessing the financial positions of counterparties is part of our credit management and tendering process; however, this cannot exclude all credit risk.
Note 8.10 New standards and interpretations not yet implemented
IFRS 15 - Revenue from contracts with customers The IASB published IFRS 15 ’Revenue from contracts with customers’ in May 2014. This standard contains principles that an entity will apply to determine the measurement of revenue and timing when revenue is recognized. The underlying principle is that an entity will recognize revenue to depict the transfer of goods or services to customers at an amount that the entity expects to be entitled to in exchange for those goods or services. This new standard will be effective as of 1 January 2018 and has been endorsed by the European Union. The company has finalized its assessment of the effects of this new standard. It was concluded that the effects on the annual result will be limited, apart from the fact that additional disclosures will need to be provided.
IFRS 9 - Financial instruments IFRS 9, ‘Financial instruments’, addresses the classification, measurement and recognition of financial assets and financial liabilities. The complete version of IFRS 9 was issued in July 2014. This new standard replaces the guidance in IAS 39. This new standard will be effective as of 1 January 2018 and has been endorsed by the European Union. The company has finalized its impact assessment of IFRS 9 ‘Financial Instruments’. It was concluded that the new hedge accounting requirements will provide more flexibility to the company as it is more aligned with the financial risk management policies of the company, but that the direct financial effects of the new standard - including those relating to the new impairment requirements - will be limited.
IFRS 16 - Leases The IASB published IFRS 16 ‘Leases’ in January 2016. IFRS 16 will require almost all leases of companies to be on the balance sheet of lessees and introduces a single income statement model which basically treats all leases as finance leases. Lessor accounting has not changed significantly. This new standard will be effective as of 1 January 2019 and has not yet been endorsed by the European Union. The company has started its impact assessment of this new standard.
It has been concluded preliminary that in most cases the services that Vopak provides to its customers do not contain a lease due to the absence of an identified asset. As the definition of a lease under IFRS 16 is substantially the same as under the current IAS 17, this conclusion is the same under both standards. As such, Vopak does not act as a lessor for most contracts in line with the current accounting treatment.
Furthermore, as the company has a large portfolio of long-term land leases and leases of other non-current assets, the impact on the statement of financial position and the result of the company of applying the new standard is estimated to be material from a lessee perspective.
There are no other new standards, amendments to existing standards or new IFRIC interpretations that are not yet effective that are expected to have a material impact on the Group.

193Consolidated Financial Statements |In
trod
uctio
nE
xecutive B
oard
repo
rtS
torin
g vital p
rod
ucts
with
careK
ey develo
pm
ents
per d
ivision
Su
stainab
ilityG
overnan
ce, risk an
d co
mp
liance
Finan
cial Statem
ents
Ad
ditio
nal in
form
ation
Finan
cial Statem
ents
193 | Vopak | Annual Report 2016 | Consolidated Financial Statements
Note 8.11 Principal subsidiaries, joint ventures and associates
SUBSIDIARIES
Europe, Middle East & Africa
BelgiumVopak Agencies Antwerpen NV Vopak Terminal Eurotank NV Vopak Chemical Terminals Belgium NV
GermanyVopak DUPEG Terminal Hamburg GmbH Vopak Agency Germany GmbH
The NetherlandsVopak Agencies Amsterdam B.V. Vopak Agencies Rotterdam B.V. Vopak Agencies Terneuzen B.V. Vopak Chemicals Logistics Netherlands B.V. Vopak EMEA B.V. Vopak Finance B.V. Vopak Global IT B.V. Vopak Global Procurement Services B.V. Vopak LNG Holding B.V. Vopak Nederland B.V. Vopak Terminal Amsterdam Westpoort B.V. Vopak Terminal Botlek B.V. Vopak Terminal Chemiehaven B.V. Vopak Terminal Europoort B.V. Vopak Terminal Laurenshaven B.V. Vopak Terminals North Netherlands B.V. Vopak Terminal TTR B.V. Vopak Terminal Vlaardingen B.V. Vopak Terminal Vlissingen B.V.
South AfricaVopak Terminal Durban (Pty) Ltd. (70%)
SpainVopak Terminal Algeciras S.A. (80%)
SwitzerlandMonros AG
United KingdomVopak Holding Bacrippuls Ltd
Asia Pacific
AustraliaVopak Terminals Australia Pty Ltd. Vopak Terminals Sydney Pty Ltd. Vopak Terminal Darwin Pty Ltd.
ChinaVopak China Management Company Ltd. Vopak Terminal Zhangjiagang Ltd. Vopak Terminal Shangdong Lanshan (60%)1
IndiaVopak Terminals Kandla (CRL Terminals Pvt, Ltd.)
IndonesiaPT Vopak Terminal Merak (95%)
SingaporeVopak Asia Pte. Ltd. Vopak Terminals Singapore Pte. Ltd. (69.5%)2 Vopak Terminal Penjuru Pte. Ltd. (100%)3 Vopak Gas Terminal LLP (80%)4
VietnamVopak Vietnam Co. Ltd.
Americas
BrazilVopak Brasil S.A. VPK Partiçipacões e Serviçoes Portuários Ltda.
CanadaVopak Terminals of Canada Inc. Vopak Terminals of Eastern Canada Inc.
ColombiaVopak Colombia S.A.
MexicoVopak Mexico SA de CV
PanamaVopak Panama Atlantic Inc. Terminal Atlantica de Panama S. de R.L.
United StatesVopak North America Inc. Vopak Terminals North America Inc. Vopak Terminal Deer Park Inc. Vopak Terminal Savannah Inc. Vopak Terminal Los Angeles Inc. Vopak Terminal Long Beach Inc.
VenezuelaVopak Venezuela S.A.
1. Vopak Terminal Penjuru Pte. Ltd. 60% ownership in Vopak Terminals Shangdong Lanshan2. Vopak Holding Singapore Pte. Ltd 69.5% ownership in Vopak Terminals Singapore Pte. Ltd.3. Vopak Terminals Singapore Pte. Ltd. 100% ownership in Vopak Terminals Penjuru Pte. Ltd.4. Vopak Terminals Singapore Pte. Ltd. 80% ownership in Vopak Gas Terminal LLP

194 | Vopak | Annual Report 2016In
trod
uctio
nE
xecutive B
oard
repo
rtS
torin
g vital p
rod
ucts
with
careK
ey develo
pm
ents
per d
ivision
Su
stainab
ilityG
overnan
ce, risk an
d co
mp
liance
Ad
ditio
nal in
form
ation
| Vopak | Annual Report 2016 | Consolidated Financial StatementsFin
ancial S
tatemen
ts
JOINT VENTURES
Europe, Middle East & Africa
EstoniaAS Vopak E.O.S. (50%)
The NetherlandsGate Terminal B.V. (50%) MultiCore CV (25%) Vopak Terminal Eemshaven B.V. (50%)
PakistanEngro Vopak Terminal Ltd. (50%)
SpainTerminals Quimicos SA (Terquimsa) (50%)
SwedenVopak Agencies Sweden A.B. (50%)
United Arab EmiratesVopak Horizon Fujairah Ltd. (33.33%)
Asia Pacific
ChinaVopak Terminal Ningbo Co. Ltd. (50%) Vopak Shanghai Logistics Company Ltd. (50%) Vopak Nanjiang Petrochemicals Terminal Tianjin Company Ltd. (50%) Vopak Bohua (Tianjin) Terminal Co. Ltd. (50%) Tianjin Lingang Vopak Bohua Jetty Co. Ltd. (30%) Vopak Terminal SDIC Yangpu Co. Ltd. (49%)
IndonesiaPT Jakarta Tank Terminal (49%)
KoreaVopak Terminals Korea Ltd. (51%)
MalaysiaKertih Terminals Sdn. Bhd. (30%)1 Pengerang Terminals Sdn. Bhd. (49%)2 Pengerang Independent Terminals Sdn. Bhd. (90%)3
SingaporeBanyan Cavern Storage Services Pte. Ltd. (45%)4 Vopak TOS Agency Singapore Pte Ltd (50%)
ThailandThai Tank Terminal Ltd. (49%)
Americas
BrazilUniao-Vopak Armazens Gerais Limitada (50%)
MexicoTerminal de Altamira de S. de R.L. de C.V. (60%)
PanamaPayardi Terminal Company S. de R.L. (50%)
ASSOCIATES
ChinaZhangzhou Gulei Haiteng Jetty Investment and Management Co. Ltd. (30%)
MalaysiaPengerang Terminals (Two) Sdn. Bhd. (29.7%)
Saudi ArabiaJubail Chemicals Storage & Services Company LLC / Chemtank (25%)
The NetherlandsMaasvlakte Olie Terminal N.V. (16.67%)
1. Vopak Terminal Penjuru Pte. Ltd. 30% ownership in Kertih Terminals Sdn. Bhd.2. Vopak Terminal Pengerang B.V. 49% ownership in Pengerang Terminals Sdn. Bhd.3. Pengerang Terminals Sdn Bhd. 90% ownership in Pengerang Independent Terminals Sdn. Bhd.4. Vopak Terminals Singapore Pte. Ltd. 45% ownership in Banyan Cavern Storage Services Pte. Ltd.

195Consolidated Financial Statements |In
trod
uctio
nE
xecutive B
oard
repo
rtS
torin
g vital p
rod
ucts
with
careK
ey develo
pm
ents
per d
ivision
Su
stainab
ilityG
overnan
ce, risk an
d co
mp
liance
Finan
cial Statem
ents
Ad
ditio
nal in
form
ation
Finan
cial Statem
ents
195 | Vopak | Annual Report 2016 | Consolidated Financial Statements
Note 8.12 Subsequent events• There are no material events after the balance sheet date.

Company Financial StatementsCompany Statement of Income
In EUR millions Note 2016 2015
Other operating income 1.1 1.0
Total operating income 1.1 1.0
Personnel expenses 8 22.5 25.7
Other operating expenses 27.3 0.6
Depreciation and amortization 1.1 0.9
Total operating expenses 50.9 27.2
Interest and similar income 55.4 47.6
Release from revaluation reserves - 1.7 5.8
Interest and similar expenses - 156.8 - 157.4
Result before income tax - 152.9 - 130.2
Income tax 9 38.7 31.0
Share in result of subsidiaries and participations 648.2 381.4
Net profit 534.0 282.2
196 | Vopak | Annual Report 2016In
trod
uctio
nE
xecutive B
oard
repo
rtS
torin
g vital p
rod
ucts
with
careK
ey develo
pm
ents
per d
ivision
Su
stainab
ilityG
overnan
ce, risk an
d co
mp
liance
Finan
cial Statem
ents
Ad
ditio
nal in
form
ation
Finan
cial Statem
ents
| Vopak | Annual Report 2016
Company Financial StatementsCompany Financial Statements

197Company Financial Statements |In
trod
uctio
nE
xecutive B
oard
repo
rtS
torin
g vital p
rod
ucts
with
careK
ey develo
pm
ents
per d
ivision
Su
stainab
ilityG
overnan
ce, risk an
d co
mp
liance
Finan
cial Statem
ents
Ad
ditio
nal in
form
ation
Finan
cial Statem
ents
197 | Vopak | Annual Report 2016 | Company Financial Statements
Company Statement of Financial Position before Profit Appropriation
In EUR millions Note 31-Dec-16 31-Dec-15
Participating interests in group companies 2 3,389.2 2,882.7
Property, plant & equipment 8.6 –
Loans granted 3 876.3 1,280.9
Derivative financial instruments 6 94.2 119.4
Deferred taxes 11.1 8.9
Total non-current assets 4,379.4 4,291.9
Trade and other receivables 0.5 0.3
Taxes receivable 0.5 0.3
Prepayments 0.9 0.2
Derivative financial instruments 6 34.4 10.6
Cash and cash equivalents 198.2 7.6
Total current assets 234.5 19.0
Bank overdrafts 7.9 7.1
Interest-bearing loans 5 162.7 2.6
Derivative financial instruments 6 2.5 3.2
Taxes payable – 0.4
Trade and other payables 9.6 5.0
Pension and other employee benefits 7 1.2 1.4
Provisions 11.7 0.4
Total current liabilities 195.6 20.1
Current assets less current liabilities 38.9 - 1.1
Total assets less current liabilities 4,418.3 4,290.8
Interest-bearing loans 5 1,829.7 2,108.8
Derivative financial instruments 6 71.2 91.7
Pension and other employee benefits 7 107.9 65.8
Provisions 9.8 12.7
Other non-current liabilities – 2.4
Non-current liabilities 2,018.6 2,281.4
Share capital 63.9 63.9
Share premium 194.4 194.4
Statutory reserve for participating interests 4 265.0 271.6
Translation reserve 14.8 - 3.5
Revaluation reserve derivatives - 137.6 - 130.2
Revaluation reserve assets – 4.7
Transaction reserve non-controlling interest 1.3 1.3
Other reserves 4 1,463.9 1,325.0
Unappropriated profit 4 534.0 282.2
Shareholders' equity 2,399.7 2,009.4
Total 4,418.3 4,290.8

198 | Vopak | Annual Report 2016In
trod
uctio
nE
xecutive B
oard
repo
rtS
torin
g vital p
rod
ucts
with
careK
ey develo
pm
ents
per d
ivision
Su
stainab
ilityG
overnan
ce, risk an
d co
mp
liance
Ad
ditio
nal in
form
ation
| Vopak | Annual Report 2016 | Company Financial StatementsFin
ancial S
tatemen
ts
Notes to the Company Financial StatementsNote 1. GeneralKoninklijke Vopak N.V. (Vopak) has its registered office in Rotterdam, the Netherlands. Vopak is listed on the Euronext Amsterdam. Vopak is the world’s leading independent tank storage provider, specialized in the storage and handling of liquid chemicals, gases and oil products.
The company is registered at the Company Registry of the Rotterdam Chamber of Commerce under number 24295332.
All amounts are in EUR millions, unless stated otherwise.
Accounting policies The Company financial statements have been drawn up in accordance with Dutch law (Part 9 of Book 2 of the Dutch Civil Code). In doing so, the company made use of the possibility to apply the accounting policies (including the policies for the presentation of financial instruments as equity or loan capital) used in the Consolidated financial statements to the Company financial statements, as provided in Section 362 (8) of Book 2 of the Dutch Civil Code.
The accounting policies applied in the Company financial statements are the same as those applied in the Consolidated financial statements, unless stated otherwise.
Participating interests in group companiesInterests in Group companies and other companies over which Vopak exercises control or which it manages are carried at net asset value. The net asset value is determined by measuring the assets, provisions and liabilities and calculating the result according to the accounting policies applied in the Consolidated financial statements.
Note 2. Participating interests in Group companies
In EUR millions 2016 2015
Carrying amount at 1 January 2,882.7 2,680.2
Investments – 5.1
Disposal – - 0.8
Dividend - 178.0 - 235.2
Exchange differences 30.8 31.8
Hedging 5.7 13.6
Unrealized actuarial gains and losses - 0.2 8.6
Tax on unrealized actuarial gains and losses – - 2.0
Profit 648.2 381.4
Carrying amount at 31 December 3,389.2 2,882.7
For an overview of the investments in subsidiaries, joint ventures and associates held (indirectly) by the company, reference is made to note 8.11 of the Consolidated financial statements.
Note 3. Loans granted
In EUR millions 2016 2015
Carrying amount at 1 January 1,280.9 1,306.9
Loans granted 371.7 408.5
Repayments - 777.0 - 432.3
Exchange differences 0.7 - 2.2
Carrying amount at 31 December 876.3 1,280.9
At 31 December 2016, loans granted did not include any subordinated loans (2015: nil).

199Company Financial Statements |In
trod
uctio
nE
xecutive B
oard
repo
rtS
torin
g vital p
rod
ucts
with
careK
ey develo
pm
ents
per d
ivision
Su
stainab
ilityG
overnan
ce, risk an
d co
mp
liance
Finan
cial Statem
ents
Ad
ditio
nal in
form
ation
Finan
cial Statem
ents
199 | Vopak | Annual Report 2016 | Company Financial Statements
Note 4. Shareholders’ equityReference is made to note 5.1 to the Consolidated Financial Statements for movements in the number of shares, share capital and share premium.
The share premium can be distributed in full, free of tax.
For the translation reserve, the revaluation reserve derivatives, the revaluation reserve assets and the transaction reserve of non-controlling interests (NCI), reference is made to note 5.2 to the Consolidated Financial Statements.
Movements in the remaining components of shareholders’ equity for 2016 and 2015 are shown in the following tables.
Statutory reserve for participating interests
In EUR millions 2016 2015
Carrying amount at 1 January 271.6 220.7
Donation from Other reserves – 50.9
Release to Other reserves - 6.6 –
Carrying amount at 31 December 265.0 271.6
Other reserves
In EUR millions 2016 2015
Carrying amount at 1 January 1,325.0 1,171.8
Profit appropriation from Unappropriated profit 154.7 132.3
Remeasurement of defined benefit plans - 26.2 72.2
Measurement of equity-settled share-based payment arrangements 2.9 2.3
Release revaluation reserve assets 4.7 0.2
Purchase treasury shares - 3.8 - 2.9
Donation from Statutory reserves 6.6 –
Release to Statutory reserves – - 50.9
Carrying amount at 31 December 1,463.9 1,325.0
Unappropriated profit
In EUR millions 2016 2015
Carrying amount at 1 January 282.2 250.4
Profit appropriation to Other reserves - 154.7 - 132.3
Dividend in cash - 127.5 - 118.1
Profit for the year 534.0 282.2
Carrying amount at 31 December 534.0 282.2
After adjustment for the legal reserves at 31 December 2016, a total of EUR 1,860.3 million (2015: EUR 1,473.5 million) is freely distributable from reserves, including unappropriated profit for the year.

200 | Vopak | Annual Report 2016In
trod
uctio
nE
xecutive B
oard
repo
rtS
torin
g vital p
rod
ucts
with
careK
ey develo
pm
ents
per d
ivision
Su
stainab
ilityG
overnan
ce, risk an
d co
mp
liance
Ad
ditio
nal in
form
ation
| Vopak | Annual Report 2016 | Company Financial StatementsFin
ancial S
tatemen
ts
Note 5. Interest-bearing loans
Nominal value in EUR millions
> 5 yearsin EUR millions
Average term in years
Average interest in %
31-Dec-16 31-Dec-15 31-Dec-16 31-Dec-15 31-Dec-16 31-Dec-15 2016 2015
Current portion 162.7 2.6
Non-current portion 1,829.7 2,108.8
Total 1,992.4 2,111.4 1,310.8 1,437.3 7.7 8.2 4.2 4.2
Note 6. Derivative financial instruments
31 December 2016 31 December 2015
In EUR millions Maturity Assets 1 Liabilities 1
Notional amount Assets 1 Liabilities 1
Notional amount
Forward foreign currency contracts 2 < 1 year 0.3 2.4 395.3 2.5 2.4 250.1
Total net investment hedges 0.3 2.4 395.3 2.5 2.4 250.1
Forward foreign currency contracts < 1 year 0.2 0.1 103.4 8.1 0.8 504.9
Cross currency swaps 3 < 1 year 34.3 – 156.1 – – –
Cross currency swaps 3 1-5 years 92.1 – 385.0 108.0 – 559.5
Cross currency swaps 3 > 5 years 47.7 15.7 355.4 39.9 23.3 359.0
Total cash flow hedges - currency part 174.3 15.8 999,9 156.0 24.1 1,423.4
Cross currency interest rate swaps 4 < 1 year – 0.4 156.1 – – –
Cross currency interest rate swaps 4 1-5 years – 18.5 385.0 1.0 13.6 559.5
Cross currency interest rate swaps 4 > 5 years – 82.6 355.4 – 84.3 359.0
Total cash flow hedges - interest part – 101.5 896.5 1.0 97.9 918.5
Total derivative financial instruments 174.6 119.7 2,291.7 159.5 124.4 2,592.0
Currency derivative financial instruments 174.6 18.2 158.5 26.5
Interest derivative financial instruments – 101.5 1.0 97.9
Total derivative financial instruments 174.6 119.7 159.5 124.4
Offsetting - 46.0 - 46.0 - 29.5 - 29.5
Total 128.6 73.7 130.0 94.9
Non-current 94.2 71.2 119.4 91.7
Current 34.4 2.5 10.6 3.2
Total 128.6 73.7 130.0 94.9
1. At fair value.2. Forward foreign currency contracts accounted for as hedges on net investments.3. Cross currency swaps accounted for as cash flow hedges are used to hedge currency (2016: USD 971 million and JPY 16 billion;
2015: USD 1 billion and JPY 16 billion) on fixed debt denominated in foreign currency.4. Cross currency swaps are used to hedge future cash flow interest rate risks (2016: USD 971 billion and JPY 16 billion;
2015: USD 1 billion and JPY 16 billion) on fixed debt denominated in foreign currency.

201Company Financial Statements |In
trod
uctio
nE
xecutive B
oard
repo
rtS
torin
g vital p
rod
ucts
with
careK
ey develo
pm
ents
per d
ivision
Su
stainab
ilityG
overnan
ce, risk an
d co
mp
liance
Finan
cial Statem
ents
Ad
ditio
nal in
form
ation
Finan
cial Statem
ents
201 | Vopak | Annual Report 2016 | Company Financial Statements
Note 7. Pension and other employee benefits provisions
In EUR millions 2016 2015
Present value of funded defined benefit obligation 1,141.3 1,035.0
Fair value of plan assets - 1,035.9 - 972.8
Total deficit of defined benefit plans 105.4 62.2
Net pension obligations under defined contribution plans 3.7 5.0
Net pension obligations recognized at 31 December 109.1 67.2
Non-current liabilities 107.9 65.8
Current liabilities 1.2 1.4
Net pension obligations recognized at 31 December 109.1 67.2
8. Personnel expensesDuring the year under review, the company employed an average of 147 employees and temporary staff (in FTEs) (2015: 135).
In EUR millions 2016 2015
Wages and salaries 21.8 20.1
Social security charges 1.4 1.3
Contribution to pension schemes (defined contribution) 2.6 4.1
Pension charges (defined benefit plans) 2.0 2.2
Long-term incentive plans 4.8 3.2
Other personnel expenses 0.3 0.4
Recharged to group companies - 10.4 - 5.6
Total 22.5 25.7
9. Income taxesRoyal Vopak is the head of a fiscal unity which includes almost all Dutch wholly-owned subsidiaries. The company is therefore jointly and severally liable for the tax liabilities of the fiscal unity as a whole. The tax expense of Royal Vopak represents the tax impact of its share in the taxable income of the fiscal unity based on Royal Vopak’s earnings.
In EUR millions 2016 2015
Result before income tax - 152.9 - 130.2
Income tax 38.7 31.0
Effective tax rate 25.3% 23.8%
Composition: Amount % Amount %
Weighted average statutory tax rate 38.3 25.0 32.5 25.0
Non-deductible expenses - 1.3 - 0.8 – –
Recognition of tax losses and tax credits 1.7 1.1 - 1.5 - 1.2
Effective tax (rate) 38.7 25.3 31.0 23.8
The 2016 effective tax rate of 25.3% deviates slightly from the applicable tax rate of 25.0% as a result of non-deductible expenses.

202 | Vopak | Annual Report 2016In
trod
uctio
nE
xecutive B
oard
repo
rtS
torin
g vital p
rod
ucts
with
careK
ey develo
pm
ents
per d
ivision
Su
stainab
ilityG
overnan
ce, risk an
d co
mp
liance
Ad
ditio
nal in
form
ation
| Vopak | Annual Report 2016 | Company Financial StatementsFin
ancial S
tatemen
ts
Note 10. Remuneration of Supervisory Board members and Executive Board members For the remuneration of the Supervisory Board members and the Executive Board members, reference is made to the section of the Remuneration report.
Note 11. Contingent liabilitiesGuarantees and security provided on behalf of participating interests and third parties amounted to EUR 126.5 million (2015: EUR 195.9 million). Guarantees and security provided on behalf of Group companies amounted to EUR 40.8 million (2015: EUR 97.0 million).
Joint and several liability undertakings for an amount of EUR 80.0 million (2015: EUR 130.0 million) were issued for bank credits granted to Royal Vopak. Furthermore, joint and several liability undertakings for an amount of EUR 75.2 million (2015: EUR 70.5 million) were issued for bank credits granted to subsidiaries.
The company has filed joint and several liability undertakings (403 exemptions) for a number of its Dutch Group companies at the office of the Company Registry in whose area of jurisdiction the Group company concerned has its registered office. The list of interests filed at the office of the Company Registry for inspection states for which Group companies Royal Vopak has issued joint and several liability undertakings.
The members of the Executive Board have signed the financial statements in order to comply with the statutory obligation pursuant to article 2:101 paragraph 2 of the Dutch Civil Code and article 5:25c sub c of the Act on Financial Supervision (Wft).
Rotterdam, 16 February 2017
The Executive Board E.M. Hoekstra (Chairman and CEO)J.P. de Kreij (Vice-Chairman and CFO)F. Eulderink (COO)
The Supervisory Board A. van Rossum (Chairman)M.F. Groot (Vice-Chairman)F.J.G.M. CremersC.J. van den DriestB.J. NoteboomR.G.M. Zwitserloot

Executive Board declarationIn-control statementIn the Internal control and risk management, we set out in detail our risks and risk management framework, as well as the responsibilities of the Executive Board. In compliance with the best practice principle II.1.5 laid down in the Dutch Corporate Governance Code, and taking into account the limitations outlined below (and based on our evaluation), we confirm that our internal risk management and control systems relating to financial reporting risks worked properly in 2016 and provide a reasonable assurance that the financial reporting does not contain any errors of material importance. Our internal risk management and control systems are, however, unable to offer absolute assurance that the strategic, operational and financial objectives will be fully achieved, or that laws and regulations are always complied with. Furthermore, the systems cannot prevent all human errors of judgments and mistakes. It is also inherent that in business, cost-benefit assessments must be made for the acceptance of risks and the implementation of controls. We continuously monitor the effectiveness of our internal risk management and control procedures, and when needed these are further improved and optimized.
Executive Board declaration
Pursuant to the Financial Supervision Act, Section 5:25c, paragraph 2, sub-paragraph c, we declare that, to the best of our knowledge:• The financial statements in this Annual Report give a true and fair view of the Group’s assets, liabilities,
financial position and profit or loss.• The management report (‘bestuursverslag’) in this Annual Report gives a true and fair view of the situation on
the balance sheet date, of developments during the financial year of the company and entities affiliated with it; and includes a description of the main risks the company faces.
Rotterdam, 16 February 2017
The Executive Board E.M. Hoekstra - Chairman and CEO J.P. de Kreij - Vice-Chairman and CFO F. Eulderink - COO
203In
trod
uctio
nE
xecutive B
oard
repo
rtS
torin
g vital p
rod
ucts
with
careK
ey develo
pm
ents
per d
ivision
Su
stainab
ilityG
overnan
ce, risk an
d co
mp
liance
Finan
cial Statem
ents
Ad
ditio
nal in
form
ation
Finan
cial Statem
ents
|
Intro
du
ction
Execu
tive Bo
ard rep
ort
Sto
ring
vital pro
du
cts w
ith care
Key d
evelop
men
ts p
er divisio
nS
ustain
ability
Govern
ance, risk
and
com
plian
ceFin
ancial S
tatemen
tsA
dd
ition
al info
rmatio
n
203
Finan
cial Statem
ents
| Vopak | Annual Report 2016
Other relevant documents
Executive Board declaration
Executive Board declaration

Independent auditor’s report To the shareholders and Supervisory Board of Koninklijke Vopak N.V.
Report on the Financial Statements 2016 included in the Annual Report
Our OpinionWe have audited the financial statements 2016 of Koninklijke Vopak N.V. (‘company’), based in Rotterdam, the Netherlands. The financial statements include the Consolidated Financial Statements and the Company Financial Statements.
In our opinion:• The Consolidated Financial Statements included in the Annual Report give a true and fair view of the financial
position of Koninklijke Vopak N.V. as at 31 December 2016, and of its result and its cash flows for 2016 in accordance with International Financial Reporting Standards as adopted by the European Union (EU-IFRS) and with Part 9 of Book 2 of the Dutch Civil Code;
• The Company Financial Statements included in the Annual Report give a true and fair view of the financial position of Koninklijke Vopak N.V. as at 31 December 2016, and of its result for 2016 in accordance with Part 9 of Book 2 of the Dutch Civil Code.
The Consolidated Financial Statements comprise:• The Consolidated Statement of Financial Position as at 31 December 2016;• The following statements for 2016: the Consolidated Statement of Income, Comprehensive Income,
Changes in Equity and Cash Flows; and• The notes, comprising a summary of the significant accounting policies and other explanatory information.
The Company Financial Statements comprise:• The Company Statement of Financial Position before Profit Appropriation as at 31 December 2016;• The Company Statement of Income for 2016; and• The notes, comprising a summary of the significant accounting policies and other explanatory information.
Basis for our opinionWe conducted our audit in accordance with Dutch law, including the Dutch Standards on Auditing. Our responsibilities under those standards are further described in the ‘Our responsibilities for the audit of the financial statements’ section of our report.
We are independent of Koninklijke Vopak N.V. in accordance with the “Verordening inzake de onafhankelijkheid van accountants bij assurance-opdrachten” (ViO) and other relevant independence regulations in the Netherlands. Furthermore, we have complied with the “Verordening gedrags- en beroepsregels accountants” (VGBA).
We believe the audit evidence we have obtained is sufficient and appropriate to provide a basis for our opinion.
MaterialityBased on our professional judgement we determined the materiality for the financial statements as a whole at EUR 20.0 million. The materiality is primarily based on 5% of profit before income tax, adjusted for certain non-recurring items. We have also taken into account misstatements and/or possible misstatements that in our opinion are material for the users of the financial statements for qualitative reasons.
We agreed with the Supervisory Board that uncorrected misstatements in excess of EUR 1.0 million, which are identified during the audit, would be reported to them, as well as smaller misstatements that in our view must be reported on qualitative grounds.
Scope of the group auditKoninklijke Vopak N.V. is at the head of a group of entities. The financial information of this group is included in the consolidated financial statements of Koninklijke Vopak N.V.
204 | Vopak | Annual Report 2016In
trod
uctio
nE
xecutive B
oard
repo
rtS
torin
g vital p
rod
ucts
with
careK
ey develo
pm
ents
per d
ivision
Su
stainab
ilityG
overnan
ce, risk an
d co
mp
liance
Finan
cial Statem
ents
Ad
ditio
nal in
form
ation
Finan
cial Statem
ents
| Vopak | Annual Report 2016
Independent auditor’s report
Independent auditor’s report

205Independent auditor’s report |In
trod
uctio
nE
xecutive B
oard
repo
rtS
torin
g vital p
rod
ucts
with
careK
ey develo
pm
ents
per d
ivision
Su
stainab
ilityG
overnan
ce, risk an
d co
mp
liance
Finan
cial Statem
ents
Ad
ditio
nal in
form
ation
Finan
cial Statem
ents
205 | Vopak | Annual Report 2016 | Independent auditor’s report
Because we are ultimately responsible for the opinion, we are responsible for directing, supervising and performing the group audit. In this respect we have determined the nature and extent of the audit procedures to be carried out for group entities. Decisive were the size and/or the risk profile of the group entities or operations. On this basis, we selected group entities for which an audit or review had to be carried out on the complete set of financial information or specific items.
The group is structured along the divisions Netherlands, EMEA, Asia, Americas and LNG. The group’s financial statements are a combination of:• Consolidated reporting units, comprising the operating terminals under the group’s control and centralized
functions; and• Unconsolidated reporting units comprised of operating terminals under joint control with unrelated parties
(joint ventures) and operating terminals where the group exercises significant influence (associates); allaccounted for under the equity method.
In establishing the overall group audit strategy and plan, we determined the type of work that needed to be performed at the reporting units by the group engagement team, by component auditors from other Deloitte network firms and by component auditors from non-Deloitte network firms primarily working under our instruction at the joint ventures. Where the work was performed by component auditors, we determined the level of involvement we needed to have in the audit work at those reporting units so as to be able to conclude whether sufficient appropriate audit evidence had been obtained as a basis for our opinion on the group financial statements as a whole. For each reporting unit we determined whether we required an audit of their complete financial information or whether other procedures would be sufficient. Those where a full audit was required included the three largest (consolidated) reporting units (Netherlands, Singapore and United States of America), because they each make up more than 10% of the group’s revenue or underlying profits.
We included additional reporting units in the scope of our group audit to have audit coverage on the group’s consolidated financial statements and to cover a geographic spread across the group’s divisions.
Audit coverage
Audit coverage of consolidated revenues: 93% Audit coverage of group operating profit: 97% Audit coverage of total assets: 82%
In addition, we performed other procedures with respect to the remaining reporting units.
The group consolidation, financial statement disclosures and a number of complex items were audited by the group engagement team at the head office. These include impairment testing of terminal assets and joint ventures, general IT controls, derivative financial instruments, hedge accounting, pensions and share-based payments. The group engagement team participated in closing meetings and also visited group entities in several countries to direct the planning, review the work undertaken and assess the findings.
By performing the procedures mentioned above at group entities, together with additional procedures at group level, we have been able to obtain sufficient and appropriate audit evidence about the group’s financial information to provide an opinion about the consolidated financial statements.
Our key audit mattersKey audit matters are those matters that, in our professional judgement, were of most significance in our audit of the financial statements. We have communicated the key audit matters to the Supervisory Board. The key audit matters are not a comprehensive reflection of all matters discussed.
These matters were addressed in the context of our audit of the financial statements as a whole and in forming our opinion thereon, and we do not provide a separate opinion on these matters.

206 | Vopak | Annual Report 2016In
trod
uctio
nE
xecutive B
oard
repo
rtS
torin
g vital p
rod
ucts
with
careK
ey develo
pm
ents
per d
ivision
Su
stainab
ilityG
overnan
ce, risk an
d co
mp
liance
Ad
ditio
nal in
form
ation
| Vopak | Annual Report 2016 | Independent auditor’s reportFin
ancial S
tatemen
ts
Key audit matter How the key audit matter was addressed in the audit
Impairment testing of terminal assets and joint venturesThe group controls a number of tank storage terminals with a total carrying value of property, plant and equipment of EUR 3,553.0 million (note 3.3). Furthermore, the group has an interest in a number of joint ventures and associates, with a total carrying value of EUR 1,091.7 million (note 3.4).
This area is significant to our audit as the determination whether these assets are not carried at more than their recoverable amounts is subject to significant management judgement. Such judgement focuses predominantly on future cash flows, which are, among others, dependent on economic conditions, the continued attractiveness of the terminal location for users along the major shipping routes and local market circumstances and is inherently surrounded by uncertainties. For Greenfield terminal projects in which a new terminal is built on undeveloped land, these uncertainties are even more prominent.
As described in note 3.7 of the financial statements, the group recognized (net) impairments in 2016 at an amount of EUR 65.8 million.
The company has provided disclosures for its key accounting estimates in note 3.7 of the financial statements which include disclosures of:• The uncertainties in relation to the recoverable value of the
group’s associate Vopak Terminal Haiteng;• The impairment recognized on the joint venture Vopak E.O.S.
(Estonia) and uncertainties with respect to the recoverablevalue of the group’s investment in Vopak E.O.S.; and
• The uncertainties with respect to the recoverable value ofthe group’s other investments.
Our impairment testing included, among others, evaluating the group’s policies and procedures to identify triggering events for potential impairment of terminal assets and joint ventures and associates.
For the terminal locations that triggered management’s impairment testing, we evaluated the policies and procedures regarding impairment testing, we challenged management’s primary cash flow assumptions and corroborated them by comparison to commercial contracts, customer relationship management information, available market reports and historic trend analyses (value in use) or in certain situations to market multiples from recent tank terminal sales transactions in the region or (non-binding) sales agreements with unrelated parties in the event of potential divestments (fair value less cost of disposal).
Further, we involved our valuation experts to validate the weighted average cost of capital as applied by the group and the appropriateness of the applied value in use or where applicable the fair value less cost of disposal calculations.We further assessed that the main assumptions and related uncertainties are appropriately reflected in the disclosures in note 3.7 of the financial statements.
Report on the other information included in the Annual Report
In addition to the financial statements and our auditor’s report, the annual accounts contain other information that consists of:• Management report;• Supervisory Board report;• Remuneration report; and• Other information as required by Part 9 Book 2 of the Dutch Civil Code.
Based on the following procedures performed, we conclude that the other information:• Is consistent with the financial statements and does not contain material misstatements; and• Contains the information as required by Part 9 of Book 2 of the Dutch Civil Code.
We have read the other information. Based on our knowledge and understanding obtained through our audit of the financial statements or otherwise, we have considered whether the other information contains material misstatements.
By performing these procedures, we comply with the requirements of Part 9 of Book 2 of the Dutch Civil Code and the Dutch Standard on Auditing 720. The scope of the procedures performed is substantially less than the scope of those performed in our audit of the financial statements.
Management is responsible for the preparation of other information, including the management report in accordance with Part 9 of Book 2 of the Dutch Civil Code, and the other information as required by Part 9 of Book 2 of the Dutch Civil Code.

207Independent auditor’s report |In
trod
uctio
nE
xecutive B
oard
repo
rtS
torin
g vital p
rod
ucts
with
careK
ey develo
pm
ents
per d
ivision
Su
stainab
ilityG
overnan
ce, risk an
d co
mp
liance
Finan
cial Statem
ents
Ad
ditio
nal in
form
ation
Finan
cial Statem
ents
207 | Vopak | Annual Report 2016 | Independent auditor’s report
Report on other legal and regulatory requirements
EngagementWe were engaged by the Annual General Meeting as auditor of Koninklijke Vopak N.V. on 23 April 2014, as of the audit for the year 2015 and have operated as statutory auditor ever since that date.
Description of responsibilities for the financial statements
Responsibilities of management and the Supervisory Board for the financial statementsManagement is responsible for the preparation and fair presentation of the financial statements in accordance with EU-IFRS and Part 9 of Book 2 of the Dutch Civil Code. Furthermore, management is responsible for such internal control as management determines is necessary to enable the preparation of the financial statements that are free from material misstatement, whether due to fraud or error.
As part of the preparation of the financial statements, management is responsible for assessing the company’s ability to continue as a going concern. Based on the financial reporting framework mentioned, management should prepare the financial statements using the going concern basis of accounting unless management either intends to liquidate the company or to cease operations, or has no realistic alternative but to do so. Management should disclose events and circumstances that may cast significant doubt on the company’s ability to continue as a going concern in the financial statements.
The Supervisory Board is responsible for overseeing the company’s financial reporting process.
Our responsibilities for the audit of the financial statementsOur objective is to plan and perform the audit assignment in a manner that allows us to obtain sufficient and appropriate audit evidence for our opinion.
Our audit has been performed with a high, but not absolute, level of assurance, which means we may not have detected all material errors and fraud.
Misstatements can arise from fraud or error and are considered material if, individually or in the aggregate, they could reasonably be expected to influence the economic decisions of users taken on the basis of these financial statements. The materiality affects the nature, timing and extent of our audit procedures and the evaluation of the effect of identified misstatements on our opinion.
For an overview of our responsibilities we refer to NBA’s website https://www.nba.nl/Vaktechniek/Verklaringen/voorbeeldverklaringen-voorbeeldbrieven/ (Standard texts auditor’s report).
Rotterdam, 16 February 2017
Deloitte Accountants B.V. Signed on the original: R.J.M. Dassen

Assurance report of the independent auditorTo: the shareholders and Supervisory Board of Koninklijke Vopak N.V.
We have reviewed the sustainability information in the Chapter ‘Sustainability’ (‘the Report’) of the Annual Report 2016 of Koninklijke Vopak N.V. (‘company’), based in Rotterdam. This Report comprises a description of the policy, the activities, events and performance of the company relating to sustainable development during the reporting year 2016.
Limitations in our scopeThe Report contains prospective information, such as ambitions, strategy, targets, expectations and projections. Inherent to this information is that actual future results may be different from the prospective information and therefore may be uncertain. We do not provide any assurance on the assumptions and feasibility of this prospective information.
Management’s responsibilityManagement of the company is responsible for the preparation of the Report in accordance with the Sustainability Reporting Guidelines GRI G4 Comprehensive option, including the identification of the stakeholders and the determination of material subjects. The disclosures made by management with respect to the scope of the Report are included in the section ‘Reporting scope’ of the Report.
Furthermore, management is responsible for such internal control as it determines is necessary to enable the preparation of the Report that is free from material misstatement, whether due to fraud or error.
Auditor’s responsibilityOur responsibility is to express a conclusion on the Report based on our review. We conducted our review in accordance with Standard 3810N ‘Assurance engagements relating to sustainability reports’. This requires that we comply with ethical requirements and that we plan and perform our work to obtain limited assurance about whether the report is free from material misstatement.
A review is focused on obtaining limited assurance. The procedures performed in obtaining limited assurance are aimed at the plausibility of information which does not require the same exhaustive gathering of evidence as in engagements focused on reasonable assurance. The procedures performed consisted primarily of making inquiries of management and others within the company, as appropriate, applying analytical procedures and evaluating the evidence obtained. Consequently, a review engagement provides less assurance than an audit.
We believe that the evidence we have obtained is sufficient and appropriate to provide a basis for our conclusion.
Procedures performed
Our main procedures included the following:• Performing an external environment analysis and obtaining an understanding of the sector, relevant social
issues, relevant laws and regulations and the characteristics of the organisation.• Evaluating the acceptability of the reporting policies and their consistent application, such as the assessment
of the outcomes of the stakeholder dialogue and the reasonableness of estimates made by management.• Assessing whether the sustainability information has been prepared in accordance with the Sustainability
Reporting Guidelines GRI G4 Comprehensive option.• Evaluating the design and implementation of the systems and processes for data gathering and processing
of information as presented in the Report.• Interviewing management or relevant staff responsible for the sustainability strategy and policies at
corporate, division and terminal level.• Interviews with relevant staff responsible for providing the information in the Report, and responsible for
carrying out internal control procedures on the data and the consolidation of the data in the Report. • Reviewing internal and external documentation to determine whether the sustainability information, including
the disclosure, presentation and assertions made in the Report, is substantiated adequately.• Analytical review of the data and trend explanations submitted for consolidation at group level.
208 | Vopak | Annual Report 2016In
trod
uctio
nE
xecutive B
oard
repo
rtS
torin
g vital p
rod
ucts
with
careK
ey develo
pm
ents
per d
ivision
Su
stainab
ilityG
overnan
ce, risk an
d co
mp
liance
Finan
cial Statem
ents
Ad
ditio
nal in
form
ation
Finan
cial Statem
ents
| Vopak | Annual Report 2016
Assurance report of the independent auditor
Assurance report of the independent auditor

209Assurance report of the independent auditor |In
trod
uctio
nE
xecutive B
oard
repo
rtS
torin
g vital p
rod
ucts
with
careK
ey develo
pm
ents
per d
ivision
Su
stainab
ilityG
overnan
ce, risk an
d co
mp
liance
Finan
cial Statem
ents
Ad
ditio
nal in
form
ation
Finan
cial Statem
ents
209 | Vopak | Annual Report 2016 | Assurance report of the independent auditor
ConclusionBased on our procedures performed, nothing has come to our attention that causes us to conclude that the Report, in all material respects, does not provide a reliable and appropriate presentation of the company’s policy for sustainable development, or its activities, events and performance relating to sustainable development during 2016, in accordance with the Sustainability Reporting Guidelines GRI G4 Comprehensive option.
Rotterdam, 16 February 2017
Deloitte Accountants B.V. Signed on the original: R.J.M. Dassen

Additional informationNon-IFRS proportionate financial information
Profit Appropriation
Stichting Vopak
Principal company officers at 16 February 2017
Five-year consolidated summary
Glossary
Contact us
Intro
du
ction
Execu
tive Bo
ard rep
ort
Sto
ring
vital pro
du
cts w
ith care
Key d
evelop
men
ts p
er divisio
nG
overnan
ce, risk an
d co
mp
liance
Finan
cial Statem
ents
Su
stainab
ilityA
dd
ition
al info
rmatio
n
Additional information

Non-IFRS proportionate financial informationProportionate information
Basis of preparation
Vopak provides Non-IFRS proportionate financial information -excluding exceptional items- in response to requests by multiple investors to provide additional operational performance insights on a comparable basis for subsidiaries, joint ventures and associates. In this disclosure, the joint ventures and associates and the subsidiaries with non-controlling interests are consolidated based on the economic ownership interests of the Group in these entities.
In the tables in this section, we provide the proportionate financial information for the statement of income, the statement of financial position, and the segment information for each of our reportable segments. Where applicable, we show a reconciliation with our IFRS figures in order to create comparability with the proportionate information. Other information is based on the same principles as applied for the proportionate financial information.
Definition of CFROGA
In order to assess the performance trend of its operations, the company also calculates the ‘Cash Flow Return on Gross Assets’ (CFROGA). CFROGA is defined as EBITDA minus the statutory income tax charge on EBIT divided by the average historical investment (gross assets).
Cash Flows are determined based on EBITDA from which the statutory income tax charges are subsequently subtracted. The year-to-date cash flows are annualized for all quarters except Q4.
Gross Assets are based on the carrying amount of non-current assets, excluding loans granted, and are grossed up by means of adding back the accumulated depreciation, amortization and impairment. Subsequently, the net trade working capital (trade debtors minus trade creditors) is added. Balances related to assets under construction are excluded from the gross assets. The average historical investment is based on the quarter-end balances in the measurement period relevant to the quarter to which the CFROGA relates. Statement of income
2016 2015
In EUR millionsIFRS
figures
Exclusion excep-tional items
Effects propor-tionate
consoli-dation
Propor-tionate
consoli-dated
IFRS figures
Exclusion excep-tional items
Effects propor-tionate
consoli-dation
Propor-tionate
consoli-dated
Revenues 1,346.9 – 305.3 1,652.2 1,386.0 – 292.8 1,678.8
Net operating expenses - 377.9 270.5 - 86.9 - 735.3 - 631.1 47.7 - 95.9 - 774.7Results of joint ventures and associates using the equity method 59.9 - 63.9 - 123.8 – 54.0 - 50.3 - 104.3 –
Impairment - 5.7 - 5.7 – – - 3.7 - 3.7 – –Group operating profit before depreciation and amortization (EBITDA) 1,023.2 200.9 94.6 916.9 805.2 - 6.3 92.6 904.1
Depreciation and amortization - 263.9 – - 72.8 - 336.7 - 256.0 – - 69.2 - 325.2
Group operating profit (EBIT) 759.3 200.9 21.7 580.1 549.2 - 6.3 23.4 578.9
Net finance costs - 107.2 – - 39.8 - 147.0 - 105.2 - 2.3 - 42.4 - 145.3
Income tax - 72.5 6.8 - 27.7 - 107.0 - 117.3 - 35.3 - 26.3 - 108.3
Net profit 579.6 207.7 - 45.8 326.1 326.7 - 43.9 - 45.3 325.3
Non-controlling interests - 45.6 0.2 45.8 – - 44.5 0.8 45.3 –
Net profit owners of parent 534.0 207.9 – 326.1 282.2 - 43.1 – 325.3
211In
trod
uctio
nE
xecutive B
oard
repo
rtS
torin
g vital p
rod
ucts
with
careK
ey develo
pm
ents
per d
ivision
Su
stainab
ilityG
overnan
ce, risk an
d co
mp
liance
Finan
cial Statem
ents
Ad
ditio
nal in
form
ation
Ad
ditio
nal in
form
ation
|
Intro
du
ction
Execu
tive Bo
ard rep
ort
Sto
ring
vital pro
du
cts w
ith care
Key d
evelop
men
ts p
er divisio
nG
overnan
ce, risk an
d co
mp
liance
211
Finan
cial Statem
ents
Su
stainab
ilityA
dd
ition
al info
rmatio
n
| Vopak | Annual Report 2016
Non-IFRS proportionate financial informationNon-IFRS proportionate financial information

Statement of financial position
31-Dec-16 31-Dec-15
In EUR millionsIFRS
figures
Effects propor-tionate
consoli-dation
Propor-tionate
consoli-dated
IFRS figures
Effects propor-tionate
consoli-dation
Propor-tionate
consoli-dated
Non-current assets (excl. joint ventures and associates) 3,882.3 1,918.7 5,801.0 3,787.8 2,016.2 5,804.0
Joint ventures and associates 1,091.7 - 1,091.7 – 1,068.1 - 1,068.1 –
Current assets 608.0 277.6 885.6 641.3 205.1 846.4
Total assets 5,582.0 1,104.6 6,686.6 5,497.2 1,153.2 6,650.4
Non-current liabilities 2,452.8 1,075.0 3,527.8 2,761.6 982.2 3,743.8
Current liabilities 570.2 188.9 759.1 575.2 322.0 897.2
Total liabilities 3,023.0 1,263.9 4,286.9 3,336.8 1,304.2 4,641.0
Equity attributable to owners of parent 2,399.7 – 2,399.7 2,009.4 – 2,009.4
Non-controlling interests 159.3 - 159.3 – 151.0 - 151.0 –
Total equity 2,559.0 - 159.3 2,399.7 2,160.4 - 151.0 2,009.4
Other information
2016 2015
EBITDA margin -excluding exceptional items- 55.1% 53.4%
Cash Flow Return On Gross Assets (CFROGA) 10.2% 10.2%
Occupancy rate subsidiaries, joint ventures and associates 94% 92%
Segment information -excluding exceptional items-
Revenues EBITDAGroup operating
profit (EBIT)
In EUR millions 2016 2015 2016 2015 2016 2015
Netherlands 508.6 501.3 291.4 283.8 183.5 184.1
Europe, Middle East & Africa 289.9 339.8 147.5 152.1 84.1 83.8
Asia 461.4 454.8 298.7 289.2 209.0 203.4
of which Singapore 194.7 187.2 141.0 135.0 112.3 107.7
Americas 275.4 268.4 120.0 122.9 75.2 80.7
of which United States 171.3 168.8 80.2 83.4 55.3 58.6
LNG 115.4 114.0 89.6 93.3 65.5 69.7
Global functions, corporate activities and others 1.5 0.5 - 30.4 - 37.2 - 37.2 - 42.8
Total excluding exceptional items 1,652.2 1,678.8 916.8 904.1 580.1 578.9
Net interest-bearing debt
In EUR millions 31-Dec-16 31-Dec-15
Non-current portion of interest-bearing loans 2,865.9 3,120.7
Current portion of interest-bearing loans 257.5 84.3
Total interest-bearing loans 3,123.4 3,205.0
Short-term borrowings 3.0 146.9
Bank overdrafts 8.2 42.6
Cash and cash equivalents - 457.7 - 269.5
Net interest-bearing debt 2,676.9 3,125.0
212 | Vopak | Annual Report 2016In
trod
uctio
nE
xecutive B
oard
repo
rtS
torin
g vital p
rod
ucts
with
careK
ey develo
pm
ents
per d
ivision
Govern
ance, risk
and
com
plian
ce| Vopak | Annual Report 2016 | Non-IFRS proportionate financial information
Finan
cial Statem
ents
Su
stainab
ilityA
dd
ition
al info
rmatio
n

Profit AppropriationArticles of Association Provisions Governing Profit Appropriation
The Articles of Association provisions governing profit appropriation are contained in Articles 19 and 27.
The relevant paragraphs of these articles are as follows:
Article 19.2. In the Annual General Meeting of Shareholders: b. the annual accounts as prepared by the management board will be presented to the general meeting for adoption and the allocation of profits will – with due observance of the provisions of article 27 – be determined.
Article 27.12. The profits remaining after application of the previous paragraphs shall be at the free disposal of the general meeting, with due observance of the fact that no dividend can be distributed when, at the time of the distribution, the dividend reserve finance preference shares has a positive balance and furthermore provided that no further distributions shall be made on the anti-takeover preference shares and the finance preference shares and no profits shall be (further) reserved for the account of the finance preference shares.
Proposed Profit Appropriation
The proposal to the Annual General Meeting will be to distribute a dividend in cash of EUR 1.05 (2015: EUR 1.00 in cash) per ordinary share, with a nominal value of EUR 0.50. Provided that the Annual General Meeting adopts the financial statements, the dividend for the 2016 financial year will be made payable on 26 April 2017.
213In
trod
uctio
nE
xecutive B
oard
repo
rtS
torin
g vital p
rod
ucts
with
careK
ey develo
pm
ents
per d
ivision
Su
stainab
ilityG
overnan
ce, risk an
d co
mp
liance
Finan
cial Statem
ents
Ad
ditio
nal in
form
ation
Ad
ditio
nal in
form
ation
|
Intro
du
ction
Execu
tive Bo
ard rep
ort
Sto
ring
vital pro
du
cts w
ith care
Key d
evelop
men
ts p
er divisio
nG
overnan
ce, risk an
d co
mp
liance
213
Finan
cial Statem
ents
Su
stainab
ilityA
dd
ition
al info
rmatio
n
| Vopak | Annual Report 2016
Profit AppropriationProfit Appropriation

The objectives of Stichting Vopak, established in Rotterdam, are to promote the interests of Koninklijke Vopak N.V. (Royal Vopak) and all those involved with the company and any of its affiliated companies in order tosafeguard, among other things, Royal Vopak’s and these companies’ continuity and/or identity and/orindependence. During the year 2016, the Board of Stichting Vopak met twice. At these meetings, it discussedthe protection of Vopak and its effectiveness, the composition of the Board of Stichting Vopak as well as thefinancing of Stichting Vopak. Furthermore, the Board of Stichting Vopak was briefed by the Chairman of theExecutive Board of Royal Vopak on developments in the company. The Chairman of the Supervisory Boardattended these meetings as an observer.
The current members of the Board of Stichting Vopak are:Mr A. Schaberg, ChairmanMr J.H.M. LindenberghMr B. van der VeerMs A.P. Aris
No cumulative preference shares in Royal Vopak had been issued at the date of the statement of financial position.
Cumulative preference shares will be issued if Stichting Vopak exercises its option right. On 18 October 1999, the AGM decided to grant the right to Stichting Vopak to acquire cumulative preference shares to a maximum amount of the full nominal value of the share capital issued to third parties in the form of ordinary and financing preference shares, less the nominal value of one ordinary share. Royal Vopak and Stichting Vopak have specified their mutual relationship with regard to the option in an option agreement dated 1 November 1999, which was amended on 5 May 2004 in such a manner that the original put option granted to Royal Vopak was cancelled.
On 17 September 2013, the EGM resolved to increase the right of Stichting Vopak to acquire cumulative preference shares in such a way that the right to acquire cumulative preference shares is related to all shares in the share capital of Vopak issued to third parties at such time, less one ordinary share. Pursuant to this, Royal Vopak and Stichting Vopak amended the option agreement accordingly on 17 September 2013.
The Board of Stichting Vopak decides independently whether and when there is a need to exercise its option right for the issue of cumulative preference shares to Stichting Vopak.
Rotterdam, 16 February 2017
Stichting Vopak
Declaration of independenceIn the opinion of the Board of Stichting Vopak and the Executive Board of Royal Vopak, Stichting Vopak is independent as meant by Section 5:71(1c) of the Financial Supervision Act.
Rotterdam, 16 February 2017
Stichting Vopak Koninklijke Vopak N.V. (Royal Vopak)
Stichting Vopak
214 | Vopak | Annual Report 2016In
trod
uctio
nE
xecutive B
oard
repo
rtS
torin
g vital p
rod
ucts
with
careK
ey develo
pm
ents
per d
ivision
Govern
ance, risk
and
com
plian
ceFin
ancial S
tatemen
tsS
ustain
ability
Ad
ditio
nal in
form
ation
| Vopak | Annual Report 2016
Stichting VopakStichting Vopak

Principal company officers at 16 February 2017Netherlands
Division management
Jan Bert Schutrops - Division President Marcel van de Kar - Commercial & Business Development Age Reijenga - Operations & Technology René van Tatenhove - Finance & Control Edwin Taal - Human Resources
Business units
Walter Moone1 - Rotterdam Botlek Janhein van den Eijnden1 - Rotterdam Europoort Ard Huisman1 - Vlaardingen Ramon Ernst1 - North Netherlands Tjeerd van der Voorn - Agencies Ian Ter Haar - Vlissingen
Europe, Middle East & Africa
Division management
Dick Meurs - Division President Michiel Gilsing - Commercial & Business Development Syed Atiquddin Qadri - Operations & Technology Maarten van Akkerveeken - Finance & Control Wouter Merks - Human Resources
Business units
Manon Bloemer - Belgium Jos Steeman - Germany Paul Cox - South Africa Peter van der Brug - Algeciras, Spain
Joint ventures and associates
Arnout Lugtmeijer - Vopak E.O.S., Estonia Andrew North - SabTank, Saudi Arabia Cees de Greve - Vopak Horizon Fujairah, UAE Eduardo Sanudo - Terquimsa, Spain Syed Mohammad Ali - Engro Vopak, Pakistan Abdullah Al Fardan - Jubail Chemicals Storage and Services Company (Chemtank), Saudi Arabia
Asia
Division management
Dick Richelle - Division President Casper Pieper - Commercial & Business Development Niek Verbree - Operations & Technology K.P. Aldridge - Finance & Control Christina Seet - Human Resources
Business units
Fulco van Geuns - Australia Law Say Huat - Malaysia Tan Soo Koong - Singapore Deepak Dalvi - India Lars Schaumann - Indonesia Patrick Trinh - Vietnam
Joint ventures and associates
Vitaya Pinmuangngarm - Thai Tank Terminal, Thailand J.I. Lee - Ulsan, Korea
Aqeel Hussain - Pengerang Terminals 2, Malaysia
China
Division management
Yan Chen - Division President Chen Peng - Commercial & Business Development Randy Cheong - Operations & Technology Ferry Lupescu - Finance & Control Whitney Wu - Human Resources
Business units
Foo Chek Chai - Zhangjiagang, China Xiaomei Liu - Lanshan, China
Joint ventures and associates
Jeremy Pei - Vopak SDIC Terminal Yangpu Bo Teng - Zhangzhou Gulei Haiteng Terminals Liang Wu - Tianjin Biwei Yan - Tianjin Lingang Buu Dinh - Caojing Shanghai Edwin Hui - Ningbo
1. Also a member of Division Management
215In
trod
uctio
nE
xecutive B
oard
repo
rtS
torin
g vital p
rod
ucts
with
careK
ey develo
pm
ents
per d
ivision
Su
stainab
ilityG
overnan
ce, risk an
d co
mp
liance
Finan
cial Statem
ents
Ad
ditio
nal in
form
ation
Ad
ditio
nal in
form
ation
|
Intro
du
ction
Execu
tive Bo
ard rep
ort
Sto
ring
vital pro
du
cts w
ith care
Key d
evelop
men
ts p
er divisio
nG
overnan
ce, risk an
d co
mp
liance
215
Finan
cial Statem
ents
Su
stainab
ilityA
dd
ition
al info
rmatio
n
| Vopak | Annual Report 2016
Principal company officers at 16 February 2017Principal company officers at 16 February 2017

Americas
Division management
Boudewijn Siemons - Division President Ralf van der Ven - Commercial & Business Development Jeffrey Tan - Operations & Technology Wim Samlal - Finance & Control Scott Grossman - Legal Affairs Hernán Rein - Human Resources
Business units
Chris Robblee - Gulf Coast Mike LaCavera - West Coast Charles Bradley - East Coast Ignacio González - Canada David Lozano - Mexico Cristhian Pérez - Venezuela Michael Mulford - Colombia Sjoerd Bazen - Brazil Agustin Silva - Panama
LNG
Division management
Kees van Seventer - Division President Jarmo Stoopman - General Manager Ton Floors - Commercial & Business Development Guy Marien - Operations & Technology Joost Ketelaars - Finance & Control
Joint Ventures
Rolf Brouwer - Gate Terminal, The Netherlands David Lozano - LNG Terminal Altamira, Mexico
Global staff
Wim Bloks - Sourcing & Procurement Leo Brand - Information Technology Michiel van Cortenberghe - Control & Business Analysis Kees van Seventer - Sales & Marketing Elsbeth Janmaat - Human Resources Anne-Marie Kroon - Tax Patrick van der Voort - Operations & Technology Branko Pokorny - Projects Michiel van Ravenstein - Moves IT Program Katie Slipper - Internal Audit Peter Paul Smid - Legal Affairs & Corporate Secretary Marjan Groeneveld - Treasury René Wiezer - Insurance Karen Beuk - Communication & Investor Relations
216 | Vopak | Annual Report 2016In
trod
uctio
nE
xecutive B
oard
repo
rtS
torin
g vital p
rod
ucts
with
careK
ey develo
pm
ents
per d
ivision
Govern
ance, risk
and
com
plian
ce| Vopak | Annual Report 2016 | Principal company officers at 16 February 2017
Finan
cial Statem
ents
Su
stainab
ilityA
dd
ition
al info
rmatio
n

Five-year consolidated summary In EUR millions 2016 2015 2014 2013 2012
Consolidated abridged statement of incomeRevenues 1,347 1,386 1,323 1,295 1,314
Other operating income 303 106 26 27 12
Total operating income 1,650 1,492 1,349 1,322 1,326
Operating expenses - 681 - 737 - 676 - 673 - 664
Depreciation and amortization - 264 - 256 - 239 - 217 - 203
Impairment - 6 - 4 - 40 - 21 - 15
Total operating expenses - 951 - 997 - 955 - 911 - 882
Operating profit 699 495 394 411 444Result of joint ventures and associates using the equity method 60 54 74 123 97
Group operating profit (EBIT) 759 549 468 534 541
Net finance costs - 107 - 105 - 90 - 105 - 84
Profit before income tax 652 444 378 429 457
Income tax - 72 - 117 - 83 - 68 - 84
Net profit 580 327 295 361 373
Non-controlling interests - 46 - 45 - 45 - 42 - 40
Net profit owners of parent 534 282 250 319 333
Net profit holders of financing preference shares - - - 3 - 6 - 8
Net profit holders of ordinary shares 534 282 247 313 325
Consolidated abridged statement of income excluding exceptional itemsOperating profit 435 451 436 431 459
Result of joint ventures and associates using the equity method 123 104 87 105 107
Group operating profit (EBIT) 558 555 523 536 566
Net finance costs - 107 - 103 - 90 - 102 - 84
Profit before income tax 451 452 433 434 482
Income tax - 79 - 82 - 91 - 74 - 87
Net profit 372 370 342 360 395
Non-controlling interests - 46 - 45 - 45 - 42 - 40
Net profit owners of parent 326 325 297 318 355
Net profit holders of financing preference shares - - - 3 - 6 - 8
Net profit holders of ordinary shares 326 325 294 312 347
Consolidated abridged statement of financial positionIntangible assets 146 90 92 68 68
Property, plant and equipment 3,553 3,496 3,622 3,307 3,127
Financial assets 1,138 1,108 1,001 826 759
Deferred tax 15 14 53 20 51
Other 122 148 47 41 34
Total non-current assets 4,974 4,856 4,815 4,262 4,039
Total current assets 608 641 593 561 799
Total assets 5,582 5,497 5,408 4,823 4,838
Total equity 2,559 2,160 1,903 1,928 1,753
Total non-current liabilities 2,453 2,762 2,775 2,320 2,553
Total current liabilities 570 575 730 575 532
Total liabilities 3,023 3,337 3,505 2,895 3,085
Total equity and liabilities 5,582 5,497 5,408 4,823 4,838
217In
trod
uctio
nE
xecutive B
oard
repo
rtS
torin
g vital p
rod
ucts
with
careK
ey develo
pm
ents
per d
ivision
Su
stainab
ilityG
overnan
ce, risk an
d co
mp
liance
Finan
cial Statem
ents
Ad
ditio
nal in
form
ation
Ad
ditio
nal in
form
ation
|
Intro
du
ction
Execu
tive Bo
ard rep
ort
Sto
ring
vital pro
du
cts w
ith care
Key d
evelop
men
ts p
er divisio
nG
overnan
ce, risk an
d co
mp
liance
217
Finan
cial Statem
ents
Su
stainab
ilityA
dd
ition
al info
rmatio
n
| Vopak | Annual Report 2016
Five-year consolidated summaryFive-year consolidated summary

Glossary3YMP Three-Year Maintenance Program
AFM Dutch Authority for Financial Markets
AGM Annual General Meeting of Shareholders
API RP 754 American Petroleum Institute Recommended Practice 754, Process Safety Performance Indicators for the Refining and Petrochemical Industries
ARA Region Port area of the cities of Amsterdam, Rotterdam and Antwerp
Audit Committee Committee within the Supervisory Board that assists the Supervisory Board in performing the supervisory tasks relating to, among other things, the integrity of the financial statements, the financial reporting, the internal audit procedures and the relationship with and the independence of the external auditors
Biofuels/Biodiesel Products of vegetable origin or from animal fats that are added to gasoline or diesel
Brownfield Expansion of an existing terminal
Capex Capital expenditure
Capital employed Total assets less current liabilities, excluding assets and current liabilities not related to operational activities
Cbm Cubic meter
CCIRS Cross-currency interest rate swap
CDI-T The Chemical Distribution Institute audit protocol for Terminals
CEO Chief Executive Officer, the highest ranking executive with the overall responsibility for the organization
CFO Chief Financial Officer, member of the Executive Board, specifically charged with Finance
CFROGA - Cash Flow Return on Gross Assets Before Interest and After Tax The ‘Cash Flow Return on Gross Assets’ is defined as EBITDA -excluding exceptional items- minus the statutory income tax charge on EBIT divided by the average historical investment (gross assets). This measure is used by the company to assess the cash-flow based performance trend of its operations
CO2 Carbon dioxide
COBIT Control Objectives for Information and related Technology is a framework for the governance and management of enterprise IT
COO Chief Operating Officer, member of the Executive Board, specifically charged with Operations & Technology
COP21 The 2015 United Nations Climate Change Conference (‘COP 21’), held in Paris, France, from 30 November to 12 December 2015. It was the 21st yearly session of the Conference of the Parties (COP) to the 1992 United Nations Framework Convention on Climate Change (UNFCCC)
COP22 The 2016 United Nations Climate Change Conference (‘COP 22’), held in Marrakesh, Morocco, from 7 to 18 November 2016. It was the 22nd Conference of the Parties (‘COP’) to the 1992 United Nations Framework Convention on Climate Change (UNFCCC)
Corporate Governance The manner in which the company is managed and the supervision of management is structured
COSO Committee of Sponsoring Organizations of the Treadway Commission, an international organization whose aim is to create a model for information on and management of business risks
CRSA Control Risk Self-Assessment
218 | Vopak | Annual Report 2016In
trod
uctio
nE
xecutive B
oard
repo
rtS
torin
g vital p
rod
ucts
with
careK
ey develo
pm
ents
per d
ivision
Govern
ance, risk
and
com
plian
ceFin
ancial S
tatemen
tsS
ustain
ability
Ad
ditio
nal in
form
ation
| Vopak | Annual Report 2016
GlossaryGlossary

DMA Disclosures on Management Approach
DNB Dutch Central Bank
EBIT - Earnings Before Interest and Tax Net income, before income taxes, and before net finance costs. This performance measure is used by the company to evaluate the operating performance of its operating entities
EBITDA - Earnings Before Interest, Tax, Depreciation and Amortization Net income, before income taxes, before net finance cost, and before amortization and depreciation expenses. EBITDA is a rough accounting approximate of gross cash flows generated. This measure is used by the company to evaluate the financial performance of its operating entities
EGM Extraordinary General Meeting of Shareholders
EMEA Vopak division Europe, Middle East & Africa
EPS Earnings per share
ERM Enterprise Risk Management
ERP Emergency Response Plan
EU European Union
Exceptional items A limited set of events pre-defined by the company which are not reflective of the normal business of the company and which are exceptional by nature from a management perspective. These exceptional items include impairments, reversed impairments, additions to and releases from provisions for restructuring, results on assets sold, gains on the sale of subsidiaries, joint ventures and associates, any other provisions being formed or released and any significant change in estimates The Group does not apply a threshold for impairments, reversal of impairments, disposal of investments and discontinued operations. For the other items, the Group considers an event exceptional when the effect exceeds the threshold of EUR 2.75 million
FSRU Floating Storage Regasification Unit
FTE Full-time equivalent
GDP Gross domestic product
Greenfield Building a new terminal on undeveloped land.
GRI Global Reporting Initiative (for more information visit www.globalreporting.org)
Gross Assets / Gross capital employed Gross Assets are based on the carrying amount of non-current assets, excluding loans granted,and are grossed up by means of adding back the accumulated depreciation, amortization and impairment. Subsequently, the net trade working capital (trade debtors minus trade creditors) is added. Balances related to assets under construction are excluded from the gross assets. The average historical investment is based on the quarter-end balances in the measurement period relevant to the quarter concerned
HR Human Resources
Hub Regional storage and transport center
IAS International Accounting Standards
ICT Information and Communication Technology
IFRS International Financial Reporting Standards
I-IoT Industrial Internet of Things
IMO International Maritime Organization IPCC Intergovernmental Panel on Climate Change
IRS Interest Rate Swap
219Glossary |In
trod
uctio
nE
xecutive B
oard
repo
rtS
torin
g vital p
rod
ucts
with
careK
ey develo
pm
ents
per d
ivision
Su
stainab
ilityG
overnan
ce, risk an
d co
mp
liance
Finan
cial Statem
ents
Ad
ditio
nal in
form
ation
Ad
ditio
nal in
form
ation
Intro
du
ction
Execu
tive Bo
ard rep
ort
Sto
ring
vital pro
du
cts w
ith care
Key d
evelop
men
ts p
er divisio
nG
overnan
ce, risk an
d co
mp
liance
219 | Vopak | Annual Report 2016 | Glossary
Finan
cial Statem
ents
Su
stainab
ilityA
dd
ition
al info
rmatio
n

ISCC International Sustainability & Carbon Certification
ISDA International Swaps and Derivatives Association
ISPS International Ship and Port Security Code mandated by the United States
KCF Key Control Framework
LNG Liquefied Natural Gas
LPG Liquefied Petroleum Gas
LTI Lost Time Injury
LTIP Long-term incentive plan
LTIR Lost Time Injury Rate; number of accidents entailing absence from work per 200,000 hours worked (of own personnel and contractors at subsidiaries, joint ventures and associates)
LTSP Long-term share plan
Management Report The ‘Management report’ (‘bestuursverslag’), within the meaning of section 2:391 of the Dutch Civil Code, comprises the chapters CEO statement up to and including Internal control and risk management, with the exception of the chapters Supervisory Board members, Supervisory Board report and Remuneration report
ME2 Vopak’s Maintenance Management System
MLO My Learning Operations
NCI Non-controlling interest
NGO Non-governmental organization N.R. Not reported
NOx NOx is a generic term for mono-nitrogen oxides NO and NO2 (nitric oxide and nitrogen dioxide)
NPS Net Promoter Score; a method of measuring the strength of customer loyalty for an organization
N.R. Not reported
OCI Other comprehensive income
OECD Organization for Economic Cooperation and Development
Other information The ‘Other information’ (‘overige gegevens’), within the meaning of section 2:392 of the Dutch Civil Code, comprises the chapters Independent auditor’s report, the Profit Appropriation and Stichting Vopak
PDH Propane dehydrogenation
PP Private placement, US Private placement (USPP), Asian Private Placement (APP)
PSER Process safety incidents per 200,000 hours worked
Q.R. Qualitative reporting RCF Revolving credit facility
ROCE - Return On Capital Employed Before Interest and Tax EBIT -excluding exceptional items- as a percentage of the average capital employed. This performance measure is used by the company to assess the profitability and the efficiency of its operations in relation to the capital employed
ROE - Return On Equity After Interest and Tax Net income -excluding exceptional items- as a percentage of the average equity employed. This performance measure is used by the company to assess the return that the company generates with the equity funds provided by its shareholders
RSPO Roundtable on Sustainable Palm Oil
220 | Vopak | Annual Report 2016In
trod
uctio
nE
xecutive B
oard
repo
rtS
torin
g vital p
rod
ucts
with
careK
ey develo
pm
ents
per d
ivision
Govern
ance, risk
and
com
plian
ce| Vopak | Annual Report 2016 | Glossary
Finan
cial Statem
ents
Su
stainab
ilityA
dd
ition
al info
rmatio
n

SDG Sustainable Development Goal
Shale gas A natural gas formed as a result of being trapped within shale formations
SHE Safety, Health and Environment
SMEs Small and medium-sized enterprise
SOx SOx refers to all sulfur oxides, the two major ones being sulfur dioxide (SO2) and sulfur trioxide (SO3)
THA Terminal Health Assessment
Throughput Volume of a product handled by a terminal in a given period, calculated as (in + out)/2
TIR - Total Injury Rate Total number of injuries per 200,000 hours worked (own personnel)
UN United Nations
US United States
VLCC Very Large Crude Carrier
VOC Volatile Organic Compound
VPM Vopak Project Management
221Glossary |In
trod
uctio
nE
xecutive B
oard
repo
rtS
torin
g vital p
rod
ucts
with
careK
ey develo
pm
ents
per d
ivision
Su
stainab
ilityG
overnan
ce, risk an
d co
mp
liance
Finan
cial Statem
ents
Ad
ditio
nal in
form
ation
Ad
ditio
nal in
form
ation
221 | Vopak | Annual Report 2016 | Glossary

Cover pageStoring vital products with careVopak Terminal Europoort (the Netherlands)
Inside cover pageStoring vital products with careVopak Terminal Korea (Korea)
Page 8Profile, mission & strategyVopak Singapore - Banyan Terminal (Singapore)
Page 16Business environmentVopak Brazil - Aratu Terminal (Brazil)
Page 20Financial performanceVopak Terminal Europoort (the Netherlands)
Page 25Leading assets in leading locationsVopak Terminal Vlissingen (the Netherlands)
Page 28Operational leadershipVopak Singapore - Banyan Terminal (Singapore)
Page 34Service leadershipVopak Terminal TTR (the Netherlands)
Page 36Technology leadershipVopak Terminal Durban (South Africa)
Page 38People leadershipRoyal Vopak Global head office (the Netherlands)
Page 43OverviewPengerang Independent Terminals (Malaysia)
Page 44Netherlands (key developments)Vopak Terminal Botlek (the Netherlands)
Page 46EMEA (key developments)Vopak Horizon Fujairah (United Arab Emirates)
Page 48Asia (key developments)Vopak Singapore - Banyan Terminal (Singapore)
Page 50Americas (key developments)Terminal Bahia Las Minas (Panama)
Page 52LNG (key developments)Gate Terminal (the Netherlands)
Page 58Stakeholder engagement & materiality assessmentVopak Terminals of Canada - Montreal East (Canada)
Page 223Additional information (Contact us)Vopak Global head office (the Netherlands)
222 | Vopak | Annual Report 2016In
trod
uctio
nE
xecutive B
oard
repo
rtS
torin
g vital p
rod
ucts
with
careK
ey develo
pm
ents
per d
ivision
Govern
ance, risk
and
com
plian
ce| Vopak | Annual Report 2016 | Glossary
Finan
cial Statem
ents
Su
stainab
ilityA
dd
ition
al info
rmatio
n

Contact us
Royal VopakGlobal Communication & Investor RelationsTelephone: +31 (0)10 400 2911Email: [email protected]
Visiting addressWesterlaan 103016 CK RotterdamThe Netherlands
Postal addressP.O. Box 8633000 AW RotterdamThe Netherlands
Media contactLiesbeth LansTelephone: +31 (0)10 400 2777Email: [email protected]
Investor Relations contactChiel RietveltTelephone: +31 (0)10 400 2776Email: [email protected]
Sustainability contactWillem van der ZonTelephone: +31 (0)10 400 2561Email: [email protected]
223In
trod
uctio
nE
xecutive B
oard
repo
rtS
torin
g vital p
rod
ucts
with
careK
ey develo
pm
ents
per d
ivision
Su
stainab
ilityG
overnan
ce, risk an
d co
mp
liance
Finan
cial Statem
ents
Ad
ditio
nal in
form
ation
Ad
ditio
nal in
form
ation
| Vopak | Annual Report 2016223 | Vopak | Annual Report 2016
Contact us Contact us

CreditsConsultancy, concept and designDartGroup, Amsterdam
Technical realizationDartGroup, Amsterdam
Photography Martin Dijkstra
224 | Vopak | Annual Report 2016In
trod
uctio
nE
xecutive B
oard
repo
rtS
torin
g vital p
rod
ucts
with
careK
ey develo
pm
ents
per d
ivision
Govern
ance, risk
and
com
plian
ceFin
ancial S
tatemen
tsS
ustain
ability
Ad
ditio
nal in
form
ation
| Vopak | Annual Report 2016
Additional information
Royal VopakWesterlaan 103016 CK RotterdamP.O.Box 8633000 AW RotterdamThe Netherlands
Telephone: +31 10 400 29 11Email: [email protected]