Embed Size (px)
Citation preview
www.americanprogress.org
istoc
kpho
to
Stop the ConferenceThe Economic and Fiscal Consequences of Conference Cancellations Due to Arizona’s S.B. 1070
Marshall Fitz and Angela Kelley November 2010
Research and economic analysis conducted by Elliott D. Pollack & Company

Stop the ConferenceThe Economic and Fiscal Consequences of Conference Cancellations Due to Arizona’s S.B. 1070
Marshall Fitz and Angela Kelley November 2010
Research and economic analysis conducted by Elliott D. Pollack & Company

Contents 1 Executive summary
4 Methodology and assumptions 4 Background
5 Assumptions
6 Economic impact methodology
7 Fiscal impact methodology
10 Losses from reported cancellations 10 Cancellation and spending assumptions
11 Economic losses
11 Fiscal losses
13 Losses from future booking declines 13 Visitor assumptions and scenarios
14 Economic losses
15 Fiscal losses
16 Incremental effects
17 Conclusion
18 About the authors and acknowledgements
20 Endnotes

Total losses from cancellations and
booking declines • $217 million in lost direct spending by
convention attendees• 4,236 lost jobs• $133 million in lost earnings• $388 million in lost economic output • $14.4 million in lost tax revenue
Losses from conventions already cancelled• $141 million in lost direct spending by
convention attendees• 2,761 lost jobs• $86.5 million in lost earnings• $253 million in lost economic output• $9.4 million in lost tax revenues
Potential losses from future convention
booking declines• $76 million in lost direct spending by con-
vention attendees• 1,475 lost jobs• $46 million in lost earnings• $135 million in lost economic output• $5 million in lost taxes
1 center for American progress | stop the conference
Executive summary
Arizona’s enactment of harsh, anti-immigrant legislation—S.B. 1070—sparked an incendiary national debate over the role of states in making and enforcing immigration policy.1 Some states and localities rushed to copy Arizona’s draconian approach; others adopted resolutions condemning Arizona’s intolerance. But all states would be wise to consider the practical implications of their decisions before following Arizona any further down the proverbial garden path.
Passage of the Arizona legislation triggered a fierce, national public-opinion backlash against the state and led many national organizations and opinion leaders to call for economic boycotts.2 Arizona’s business community, especially those in the tourism industry, anticipated and feared this type of response to S.B. 1070.3 And the conven-tion industry felt the effects of this backlash immediately when major groups and associations started canceling events and conventions in the state. Arizona’s Hotel and Lodging Association publicly reported a combined loss of $15 million in lodg-ing revenue due to meeting cancellations just four months after the bill’s passage.4
Our extensive research estimates that the actual lost lodging revenue from these cancellations is at least three times that amount: $45 million. That estimate provides a basis for calculating other losses in visitor spending. Analyzing average food and beverage, entertainment, in-town transportation, and retail sales brings the com-bined loss of estimated conference attendee spending up to a startling $141 million.
The economic and fiscal consequences of conference cancellations

2 center for American progress | stop the conference
This significant hit to direct visitor spending could not come at a worse economic time for Arizona and yet these numbers still vastly understate the overall conse-quences of these cancellations for the state’s economy. Cancelled meetings and conferences over the next two to three years would have supported nearly 2,800 jobs. The cancellations will trigger more than a quarter billion dollars in lost eco-nomic output and more than $86 million in lost wages.
The losses will hurt the state’s businesses and workers as well as the state’s budget through lost economic activity and sales and bed taxes from convention attendees. The state will also lose income taxes on now-lost salaries, and sales taxes on goods and services that would have been purchased with those earnings. The ripple effect of the meetings and conventions that have already been cancelled adds up to a fiscal setback of more than $9 million in lost tax revenue over the next two to three years.
But the economic and fiscal consequences don’t stop there. It is highly likely that decisions not to book conventions in Arizona will continue for some time. In fact, bookings through the Convention and Visitors’ Bureau in July and August 2010 were down 35 percent from the same period in 2009 according to reviewed bookings and leads data.5 Large convention bookings typically occur several years in advance, and many organizations and associations will be making booking deci-sions over the course of the next year.
The report examines a range of possible future booking scenarios since many factors could alter trends in the bookings decline. The first, high-range scenario assumes that the decline in future bookings will continue at this rate for the next year, which would produce the greatest economic loss. A low-range scenario assumes that no further decrease in bookings will continue, which would lead to the smallest economic and fiscal losses.
A mid-range scenario that splits the difference between the high- and low-range possibilities estimates that Arizona businesses will lose $76 million in direct rev-enue from decisions not to book in Arizona in the future. That loss translates into 1,475 lost jobs, $46 million in lost wages, $135 million in lost economic output, and $5 million in lost tax revenues. That is in addition to the losses already trig-gered by cancelled bookings.
These convention cancellations represent only a portion of Arizona’s economic losses due to this legislation. These findings do not encompass other economic
3 center for American progress | stop the conference
setbacks, such as leisure travel cancellations, or boycotts from other municipalities and the entertainment industry. For example, Los Angeles, Austin, and St. Paul have all approved boycotts of Arizona and dozens more have stopped just short of a boycott, condemning S.B. 1070 and urging the state to repeal the law.6 Mexico’s Foreign Ministry warned Mexican nationals that they could be “questioned for no reason at any moment” in a travel advisory posted in April.7 And hundreds of artists, including Kanye West and Rage Against the Machine, have joined in a performance boycott of Arizona called The Sound Strike.8
This report also does not capture other types of economic consequences such as workers and families that have reportedly left the state, or disrupted productivity at businesses whose employees are targeted by the law.9 There are also signifi-cant budgetary concerns such as the substantial litigation costs that are already mounting for the state.10
Yet even the narrow and targeted scope of this report shows that Arizona is facing severe economic and fiscal consequences. This report provides a clear window into the potentially catastrophic impacts of pursuing harsh, state-based immigration policies and should give other state legislatures pause before pursu-ing such measures.
4 center for American progress | stop the conference
Methodology and assumptions
Background
The Center for American Progress retained Elliott D. Pollack & Company to perform a study into the economic and fiscal consequences of the tourism boycott that occurred in response to the passage of S.B. 1070.
The report’s scope is extremely limited in that it only considers the effects of lost tourism from meetings and conventions. The figures reported within this analy-sis do not take into consideration any other potentially negative consequences, such as leisure travel cancellations, municipal business boycotts, entertainment boycotts such as concert cancellations, and other losses. The analysis also does not address any changes in state expenditure obligations.
The study focuses on the economic and fiscal consequences from:
Existing cancellations: lost tourism due to conventions that have already made the decision to cancel or relocate their meetings
Future booking declines: potential ongoing losses from decisions not to book conferences and conventions in the near future
Incremental cancellations: a method for estimating further future lost bookings or cancellations if more data about cancellations become public
The economic impact analysis examines the regional implications of cancellations in terms of output, earnings, and job creation. The fiscal impact analysis evaluates public revenue losses from conference cancellations.
The economic losses reported in this document are only attributable to lost convention travel and do not include losses associated with cancelled concerts, personal tourism travel, future labor shortages, tax base declines, or savings associ-ated with reduced government obligations.
5 center for American progress | stop the conference
Assumptions
Numerous articles in the media actively tracked associations and meetings that announced intentions to cancel or no longer consider Arizona for their upcoming conventions as a way to register opposition to S.B. 1070.11 The initial purpose of this analysis was to collect as much information from known cancellations by con-tacting convention centers, hotels, and the associations themselves. An exhaustive effort to initiate contact and make inquiries revealed that only a limited number would agree to an interview, and those that did were reticent in divulging informa-tion. Some organizations and hotels or convention centers were willing to share comments on the issue, but they withheld the specifics on most meetings.
Industry experts explained that these reactions are with good reason due to the competitiveness of the industry. The relationships that convention centers, hotels, and visitors bureaus have with existing and potential clients are proprietary. Revealing such information creates a risk of lost business if competing meeting spaces in other regions across the country are aware of the specific relationship and directly target those associations through marketing efforts.
The limited data that is available, however, made it possible to model potential impacts and to estimate a rough scale of losses.
Market segment focus
Large association convention business appears to have been most affected by the national backlash. This is especially true for organizations whose members or mis-sion statements value diversity or civil rights.
Travel statistics for other travel segments, such as leisure travelers and corporate entities, have not shown significant losses so far. But the number of reported sta-tistics is only just beginning to reflect possible consequences from the opposition to S.B. 1070.
A review of Smith Travel Research statistics shows, for example, a significant drop-off of occupancy growth after June of this year.12 The statistics for the month of June largely track the year-to-date statistics. The Phoenix metro area ranked fifth out of the top 25 metropolitan markets in June 2010 for percent growth in occupancy among all customer segments, 11th for transient occupancy growth
6 center for American progress | stop the conference
(leisure travelers), and eighth for group occupancy growth (convention delegates and other large parties). The year-to-date statistics ( January through June) show Phoenix at sixth for total occupancy growth, 12th in transient occupancy growth, and fifth in group occupancy growth. In other words, the figures for the month of June largely tracked occupancy levels for the Phoenix metro area throughout the first half of 2010.
These figures change dramatically in the month of July. Phoenix dropped to 22nd in transient occupancy growth that month, 25th out of 25 in group occupancy growth, and 25th in total occupancy growth. It was one of only four markets to post a decline in occupancy for transient lodging and one of only two markets to post a decline in group occupancy. And it was the only metropolitan market to post a decline in total occupancy growth. These declines were so severe that they caused the city’s year-to-date rankings to decline significantly. From June to July, the Phoenix market dropped from 12th to 17th in year-to-date transient occu-pancy growth, from fifth to eighth in group occupancy growth, and from sixth to 12th in total occupancy growth.
Recent statistics like these, along with the feedback from tourism industry repre-sentatives, indicate that the new immigration law has initiated real consequences that will be realized over the next several years.
Economic impact methodology
The economic impact analysis examines the economic implications of confer-ence activity losses in terms of output, earnings, and employment. There are three different types of economic impact for each of these groups: direct, indirect, and induced. For instance, direct employment consists of permanent jobs held by construction workers and employees within commercial buildings. Indirect employment refers to those jobs created by businesses that provide goods and services essential to the operation or construction of the convention enterprise. These businesses range from manufacturers (who make goods) to wholesalers (who deliver goods). Spending by direct and indirect employees on items such as food, housing, transportation, and medical services creates induced employment in all sectors of the economy throughout the metropolitan area. The analysis in this study captures these secondary effects as well as the direct and indirect effects.

7 center for American progress | stop the conference
The analysis develops multipliers to estimate the indirect and induced impacts of various direct economic activities. The Minnesota IMPLAN Group developed the multipliers used in this study.13 The economic impact is categorized into three types of impacts:
• Employment: the change in total wage, salary, and self-employed jobs. These include both part-time and full-time workers.
• Earnings: the change in direct, indirect, and induced employees’ personal income, earnings, or wages. Earnings include total wage and salary payments as well as benefits of health and life insurance, retirement payments, and any other non-cash compensation.
• Economic output: the change in economic activity, which relates to the gross receipts for goods or services generated by a company’s operations.
All dollar figures are expressed in 2010 dollars unless otherwise stated.
Fiscal impact methodology
The fiscal impact analysis studies the public revenues associated with conference activity losses. It analyzes local, county, and state governments’ primary revenue sources—taxes—to determine how an activity may affect the various jurisdic-tions. The analysis excludes special districts or other local tax entities.
The fiscal impact figures cited in this report are generated from information provided by a variety of sources including the U.S. Bureau of the Census, the U.S. Department of Labor, the Internal Revenue Service, the state of Arizona, the Arizona Tax Research Association, and the U.S. Consumer Expenditure Survey.
Spending related to tourist activity creates beneficial fiscal effects for a region. The primary revenues to governmental entities can be calculated from the assumptions of the study. The major revenue sources for Arizona would include sales taxes and bed taxes collected directly from convention delegates. These revenues have been calculated from the assumptions of the study.
Employees who work within industries that receive and are supported by the conference attendees’ spending dollars would spend part of their salaries on local
8 center for American progress | stop the conference
goods and services. The employees would thus also contribute to state revenues, which are ultimately shared with local cities and counties. This report refers to these revenues as secondary impacts, which include:
Sales tax: The state, county, and local governments in Arizona charge sales tax on retail goods, which is officially called the transaction privilege tax. Arizona’s sales tax rate is temporarily 6.6 percent.14 Portions of this tax are redistributed through revenue sharing to counties and cities throughout Arizona based on population. These tax rates are also applied to the spending of direct, indirect, and induced employees. This report calculates the projected extent of retail spending and resulting sales tax receipts based on data from the U.S. Consumer Expenditure Survey.
Bed tax: Arizona imposes a bed tax on hotel rooms. This rate replaces the sales tax and is currently set at 6.5 percent.
State shared revenues: Each county and city in Arizona receives a portion of state revenues from four different sources: state sales tax, state income tax (cities only), vehicle license tax, and highway user tax. The formulas for allocating these revenues are primarily based on population.
State income tax: Arizona collects taxes on personal income. The tax rate used in this analysis averages about 1.6 percent for earnings.15 These percentages are based on the state’s most recently available income-tax data and the pro-jected wage levels of jobs created by construction and operations. Our analy-sis applies this tax to wages and earnings from direct, indirect, and induced employment. Portions of this tax are redistributed through revenue sharing to cities throughout Arizona based on population.
State unemployment tax: Unemployment insurance tax for employees is 2.7 percent on the first $7,000 of earned income.16 Our analysis applies this factor to the projected wages and earnings of direct, indirect, and induced employees.
HURF taxes: Arizona collects specific taxes for the Highway User Revenue Fund. Our analysis covers both the registration fees and the motor vehicle fuel tax. The motor vehicle fuel tax is $0.18 per gallon and is calculated based on a vehicle traveling 12,000 miles per year at 20 miles per gallon.17 Registration fees average $66 per employee in Arizona.18 Our analysis applies these factors
9 center for American progress | stop the conference
to the projected direct, indirect, and induced employee count. Portions of these taxes are distributed to cities and counties throughout Arizona based on a formula that includes population and the origin of gasoline sales.
Vehicle license tax: The vehicle license tax is a personal property tax placed on vehicles at the time of annual registration. Our analysis applies this factor to the projected direct, indirect, and induced employee count. The average tax used in this analysis is $325 and portions of the total collections are distrib-uted through the Highway User Revenue Fund.19 Cities and counties share the remaining funds in accordance with population-based formulas.
The above tax categories represent the largest sources of revenues generated to city, county, and state governments. This analysis reports state revenues and con-siders gross tax collections and does not differentiate among dedicated purposes or uses of such gross tax collections.
10 center for American progress | stop the conference
Losses from reported cancellations
Preliminary figures released to the media do not represent the full breadth of lost economic activity associated with convention cancellations. The reported $15 million figure actually represents only an estimated one-third of hotel spending and does not include total visitor travel spending. Lost direct spending within the state actually totals an estimated $141.4 million. This translates into $9.4 million in lost state tax collections, nearly 2,800 lost jobs, $87 million in lost earnings, and $253 million in lost economic output over a period of two to three years.
Cancellation and spending assumptions
Some members of the Arizona Hotel and Lodging Association, or AZHLA, have reported a combined loss of $15 million in lodging revenue due to meeting cancellations attributed to the passage of S.B. 1070.20 This is an extremely limited estimate of losses by many accounts.
There are strong reasons to conclude that the “losses” figure is well understated. Not every hotel in Arizona is a member of AZHLA. One of the largest resort hotels, JW Marriott Desert Ridge Resort and Spa, which has 950 hotel rooms and 240,000 square feet of meeting space, is not a member and would not have reported any meeting cancellations to the association.21 AZHLA also did not undertake an exhaustive effort to poll all of its member hotels in order to create a comprehensive list of meeting cancellations. The organization just compiled a list of cancellations that were voluntarily reported to it.22
The topic is also controversial, and so very few individuals were willing to go on record in terms of reporting lost lodging activity in the state. This was true of local professionals in the tourism field, as well as the individual organizations that ini-tially reported to boycott Arizona only to later refuse an interview for this report. We estimate based on industry feedback that the $15 million estimate represents approximately one-third of the true lodging revenues that will be lost some time during the next couple of years.

11 center for American progress | stop the conference
This report uses travel spending surveys and economic impact modeling to esti-mate total spending losses based on a loss of $45 million (three times the initial $15 million estimate) in just lodging spending over a partial year. We also calcu-late total visitor spending using lodging spending as a base for the calculation. This figure drives the cumulative economic and tax revenue losses. Total spending includes food and beverage, entertainment, in-town transportation, and retail spending from lost convention delegates. We estimate that this spending would have reached $141.4 million. (see Table 1)
Economic losses
Total spending from lost conference attendees could have sup-ported more than 1,937 direct jobs. These attendees would have also created an additional 824 indirect and induced jobs for a total impact of 2,761 jobs spread over multiple years. Those workers would have received $86.5 million in wages and the overall eco-nomic impact would have totaled $253.0 million within the state. (see Table 2)
Fiscal losses
Spending and employment generate revenues that would ultimately flow to the state of Arizona. The county and municipality in which the spending was going to occur would also see benefits from collecting tax revenues. Local gov-ernments combined accrue roughly half of what the state collects as an approxi-mate rule of thumb.
Some revenues are more direct and definable than others. This analysis defines revenues as either primary or secondary, depending on their source and how the dollars flow through the economy into government tax accounts. Some revenues, such as construction sales taxes, are definable, straightforward calculations based on the value of construction. This study defines these revenues as primary revenues. Secondary revenues, on the other hand, flow from the wages of those direct, indirect, and induced employees who are supported by the project, as well as revenues that the states distribute from various tax categories.
Table 1
Visitor assumptions
Lodging $45,000,000
Food and beverage $50,100,000
Entertainment $13,400,000
In-town transportation $14,100,000
Retail $18,800,000
Total $141,400,000
Source: Arizona Office of Tourism; IACVB; EDPCo
Table 2
Economic consequences of lost tourism to Arizona, in 2010 dollars
Impact type Jobs Wages Economic output
Direct 1,937 $48,944,000 $141,511,000
Indirect 358 $17,689,000 $53,225,000
Induced 466 $19,904,000 $58,293,000
Total 2,761 $86,537,000 $253,029,000
Note: The total may not equal the sum of the impacts due to rounding. All dollar figures are in constant dollars. Inflation has not been included in these figures. Source: Elliott D. Pollack & Company; IMPLAN

12 center for American progress | stop the conference
Revenue projections are based on direct spending as well as typical wages of the employees supported by the spending, their spending patterns, and other assump-tions outlined earlier in this report.
The direct spending of more than $141 million in travel-related expenses would generate $3.9 million in sales tax for the state of Arizona, $2.0 million in bed taxes, and an additional $3.6 million in secondary revenues generated from employees that would have spent their disposable income from wages in the state. This totals $9.4 million in lost state tax collections that can be attributed to the cancellations. These losses would be realized primarily in fiscal years 2011 and 2012. (see Table 3)
Table 3
Fiscal consequences of lost tourism to Arizona, in 2010 dollars
Primary revenues Secondary revenues from employees
Direct sales tax Direct bed tax Employees sales tax Income tax Vehicle license tax Unemployment taxHURF fuel and
registration tax Total annual
revenues
Direct $3,890,000 $1,966,900 $963,300 $575,500 $125,200 $366,200 $179,600 $8,066,700
Indirect N/A N/A $247,900 $259,500 $23,100 $67,600 $33,200 $631,300
Induced N/A N/A $297,500 $292,000 $30,100 $88,100 $43,200 $750,900
Total $3,890,000 $1,966,900 $1,508,700 $1,127,000 $178,400 $521,900 $256,000 $9,448,900
*Total may not equal sum of impacts due to rounding. All dollar figures are in constant dollars. Inflation has not been included in these figures. All of the above figures do not include revenues distributed to counties, cities, and towns. All of the above figures are representative of major revenue sources for the state of Arizona. Figures are intended only as a general guideline as to how the state could be affected The above figures are based on Arizona's current economic structure and tax rates. Source: Elliott D. Pollack & Company; IMPLAN; Arizona Department of Revenue; Arizona Tax Research Association
13 center for American progress | stop the conference
Losses from future booking declines
Bookings through the Phoenix Convention and Visitors Bureau were down 35 percent in August 2010.23 A worst-case scenario assumes that the decline in book-ings will continue for a full year. A best-case scenario assumes that no further decrease in bookings will occur. And a mid-range scenario falls in between these two extreme scenarios.
The mid-range scenario that we adopted to calculate totals finds that Arizona will lose $75.6 million in total visitor spending. This translates into an estimated 1,475 lost jobs, $135.2 million in lost economic activity, and $5.0 million in lost state tax collections. Lost tax collections rise to $10.1 million under the worst-case scenario. These figures relate only to Phoenix-area activity and should be considered a con-servative estimate of true, statewide lost future economic activity.
Visitor assumptions and scenarios
It is very likely that opposition to the legislation will depress large-association convention activity for some time going forward. Many large associations are run by a board of directors that meets only periodically throughout the year to vote on items on their agenda. One industry expert stated that these meetings typically occur in June and December each year.24 The concern is that these boards could cancel booked events after the next round of association meetings.
The following modeling exercise examines the potential that continued depressed convention activity could have on Arizona’s economy. This example utilizes the Phoenix Convention Center as the scenario. The Phoenix Convention Center is the largest convention center in the state of Arizona and is often the only option within the state to accommodate large meetings that reach multiple thousands of delegates.
The modeling took into consideration three scenarios of differing percentage declines in bookings. The declines were calculated against the 309,729-person del-egate total at the Phoenix Convention Center in 2009. The “high-range” scenario
14 center for American progress | stop the conference
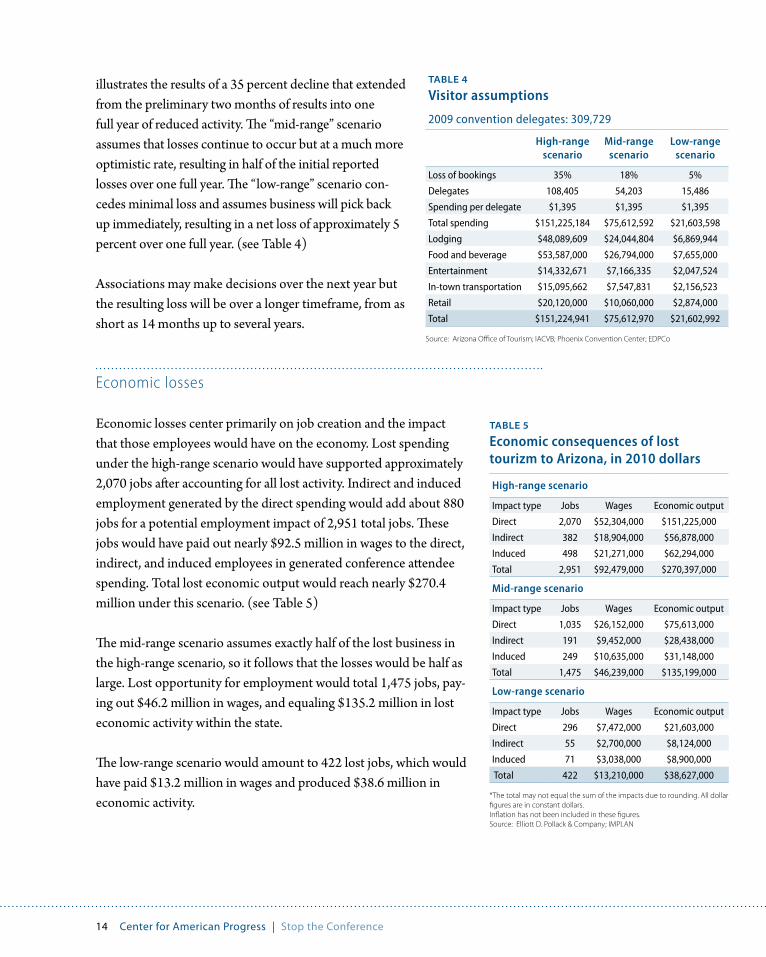
illustrates the results of a 35 percent decline that extended from the preliminary two months of results into one full year of reduced activity. The “mid-range” scenario assumes that losses continue to occur but at a much more optimistic rate, resulting in half of the initial reported losses over one full year. The “low-range” scenario con-cedes minimal loss and assumes business will pick back up immediately, resulting in a net loss of approximately 5 percent over one full year. (see Table 4)
Associations may make decisions over the next year but the resulting loss will be over a longer timeframe, from as short as 14 months up to several years.
Economic losses
Economic losses center primarily on job creation and the impact that those employees would have on the economy. Lost spending under the high-range scenario would have supported approximately 2,070 jobs after accounting for all lost activity. Indirect and induced employment generated by the direct spending would add about 880 jobs for a potential employment impact of 2,951 total jobs. These jobs would have paid out nearly $92.5 million in wages to the direct, indirect, and induced employees in generated conference attendee spending. Total lost economic output would reach nearly $270.4 million under this scenario. (see Table 5)
The mid-range scenario assumes exactly half of the lost business in the high-range scenario, so it follows that the losses would be half as large. Lost opportunity for employment would total 1,475 jobs, pay-ing out $46.2 million in wages, and equaling $135.2 million in lost economic activity within the state.
The low-range scenario would amount to 422 lost jobs, which would have paid $13.2 million in wages and produced $38.6 million in economic activity.
Table 4
Visitor assumptions
2009 convention delegates: 309,729
High-range scenario
Mid-range scenario
Low-range scenario
Loss of bookings 35% 18% 5%
Delegates 108,405 54,203 15,486
Spending per delegate $1,395 $1,395 $1,395
Total spending $151,225,184 $75,612,592 $21,603,598
Lodging $48,089,609 $24,044,804 $6,869,944
Food and beverage $53,587,000 $26,794,000 $7,655,000
Entertainment $14,332,671 $7,166,335 $2,047,524
In-town transportation $15,095,662 $7,547,831 $2,156,523
Retail $20,120,000 $10,060,000 $2,874,000
Total $151,224,941 $75,612,970 $21,602,992
Source: Arizona Office of Tourism; IACVB; Phoenix Convention Center; EDPCo
Table 5
Economic consequences of lost tourizm to Arizona, in 2010 dollars
High-range scenario
Impact type Jobs Wages Economic output
Direct 2,070 $52,304,000 $151,225,000
Indirect 382 $18,904,000 $56,878,000
Induced 498 $21,271,000 $62,294,000
Total 2,951 $92,479,000 $270,397,000
Mid-range scenario
Impact type Jobs Wages Economic output
Direct 1,035 $26,152,000 $75,613,000
Indirect 191 $9,452,000 $28,438,000
Induced 249 $10,635,000 $31,148,000
Total 1,475 $46,239,000 $135,199,000
Low-range scenario
Impact type Jobs Wages Economic output
Direct 296 $7,472,000 $21,603,000
Indirect 55 $2,700,000 $8,124,000
Induced 71 $3,038,000 $8,900,000
Total 422 $13,210,000 $38,627,000
*The total may not equal the sum of the impacts due to rounding. All dollar figures are in constant dollars. Inflation has not been included in these figures. Source: Elliott D. Pollack & Company; IMPLAN
15 center for American progress | stop the conference
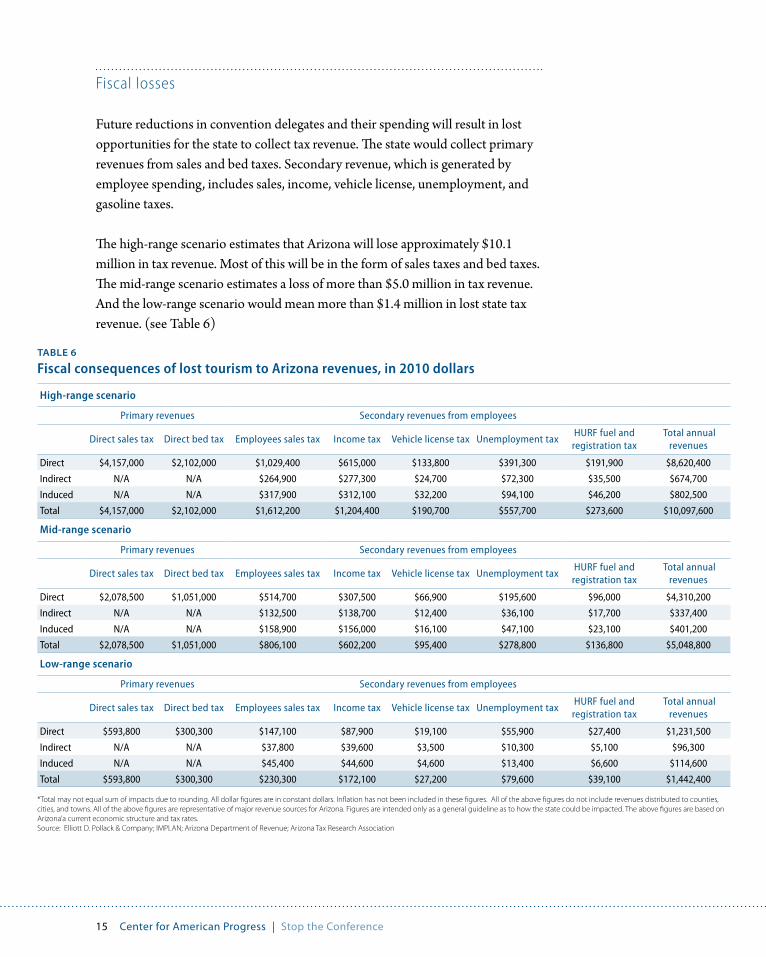
Fiscal losses
Future reductions in convention delegates and their spending will result in lost opportunities for the state to collect tax revenue. The state would collect primary revenues from sales and bed taxes. Secondary revenue, which is generated by employee spending, includes sales, income, vehicle license, unemployment, and gasoline taxes.
The high-range scenario estimates that Arizona will lose approximately $10.1 million in tax revenue. Most of this will be in the form of sales taxes and bed taxes. The mid-range scenario estimates a loss of more than $5.0 million in tax revenue. And the low-range scenario would mean more than $1.4 million in lost state tax revenue. (see Table 6)
Table 6
Fiscal consequences of lost tourism to Arizona revenues, in 2010 dollars
High-range scenario
Primary revenues Secondary revenues from employees
Direct sales tax Direct bed tax Employees sales tax Income tax Vehicle license tax Unemployment taxHURF fuel and
registration tax Total annual
revenues
Direct $4,157,000 $2,102,000 $1,029,400 $615,000 $133,800 $391,300 $191,900 $8,620,400
Indirect N/A N/A $264,900 $277,300 $24,700 $72,300 $35,500 $674,700
Induced N/A N/A $317,900 $312,100 $32,200 $94,100 $46,200 $802,500
Total $4,157,000 $2,102,000 $1,612,200 $1,204,400 $190,700 $557,700 $273,600 $10,097,600
Mid-range scenario
Primary revenues Secondary revenues from employees
Direct sales tax Direct bed tax Employees sales tax Income tax Vehicle license tax Unemployment taxHURF fuel and
registration tax Total annual
revenues
Direct $2,078,500 $1,051,000 $514,700 $307,500 $66,900 $195,600 $96,000 $4,310,200
Indirect N/A N/A $132,500 $138,700 $12,400 $36,100 $17,700 $337,400
Induced N/A N/A $158,900 $156,000 $16,100 $47,100 $23,100 $401,200
Total $2,078,500 $1,051,000 $806,100 $602,200 $95,400 $278,800 $136,800 $5,048,800
Low-range scenario
Primary revenues Secondary revenues from employees
Direct sales tax Direct bed tax Employees sales tax Income tax Vehicle license tax Unemployment taxHURF fuel and
registration tax Total annual
revenues
Direct $593,800 $300,300 $147,100 $87,900 $19,100 $55,900 $27,400 $1,231,500
Indirect N/A N/A $37,800 $39,600 $3,500 $10,300 $5,100 $96,300
Induced N/A N/A $45,400 $44,600 $4,600 $13,400 $6,600 $114,600
Total $593,800 $300,300 $230,300 $172,100 $27,200 $79,600 $39,100 $1,442,400
*Total may not equal sum of impacts due to rounding. All dollar figures are in constant dollars. Inflation has not been included in these figures. All of the above figures do not include revenues distributed to counties, cities, and towns. All of the above figures are representative of major revenue sources for Arizona. Figures are intended only as a general guideline as to how the state could be impacted. The above figures are based on Arizona’a current economic structure and tax rates. Source: Elliott D. Pollack & Company; IMPLAN; Arizona Department of Revenue; Arizona Tax Research Association
16 center for American progress | stop the conference
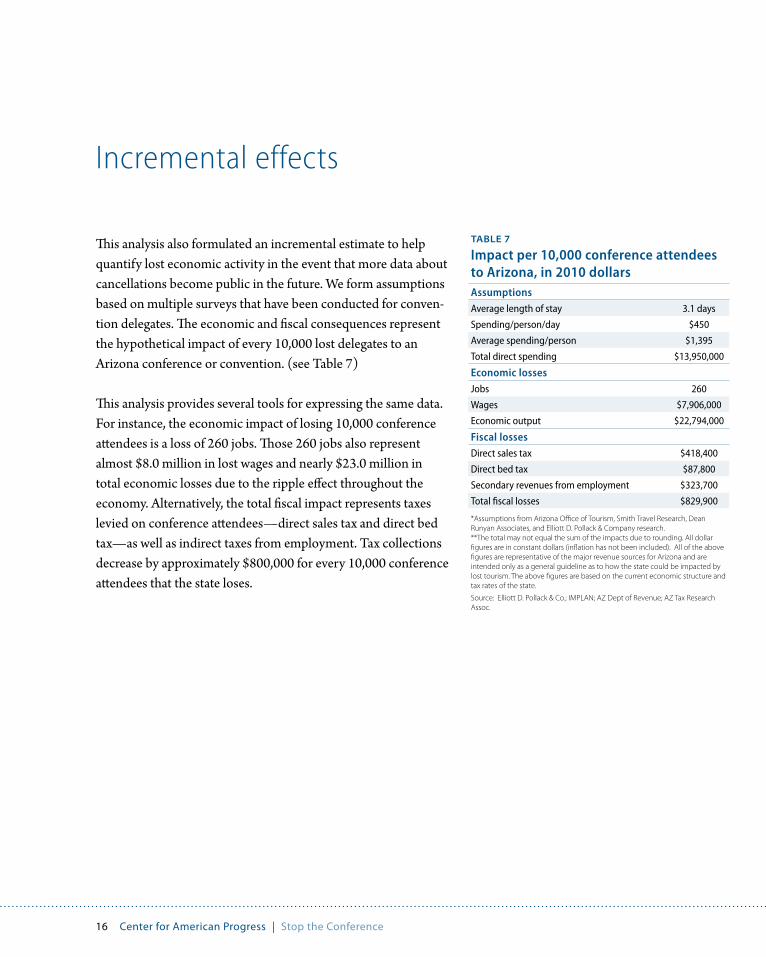
Incremental effects
This analysis also formulated an incremental estimate to help quantify lost economic activity in the event that more data about cancellations become public in the future. We form assumptions based on multiple surveys that have been conducted for conven-tion delegates. The economic and fiscal consequences represent the hypothetical impact of every 10,000 lost delegates to an Arizona conference or convention. (see Table 7)
This analysis provides several tools for expressing the same data. For instance, the economic impact of losing 10,000 conference attendees is a loss of 260 jobs. Those 260 jobs also represent almost $8.0 million in lost wages and nearly $23.0 million in total economic losses due to the ripple effect throughout the economy. Alternatively, the total fiscal impact represents taxes levied on conference attendees—direct sales tax and direct bed tax—as well as indirect taxes from employment. Tax collections decrease by approximately $800,000 for every 10,000 conference attendees that the state loses.
Table 7
Impact per 10,000 conference attendees to Arizona, in 2010 dollarsAssumptionsAverage length of stay 3.1 days
Spending/person/day $450
Average spending/person $1,395
Total direct spending $13,950,000
Economic lossesJobs 260
Wages $7,906,000
Economic output $22,794,000
Fiscal lossesDirect sales tax $418,400
Direct bed tax $87,800
Secondary revenues from employment $323,700
Total fiscal losses $829,900
*Assumptions from Arizona Office of Tourism, Smith Travel Research, Dean Runyan Associates, and Elliott D. Pollack & Company research. **The total may not equal the sum of the impacts due to rounding. All dollar figures are in constant dollars (inflation has not been included). All of the above figures are representative of the major revenue sources for Arizona and are intended only as a general guideline as to how the state could be impacted by lost tourism. The above figures are based on the current economic structure and tax rates of the state.
Source: Elliott D. Pollack & Co.; IMPLAN; AZ Dept of Revenue; AZ Tax Research Assoc.
17 center for American progress | stop the conference
Conclusion
State and local governments have good reason to be frustrated with the federal government’s failure to produce a rational, legal immigration system. But Arizona’s approach of enacting its own “attrition through enforcement” immigration policy is costly and counterproductive.25 Not only has a federal judge blocked much of the legislation as unconstitutional but this report also shows that the national backlash it triggered has significantly harmed the state’s economy.26
Even focusing narrowly on just one sector—the state’s important convention industry—we find that the consequences are severe. National opposition to the legislation has produced or will produce hundreds of millions of dollars in lost direct spending in the state and diminished economic output. That, in turn, will lead to thousands of lost jobs and more than $100 million in lost salaries.
Other states considering immigration legislation should pause before rush-ing to adopt measures like S.B. 1070 and understand the potentially disastrous economic and fiscal consequences of such a decision. This report illuminates just one of the many unintended and costly consequences that can result from proceeding down this path.
18 center for American progress | stop the conference
About the authors
Marshall Fitz is Director of Immigration Policy at American Progress. Before hold-ing his current position he served as the director of advocacy for the American Immigration Lawyers Association where he led the education and advocacy efforts on all immigration policy issues for the 11,000-member professional bar association. He has been a leader in national and grassroots coalitions that have organized to advance progressive immigration policies.
Fitz has been one of the key legislative strategists in support of comprehensive immigration reform and has served as a media spokesperson on a broad array of immigration policy and legislative issues. He has appeared on national and regional television and radio stations including MSNBC, CNN, BBC, C-SPAN, Fox News, and NPR; been quoted extensively across the spectrum of interna-tional, national, and local publications; and presented at national conferences and universities on immigration matters. He has also advised numerous members of Congress on immigration policy, politics, and strategy and helped draft major legislation. He currently serves on the boards and steering committees of other national organizations focused on immigrant rights and immigration policy.
Marshall is a graduate of the University of Virginia School of Law and served on the Virginia Law Review. After graduation he clerked for Judge Bruce M. Selya on the U.S. Court of Appeals for the First Circuit. In the following years he practiced immigration law in Washington, D.C., at Hogan & Hartson, LLP.
Angela M. Kelley, a well-known authority on the policy and the politics of immi-gration, joined American Progress in 2009 as Vice President for Immigration Policy and Advocacy.
As Vice President, Angela applies her 20 years of experience in the immigration field to the Center’s stepped-up immigration initiative, overseeing and coordinat-ing the Center’s work in this area.
Throughout her career, Angela has been at the forefront of policy debates regard-ing changes in immigration policy and the historic creation of the Department of Homeland Security following the 9/11 terrorist attacks.
Angela’s sharp and credible political analyses make her a frequent speaker before other policy groups and she is often asked by news organizations to comment on policy and political developments related to immigration. She is regularly quoted

19 center for American progress | stop the conference
by all of the major national and regional news organizations including The New York Times, The Washington Post, and Politico, and also has appeared on national television and radio networks including PBS, MSNBC, Fox, and NPR.
Before joining the Center in 2009, Angela served as director of the Immigration Policy Center—the research arm of the American Immigration Law Foundation—which provides policymakers, academics, the media, and the gen-eral public with access to accurate information about the effects of immigration on the U.S. economy and society.
Prior to that, Angela was deputy director at the National Immigration Forum where she headed its legislative, policy, and communications activities and oversaw its operations. During her service at the forum, Angela was a front-line negotiator as Congress debated in 2006 and 2007 proposed comprehensive immi-gration reform legislation.
Other major legislative work by Angela included the Legal Immigration Family Equity Act of 2000, which, among other things, extended the period during which undocumented workers and family members could be sponsored for perma-nent residence. The LIFE Act also expanded eligibility for permanent residence to some individuals who had been denied benefits under the Haitian Refugee Immigration Fairness Act and the Nicaraguan Adjustment and Central American Relief Act. Angela was previously part of the successful NACARA and HRIFA campaigns to secure immigration benefits for certain Nicaraguans, Cubans, Salvadorans, Guatemalans, and Haitians.
Angela began her career as a staff attorney for Ayuda, a local services agency in Washington, D.C., representing low-income immigrants on immigration and fam-ily matters.
She is a graduate of George Washington University Law Center and was a fellow with Georgetown University’s Women’s Law and Public Policy Program.
The daughter of Bolivian and Colombian immigrant parents, Angela is the mother of two young girls.
20 center for American progress | stop the conference
Acknowledgments
The Center for American Progress is grateful to the Ford Foundation for its generous and continuing support which made this important research and report possible.
The report authors also extend their sincere appreciation to James Rounds and Daniel Court of the economic consulting firm Elliott D. Pollack & Company who provided superb ground-level research and economic analysis which provided the foundation for this report. We also thank the following Center for American Progress colleagues who were instrumental in driving this report to completion: Michael Ettlinger, Michael Linden, and Adam Hersh for guiding us through the economic analysis; Ann Garcia and Maria Flores for their research contributions, and Ed Paisley and Annie Schutte for their framing suggestions and edits.

21 center for American progress | stop the conference
Endnotes
1 Support Our Law Enforcement and Safe Neighborhoods Act, s.B. 1070, Arizona senate 49th Legislature, available at http://www.azleg.gov/legtext/49leg/2r/bills/sb1070s.pdf.
2 “Who is boycotting Arizona?”, azcentral.com, August 27, 2010, avail-able at http://www.azcentral.com/business/articles/2010/05/13/20100513immigration-boycotts-list.html.
3 Glenn hamer and others, “Biz leaders: Let’s talk about the real solution,” Arizona Capitol Times, July 9, 2010, available at http://azcapitoltimes.com/news/2010/07/09/biz-leaders-let%E2%80%99s-talk-about-the-real-solution/.
4 Associated press, “Arizona immigration Law killing tourism, costing state Millions,” the huffington post, August 3, 2010, available at http://www.huffingtonpost.com/2010/08/03/arizona-immigration-law-k_n_669242.html.
5 Elliott D. pollack & company.
6 Associated press, “L.A. approves boycott of Arizona,” MsNBc.com, May 12, 2010, available at http://www.msnbc.msn.com/id/37113818/; sarah coppola, “Austin cuts off business and travel ties with Arizona,” Houston Chronicle, May 14, 2010, available at http://www.chron.com/disp/story.mpl/metropolitan/7004482.html; Andy Birkey, “coleman announces st. paul boycott of Arizona,” The Minnesota Independent, April 28, 2010, available at http://minneso-taindependent.com/58209/coleman-announces-st-paul-boycott-of-arizona.
7 secretaría de Relaciones Exteriores, “travel alert,” April 27, 2010, available at http://www.sre.gob.mx/csocial/contenido/comunica-dos/2010/abr/cp_121eng.html.
8 “the sound strike,” available at http://www.thesoundstrike.net/.
9 Daniel González, “Arizona’s illegal immigrants departure affecting businesses,” The Arizona Republic, June 29, 2010, available at http://www.azcentral.com/arizonarepublic/news/articles/2010/06/29/20100629arizona-immigration-law-affecting-businesses.html.
10 Ginger Rough, “Ariz. immigration law’s legal costs could top $1 million,” USA Today, september 3, 2010, available at http://www.usatoday.com/news/nation/2010-09-03-arizona-lawsuits_N.htm.
11 “Who is boycotting Arizona?”, azcentral.com
12 smith travel Research Monthly hotel Review, available at http://www.strglobal.com/.
13 customized modeling done by Elliott D. pollack & company.
14 Nicholas Riccardi, “Arizona voters approve sales-tax increase,” Los Angeles Times, May 19, 2010, available at http://articles.latimes.com/2010/may/19/nation/la-na-arizona-tax-20100519.
15 Arizona Department of Revenue, “2009 Annual Report” (2009), avail-able at http://www.azdor.gov/portals/0/AnnualReports/FY09%20Annual%20Report_web.pdf.
16 Arizona Department of Economic security, “Employer handbook on Unemployment insurance tax,” available at https://www.azdes.gov/main.aspx?menu=316&id=4185.
17 Arizona Department of transportation, “highway User Revenue Fund - Fiscal Year 2010 Year-End Report” (2010), available at http://www.azdot.gov/inside_ADot/fms/pDF/hurf10.pdf.
18 Arizona Department of transportation, “Financial Management ser-vices: highway User Revenue Fund,” available at http://www.azdot.gov/inside_ADot/fms/hurfund.asp.
19 Arizona Department of transportation, “Motor Vehicle Division: title and Registration,” available at http://www.azdot.gov/mvd/faqs/scripts/FAQsResponse.asp?category=0&keyword=registration%20fee.
20 Ap, “Arizona immigration Law killing tourism, costing state Millions.”
21 interviews of AZhLA representatives conducted by Elliott D. pollack & company.
22 ibid.
23 interviews conducted by Elliott D. pollack & company.
24 interview conducted by Elliott D. pollack & company.
25 Support Our Law Enforcement and Safe Neighborhoods Act, s.B. 1070, p. 1.
26 United States of America v. State of Arizona, No. cV 10-1413-phX-sRB, July 28, 2010, available at http://www.scribd.com/doc/34998325/U-s-v-Arizona-order-on-Motion-for-preliminary-injunction.
The Center for American Progress is a nonpartisan research and educational institute
dedicated to promoting a strong, just and free America that ensures opportunity
for all. We believe that Americans are bound together by a common commitment to
these values and we aspire to ensure that our national policies reflect these values.
We work to find progressive and pragmatic solutions to significant domestic and
international problems and develop policy proposals that foster a government that
is “of the people, by the people, and for the people.”
1333 H Street, NW, 10tH Floor, WaSHiNgtoN, DC 20005 • tel: 202-682-1611 • Fax: 202-682-1867 • WWW.ameriCaNprogreSS.org