Embed Size (px)
Citation preview

STOCK PERFORMANCE ANALYSIS OF LISTED ENTITIES AT THE
BUCHAREST STOCK EXCHANGE. CASE STUDY ON THE ENERGY AND
RELATED UTILITIES SECTOR COMPANIES.
Student Ioana Anghel, Ph. D Student, University of Craiova, Faculty of Economics and Business Administration Craiova, Romania Prof. Mariana Man, Ph. D, University of Petroșani, Faculty of Sciences Petroșani, Romania
Abstract: Financial performance, as a multi-criteria economic category, constitutes a current topic broadly investigated by authors and experts in finance, financial management, accounting, evaluation and general management. In this ever more competitive capital market, because investors are increasingly better informed, it becomes essential for a company to know and periodically evaluate its stock performance in order to compare it at economic branch level. This present research study analyses six companies that activate in the energy and related utilities sector, listed at the Bucharest Stock Exchange, between 2004 and 2015, with the aim of identifying branch similarities regarding the evolution of the key stock growth ratios and indicators used in stock performance analysis. Furthermore, the authors deemed appropriate to correlate their results with the evolution of the main rates of return of the same companies.
JEL classification: M41, G10, G32
Key words: stock performance; stock indicators; stock growth ratios; rates of return;
capital market
1. INTRODUCTION
The attitude and behavior of capital market investors are a direct manifestation
of their perception regarding economic events and context which they analyze with
great concern and diligence. Furthermore, this perception is what determines their state
of mind as the immediate result of confidence in the capital market and the studied data,
including financial and accounting information.
Generally speaking, investors seek to find the best investment opportunities
available that are congruent with their risk aversion or inclination profile. Depending on
the adversity towards risk, the experience and training of investors, the macroeconomic
environment and development prospects expected, especially their subjective
perception of the risk and return relationship, investors will choose a certain investment
in securities (shares, bonds) but also to a specific structure of their investment portfolio.
Moreover, accounting information is the main source for fundamental analysis
on the companies’ result, aiming to obtain the relevant information needed to establish
the intrinsic value of the company, in order to capitalize on favorable differences

compared to market value and to minimize as much as possible the risk of unfavorable
gaps. Depending on the intrinsic value determined by comparison with the market
price, the investor must decide in a rational and documented manner.
Since its debut in 1995, the Bucharest Stock Exchange (BSE) has considerably
evolved by the means of ensuring regulatory framework, activity surveillance, defining
and continually adapting its infrastructure and institutions, introducing new financial
instruments and implementing appropriate technical operating systems. Admittedly, the
main Romanian institution of capital market is an emerging one, operating for only 21
years, but it is safe to iterate that it is comparable with its counterparts form Central and
Eastern Europe, namely Bulgaria, Hungary, Slovenia, Slovakia, Poland and Czech
Republic.
In accordance with the legal framework of the capital market, securities issuers
are required to provide all the information that may affect the valuation of financial
instruments, particularly financial information, in order protect investors' interests and
maintain an orderly market trading.
The present paper aims to contribute to the empirical financial literature by
comprising particular rates and concepts used on the capital market to measure and
describe stock performance, in order to identify similarities and differences regarding
the evolution of stock performance of energy and related utilities sector companies
listed on the Bucharest Stock Exchange, between 2004 and 2015.
2. LITERATURE REVIEW
Due to the dynamic nature of the present economic context, highly shaped by
the globalization phenomena, the contents and requirements of financial statements
have been the object of continuous improvements in order to connect them to the
everchanging informational needs of their users. Financial statements provide useful
information regarding different complementary aspects of a companies’ activity, but
their construction still requires improvements. A recent study has proven the fact that
the vast majority of investors and other external information users would rather trust in
financial and accounting information and public company statements, than in surveys,
news or other market based information (Miloș and Miloș 2014).
Undoubtedly, there is a consensus regarding the importance of conveying
relevant financial and accounting information in the process of substantiation correct
investment decisions. Consequently, value relevance can be seen as a measure of
accounting usefulness by stock investors (Beisland, 2009). Moreover, Lambert et al.
(2007) have demonstrated that by shaping the market participants’ perceptions
regarding the foreseen distribution of future cash flows, the quality of accounting
information can impact the cost of capital.
Financial reporting analysis decodes the accounting information and outlines a
coherent image of companies’ profitability, risk and efficiency, image that highly
impacts the investment decisions (Elliott and Elliott, 2011). Additionally, Chen et al.
(2007) proved that stock returns are strongly related to judgements based on financial
performance and its evolution and forecast. The information content captured by their
model is mainly attributed to the earnings yield, profitability changes and growth
opportunities, only a minor influence being brought by discount rates evolutions.
Furthermore, Pirie and Smith (2005) have proven their hypothesis that accounting-
based measures of value creation, that target simultaneously book value and earnings,

are more effective in analyzing the formed connections between financial
communication through accounting statements and stock price.
3. RESEARCH METHODOLOGY
Regarding the research methodology, the first step was to select companies that
met a number of preset selection criteria. In this regard, we decided to analyze the
activity of listed entities that meet predefined criteria for selection, as follows: blue-chip
companies, listed on the Premium category of the BSE, listed for at least 10 years, with
a large volume of transactions on the regulated capital market, part of the BET-NG
Index (Bucharest Exchange Related Energy & Utilities Index), generous in terms of
publication and access to financial and accounting information, very attractive and
credible to investors generous in terms of analytical approaches possible.
BET-NG sectoral index, launched on 01.07.2008, with a starting value of 1,000
points, was calculated retroactively from 02.01.2007. This stock index, reflecting the
evolution of the companies listed on the regulated market of the Bucharest Stock
Exchange, that activate in the energy and related utilities economic sector. As well,
BET-NG is a price index weighted by free-float capitalization. The maximum weight of
a company in the composition of this index shall not exceed 30%. Often times,
companies that form BET-NG are among the most traded on the BSE. BET-NG index
composition on the 22nd
of April 2016, comprised 11 companies as table 1 shows.
Table no. 1 Composition of BET-NG Index
Symbol Company Industry Trading start
SNP OMV PETROM S.A. Energy 03.09.2001
SNG S.N.G.N. ROMGAZ S.A. Energy 12.11.2013
EL SOCIETATEA ENERGETICA ELECTRICA S.A. Utilities 04.07.2014
TGN S.N.T.G.N. TRANSGAZ S.A. Energy 24.01.2008
TEL C.N.T.E.E. TRANSELECTRICA Utilities 29.08.2006
COTE CONPET S.A. Ploiești Energy 04.08.2004
SNN S.N. NUCLEARELECTRICA S.A. Utilities 04.11.2013
RRC ROMPETROL RAFINARE S.A. Energy 07.04.2004
OIL OIL TERMINAL S.A. Energy 09.02.1998
PTR ROMPETROL WELL SERVICES S.A. Energy 18.06.1998
PEI PETROLEXPORTIMPORT S.A. Energy 04.01.1999 Source: bvb.ro, authors’ projection
Since we wanted the results of the study to be highly relevant, by maximizing
the analysis period to 12 years, we found that the time frame 2004 – 2015 provided us
with the greatest number of companies eligible for our planned scientific approaches.
Of the 11 companies, we have eliminated five as they were listed only after 2004:
C.N.T.E.E. Transelectrica listed in 2006 S.N.T.G.N. TRANSGAZ S.A. marketable
2008 S.N.G.N. ROMGAZ S.A. and S.N. NUCLEARELECTRICA S.A. only in 2013
and SOCIETATEA ENERGETICA ELECTRICA S.A. listed in 2014. Thus, the sample
is as follows: OMV Petrom S.A., CONPET S.A., ROMPETROL RAFINARE S.A.,
OIL TERMINAL S.A., ROMPETROL WELL SERVICES S.A.,
PETROLEXPORTIMPORT S.A. We also considered the possibility of extending the
research to other important entities in the energy sector, but the only companies large
enough to be considered were excluded because they were suspended from trading

following their entry into insolvency proceedings in 2015: Dafora S.A. and Condmag
S.A.
In compliance with widely accepted views, we started from the premise that
traded companies possess an above-average financial performance and therefore the
analysis made at their level could outline a successful example to be applied by other
similar entities.
When collecting the necessary data, we consulted a number of officially
published documents and the selected rates and indicators are determined by the authors
based on official information during 2004 until 2015. Where necessary, additional
information was obtained via the audit reports, board reports and other official
publications for investors.
This research has some inherent limitations specific to any scientific approach
of this kind. Firstly, a limitation is the number of companies considered in the sample,
plus the limited time frame investigated. At the same time, the lack of access to
managerial accounting hinders the prospects of formulating additional explanatory
conclusions.
4. RESEARCH STRUCTURE. RESULTS AND DISCUSSION.
4.1 STUDY REGARDING THE FINANCIAL PERFORMANCE BASED ON KEY CAPITAL MARKET
INDICATORS
Stock performance indicators combine elements established on the capital
market with accounting information, generating relevant performance measures of
companies. They are considered as well the most comprehensive measure of the entity's
performance as it reflects the corroborated influence of financial rates of return and
risk.
Source: authors’ projection
Figure no. 1 Market capitalization evolution during 2004-2015
First, the market capitalization of the six analyzed companies is inconsistent
and has progressed interestingly during the 12 years. During 2004 until 2006 the
indicator was characterized by considerable growth, in 2005 reaching the maximum
recorded, but 2007 and 2008 have brought a considerable decrease and a minimum
level. Afterwards, between 2009-2012 the growth trend is resumed, but consistently
0.00
5,000,000,000.00
10,000,000,000.00
15,000,000,000.00
20,000,000,000.00
25,000,000,000.00
30,000,000,000.00
35,000,000,000.00
200420052006200720082009201020112012201320142015

fails to return to the level preceding the financial crisis. This is a sign that investors
have not fully restored their confidence in the energy and utilities sector, nor in the
capital market as a whole. As a result, from 2013 the market capitalization starts to
decline again.
The evolutions of the main capital market indicators (PER ratio of market
capitalization, price to book value P / BV and DIVY dividend yield), in the horizon
under review (2004-2015) are shown graphically in the following graph (figure no. 2).
Determined as the ratio between stock price and equity, the price to book value
indicator (P / BV) recorded only positive values during the period under review. This
happens mainly because the stock may have only positive prices, but mostly because
the net assets also have only positive values, which means that even when entities have
encountered loss, it was not as large as to surpass the equity.
Source: authors’ projection
Figure no. 2 PER, P/BV, DIVY evolution during 2004-2015
In the years that followed the financial crisis, there is a resumption of the
growth trend even though the levels before 2008 are not reached again. For example, in
2009 compared to 2007, the average P / BV decreased by 39.32 %, level in rising up
until 2014, during which the sector has recovered only 23.66 % growth, 2015 brings
again a decrease by 38.18% compared to 2014, and by 47.86% in comparison with the
peak value reached in 2007. As can be noted from the next graph, by studying the
weights of each company in regards to the formation of the average P / BV, we can
firmly state that there is an inconsistency generated by changes in share price. This
situation is an indicator that other judgements have led to the price formation, most
probably stock and company performance.
2004 2005 2006 2007 2008 2009 2010 2011 2012 2013 2014 2015
PER 19.61 12.05 19.76 13.11 13.52 39.29 14.81 42.22 34.50 6.94 20.35 3.05
P/BV 2.04 4.09 5.37 5.62 1.99 3.41 3.34 3.54 4.17 4.35 4.74 2.93
DIVY 57.05 0.05 0.01 0.02 0.05 0.02 0.04 0.05 0.04 0.03 0.03 0.03
0.00
10.00
20.00
30.00
40.00
50.00
60.00
PER P/BV DIVY

Source: authors’ projection
Figure no. 3 Average P/BV composition during 2004-2015
Moreover, this ratios fluctuation, as well as its composition, outlines the
mobility of the capital invested by investors according to their subjective assessment of
current investment return. Furthermore, there is a considerable variation among
individual levels of this ratio which confirms the fact that even though companies are
part of the same sector, investors analyze individual performance and less the energy-
utilities sector as a whole.
However, in terms of P / BV, Conpet S.A. is the one on a growing trend in its
confidence and in its profitability and perspectives. Meanwhile, surprising is the
evolution of OMV Petrom S.A. who does not show a well-rounded evolution, but a
fluctuating one on par with its financial results.
Source: authors’ projection
Figure no. 4 Average and individual PER during2004-2015
0% 20% 40% 60% 80% 100%
2004
2006
2008
2010
2012
2014
SNP PTR RRC OIL PEI COTE
2004 2005 2006 2007 2008 2009 2010 2011 2012 2013 2014 2015
SNP -12.3 20.92 12.25 9.21 2.34 8.33 9.71 5.44 6.49 5.07 11.56 -21.7
PTR 6.01 1.08 4.56 5.19 2.18 6.53 4.72 4.50 4.52 5.04 13.35 -3.23
RRC 78.89 11.78 -46.3 -5.37 -1.18 -3.32 -1.76 -2.44 -7.39 -8.66 -0.80 24.07
OIL 34.78 28.84 104.4 56.72 76.09 216.8 71.34 202.8 183.2 0.00 91.46 9.51
PEI 0.00 4.62 33.38 -2.81 -1.37 -1.18 -2.63 31.26 7.83 27.75 -3.65 -0.02
COTE 10.36 5.06 10.26 15.72 3.04 8.52 7.50 11.67 12.35 12.45 10.19 9.75
Ma 19.61 12.05 19.76 13.11 13.52 39.29 14.81 42.22 34.50 6.94 20.35 3.05
-100.00-50.000.0050.00100.00150.00200.00250.00
SNP PTR RRC OIL PEI COTE Ma

The average PER fluctuates greatly, mainly because the share price is obtained
by dividing the share price to earnings per share, the financial results of the sample
companies not reaching a solid trend. The always fluctuating share price reiterating this
statement. Overall, the average PER has a sinuous evolution between 2004 and 2009,
the peak was reached in 2011 (42.22), but this was followed by consecutive reductions
in 2012 (34.5) and 2013 (6.94), a slight recovery in 2014 (to 20.35), just as the
minimum period of analysis to be recorded 2015 (3.05). Generally speaking, a PER
increase is due to the favorable financial performance that is observed by investors that
ultimately generate an increasing share price.
Negative values for PER were recorded due to the net loss of OMV Petrom
S.A. in 2004 and 2015, Rompetrol Well Services S.A. in 2015, Rompetrol Rafinare
S.A. between 2006-2014, Petrolexportimport S.A. between 2007-2010 and later during
2014 until 2015. Meanwhile, the most notable fluctuations are shown by OIL
TERMINAL S.A. which recorded a maximum of 216.87 in 2009 and a minimum of
0.00 in 2013, but its PER evolution has varied very much between the two values.
Next, the average dividend yield with the exception of 2004, it was kept within
the limits of 0.01-0.05 range (1% - 5%). As shown in the graph below (figure no. 5), the
dividend policy of the entities in the energy-utilities is often inconsistent, as a direct
result of the prioritization of company growth and development needs over dividend
distribution as a form to repay its investors.
Source: authors’ projection
Figure no. 5 Average and individual DIVY during 2004-2015 The management of Rompetrol Rafinare S.A. choose not to pay dividends, not
even in years when profit is attained (2004-2005, 2015), the main reason being the
process of recovering previous years’ loss. On the opposite spectrum, Conpet S.A.,
except for 2004, has distributed dividends annually in tune with the net profit and
forecasted development needs of the company. In contrast, OMV Petrom S.A., Oil
Terminal S.A. and Rompetrol Well Services S.A. do not have clear dividend policy and
focus on future development plans.
2004 2005 2006 2007 2008 2009 2010 2011 2012 2013 2014 2015
SNP 0.00 0.02 0.04 0.07 0.00 0.00 0.06 0.09 0.06 0.07 0.03 0.00
PTR 0.00 0.00 0.00 0.00 0.13 0.05 0.06 0.12 0.08 0.06 0.05 0.00
RRC 0.00 0.00 0.00 0.00 0.00 0.00 0.00 0.00 0.00 0.00 0.00 0.00
OIL 0.01 0.02 0.01 0.01 0.01 0.00 0.01 0.02 0.01 0.00 0.01 0.05
PEI 342.2 0.18 0.00 0.00 0.00 0.00 0.00 0.00 0.00 0.00 0.00 0.00
COTE 0.00 0.06 0.00 0.03 0.17 0.06 0.12 0.07 0.07 0.08 0.10 0.10
DIVY 57.05 0.05 0.01 0.02 0.05 0.02 0.04 0.05 0.04 0.03 0.03 0.03
0.0050.00100.00150.00200.00250.00300.00350.00400.00
SNP PTR RRC OIL PEI COTE DIVY

Source: authors’ projection
Figure no. 6 Medium and individual EPS during 2004-2015
In theory, investors compare the dividend yield with the monetary market
interest rate or the state bonds interest rate. When the dividend is the sole criterion in
the assessment of investment decisions, an inconsistent dividend policy may be
considered a disadvantage.
Source: authors’ projection
Figure no. 7 Average and individual share price during 2004-2015
-300.00 -250.00 -200.00 -150.00 -100.00 -50.00 0.00 50.00 100.00
-100.000.00
100.00
2004 2005 2006 2007 2008 2009 2010 2011 2012 2013 2014 20152004 2005 2006 2007 2008 2009 2010 2011 2012 2013 2014 2015
SNP -0.03 0.03 0.04 0.03 0.02 0.02 0.03 0.07 0.07 0.09 0.03 -0.01
PTR 0.01 0.07 0.11 0.12 0.09 0.05 0.05 0.06 0.08 0.10 0.03 -0.11
RRC 0.00 0.01 0.00 -0.01 -0.02 -0.02 -0.03 -0.02 -0.01 -0.01 -0.05 0.00
OIL 0.01 0.01 0.00 0.01 0.00 0.00 0.00 0.00 0.00 0.00 0.00 0.01
PEI 8.38 38.49 3.70 -21.00 -10.22 -19.35 -7.38 0.58 2.81 0.86 -3.34 -281.6
COTE 1.13 1.68 3.33 2.59 7.74 3.97 4.47 3.30 3.56 3.62 5.94 7.30
EPS 1.58 6.71 1.20 -3.04 -0.40 -2.56 -0.48 0.66 1.09 0.78 0.44 -45.74
SNP PTR RRC OIL PEI COTE EPS
2004
2005
2006
2007
2008
2009
2010
2011
2012
2013
2014
2015
SNP 0.40 0.53 0.49 0.29 0.04 0.20 0.31 0.35 4.41 0.43 0.38 0.24
PTR 0.05 0.08 0.49 0.64 0.19 0.32 0.25 0.25 0.36 0.50 0.43 0.34
RRC 0.12 0.10 0.10 0.08 0.03 0.07 0.06 0.04 0.05 0.04 0.04 0.05
OIL 0.31 0.30 0.28 0.73 0.13 0.28 0.25 0.19 0.17 0.11 0.09 0.10
PEI 0.02 178. 123. 58.9 14.0 22.9 19.3 18.0 22.0 23.8 12.2 6.00
COTE 11.7 8.50 34.2 40.8 23.5 33.8 33.5 38.5 44.0 45.0 60.5 71.2
Ma 2.10 31.2 26.5 16.9 6.32 9.60 8.96 9.56 11.8 11.6 12.2 12.9
0.0020.0040.0060.0080.00100.00120.00140.00160.00180.00200.00
SNP
PTR
RRC
OIL
PEI
COTE
Ma

As depicted by figure number 6, the average earnings per share has also varied
considerably, as the stable growth trend was noted between 2009 and 2014. The
minimum was reached in 2015 (-45.74) this value representing a major departure from
the average of the previous 11 years (0.54). The maximum of 6.71 lei / share was
recorded in the second year of analysis, 2005, result largely due to net earnings per
share of 38.49 achieved Petrolexportimport S.A. (PEI), a company whose fluctuating
EPS has impacted the change in the group average. Also, because of the net loss of PEI
(281.63 lei / share) the average minimum is reached in 2015 (of -45.74 lei/share).
To summarize, the evolution of the stock exchange rate is a complex
phenomenon, that is a direct result of the attitude and behavior of investors generated
by their perception of analyzed events and economic context.
4.2. STUDY REGARDING THE FINANCIAL PERFORMANCE BASED ON THE RATES OF RETURN
Economic efficiency is a broader category than profitability, which
characterizes the general category results arising from different versions intended for
use saving resources or entering into or excluded from the economic circuit.
In addition, the absolute level of profitability is reflected in the profit and the
degree to which capital or resource use generate profit is reflected in the rates of return.
Furthermore, companies’ financial performance can be determined and compared by
the use of complementary rates of return. Advantages of using rates of the up-
effectiveness analysis are as follows: high level synthesis phenomenon analyzed
eliminates the inconvenience of the standard to ensure comparability while expressing.
In contrast, the main disadvantage of use is not possible to appreciate the absolute size
of the analyzed indicator.
To explain specific indicators of capital market developments, we must analyze
developments and individual rates of return mean for entities selected for research. The
following figure shows the evolution of profitability entities analyzed from several
perspectives: resources consumed, commercial, economic and financial.
Source: authors’ projection
Figure no. 8 Average ROE, ROA, ROS and Rrc during 2004-2015
2004 2005 2006 2007 2008 2009 2010 2011 2012 2013 2014 2015
Rrc 0.01 0.12 0.10 0.09 0.11 0.06 0.10 0.11 0.12 0.14 0.19 -0.18
ROS -0.01 0.09 0.08 0.04 0.07 0.05 0.06 0.07 0.08 0.10 -0.20 -24.9
ROA 0.01 0.09 0.06 0.02 0.04 0.01 0.01 0.03 0.04 0.05 -0.03 -0.27
ROE 0.03 0.17 0.09 -0.01 -0.01 -0.10 -0.18 0.61 0.05 0.06 -0.29 0.17
-100%-80%-60%-40%-20%0%20%40%60%80%100%
ROE ROA ROS Rrc

From figure number 8, we note that broadly the four types of rate of return
followed the same track evolution: growth in 2005, followed by decline in 2006 and
2007, a slight recovery in 2008 followed again by decreases between 2009 and 2010,
then reaching the peak in 2011, and resuming a contraction trend between 2012-2015.
The minimum is achieved in 2015 for the return on resources consumed and for the
return on sales, while the minimum for the return on assets was reached in 2010 and for
the return on equity in 2014.
Return on equity (ROE) has significant relevance to the company's shareholders
and is the ratio between net profit and equity. It should be higher than the average
market interest rate. Furthermore, ROE reveals the company’s capacity to repay its
shareholders through dividend distribution or by increasing its owners’ wealth. The
average ROE was inconsistent from 2004 through 2015, mainly due to fluctuating
results that the sample companies have attained.
Most notable impacts on the average were: Rompetrol Rafinare S.A. between
2006-2010 and 2012-2014, Petrolimportexport S.A. between 2007-2010 and 2014.
Rompetrol Rafinare S.A. scored the minimum recorded -1.82 (-182%) in 2014, and the
maximum of 3.28 (328%) in 2011, which reiterates the wide variation that ROE has at
individual level and at sectoral level. A similar case is observed for Petrolimportexport
S.A., ROE varying between a minimum of -46.73% (2009) and a maximum of 113.15%
(2015).
Only two companies had relatively constant financial returns, with amplitudes
below 10 percentage points: CONPET S.A. (between 3.57% - 13.88%), Oil Terminal
S.A. (between 0% - 4.7%). OMV Petrom S.A. it has an average return on equity of
9.34% between 2004-2015, a minimum of -19.14% in 2004 and reached a historic peak
of 18.54% in 2006.
Table no. 2 Average and individual ROE variation amplitude
Company SNP PTR RRC OIL PEI COTE Group
Minimum -19,14% -23,49% -182,68% 0,00% -46,73% 3,57% -28,86%
Maximum 18,54% 23,57% 328,25% 4,70% 113,15% 13,88% 60,92%
Average 9,34% 11,14% -4,62% 1,54% 5,87% 6,77% - Source: authors’ projection
The rate of return on assets (ROA) describes the efficiency of asset
management and is used primarily by the management. The average level of the
sample, has a similar pattern to the financial return, recording minimum in 2015 (-
26.68%) and maximum ten years before in 2005 (8.68%). However, as can be seen in
table 3, on an individual and global variations are considerably lower compared to
ROE.
Table no. 3 Average and individual ROA variation amplitude
Company SNP PTR RRC OIL PEI COTE Group
Minimum -11,47% -21,74% -34,33% 0,00% -146,82% 2,09% -26,68%
Maximum 12,44% 21,65% 4,78% 3,97% 20,54% 10,68% 8,68%
Average 5,60% 9,71% -7,07% 1,30% -12,57% 5,42% - Source: authors’ projection
The return on sales (ROS) describes the commercial efficiency of the company
and generates information regarding pricing policy, depicting the effects of market
constrains on a company’s commercial activity. Its main methods of maximizing
include: improved sales structure, accelerating the rotation of stock items, along with
cost optimization. A dynamic analysis shows that the profit growth trend surpasses the
turnover growth rate, meanwhile a low return on sales should lead to a rethinking of
cost management policies.
Once again, the average ROS has a similar trend to ROE and ROA, reaching a
minimum in 2015 (-24.95), even though the return peaked in 2013 (0.10). As can be
seen from table 4, individual and global variations are considerable. 2015 is the year of
minimum values for 50% of the analyzed group. The most striking case is the fall
PETROLIMPORTEXPORT S.A. from 2014 to -1.39 -149.28 as a result of recording an
impressive loss (-149.28, -14.928%) overlapped with a considerable reduction in
turnover.
Table no. 4 Average and individual ROS variation amplitude
Company SNP PTR RRC OIL PEI COTE Group
Minimum -0,21 -0,59 -0,16 0,00 -149,28 0,04 -24,95
Maximum 0,27 0,25 0,04 0,06 0,14 0,21 0,10
Average 0,11 0,10 -0,04 0,02 -12,57 0,11 - Source: authors’ projection
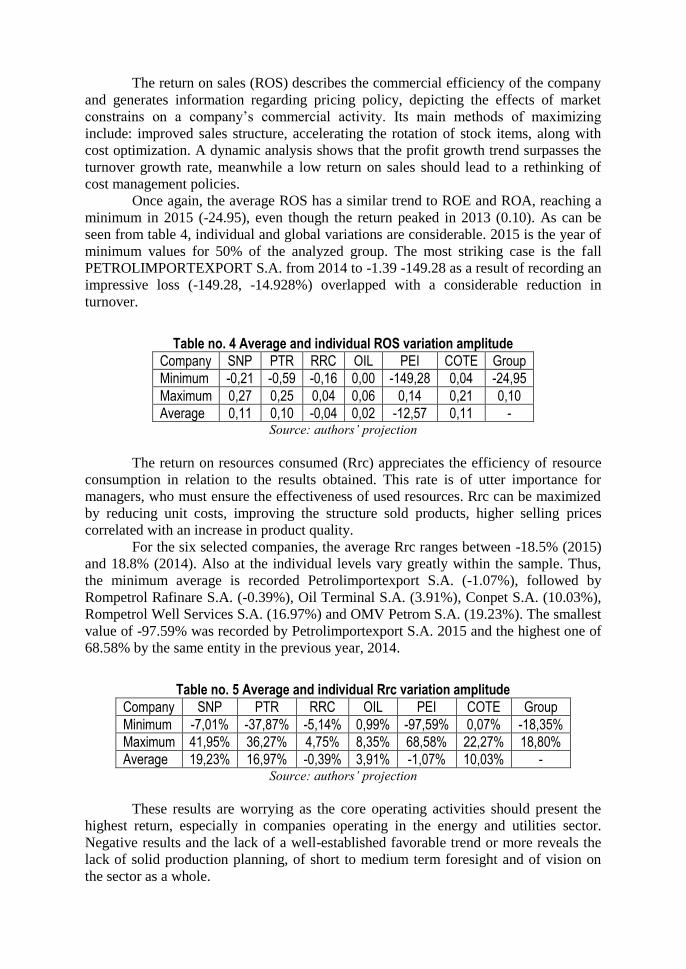
The return on resources consumed (Rrc) appreciates the efficiency of resource
consumption in relation to the results obtained. This rate is of utter importance for
managers, who must ensure the effectiveness of used resources. Rrc can be maximized
by reducing unit costs, improving the structure sold products, higher selling prices
correlated with an increase in product quality.
For the six selected companies, the average Rrc ranges between -18.5% (2015)
and 18.8% (2014). Also at the individual levels vary greatly within the sample. Thus,
the minimum average is recorded Petrolimportexport S.A. (-1.07%), followed by
Rompetrol Rafinare S.A. (-0.39%), Oil Terminal S.A. (3.91%), Conpet S.A. (10.03%),
Rompetrol Well Services S.A. (16.97%) and OMV Petrom S.A. (19.23%). The smallest
value of -97.59% was recorded by Petrolimportexport S.A. 2015 and the highest one of
68.58% by the same entity in the previous year, 2014.
Table no. 5 Average and individual Rrc variation amplitude
Company SNP PTR RRC OIL PEI COTE Group
Minimum -7,01% -37,87% -5,14% 0,99% -97,59% 0,07% -18,35%
Maximum 41,95% 36,27% 4,75% 8,35% 68,58% 22,27% 18,80%
Average 19,23% 16,97% -0,39% 3,91% -1,07% 10,03% - Source: authors’ projection
These results are worrying as the core operating activities should present the
highest return, especially in companies operating in the energy and utilities sector.
Negative results and the lack of a well-established favorable trend or more reveals the
lack of solid production planning, of short to medium term foresight and of vision on
the sector as a whole.
5. CONCLUDING REMARKS
All things considered, in times of uncertainty only the awareness of investors
regarding the methods of measuring value creating and performance leads to increased
competitiveness of companies. As a result of ever increasing complexity of economic
phenomena combined with particularities of the operational activities of individual
company, in the absence of a diligent and complete analysis, comprising all relevant
aspects of a company’s activity, basic economic indicators can mislead stock exchange
investors. Consequently, investors should aim at identifying performant companies that
maintain safe levels of sustainable growth, and do not exhibit fluctuations on a
medium-term analysis.
Admittedly, the importance of a thorough financial analysis is undeniable. This
analysis must include key stock exchange rates combined with the evolutionary trend of
the economic fundaments used to determine them. Furthermore, the conclusions drawn
from the stock market ratio analysis are complementary and grow in relevance when we
extend our focus towards annual accounts and modern day methods of measuring value
creation. Stock market ratios are the most comprising instruments to measure the
performance of listed companies because they comprise the influence of both risk ratios
and financial profitability.
From the present paper, we concluded that there is a direct link between
financial performance and stock exchange performance. Firstly, financial performance
is the result of company strategy and objectives. Secondly, stock market performance
analysis is a special kind of financial analysis that allows investors to make informed
decisions regarding trading securities. The information generated by this type of
analysis characterizes the policy of the portfolio and the real situation of the share and
evolutionary analysis of its profitability and future intentions securities related to them.
Through this paper, the energy and utilities sector has been proven to be a
heterogeneous group of companies, because despite the similarities regarding their
operating activity, their results are marked by considerable variations generally caused
by the general economic context, management policies and strategies. The only area
where these companies are consistent is in being inconsistent. Many of them fail to
perform well and consequently fail to attract new investors or to maintain the existing
ones.
Synthetically, we can assert that the efficiency of stock analysis and
interpretation should also involve traditional indicators regarding profitability, leverage,
liquidity and solvency as well as their correlation with the main indices.
REFERENCES 1. Achim M.V.
Borlea S.N.
Analiza financiară a entităţii economice, Risoprint Publishing house, Cluj-
Napoca, 2012
2. Anghel I.
Man M.
The impact of financial communication on stock price. The case of OMV
Petrom SA 2004-2013., Annales Universitatis Apule-nsis – Series
Oeconomica, Number 16, Volume 2, 2014
3. Anghel I.
Man M.
Does the self-financing capacity influence the performance of entities listed
on the stock exchange? OMV Petrom S.A. Romania case study., Revista
Economică, Number 67:3, 2015
4. Beisland
L.A.
A Review of the Value Relevance Literature, The Open Business Journal,
2, 2009
5. Bratu R. St.
Tudor M.S.
Tendințe și mutații în evoluția pieței de capital din România, Publishing
House Universitaria Craiova, 2010

6. Chen P. F.
Zhang, G.
How Do Accounting Variables Explain Stock Price Movements? Theory
and Evidence, Journal of Accounting and Economics, Vol. 43, Issues 2-3,
2007
7. Elliott B.
Elliott J.
Financial accounting and reporting, Fourteenth Edition, Pearson Education
Limited, Harlow, United Kingdom, 2011
8. Fabozzi F.J.
Peterson
D.P.
Finance, Capital Markets, Financial Management and Investment
Management, John Wiley & Sons, New York, 2009
9. Lambert R.
Leuz C.
Verrecchia
R.E.
Accounting information, disclosure, and the cost of capital, Journal of
Accounting Research, Vol. 45 No. 2, 2007
10. Miloș M.C.
Miloș L.R.
A survey regarding the quality of financial statements, Annales
Universitatis Apulensis Series Oeconomica, 16(2), 2014, 221-228, 2014
11. Petrescu S. Analiză şi diagnostic financiar contabil, Third Edition, CECCAR
Publishing House, Bucharest, Romania, 2009
12. Pirie S.
Smith M.
Relationships between stock prices and accounting information: a review of
the residual income and Ohlson models, School of Accounting, Finance and
Economics & FIMARC Working Paper series, Edith Cowan University,
Working Paper 0508, 2005
13. *** Manualul indicelui BET-NG, Bucharest Stock Exchange, Bucharest, 2014
14. *** www.bvb.ro, Bucharest Stock Exchange
15. *** www.petrom.com, OMV Petrom S.A.
16. *** www.conpet.ro, CONPET S.A.
17. *** www.oil-terminal.com, OIL TERMINAL S.A.
18. *** www.petex.ro, PETROLEXPORTIMPORT S.A.
19. *** www.petros.ro, ROMPETROL WELL SERVICES S.A.
20. *** www.rompetrol-rafinare.ro, ROMPETROL RAFINARE S.A.