Embed Size (px)
Citation preview
Stock Market Sensitivity to UK Firms’ Pension Discounting
Assumptions
Paper number 06/04
by
Paul J M Klumpes Nottingham University Business School
University of Nottingham
Kevin McMeeking* University of Exeter
ABSTRACT
New UK pension accounting regulations significantly increase the exposure of the
balance sheets of UK firms to volatilities in pension fund valuations. We examine
whether the abnormal returns of firms that voluntarily used market based pension
discount rates are significantly different from the abnormal returns of industry-
matched pair samples of firms that retained traditional cost-based valuation assumptions during the period surrounding the release of the related exposure draft.
We also examine the interest rate sensitivity of stock price returns over the four-year
period before and after the announcement date. Consistent with our hypotheses, UK
stock price returns incorporate the effect of unexpected interest changes on sources of
pension earnings for firms that voluntarily switched to market based assumptions, but do not incorporate these effects for firms that do not switch. These results suggest that
unexpected changes in interest rates have a differential effect on a firm’s sources of
pension, financial and core earnings.
_________________________ *Contact Author: Kevin McMeeking, Lecturer in Accounting, School of Business and Economics, University of Exeter, Rennes Drive, Exeter EX4 4PU, Exeter, Devon, England. Tel: +44 1392 263206
Email: [email protected]

2
ISSN 1473 2904
3
I. INTRODUCTION
UK pension accounting rules formerly required pension employers to recognize only
the accrued or prepaid pension cost and usually defer and amortize any actuarial gains
or losses. However, Financial Reporting Standard 17 (FRS17) requires full
recognition of the excess pension deficit or surplus on the employer sponsors balance
sheet and the immediate write-off of actuarial gains or losses. FRS17 is significantly
different from the former UK GAAP requirements that pension gains or losses be
smoothed over time. Assuming that markets are efficient, one important question
raised by the new policy concerns the implications of the newly reported pension
exposure on firms’ stock returns in the period surrounding the announcement of the
regulatory change. If firms’ stock prices react to apparently minor changes in actuarial
assumptions underlying firms’ pension obligations, more effective corporate risk
management policies would be needed to mitigate these exposures.
The objective of this research is to determine if the release of the exposure draft that
preceded FRS 17 affected the abnormal returns of the securities of UK firms that
voluntarily chose to adopt the new pension accounting rule in a significantly different
way than the abnormal returns of firms that did not adopt the new rule1. We test this
prediction using both an event study and variable effect methodology around the time
of the announcement and over the four-year period before and after the announcement
date. We condition any stock price reaction on the level of the firm’s pension
exposure and managerial discretion over the choice of valuation assumption. The
reaction to regulatory induced changes in pension discounting assumptions should be
of interest to corporate decision-makers, financial economists and accounting
researchers for two reasons. First, strong evidence that capital market participants fail
to account for the effect of unexpected changes in pension discount rate assumptions
on UK firms’ reported balance sheets would either challenge the efficient markets
hypothesis or conflict with the conventional ‘corporate finance’ view (and FRS17)
that the firm owns the pension surplus (e.g. Bulow, 1982).2 Second, these regulations
are potentially value-relevant if around the time of regulation the stock price returns
differ systematically across firms that use significantly different pension discounting
rates.

4
Our empirical results over the extended four-year window surrounding the
announcement date seek to additionally control for other factors which might be
expected to mitigate the interest rate sensitivity of stock prices to discount rate
assumptions. These tests support the hypothesis that the extent to which the capital
markets anticipate the effect of using different discount rates depends on the relative
magnitude of the discounting rate assumptions underlying firms’ pension exposures.
Our event-study empirical results show that allowing for control variables, the
abnormal returns of firms that use market-based (FRS17) discount rate assumptions
are sensitive to unexpected interest rate changes. These results support the hypothesis
that the UK stock market is able to evaluate the effect of unexpected interest rate
changes on the stock price returns of firms that adopt market-based discount rate
assumptions. We conclude that the capital market rewards UK firms that manage
interest rate risk by voluntarily using market-based discount rate assumptions.

5
II. INSTITUTIONAL BACKGROUND AND PRIOR RESEARCH
This section reviews the institutional background, the potential relevance of pension
discounting to capital market participants and summarises the differences between
UK and US pension accounting rules.
2.1. Institutional Background
Accounting standard setters have long debated the most appropriate basis for pension
discounting assumptions with the result that many new pension accounting rules have
been released over the last two decades. Table I summarizes the chronological
development of pension accounting standards that are of interest to this study. Table I
shows that US GAAP (Statement of Financial Accounting Standards 87 (SFAS87))
came into effect in 1985. SFAS87 requires firms to disclose various measures of
pension liabilities in a footnote to the annual financial statements. The minimum net
unfunded pension liability must also be recognized on the balance sheet using
standard AA-bond discount rate assumptions.
-------------------------------------
INSERT TABLE I ABOUT HERE
-------------------------------------
The UK regulatory requirements are substantially different from SFAS87. Prior to 1
January 2005, Statement of Standard Accounting Practice 24 (SSAP24) gave UK
actuaries considerable discretion over valuation frequency (every three years) and the
methodology used to value the pension costs. SSAP24 merely required firms to state
the main actuarial assumptions underlying their estimated pension liabilities. Firms
could use the flexibility in the standard to show either an asset or liability on the
balance sheet. Moreover, actuaries could spread the pension costs over many years by
smoothing the pension assets and discounting pension liabilities using a long-term
equity-related expected rate of return. In the 1990s, many UK firms took advantage of
this discretion and the rising stock markets by taking ‘contribution holidays’. The
recorded pension costs became meaningless and the subsequent stock market
downturn forced many pension funds into deficit.
6
Subsequently, the Accounting Standards Board (ASB) began to review the adequacy
of the existing pension accounting rules. In June 1995, a discussion paper was issued
endorsing the existing position. In July 1998, the ASB released another discussion
paper that showed a change of view on this issue. The ASB finally set out its current
market value proposals in Financial Reporting Exposure Draft 20 (FRED20) in July
1999. Despite extensive industry opposition to its proposals, the ASB issued FRS 17
on 24 November 2000.
The ASB initially hoped that the new pension accounting rule would take effect from
2003. However, the proposals were strongly criticised on the grounds that they may
force many UK firms to terminate their defined benefit plans (e.g. Financial Times,
30 December 2001). The ASB deferred the mandatory implementation of FRS 17 in
July 2002 because of the controversy and the impending announcement by the
International Accounting Standards Board (IASB). An important unresolved issue is
determining the appropriate basis for discounting pension assets and liabilities, since
there is a trade-off between the reliability and value relevance of the reported figures.3
Table II summarizes the different pension discounting assumptions that have caused
such consternation for the regulatory bodies.
----------------------------------------------
INSERT TABLE II ABOUT HERE
-----------------------------------------------
2.2. Review of Prior Research
The prior US-based empirical research has shed considerable light on the issue of
whether pension liabilities are fully reflected in stock prices. Chen and D’Arcy (1986)
examine whether the market is sensitive to different pension interest rate assumptions
around the issue date of US pension accounting proposals. This paper analyses the
market performance of the securities of firms with varying pension plan interest rate
assumptions around the release date of Financial Accounting Standards Board No. 36
(FASB36). They investigate the interest sensitivity of the stock returns of firms that
differed both in the level of pension exposure and in the magnitude of discount rate
assumptions. They find that the securities of firms that make a low interest rate
assumption outperformed the securities of other samples and provided significantly
positive risk adjusted returns. However, Chen and D’Arcy (1986) can be criticized for
7
failing to control for industry effects or for the management discretion that can be
used to ameliorate the magnitude and/or timing of their reported pension exposures.
This raises the possibility that the choice of interest rate assumption may be value
relevant to firms (Fogarty and Grant, 1995). Blankley and Swanson (1995) investigate
the behavior of the discount rate, expected rate of return on plan assets and expected
rate of future compensation using a sample of 303 US firms from 1987-1993. They
find that firms have changed their discount rates less frequently than one would
expect if they had fully complied with the SFAS 87 requirements. Other empirical
studies examine the motivations of the managers of over-funded defined benefit
pension funds for changing interest rate assumptions (e.g. Thomas, 1989; Ghicas,
1990). Godwin et al. (1997) provide evidence that the managers of US-firms change
actuarial-interest-rate assumptions to manage earnings.
This suggest that the considerable managerial scope in SSAP 24 might allow UK
managers to voluntarily adopt market-based valuation assumptions to engage in
earnings management. Klumpes and Whittington (2003) examine the factors that
explain variations in UK firms’ decision to switch to the market-based valuation
method required by FRS 17. They find a significant relation between the switching
decision and pension plan funding. These findings suggest that firms’ switching
decisions are potentially explained by the characteristics of the pension plans rather
than by the US earnings management motivation.
Nevertheless, most of the financial press criticisms of FRS 17 are based on concern
that the value of the sponsoring firm will be adversely affected by the use of market-
based pension discounting methods. These fears are not supported by the extensive
US literature (e.g. Oldfield, 1977; Gersovitz, 1980; Feldstein and Seligman, 1981;
Feldstein and Morck, 1983; Daley, 1984; Landsman, 1986; Barth, 1991; Barth et al.,
1992 and Sami and Shahid, 1997). All of these studies evaluate the information
content of likely determinants of a firm’s market value using cross-sectional models
that assume that pension liabilities are determined using a “spin-off” or termination
value basis. These studies typically conclude that unfunded pension obligations
influence stock prices if unfunded pension liabilities can be shown to affect market
value. However, Chen and D’Arcy (1986, 213) restrict the implications of this

8
literature on the grounds that funding policy depends significantly on the accuracy of
estimates of pension liabilities.
9
III. DEVELOPMENT OF HYPOTHESES
The results of the studies discussed above suggest that the most important
determinants of pension costs and liabilities are the underlying assumptions. The issue
of whether the stock market takes account of the difference between market based
(FRS17) and actuarial (SSAP24) valuation assumptions is interesting because the
underlying assumptions of SSAP 24 differ significantly from those of FRS17. The
research hypothesis examines the market sensitivity to pension valuation assumptions
by UK firms. The hypothesis is conditioned by whether a firm voluntarily chooses to
switch to market-based discount rate assumptions around the time of the rule-change.4
Firms adopting market-based valuation techniques are likely to be more conservative
in their forecast to try to minimize the aforementioned stock price volatility. Such
companies are more likely to use rates that reflect contemporary market conditions to
hedge their pension liability. Since prime corporate bond rates and equity market
conditions were unfavourable in the late 1990s, firms choosing to voluntarily adopt
FRS 17 will tend to report higher pension liabilities and net pension expense. The
proposed rules will increase the volatility of reported pension values and will be
impounded into prices if the market is efficient. Thus, if pension liabilities are
discounted at market rates, early adopters should have no excess returns since they
have already revealed the effects of the proposed new standard in their pension
exposure. Building on this conjecture, the first hypothesis predicts that investors either
will have already rewarded, or will reward on discovery, firms using market-based
actuarial valuation assumptions by incorporating these changes into the market
valuation of the firms’ funded pension liabilities during the pre-announcement period.
Hypothesis 1: Ceteris paribus, the stock prices of UK firms sponsoring
pension plans with market-based pension valuation assumptions will react
more favorably to the proposed new pension accounting rules in the immediate
pre-announcement period than the stock prices of industry match paired firms
that have low pension expense or that use non-market valuation assumptions.
Unexpected changes in interest rates should affect various components of firms’
exposure. If interest rates change rapidly and market conditions are volatile, the
sensitivity of reported pension assets and/or liabilities will be potentially value-

10
relevant to capital market participants. Ceteris paribus, firms that voluntarily adopt
market-based valuation methods (as required by FRS 17) allow capital market
participants to quickly incorporate unanticipated changes in interest rates into their
reported pension exposure. Accordingly, the stock price returns of switch firms are
expected to incorporate firm risk associated with the option to terminate pensions. We
predict that the stock prices of UK firms that voluntarily switch to market-based
pension discount rate assumptions will be more sensitive to unexpected interest rate
changes than those that retain actuarial assumptions. Our empirical tests examine this
prediction controlling for the association between stock returns and the effect of
unexpected changes in interest rates on earnings.
UK firms are required, during an extended transitional period, to report their pension
liabilities discounted using both the FRS 17-based AAA corporate bond rate and the
SSAP 24-based long-term expected rate of return on pension assets. This difference is
likely to be directly associated with the impact of unanticipated changes in interest
rates on returns. Since firms can exercise discretion to update these latter assumptions
more frequently to enhance the interest-sensitivity of their reported pension assets and
liabilities, their stock price returns should also be more sensitive to these differences.
The second hypothesis of this study posits that stock price returns of firms that
voluntarily adopted market-based discount rate assumptions will be negatively
associated with the effect of these changes on the interest-rate sensitive pension assets
and liabilities:
Hypothesis 2 Ceteris paribus, the association between the stock returns and
the effect of unexpected interest rate changes on pension assets and liabilities
will be significantly stronger for UK firms that voluntarily used market-based
discount rate assumptions than UK firms that used actuarial based
assumptions.

11
IV. METHODOLOGY AND SAMPLE SELECTION
4.1.1 Methodology – Hypothesis 1
In order to test hypothesis 1, the standard market model is used to calculate
the abnormal return (AR), for security j on event day t as follows:
)ˆˆ( mtjjjtjt RRAR βα +−= (1)
where
Rjt = the rate of return on security j on event day t, and
Rmt = the rate of return on the FTSE 100 value-weighted index on event day t.
We use the market model to calculate ordinary least squares estimates of the
intercept, jα and gradient, jβ over the 100 day estimation period t = -145 to t = -46
that is taken relative to the event day t = 0. We then compute daily abnormal returns
for each firm over the period t = -45 to t = +10. The cumulative abnormal return
(CAR) over the event period K to J is defined as:
∑=L
K
jtj ARCAR (2)
The mean cumulative abnormal return for a sample of N stocks is:
∑−
=N
j
jCARN
CAR1
1 (3)
The mean cumulative abnormal return is completed for several intervals around event
day t = 0 and is expected to be zero in the absence of abnormal performance. The
Dodd and Warner (1983) mean standardised cumulative abnormal return can be used
to test the significance of any prediction error. This test statistic is calculated by
standardising the daily prediction by its standard deviation (sj t):5
jt
jtjt s
ARSAR = (4)
and then cumulating the standardised abnormal return over the period K to J:
∑− +−
=L
Kt
jt
jt
KL
SARSCAR
1 (5)
For a sample of N securities, the appropriate test statistic is:
∑=
=N
1j
j (6)
N
SCAR z
SARjt and z will be normally distributed with a unit root if there is no abnormal
performance.

12
The next section introduces a ‘variable effect’ methodology to study the association
between both short-term and long-term stock returns and the interest rate sensitivity of
firms’ pension liabilities. We then introduce the experimental design and provide
descriptive statistics for the put option termination option and other control variables.
4.1.2 Empirical Modelling Specification – Hypothesis 2
The event study methodology outlined above is unable to discriminate whether the
observed market response to a proposed new pension accounting rule is associated
with other sources of firm income and expenses that are entirely within management
control, as opposed to those arising from external events. For instance, unexpected
changes in interest rates are likely to directly impact a company’s pension-related
earnings, its fixed rate bonds and have second order-effects on equity investments and
even the prices of a company’s goods. Standard event study methods cannot control
for these sensitivities.
This section outlines an alternative ‘variable effect’ methodology introduced by
Bulow et al. (1987), to study the posited association between both short-term and
long-term stock returns and the interest rate sensitivity of firms’ assets and liabilities
during the four years immediately preceding the issue of new pension accounting
rules. Consistent with Bulow et al. (1987, 97) we postulate that the return on firm i, in
month t (rit), as specified by equation (1), can be re-expressed as:
rit = αi + Βit ∆ Rt + uit, (7)
where αi is the normal required expected return on firm i and Βit reflects its sensitivity
to interest rate news, here proxied by the change in the long-term actuarial-based
interest rate Rt, and uit is a random error term. ∆Rt depends on the firm’s
characteristics at time t that are subject to unexpected changes in the interest rate
sensitivity of funded pension liabilities (FPL), funded pension assets (FPA), and long-
term debt (LTD).4 In addition such events will impact PA
A-M and PL
A-M, the amount
of the difference between long-term actuarial assessed and short-term market-based
valuation assumptions on the pension assets and liabilities, respectively.5 These terms
can be deflated by Vit, the equity value of firm i in period t6. It is also assumed that the
evolution of the stock return is influenced by RMit, the return on the market portfolio.

13
Including these terms yields the following cross-section time series equation, which
provides the basis for our empirical work:
rit = αi + γ0 ∆Rt + γ1 ∆RtFPL/Vit +γ2 ∆RtLTD/Vit + γ3 ∆RtPLA-M
/Vit
+γ4 ∆RtFPA/Vit+γ5∆RtPAA-M
/Vit + γ6PUT/V it + γ7CALL/Vi t + εit (8)
Equation (8) can be estimated, given cross-section time series data using ordinary
least squares, to yield unbiased estimates of the parameters. This model specification
differs from that suggested by Bulow et al. (1987) by including, in addition to the
variables posited to be influenced by unexpected interest rate changes, firms’ strategic
option to terminate pensions (PUT/Vit), employees call options over improved benefit
above the regulatory minimum (CALL/Vi t), as well as periodic earnings before
interest and pension expense (NI/Vit) that Easton (1999) suggests should be
incorporated into stock price returns models. Controlling for these explanatory
variables of security returns also allows for improved interpretation of the magnitude
and significance of the coefficients (Scholes, 1987).7
4.2. Sample Selection Procedures
We test our hypotheses by comparing the returns of firms that voluntarily switched to
new market-based valuation methods in their financial reports with those of industry-
matched, non-switch firms that reported their pension funding ratios using traditional
actuarial valuation methods. We use industry matching to control for industry-related
variables that affect pension liabilities because pension funds in the same industry use
similar mortality and turnover assumptions (Ghicas, 1990). Industry-matched pair
firms were created on the basis that a different valuation policy or a significantly
different level of pension expense existed between the two groups. In the first case,
firms switching to market-based actuarial valuation methods can be distinguished
from an industry-matched pair of either (1) firms which switched but had relatively
low pension expense; or (2) firms that continued to rely on traditional actuarial
valuation methods. Industry matching was also conducted on the basis that pension
exposure is a significant factor (above 5%) in a firm’s total market value at balance
sheet date. These criteria are important because the hypothesis assumes that switch
firms can be easily distinguished from non-switch firms. Switch firms reported the
new method, the old method and a decrease in pension expense arising from the

14
switch. Subsequently, these switches were confirmed in the equivalent pension fund
annual report. The number of switches in 1996, 1997 and 1998 were similar (12, 10
and 9, respectively).
Accordingly, rigorous sample selection procedures were followed that limited the
total industry matched-pair sample to the 31 switching firms and 31 non-switching
firms that are listed in Table III. Firms are matched in the following categories:
building and construction, brewing, engineering, financial services, food
manufacturing, industrial instruments, leisure, manufacturing, medical packaging and
distribution, publishing, resources, retail, services, travel, technology,
telecommunications and utilities. These firms (i) have complete, relevant financial
and actuarial data available on Datastream over the entire study period 1994-99; (ii)
sponsor pension funds for which complete and relevant data are available over the
corresponding period (collected by the authors) and (iii) are in continuous existence
during the five years prior to the issue of the standard (i.e. when UK managers first
had an opportunity to elect to use market-based valuation methods).
-------------------------------------------
INSERT TABLE III ABOUT HERE
------------------------------------------
4.3.1 Data – standard event study
Our first hypothesis was tested using daily Datastream returns for the 3 sub-periods
summarized in Table IV. Parameter estimates are based only on 100 trading days in
the pre-event period. The 45 days immediately preceding the event are excluded to
avoid the introduction of noise in the model when it is believed that the market
anticipates the event. Only 10 days were used for the post-event analysis. It would be
extremely difficult to attribute price changes over a long post event period to a
specific source of information.
-------------------------------------------
INSERT TABLE IV ABOUT HERE
------------------------------------------

15
4.3.2. Descriptive Statistics – Control Variables for variable effects event study
Data on pension assets and liabilities are drawn from DATASTREAM. The following
variables are used in the study for examining both switching and non-switching firms:
pit = return on firm i, in month t
PLt = actuarially-assessed pension liabilities at the end of year t, as reported by the
sponsoring firm’s annual report. It should be noted that this figure is reported
according to the ratio of actuarial assets (assumed to equal PAt) to actuarially-assessed
pension liabilities as required by SSAP 24.
PAt = actuarially-assessed pension assets at end of year t, as reported by the
sponsoring firm’s annual report at a smoothed (i.e. five year average) market value in
the pension footnote in accordance with SSAP 24.
LTDt = long term corporate debt at end of year t, obtained from DATASTREAM.
NIt = net earnings for relevant year, before pension and interest expense, divided by
market value of equity in year t, obtained from DATASTREAM.
PLA-M
t = difference between actuarial and market-based value of pension fund
liabilities during year t. The difference is obtained from firms’ pension footnote
disclosures of both (a) the discounted pension liabilities when using the actuarial
method (SSAP 24), and (b) the most recent 1 year UK corporate bond rate (FRS 17).
PAA-M
t = difference between actuarial and market-based pension asset disclosures in
the footnote. The difference is obtained from firms’ pension footnote disclosures of
both (a) the actuarially-assessed (SSAP 24) pension assets; and (b) the current market
(i.e. unsmoothed per FRS 17) value of pension fund assets during year t.
∆Rit = unexpected change in interest rates during year t for firm i, defined as the
difference between the market-based interest rate as at the date of the release of the
firm’s annual report and the most recent 1 year UK corporate bond rate.
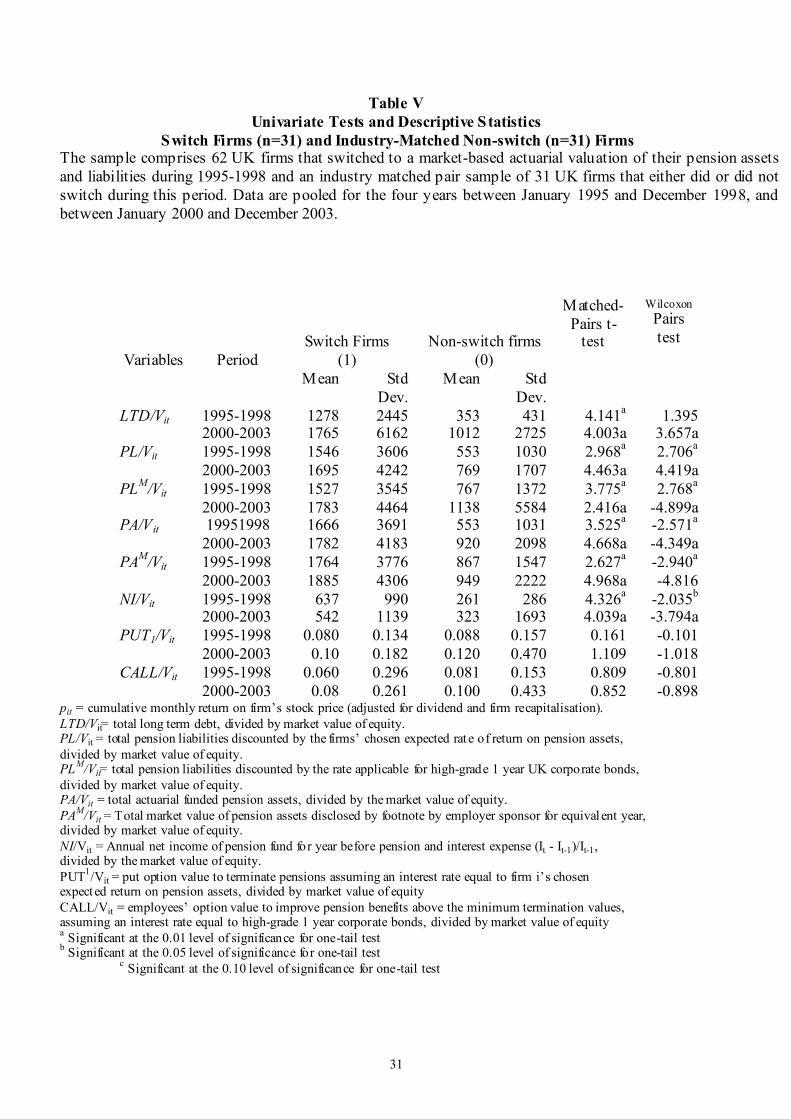
Table V provides descriptive statistics for the control variables for both switch and
non-switch sample firms. The differences in pension asset and liability rate valuation
assumptions as between switching and non-switching firms are statistically different.
This implies that switching firms are likely to be relatively more sensitive to the
effects of unexpected discount rate changes. These results tentatively confirm our
hypothesis that UK firms’ switching decisions impact observed variations in discount
valuation rate assumptions. However, more sophisticated multivariate tests are needed
16
to establish whether such variations also bear upon the value relevance of these
observed differences for each of our sub-samples of switch and non-switch firms.
----------------------------------------------
INSERT TABLE V ABOUT HERE
-----------------------------------------------
V. EMPIRICAL TESTS
5.1. Results
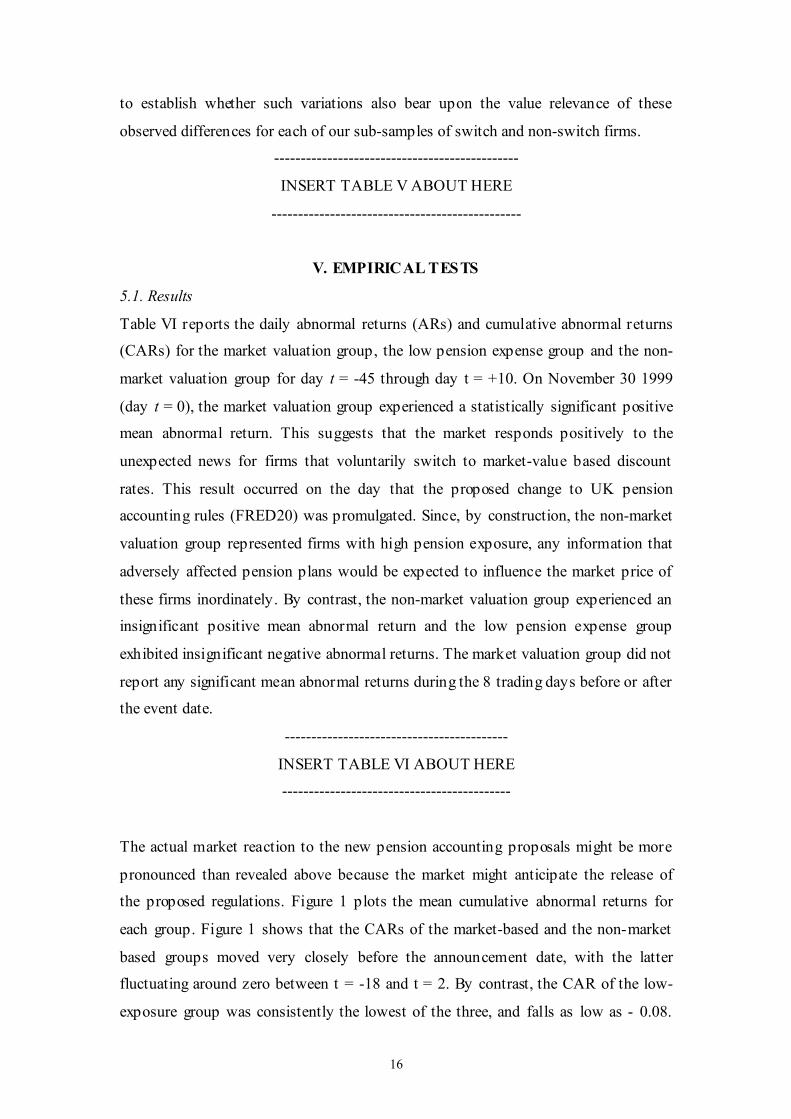
Table VI reports the daily abnormal returns (ARs) and cumulative abnormal returns
(CARs) for the market valuation group, the low pension expense group and the non-
market valuation group for day t = -45 through day t = +10. On November 30 1999
(day t = 0), the market valuation group experienced a statistically significant positive
mean abnormal return. This suggests that the market responds positively to the
unexpected news for firms that voluntarily switch to market-value based discount
rates. This result occurred on the day that the proposed change to UK pension
accounting rules (FRED20) was promulgated. Since, by construction, the non-market
valuation group represented firms with high pension exposure, any information that
adversely affected pension plans would be expected to influence the market price of
these firms inordinately. By contrast, the non-market valuation group experienced an
insignificant positive mean abnormal return and the low pension expense group
exhibited insignificant negative abnormal returns. The market valuation group did not
report any significant mean abnormal returns during the 8 trading days before or after
the event date.
------------------------------------------
INSERT TABLE VI ABOUT HERE
-------------------------------------------
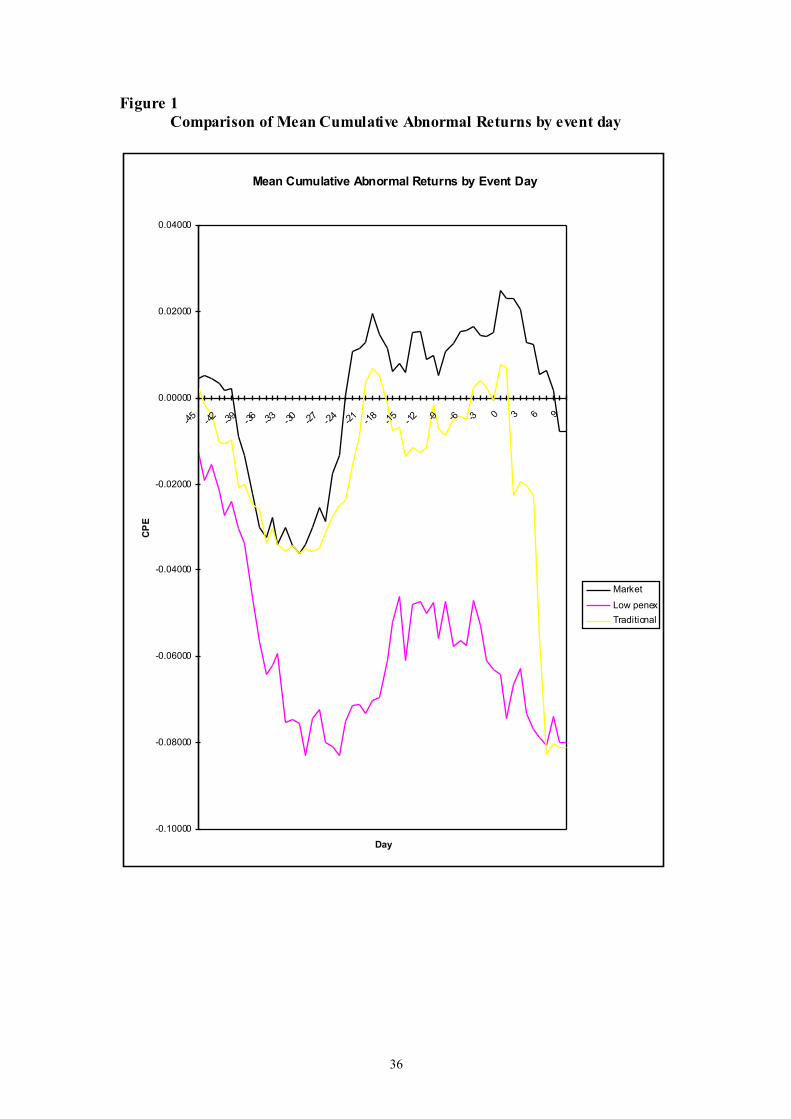
The actual market reaction to the new pension accounting proposals might be more
pronounced than revealed above because the market might anticipate the release of
the proposed regulations. Figure 1 plots the mean cumulative abnormal returns for
each group. Figure 1 shows that the CARs of the market-based and the non-market
based groups moved very closely before the announcement date, with the latter
fluctuating around zero between t = -18 and t = 2. By contrast, the CAR of the low-
exposure group was consistently the lowest of the three, and falls as low as - 0.08.
17
Consistent with stock market efficiency, we conclude that FRED 20 seems to have
been anticipated by the market a few days before it was released.
-------------------------------------------
INSERT FIGURE 1 ABOUT HERE
--------------------------------------------
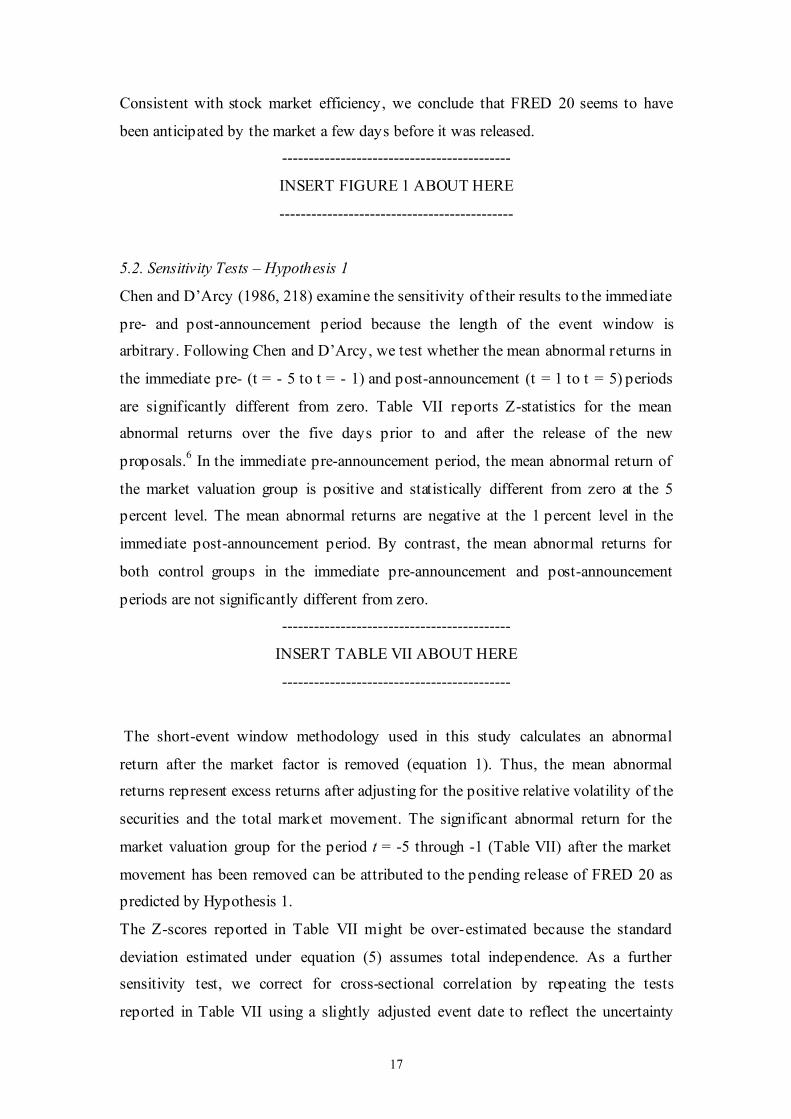
5.2. Sensitivity Tests – Hypothesis 1
Chen and D’Arcy (1986, 218) examine the sensitivity of their results to the immediate
pre- and post-announcement period because the length of the event window is
arbitrary. Following Chen and D’Arcy, we test whether the mean abnormal returns in
the immediate pre- (t = - 5 to t = - 1) and post-announcement (t = 1 to t = 5) periods
are significantly different from zero. Table VII reports Z-statistics for the mean
abnormal returns over the five days prior to and after the release of the new
proposals.6 In the immediate pre-announcement period, the mean abnormal return of
the market valuation group is positive and statistically different from zero at the 5
percent level. The mean abnormal returns are negative at the 1 percent level in the
immediate post-announcement period. By contrast, the mean abnormal returns for
both control groups in the immediate pre-announcement and post-announcement
periods are not significantly different from zero.
-------------------------------------------
INSERT TABLE VII ABOUT HERE
-------------------------------------------
The short-event window methodology used in this study calculates an abnormal
return after the market factor is removed (equation 1). Thus, the mean abnormal
returns represent excess returns after adjusting for the positive relative volatility of the
securities and the total market movement. The significant abnormal return for the
market valuation group for the period t = -5 through -1 (Table VII) after the market
movement has been removed can be attributed to the pending release of FRED 20 as
predicted by Hypothesis 1.
The Z-scores reported in Table VII might be over-estimated because the standard
deviation estimated under equation (5) assumes total independence. As a further
sensitivity test, we correct for cross-sectional correlation by repeating the tests
reported in Table VII using a slightly adjusted event date to reflect the uncertainty

18
over the accounting rules over time. The power of these tests is relatively invariant to
the exact choice of event date.
5.3 Multivariate Regression Tests – Hypothesis 1
The time series empirical tests ignore the possibility of errors in the estimation of the
parameters. We therefore use a fixed effects model to investigate whether the models
of abnormal returns for firms using market and non-market-based discount rate
assumptions have significantly different explanatory power for the post-
announcement period.7
Table VIII presents the results of a regression of announcement returns on abnormal
returns. We allow the coefficient on abnormal returns to vary across the first and last
half of the sample period. This is accomplished by interacting the abnormal returns
with a time-period dummy variable POSTANN, which takes the value of 1 if the
observation is post announcement date or later and 0 otherwise. If there has been no
change in the effect of discount rate on market performance across time, the
coefficient on the interaction term should be zero. Alternatively, a significant
coefficient confirms that there has been a change in the intensity with which the
market has approached the interpretation of market-value discount rate assumptions.
The regression is estimated separately for the market valuation abnormal returns
ARMkt and non-market valuation abnormal returns ARNMkt, and with both metrics
together and finally after controlling for the sub-sample firms with low pension
expense (ARLPE). The purpose of the last specification is to allow a test of differences
in the coefficients of the two predicted error metrics.
In the separate ARMkt and ARNMkt regressions, the coefficient on ARNMkt * POSTANN
(0.002) is significantly different from that of ARMkt * POSTANN (0.772). An F-test
cannot reject the null of equality for the two coefficient estimates, p-value = 0.001.
This result suggests that in the pre-announcement portion of the sample period,
investors do not reveal a strong preference for one measure over the other. Turning to
the post-announcement portion of the sample period, we find that the coefficient
estimates on the time-period interaction terms are significant for both ARMkt and
ARNMkt, suggesting that announcement returns have become more strongly associated
with abnormal returns in the post-announcement sample period. An F-test reveals that
19
the difference in the mean abnormal return coefficients is significant (e.g., [ARMkt *
POSTANN]> [ARNMkt* POSTANN], p-value 0.0001). Thus, it appears that the market
has shifted toward responding to the market-based figure rather than to the non-
market based discounting rate assumption. Overall, we find that investors are
displaying a greater sensitivity in the immediate post-announcement period to
discounting rate assumptions for ARMkt over ARNMkt. These results confirm our
predictions.
-------------------------------------------
INSERT TABLE VIII ABOUT HERE
-------------------------------------------
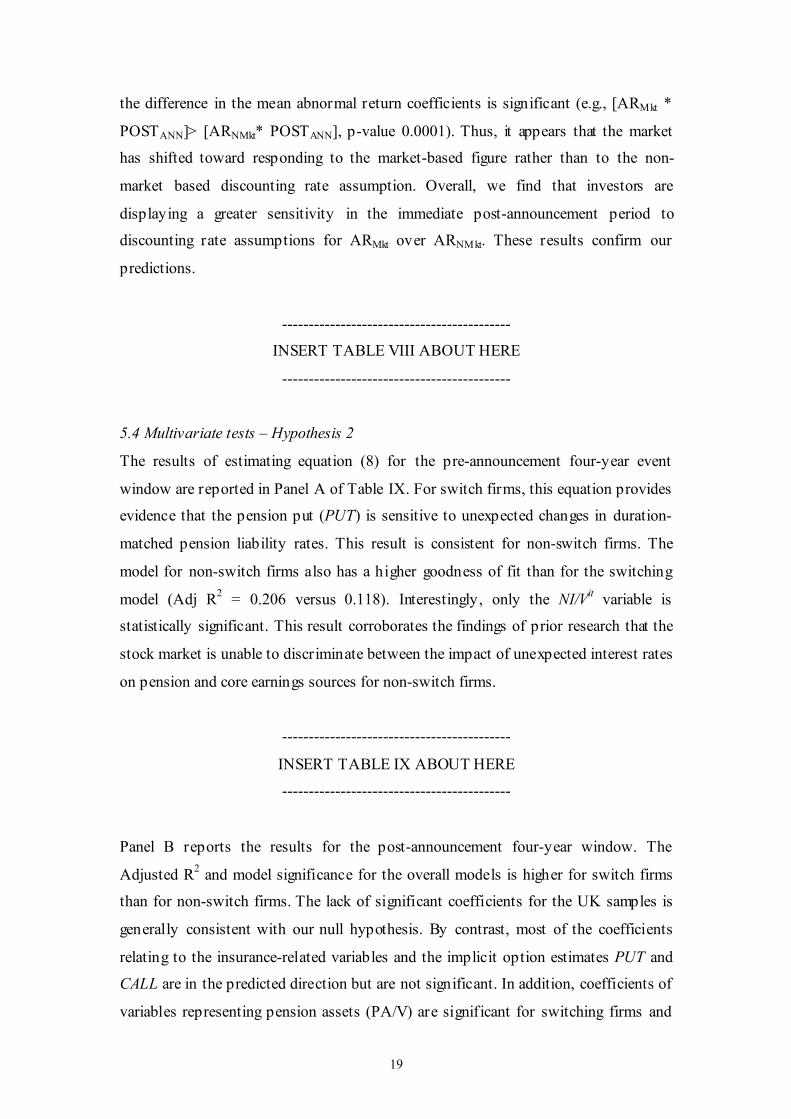
5.4 Multivariate tests – Hypothesis 2
The results of estimating equation (8) for the pre-announcement four-year event
window are reported in Panel A of Table IX. For switch firms, this equation provides
evidence that the pension put (PUT) is sensitive to unexpected changes in duration-
matched pension liability rates. This result is consistent for non-switch firms. The
model for non-switch firms also has a higher goodness of fit than for the switching
model (Adj R2 = 0.206 versus 0.118). Interestingly, only the NI/V
it variable is
statistically significant. This result corroborates the findings of prior research that the
stock market is unable to discriminate between the impact of unexpected interest rates
on pension and core earnings sources for non-switch firms.
-------------------------------------------
INSERT TABLE IX ABOUT HERE
-------------------------------------------
Panel B reports the results for the post-announcement four-year window. The
Adjusted R2 and model significance for the overall models is higher for switch firms
than for non-switch firms. The lack of significant coefficients for the UK samples is
generally consistent with our null hypothesis. By contrast, most of the coefficients
relating to the insurance-related variables and the implicit option estimates PUT and
CALL are in the predicted direction but are not significant. In addition, coefficients of
variables representing pension assets (PA/V) are significant for switching firms and
20
long-term debt (LTD) and pension liabilities (PL/V) are statistically significant for
non-switch firms. These results support the notion that the stock market valuation of
firms’ implicit termination options is strongly conditioned by firms’ switching
choices.
5.5. Sensitivity Tests
Further sensitivity analysis was conducted to increase our confidence about the
robustness of our results. First, we included a number of control variables used in
prior value-relevance research in the regressions (e.g. lagged earnings). We eliminated
observations with negative earnings. Potential endogeneity of earnings, market returns
and industry match-paired firms was recognised by running two-stage least squared
regressions for equation (3). We also eliminated observations of firms in regulated
industries, where different accounting standards and disclosure requirements may
apply (e.g. banking, life insurance, telecommunications, and utilities). We also
repeated the analysis separately for only firms with a minimum net pension liability or
asset (i.e. which are less than 1% of market value of equity) and for outlier firms with
relatively high and low debt. Finally, we repeated the analyses separately for the years
1999-2000 and 2001-02, when presumably the effects of the long bull stock market
may have caused substantially more UK firms to have over funded pension plans. In
all cases the regression results are not affected and so are not separately reported.
We also conducted various diagnostic and sensitivity tests in order to examine the
robustness and efficiency of our multivariate results. First, we incorporated a number
of other control variables, such as lagged earnings and earnings multiplied by the
interest rate factor: none of these significantly affected our overall results. Second,
homoscedasticity of the residuals was tested using the White (1980) test for
heteroscedasticity to examine correlation of the error terms. The White test rejects the
null hypothesis of homoscedasticity for the sample, but the findings are robust to
using White heteroscedasticity-consistent standard errors. Based on White standard
errors, the null hypothesis is rejected at the 0.01 level for the pooled sample.
Therefore, we conclude that our fixed-effects results are not unduly biased by the
normality problem.
VI. SUMMARY AND CONCLUSION

21
New UK pension accounting rules imposing market-consistent valuation of pension
assets and liabilities effectively removed considerable discretion over firms’ pension
discount rate assumptions. The proposals were developed over a period where many
firms’ sponsored pension funds experienced both declining interest rates and
relatively poor stock market performance. We predict the proposals differentially
affected the stock price returns of industry match-paired samples of UK firms that
either did or did not voluntarily adopt the market-based discount rate assumptions.
The short time frame for the event study identifies positive cumulative abnormal
returns for firms switching to market-based pension discount rates twenty days prior
to the announcement date of the proposed new pension accounting rules. By contrast,
the performance of the industry match pair samples of non-switching firms around the
time of the announcement is consistently insignificant.
The post-announcement differential market response to sample firms that either did or
did not use discounting rate assumptions is robust to the results of a multivariate
fixed-effects regression. These findings provide tentative support to earlier findings
concerning the market sensitivity to the issue of US pension accounting proposals on
firms that choose differential pension interest rate assumptions (Chen and D’Arcy,
1986). Our results extend the prior literature by additionally controlling for both
industry effects in the sample selection procedure and UK firm managers’ discretion
over market-based discount rate assumptions.
We also exploit a variable effects event study methodology to examine the
association between stock returns and the effect of unexpected interest rate changes
on interest sensitive pension assets and liabilities, over four year transitional periods
both prior to and following the announcement. This tests a further hypothesis that
stock prices of UK firms’ are sensitive to interest rate sensitivity of pension discount
rate assumptions and their strategic option to voluntarily terminate these schemes to
new employees. Our findings are generally consistent with this hypothesis for the
post-announcement period, even after controlling for other pension and firm related
sources of value that are sensitive to the effect of unexpected interest rate changes on
firm stock returns.

22
This conclusion is reasonably robust because alternative methodological approaches
and data from several different years were used. The put option estimate is
significantly associated with stock price returns even after controlling for business and
economic factors affecting the interest rate sensitivity of firms’ security prices. For
those firms exercising this discretion by using standard discounting assumptions, the
put option estimate that is premised on pension liabilities estimated consistently with
solvency regulations significantly associated with stock price returns; for other firms
the put option estimate premised on pension liabilities estimated consistent with
financial reporting rules. This suggests that this amount is potentially value-relevant
to capital market participants.
These empirical results also support our prediction that the difference between
(actuarial cost based versus market-based) pension asset values and (equity-linked
versus corporate bond-linked liability) discount rates is potentially value-relevant to
capital market participants for assessing the option to terminate pension plans. Thus,
we provide some evidence that market valuation assumptions of firms reflect long-
duration contractual liabilities and assets in respect of their workforce.

23
Footnotes
1. It could be alternatively argued that disclosure, rather than recognition of pension
liabilities, is sufficient information. However Landsman and Ohlson (1990)
provide evidence that the stock market appears to under-react to the disclosure,
rather than recognition, of information inherent in net pension assets, and
conclude that this is caused by market inefficiency.
2. The question of whether actuarial or market-based interest rates should be used to
discount pension liabilities is also closely related to the broader conceptual issue
of how pension liabilities should be defined and measured (Klumpes, 2001).
3. Prior UK GAAP did not mandate a uniform actuarial methodology for calculating
pension assets or liabilities, although FRS 17 proposes to use a more standard
market-based approach (para 12). Consequently it is not possible to empirically
examine this issue directly in our study, although we partially attempt to overcome
this problem by dichotomizing our sample of firms between those likely to use
short-term and long-term pension contracts.
4. Consistent with Landsman (1986) and Barth (1991), we attempt to overcome this
potential problem by examining the market impact of the full pension liability.
5. The value of sj t is given by (Chen and D’Arcy, 1986):
( )( )
21
1
2
2
2 11
−
−++=
∑=
jD
mm
mmt
j
jjt
RR
RR
Dss
ττ
Where s2j = residual variance for security j from the market model regression,
Dj = number of observations during the estimation period,
Rmt = rate of return on the market index for day t of the event period,
Rm = mean rate of return on the market index during the estimation period,
Rmt = rate of return on the market index for day t of the estimation period.
6. The authors also calculated mean abnormal returns over various other time period
intervals. Consistent with the findings reported in this section, the mean abnormal
returns of market valuation group are positive in the pre-announcement period but

24
negative in the post announcement period. However, the man prediction errors of
the low pension and non market groups are not statistically different from zero in
either the pre- or post-announcement period. None of the empirical results are
affected when companies cross-listed on the New York Stock Exchange.
7. We are grateful to an anonymous referee for this point. The tests reported in table
VIII below were robust to alternative specifications of the pre- and post-
announcement periods, after controlling for other financial variables for each firm
and conditioning by market capitalisation.

25
References
Accounting Standards Committee 1988. SSAP 24: Accounting for the cost of pensions. ASB: London.
Accounting StandardsBoard 2000. FRS 17: Retirement Benefits, ASB: London.
Barth, M.E. 1991. Relative measurement errors among alternative pension asset and
liability measures. Accounting Review 66: 433-63. Barth, M., Beaver, W.H.
and Landsman, W.R. 1992. The market valuation implications of net periodic pension cost components. Journal of Accounting and Economics (15): 27-62.
Blankley, A.I. and Swanson, E.P. 1995. A longitudinal study of SFAS 87 pension rate
assumptions. Accounting Horizons. (December) 9(4): 1-21.
Bulow, J. 1982. What are corporate pension liabilities? Quarterly Journal of
Economics, 97: 435-52.
Chen, K.C. and S.P. D’Arcy. 1986. Market sensitivity to interest rate assumptions in
corporate pension plans. Journal of Risk and Insurance. (June) 53(2): 209-225.
Clark, P. 1998. IAS 19 is a big step towards IOSCO endorsement. Accountancy
Magazine, March. Page numbers?
Daley, L. 1984. The valuation of reported pension measures for firms sponsoring defined benefit plans. The Accounting Review (April): 111-198.
Dodd, P. and Warner, J.B. 1983. On corporate governance: a study of proxy contests,
Journal of Financial Economics 11(4): 401-438.
Feldstein, M.S. and Morck, R. 1983. Pension funding decisions, interest rate
assumptions, and share prices. In Financial Aspects of the United States Pension System, ed., Z. Bodie and J.B. Shoven. Chicago: University of
Chicago Press.
Feldstein, M.S. and S. Seligman 1981. Pension funding, share prices and national
savings. Journal of Finance (September), pp. 801-824.
Financial Accounting Standards Board 1985. Statement of Financial Accounting Standards No. 87. Employer Sponsors’ Pension Accounting.
Fogarty, T.J. and J. Grant. 1995. Impact of the actuarial profession on financial
reporting. Accounting Horizons. (September) 9(3): 23-33.
Gersowitz, M. 1980. Economic consequences of unfunded vested pension benefits.
Working Paper. National Bureau of Economic Research.
Ghicas, D.C. 1990. Determinants of actuarial cost method changes for pension
accounting and funding. The Accounting Review (April)., pp. 384-405.
Godwin, J.H., S.R. Goldberg and J.E. Duchac. 1997. An empirical analysis of factors
associated with changes in pension-plan interest-rate assumptions. Journal of
Accounting, Auditing and Finance, 305-322.
Gopalakrishnan, V. and T.F. Sugrue. 1993. An empirical investigation of stock market
valuation of corporate projected pension liabilities. Journal of Business
Finance and Accounting. 711-723.
International Accounting Standards Committee. 1996. Exposure Draft E54: Employee
Benefits. IASC: London.
26
-----. 1997. IAS 19 (Revised): Accounting for Employers’ Pension Costs. IASC:
London.
Klumpes, P.J.M. 2001. Implications of four theoretical perspectives for pension accounting research, Journal of Accounting Literature, Vol. 20, 30-61.
Klumpes, P.J.M. and M. Whittington. 2003. Determinants of Actuarial Valuation
Method Changes for Pension Funding and Reporting: Evidence from the UK,
Journal of Business Finance and Accounting (25&25):781-783.
Landsman, W. 1986. An empirical investigation of pension fund property rights. Accounting Review 61: 662-91.
-----. And J.A. Ohlson. 1990. Evaluation of market efficiency for supplementary
accounting disclosures: the case of pension liability, Contemporary
Accounting Research 2 (October): 1-30.
Mittelstaedt, H.F and P.R. Regier 1993. The market response to pension plan terminations. The Accounting Review (January). pp. 1-27.
Oldfield, G.S. 1977. Financial aspects of the private pension system. Journal of
Money, Credit and Banking, pp. 48-93.
Sami, H. and A. Shahid 1997. Financial accounting standards and the relevance and
reliability of accounting information: the case of accounting for pensions. Accounting Enquiries 6(2): 149-186.
Scholes, M. Comment on Marcus et al., in Bodie, Z, Shoven, B. and D. Wise eds.,
Issues in Pension Economics, University of Chicago Press, Chicago.
---------. And M. Williams. 1977. Estimating betas from nonsynchronous data,
Journal of Financial Economics, 5(3): 309-327.
Sharpe, W. 1976. Corporate pension funding policy, Journal of Financial Economics,
4(2): 183-194.
Thomas, J.K. 1989. Why do firms terminate their overfunded pension plans? Journal
ofAccounting and Economics. 11: 361-398.

27
Table I
Chronology of Development of UK, US and International Pension Accounting Standards
DATE EVENT DESCRIPTION
December 1985
FASB issues SFAS 87. SFAS 87 requires disclosure of several measures of pension
liabilities in a footnote and
recognition of the net unfounded
pension liability in the Balance
Sheet.
May 1988 ASB issues SSAP 24; effective
1990
SSAP 24 requires footnote
disclosure of certain actuarial
assumptions underlying the
reported pension cost calculation. Considerable discretion over
actuarial method and actuarial
assumptions permitted.
June 1995 ASB issues Discussion Paper ASB explores problems with SSAP 24, including lack of
standard disclosures
October 1996
IASC issues Exposure Draft 54 IASC proposes valuation of pension liability using market-
based assumptions
6 April 1997 Minimum Funding
Requirements of Pensions Act 1995 effective for periods
beginning on or after this date
Actuaries required to measure
value of pension plan liabilities using prescribed assumptions and
adjust to reflect current market
conditions
March 1998 IASC issues Revised IAS 19 IASC implements ED 54
July 1998 ASB issues further Discussion
Paper
ASB restates intention to require
UK firms to recognise pension
liability on balance sheets; favours
market-values
30
November
1999
ASB issues proposed changes to
pension accounting rules
(FRED20)
UK firms to recognise pension
liability using market-based
assumptions
25
November
2000
ASB issues FRS 17 Proposals implemented: effective
2003
5 July 2002 ASB delays implementation of
FRS 17
ASB postpones the
implementation of FRS 17 until
2005 for re-issue of IAS 19
1 Jan 2005 ASB implements FRS17 FRS17 takes effect from this date.
Table Notes: Refer to Statements of Standard Accounting Practice 24, Statements of
Financial Accounting Standard 87, International Accounting Standard 19 and Financial Reporting Standard 17.

28
Table II
Differences in Discounting Assumptions Between Accounting UK, US and
International Pension Cost Accounting Standards
Feature SSAP 24 SFAS 87 IAS 19 FRS 17
Origin of GAAP UK US International UK
Discount rate:
Pension assets
Actuarial
(long term) value
Market value
(smoothed)
Market value Market value
Discount rate: pension liabilities
Long-term rate of return
expected on
actual asset
portfolio
Prime corporate bond
return
Prime corporate bond
return
Gilt bond return
Treatment of
gains or losses
Spread Spread outside
corridor
Spread outside
corridor
Immediate
write-off
Actuarial
valuation
methodology
Actuarial
judgment
using ‘best
estimate’
Interest on past
service
liabilities plus
return on assets
Interest on past
service
liabilities plus
return on assets
Interest on
past service
liabilities
plus return on assets
Assumed pension
liabilities
Any ABO (PBO) ABO ABO
Valuation
frequency
Triennial Annual Annual Annual
Table Notes: Refer to Statements of Standard Accounting Practice 24, Statements of
Financial Accounting Standard 87, International Accounting Standard 19 and
Financial Reporting Standard 17.

29
Table III
Sample Details
Industry Switch
Firms
Low Pension Expense
Firms
Non-switch
Firms
Building and Construction McAlpine Bett Brothers Mowlem Brewing Guinness / Diageo Allied Domecq Whitbread
Engineering/Agricultural Hall Engineering Slough Carr’s Milling
Engineering Molins Haynes Ricardo
Financial Services (banking) NationalWestminster Bank of Scotland HSBC Holdings
Financial Services (retail) Hogg Robinson Britannic Legal & General Financial Services (brokerage) James Finlay Halifax Provident Financial
Food Manufacturing Assoc. British Foods Aggregate Bernard Matthews
Industrial Instruments Norcos United Business Smiths Industries
Medical and Chemical Imperial Chemical Chemex Smith & Nephew
Packaging and Distribution Waddington Independent James Latham Publishing and Advertising News International Johnston Pearson
Manufacturing Bunzl Sinclair British Vita
Manufacturing Cadbury Schweppes Rentokil General Electric
Manufacturing Garton Engineering Charter Relyon
Manufacturing Pilkington DeLaRue Williams Holdings Manufacturing Airsprung Furniture Homestyle Blue Circle
Pharmaceutical Smithkline Beecham Glaxo Astra-Zeneca
Leisure Granada Thomson Rank Group
Retail – food Boots Swan Hill Safeway
Retail - beverages Greenalls Malcolm Eldridge Pope Retail - household Dixons Group Grampian Silentnight
Retail - clothing House of Fraser James Beattie Kingfisher
Retail - diversified Storehouse GUS Sainsbury
Resources and minerals BP-Amoco BNB Resources British Steel
Services Securicor Brooke BAA Technology Johnson Matthey Reuters FI Group
Telecommunications BT Carlton Vodafone-Airtouch
Travel British Airways First choice Stagecoach
Utilities - reticulation Scottish Power United Utilities Severn Trent
Utilities - generation Powergen Carbo Ocean Group
Table Notes: The sample is selected using an industry-matched pair sample procedure, following Ghicas (1990). Industry segments were select ed based on those reported in the Financial Times. Firms
considered for inclusion in the sample met the following criteria: (1) sponsored defined benefit pension funds exceeding £10 million as reported in the industry publication Pension Funds and Their Advisers;
(2) were listed in the FTSE 500 for the last ten years; (3) had complete financial and actuarial data available on Datastream from 1994-1999. Firms were classified as using ‘market-based’ discount rates
if their disclosed actuarial pension asset and/or liability assumptions were updated more frequently than that required by actuarial requi rements (i.e. more than once every three years). An industry-matched
pair firm was then randomly select ed which did not update its actuarial assumptions by more than once every three years. A third industry matched pair fi rm was selected which did not record a pension
expense exceeding 5% of its net sales for the period 1994-1999.

30
Table IV
Calendar Dates for Three Subperiods
Surrounding the Release of ASB’s Pension Cost Proposals (Financial Reporting Exposure Draft 20 ‘FRED 20’) on 30 November 1999
Subperiod
Dates
No. of
Trading
Days 1. The “Pre-Announcement” period used for
estimating the “Market Model” parameters for
each firm
14 April 1999 -
1 September 1999
100
2. The “Announcement” period 2 September 1999 - 30 November 1999
45
3. The “Post-Announcement” period 3 December 1999 –
17 December 1999
10
31
Table V
Univariate Tests and Descriptive Statistics
Switch Firms (n=31) and Industry-Matched Non-switch (n=31) Firms The sample comprises 62 UK firms that switched to a market-based actuarial valuation of their pension assets
and liabilities during 1995-1998 and an industry matched pair sample of 31 UK firms that either did or did not
switch during this period. Data are pooled for the four years between January 1995 and December 1998, and
between January 2000 and December 2003.
Variables
Period
Switch Firms
(1)
Non-switch firms
(0)
Matched-
Pairs t-test
Wilcoxon Pairs
test
Mean Std
Dev.
Mean Std
Dev.
LTD/Vit 1995-1998 2000-2003
1278 1765
2445 6162
353 1012
431 2725
4.141a
4.003a 1.395 3.657a
PL/Vit 1995-1998
2000-2003
1546
1695
3606
4242
553
769
1030
1707
2.968a
4.463a
2.706a
4.419a
PLM/Vit 1995-1998
2000-2003
1527
1783
3545
4464
767
1138
1372
5584
3.775a
2.416a
2.768a
-4.899a PA/V it 19951998
2000-2003
1666
1782
3691
4183
553
920
1031
2098
3.525a
4.668a
-2.571a
-4.349a
PAM/Vit 1995-1998
2000-2003
1764
1885
3776
4306
867
949
1547
2222
2.627a
4.968a
-2.940a
-4.816
NI/Vit 1995-1998 2000-2003
637 542
990 1139
261 323
286 1693
4.326a
4.039a -2.035
b
-3.794a
PUT1/Vit 1995-1998
2000-2003
0.080
0.10
0.134
0.182
0.088
0.120
0.157
0.470
0.161
1.109
-0.101
-1.018
CALL/Vit 1995-1998
2000-2003
0.060
0.08
0.296
0.261
0.081
0.100
0.153
0.433
0.809
0.852
-0.801
-0.898 pit = cumulative monthly return on firm’s stock price (adjusted for dividend and firm recapitalisation).
LTD/Vit= total long term debt, divided by market value of equity. PL/Vit = total pension liabilities discounted by the firms’ chosen expected rat e of return on pension assets,
divided by market value of equity. PL
M/Vit= total pension liabilities discounted by the rate applicable for high-grade 1 year UK corporate bonds,
divided by market value of equity. PA/Vit = total actuarial funded pension assets, divided by the market value of equity.
PAM/Vit = Total market value of pension assets disclosed by footnote by employer sponsor for equival ent year,
divided by market value of equity.
NI/Vit = Annual net income of pension fund for year before pension and interest expense (It - It-1)/It-1, divided by the market value of equity.
PUT1/Vit = put option value to terminate pensions assuming an interest rate equal to firm i’s chosen
expect ed return on pension assets, divided by market value of equity
CALL/Vit = employees’ option value to improve pension benefits above the minimum termination values, assuming an interest rate equal to high-grade 1 year corporate bonds, divided by market value of equity a Significant at the 0.01 level of significance for one-tail test b Significant at the 0.05 level of significance for one-tail test
c Significant at the 0.10 level of significance for one-tail test

32
Table VI
Daily Mean Market-Adjusted Abnormal Returns (AR) and Cumulative Sum of the Daily Mean Abnormal Returns (CAR)
For the Issue of FRS 17 (30 November, 1999) Market Valuation Group Low Pension Expense Group Non Market Valuation Group
Day AR CAR AR CAR AR CAR
-45 -44 -43 -42
-41 -40 -39 -38 -37
-36 -35 -34 -33 -32
-31 -30 -29 -28 -27
-26 -25 -24 -23 -22
-21 -20 -19 -18 -17
-16 -15 -14 -13 -12
-11 -10 -9 -8 -7
-6 -5 -4 -3 -2
-1 0 1 2 3
4 5 6 7 8
9
0.00455 0.00050 -0.00046 -0.00135
-0.00145 0.00012 -0.01100 -0.00417 *-0.00896
-0.00794 -0.00224 0.00435 -0.00608 0.00402
-0.00425 -0.00182 0.00236 0.00383 0.00474
-0.00359 *0.01095
0.00445 **0.01400
*0.01009
0.00085 0.00153 0.00649 -0.00470 -0.00340
-0.00537 0.00180 -0.00215 0.00948 0.00026
-0.00676 0.00115 -0.00482 0.00581 0.00157
0.00303 0.00019 0.00098 -0.00222 -0.00048
0.00132 *0.00968
-0.00176 -0.00010 -0.00226
-0.00786 -0.00059 -0.00675 0.00090 -0.00468
*-0.00955
0.00455 0.00505 0.00459 0.00325
0.00179 0.00191 -0.00909 -0.01326 -0.02222
-0.03016 -0.03240 -0.02805 -0.03413 -0.03011
-0.03436 -0.03618 -0.03382 -0.02999 -0.02526
-0.02885 -0.01790 -0.01345 0.00055 0.01064
0.01149 0.01302 0.01951 0.01482 0.01142
0.00604 0.00785 0.00569 0.01518 0.01544
0.00868 0.00983 0.00501 0.01082 0.01293
0.01542 0.01561 0.01659 0.01436 0.01388
0.01520 0.02488 0.02312 0.02302 0.02077
0.01291 0.01232 0.00557 0.00646 0.00183
-0.00772
**-0.01273
-0.00661 0.00391 -0.00610
-0.00555 0.00298 -0.00628 -0.00333
**-0.01253
*-0.01039 -0.00773 0.00216 0.00293
**-0.01626
0.00067 -0.00097 -0.00723 0.00866 0.00206
-0.00774 -0.00102 -0.00204 0.00811 0.00356
0.00037 -0.00207 0.00316 0.00061 0.00852
0.00874 0.00616
**-0.01491
*0.01302
0.00044
-0.00248 0.00211 -0.00812 0.00866
*-0.01059
0.00141 -0.00116 0.01072 -0.00611 -0.00792
-0.00228 -0.00110 *-0.01011
0.00814 0.00367
*-0.01058
-0.00367 -0.00196 -0.00180 0.00676
-0.00624
-0.01273 -0.01934 -0.01543 -0.02153
-0.02707 -0.02410 -0.03037 -0.03371 -0.04624
-0.05663 -0.06436 -0.06220 -0.05927 -0.07553
-0.07486 -0.07583 -0.08306 -0.07440 -0.07235
-0.08009 -0.08111 -0.08315 -0.07504 -0.07148
-0.07111 -0.07317 -0.07002 -0.06941 -0.06089
-0.05215 -0.04599 -0.06090 -0.04789 -0.04745
-0.04993 -0.04782 -0.05594 -0.04728 -0.05787
-0.05646 -0.05762 -0.04690 -0.05301 -0.06093
-0.06321 -0.06431 -0.07442 -0.06629 -0.06262
-0.07320 -0.07687 -0.07883 -0.08063 -0.07387
-0.08011
0.00230 -0.00404 -0.00208 -0.00658
0.00036 0.00092
*-0.01103
0.00076 -0.00474
-0.00128 -0.00762 0.00333 -0.00368 -0.00155
0.00139 -0.00177 0.00102 -0.00051 0.00055
0.00357 0.00372 0.00261 0.00120 0.00789
0.00727 *0.01223
0.00323 -0.00178 -0.00655
-0.00602 0.00075 -0.00682 0.00217 -0.00129
0.00135 *0.00976
-0.00544 -0.00151 0.00383
0.00031 -0.00059 0.00759 0.00140 -0.00167
-0.00298 0.00824 -0.00050 -0.02979 0.00331
-0.00105 -0.00214
**-0.03286
-0.02720 0.00245
-0.00092
0.00230 -0.00173 -0.00381 -0.01039
-0.01075 -0.00983 -0.02086 -0.02010 -0.02484
-0.02612 -0.03374 -0.03041 -0.03409 -0.03564
-0.03425 -0.03602 -0.03500 -0.03551 -0.03496
-0.03138 -0.02767 -0.02505 -0.02385 -0.01596
-0.00896 0.00353 0.00677 0.00499 -0.00156
-0.00759 -0.00683 -0.01366 -0.01148 -0.01278
-0.01143 -0.00168 -0.00712 -0.00863 -0.00480
-0.00449 -0.00508 0.00251 0.00391 0.00224
-0.00074 0.00750 0.00700 -0.02279 -0.01948
-0.02053 -0.02266 -0.05552 -0.08272 -0.08027
-0.08119
** significant at 1% level
* significant at 5% level.

33
Table VII
Mean Abnormal Returns in Immediate Pre- and Post-Announcement Periods FRS 17 (Issued 30 November 1999)
Market
valuation
group
Low pension
expense
group
Non-Market
valuation
group Pre-Announcement Period:
t = -42 through t = -38
-0.0035
(-1.743)
-0.0031
(-1.095)
-0.0031
(-1.352)
t = -36 through t=-32 -0.0007
(-0.354)
-0.0054
(-0.917)
-0.0015
(-0.929) t = -5 through t = -1 0.0005
*(1.985)
-0.0026
(-0.389)
0.0010
(0.482)
Post-Announcement
Period:
t = 1 through t = 5 -0.0029 **(-3.449)
-0.0018 (0.291)
-0.0054 (-0.335)
t = 1 through t = 10 -0.0898
(-0.014)
-0.1018
(-0.012)
-0.1033
(-0.014)
Various Intervals:
t = -30 through t = -1 0.0016 (0.667)
0.0004 (0.086)
0.0011 (0.534)
t = -20 through t = -1 0.0002
(0.123)
0.0004
(0.079)
0.0004
(0.170)
t = -10 through t = -1 0.0006
(0.917)
-0.0013
(-0.296)
0.0011
(0.548)
Table Notes: The z statistics of equation (6) are in parentheses. ** = Significant at 1% level.
* = Significant at 5% level.
+ = Significant at 10% level.

34
Table VIII
Regressions of Announcement Period Returns on Abnormal Returns
(t-statistics and (p-values) under coefficient estimates)
Return = α0 + α1ARMkt * POSTANN + α2ARLPE* POSTANN + α3 ARNMkt * POSTANN +
ε
Model N Intercept ARMkt*
POSTANN
ARLPE *
POSTANN
ARNMkt*
POSTANN
Adj R2
1 1023 0.004 0.772 - - 0.040
0.48 6.517
(0.630) (0.001)
2 1023 0.006 0.772 - 0.002 0.042
0.547 6.529 2.026
(0.585) (0.001) (0.043)
3 1023 0.075 0.771 0.001 0.002 0.041
0.319 6.519 0.474 2.018
(0.750) (0.001) (0.636) (0.048)
H0: ARMkt* POSTANN = ARNMkt * POSTANN,
F-statistic = 23.352, p-value = 0.0001
Table Notes: This table presents regressions of announcement period raw stock returns (Return) on abnormal returns calculated relative to ARMkt (PELPE) and ARNMkt
(PELPE). The announcement period is defined as the period beginning five days after
the ASB’s issue of the pension cost accounting exposure draft FRED 20 and ending 5
days, where the announcement date is defined as 30 November 1999, i.e. the issue
date of FRED 20.
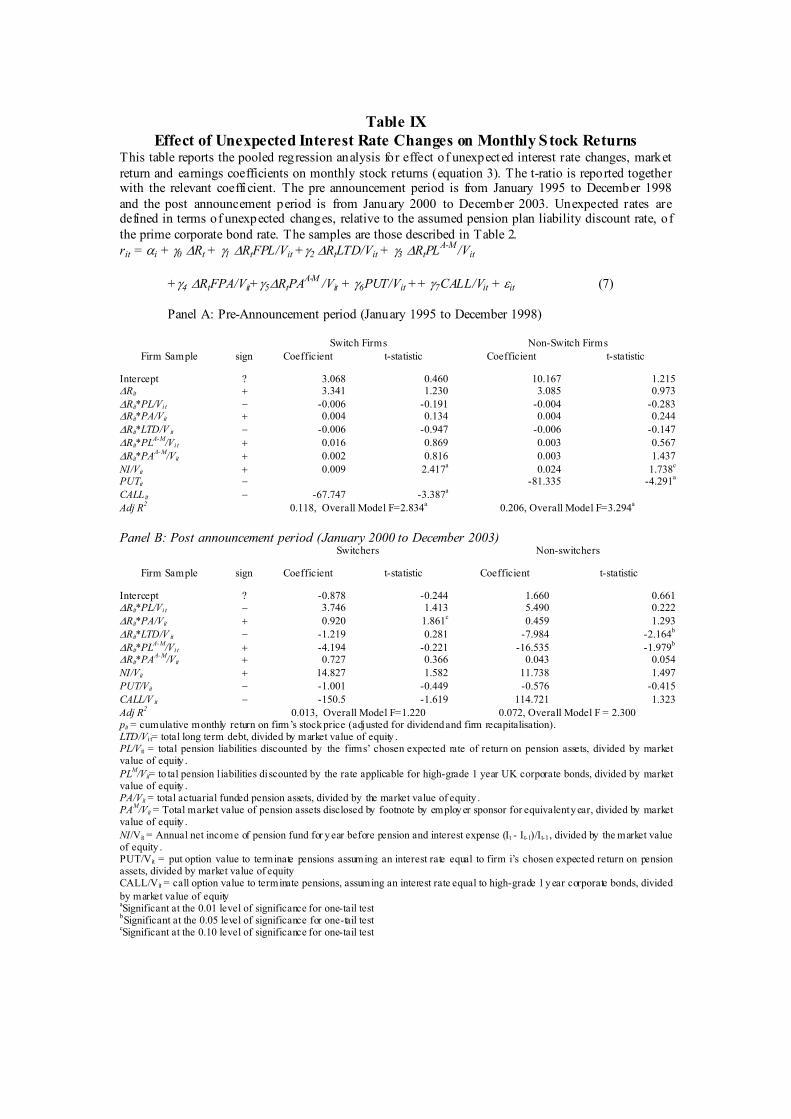
Table IX
Effect of Unexpected Interest Rate Changes on Monthly Stock Returns This table reports the pooled regression analysis for effect of unexpect ed interest rate changes, market
return and earnings coefficients on monthly stock returns (equation 3). The t-ratio is reported together with the relevant coeffi cient. The pre announcement period is from January 1995 to December 1998
and the post announcement period is from January 2000 to December 2003. Unexpected rates are defined in terms of unexpected changes, relative to the assumed pension plan liability discount rate, of
the prime corporate bond rate. The samples are those described in Table 2.
rit = αi + γ0 ∆Rt + γ1 ∆RtFPL/Vit +γ2 ∆RtLTD/Vit + γ3 ∆RtPLA-M
/Vit
+γ4 ∆RtFPA/Vit+γ5∆RtPAA-M
/Vit + γ6PUT/Vit ++ γ7CALL/Vit + εit (7)
Panel A: Pre-Announcement period (January 1995 to December 1998)
Switch Firms Non-Switch Firms
Firm Sample sign Coefficient t-statistic Coefficient t-statistic
Intercept ? 3.068 0.460 10.167 1.215 ∆Rit + 3.341 1.230 3.085 0.973
∆Rit*PL/Vi t − -0.006 -0.191 -0.004 -0.283 ∆Rit*PA/Vit + 0.004 0.134 0.004 0.244
∆Rit*LTD/V it − -0.006 -0.947 -0.006 -0.147
∆Rit*PLA-M
/Vi t + 0.016 0.869 0.003 0.567
∆Rit*PAA-M
/Vit + 0.002 0.816 0.003 1.437
NI/Vit + 0.009 2.417a
0.024 1.738c
PUTit − -81.335 -4.291a
CALL it − -67.747 -3.387a
Adj R2 0.118, Overall Model F=2.834
a 0.206, Overall Model F=3.294
a
Panel B: Post announcement period (January 2000 to December 2003) Switchers Non-switchers
Firm Sample sign Coefficient t-statistic Coefficient t-statistic
Intercept ? -0.878 -0.244 1.660 0.661 ∆Rit*PL/Vi t − 3.746 1.413 5.490 0.222
∆Rit*PA/Vit + 0.920 1.861c 0.459 1.293
∆Rit*LTD/V it − -1.219 0.281 -7.984 -2.164b
∆Rit*PLA-M
/Vi t + -4.194 -0.221 -16.535 -1.979b
∆Rit*PAA-M
/Vit + 0.727 0.366 0.043 0.054
NI/Vit + 14.827 1.582
11.738 1.497
PUT/Vit − -1.001 -0.449 -0.576 -0.415
CALL/V it − -150.5 -1.619 114.721 1.323
Adj R2 0.013, Overall Model F=1.220 0.072, Overall Model F = 2.300
pit = cumulative monthly return on firm’s stock price (adjusted for dividend and firm recapitalisation). LTD/Vi t= total long term debt, divided by market value of equity . PL/Vit = total pension liabilities discounted by the firms’ chosen expected rate of return on pension assets, divided by market value of equity .
PLM/Vit= to tal pension l iabilities discounted by the rate applicable for high-grade 1 year UK corporate bonds, divided by market
value of equity . PA/Vit = total actuarial funded pension assets, divided by the market value of equity . PA
M/Vit = Total market value of pension assets disclosed by footnote by employer sponsor for equivalent year, divided by market
value of equity .
NI/Vit = Annual net income of pension fund for year before pension and interest expense (It - It-1)/It-1, divided by the market value of equity . PUT/Vit = put option value to terminate pensions assuming an interest rate equal to firm i’s chosen expected return on pension assets, divided by market value of equity CALL/Vit = call option value to terminate pensions, assuming an interest rate equal to high-grade 1 year corporate bonds, divided
by market value of equity aSignificant at the 0.01 level of significance for one-tail test bSignificant at the 0.05 level of significance for one-tail test
cSignificant at the 0.10 level of significance for one-tail test
36
Figure 1
Comparison of Mean Cumulative Abnormal Returns by event day
Mean Cumulative Abnormal Returns by Event Day
-0.10000
-0.08000
-0.06000
-0.04000
-0.02000
0.00000
0.02000
0.04000
-45
-42
-39
-36
-33
-30
-27-24
-21-18
-15
-12 -9 -6 -3 0 3 6 9
Day
CPE
Market
Low penex
Traditional

37