Embed Size (px)
Citation preview

1
Stock Liquidity and Stock Price Crash Risk*
Xin Chang
Cambridge Judge Business School and Nanyang Business School
Yangyang Chen
The Hong Kong Polytechnic University
Leon Zolotoy
Melbourne Business School
* We thank Michael Chng, Ning Gong, Jarrad Harford, Elaine Hutson, John Lyon, Mark Maffett,
Nadia Massoud, Spencer Martin, participants of the 2014 Auckland Finance Meeting and 2015
Macquarie Global Quantitative Research Conference, and seminar participants at Deakin
University, Monash University, the University of Adelaide, and the University of Melbourne. We
are especially grateful to the editor Hendrik Bessembinder and two anonymous referees for the
insightful comments and suggestions which have significantly improved the paper. We are also
grateful to Hans Stoll and Christoph Schenzler of Vanderbilt University for providing the relative
effective spread data, Brian Bushee for sharing the institutional investor classification data, and
Fotis Grigoris for excellent research assistance.

2
Stock Liquidity and Stock Price Crash Risk
ABSTRACT
We find that stock liquidity increases stock price crash risk. To identify the causal effect, we use
the decimalization of stock trading as an exogenous shock to liquidity. This effect is increasing
in a firm’s ownership by transient investors and non-blockholders. Liquid firms have a higher
likelihood of future bad earnings news releases, which are accompanied by greater selling by
transient investors, but not blockholders. Our results suggest that liquidity induces managers to
withhold bad news, fearing that its disclosure will lead to selling by transient investors.
Eventually, accumulated bad news is released all at once, causing a crash.
JEL Classification: G12; G14; G34.
Keywords: Stock liquidity; Crash risk; Short-termism; Bad news hoarding

3
I. Introduction
Crash risk in security prices has attracted increasing attention in recent years from a broad
spectrum of parties, including academics, practitioners, and legislators. Recent high-profile
corporate scandals (e.g., WorldCom, Enron, Xerox) have triggered a rapidly growing stream of
research that examines the mechanism of stock price crashes. These studies view the
accumulation of bad news (“bad news hoarding”) as the key factor in the formation of a stock
price crash.1
Incentives such as compensation contracts and career concerns induce firm
management to conceal bad news from the market in order to preserve inflated share prices (Ball
(2009), Kothari, Shu, and Wysocki (2009)). As unfavorable information accumulates and
eventually reaches its upper limit, it is revealed at once, leading to large stock price declines.
We examine the relation between stock liquidity and stock price crash risk. Stock liquidity is
generally defined as the ability to trade a significant quantity of a company’s stock at a low cost
in a short time (Holden, Jacobsen, and Subrahmanyam (2014)). Prior research has offered
differing views on the impact of stock liquidity on crash risk. Governance theory suggests that
higher stock liquidity may result in lower crash risk, because it facilitates monitoring of firm
management by blockholders (e.g., Maug (1998), Edmans (2009)). More effective monitoring by
blockholders reduces the likelihood of bad news formation due to inefficient investment
decisions, thereby leading to lower crash risk. Moreover, higher stock liquidity enhances
information production and informed trading (Holmstrom and Tirole (1993), Holden, Jacobsen,
and Subrahmanyam (2014)). As stock prices become more informative about firms’ economic
fundamentals, managers should be less able to accumulate bad news for a substantial period of
time, which, in turn, should lower crash risk.
1 See, e.g., Jin and Myers (2006), Bleck and Liu (2007), Hutton, Marcus, and Tehranian (2009), Benmelech, Kandel,
and Veronesi (2010), Kim, Li, and Zhang (2011a, 2011b), and Callen and Fang (2014). We review the relevant
literature in greater detail in Section II.A.

4
However, a competing viewpoint is that higher stock liquidity results in higher crash risk.
Prior research has advanced two potential mechanisms for this effect. First, short-termism theory
suggests that, due to low trading costs, higher liquidity can attract more transient institutional
investors with short investment horizons and excessive focus on firms’ short-term performance
(Porter (1992), Fang, Tian, and Tice (2014)). To avoid the downward stock price pressure exerted
by these investors, managers may withhold bad news to inflate short-term earnings. Such an
effect will lead to accumulation of bad news over time. Eventually, accumulated bad news is
released all at once, triggering “cutting and running” selling by transient investors and causing a
crash. Second, governance theory also suggests that higher stock liquidity can facilitate
blockholder exit (e.g., Edmans (2009)) when bad news is made public.2 Heavy selling pressure
from blockholders can magnify market responses to negative information about firms and cause
stock prices to plunge.
In sum, prior research has offered competing views as to whether stock liquidity mitigates or
exacerbates crash risk. Therefore, it is ultimately an empirical question as to which effect
prevails. Using a large sample of U.S. firms for 1993–2010, we find strong support for the latter
perspective. We use relative effective spread as our primary measure of stock liquidity (e.g.,
Fang, Noe, and Tice (2009)), and we capture crash risk using the likelihood of extremely low
firm-specific weekly stock returns and negative skewness of stock returns (e.g., Chen, Hong,
and Stein (2001), Hutton, Marcus, and Tehranian (2009)). We document that stocks with higher
liquidity (i.e., lower relative effective spreads) are more susceptible to crash risk, as reflected in a
higher subsequent probability of extremely low returns and more negatively skewed returns. The 2 Note that even though liquidity facilitates monitoring of firm management by blockholders, blockholder exit can
still occur and result in crashes. Specifically, assume that firm value is determined by managerial efforts and
exogenous shocks. Greater liquidity leads to a greater threat of exit and induces managers to exert greater efforts,
leading to more efficient investment decisions and a lower likelihood of bad news formation. However, bad news
can still happen due to negative shocks (e.g. bad industry conditions). Greater liquidity may facilitate blockholders’
exit when bad news comes out, if blockholders are more capable of processing news than other investors.

5
effect is economically meaningful–increasing stock liquidity by one standard deviation increases
the probability of a future stock price crash by 0.027, and raises negative skewness of stock
returns by 0.047. Our results are robust to alternative measures of crash risk and stock liquidity.
We also perform several tests to address endogeneity concerns. Among these tests, we utilize
the decimalization of stock trading as a positive exogenous shock to stock liquidity (e.g., Fang,
Noe, and Tice (2009)). In 2001, the NYSE, AMEX, and NASDAQ began quoting and trading
stocks in decimal increments (as opposed to increments of one-sixteenth of $1). Chordia, Roll,
and Subrahmanyam (2008) show that after decimalization, firms experienced a substantial
increase in stock liquidity. We document a significant increase in crash risk following the year of
decimalization. Additional analysis reveals that the increase in crash risk is more pronounced for
low-priced stocks, the liquidity of which is more affected by decimalization (Edmans, Fang, and
Zur (2013)). To further ensure that the increase in crash risk is driven by decimalization instead
of other confounding events in 2001, we compare the changes in crash risk around 2001 in the
U.S. with those in major non-U.S. markets, which did not experience an event comparable to
decimalization. We find that the change in crash risk is significantly more positive for the U.S.
market. The entirety of these results confirms the causal effect of stock liquidity on crash risk.
Having established the sign of and causality for the stock liquidity-crash risk relation, we
further explore its potential mechanisms. As discussed above, such an effect can occur either
through the transient investor channel (i.e., high stock liquidity exacerbates short-termism-
induced bad news hoarding and subsequent “cutting and running” selling by transient
institutional investors when bad news is released), or through the blockholder channel (i.e., with
higher stock liquidity, blockholders, as informed investors, can sell their holdings more
aggressively upon bad news). Because higher liquidity implies a lower price impact for a given

6
sale volume, both channels implicitly require that in response to bad news releases, the selling
pressure from investors (transient investors or blockholders) must be large enough in order to
have a very negative price impact on liquid stocks.
We conduct several tests to assess the relative importance of the two channels in shaping the
stock liquidity-crash risk relation. Collectively, the findings offer strong support for the transient
investor channel, but not for the blockholder channel. Specifically, we document that the effect
of stock liquidity on crash risk is stronger for firms with a higher proportion of transient
institutional ownership, but not for those with higher blockholder ownership. Further, we find
that crash weeks are characterized by a higher intensity of very bad earnings news releases (e.g.,
extremely low unexpected earnings and/or negative management earnings guidance) than non-
crash weeks, and that higher liquidity is positively associated with the intensity of subsequent
unexpected very bad earnings news releases. These results are consistent with the transient
investor channel, which implies accumulation of bad news over time, until the point when all bad
news is released at once and crash occurs. Finally, we examine the level of institutional selling
during crash weeks, and find it to be higher for firms with higher liquidity. Further analysis
reveals that the positive effect of stock liquidity on abnormal institutional selling during crash
weeks is stronger for firms with higher transient institutional ownership, but not for those with
higher blockholder ownership. This result indicates that the abnormal institutional selling for
liquid stocks during crash weeks is driven primarily by the “cutting and running” exit of transient
institutions, instead of blockholders’ exit. Taken together, our findings imply that stock liquidity
increases crash risk not only because high liquidity increases short-termism pressure and induces
managers to withhold bad news ex ante, but also because it facilitates the exit of transient
institutions, thereby magnifying stock price responses to bad news releases ex post.
7
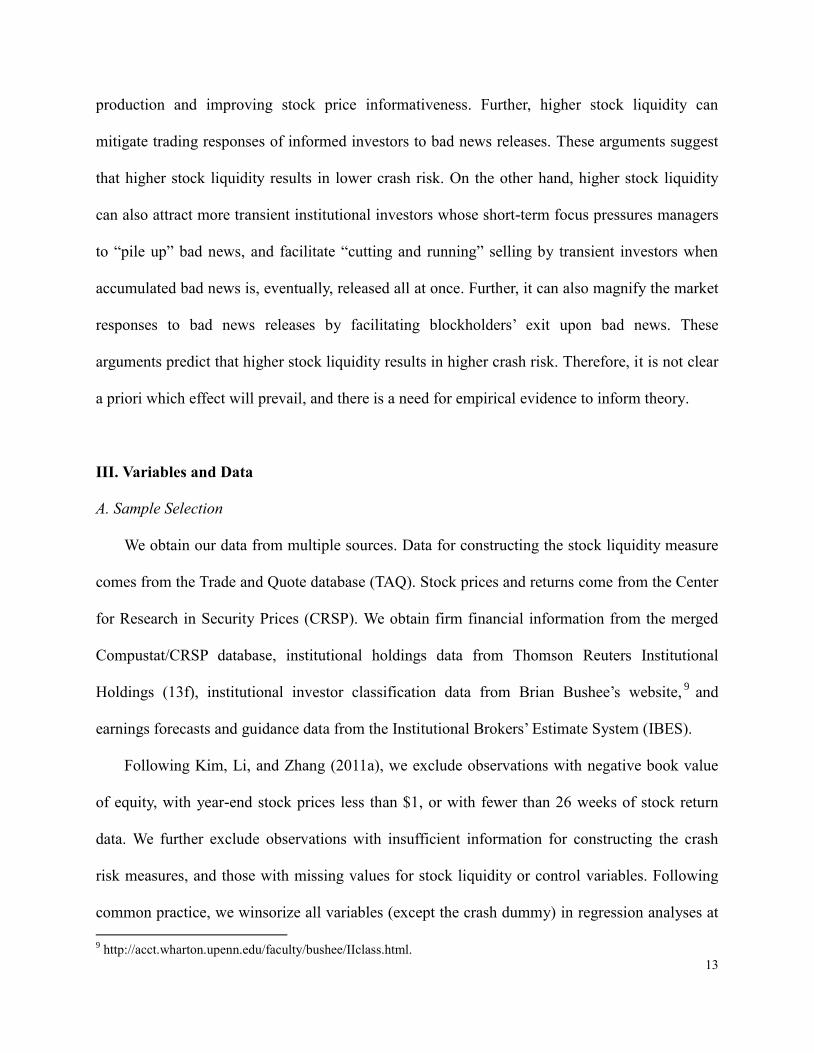
Our paper contributes to the existing literature in several ways. First, we contribute to the
stream of research that examines the determinants of stock price crash risk. There are growing
concerns among academics and legislators that stock liquidity can cause instability in the capital
markets (e.g., O’Hara (2004)).3 Our findings provide firm-level evidence that these concerns are
valid. In this context, our findings should be relevant for regulators, because stock liquidity can
be altered by financial market regulations and securities laws (e.g., O’Hara (2004), Chordia,
Roll, and Subrahmanyam (2008)). Furthermore, identifying stock liquidity as an important
predictor of extreme return outcomes could be useful in risk management applications that focus
on tail events and option pricing (e.g., Berkowitz and O’Brien (2002), Cohen et al. (2014)).
Second, our study extends prior research that examines the effect of stock liquidity on
managerial short-termism. Studies such as Fang, Tian, and Tice (2014) focus primarily on how
liquidity-induced short-term pressures can distort investment decisions. We provide new
evidence from the context of bad news hoarding activities. Such activities avert timely disclosure
of bad news, and can thus avoid disappointing transient institutional investors in the short run.
But they can ultimately result in a “pile up” of bad news, and thus expose firms to higher crash
risk in the long run.
Third, our results contribute to the market microstructure literature that examines the links
between stock liquidity and stock price declines (e.g., Bernardo and Welch (2003), Brunnermeier
and Pedersen (2009)). These studies suggest that substantial declines in stock prices can result in
decreasing liquidity. Our findings imply that causality may also run in the opposite direction
from stock liquidity to stock price crashes.
The remainder of the paper is organized as follows. Section II reviews the relevant literature
3 Specifically, O’Hara (2004, p. 1) points out that “there is debate as to whether liquidity fosters or retards financial
market stability. This divergence reflects a deeper disagreement as to whether liquidity is best viewed as a virtue or a
vice.”

8
and develops our empirical predictions. Section III describes our data, variables, and summary
statistics. Section IV reports our main findings regarding the effect of stock liquidity on crash
risk, while Section V examines its potential mechanisms. Section VI concludes.
II. Related Literature and Empirical Predictions
A. Stock Price Crash Risk: A Brief Review of Prior Research
Corporate managers often possess higher levels of private information about firm operations,
asset values, and future prospects than outside investors. As managers’ decisions to disclose or
conceal their private information are governed by a variety of incentives, their disclosure
preferences are not perfectly aligned with those of outside investors (e.g., Healy and Palepu
(2001), Kothari, Shu, and Wysocki (2009)). In particular, managers may tend to strategically
withhold or delay the disclosure of bad news, gambling that it will ultimately be offset by
subsequent good news. A number of studies suggest this tendency arises from managerial
incentives such as career concerns (Kothari, Shu, and Wysocki (2009)), desire to maintain the
esteem of peers (Ball (2009)), and equity-based incentives (Kim, Li, and Zhang (2011b)).4 The
survey evidence in Graham, Harvey, and Rajgopal (2005) also suggests Chief Financial Officers
(CFOs) delay bad news disclosure in the hope that firm status will improve before the required
release date, which averts the need to disclose unfavorable information to the market.
However, bad news hoarding by firm management engenders crash risk, because the amount
of bad news a manager is willing or able to withhold is limited (Jin and Myers (2006)). As a
sufficiently long run of bad news or bad performance accumulates and reaches a certain tipping
point, managerial incentives for withholding bad news collapse and a large amount of negative
4 For additional analyses of the channels through which equity-based incentives can lead to strategic timing of
corporate news releases, see Aboody and Kasznik (2000), Daines, McQueen, and Schonlau (2014), and Edmans et
al. (2014).

9
firm-specific information comes out in one fell swoop, resulting in a crash.
Several theoretical studies link bad news hoarding to crash risk using an agency theory
framework. Jin and Myers (2006) argue that, when a firm is not completely transparent, its
managers can capture a portion of cash flows in ways not perceived by outside investors. To
protect their jobs, managers may absorb downside risk and losses caused by temporary firm
performance by hiding firm-specific bad news until a crash occurs. Bleck and Liu (2007) argue
that managers may prefer to keep bad projects for private benefits. To prevent investors and
directors from taking timely abandonment actions, they may hide negative information using
historical cost accounting. But the poor performance of bad projects accumulates over time and
eventually materializes, leading to crashes. Using a hidden action model, Benmelech, Kandel,
and Veronesi (2010) show that stock-based compensation induces managers to conceal bad news
about future growth options, which results in inflated stock prices and subsequent crashes.
As these theoretical studies suggest, bad news hoarding and crash risk are driven by the
conflicts of interest between managers and outside investors, which cause managers to hang on
to bad projects or conceal bad performance to benefit themselves at the expense of shareholders.
Consistent with these theoretical arguments, recent empirical studies provide strong support for
the bad news hoarding theory of crash risk.5
B. Stock Liquidity and Crash Risk
Prior research suggests that stock price crash risk can occur when a large amount of bad
news that was previously withheld by firm management is released at once. This implies that
stock liquidity can impact crash risk by affecting one or more of the following three items: the
5 These studies show that factors such as corporate tax avoidance (Kim, Li, and Zhang (2011a)), CFO’s equity
incentives (Kim, Li, and Zhang (2011b)), CEO overconfidence (Kim, Wang, and Zhang (2014)), opaque financial
reports (Hutton, Marcus, and Tehranian (2009)), international financial reporting standards (DeFond et al. (2015)),
and religiosity (Callen and Fang (2014)) are associated with crash risk in a manner consistent with managers’
tendencies to conceal bad news.

10
likelihood of bad news formation (i.e., the likelihood that bad news arises due to managerial
underperformance or a negative shock), the extent of managerial bad news hoarding (i.e.,
whether, once bad news arises, it is released or hoarded by managers), and the strength of the
market response when bad news is revealed. Prior research on stock liquidity has offered two
relevant theories on crash risk: governance theory and short-termism theory. Governance theory
predicts that higher stock liquidity encourages investors’ information production and informed
trading, and enhances large shareholders’ (i.e., blockholders’) incentives and capability to
monitor firms. Short-termism theory predicts that higher stock liquidity attracts transient
investors and induces managers to engage in short-termist behavior. In what follows, we develop
the predictions of these theories regarding the effects of stock liquidity on the three items
associated with crash risk. For convenience, we summarize the predictions in Figure 1.
[Insert Figure 1 about here]
We first discuss the links between stock liquidity and the likelihood of bad news formation.
Governance theory suggests that higher stock liquidity enhances blockholders’ monitoring of
firm management, thus preventing managers from undertaking value-destroying projects. This
reduces the likelihood of bad news formation. For example, Kahn and Winton (1998) and Maug
(1998) show that stock liquidity encourages large shareholders’ intervention through facilitating
the accumulation of shares and increasing profits from intervention.6 A more recent stream of
research emphasizes how stock liquidity can strengthen blockholder governance via exit, namely,
selling a firm’s stock based on private information (e.g., Edmans (2009), Edmans and Manso
(2011)). Because managerial compensation is typically linked to stock prices, ex post, managers
suffer from low stock prices caused by informed blockholders selling shares. Therefore, ex ante,
6
Specifically, higher stock liquidity makes blockholders more able to purchase additional shares (prior to
intervention) at a price that does not yet reflect the benefits of intervention. Consequently, higher stock liquidity
increases blockholder’s profits from intervention, and encourages blockholders’ intervention.

11
the threat of blockholder exit induces managers to act in the best interest of shareholders,
deterring managers from engaging in value-destructive behavior (Admati and Pfleiderer (2009)).
Next, we outline potential interplays between stock liquidity and the extent of bad news
hoarding by firm management. Governance theory predicts that higher stock liquidity alleviates
bad news hoarding. Holmstrom and Tirole (1993) show that the marginal value of information
acquisition goes up with stock liquidity because informed investors can profit from private
information by trading against liquidity traders. Therefore, higher stock liquidity increases
investors’ information production, enhances informed trading, and improves the information
content of stock prices.7 In addition, Edmans (2009) argues that higher stock liquidity encourages
costly information acquisition and more aggressive trading on private information by
blockholders. By making stock prices more informative about firms’ economic fundamentals,
enhanced information discovery and informed trading can weaken managers’ ability to “pile up”
bad news for a substantial period of time.
On the other hand, short-termism theory implies that stock liquidity exacerbates bad news
hoarding by inducing short-termism pressures. Porter (1992) notes that a large percentage of U.S.
institutional investors are transient institutions, chasing short-term price appreciation and exiting
in response to low reported earnings. High liquidity stocks attract transient investors because low
trading costs facilitate their entry and exit (e.g., Fang, Tian, and Tice (2014)). Bushee (1998,
2001) shows that transient institutions tend to favor firms with greater expected short-term
earnings, pressuring managers into an overly short-term focus. In response, short-term-focused
managers may “pile up” bad news to avert the hit to reported earnings and avoid the negative
impact of transient investors’ selling pressure on current stock prices. Consistent with this,
7 Consistent with this, prior studies document that stock liquidity reduces stock mispricing (Chordia, Roll, and
Subrahmanyam (2008), Boehmer and Kelley (2009)), increases the use of equity-based compensation (Jayaraman
and Milbourn (2012)), and reduces reliance on board independence (Ferreira, Ferreira, and Raposo (2011)).

12
Matsumoto (2002) documents that firms with higher transient institutional ownership are more
likely to manage earnings upward to meet earnings targets or exceed analyst forecasts.
Finally, we explore the impact of stock liquidity on the strength of market responses to bad
news. Higher stock liquidity reduces the exit costs for unhappy stockholders (e.g., Bhide (1993)),
and thus amplifies market responses to unfavorable information. The short-termism theory of
stock liquidity implies that higher stock liquidity should magnify the response of transient
institutional investors to bad news releases, inducing a “cutting and running” type of selling that
can lead to crashes. However, governance theory’s predictions about how liquidity impacts
market responses to bad news releases are less clear. To the extent that informed investors trade
primarily on private rather than public information, their trading responses to public bad news
releases should be weak since the news is already incorporated in stock prices, especially when
the bad news is interpreted unambiguously by investors. On the other hand, if information
advantage makes blockholders more capable of processing bad news disclosures than other
investors, we would expect to observe strong stock selling by blockholders upon bad news
releases. Edmans (2009, 2014) shows that stock liquidity facilitates initial block formation and
allows blockholders to trade more aggressively based on their information. As a result,
blockholders’ exit may also amplify the market responses to bad news and cause stock price
crashes.8
To summarize, there are competing predictions regarding the effect of stock liquidity on
crash risk. On the one hand, higher stock liquidity can reduce the likelihood of bad news
formation by enhancing blockholder governance through either intervention or the threat of exit.
It can also constrain managers’ ability to “pile up” bad news by encouraging information
8 It is plausible that if blockholders’ exit is sufficiently strong, it may outweigh the negative effect of stock liquidity
on bad news formation through the threat of exit, thereby turning the relation between stock liquidity and crash risk
into a positive one.
13
production and improving stock price informativeness. Further, higher stock liquidity can
mitigate trading responses of informed investors to bad news releases. These arguments suggest
that higher stock liquidity results in lower crash risk. On the other hand, higher stock liquidity
can also attract more transient institutional investors whose short-term focus pressures managers
to “pile up” bad news, and facilitate “cutting and running” selling by transient investors when
accumulated bad news is, eventually, released all at once. Further, it can also magnify the market
responses to bad news releases by facilitating blockholders’ exit upon bad news. These
arguments predict that higher stock liquidity results in higher crash risk. Therefore, it is not clear
a priori which effect will prevail, and there is a need for empirical evidence to inform theory.
III. Variables and Data
A. Sample Selection
We obtain our data from multiple sources. Data for constructing the stock liquidity measure
comes from the Trade and Quote database (TAQ). Stock prices and returns come from the Center
for Research in Security Prices (CRSP). We obtain firm financial information from the merged
Compustat/CRSP database, institutional holdings data from Thomson Reuters Institutional
Holdings (13f), institutional investor classification data from Brian Bushee’s website,9 and
earnings forecasts and guidance data from the Institutional Brokers’ Estimate System (IBES).
Following Kim, Li, and Zhang (2011a), we exclude observations with negative book value
of equity, with year-end stock prices less than $1, or with fewer than 26 weeks of stock return
data. We further exclude observations with insufficient information for constructing the crash
risk measures, and those with missing values for stock liquidity or control variables. Following
common practice, we winsorize all variables (except the crash dummy) in regression analyses at
9 http://acct.wharton.upenn.edu/faculty/bushee/IIclass.html.
14
both the 1st and 99
th percentiles to mitigate the effect of outliers. Our final sample consists of
58,533 firm-year observations for 9,285 U.S. firms for 1993–2010.
B. Crash Risk Measures
To construct our crash risk measures, we build on Jin and Myers (2006) who define a stock
price crash as a remote, negative outlier in a firm’s residual stock return. Accordingly, we
compute residual stock returns and measure crash risk using two common metrics: the crash
dummy, and negative skewness. Specifically, we first calculate firm-specific weekly returns from
the following expanded index model regression for each firm-year (Hutton, Marcus, and
Tehranian (2009)):
(1) , 0 1 , 1 2 , 1 3 , 4 , 5 , 1 6 , 1 ,i t mkt t ind t mkt t ind t mkt t ind t i tr r r r r r r
where ri,t is the return on stock i in week t, rmkt,t is the return on the CRSP value-weighted market
index, rind,t is the return on the Fama and French’s (1993) value-weighted industry index, and εi,t
is the error term. We include the lead and lag market and industry index returns to account for
non-synchronous trading (Dimson (1979)). Following prior research (e.g., Chen, Hong, and Stein
(2001), Hutton, Marcus, and Tehranian (2009)), we estimate the firm-specific weekly return, Wi,t,
as the natural log of one plus the regression residual (i.e., Wi,t =ln(1+εi,t)). We obtain similar
(untabulated) results by estimating crash risk measures using raw residual returns.
The first measure, crash dummy (CRASH), equals 1 if a firm experiences one or more crash
weeks over the fiscal year, and zero otherwise. Following Hutton, Marcus, and Tehranian (2009),
we define crash weeks as those when a firm experiences firm-specific weekly returns that are
3.09 standard deviations below the mean firm-specific weekly returns over the fiscal year. The
number 3.09 is chosen to generate a 0.1% frequency in the normal distribution. In Section IV.C,
we experiment with alternative definitions of crash weeks and obtain similar results.
15
We compute our second measure, negative skewness (NSKEW), by following Chen, Hong,
and Stein (2001) and Kim, Li, and Zhang (2011a, 2011b). NSKEW for each firm-year is the ratio
of the third moment of firm-specific weekly returns over the standard deviation of firm-specific
weekly returns raised to the third power, and then multiplied by 1, as shown in Equation (2). A
higher value of NSKEW implies a more left-skewed return distribution, and thus a more ‘‘crash-
prone” stock.
(2) 3/ 2 3 2 3/ 2
, . ,[ ( 1) ]/[( 1)( 2)( ) ]i t i t i tNSKEW n n W n n W
C. Stock Liquidity Measure
Our primary measure of stock liquidity, the relative effective spread, is generally considered
to be among the best liquidity measures (e.g., Fang, Noe, and Tice (2009), Fang, Tian, and Tice
(2014)). It is constructed using high-frequency trading data, and is often used as the benchmark
for liquidity measures constructed using low-frequency data (e.g., Hasbrouck, (2009), Goyenko,
Holden, and Trzcinka (2009)). It is the ratio of the absolute value of the difference between the
trade price and the midpoint of the bid-ask quote over the trade price. The data is from Vanderbilt
University's Financial Markets Research Centre which computes daily relative effective spread
for a given stock as the trade-weighted average of the relative effective spreads of all trades for a
given stock during the day, as per TAQ. To obtain the annual relative effective spread, we take
the arithmetic mean of the daily spreads over the firm’s fiscal year. Because a higher relative
effective spread indicates lower stock liquidity, we define stock liquidity (LIQ) as the annual
relative effective spread multiplied by 1. For ease of interpretation, we multiply stock liquidity
by 100. The robustness tests described in Section IV.C show that our findings are robust to
alternative liquidity measures.
16
D. Control Variables
Our selection of control variables follows prior literature. We use stock return volatility
(SIGMA), past stock returns (RET), and past stock turnover (DTURN), because Chen, Hong, and
Stein (2001) show that these variables are positively associated with crash risk. We control for
firm size (SIZE) using market capitalization, and growth opportunities using the market-to-book
ratio (MB) because Chen, Hong, and Stein (2001) and Hutton, Marcus, and Tehranian (2009)
find that these two variables are positively correlated with crash risk. We further control for
leverage (LEV) and return on assets (ROA), because Hutton, Marcus, and Tehranian (2009)
document their negative correlations with crash risk. We include discretionary accruals (ACCM)
as Hutton, Marcus, and Tehranian (2009) show that firms with higher levels of ACCM are more
prone to crashes.10
Finally, we control for lagged NSKEW since Chen, Hong, and Stein (2001)
find that stock return skewness is persistent over time. Detailed definitions of these variables are
in Appendix A.
E. Descriptive Statistics
Table 1 reports the number of observations by year, as well as the mean values of crash
dummy, negative skewness, stock liquidity, and firm-specific stock returns on crash weeks for
each year. The mean crash dummy (the proportion of firms experiencing at least one crash over
the year) is higher during the 2000s than in the 1990s, possibly because of the dot-com bubble
burst and the recession of 2008–2009. A similar trend is observed for mean negative skewness.
Mean stock liquidity increased from -1.21 in 1993 to -0.345 in 2010, suggesting a substantial
improvement in market liquidity over our sample period. The mean firm-specific weekly stock 10
Based on these results, Hutton, Marcus, and Tehranian (2009) conclude that opacity of firm’s financial statements
allows managers to obscure negative information about underlying fundamentals. However, since financial
statement’s bottom line is only one of many ways of conveying information (Lambert, 2010), managers may use a
variety of methods other than managing firm’s accruals to withhold bad news from investors (Kim, Li, and Zhang
(2011b)).

17
return on crash weeks is -24.7%. Furthermore, (untabulated) results show that 95% of firms in
our sample that experienced stock price crashes had firm-specific returns lower than or equal to -
7.8% during crash weeks. These observations suggest that our crash risk definition captures
substantially negative events for firms’ stock prices.
[Insert Table 1 about here]
Table 2 presents the summary statistics and the Pearson correlation matrix of variables.
Panel A shows that, on average, 18.8% of firm-years in our sample experience one or more crash
weeks during the fiscal year. This and other summary statistics are generally in line with those
reported in prior research (e.g., Hutton, Marcus, and Tehranian (2009), Kim, Li, and Zhang
(2011a, 2011b)). Panel B shows that the two crash risk measures are significantly correlated.
Moreover, both crash dummy and negative skewness are positively correlated with stock
liquidity.
[Insert Table 2 about here]
IV. Stock Liquidity and Crash Risk: Main Results
A. Univariate Analysis
We begin by plotting crash dummy and negative skewness against stock liquidity. First, we
divide the entire sample into deciles by one-year lagged stock liquidity. We then calculate the
mean values of the two crash risk measures for each liquidity decile. Finally, we plot the mean
values against deciles from lowest to highest. Panel A of Figure 2 shows an increasing trend in
the crash dummy as liquidity increases. We observe a similar trend for negative skewness. For
both measures, the difference between the mean values of crash risk for firms in the 1st versus
10th
deciles of stock liquidity is statistically significant (smallest t-statistic = 13.90).

18
Because stock liquidity in our sample is significantly correlated with firm size, we repeat
our analysis using residual stock liquidity deciles to ensure that the pattern in Panel A is not
driven by the high correlation between stock liquidity and firm size. Residual stock liquidity is
the regression residual of stock liquidity against firm size (SIZE). The graph presented in Panel B
of Figure 2 shows that both crash risk measures increase monotonically with residual stock
liquidity. The difference between the mean values of crash risk for the firms in the 1st versus 10
th
deciles is statistically significant (smallest t-statistic = 10.66). Collectively, these findings
provide preliminary evidence for the positive relation between stock liquidity and crash risk.
Although interesting, these unconditional relations require more refined multivariate tests, which
we turn to next.
[Insert Figure 2 about here]
B. Regression Analysis
In this section, we perform regression analyses to examine the relation between stock
liquidity and crash risk. The regression specifications are as follows:
(3a) , 0 1 , 1 2 , 1 3 , 1 4 , 1 5 , 1
6 , 1 7 , 1 8 , 1 9 , 1 10 , 1 ,
i t i t i t i t i t i t
i t i t i t i t i t t i i t
CRASH LIQ NSKEW SIGMA RET DTURN
SIZE MB LEV ROA ACCM Yr Ind
(3b) , 0 1 , 1 2 , 1 3 , 1 4 , 1 5 , 1
6 , 1 7 , 1 8 , 1 9 , 1 10 , 1 ,
i t i t i t i t i t i t
i t i t i t i t i t t i i t
NSKEW LIQ NSKEW SIGMA RET DTURN
SIZE MB LEV ROA ACCM Yr Ind
Here, i denotes the firm, t denotes the year, Yrt denotes the year fixed-effects, Indi denotes the
industry fixed-effects based on two-digit SIC codes, and εi,t is the error term. We estimate
Equation (3a) using the logit model and Equation (3b) using ordinary least squares (OLS). Both
z- and t-statistics are computed using standard errors adjusted for heteroskedasticity and
clustering at the firm level. Because all explanatory variables are lagged one year, the sample
size for these tests is reduced from 58,533 (as in Table 1) to 48,176 observations.
19
Table 3 gives the baseline regression results. Column (1) shows the results for crash dummy.
The coefficient of stock liquidity is positive and statistically significant (z-statistic = 7.439),
suggesting that firms with higher liquidity are more likely to experience a stock price crash in the
future. The marginal effect of stock liquidity on crash dummy (evaluated at the mean values of
the explanatory variables) is 0.033, suggesting that a one-standard-deviation rise in stock
liquidity (i.e., 0.826) is associated with a 0.826 × 0.033 = 0.027 increase in crash probability.
Given that our sample mean of crash dummy is 0.188, the effect of stock liquidity on crash risk
is not only statistically significant, but also economically meaningful.
[Insert Table 3 about here]
Column (2) shows the results for negative skewness. The coefficient of stock liquidity is
positive and statistically significant (t-statistic = 9.008), which suggests that future stock returns
of firms with higher liquidity are, on average, more negatively skewed. In terms of economic
significance, increasing stock liquidity by one standard deviation (0.826) raises negative
skewness by 0.826 × 0.057 = 0.047. To put this in perspective, a one-standard-deviation increase
in MB, which has been shown by prior studies (e.g., Cheng, Hong, and Stein (2001)) to be one of
the most important determinants of crash risk, increases negative skewness by 4.478 × 0.004 =
0.018. Overall, these findings further confirm a positive and significant association between
stock liquidity and crash risk.
The results for control variables are largely consistent with prior literature. Specifically,
crash risk is positively associated with past stock returns, stock turnover, MB, stock return
volatility, and discretionary accruals. It is negatively correlated with firm profitability.
Untabulated statistics show that the largest variance inflation factor (VIF) is below 5, suggesting
that multicollinearity does not pose a serious problem in our setting (O'Brien (2007)).

20
C. Robustness Tests
We conduct further analyses to ensure our baseline results are robust to alternative model
specifications and variable definitions. We report the results in Table 4. For brevity, we only
tabulate the coefficients of stock liquidity.
We begin by considering alternative measures of crash risk, and conduct three sets of
analyses. In the first set, we use alternative firm-specific thresholds to identify crash weeks. The
purpose is to mitigate the concern that our results may be driven by a particular threshold (3.09
standard deviations) used in defining crash risk dummy. Specifically, we define crash weeks as
those weeks during which a firm experiences firm-specific weekly returns that are 3.5, 4, or 4.5
standard deviations below the mean firm-specific weekly returns over the fiscal year. In the
second set, we use general instead of firm-specific thresholds to identify crash weeks. Firm-
specific thresholds are subject to the concern that, for example, 3.09 standard deviations below
mean returns may not be economically significant enough to be a crash for stocks with low
volatility. To mitigate this concern, we alternatively define crash weeks as those during which
firms experience firm-specific weekly returns that are below -10%, -15%, or -20%. Finally, we
consider the number of crash weeks within a fiscal year as an alternative measure of crash risk.
While crash dummy has been widely used in prior research (e.g., Hutton, Marcus, and Tehranian
(2009), Kim, Li, and Zhang (2011a, 2011b)), it is expected to have less variation in the
outcomes—and thus, to be less informative— than the number of crash weeks over a fiscal year.
However, our (untabulated) results indicate that the number of observations with more than one
crash week is very small (less than 0.6% of the sample), consistent with the notion that crash
dummy captures a rare negative stock event. Thus, using the number of crashes within a year as
the dependent variable in the OLS regression is empirically very similar to estimating a binary
21
choice model using crash dummy as the dependent variable. Nevertheless, for completeness we
re-estimate Equation 3(a) using OLS and using the number of crashes as the dependent variable.
The results of these tests are tabulated in Panel A of Table 4. For each test, the coefficient for
stock liquidity is positive and significant (smallest z-statistic for the crash dummy = 6.869, and
the t-statistic for the number of crashes = 7.648), suggesting that our findings are robust to
alternative measures of crash risk.
Next, we consider the possibility that the documented stock liquidity-crash risk relation is
driven by our choice of stock liquidity measure. To alleviate this concern, we consider the
following alternative measures of stock liquidity: Amihud’s (2002) price impact measure,
Hasbrouck’s (2009) implicit bid-ask spread measure, and Lesmond’s (2005) percentage of zero
daily returns measure.11
We again multiply each measure by 1 so that higher values imply
higher liquidity. The results are in Panel B of Table 4. The coefficient of stock liquidity is
positive and significant for each liquidity measure in both crash dummy and negative skewness
regressions (smallest z-statistic = 6.439, and smallest t-statistic = 7.508). This suggests our
findings are robust across alternative measures of stock liquidity.
[Insert Table 4 about here]
For completeness, we conduct several additional (untabulated) tests. The results show that
our findings are robust to using down-up volatility as an alternative measure of crash risk (Chen,
Hong, and Stein (2001)),12
excluding the recent financial crisis (2008–2009) to address the
11
Amihud’s (2002) price impact measure captures the stock price changes per $ millions of trading volume. The
implicit bid-ask spread is the Gibbs sampler estimate of the square root of the negative daily autocorrelation of
individual stock returns. Implicit bid-ask spread data is from Joel Hasbrouck's homepage:
http://people.stern.nyu.edu/jhasbrou/Research/. The percentage of zero daily returns is the number of trading days
with zero daily returns and positive trading volume, divided by the number of trading days over the fiscal year. 12
We calculate the down-up volatility measure as per Chen, Hong, and Stein (2001). For each firm-year, we divide
weeks into “down” (weeks with firm-specific returns below the annual mean) and “up” (those with firm-specific
returns above the annual mean). We then calculate the standard deviation of firm-specific weekly returns for the two
subsamples separately, and define down-up volatility as the log of the ratio of standard deviation on down weeks to

22
concern that our results may be driven by the excess market volatility during that period, and
using the post-SOX sample period (2003-2010) to control for changes in the regulatory
environment (Hutton, Marcus, and Tehranian (2009)).
D. Endogeneity
While we document a strong positive association between stock liquidity and crash risk, the
results are potentially subject to endogeneity arising from either omitted variables, or reverse
causality running from crash risk to liquidity. We perform several tests to alleviate these
concerns. In Panel C of Table 4, we augment our baseline regression models by including firm
fixed effects to account for potential firm-specific time-invariant omitted variables. We obtain
qualitatively similar results. Next, we modify our baseline regression models by including a set
of additional control variables that could be correlated with both stock liquidity and crash risk.
We control for high-frequency trading to mitigate the concern that its rise in recent years could
affect both stock liquidity and crash risk. We follow Zhang (2010) in constructing this measure.
We also control for the effects of tax avoidance and executive equity incentives on crash risk (as
documented by Kim, Li, and Zhang (2011a, 2011b)). We include the estimated probability of
engaging in a tax shelter based on Wilson’s (2009) prediction model, and CFO option sensitivity
to stock price changes estimated following Core and Guay (2002).13
Prior research suggests that
managers’ propensity to hoard bad news — and thus crash risk — could be related to firms’
corporate governance and auditor characteristics (Beasley (1996), Dunn and Mayhew (2004)).
Therefore, we include board independence, the CEO duality dummy, the big auditor dummy, and
that on up weeks. The coefficient of stock liquidity remains positive and significant (t-statistic = 9.681). 13
We control for CFO option incentives following Kim, Li, and Zhang (2011b). They show that CFO option
incentives dominate CEO option incentives in determining future crash risk and conclude that CFOs are more
influential in firms' bad news hoarding decisions. As a robustness test, we include CEO (rather than CFO) option
sensitivity to stock price changes as an additional control. The results (untabulated) remain qualitatively the same.
23
the auditor industry specialization dummy as additional controls.14
Furthermore, we include a
high litigation industry membership dummy to control for litigation risk (Matsumoto (2002)),
and a KMV distance-to-default measure constructed as per Bharath and Shumway (2008) to
control for financial distress risk. Because of missing values for these additional controls, we
perform our analysis with a much smaller sample of 7,674 firm-year observations. Our main
results, however, are unaffected.
To further address endogeneity concerns, we follow prior studies (e.g., Fang, Noe, and Tice
(2009), Bharath, Jayaraman, and Nagar (2013)) and use a decimalization event as a quasi-natural
experiment. On January 29, 2001, the NYSE and AMEX began quoting and trading stocks in
decimal increments (as opposed to increments of one-sixteenth of $1). The NASDAQ also
changed its tick size to decimals between March 12, 2001 and April 9, 2001. Prior research (e.g.,
Chordia, Roll, and Subrahmanyam (2008)) shows that decimalization resulted in increase in
stock liquidity, making it an appealing framework to examine the effect of stock liquidity on
crash risk.
We examine the changes in crash risk around decimalization using regression analysis. We
rely on firms for which data is available for both the fiscal year before and the fiscal year after
decimalization. The post-shock dummy (POST) equals 1 for the fiscal year after the
decimalization, and zero for the fiscal year before the event. The regression models are estimated
as follows.
4(a) , 0 1 , 2 , 1 3 , 1 4 , 1 5 , 1
6 , 1 7 , 1 8 , 1 9 , 1 10 , 1 ,
i t i t i t i t i t i t
i t i t i t i t i t i i t
CRASH POST NSKEW SIGMA RET DTURN
SIZE MB LEV ROA ACCM Ind
14
Board independence is the proportion of independent directors on a board. The CEO duality dummy equals 1 if
the CEO is also the chairman of the board, and 0 otherwise. The big auditor dummy equals 1 if the company is
audited by one of the big auditors, and 0 otherwise. The actual number of big auditors has varied over time from
eight during the 1980s, to four currently due to mergers and the dissolution of Arthur Andersen. The auditor industry
specialization dummy equals 1 if the firm is audited by an industry specialist auditor, defined as the auditor with the
largest market share among all auditors in the firm’s two-digit SIC industry code.
24
4(b) , 0 1 , 2 , 1 3 , 1 4 , 1 5 , 1
6 , 1 7 , 1 8 , 1 9 , 1 10 , 1 ,
i t i t i t i t i t i t
i t i t i t i t i t i i t
NSKEW POST NSKEW SIGMA RET DTURN
SIZE MB LEV ROA ACCM Ind
The notations are the same as in Equations (3a) and (3b). We report the results in Panel A of
Table 5. Column (1) gives results for crash dummy, and Column (2) for negative skewness. For
each measure, the coefficient for the post-shock dummy is positive and significant (z-statistic =
2.434 and t-statistic = 4.136, respectively), suggesting that crash risk has increased in response to
the liquidity-increasing shock.
However, an increase in crash risk may be capturing the effects of other market-wide
confounding events in 2001, rather than the effect of decimalization per se. To address this
concern, we conduct two tests. In the first test, we adopt an identification approach suggested by
Edmans, Fang, and Zur (2013), who note that moving from $1/16 to $1/100 increments is a
greater proportional change for—and thus, should have a greater effect on—liquidity of low-
priced stocks. Consistent with this, they document that decimalization has a stronger effect on
the liquidity of low-priced stocks. We create a low price dummy (LOWPRC) that is equal to one
if a firm's closing stock price in the fiscal year prior to the decimalization was below the sample
median, and zero otherwise. Next, we modify Equations 4(a) and 4(b) to include LOWPRC and
the interaction term between POST and LOWPRC. We report the results in Panel A of Table 5.
Column (3) gives results for crash dummy, and Column (4) for negative skewness. For each
measure, the coefficient of the interaction term between POST and LOWPRC is positive and
significant (z-statistic = 2.620 and t-statistic = 3.451, respectively), suggesting that an increase in
crash risk following decimalization was more pronounced for the low-priced stocks. These
findings confirm that the crash risk increase was attributable to decimalization.15
15
We perform several additional analyses (untabulated) to ensure the robustness of our results. None of the
following has a major effect on regression results: including firm fixed instead of industry fixed effects in Equations

25
[Insert Table 5 about here]
In the second test, we compare the changes in crash risk around 2001 in the U.S. with those
in major non-U.S. markets, which did not experience an event comparable to decimalization. We
expect the changes in crash risk to be more positive for the U.S. market.16
The results are
reported in Panel B of Table 5. For the U.S. market, the mean crash dummy increased by 0.044
and the mean negative skewness increased by 0.118. For the non-U.S. markets, the average
change in the mean crash dummy was 0.012 and the average change in the mean negative
skewness was 0.037. More importantly, the difference between the change in crash risk in the
U.S. market and that in the non-U.S. markets is positive and statistically significant for both
measures of crash risk (t-statistics are 1.701 and 2.392 for crash dummy and negative skewness,
respectively). We obtain similar (untabulated) results using median values. Overall, these
findings are consistent with the view that the increase in crash risk around 2001 is driven by
decimalization. Taken together, the totality of the evidence from our identification tests suggests
a positive causal relation running from stock liquidity to stock price crash risk.
V. Stock Liquidity and Crash Risk: Which Channel Matters?
Our baseline results suggest that higher stock liquidity leads to higher crash risk. As
discussed in Sections I and II, such an effect can occur through the transient investor channel or
through the blockholder channel. In this section, we develop several tests to evaluate which
channel is more important in driving the stock liquidity-crash risk relation.
4(a) and 4(b); using the number of crash weeks (instead of crash dummy) as the dependent variable in Columns (1)
and (3) of Table 5; and examining a different positive shock to liquidity, the change in minimum tick size from $1/8
to $1/16 in 1997 by the NYSE, AMEX, and NASDAQ (Fang, Tian, and Tice (2014)). 16
We obtain the data used to construct crash risk measures for non-U.S. markets from Compustat Global and
Datastream. Non-U.S. markets include Germany, France, Great Britain, Japan, and Italy.
26
A. Institutional Ownership and the Liquidity-Crash Relation
The transient investor channel suggests that stock liquidity encourages the “cutting and
running” type of selling by transient institutional investors upon bad news disclosures. This, in
turn, may induce managers to withhold bad news, resulting in bad news accumulation and,
consequently, an increased probability of a future crash. Thus, if the transient investor channel
plays an important role in shaping the positive liquidity-crash relation, the effect of stock
liquidity on future crash risk should be more pronounced for firms with a higher proportion of
transient institutional ownership. In contrast, if liquidity influences crash risk mainly through the
blockholder channel, the liquidity-crash relation should be stronger when blockholder ownership
is higher.
Prior studies suggest that institutional investors are a generally heterogeneous class, with
many different types of investors who have differing investment horizons and monitoring
intensities. We categorize institutions in two ways to account for this heterogeneity. We first
categorize institutions as either transient (TRAIO) or non-transient (NONTRAIO) by following
Bushee (1998), who classifies institutional investors using a factor analysis based on
characteristics of past behavior (e.g., portfolio turnover, diversification, and momentum trading).
Transient institutions are characterized as having high portfolio turnovers, highly diversified
portfolio holdings, and a strong interest in short-term trading profits. Non-transient institutions
include quasi-indexer and dedicated institutions, which are characterized as having low portfolio
turnovers, monitoring firm management intensely, and relying on information beyond current
earnings to assess managers’ performance (e.g., Gaspar, Massa, and Matos (2005), Fang, Tian,
and Tice (2014)).17
Second, we partition institutions into blockholders and non-blockholders.
17
Quasi-indexers differ from dedicated institutions in that the former hold highly diversified portfolios and generally
follow indexing and buy-and-hold investing strategies, while the latter have a high stockholding concentration and

27
Following prior research (e.g., Roosenboom, Schlingemann, and Vasconcelos (2014)), we define
blockholders (BLOCK) as institutions that own more than 5% of a firm’s shares outstanding, and
non-blockholders (NONBLOCK) as the remaining institutions. Edmans and Manso (2011) and
Roosenboom, Schlingemann, and Vasconcelos (2014) argue that blockholders are typically
dedicated and long-term-oriented institutional investors that monitor management via their threat
of exit. They posit that non-blockholders consist mainly of short-term-oriented institutions that
do not actively monitor or gather information.
Table 6 shows our regression results. As a preliminary analysis, we first examine the effect
of total institutional ownership on the stock liquidity-crash risk relation. We define total
institutional ownership (IO) as the number of shares held by all institutional investors, divided by
the total shares outstanding. In Panel A, we augment our baseline models by adding total
institutional ownership and its interaction with stock liquidity. The coefficient of the interaction
term is positive and significant in the crash dummy regression, and positive but insignificant in
the negative skewness regression. These results provide some evidence that higher institutional
ownership increases the positive effect of stock liquidity on crash risk.
Next, to explore which type of institutions drives the documented effect, Panel B
decomposes total institutional ownership into transient and non-transient, and interacts each
ownership variable with stock liquidity. The results show that the coefficients of the interaction
term between stock liquidity and transient institutional ownership are positive and statistically
significant in both regressions (z-statistic = 2.186 and t-statistic = 2.535, respectively). This
suggests that the effect of stock liquidity on future crash risk is stronger for firms held by more
undertake more of a "relationship investing" role (Porter (1992)). Similar to dedicated institutions, however, quasi-
indexers are long-term-oriented. Recent studies show that they exert influence through proxy voting and by
facilitating other blockholders’ activism (e.g., Appel, Gormley, and Keim (2015), Mullins (2014)). Untabulated
robustness checks show our results are unaffected if we exclude quasi-indexers from non-transient institutions.
28
transient institutions, consistent with the transient investor channel. On the other hand, the
interaction terms between stock liquidity and non-transient institutional ownership are
insignificant in both regressions, suggesting that long-term-oriented institutions have no
discernible impact on the liquidity-crash relation.18
Panel C divides total institutional ownership into block and non-block ownership, and
interacts them separately with stock liquidity. The results show that the interaction terms
between stock liquidity and block ownership are insignificant. Thus, we find no evidence that the
strength of the stock liquidity-crash risk relationship varies with the level of block ownership. In
contrast, the coefficients of the interaction term between stock liquidity and non-block ownership
are positive and significant in both regressions (z-statistic = 1.703 and t-statistic = 4.973,
respectively). This suggests that the effect of liquidity on crash risk is stronger when firms are
held by more non-blockholders, who are typically viewed as short-term-oriented investors. These
findings provide further support for the transient investor channel, but not for the blockholder
channel.
[Insert Table 6 about here]
B. Stock Liquidity and Future Bad News Releases
Our second set of tests revolves around the link between stock liquidity and the intensity of
bad news releases during crash weeks. Recall that transient investor channel implies
accumulation of bad news over time, until the point when all bad news is released at once and
crash occurs. Thus, if the documented liquidity-crash risk relation occurs through the transient
investor channel, we should observe a higher intensity of very bad news releases during crash
18
As robustness tests, we classify institutional investors as short- or long-term using alternative measures of investor
horizons proposed by Yan and Zhang (2009) and Derrien, Kecskes, and Thesmar (2013). We sort all institutional
investors based on their average churn rate (i.e., portfolio turnover) over the past four quarters, as per Yan and Zhang
(2009), and based on the fraction of their portfolios turned over during the past twelve quarters, as per Derrien,
Kecskes, and Thesmar (2013). The (untabulated) results are qualitatively the same.
29
weeks than non-crash weeks. Further, and more importantly, we should observe a positive
association between stock liquidity and the subsequent probability of unexpected very bad news
releases. On the other hand, the blockholder channel implies a negative association between
stock liquidity and the subsequent probability of unexpected very bad news releases. This is
because higher liquidity enhances blockholders’ monitoring of firm management, which
dissuades management underperformance to begin with, and encourages blockholders to gather
information and trade on it, which limits manager’s ability to “pile up” bad news.
For intensity of bad news releases, we examine whether the magnitude of negative
unexpected earnings and the frequency of negative managerial earnings guidance are higher
during crash weeks than non-crash weeks for both quarterly and annual earnings. We first
identify firms that experienced crashes and announced earnings or released earnings guidance
during crash weeks, and label them as crash firms. We then match each crash firm with a control
firm that also announced earnings or released earnings guidance during the crash firm’s crash
week, but did not experience a crash. The control firm is matched using propensity scores based
on industry, market capitalization, and the market-to-book ratio in the previous month. Finally,
for both crash and control firms, we compute unexpected earnings (UE), or the proportion of
each type of earnings guidance (described below), and compare mean values across the two
samples.
We estimate quarterly unexpected earnings as a firm’s net income in the current quarter
minus its net income for the same quarter in the previous fiscal year, scaled by its lagged market
value of equity (Livnat and Mendenhall (2006)). We estimate annual unexpected earnings as a
firm’s income before extraordinary items in the current year minus its income before
extraordinary items in the previous fiscal year, scaled by its lagged market value of equity

30
(Kothari, Lewellen, and Warner (2006)).
We classify earnings guidance into four categories: Shortfall, Meet, Beat, and Other.
Shortfall refers to the announcement that the firm is not expected to meet the earnings target (that
is, management’s prior expectation of earnings for the period). Meet means the firm will meet the
target. Beat means the firm is expected to beat the target. Other means the firm provided earnings
guidance, but did not specify its expectations precisely.
We report the comparison results in Panel A of Table 7. The mean quarterly unexpected
earnings for crash firms is negative and significant at the 1% level. In contrast, the mean
unexpected earnings for control (non-crash) firms is not significantly different from zero. The
difference between the two means is negative (-0.010) and significant at the 1% level (t-statistic
= -4.132). The mean quarterly Shortfall for crash firms is 0.656 versus 0.309 for non-crash firms,
and the difference is significant (t-statistic = 18.550). During crash weeks, crash firms also have
significantly lower frequencies of meeting or beating earnings targets than non-crash firms. The
results are qualitatively similar for the annual items. Collectively, these results suggest that a
typical crash firm is characterized by a higher intensity of bad news releases than a non-crash
firm.
Next, we examine whether higher stock liquidity is associated with a higher or lower
subsequent probability of unexpected very bad news releases. To that end, we construct two
variables, SURP_UE and SURP_G. SURP_UE is a dummy variable that equals one if the firm’s
unexpected earnings in the current fiscal year are in the bottom decile and its unexpected
earnings in the previous fiscal year are non-negative, and zero otherwise. SURP_G is a dummy
variable that equals one if a firm issued a Shortfall guidance in the current fiscal year but not in
the previous fiscal year, and zero otherwise. The idea behind these variables is to identify firms

31
for which the release of very bad news was not expected based on firms’ prior announcements,
and thus came as a surprise to the market. We then estimate the following regressions using the
logit model:
5(a)
, 0 1 , 1 2 , 1 3 , 1 4 , 1
5 , 1 6 , 1 7 , 1 8 , 1 9 , 1
10 , 1 ,
_ i t i t i t i t i t
i t i t i t i t i t
i t i t i t
SURP UE LIQ NSKEW SIGMA RET
DTURN SIZE MB LEV ROA
ACCM Ind Year
5(b)
, 0 1 , 1 2 , 1 3 , 1 4 , 1
5 , 1 6 , 1 7 , 1 8 , 1 9 , 1
10 , 1 ,
_ i t i t i t i t i t
i t i t i t i t i t
i t i t i t
SURP G LIQ NSKEW SIGMA RET
DTURN SIZE MB LEV ROA
ACCM Ind Year
We use the same control variables as in Equations (3a) and (3b). The results are in Panel B of
Table 7. Column (1) shows results for the SURP_UE dummy; Column (2) shows results for the
SURP_G dummy. For each variable, the coefficient for stock liquidity is positive and significant
(smallest z-statistic = 5.293). The results suggest that stock liquidity is positively associated with
the subsequent probability of unexpected very bad news releases.
[Insert Table 7 about here]
Collectively, the results in Table 7 indicate that crash weeks are characterized by a higher
intensity of bad news releases than non-crash weeks, and that the subsequent probability of
unexpected very bad news releases is higher for firms with higher stock liquidity. These findings
provide further support for the transient investor channel, but are inconsistent with the
blockholder channel.
C. Stock Liquidity and Institutional Selling on Crash Weeks
In our last set of tests, we explore whether stock liquidity leads to higher institutional selling
on crash weeks, and if it does, which type of exit - the “cutting and running” type of exit by
transient institutions or blockholders’ exit - drives the institutional selling on crash weeks. Both
32
the transient investor channel and the blockholder channel suggest that higher stock liquidity
facilitates institutional selling when bad news about a firm is revealed. However, the difference
lies in which type of institutions primarily contribute to the enhanced selling pressures. The
“cutting and running” exit occurs when transient institutions reduce their stakes in a firm in
response to bad news disclosures. Blockholders’ exit occurs when blockholders use their
information advantage to make trading profits based on bad news disclosures.
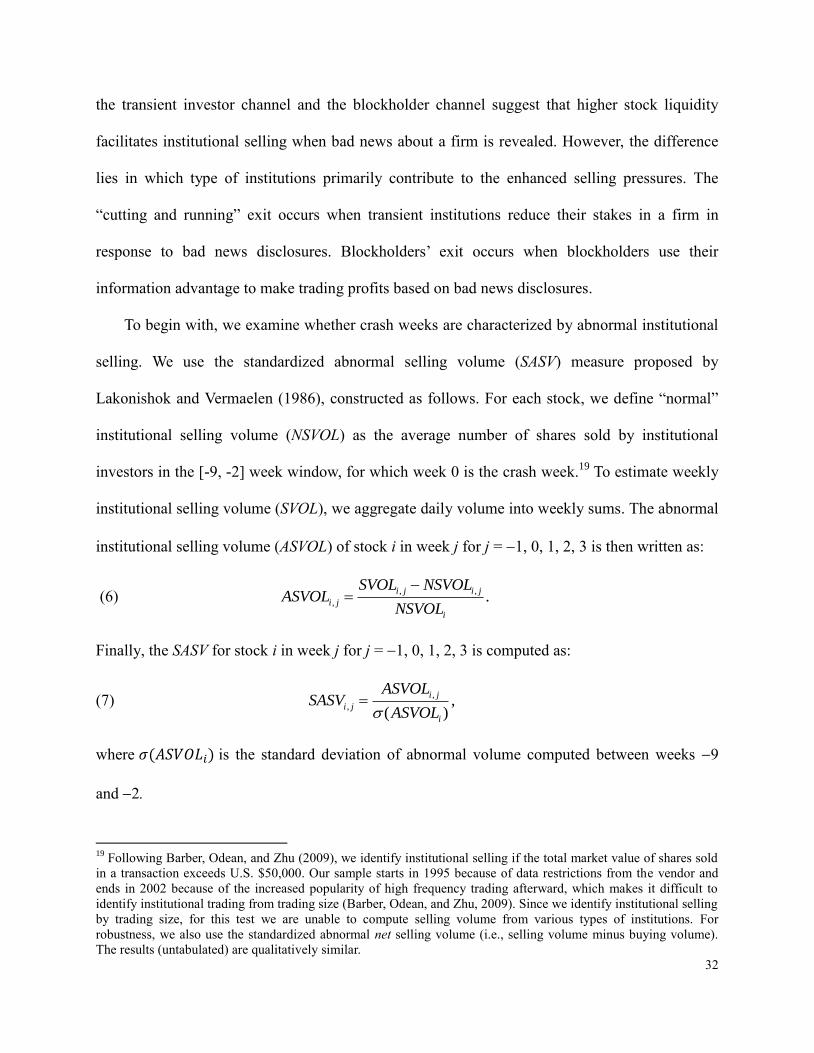
To begin with, we examine whether crash weeks are characterized by abnormal institutional
selling. We use the standardized abnormal selling volume (SASV) measure proposed by
Lakonishok and Vermaelen (1986), constructed as follows. For each stock, we define “normal”
institutional selling volume (NSVOL) as the average number of shares sold by institutional
investors in the [-9, -2] week window, for which week 0 is the crash week.19
To estimate weekly
institutional selling volume (SVOL), we aggregate daily volume into weekly sums. The abnormal
institutional selling volume (ASVOL) of stock i in week j for j = 1, 0, 1, 2, 3 is then written as:
(6) , ,
, .i j i j
i j
i
SVOL NSVOLASVOL
NSVOL
Finally, the SASV for stock i in week j for j = 1, 0, 1, 2, 3 is computed as:
(7) ,
, ,( )
i j
i j
i
ASVOLSASV
ASVOL
where 𝜎(𝐴𝑆𝑉𝑂𝐿𝑖) is the standard deviation of abnormal volume computed between weeks 9
and 2.
19
Following Barber, Odean, and Zhu (2009), we identify institutional selling if the total market value of shares sold
in a transaction exceeds U.S. $50,000. Our sample starts in 1995 because of data restrictions from the vendor and
ends in 2002 because of the increased popularity of high frequency trading afterward, which makes it difficult to
identify institutional trading from trading size (Barber, Odean, and Zhu, 2009). Since we identify institutional selling
by trading size, for this test we are unable to compute selling volume from various types of institutions. For
robustness, we also use the standardized abnormal net selling volume (i.e., selling volume minus buying volume).
The results (untabulated) are qualitatively similar.

33
Figure 3 depicts the mean SASV during weeks 1, 0, 1, 2, and 3 across all firms that
experienced a stock price crash. The results show a positive and significant spike in mean SASV
during week 0 (t-statistic = 2.340). The mean values are not significantly different from zero for
weeks 1, 1, 2, and 3 (largest t-statistic = 0.961). These results suggest that crash weeks are
characterized by abnormal institutional selling activity.
[Insert Figure 3 about here]
Next, we examine whether the abnormal institutional selling during crash weeks is stronger
for higher liquidity firms. We estimate the following regression model:
(8)
, 0 1 , 1 2 , 1 3 , 1 4 , 1
5 , 1 6 , 1 7 , 1 8 , 1 9 , 1
10 , 1 ,
.
i t i t i t i t i t
i t i t i t i t i t
i t i t i t
SASV LIQ NSKEW SIGMA RET
DTURN SIZE MB LEV ROA
ACCM Ind Year
We use the same control variables as in Equations (3a) and (3b). The results in Column (1) of
Table 8 show that the coefficient for stock liquidity is positive and significant (t-statistic =
8.056). This suggests that, on average, the abnormal institutional selling activity during crash
weeks is more intense for firms with higher stock liquidity. These results indicate that
institutional selling plays an important role in driving the stock liquidity-crash risk relation.
As discussed above, higher stock liquidity may facilitate institutional selling by enhancing
the response of transient institutional investors to bad news releases (“cutting and running”), or
by facilitating blockholders’ exit. Thus, finally we attempt to identify which type of exit
predominantly drives the relation between stock liquidity and abnormal institutional selling
during crash weeks.
We report the results for these tests in Columns (2) - (4) of Table 8. Column (2) shows the
results for the ownership of all institutional investors; Column (3) shows results for the division
between transient and non-transient institutions; and Column (4) shows results for the division

34
between blockholders and non-blockholders. Column (2) reveals that the coefficient for the
interaction term between total institutional ownership and stock liquidity is not significant in the
regression. More importantly, Column (3) indicates that the coefficient for the interaction term
between transient institutional ownership and stock liquidity is positive and significant (t-statistic
= 2.428). Column (4) shows that the coefficient for the interaction term between non-blockholder
institutional ownership and stock liquidity is positive and significant (t-statistic = 2.277).
Interestingly, the interaction term between blockholder ownership and stock liquidity is negative
and significant at the 10% level (t-statistic = 1.700), suggesting that liquidity discourages
blockholders from selling upon public bad news. A potential explanation for this result is that
stock liquidity encourages blockholders to gather private information, and thus trade more
aggressively on private rather than public signals. Overall, we find no evidence that the effect of
stock liquidity on crash risk is amplified for firms with higher block ownership, or for those with
a higher proportion of non-transient institutions.
[Insert Table 8 about here]
To summarize, these results suggest that institutional exit is important in shaping the relation
between stock liquidity and crash risk. They also suggest that institutional exit on crash weeks
occurs primarily through the selling activities of transient institutions or non-blockholders, rather
than through that of blockholders. Collectively, our results in Section V are consistent with stock
liquidity positively affecting crash risk through increasing short-termism-induced managerial bad
news hoarding, and through facilitating transient institutional exits in response to bad news
releases.

35
VI. Conclusions
Stock price crashes can severely damage investors’ welfare and confidence. Using a large
sample of U.S. firms for 1993-2010, we find that higher stock liquidity gives rise to higher crash
risk. To understand the mechanisms underlying this effect, we explore both ex ante and ex post
channels. Our analysis suggests that high stock liquidity induces short-termist pressure and
increases managers’ ex ante incentives to withhold bad news. Moreover, high liquidity facilitates
the exit of transient institutions, thus magnifying the ex post stock price reactions to bad news
releases.
Our results suggest that stock liquidity can increase managers’ incentives to withhold bad
news and weaken financial market stability. Nonetheless, given that prior literature has
documented various beneficial effects of stock liquidity on corporate governance, information
environment, and firm value (Holden, Jacobsen, and Subrahmanyam (2014)), we do not
conclude that stock liquidity is on balance a negative attribute. Rather, it has both positive and
negative effects, and our study identifies one negative side — its effect on crash risk through the
transient investor channel. Thus, our results further emphasize the need for regulators to
determine the optimal level of stock liquidity based on the trade-off between its’ various benefits
and costs.
Finally, prior research (e.g., Ang, Chen, and Xing (2006), Chang, Christoffersen, and Jacobs
(2013)) documents a significant risk premium for downside risk. However, the documented
effect of liquidity on crash risk does not necessarily imply that more liquid stocks should have
higher expected returns. Rather, our findings suggest that, to understand the net effect of liquidity
on expected stock returns, one may need to consider not only its beneficial aspects (e.g., Amihud
and Mendelson (1986)), but also its effect on crash risk. We leave this issue for future research.
36
References
Aboody, D., and R. Kasznik. "CEO Stock Option Awards and the Timing of Corporate
Voluntary Disclosures." Journal of Accounting and Economics, 29 (2000), 73–100.
Admati, A. R., and P. Pfleiderer. "The ‘Wall Street Walk’ and Shareholder Activism: Exit as a
Form of Voice." Review of Financial Studies, 22 (2009), 2645–2685.
Amihud, Y. "Illiquidity and Stock Returns: Cross-Section and Time-Series Effects." Journal of
Financial Markets, 5 (2002), 31–56.
Amihud, Y., and H. Mendelson. "Asset Pricing and the Bid-Ask Spread." Journal of Financial
Economics, 17 (1986), 223–249.
Ang, A.; J. Chen; and Y. Xing. "Downside Risk." Review of Financial Studies, 19 (2006), 1191–
1239.
Appel, I.; T.A. Gormley; and D.B. Keim. "Passive Investors, Not Passive Owners." Working
paper (2015). Available at SSRN: http://papers.ssrn.com/sol3/papers.cfm?abstract_id
=2475150
Ball, R. "Market and Political/Regulatory Perspectives on the Recent Accounting Scandals."
Journal of Accounting Research 47 (2009), 277–323.
Barber, B.M.; T. Odean; and N. Zhu. "Do Retail Trades Move Markets?" Review of Financial
Studies, 22 (2009), 151–186.
Beasley, M.S. "An Empirical Analysis of the Relation Between the Board of Director
Composition and Financial Statement Fraud." The Accounting Review, 71 (1996), 443–465.
Benmelech, E.; E. Kandel; and P. Veronesi. "Stock-based Compensation and CEO (dis)
incentives." Quarterly Journal of Economics, 125 (2010), 1769–1820.
Berkowitz, J., and J. O’Brien. "How Accurate are Value-at-Risk Models in Commercial Banks?"
Journal of Finance, 57 (2002), 1093–1112.
Bernardo, A., and I. Welch. "Liquidity and Financial Market Runs." Quarterly Journal of
Economics, 119 (2003),135–158.
Bharath, S.T., S. Jayaraman, and V. Nagar. "Exit as Governance: An Empirical Analysis."
Journal of Finance, 68 (2013), 2515–2547.
Bharath, S.T., and T. Shumway. "Forecasting Default with the Merton Distance to Default
Model." Review of Financial Studies, 21 (2008), 1339–1369.

37
Bhide, A. "The Hidden Costs of Stock Market Liquidity." Journal of Financial Economics, 34
(1993), 31–51.
Bleck, A., and X. Liu. "Market Transparency and the Accounting Regime." Journal of
Accounting Research, 45 (2007), 229–256.
Boehmer, E., and E.K. Kelley. "Institutional Investors and the Informational Efficiency of
Prices." Review of Financial Studies, 22 (2009), 3563–3594.
Brunnermeier, M., and L. Pedersen. "Market Liquidity and Funding Liquidity." Review of
Financial Studies, 22 (2009), 2201–2238.
Bushee, B. "The Influence of Institutional Investors on Myopic R&D Investment Behavior." The
Accounting Review, 73 (1998), 305–333.
Bushee, B. "Do Institutional Investors Prefer Near-Term Earnings over Long-Run Value?"
Contemporary Accounting Research, 18 (2001), 207–246.
Callen, J.L., and X. Fang. "Religion and Stock Price Crash Risk." Journal of Financial and
Quantitative Analysis, Forthcoming (2014).
Chang, B.Y.; P. Christoffersen; and K. Jacobs. "Market Skewness Risk and the Cross Section of
Stock Returns." Journal of Financial Economics, 107 (2013), 46–68
Chen, J.; H. Hong; and J. C. Stein. "Forecasting Crashes: Trading Volume, Past Returns, and
Conditional Skewness in Stock Prices." Journal of Financial Economics, 61 (2001), 345–381.
Chordia, T.; R. Roll; and A. Subrahmanyam. "Liquidity and Market Efficiency." Journal of
Financial Economics, 87 (2008), 249–268.
Chordia, T.; A. Sarkar; and A. Subrahmanyam. "An Empirical Analysis of Stock and Bond
Market Liquidity." Review of Financial Studies, 18 (2005), 85–129.
Cohen, L.J.; M.M. Cornett; A.J. Marcus; and H. Tehranian. "Bank Earnings Management and
Tail Risk During the Financial Crisis." Journal of Money, Credit and Banking, 46 (2014),
171–197.
Core, J.; and W. Guay. "Estimating the Value of Employee Stock Option Portfolios and Their
Sensitivities to Price and Volatility." Journal of Accounting Research, 40 (2002), 613–630.
Daines, R.M.; G.R. McQueen; and R.J. Schonlau. 2014. "Right On Schedule: CEO Options
Grants and Opportunism." Working Paper, Stanford University.
Dechow, P.M.; R.G. Sloan; and A.P. Sweeney. "Detecting Earnings Management." The
Accounting Review, 70 (1995), 193–225.
38
DeFond, M.L.; M. Hung; S. Li; and Y. Li. "Does Mandatory IFRS Adoption Affect Crash Risk?"
The Accounting Review, 90 (2015), 265–299.
Derrien, F.; A. Kecskes; and D. Thesmar. "Investor Horizons and Corporate Policies." Journal of
Financial and Quantitative Analysis, 48 (2013), 1755–1780.
Dimson, E., "Risk Measurement When Shares are Subject to Infrequent Trading." Journal of
Financial Economics, 7 (1979), 197–226.
Dunn, K.A., and B.W. Mayhew. "Audit Firm Industry Specialization and Client Disclosure
Quality." Review of Accounting Studies, 9 (2004), 35–58.
Edmans, A. "Blockholder Trading, Market Efficiency, and Managerial Myopia." Journal of
Finance, 64 (2009), 2481–2513.
Edmans, A. "Blockholders and Corporate Governance.” Annual Review of Financial Economics,
6 (2014), 23–50.
Edmans, A.; V.W. Fang; and E. Zur. "The Effect of Liquidity on Governance." Review of
Financial Studies, 26 (2013), 1443–1482.
Edmans, A.; L. Goncalves-Pinto; Y. Wang; and M. Groen-Xu. 2014. "Strategic News Releases in
Equity Vesting Months." NBER Working Paper No. 20476. Available at SSRN:
http://ssrn.com/abstract=2489152
Edmans, A., and G. Manso. "Governance through Trading and Intervention: A Theory of
Multiple Blockholders." Review of Financial Studies, 24 (2011), 2395–2428.
Fama E.F., and K.R. French. "Common Risk Factors in the Returns on Stocks and Bonds."
Journal of Financial Economics, 33 (1993), 3–56.
Fang, V.W; T. Noe; and S. Tice. "Stock Market Liquidity and Firm Value." Journal of Financial
Economics, 94 (2009), 150–169.
Fang, V.W.; X. Tian; and S. Tice. "Does Stock Liquidity Enhance or Impede Firm Innovations?"
The Journal of Finance, 69 (2014), 2085–2125.
Ferreira, D.; Ferreira, M.; and C.C. Raposo. "Board Structure and Price Informativeness."
Journal of Financial Economics, 99 (2011), 523–545.
Gaspar, J.; M. Massa; and P. Matos. "Shareholder Investment Horizons and the Market for
Corporate Control." Journal of Financial Economics, 76 (2005), 135–165.
Goyenko, R.Y.; C.W. Holden; and C.A. Trzcinka. "Do Liquidity Measures Measure Liquidity?"
Journal of Financial Economics, 92 (2009), 153–181.

39
Graham, J.R.; C.R. Harvey; and S. Rajgopal. "The Economic Implications of Corporate
Financial Reporting." Journal of Accounting and Economics, 40(2005), 3–73.
Hasbrouck, J. "Trading Costs and Returns for U.S. Equities: Estimating Effective Costs from
Daily Data." Journal of Finance, 64 (2009), 1445–1477.
Healy, P.M., and K.G. Palepu. "Information Asymmetry, Corporate Disclosure, and the Capital
Markets: A Review of the Empirical Disclosure Literature." Journal of Accounting and
Economics, 31 (2001), 405–440.
Holden, C.W.; S. Jacobsen; and A. Subrahmanyam. "The Empirical Analysis of Liquidity."
Foundations and Trends in Finance, 8 (2014), 263–365.
Holmstrom, B., and J. Tirole. "Market Liquidity and Performance Monitoring." Journal of
Political Economy, 101 (1993), 678–709.
Hutton, A.P.; A.J. Marcus; and H. Tehranian. "Opaque Financial Reports, R2, and Crash Risk."
Journal of Financial Economics, 94 (2009), 67–86.
Jayaraman, S., and T.T. Milbourn. "The Role of Stock Liquidity in Executive Compensation."
The Accounting Review, 87 (2012), 537–563.
Jin, L., and S.C. Myers. "R2 around the World: New Theory and New Tests." Journal of
Financial Economics, 79 (2006), 257–292.
Kahn, C., and A. Winton. "Ownership Structure, Speculation, and Shareholder Intervention."
Journal of Finance, 99 (1998), 99–129.
Kim, J-B.; Y. Li; and L. Zhang. "Corporate Tax Avoidance and Stock Price Crash-a Firm-Level
Analysis." Journal of Financial Economics, 100 (2011a), 639–662.
Kim, J-B.; Y. Li; and L. Zhang. "CFOs versus CEOs: Equity Incentives and Crashes." Journal of
Financial Economics, 101 (2011b), 713–770.
Kim, J-B.; Z. Wang; and L. Zhang. "CEO Overconfidence and Stock Price Crash Risk."
Contemporary Accounting Research, Forthcoming (2014).
Kothari, S.; J. Lewellen; and J. Warner. "Stock Returns, Aggregate Earnings Surprises, and
Behavioral Finance." Journal of Financial Economics, 79 (2006), 537–568.
Kothari, S.; S. Shu; and P. Wysocki. "Do Managers Withhold Bad News?" Journal of
Accounting Research, 47 (2009), 241–276.
Lakonishok, J., and T. Vermaelen. "Tax-Induced Trading around Ex-Dividend Days." Journal of
Financial Economics, 16 (1986), 287-319.
40
Lambert, R. A. "Discussion of ‘Implications for GAAP from an Analysis of Positive Research in
Accounting.’" Journal of Accounting and Economics, 50 (2010), 287-295.
Lesmond, D. "Liquidity of Emerging Markets." Journal of Financial Economics, 77 (2005),
411–452.
Livnat, J., and R.R. Mendenhall. "Comparing the Post-Earnings Announcement Drift for
Surprises Calculated from Analyst and Time Series Forecasts." Journal of Accounting
Research, 44 (2006), 177-205.
Matsumoto, D. "Management’s Incentives to Avoid Negative Earnings Surprises." The
Accounting Review, 77 (2002), 483–514.
Maug, E. "Large Shareholders as Monitors: Is There a Trade-Off between Liquidity and
Control?" Journal of Finance, 53 (1998), 65–98.
Mullins, W. "The Governance Impact of Index Funds: Evidence from Regression Discontinuity."
Working paper (2014).
O'Brien, R.M. "A Caution Regarding Rules of Thumb for Variance Inflation Factors." Quality
and Quantity, 41 (2007), 673–690.
O’Hara, M. "Liquidity and Financial Market Stability." National Bank of Belgium Working
Paper No. 55 (2004).
Porter, M.E. "Capital Disadvantage: America’s Failing Capital Investment System." Harvard
Business Review, 70 (1992), 65-82.
Roosenboom, P.; F.P. Schlingemann; and M. Vasconcelos. "Does Stock Liquidity Affect
Incentives to Monitor? Evidence from Corporate Takeovers." Review of Financial Studies, 27
(2014), 2392–2433.
Wilson, R.J. "An Examination of Corporate Tax Shelter Participants." The Accounting Review,
84 (2009), 969–999.
Yan, X.S.; and Z. Zhang. "Institutional Investors and Equity Returns: Are Short-Term
Institutions Better Informed?" Review of Financial Studies, 22 (2009), 893–924.
Zhang, X.F. "High-frequency Trading, Stock Volatility, and Price Discovery." Working paper
(2010).

41
Appendix A. Variable Definitions
Note: Variable names in parentheses in the right column refer to the names of the data items in the merged
Compustat/CRSP database.
Variable Definition
ACCM
Moving sum of the absolute value of annual discretionary accruals over the prior three
years, where accruals are calculated using the modified Jones model of Dechow, Sloan,
and Sweeney (1995).
CRASH Dummy variable equal to 1 for one or more weekly returns falling 3.09 standard
deviations below the mean weekly returns over the fiscal year, and 0 otherwise.
DISP Standard deviation of analysts’ earnings-per-share forecasts divided by the mean of
analysts’ forecasts.
DTURN
Average monthly stock turnovers over the current fiscal year minus those over the
previous fiscal year. Monthly stock turnover is calculated as the ratio of monthly trading
volume over the number of shares outstanding.
LEV Ratio of long-term debt (DLTT) over the book value of total assets (AT).
LIQ
100 times the relative effective spread, which is the ratio of the absolute value of the
difference between the trade price and the midpoint of the bid-ask quote over the trade
price.
LOWPRC Dummy variable equal to one if a firm's closing stock price in the fiscal year prior to the
decimalization was below the sample median, and zero otherwise.
MB
Ratio of the market value of equity over the book value of equity (CEQ). Market value of
equity is the product of stock price (PRCC_F) and the number of shares outstanding
(CSHPRI).
NSKEW Ratio of the third moment of firm-specific weekly returns over the standard deviation of
firm-specific weekly returns raised to the third power, and then multiplied by 1.
POST Dummy variable equal to 1 for the fiscal year after the decimalization, and zero for the
fiscal year before the event.
RET 100 times the mean of firm-specific weekly returns over the fiscal year.
ROA Ratio of income before extraordinary items (IB) over book value of total assets (AT).
SASV Abnormal weekly institutional selling volume deflated by the standard deviation of
abnormal selling volume over the [-9,-2] week period.
SI Ratio of the number of shares held short over the number of shares outstanding.
SIGMA Standard deviation of firm-specific weekly returns over the fiscal year.
SIZE Log value of the market value of equity.
IO
Proportion of shares held by institutional investors. We classify further into TRAIO, the
proportion held by transient institutional investors, NONTRAIO, the proportion held by
non-transient institutional investors, BLOCK, the proportion held by institutional
blockholders, and NONBLOCK, the proportion held by non-blockholders.
SURP_UE Dummy variable equal to 1 if the unexpected earnings are in the lowest decile for the
current fiscal year and non-negative in the previous fiscal year, and 0 otherwise.
SURP_G
Dummy variable equal to 1 if the firm released a Shortfall guidance in the current fiscal
year but not in the previous fiscal year, and 0 otherwise. For firms with no recorded
earnings guidance, the variable equals 0.
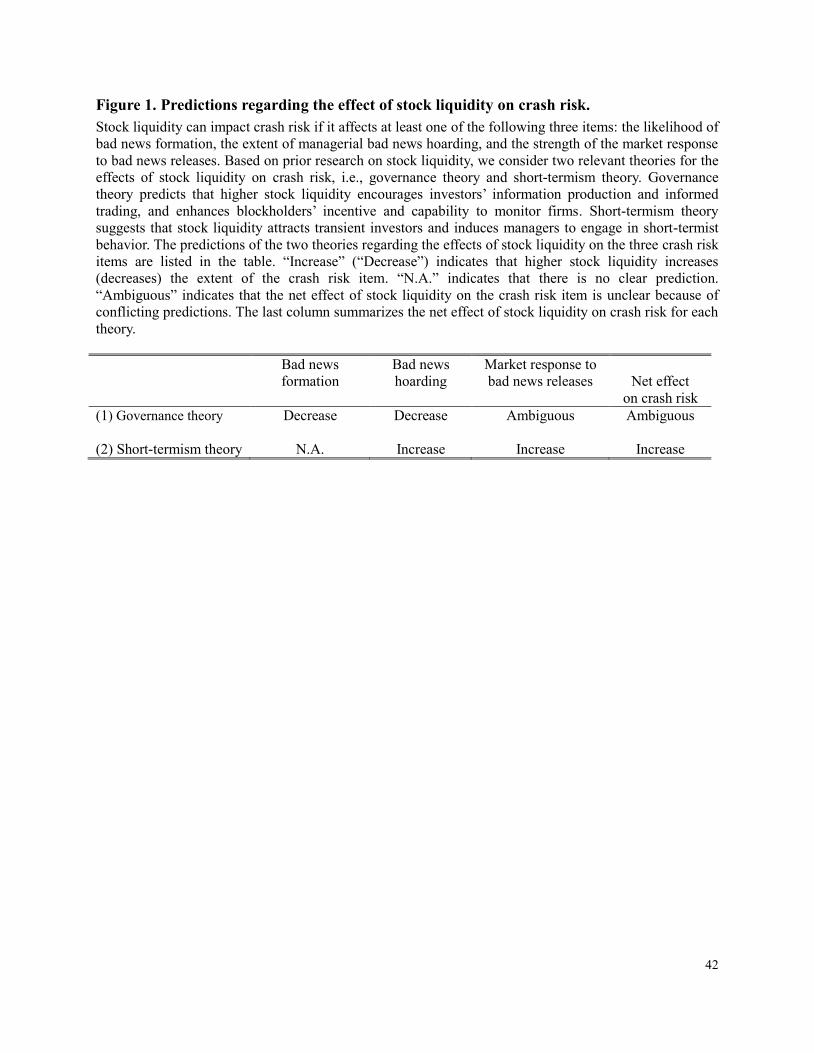
42
Figure 1. Predictions regarding the effect of stock liquidity on crash risk.
Stock liquidity can impact crash risk if it affects at least one of the following three items: the likelihood of
bad news formation, the extent of managerial bad news hoarding, and the strength of the market response
to bad news releases. Based on prior research on stock liquidity, we consider two relevant theories for the
effects of stock liquidity on crash risk, i.e., governance theory and short-termism theory. Governance
theory predicts that higher stock liquidity encourages investors’ information production and informed
trading, and enhances blockholders’ incentive and capability to monitor firms. Short-termism theory
suggests that stock liquidity attracts transient investors and induces managers to engage in short-termist
behavior. The predictions of the two theories regarding the effects of stock liquidity on the three crash risk
items are listed in the table. “Increase” (“Decrease”) indicates that higher stock liquidity increases
(decreases) the extent of the crash risk item. “N.A.” indicates that there is no clear prediction.
“Ambiguous” indicates that the net effect of stock liquidity on the crash risk item is unclear because of
conflicting predictions. The last column summarizes the net effect of stock liquidity on crash risk for each
theory.
Bad news
formation
Bad news
hoarding
Market response to
bad news releases
Net effect
on crash risk
(1) Governance theory Decrease Decrease Ambiguous Ambiguous
(2) Short-termism theory N.A. Increase Increase Increase
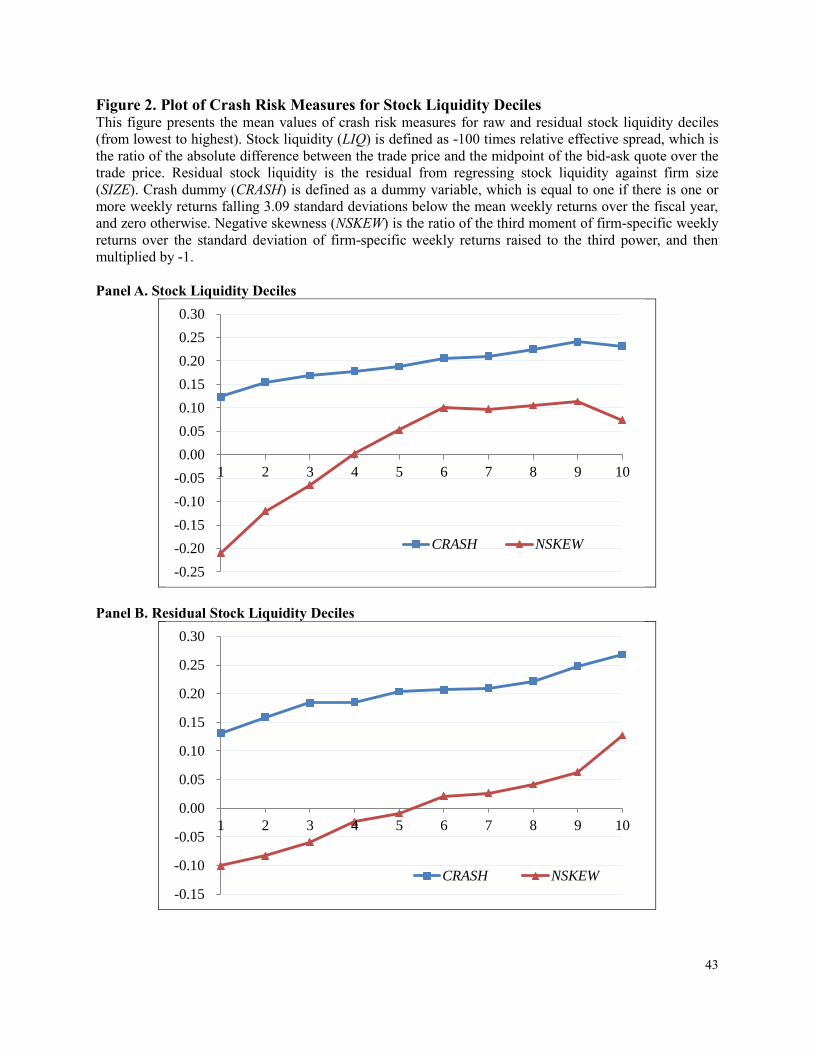
43
Figure 2. Plot of Crash Risk Measures for Stock Liquidity Deciles This figure presents the mean values of crash risk measures for raw and residual stock liquidity deciles
(from lowest to highest). Stock liquidity (LIQ) is defined as -100 times relative effective spread, which is
the ratio of the absolute difference between the trade price and the midpoint of the bid-ask quote over the
trade price. Residual stock liquidity is the residual from regressing stock liquidity against firm size
(SIZE). Crash dummy (CRASH) is defined as a dummy variable, which is equal to one if there is one or
more weekly returns falling 3.09 standard deviations below the mean weekly returns over the fiscal year,
and zero otherwise. Negative skewness (NSKEW) is the ratio of the third moment of firm-specific weekly
returns over the standard deviation of firm-specific weekly returns raised to the third power, and then
multiplied by -1.
Panel A. Stock Liquidity Deciles
Panel B. Residual Stock Liquidity Deciles
-0.25
-0.20
-0.15
-0.10
-0.05
0.00
0.05
0.10
0.15
0.20
0.25
0.30
1 2 3 4 5 6 7 8 9 10
CRASH NSKEW
-0.15
-0.10
-0.05
0.00
0.05
0.10
0.15
0.20
0.25
0.30
1 2 3 4 5 6 7 8 9 10
CRASH NSKEW

44
Figure 3. Plot of Institutional Selling Activity around Crash Weeks This figure presents the institutional standardized abnormal selling volume around stock price crash
weeks. The sample consists of firm-years jointly covered in the merged Compustat/CRSP database and
TAQ between 1995 and 2002. The standardized abnormal selling volume (SASV) is the abnormal weekly
institutional selling volume deflated by the standard deviation of abnormal selling volume over the [-9,-2]
week period.
0.00
1.00
2.00
3.00
4.00
5.00
6.00
-1 0 1 2 3
SASV
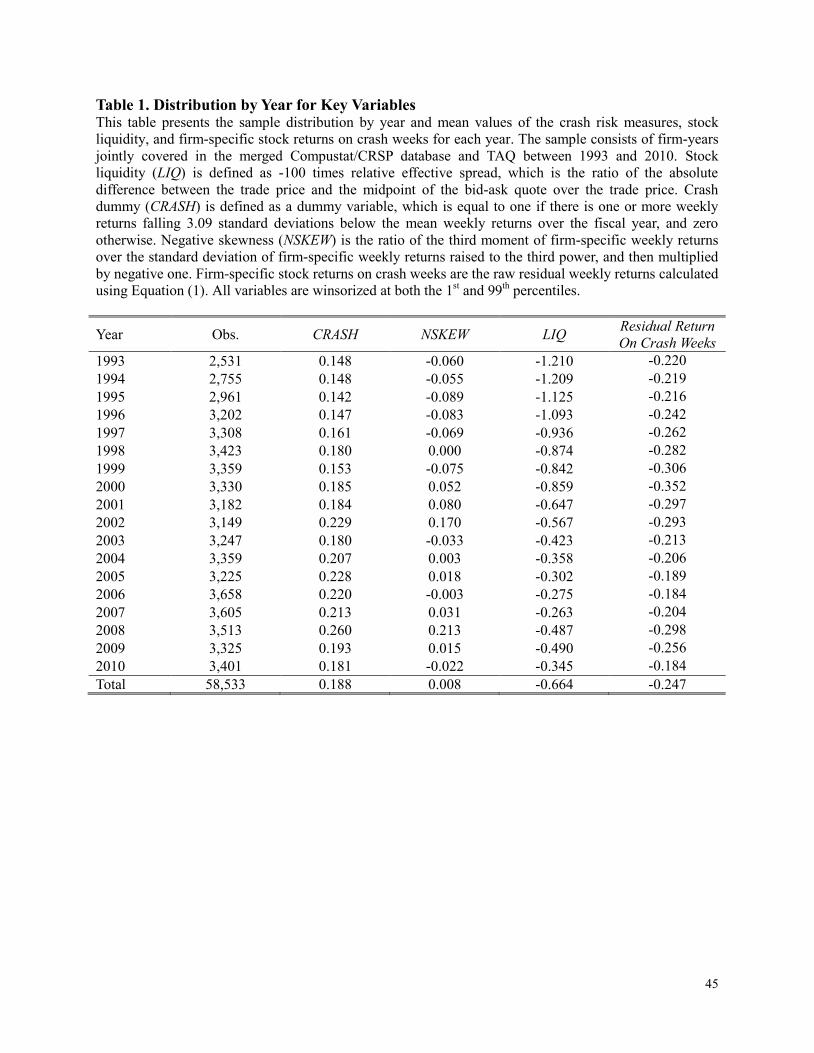
45
Table 1. Distribution by Year for Key Variables This table presents the sample distribution by year and mean values of the crash risk measures, stock
liquidity, and firm-specific stock returns on crash weeks for each year. The sample consists of firm-years
jointly covered in the merged Compustat/CRSP database and TAQ between 1993 and 2010. Stock
liquidity (LIQ) is defined as -100 times relative effective spread, which is the ratio of the absolute
difference between the trade price and the midpoint of the bid-ask quote over the trade price. Crash
dummy (CRASH) is defined as a dummy variable, which is equal to one if there is one or more weekly
returns falling 3.09 standard deviations below the mean weekly returns over the fiscal year, and zero
otherwise. Negative skewness (NSKEW) is the ratio of the third moment of firm-specific weekly returns
over the standard deviation of firm-specific weekly returns raised to the third power, and then multiplied
by negative one. Firm-specific stock returns on crash weeks are the raw residual weekly returns calculated
using Equation (1). All variables are winsorized at both the 1st and 99
th percentiles.
Year Obs. CRASH NSKEW LIQ Residual Return
On Crash Weeks
1993 2,531 0.148 -0.060 -1.210 -0.220
1994 2,755 0.148 -0.055 -1.209 -0.219
1995 2,961 0.142 -0.089 -1.125 -0.216
1996 3,202 0.147 -0.083 -1.093 -0.242
1997 3,308 0.161 -0.069 -0.936 -0.262
1998 3,423 0.180 0.000 -0.874 -0.282
1999 3,359 0.153 -0.075 -0.842 -0.306
2000 3,330 0.185 0.052 -0.859 -0.352
2001 3,182 0.184 0.080 -0.647 -0.297
2002 3,149 0.229 0.170 -0.567 -0.293
2003 3,247 0.180 -0.033 -0.423 -0.213
2004 3,359 0.207 0.003 -0.358 -0.206
2005 3,225 0.228 0.018 -0.302 -0.189
2006 3,658 0.220 -0.003 -0.275 -0.184
2007 3,605 0.213 0.031 -0.263 -0.204
2008 3,513 0.260 0.213 -0.487 -0.298
2009 3,325 0.193 0.015 -0.490 -0.256
2010 3,401 0.181 -0.022 -0.345 -0.184
Total 58,533 0.188 0.008 -0.664 -0.247

46
Table 2. Summary Statistics and Correlation Matrix This table presents the summary statistics and correlation matrix. The sample consists of firm-years jointly covered in the merged
Compustat/CRSP database and TAQ between 1993 and 2010. Stock liquidity (LIQ) is defined as -100 times relative effective spread, which is the
ratio of the absolute difference between the trade price and the midpoint of the bid-ask quote over the trade price. Crash dummy (CRASH) is
defined as a dummy variable, which is equal to one if there is one or more weekly returns falling 3.09 standard deviations below the mean weekly
returns over the fiscal year, and zero otherwise. Negative skewness (NSKEW) is -1 times the skewness of weekly returns over the fiscal year. Other
variable definitions are in Appendix A. *, **, and *** denote statistical significance at the 10%, 5%, and 1% levels, respectively.
Panel A. Summary Statistics
Mean S.D. 5% 25% Median 75% 95%
CRASH 0.188 0.391 0.000 0.000 0.000 0.000 1.000
NSKEW 0.008 0.762 -1.140 -0.417 -0.028 0.372 1.310
LIQ -0.664 0.826 -2.360 -0.907 -0.332 -0.112 -0.037
SIGMA 0.057 0.031 0.020 0.034 0.050 0.072 0.117
RET -0.206 0.250 -0.671 -0.255 -0.123 -0.057 -0.019
DTURN 0.006 0.103 -0.129 -0.021 0.001 0.028 0.154
SIZE 6.066 2.040 2.961 4.554 5.949 7.400 9.713
MB 2.801 4.478 0.476 1.178 1.898 3.250 8.561
LEV 0.174 0.190 0.000 0.005 0.120 0.280 0.537
ROA 0.011 0.184 -0.307 -0.003 0.038 0.086 0.198
ACCM 0.358 0.346 0.043 0.135 0.259 0.463 0.787
Panel B. Correlation Matrix
CRASH NSKEW LIQ SIGMA RET DTURN SIZE MB LEV ROA ACCM
CRASH 1.000
NSKEW 0.622*** 1.000
LIQ 0.066*** 0.099*** 1.000
SIGMA 0.102*** 0.059*** -0.339*** 1.000
RET -0.076*** -0.023*** 0.284*** -0.950*** 1.000
DTURN 0.030*** 0.023*** 0.046*** 0.138*** -0.163*** 1.000
SIZE 0.017*** 0.083*** 0.560*** -0.468*** 0.376*** 0.034*** 1.000
MB -0.032*** -0.032*** 0.086*** 0.043*** -0.053*** 0.061*** -0.058*** 1.000
LEV -0.007* 0.001 0.066*** -0.056*** 0.047*** 0.014*** 0.239*** -0.085*** 1.000
ROA -0.013*** -0.005 0.134*** -0.375*** 0.377*** 0.039*** 0.219*** -0.032*** -0.057*** 1.000
ACCM 0.019*** 0.015*** -0.001 0.263*** -0.239*** 0.001 -0.188*** 0.090*** -0.024*** -0.191*** 1.000

47
Table 3. Stock Liquidity and Crash Risk: Main Results This table presents regression results for the relation between stock liquidity and crash risk. The sample
consists of firm-years jointly covered in the merged Compustat/CRSP database and TAQ between 1993
and 2010. Stock liquidity (LIQ) is defined as -100 times relative effective spread, which is the ratio of the
absolute difference between the trade price and the midpoint of the bid-ask quote over the trade price.
Crash dummy (CRASH) is defined as a dummy variable, which is equal to one if there is one or more
weekly returns falling 3.09 standard deviations below the mean weekly returns over the fiscal year, and
zero otherwise. Negative skewness (NSKEW) is -1 times the skewness of weekly returns over the fiscal
year. Other variable definitions are in Appendix A. All variables are winsorized the variables at both the
1st and 99
th percentiles. The constant term, industry fixed-effects based on two-digit SIC codes, and year
fixed-effects are included in the regressions. The regression in Column (1) is estimated using logit; that in
Column (2) is estimated using OLS. z(t)-statistics (in parentheses) are computed using standard errors
robust to both clustering at the firm level and heteroskedasticity. *, **, and *** denote statistical
significance at the 10%, 5%, and 1% levels, respectively.
CRASHt NSKEWt
(1) (2)
LIQ t-1 0.216*** 0.057***
(7.439) (9.008)
NSKEW t-1 0.055*** 0.022***
(3.423) (4.176)
SIGMA t-1 7.102*** 5.231***
(4.345) (11.745)
RET t-1 0.980*** 0.574***
(4.880) (11.094)
DTURN t-1 0.448*** 0.207***
(3.805) (5.743)
SIZE t-1 0.015 0.045***
(1.540) (16.040)
MB t-1 0.008*** 0.004***
(2.957) (5.048)
LEV t-1 -0.034 -0.012
(-0.467) (-0.539)
ROA t-1 -0.313*** -0.124***
(-4.074) (-4.707)
ACCM t-1 0.079** 0.023*
(2.055) (1.792)
Obs./ R2 48,176/0.021 48,176/0.041

48
Table 4. Stock Liquidity and Crash Risk: Additional Analysis This table presents the results for the robustness tests. The sample consists of firm-years jointly covered
in the merged Compustat/CRSP database and TAQ between 1993 and 2010. Stock liquidity (LIQ) is
defined as -100 times relative effective spread, which is the ratio of the absolute difference between the
trade price and the midpoint of the bid-ask quote over the trade price. Crash dummy (CRASH) is defined
as a dummy variable, which is equal to one if there is one or more weekly returns falling 3.09 standard
deviations below the mean weekly returns over the fiscal year, and zero otherwise. Negative skewness
(NSKEW) is -1 times the skewness of weekly returns over the fiscal year. Other variable definitions are in
Appendix A. The constant terms, control variables, industry fixed-effects based on two-digit SIC codes,
and year fixed-effects are included in all regressions. z(t)-statistics (in parentheses) are computed using
standard errors robust to both clustering at the firm level and heteroskedasticity. *, **, and *** denote
statistical significance at the 10%, 5%, and 1% levels, respectively.
Coefficients of Stock Liquidity CRASHt NSKEWt
(1) (2)
Panel A: Alternative definitions of crash risk
(1) 3.5 standard deviations below the mean 0.213*** -
(7.241) -
(2) 4 standard deviations below the mean 0.182*** -
(7.352) -
(3) 4.5 standard deviations below the mean 0.181*** -
(7.346) -
(4) Firm-specific return below -10% 0.237*** -
(6.869) -
(5) Firm-specific return below -15% 0.215*** -
(6.986) -
(6) Firm-specific return below -20% 0.203*** -
(7.373) -
(7) No. of crash weeks as the dependent variable 0.026*** -
(7.648) -
Panel B: Alternative stock liquidity measures
(1) Amihud (2002) price impact 0.002*** 0.001***
(6.439) (10.250)
(2) Hasbrouck (2009) implicit bid-ask spread 0.191*** 0.043***
(7.613) (7.508)
(3) Lesmond (2005) percentage of zero returns 0.022*** 0.009***
(7.778) (11.208)
Panel C: Additional controls
(1) Including firm fixed-effects 0.122*** 0.036***
(2.749) (2.812)
(2) Including additional control variables 0.733*** 0.145**
(2.633) (2.435)
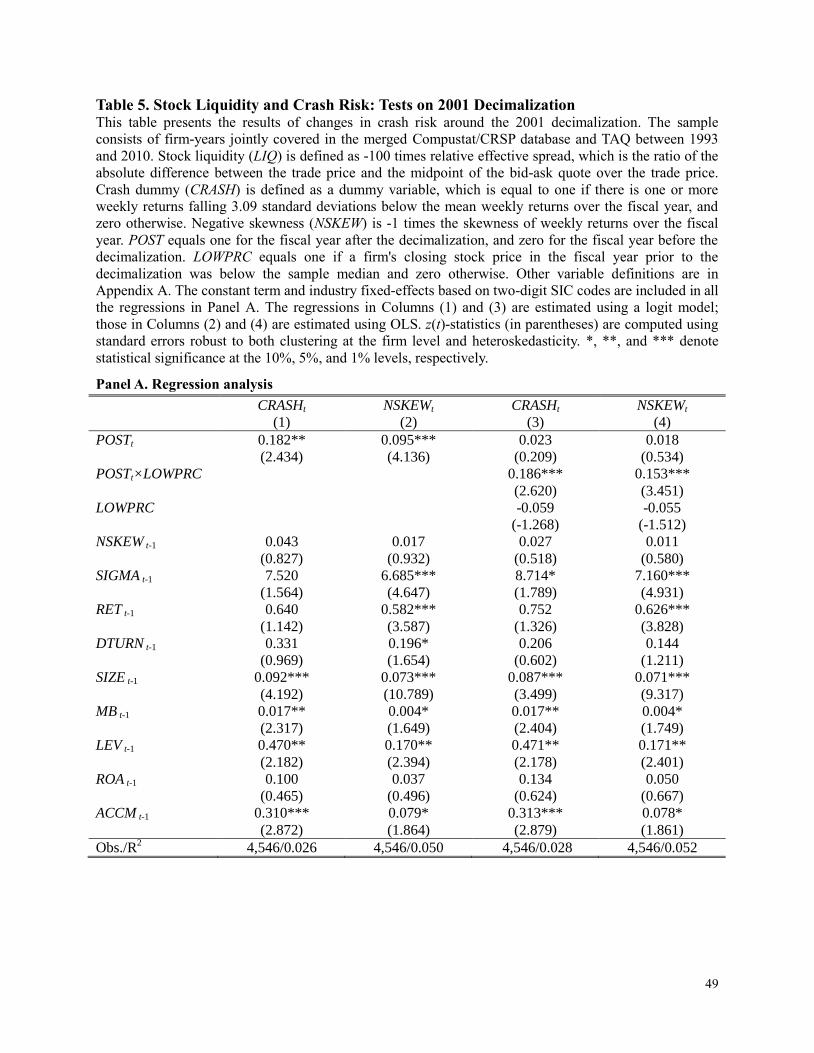
49
Table 5. Stock Liquidity and Crash Risk: Tests on 2001 Decimalization This table presents the results of changes in crash risk around the 2001 decimalization. The sample
consists of firm-years jointly covered in the merged Compustat/CRSP database and TAQ between 1993
and 2010. Stock liquidity (LIQ) is defined as -100 times relative effective spread, which is the ratio of the
absolute difference between the trade price and the midpoint of the bid-ask quote over the trade price.
Crash dummy (CRASH) is defined as a dummy variable, which is equal to one if there is one or more
weekly returns falling 3.09 standard deviations below the mean weekly returns over the fiscal year, and
zero otherwise. Negative skewness (NSKEW) is -1 times the skewness of weekly returns over the fiscal
year. POST equals one for the fiscal year after the decimalization, and zero for the fiscal year before the
decimalization. LOWPRC equals one if a firm's closing stock price in the fiscal year prior to the
decimalization was below the sample median and zero otherwise. Other variable definitions are in
Appendix A. The constant term and industry fixed-effects based on two-digit SIC codes are included in all
the regressions in Panel A. The regressions in Columns (1) and (3) are estimated using a logit model;
those in Columns (2) and (4) are estimated using OLS. z(t)-statistics (in parentheses) are computed using
standard errors robust to both clustering at the firm level and heteroskedasticity. *, **, and *** denote
statistical significance at the 10%, 5%, and 1% levels, respectively.
Panel A. Regression analysis
CRASHt NSKEWt CRASHt NSKEWt
(1) (2) (3) (4)
POSTt 0.182** 0.095*** 0.023 0.018
(2.434) (4.136) (0.209) (0.534)
POSTt×LOWPRC 0.186*** 0.153***
(2.620) (3.451)
LOWPRC -0.059 -0.055
(-1.268) (-1.512)
NSKEW t-1 0.043 0.017 0.027 0.011
(0.827) (0.932) (0.518) (0.580)
SIGMA t-1 7.520 6.685*** 8.714* 7.160***
(1.564) (4.647) (1.789) (4.931)
RET t-1 0.640 0.582*** 0.752 0.626***
(1.142) (3.587) (1.326) (3.828)
DTURN t-1 0.331 0.196* 0.206 0.144
(0.969) (1.654) (0.602) (1.211)
SIZE t-1 0.092*** 0.073*** 0.087*** 0.071***
(4.192) (10.789) (3.499) (9.317)
MB t-1 0.017** 0.004* 0.017** 0.004*
(2.317) (1.649) (2.404) (1.749)
LEV t-1 0.470** 0.170** 0.471** 0.171**
(2.182) (2.394) (2.178) (2.401)
ROA t-1 0.100 0.037 0.134 0.050
(0.465) (0.496) (0.624) (0.667)
ACCM t-1 0.310*** 0.079* 0.313*** 0.078*
(2.872) (1.864) (2.879) (1.861)
Obs./R2 4,546/0.026 4,546/0.050 4,546/0.028 4,546/0.052
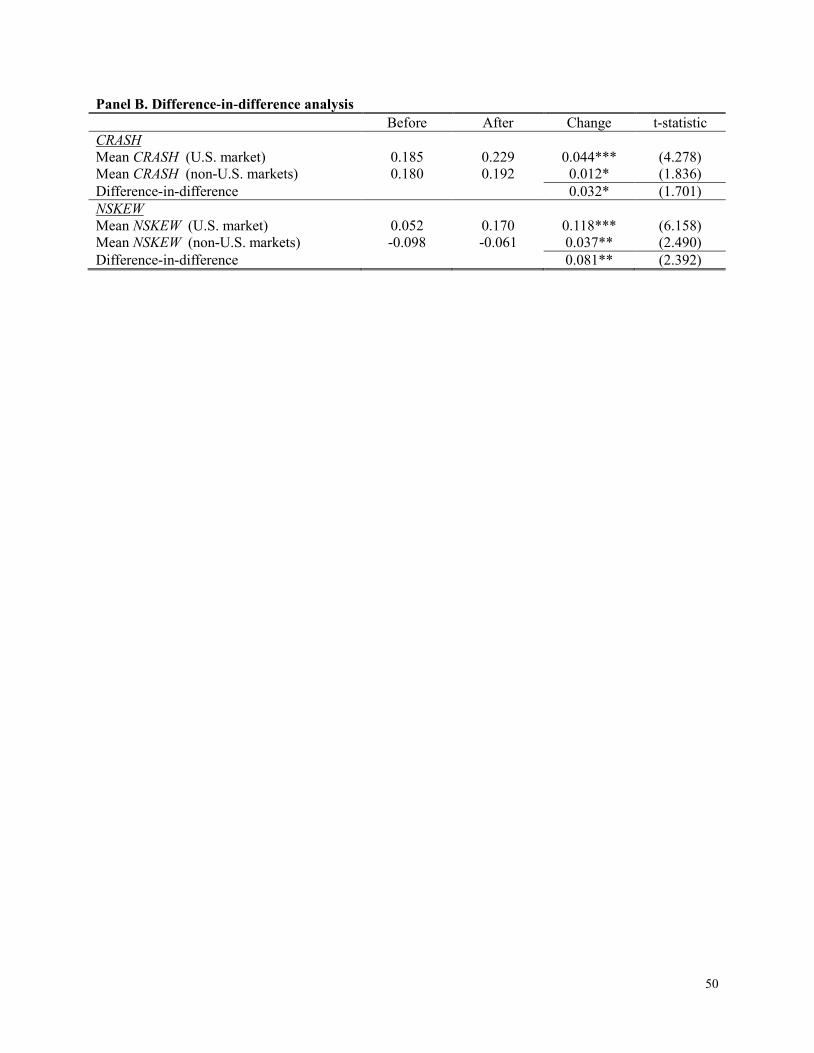
50
Panel B. Difference-in-difference analysis
Before After Change t-statistic
CRASH
Mean CRASH (U.S. market) 0.185 0.229 0.044*** (4.278)
Mean CRASH (non-U.S. markets) 0.180 0.192 0.012* (1.836)
Difference-in-difference 0.032* (1.701)
NSKEW
Mean NSKEW (U.S. market) 0.052 0.170 0.118*** (6.158)
Mean NSKEW (non-U.S. markets) -0.098 -0.061 0.037** (2.490)
Difference-in-difference 0.081** (2.392)

51
Table 6. Stock Liquidity and Crash Risk: The Role of Institutional Investors This table presents the results regarding the effects of institutional ownership on the liquidity-crash
relation. The sample consists of firm-years jointly covered in the merged Compustat/CRSP database and
TAQ between 1993 and 2010. Stock liquidity (LIQ) is defined as -100 times relative effective spread,
which is the ratio of the absolute difference between the trade price and the midpoint of the bid-ask quote
over the trade price. Crash dummy (CRASH) is defined as a dummy variable, which is equal to one if
there is one or more weekly returns falling 3.09 standard deviations below the mean weekly returns over
the fiscal year, and zero otherwise. Negative skewness (NSKEW) is -1 times the skewness of weekly
returns over the fiscal year. IO, TRAIO, NONTRAIO, BLOCK, and NONBLOCK are total institutional
ownership, transient institutional ownership, non-transient institutional ownership, blockholder
ownership, and non-blockholder ownership, respectively. The constant term, control variables, industry
fixed-effects based on two-digit SIC codes, and year fixed-effects are included in all the regressions. The
regressions in Column (1) are estimated using a logit model; those in Column (2) are estimated using
OLS. z(t)-statistics (in parentheses) are computed using standard errors robust to both clustering at the
firm level and heteroskedasticity. *, **, and *** denote statistical significance at the 10%, 5%, and 1%
levels, respectively.
CRASHt NSKEWt
(1) (2)
Panel A: The effect of total institutional ownership (N = 48,176)
LIQ t-1 0.099*** 0.036***
(3.181) (5.017)
LIQ t-1×IOt-1 0.233** 0.021
(2.514) (0.927)
IOt-1 0.598*** 0.180***
(10.078) (10.640)
Panel B: The effects of transient and non-transient institutional ownership (N = 48,176)
LIQ t-1 0.098*** 0.036***
(3.145) (4.995)
LIQ t-1×TRAIOt-1 0.142** 0.171**
(2.186) (2.535)
TRAIOt-1 1.397*** 0.657***
(9.025) (12.722)
LIQ t-1×NONTRAIOt-1 0.382 0.061
(1.436) (0.827)
NONTRAIOt-1 0.281 -0.002
(1.478) (-0.068)
Panel C: The effects of block and non-block ownership (N = 48,176)
LIQ t-1 0.139*** 0.044***
(4.189) (5.988)
LIQ t-1×NONBLOCKt-1 0.105* 0.198***
(1.703) (4.973)
NONBLOCKt-1 0.777*** 0.220***
(10.009) (9.848)
LIQ t-1×BLOCKt-1 0.002 0.010
(0.016) (0.291)
BLOCKt-1 0.115 0.048
(1.023) (1.432)
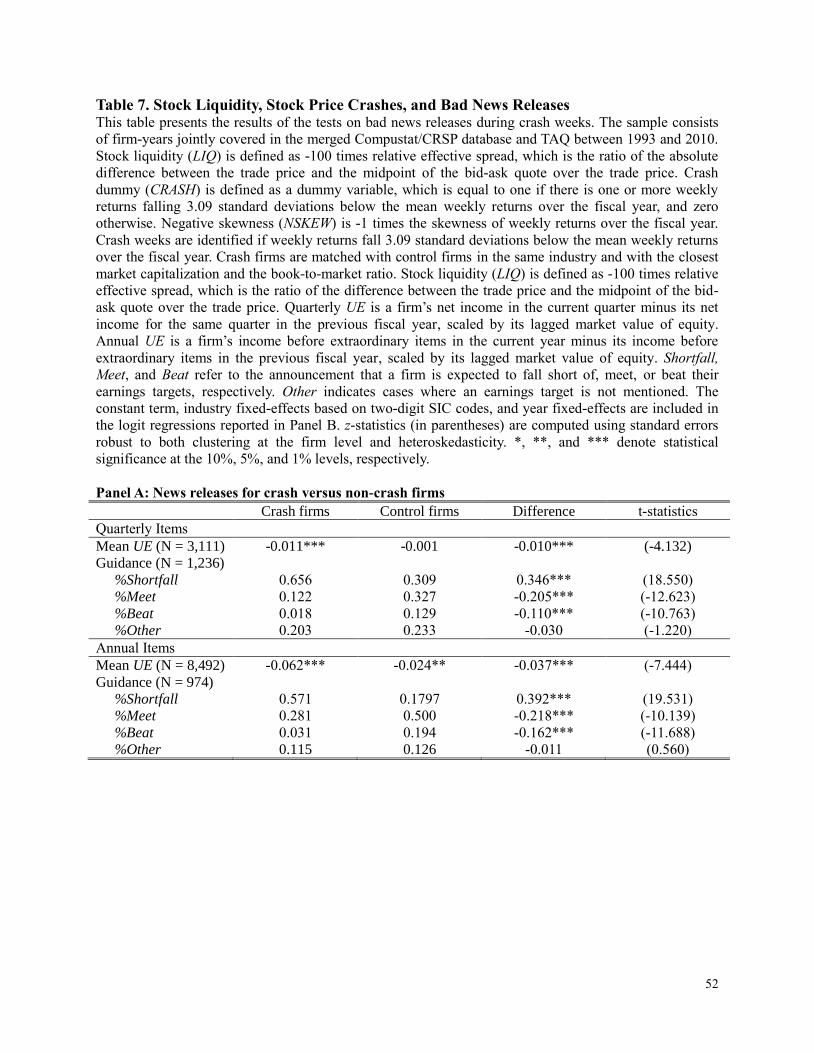
52
Table 7. Stock Liquidity, Stock Price Crashes, and Bad News Releases This table presents the results of the tests on bad news releases during crash weeks. The sample consists
of firm-years jointly covered in the merged Compustat/CRSP database and TAQ between 1993 and 2010.
Stock liquidity (LIQ) is defined as -100 times relative effective spread, which is the ratio of the absolute
difference between the trade price and the midpoint of the bid-ask quote over the trade price. Crash
dummy (CRASH) is defined as a dummy variable, which is equal to one if there is one or more weekly
returns falling 3.09 standard deviations below the mean weekly returns over the fiscal year, and zero
otherwise. Negative skewness (NSKEW) is -1 times the skewness of weekly returns over the fiscal year.
Crash weeks are identified if weekly returns fall 3.09 standard deviations below the mean weekly returns
over the fiscal year. Crash firms are matched with control firms in the same industry and with the closest
market capitalization and the book-to-market ratio. Stock liquidity (LIQ) is defined as -100 times relative
effective spread, which is the ratio of the difference between the trade price and the midpoint of the bid-
ask quote over the trade price. Quarterly UE is a firm’s net income in the current quarter minus its net
income for the same quarter in the previous fiscal year, scaled by its lagged market value of equity.
Annual UE is a firm’s income before extraordinary items in the current year minus its income before
extraordinary items in the previous fiscal year, scaled by its lagged market value of equity. Shortfall,
Meet, and Beat refer to the announcement that a firm is expected to fall short of, meet, or beat their
earnings targets, respectively. Other indicates cases where an earnings target is not mentioned. The
constant term, industry fixed-effects based on two-digit SIC codes, and year fixed-effects are included in
the logit regressions reported in Panel B. z-statistics (in parentheses) are computed using standard errors
robust to both clustering at the firm level and heteroskedasticity. *, **, and *** denote statistical
significance at the 10%, 5%, and 1% levels, respectively.
Panel A: News releases for crash versus non-crash firms
Crash firms Control firms Difference t-statistics
Quarterly Items
Mean UE (N = 3,111) -0.011*** -0.001 -0.010*** (-4.132)
Guidance (N = 1,236)
%Shortfall 0.656 0.309 0.346*** (18.550)
%Meet 0.122 0.327 -0.205*** (-12.623)
%Beat 0.018 0.129 -0.110*** (-10.763)
%Other 0.203 0.233 -0.030 (-1.220)
Annual Items
Mean UE (N = 8,492) -0.062*** -0.024** -0.037*** (-7.444)
Guidance (N = 974)
%Shortfall 0.571 0.1797 0.392*** (19.531)
%Meet 0.281 0.500 -0.218*** (-10.139)
%Beat 0.031 0.194 -0.162*** (-11.688)
%Other 0.115 0.126 -0.011 (0.560)

53
Panel B: Stock liquidity and bad news releases
SURP_UEt SURP_Gt
(1) (2)
LIQ t-1 0.221*** 1.692***
(5.293) (7.402)
NSKEW t-1 -0.153*** 0.139***
(-5.855) (3.792)
SIGMA t-1 47.878*** 6.128
(16.759) (1.206)
RET t-1 3.265*** 0.216
(10.372) (0.282)
DTURN t-1 0.444** 1.079***
(2.436) (3.749)
SIZE t-1 -0.108*** 0.011
(-5.879) (0.432)
MB t-1 0.013** -0.016**
(2.262) (-2.214)
LEV t-1 -0.577*** 0.310*
(-4.019) (1.784)
ROA t-1 3.091*** 1.423***
(13.132) (4.909)
ACCM t-1 0.606*** 0.199*
(10.654) (1.875)
Obs./ R2 47,885/0.144 21,272/0.090
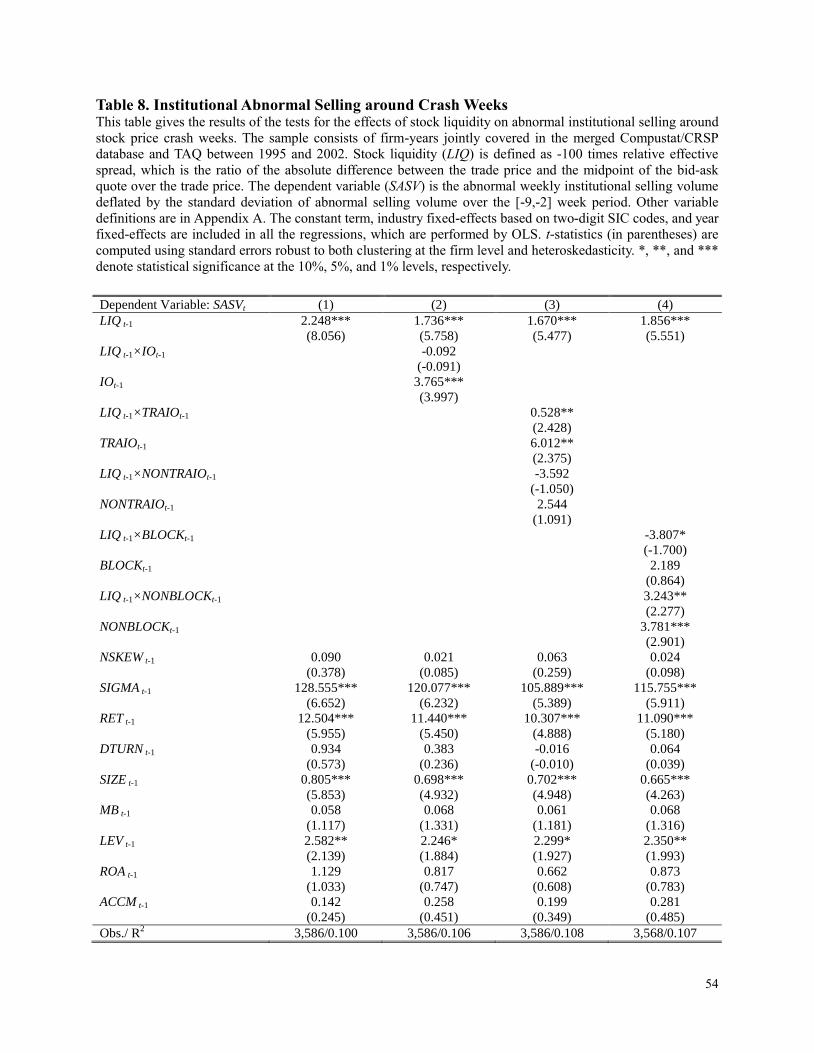
54
Table 8. Institutional Abnormal Selling around Crash Weeks This table gives the results of the tests for the effects of stock liquidity on abnormal institutional selling around
stock price crash weeks. The sample consists of firm-years jointly covered in the merged Compustat/CRSP
database and TAQ between 1995 and 2002. Stock liquidity (LIQ) is defined as -100 times relative effective
spread, which is the ratio of the absolute difference between the trade price and the midpoint of the bid-ask
quote over the trade price. The dependent variable (SASV) is the abnormal weekly institutional selling volume
deflated by the standard deviation of abnormal selling volume over the [-9,-2] week period. Other variable
definitions are in Appendix A. The constant term, industry fixed-effects based on two-digit SIC codes, and year
fixed-effects are included in all the regressions, which are performed by OLS. t-statistics (in parentheses) are
computed using standard errors robust to both clustering at the firm level and heteroskedasticity. *, **, and ***
denote statistical significance at the 10%, 5%, and 1% levels, respectively.
Dependent Variable: SASVt (1) (2) (3) (4)
LIQ t-1 2.248*** 1.736*** 1.670*** 1.856***
(8.056) (5.758) (5.477) (5.551)
LIQ t-1×IOt-1 -0.092
(-0.091)
IOt-1 3.765***
(3.997)
LIQ t-1×TRAIOt-1 0.528**
(2.428)
TRAIOt-1 6.012**
(2.375)
LIQ t-1×NONTRAIOt-1 -3.592
(-1.050)
NONTRAIOt-1 2.544
(1.091)
LIQ t-1×BLOCKt-1 -3.807*
(-1.700)
BLOCKt-1 2.189
(0.864)
LIQ t-1×NONBLOCKt-1 3.243**
(2.277)
NONBLOCKt-1 3.781***
(2.901)
NSKEW t-1 0.090 0.021 0.063 0.024
(0.378) (0.085) (0.259) (0.098)
SIGMA t-1 128.555*** 120.077*** 105.889*** 115.755***
(6.652) (6.232) (5.389) (5.911)
RET t-1 12.504*** 11.440*** 10.307*** 11.090***
(5.955) (5.450) (4.888) (5.180)
DTURN t-1 0.934 0.383 -0.016 0.064
(0.573) (0.236) (-0.010) (0.039)
SIZE t-1 0.805*** 0.698*** 0.702*** 0.665***
(5.853) (4.932) (4.948) (4.263)
MB t-1 0.058 0.068 0.061 0.068
(1.117) (1.331) (1.181) (1.316)
LEV t-1 2.582** 2.246* 2.299* 2.350**
(2.139) (1.884) (1.927) (1.993)
ROA t-1 1.129 0.817 0.662 0.873
(1.033) (0.747) (0.608) (0.783)
ACCM t-1 0.142 0.258 0.199 0.281
(0.245) (0.451) (0.349) (0.485)
Obs./ R2 3,586/0.100 3,586/0.106 3,586/0.108 3,568/0.107